

Page 1
O & M Manual
Model Q46-85
Peracetic Acid Monitor
Home Office European Office
Analytical Technology, Inc. ATI (UK) Limited
6 Iron Bridge Drive Unit 1 & 2 Gatehead Business Park
Collegeville, PA 19426 Delph New Road, Delph
Phone: 800-959-0299 Saddleworth OL3 5DE
610-917-0991 Phone: +44 (0)1457-873-318
Fax: 610-917-0992 Fax: + 44 (0)1457-874-468
Email: sales@analyticaltechnology.com Email: sales@atiuk.com
Page 2

Table of Contents
PART 1 - INTRODUCTION ................................. 4
1.1 General ...................................................... 4
1.2 Standard System ....................................... 5
1.3 Features ..................................................... 8
1.4 Q46/85 System Specifications .................. 9
1.5 Q46H Performance Specifications ...........10
PART 2 – ANALYZER MOUNTING .................11
2.1 General .....................................................11
2.2 Wall or Pipe Mount ..................................12
2.3 Panel Mounting ........................................14
PART 3 – SENSOR/FLOWCELL MOUNTING 15
3.1 General .....................................................15
3.2 Constant-Head Flowcell ...........................15
3.3 Sealed Flowcell ........................................16
3.4 Submersion Mounting ..............................18
PART 4 – ELECTRICAL INSTALLATION ......19
4.1 General .....................................................19
4.2 Power Connection ....................................19
4.4 Direct Sensor Connection ........................23
4.5 Sensor Wiring ......................................24
4.6 Junction Box Connection .........................25
PART 5 – SENSOR ASSEMBLY .........................26
5.1 PAA Sensor Preparation ..........................26
5.2 Optional pH Sensor ..................................28
PART 6 – CONFIGURATION .............................29
6.1 User Interface ...........................................29
6.11 Keys .........................................................30
6.12 Display .....................................................30
6.2 Software ...................................................32
6.21 Software Navigation ...............................32
6.22 Measure Menu [MEASURE] ...................35
6.23 Calibration Menu [CAL].............................36
6.24 Configuration Menu [CONFIG] ..............36
6.25 Control Menu [CONTROL] ....................41
6.26 Diagnostics Menu [DIAG] .........................45
PART 7 – CALIBRATION ...................................48
7.1 PAA Calibration ......................................48
7.11 PAA Zero Cal ..........................................48
7.12 PAA Span Cal ..........................................49
7.2 Temperature Calibration ..........................50
7.3 pH Calibration..........................................51
7.31 Two-Point pH Cal ....................................51
7.32 One-Point pH Cal .....................................52
PART 8 – PID CONTROLLER DETAILS .........53
8.1 PID Description .......................................53
8.2 PID Algorithm .........................................53
8.3 Classical PID Tuning ...............................55
8.4 Manual PID Override Control..................55
8.5 Common PID Pitfalls ...............................55
PART 9 – SYSTEM MAINTENANCE ................57
9.1 General .....................................................57
9.2 Analyzer Maintenance .............................57
9.3 PAA Sensor Maintenance ........................57
9.31 Sensor Acid Cleaning ..............................58
9.4 Flow Cell Maintenance ............................58
PART 10 – TROUBLESHOOTING ....................59
10.1 General .....................................................59
10.2 External Sources of Problems ..................59
10.3 Analyzer Tests .........................................60
10.4 Display Messages ....................................60
10.5 Sensor Tests .............................................63
SPARE PARTS ......................................................65
O&M Manual
Rev F (8/17)
2
Page 3

Table of Figures
FIGURE 1 - TYPICAL SYSTEM DIAGRAM .......................................................................................... 5
FIGURE 2 - MONITORING SYSTEM W/BAYONET STYLE PH SNSOR .................................................... 6
FIGURE 3 - SEALED FLOWCELL ASSEMBLIES W/FLOW CONTROL ...................................................... 7
FIGURE 4 – Q46 ENCLOSURE DIMENSIONS .................................................................................. 11
FIGURE 5 - WALL OR PIPE MOUNT BRACKET ................................................................................. 12
FIGURE 6 - WALL MOUNTING DIAGRAM ........................................................................................ 13
FIGURE 7 - PIPE MOUNTING DIAGRAM .......................................................................................... 13
FIGURE 8 - PANEL MOUNT CUTOUT ............................................................................................. 14
FIGURE 9 - CONSTANT HEAD FLOWCELL DETAILS ......................................................................... 15
FIGURE 10 - SEALED FLOWCELL DETAILS ..................................................................................... 16
FIGURE 11 - SEALED PH FLOWCELL DETAILS ............................................................................... 17
FIGURE 12 - SUBMERSIBLE SENSOR MOUNTING ASSEMBLY .......................................................... 18
FIGURE 13 - LINE POWER CONNECTION ....................................................................................... 20
FIGURE 14 - OPTIONAL RELAY BOARD WIRING ............................................................................. 21
FIGURE 15 - OPTIONAL RELAY BOARD WIRING ............................................................................. 22
FIGURE 16 - OPTIONAL ANALOG OUTPUT WIRING ......................................................................... 22
FIGURE 17 - SENSOR CABLE PREPARATION ................................................................................. 23
FIGURE 18 - SENSOR WIRING ...................................................................................................... 24
FIGURE 19 - JUNCTION BOX INTERCONNECT WIRING .................................................................... 25
FIGURE 20 - PAA SENSOR ASSEMBLY ......................................................................................... 26
FIGURE 21 - SUBMERSIBLE PAA SENSOR ASSEMBLY ................................................................... 27
FIGURE 22 - USER INTERFACE ..................................................................................................... 29
FIGURE 23 - SOFTWARE MAP ...................................................................................................... 34
FIGURE 24 - AUTOMATIC PH BUFFER TABLES ............................................................................... 40
FIGURE 25 - CONTROL RELAY EXAMPLE, HYSTERSIS AND TWO OPPOSITE PHASE OPTIONS ............ 43
FIGURE 26 - ALARM RELAY EXAMPLE .......................................................................................... 44
FIGURE 27 - Q46H ISA (IDEAL) EQUATION ................................................................................... 53
FIGURE 28 - Q46H DSIAPLY MESSAGES ...................................................................................... 61
FIGURE 29 - DISPLAY MESSAGES (CONTINUED) ........................................................................... 62
FIGURE 30 - PT100 RTD TABLE .................................................................................................. 63
O&M Manual
Rev F (8/17)
3
Page 4

Part 1 - Introduction
1.1 General
The Model Q46/85 is an on-line monitoring system designed for the continuous measurement of
Peracetic Acid (PAA) concentration in solution. The full scale operating range of the system may
be selected by the user for 0-20.00 ppm, 0-200.0 ppm, or 0-2000 ppm, and the sensing system
will operate on water streams with temperatures ranging from 0 to 50°C. The Q46/85 PAA
Measurement System is engineered for applications in which PAA is applied to water for
sterilization purposes
The basic sensing element used in the PAA monitor is a polarographic membrane sensor which
measures PAA directly. Water simply flows past the sensor and directly to drain, with the flow
rate and pressure across the sensor controlled by a constant head flow cell assembly. The PAA
measurement does not alter the sample or add any chemicals to the sample stream, so the water
flow can return to the system if desired.
Q46/85 Monitors are available in two basic electronic versions, a 90-260 VAC powered monitor,
or a 12-24 VDC powered monitor – both with three relays and two 4-20 mA analog outputs. Both
versions allow flexible output options which include additional 4-20 mA current outputs, additional
0-30 VDC signal relays, PID control, and digital communication cards.
O&M Manual
Rev F (8/17)
4
Page 5
ATI Q46H/85 PAA System Part 2 – Analyzer Mounting
1.2 Standard System
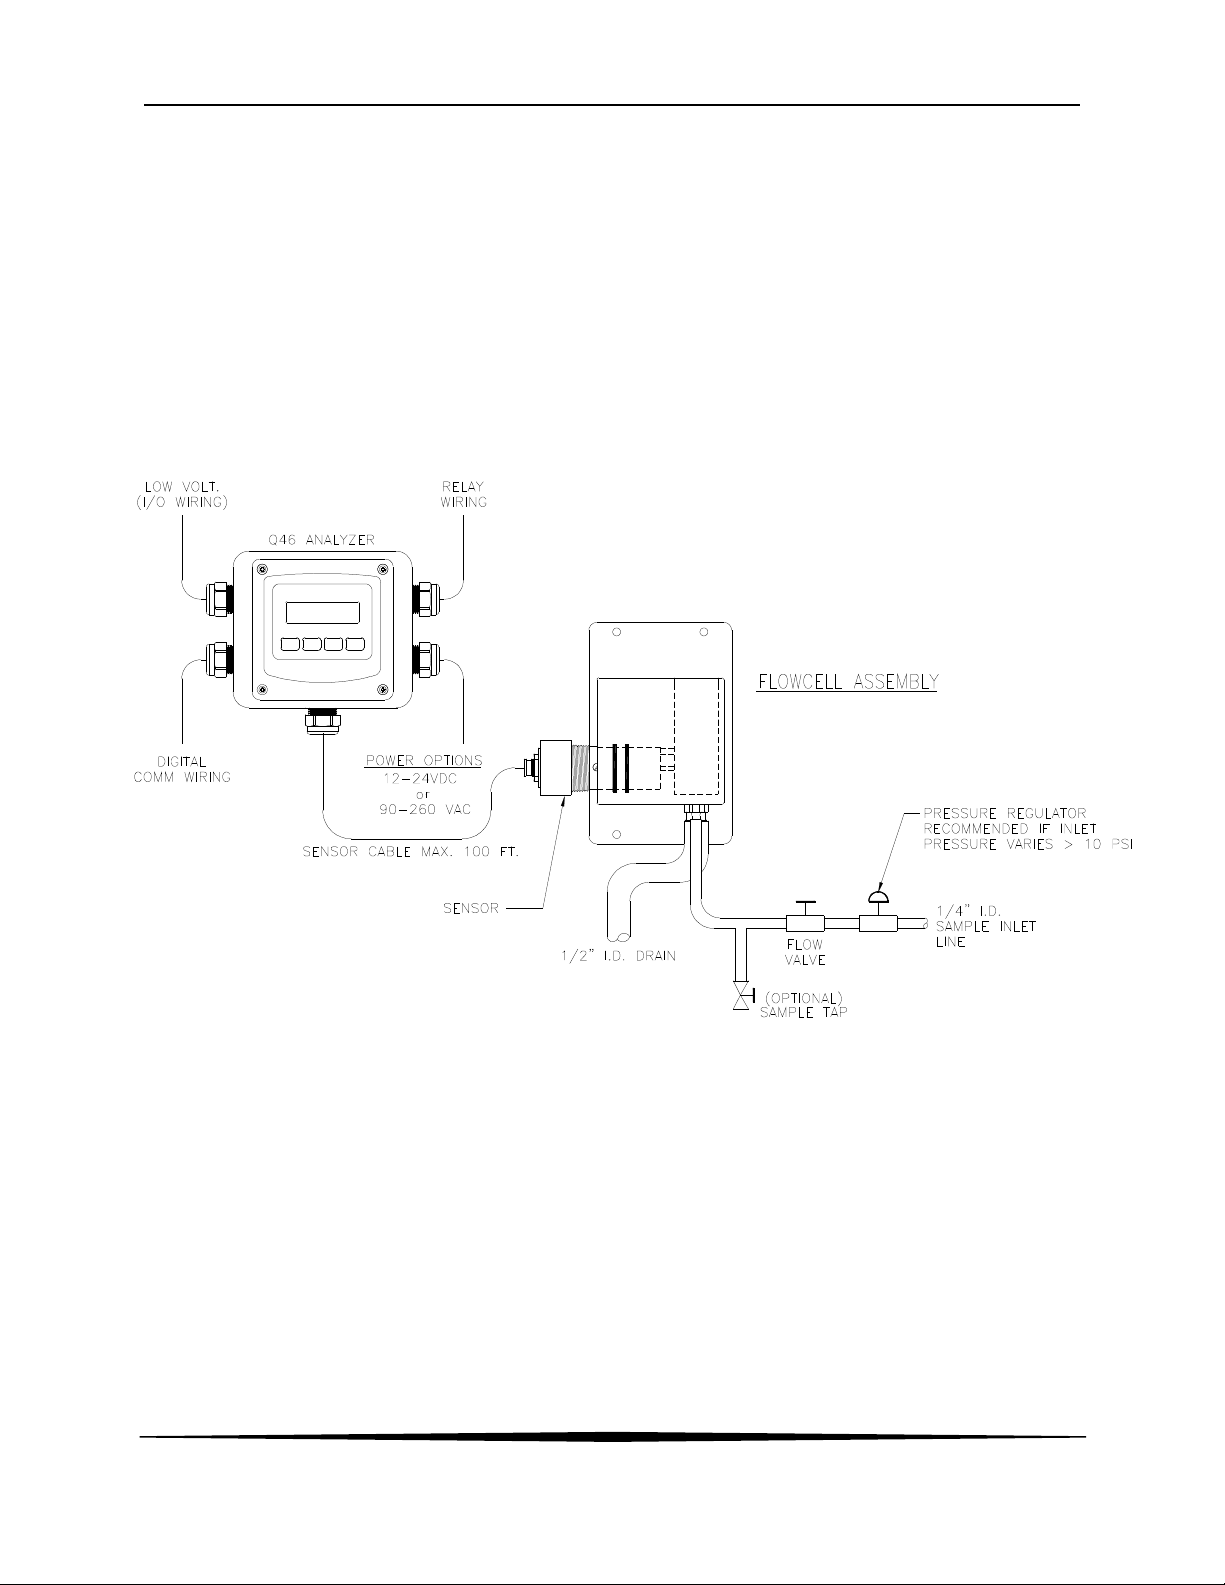
The standard model Q46/85 system includes three main components, the Q46 analyzer, a
constant head flow cell, and a PAA sensor. A low-volume flowcell is also available for
applications where sample flowrate and pressure can be carefully controlled. Figure 1 shows a
typical installation including the optional pH sensor.
For connection of the sensor to the electronics, a 25' cable is supplied. An additional 100 feet of
interconnect cable may be added using #07-0100 junction box. All required spare parts are also
provided with the basic system, including spare membranes, electrolyte, o-rings, and any special
hardware.
O&M Manual
Rev F (8/17)
Figure 1 - Typical System Diagram
5
Page 6
ATI Q46H/85 PAA System Part 2 – Analyzer Mounting
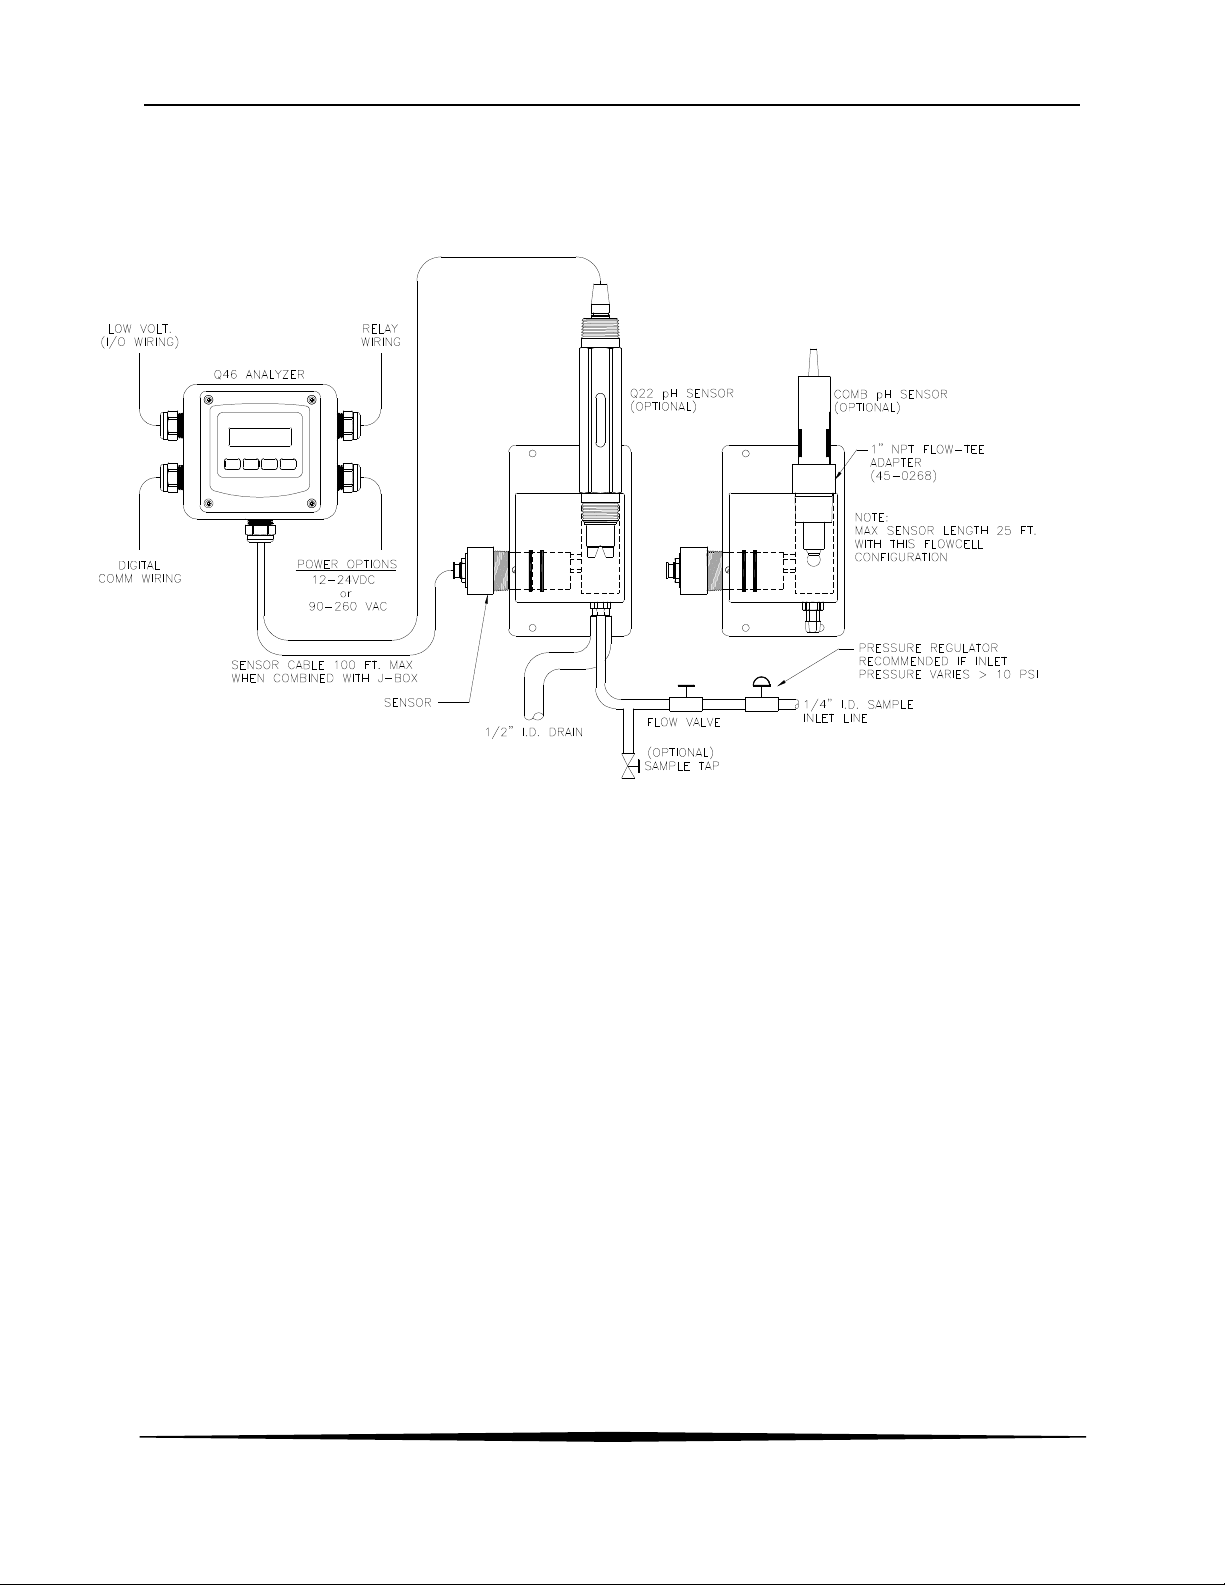
Figure 2 below shows the same standard flowcell assembly and PAA sensor along with the
conventional type pH sensor. A special adapter is required to hold the pH sensor in its proper
location in the flowcell inlet chamber.
Figure 2 - Monitoring System w/Bayonet Style pH Snsor
O&M Manual
Rev F (8/17)
6
Page 7
ATI Q46H/85 PAA System Part 2 – Analyzer Mounting
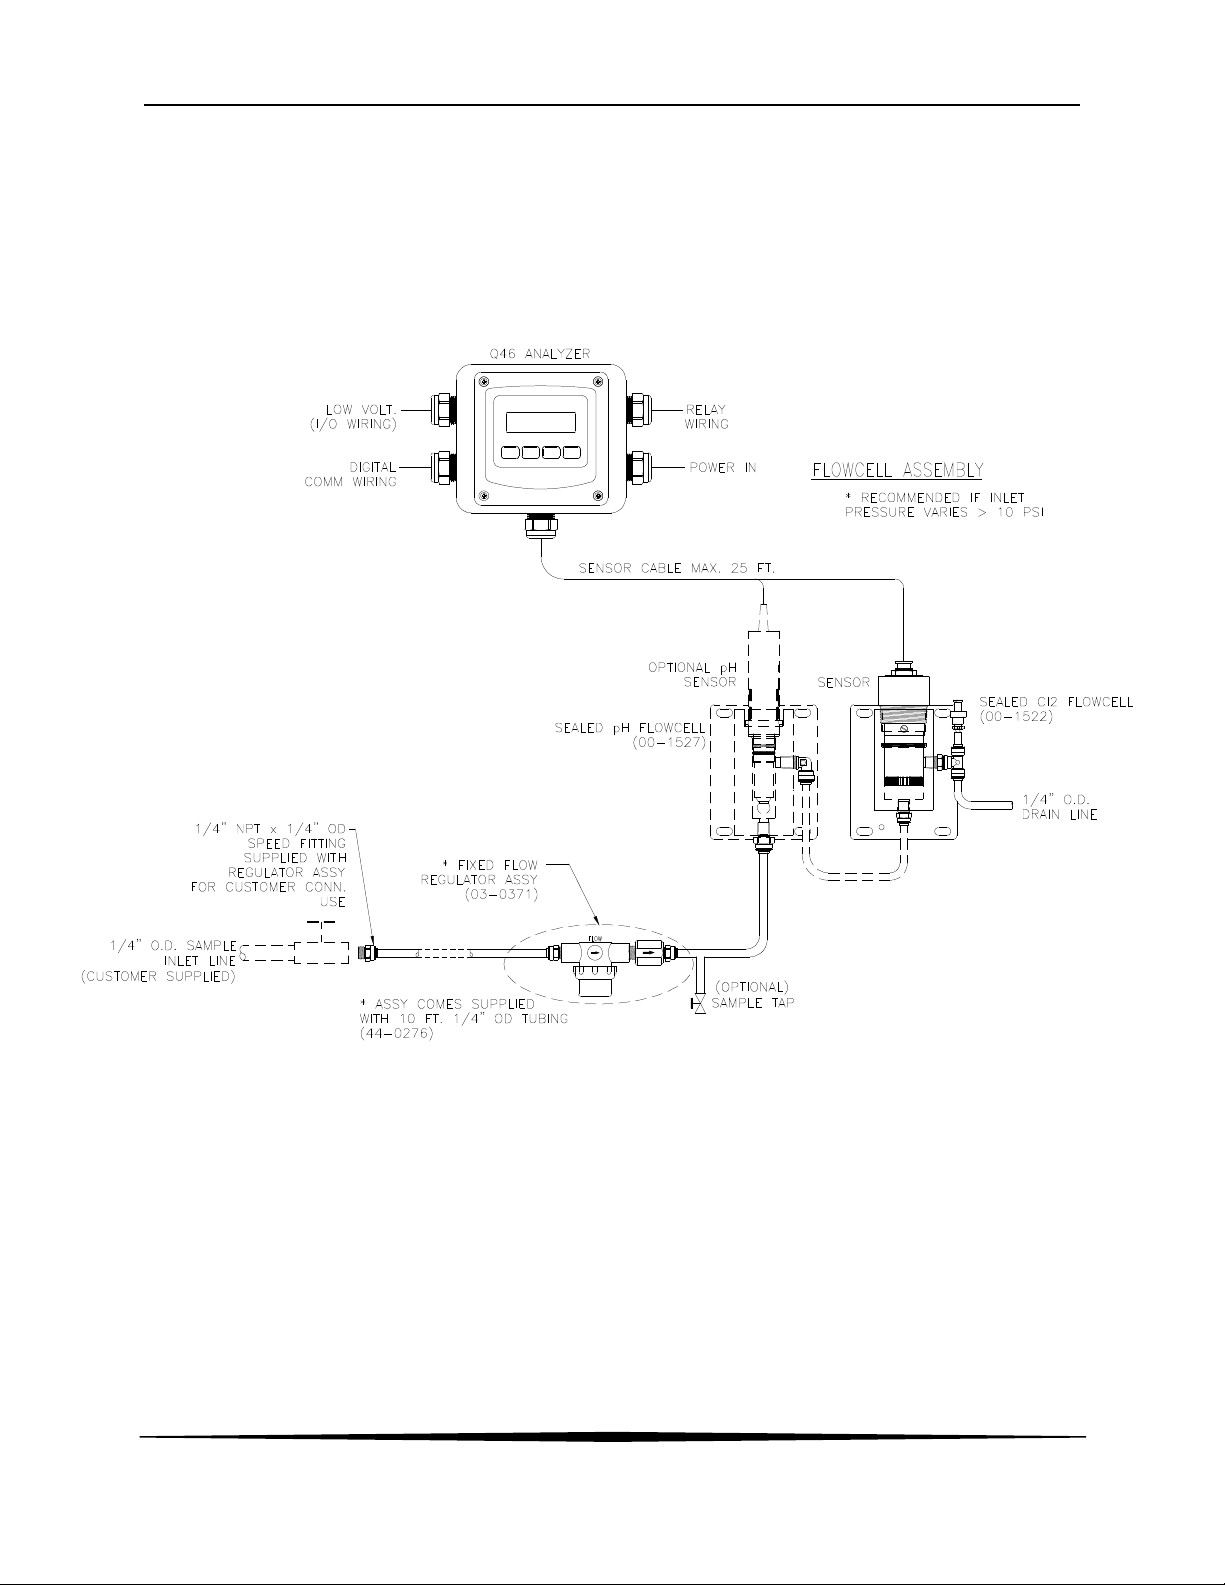
Figure 3 below shows an installation using a (00-1522) sealed flowcell for the PAA sensor and a (00-
1527) sealed flowcell for the pH sensor. This type of installation requires careful flow control. We
recommend the use of our (03-0371) flow control assembly when using sealed flowcells. This assembly
consists of an in-line filter and a fixed-flow regulator which will maintain a constant 400 cc/min flowrate
through the system. This flow will be maintained so long as inlet pressures are between 5 and 125 PSIG.
The in-line filter is used mainly to protect the flow control element against larger particles that might cause
plugging of the device.
Figure 3 - Sealed Flowcell Assemblies w/Flow Control
7
O&M Manual
Rev F (8/17)
Page 8

ATI Q46H/85 PAA System Part 2 – Analyzer Mounting
1.3 Features
• Standard Q46H Analyzers have fully inputs and outputs. Analog outputs are additionally
completely isolated from each other
• Available in either 90-260 VAC or 12-24 VDC power supply systems. All features remain the
same in both variations.
• Output Hold, Output Simulate, Output Alarm, and Output Delay Functions. All forced changes in
output condition include bumpless transfer to provide gradual return to on-line signal levels and to
avoid system control shocks on both analog outputs.
• Three 6 amp SPDT relay outputs and two analog 4-20 mA outputs are standard. Software
settings for relay control include setpoint, deadband, phase, delay, and failsafe. An optional 3relay card for low voltage signals is available to bring the total to 6 relays.
• Selectable PID controller on main analog output. PID controller can operate with instrument
configured as loop-power transmitter, or as one of the two outputs on the AC powered instrument.
PID includes manual operation feature, and diagnostic “stuck-controller” timer feature for relay
notification of control problems.
• Two analog outputs on the relay version may be configured to track PAA and temperature, PAA
and PAA, or PAA and pH. Both analog outputs can be individually programmed to fail to specific
values.
• Digital communication option for Profibus-DP, Modbus-RTU, or Ethernet-IP. See Q46 Digital
Communications Manual for Specifications.
• Diagnostic messages provide a clear description of any problem with no confusing error codes to
look up. Messages are also included for diagnosing calibration problems.
• Quick and easy one-point calibration method and sensor zero-cal. To provide high accuracy, all
calibration methods include stability monitors that check temperature and main parameter stability
before accepting data.
• Security lock feature to prevent unauthorized tampering with transmitter settings. All settings can
be viewed while locked, but they cannot be changed.
O&M Manual
Rev F (8/17)
8
Page 9

ATI Q46H/85 PAA System Part 2 – Analyzer Mounting
1.4 Q46/85 System Specifications
Displayed Parameters Main input, 0.01 ppm to 2000 ppm
Sensor temperature, -10.0 to 55.0 °C (23 to 131 ºF)
Sensor Current, 0.0–999.9 nA, 0.000 to 99.99 uA
Loop current, 4.00 to 20.00 mA
Sensor slope/offset
Model number and software version
PID Controller Status
Optional pH Input value. 0.00 to 14.00 pH
Main Parameter Ranges Manual selection of one of the following ranges,
0.00 to 20.00 ppm
0.0 to 200.0 ppm
0 to 2000 ppm
Display 0.75” (19.1 mm) high 4-digit main display with sign
12-digit secondary display, 0.3" (7.6 mm) 5x7 dot matrix.
Integral LED back-light for visibility in the dark.
Weight Approximately 5 lbs. (2.3 Kg) with sensor & flowcell
Ambient Temperature Analyzer Service, -20 to 60 °C (-4 to 140 ºF)
Sensor Service, -5 to 55°C (23 to 131 °F)
Ambient Humidity 0 to 95%, non-condensing
EMI/RFI Influence Designed to EN 61326-1, CE Marked
Output Isolation 600 V galvanic isolation
Filter Adjustable 0-9.9 minutes additional damping to 90% step input
Temperature Input Pt100 RTD with automatic compensation
Sensor 2-electrode polarographic membrane sensor for direct
Sensor Materials PVC and PEEK
Electrical Certification Ordinary Location, cCSAus (CSA and UL standards - both CSA
Sensor Cable 25 ft. (7.5 meter) cable with 6-pin plug.
Max. Sensor-to-Analyzer 100 feet (30.5 meters), with junction box
Distance
Flow Cell Constant head overflow, clear cast acrylic, 7-30 GPH, 15 GPH
Storage, -5 to 70 °C (-22 to 158 ºF)
measurement of PAA,
approved), pollution degree 2, installation category 2
recommended, inlet is ¼” hose barb at 1/8” MNPT, outlet is ½”
hose barb at 3/8” MNPT
O&M Manual
Rev F (8/17)
9
Page 10

ATI Q46H/85 PAA System Part 2 – Analyzer Mounting
Power 90 - 260 VAC, 50-60 Hz, 10 VA max or
12-24 VDC, 500 mA max.
Enclosure NEMA 4X (IP-66), polycarbonate, stainless steel hardware,
weatherproof and corrosion resistant,
Mounting Options Wall or pipe mount bracket standard. Bracket suitable for either
1.5” or 2” I.D. U-Bolts for pipe mounting.
Panel mount adapter optional.
Conduit Openings Five ½” NPT openings, Adapter can be removed to provide a 1”
NPT opening in the bottom of the enclosure. Gland seals
provided but not installed.
Relays, Electromechanical: Three SPDT, 6 amp @ 250 VAC, 5 amp @ 24 VDC contacts.
Software selection for setpoint, phase, delay, deadband, hi-lo
alarm, and failsafe. A-B indicators on main LCD, and C indicator
on lower display.
Optional Relays: Three additional non-isolated low power relays available. SPST,
1 Amp @ 30 VDC.
Analog Outputs Two 4-20 mA outputs. Output one programmable for PPM PAA
or PID. Output 2 programmable for PPM PAA or Temperature.
Max load 500 Ohms for each output. Outputs ground isolated
and isolated from each other. An additional 3rd analog option is
available.
1.5 Q46H Performance Specifications
Accuracy 0.5% of selected range or 0.02 PPM
Repeatability 0.3% of selected range or 0.01 PPM
Sensitivity 0.05% of selected range
Non-linearity 0.1% of selected range
Warm-up Time 3 seconds to rated performance (electronics only)
Supply Voltage Effects ± 0.05% span
Instrument Response Time 60 seconds to 90% of step input at lowest damping
Equipment bearing this marking may not be discarded by traditional methods
in the European community after August 12 2005 per EU Directive
2002/96/EC. End users must return old equipment to the manufacturer for
proper disposal.
O&M Manual
Rev F (8/17)
10
Page 11
ATI Q46H/85 PAA System Part 2 – Analyzer Mounting
Part 2 – Analyzer Mounting
2.1 General
All Q46 Series instruments offer maximum mounting flexibility. A bracket is included with each
unit that allows mounting to walls or pipes. In all cases, choose a location that is readily
accessible for calibrations. Also consider that it may be necessary to utilize a location where
solutions can be used during the calibration process. To take full advantage of the high contrast
display, mount the instrument in a location where the display can be viewed from various angles
and long distances.
Locate the instrument in close proximity to the point of sensor installation - this will allow easy
access during calibration. The sensor-to-instrument distance should not exceed 100 feet. To
maximize signal-to-noise ratio however, work with the shortest sensor cable possible. The
standard cable length of the PAA sensor is 25 feet.
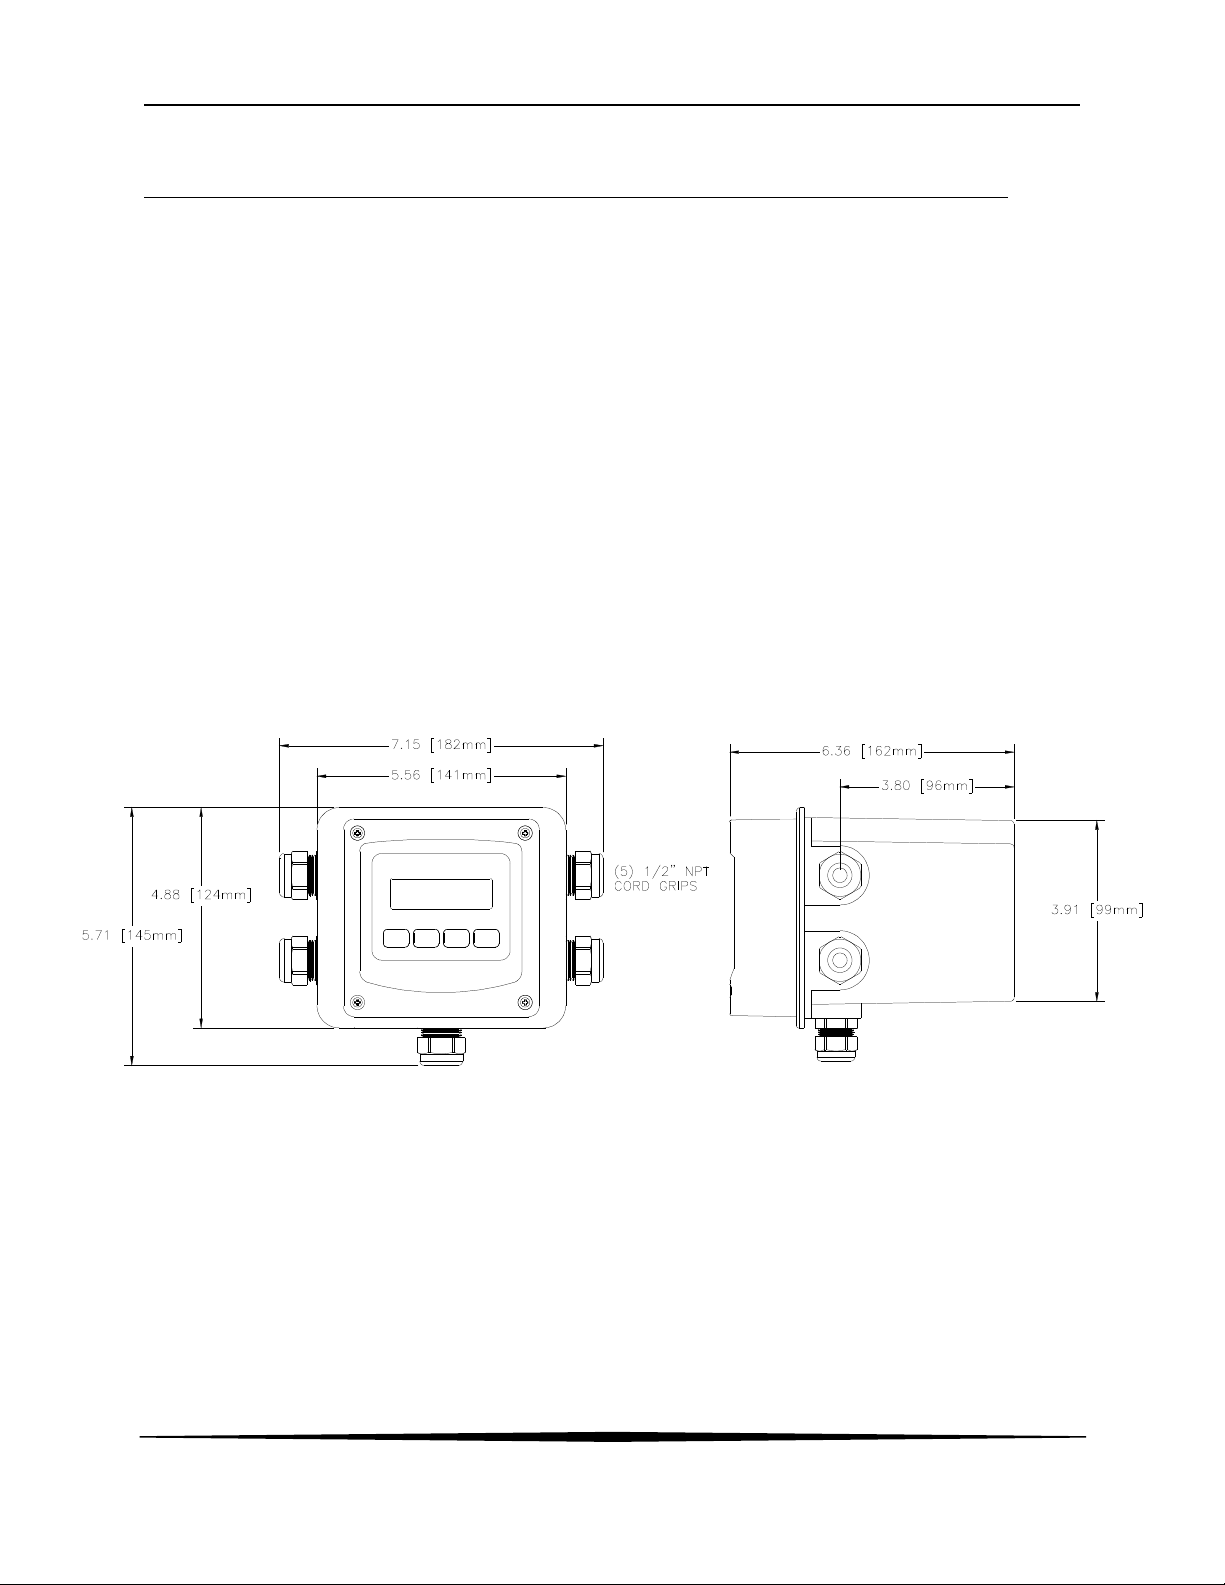
Due to the flexibility of the instrument design, some of the mounting features change based on
the configuration that was ordered. For example, the 2-wire transmitter version is different for the
115/230 VAC controller because the rear of the enclosure is much deeper when the AC powered
unit is used. In addition, the AC powered unit has an integrated panel mount flange requiring a
single cutout for flush mounting.
Figure 4 – Q46 Enclosure Dimensions
11
O&M Manual
Rev F (8/17)
Page 12
ATI Q46H/85 PAA System Part 2 – Analyzer Mounting
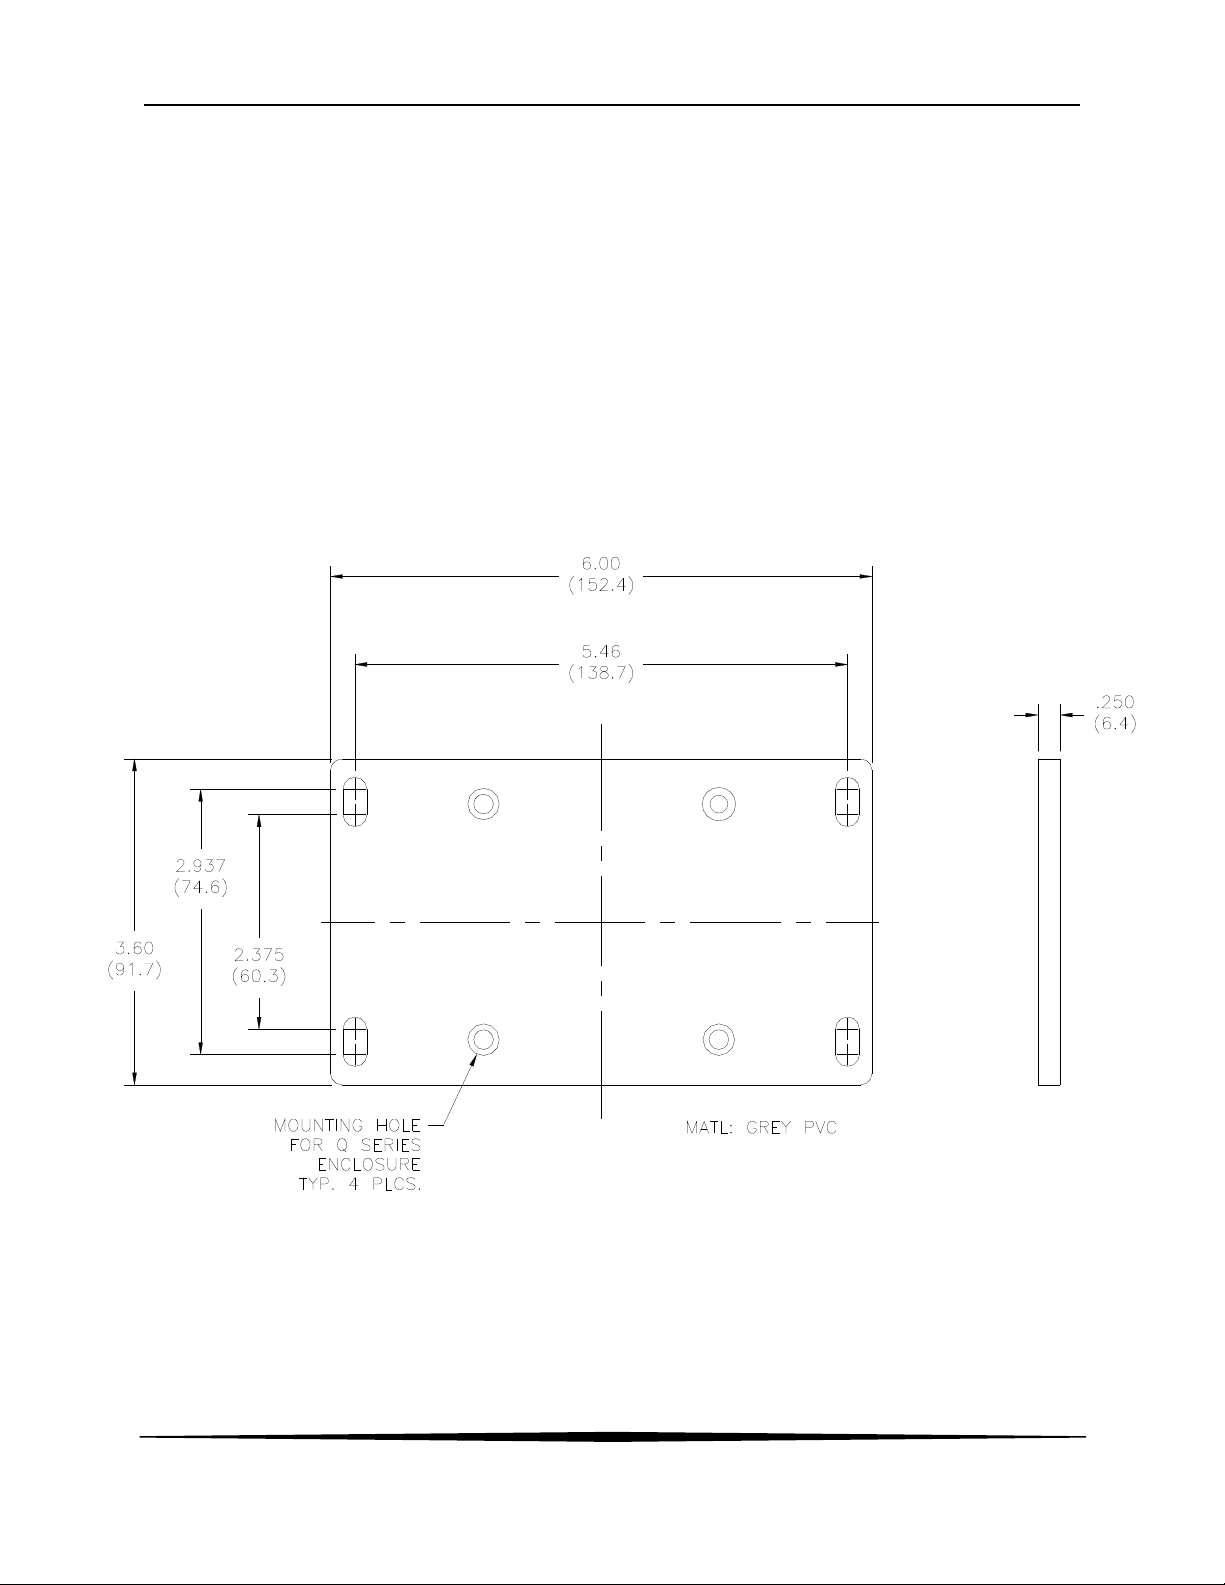
2.2 Wall or Pipe Mount
A PVC mounting bracket with attachment screws is supplied with each transmitter as shown in
Figure 5. The multi-purpose bracket is attached to the rear of the enclosure using the four flat
head screws. The instrument is then attached to the wall using the four outer mounting holes in
the bracket. These holes are slotted to accommodate two sizes of u-bolt that may be used to
pipe mount the unit. Slots will accommodate u-bolts designed for 1½ “ or 2” pipe. The actual
center to center dimensions for the u-bolts are shown in the drawing. Note that these slots are for
u-bolts with ¼-20 threads. The 1½” pipe u-bolt (2” I.D. clearance) is available from ATI in type
304 stainless steel under part number (47-0005).
Figure 5 - Wall or Pipe mount Bracket
12
O&M Manual
Rev F (8/17)
Page 13
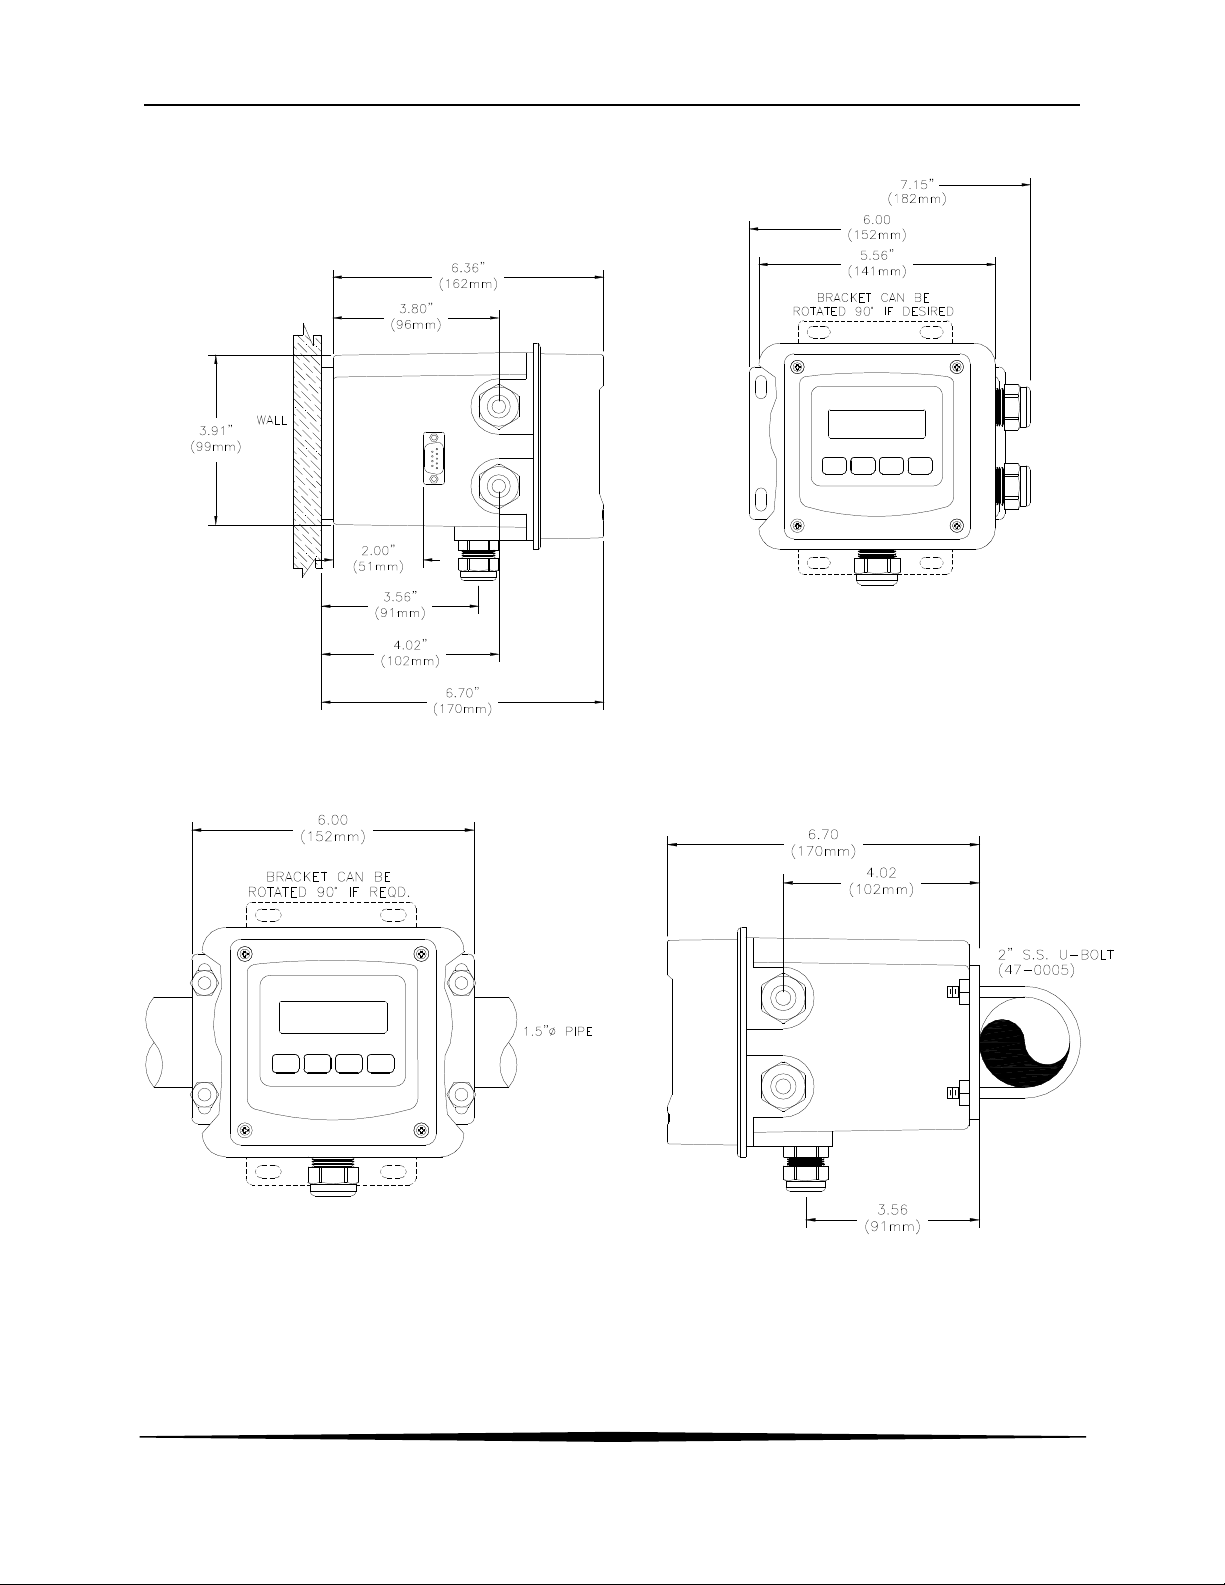
ATI Q46H/85 PAA System Part 2 – Analyzer Mounting
Figure 6 - Wall Mounting Diagram
Figure 7 - Pipe Mounting Diagram
13
O&M Manual
Rev F (8/17)
Page 14
ATI Q46H/85 PAA System Part 2 – Analyzer Mounting
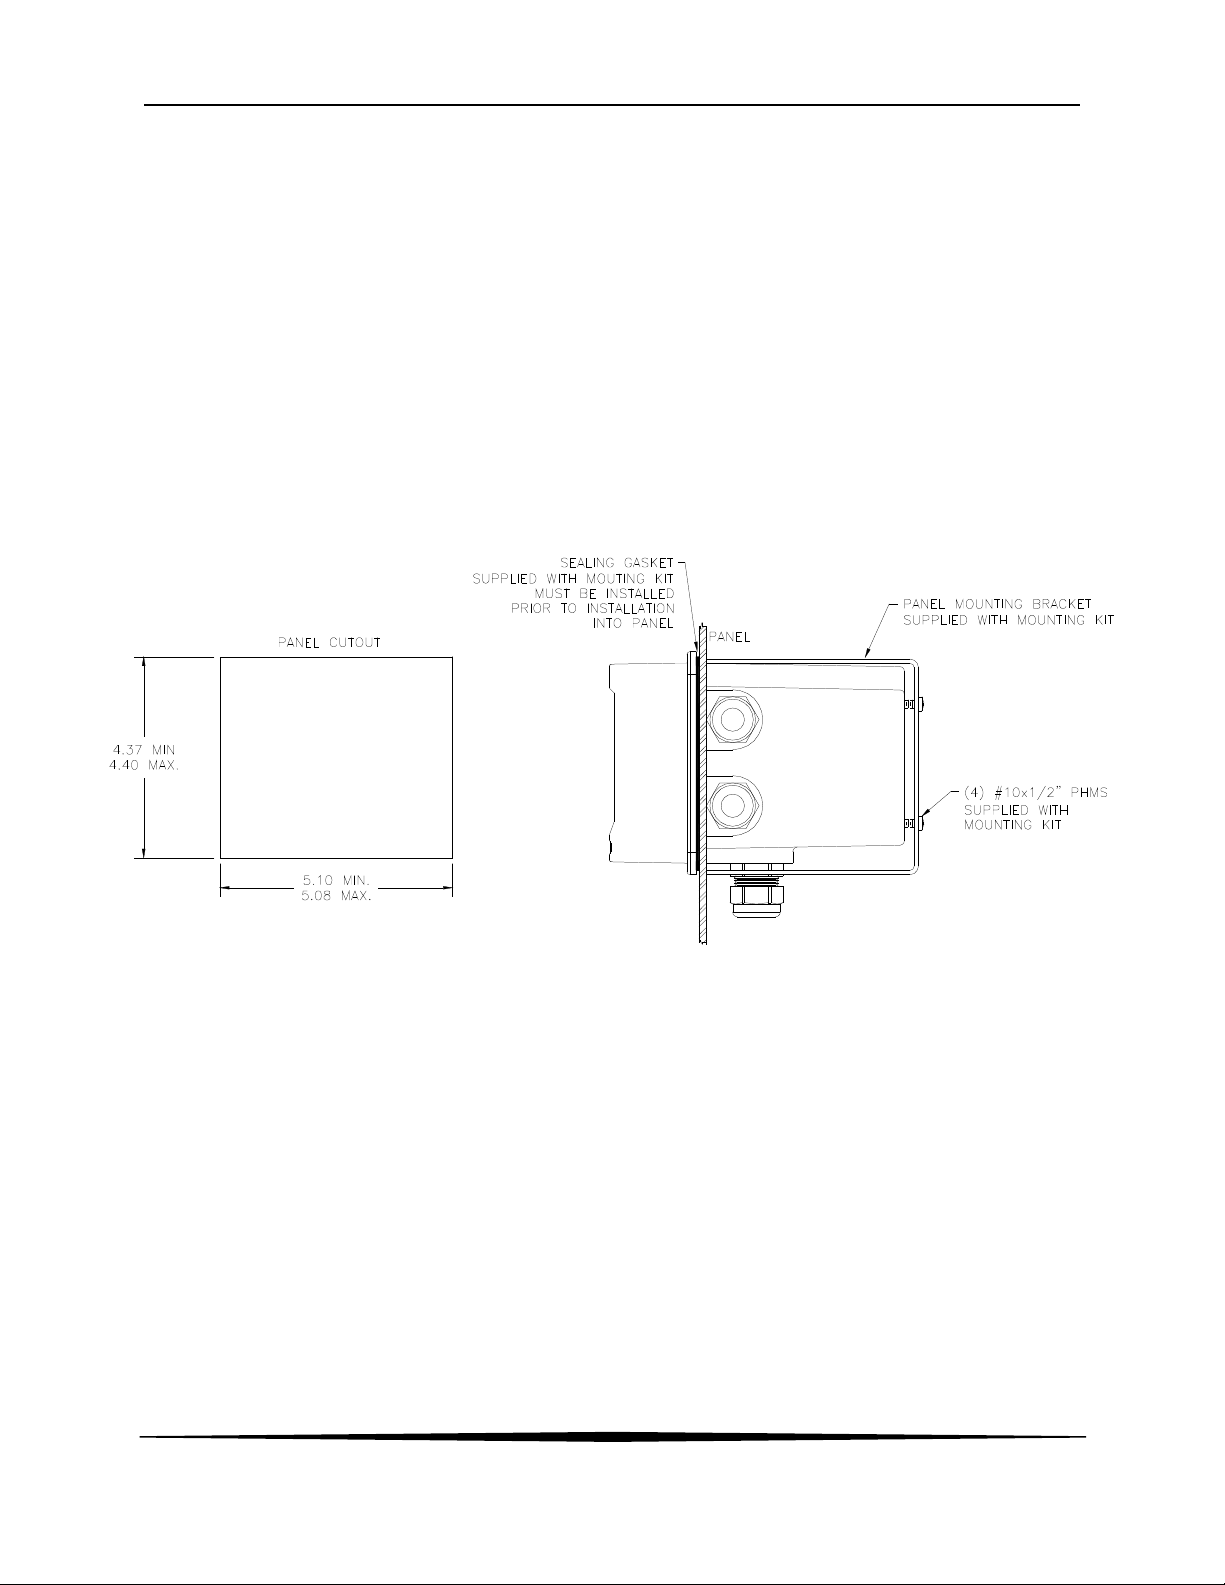
2.3 Panel Mounting
Panel mounting uses the panel mounting flange molded into the rear section of the enclosure.
Figure 8 provides dimensions for the panel cutout required for mounting.
The panel mounting bracket kit must be ordered separately (part number 05-0094). This kit
contains a metal retainer bracket that attaches to the rear of the enclosure, 4 screws for
attachment of this bracket, and a sealing gasket to insure that the panel mounted monitor
provides a water tight seal when mounted to a panel.
The sealing gasket must first be attached to the enclosure. The gasket contains an adhesive on
one side so that it remains in place on the enclosure. Remove the protective paper from the
adhesive side of the gasket and slide the gasket over the back of the enclosure so that the
adhesive side lines up with the back of the enclosure flange. Once in place, you can proceed to
mount the monitor in the panel.
O&M Manual
Rev F (8/17)
Figure 8 - Panel Mount Cutout
14
Page 15
Part 3 – Sensor/Flowcell Mounting
3.1 General
Select a location within the maximum sensor cable length for mounting of the sensor flow cell.
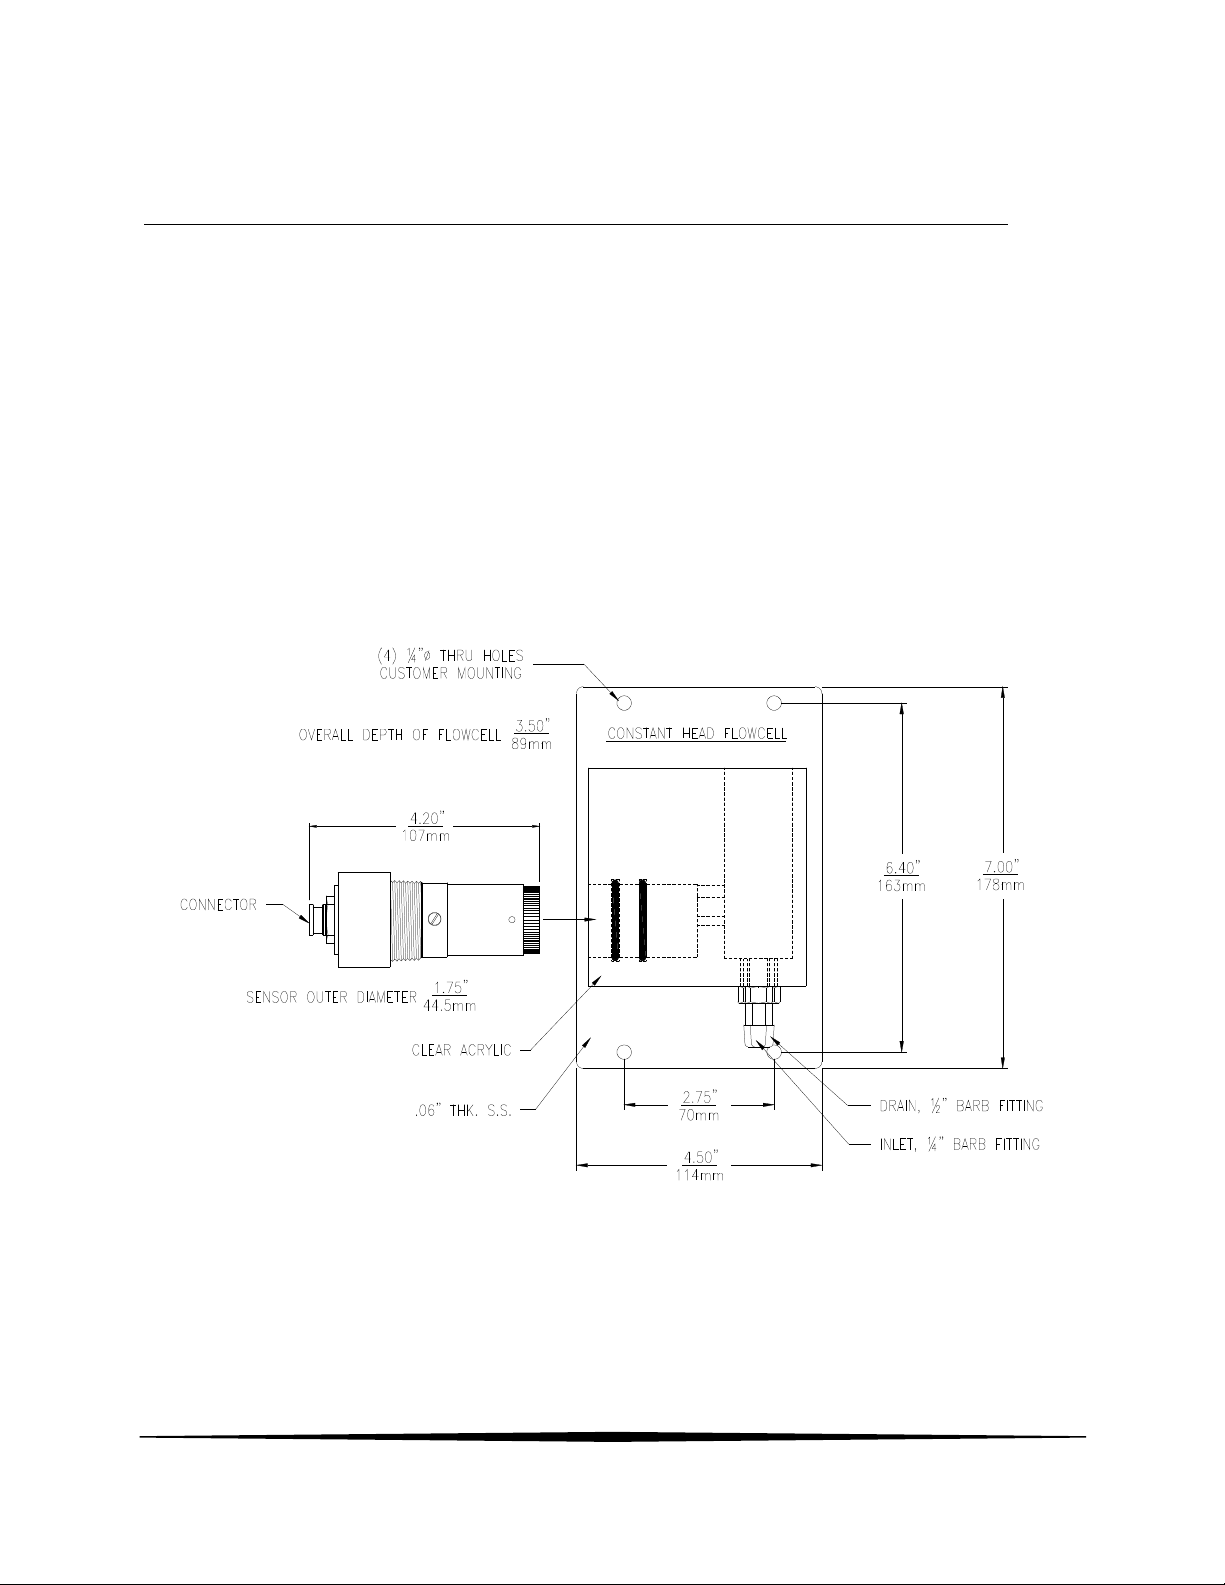
3.2 Constant-Head Flowcell
PAA sensors are best used in a constant-head overflow chamber because variations in sample
flow rate and pressure can cause unstable readings. When monitoring low concentrations (below
0.5 PPM), this method should always be used. Mechanical installation of the flow cell requires
that it be mounted to a wall or other convenient flat surface. Alternatively, the mounting holes on
the plate will accommodate a 2" U-bolt for mounting the plate to a 2" pipe. Figure 9 shows the
dimensions and mounting hole locations for the flow cell. Be sure to allow enough clearance on
the left side of the flow cell for insertion and removal of the sensor. About 12 inches clearance is
recommended.
Once mounted, inlet and drain connections must be made. The flow cell contains a 1/8" MNPT
inlet connection and a 3/8" MNPT drain connection. Hose barbs for the inlet and drain
connections are supplied with the flow cell for use with flexible tubing. The inlet hose barb is
used with ¼" I.D. tubing and the drain hose barb is used with ½" I.D. tubing.
O&M Manual
Rev F (8/17)
Figure 9 - Constant Head Flowcell Details
15
Page 16
ATI Q46H/85 PAA System Part 3 – Sensor/Flowcell Mounting
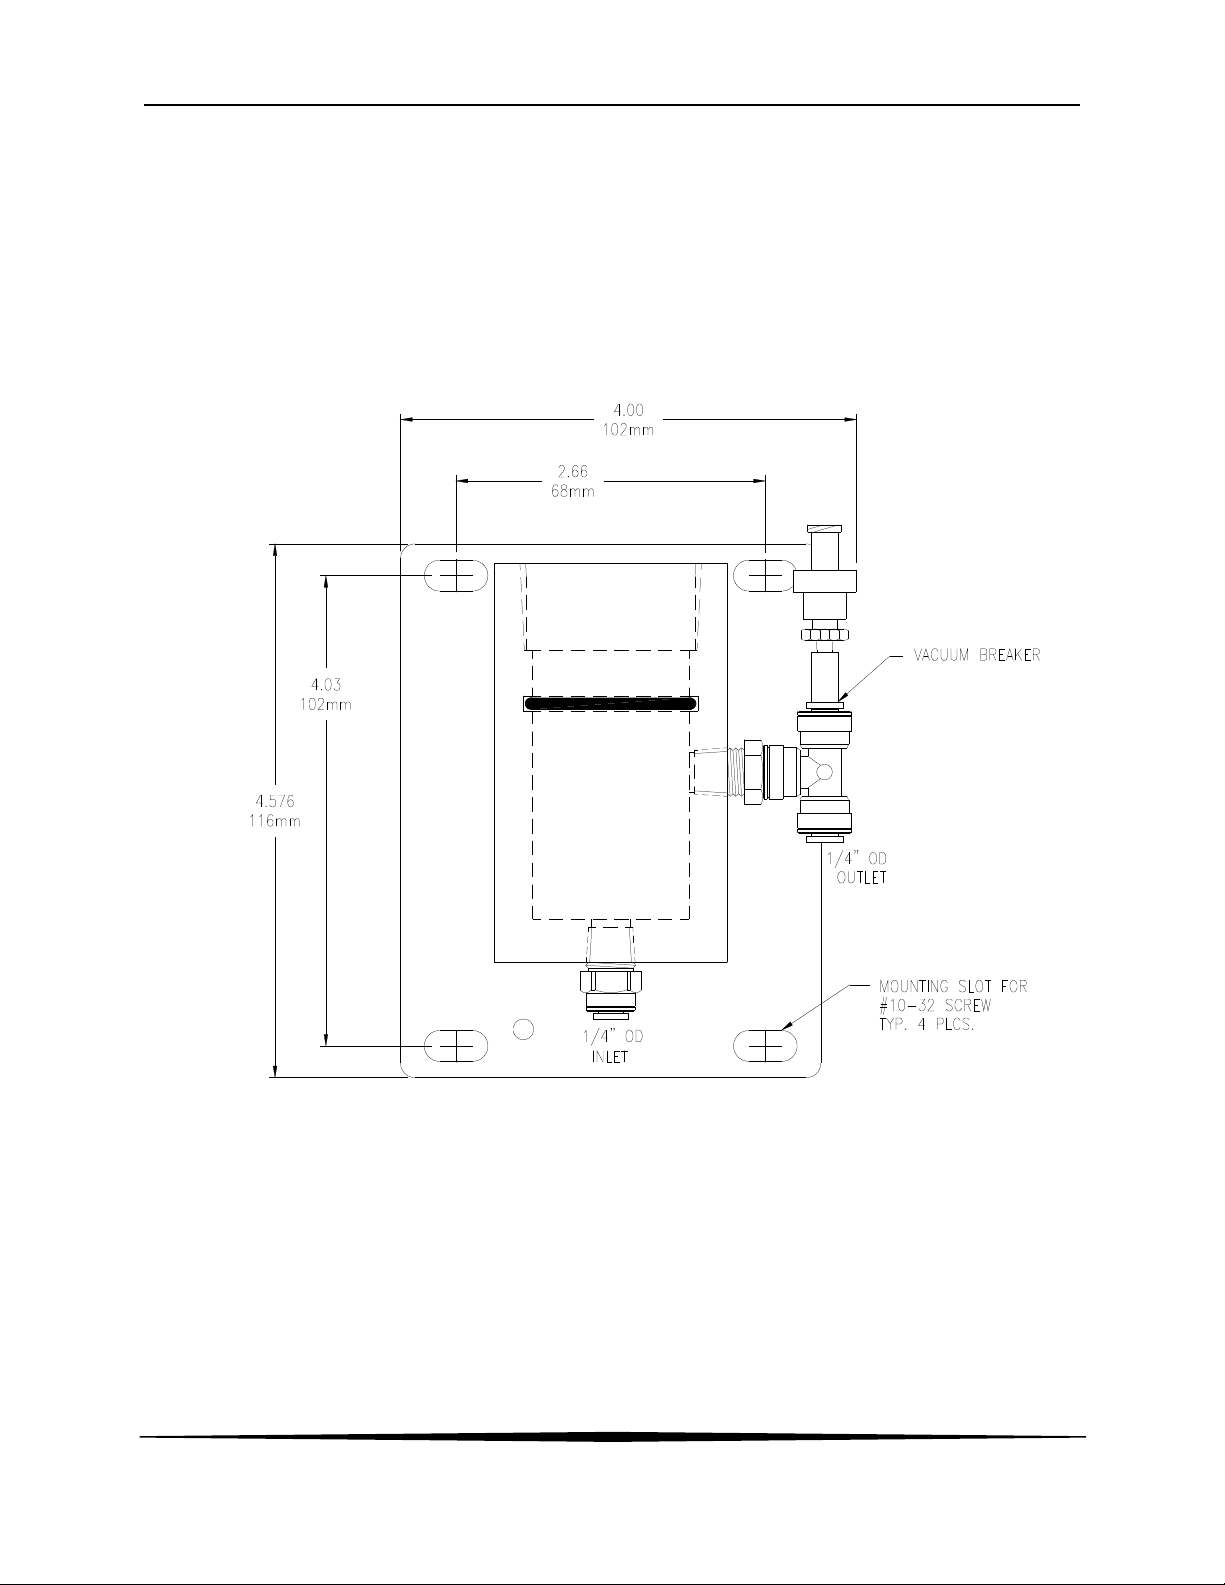
3.3 Sealed Flowcell
Applications where the sample inlet flow is well controlled can use a simpler sealed flowcell.
Using this flowcell requires that flow be controlled externally to about 400 cc/min. Variable flow
rate or variable pressure will cause unstable readings in this flowcell. ATI offers a special flow
control element that can be used ahead of this flowcell on the incoming sample line. The flow
control is part no. (55-0048). It will control the inlet flowrate at 400 cc/min. with inlet pressure
variations from 5-150 PSIG. A 50 micron y-strainer ahead of the flow control element is
recommended. The sealed flowcell provides a drain vent with check valve to avoid pulling a
vacuum on the flow chamber.
O&M Manual
Rev F (8/17)
Figure 10 - Sealed Flowcell Details
16
Page 17
ATI Q46H/85 PAA System Part 3 – Sensor/Flowcell Mounting
O&M Manual
Rev F (8/17)
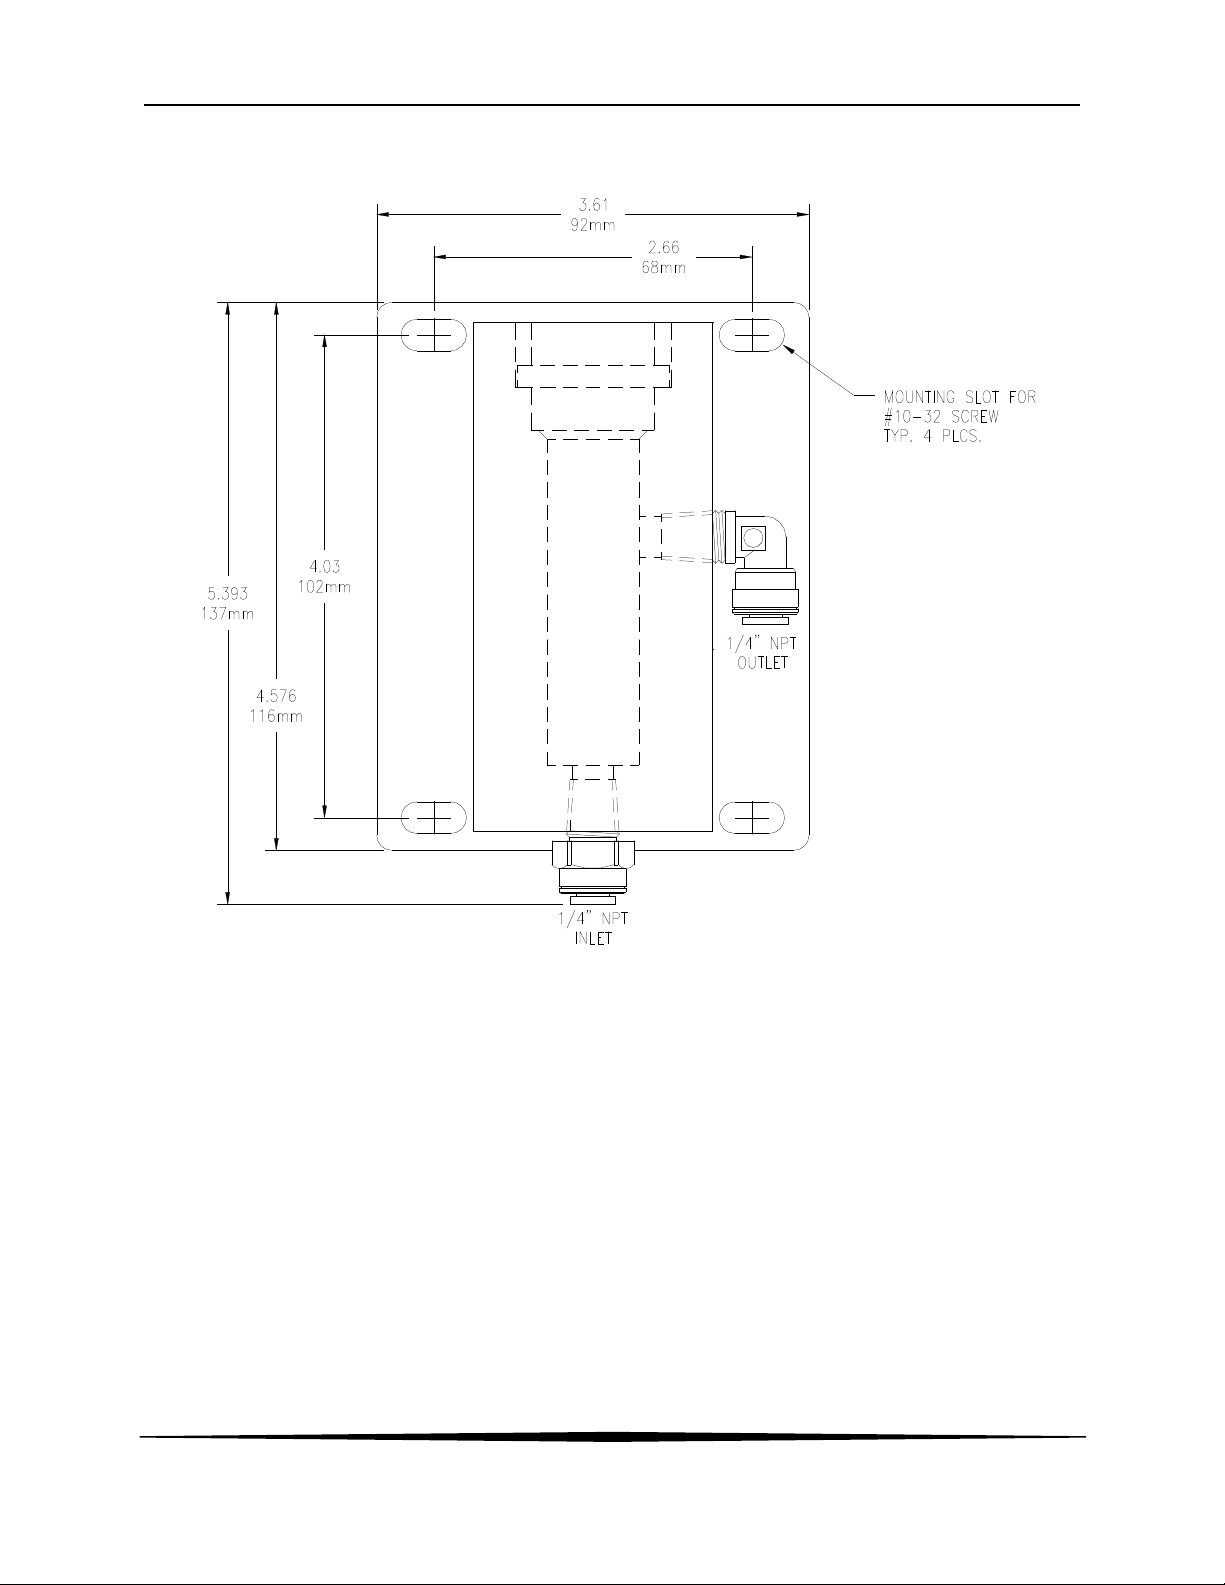
Figure 11 - Sealed pH Flowcell Details
17
Page 18
ATI Q46H/85 PAA System Part 3 – Sensor/Flowcell Mounting
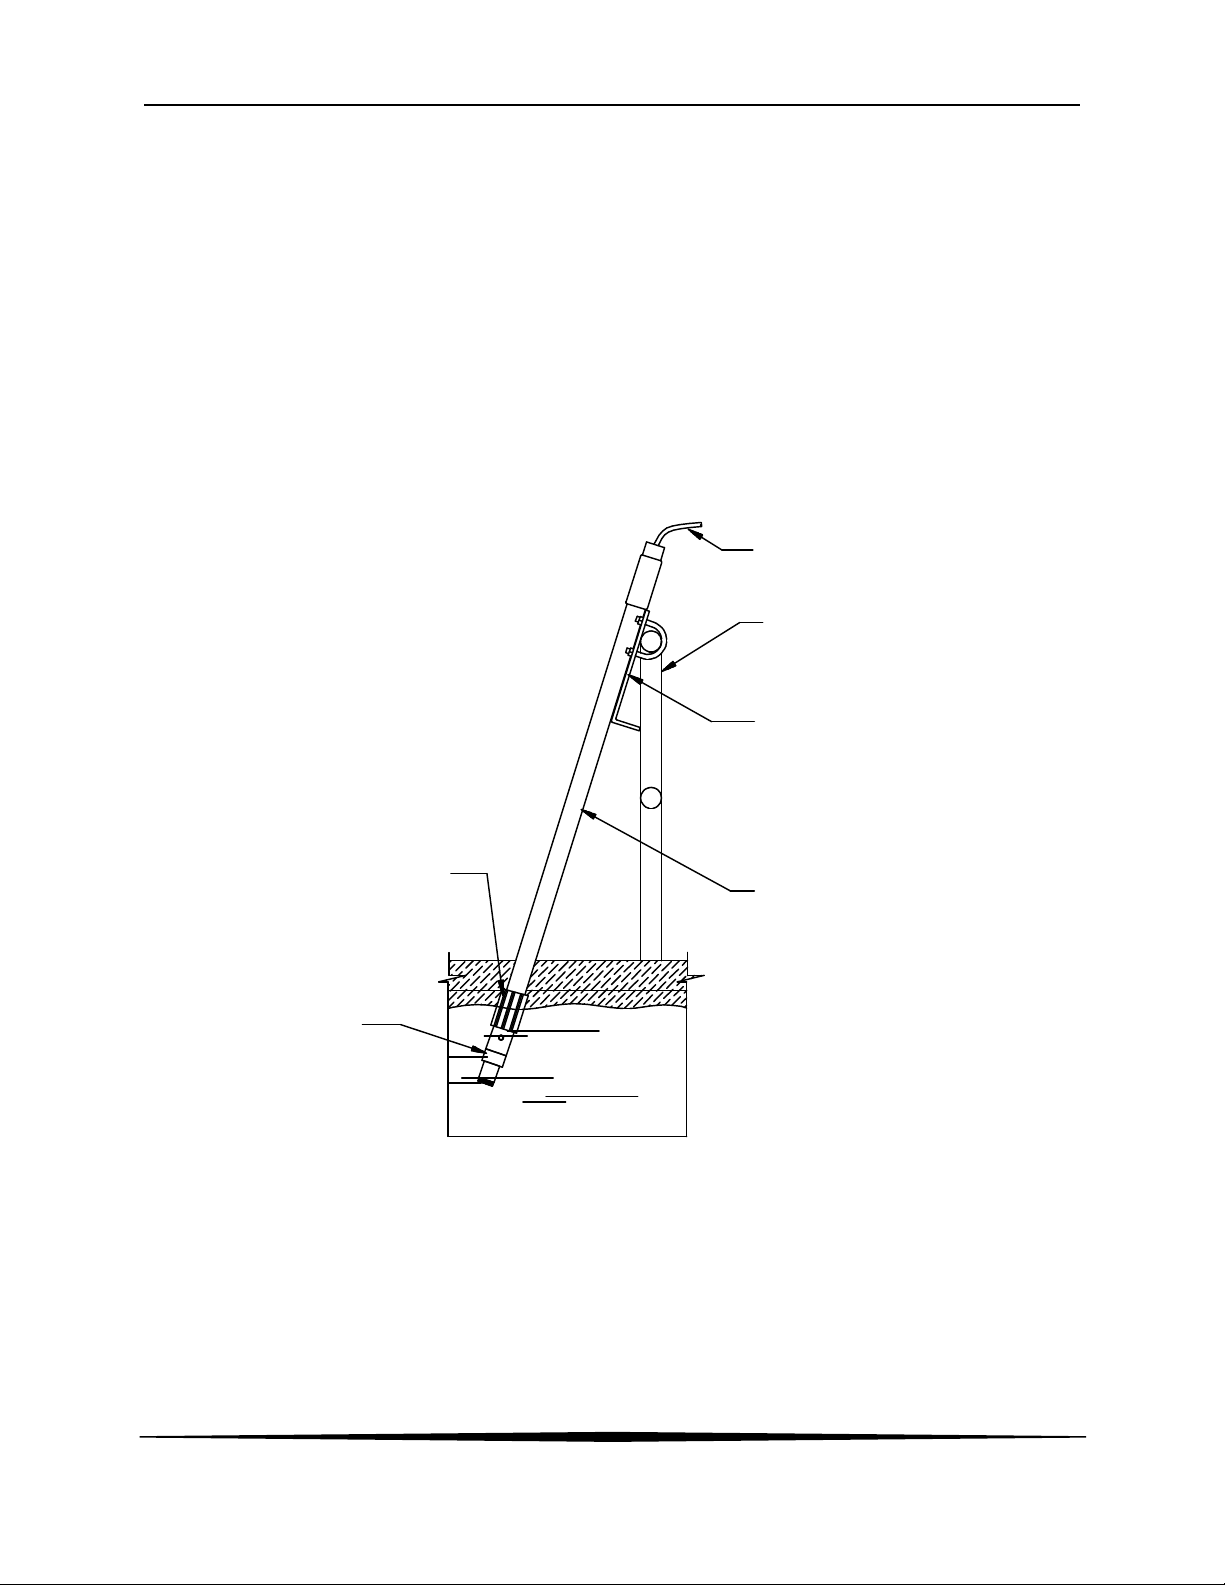
3.4 Submersion Mounting
Some applications are much easier done using the submersible sensor. This method can
sometimes be used where flow is reasonably constant, and hydraulic head does not vary
appreciably. PAA sensors can never be used in completely stagnant conditions. A flow velocity
of at least 0.3 feet per second is normally required for measurement. Any applications for a
submersible PAA sensor should first be discussed with ATI. A trial of such installations may be
necessary.
Submersible sensors are mounted to a 1" pipe using a standard 1" PVC thread by thread pipe
coupling. The mounting pipe can be secured to standard 1½" pipe rail using a mounting bracket
kit available from ATI (part number 00-0628) as shown in Figure 12 - Submersible Sensor Mounting
Assembly
.
SENSOR CABLE
2" HANDRAIL
SWIVEL MOUNTING BRACKET WITH
HARDWARE, SUPPLIED BY ATI
SUPPLIED BY ATI
SENSOR, TYPICAL
2 - 3 FT. SUBMERGENCE
1" ALUMINUM CONDUIT, THREADED1" T x T PVC COUPLING
ONE END OR 1" SCHED 80 PVC PIPE
LENGTH AS REQUIRED
(SUPPLIED BY CUSTOMER)
Figure 12 - Submersible Sensor Mounting Assembly
O&M Manual
Rev F (8/17)
18
Page 19

Part 4 – Electrical Installation
4.1 General
The Q46 is powered in one of two ways, depending on the version purchased. The 12-24 VDC
powered analyzer requires a customer supplied DC power supply. The 90-260 VAC version
requires line power. Please verify the type of unit before connecting any power.
WARNING: Do not connect AC line power to a DC powered unit. Severe damage will
result.
Important Notes:
1. Use wiring practices that conform to all national, state and local electrical codes.
For proper safety as well as stable measuring performance, it is important that the
earth ground connection be made to a solid ground point from TB7. The AC power
supply contains a single 630mA slo-blo fuse (Wickmann/Littlefuse #372-0630). The
fuse F1 is located adjacent to TB7 and is easily replaceable.
2. Do NOT run sensor cables or instrument 4-20 mA output wiring in the same
conduit that contains AC power wiring. AC power wiring should be run in a
dedicated conduit to prevent electrical noise from coupling with the instrumentation
signals.
3. This analyzer must be installed by specifically trained personnel in accordance with
relevant local codes and instructions contained in this operating manual. Observe
the analyzer's technical specifications and input ratings. Proper electrical
disconnection means must be provided prior to the electrical power connected to
this instrument, such as a circuit breaker - rated 250 VAC, 2 A minimum. If one
line of the line power mains is not neutral, use a double-pole mains switch to
disconnect the analyzer.
4. Repeated problems with lightning strikes damaging sensitive instrumentation are
often attributed to poorly bonded earth grounds in the instrument power source. The
protection schemes incorporated into this analyzer cannot operate to maximum
efficiency unless the ground connection is at its’ absolute lowest impedance.
There is no standard ground resistance universally recognized. Many agencies
recommend a ground resistance value of 5 ohms or less. The NEC recommends an
impedance to ground of less than 25 ohms, and less than 5 ohms where sensitive
equipment is installed. Power sources feeding sensitive instruments like the
Q46H/79PR should have the lowest possible impedance to ground.
4.2 Power Connection
Verify the AC power supply requirement before installing. Also verify that power is fully
disconnected before attempting to wire.
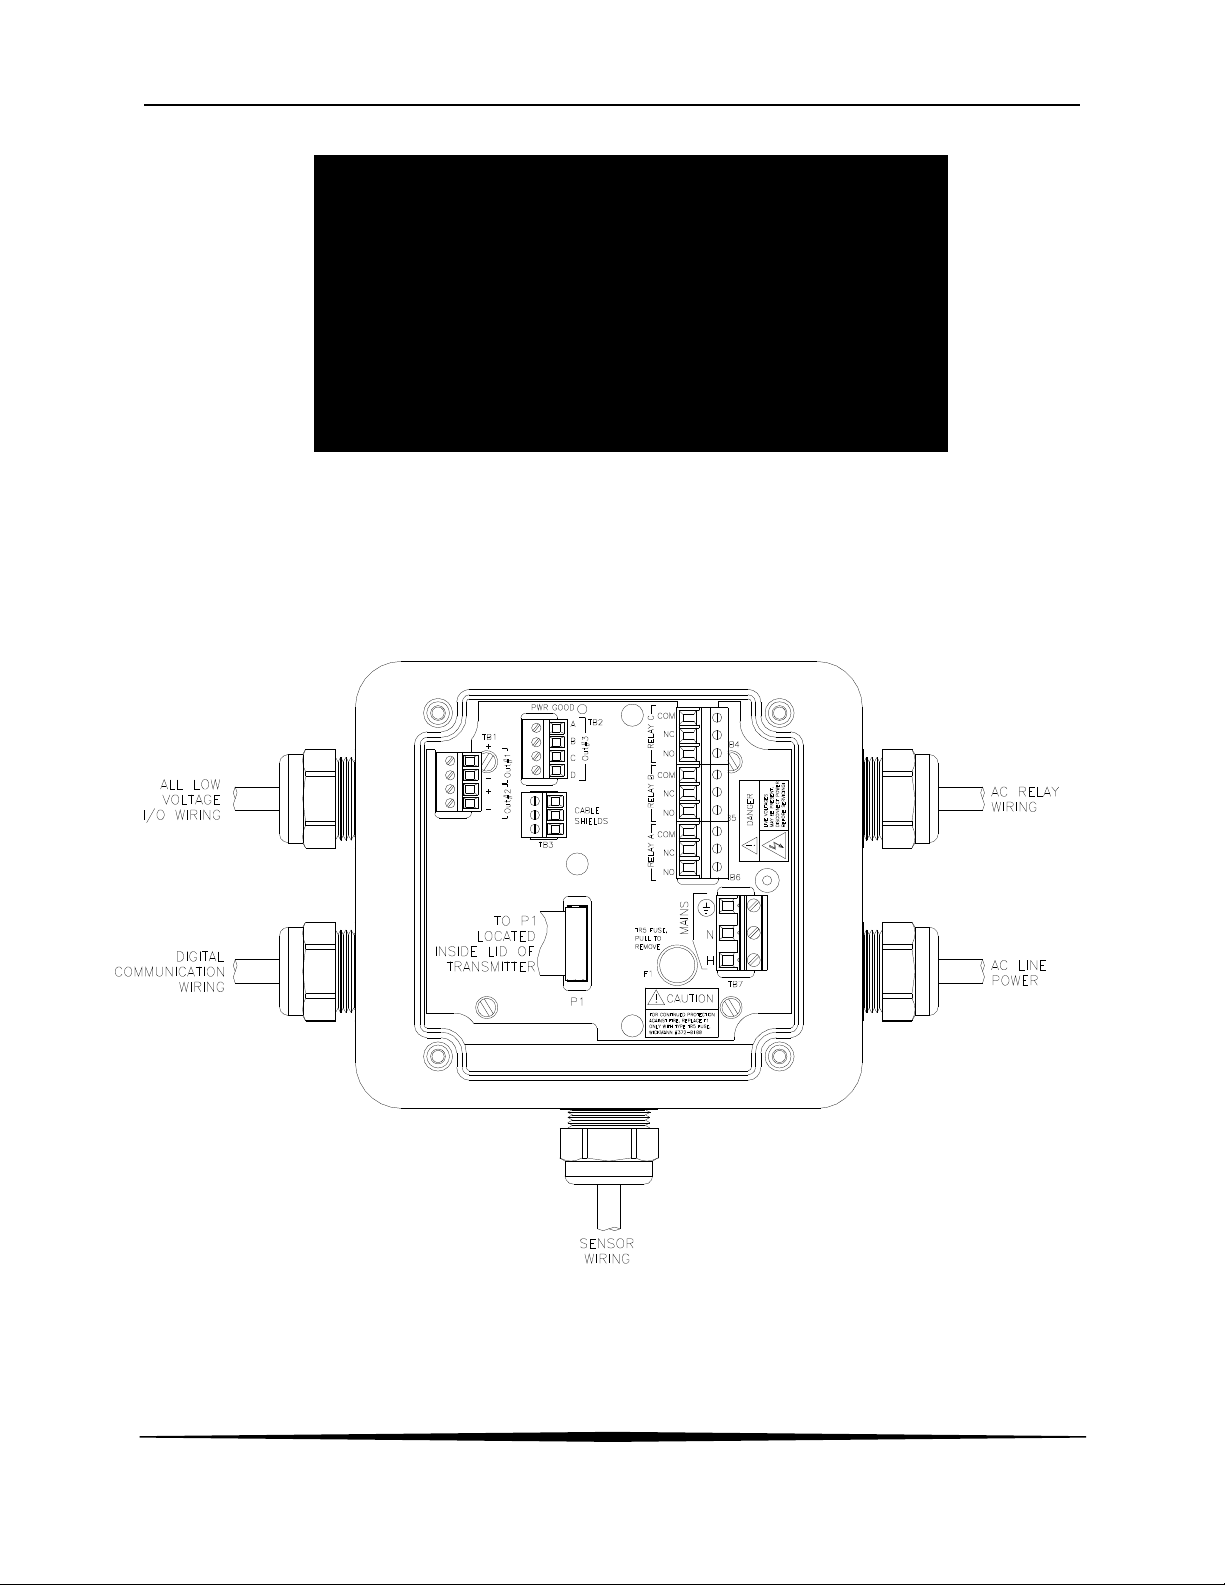
Q46 systems are supplied with 5 cable gland fittings for sealing cable entries.
Connect HOT, NEUTRAL, and GROUND to the matching designations on terminal strip TB7.
O&M Manual
Rev F (8/17)
19
Page 20
ATI Q46H/85 PAA System Part 4 – Electrical Installation
WARNING
Disconnect line power voltage BEFORE connecting
line power wires to Terminal TB7 of the power supply.
wire
ies are
260 VAC operation at the factory at
time of order, and the power supply is labeled as
such. Do NOT connect voltages other than the
The two analog outputs for the standard system are present at terminalTB1. The loop-load
limitation in this configuration is 500 Ohms maximum for each output. Also note that these two
outputs are completely isolated from each other to insure that ground loops do not result from the
connection of both outputs to the same device such as a PLC or DCS.
A ribbon cable connects the power supply assembly with the microprocessor assembly located in
the front section of the enclosure. This cable may be unplugged from the front section of the
monitor if service is needed, but should normally be left in place during installation.
The power supply accepts only standard threesingle phase power. AC power suppl
configured for 90-
labeled requirement to the input.
Figure 13 - Line Power Connection
The power strip, TB7, allows up to 12 AWG wire. A wire gauge of 16 AWG is recommended to
allow for an easy pass-through into the ½” NPT ports when wiring.
20
O&M Manual
Rev F (8/17)
Page 21
ATI Q46H/85 PAA System Part 4 – Electrical Installation
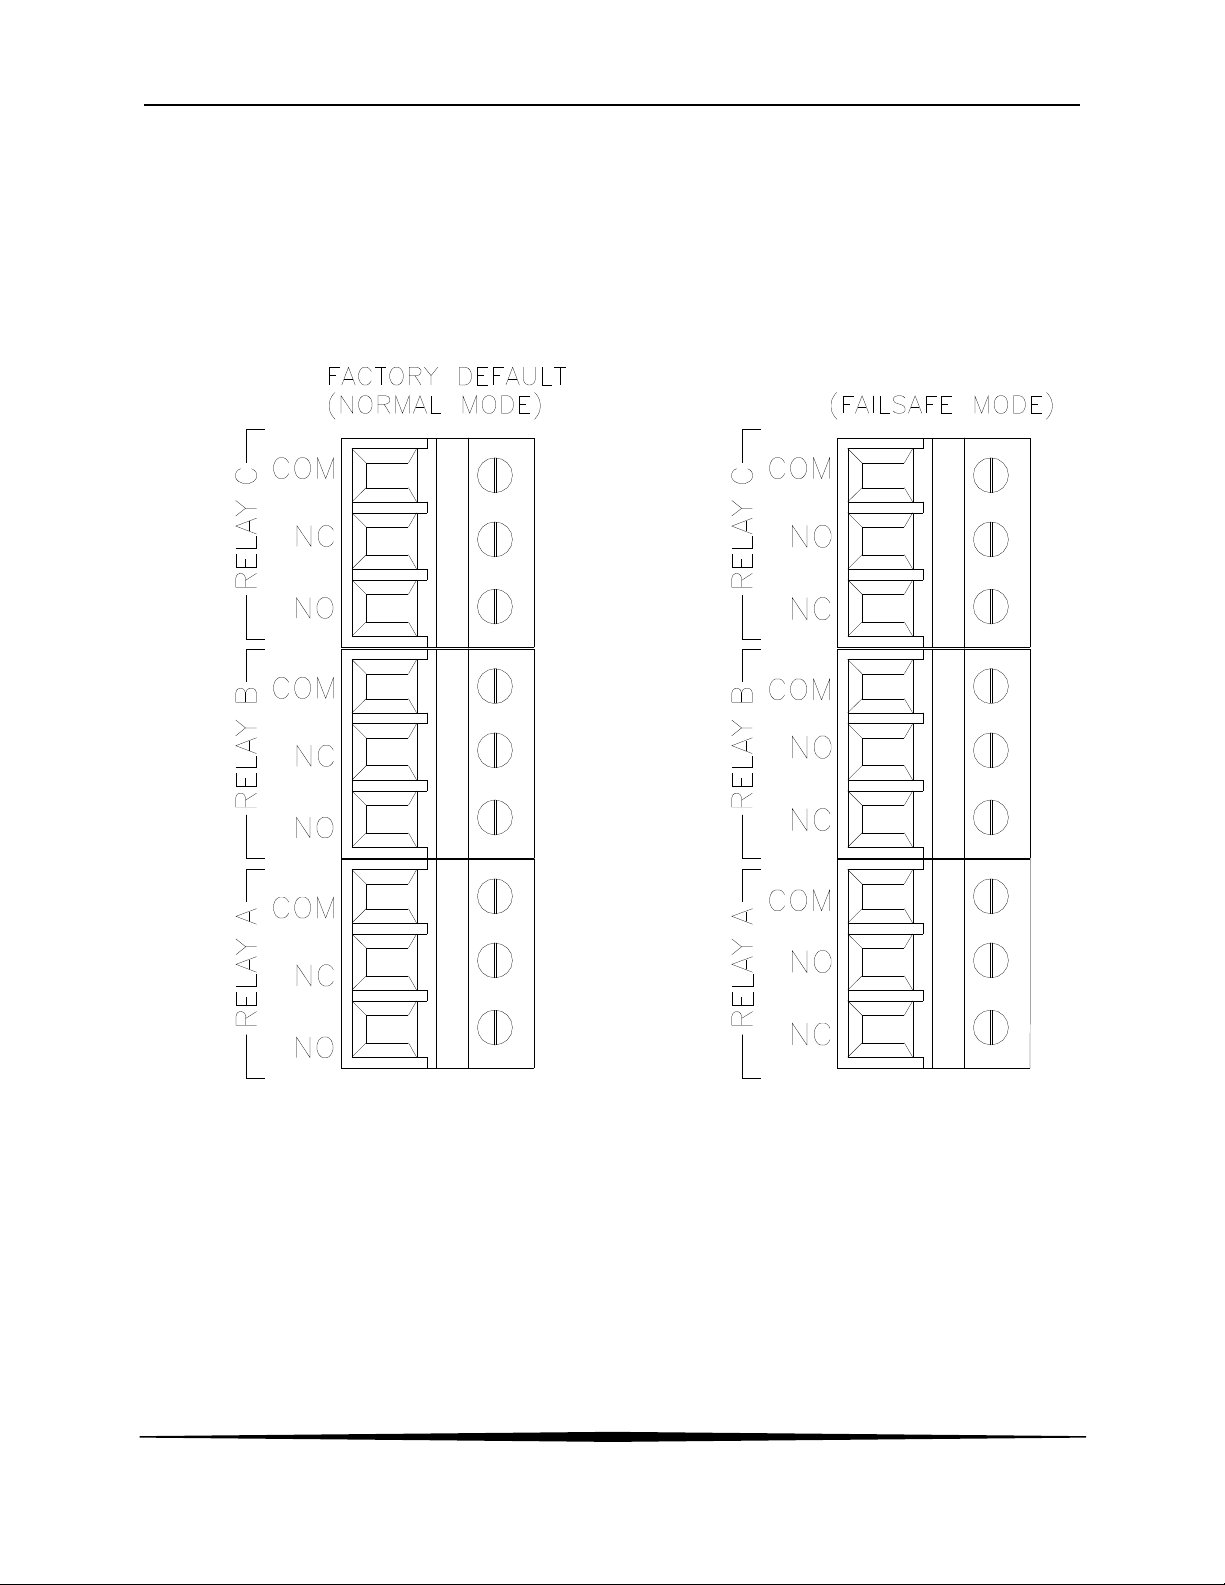
4.3 Relay Connection
Three SPDT relays are provided on the power supply board. None of the relay contacts are
powered. The user must supply the proper power to the contacts. For applications that require
the same switched operating voltage as the Q46 (115 or 230 V), power may be jumpered from
the power input terminals at TB7. Relay wiring is connected at TB4, TB5, and TB6 as shown
below. Note that the relay contact markings are shown in the NORMAL mode. Programming a
relay for “Failsafe” operation reverses the NO and NC positions in this diagram
Figure 14.
O&M Manual
Rev F (8/17)
Figure 14 - Optional Relay Board Wiring
21
Page 22

ATI Q46H/85 PAA System Part 4 – Electrical Installation
TB2, is used to connect to the optional 3-relay card (Figures 14) OR the optional third analog
outputOut#3, Figure 15. The Q46 can be configured for only one of these optional features, and
the hardware for either option must be factory installed.
Figure 15 - Optional Relay Board Wiring
O&M Manual
Rev F (8/17)
Figure 16 - Optional Analog Output Wiring
22
Page 23

ATI Q46H/85 PAA System Part 4 – Electrical Installation
4.4 Direct Sensor Connection
The sensor cable can be routed into the enclosure through one of cord-grips supplied with the
unit. Routing sensor wiring through conduit is only recommended if a junction box is to be used.
Some loose cable is needed near the installation point so that the sensor can be inserted and
removed easily from the flowcell.
Cord-grips used for sealing the cable should be snugly tightened after electrical connections have
been made to prevent moisture incursion. When stripping cables, leave adequate length for
connections in the analyzer enclosure as shown below. The standard 25 ft. sensor cable
normally supplied with the system is already stripped and ready for wiring. This cable can be cut
to a shorter length if desired to remove extra cable in a given installation. Do not cut the cable so
short as to make installation and removal of the sensor difficult.
.
O&M Manual
Rev F (8/17)
Figure 17 - Sensor Cable Preparation
23
Page 24

ATI Q46H/85 PAA System Part 4 – Electrical Installation
4.5 Sensor Wiring
The sensor cable can be quickly connected to the Q46 terminal strip by matching the wire colors
on the cable to the color designations on the label in the monitor. A junction box is also available
to provide a break point for long sensor cable runs. Route signal cable away from AC power
lines, adjustable frequency drives, motors, or other noisy electrical signal lines. Do not run
sensor or signal cables in conduit that contains AC power lines or motor leads.
Note: If sensor is experiencing Low-Slope or Low-Output conditions, due
To poor Earth Ground Connections, move the Shield connection
from P/S board to alternate location on lid, where indicated with an
“S”.
Figure 18 - Sensor Wiring
24
O&M Manual
Rev F (8/17)
Page 25

ATI Q46H/85 PAA System Part 4 – Electrical Installation
4.6 Junction Box Connection
For installations where the sensor is to be located more than 25 feet from the monitor (max. 100
feet), a junction box must be used. The junction box is shown in Figure 19, and is supplied with a
½" conduit hub on one end and a sensor cable gland on the other end. Wiring shown below is
with optional pH sensor installed requiring (07-0382) junction box.
Note: If sensor is experiencing Low-Slope or Low-Output conditions, due
To poor Earth Ground Connections, move the Shield connection
from P/S board to alternate location on lid, where indicated with an
“S”.
O&M Manual
Rev F (8/17)
QUANTUM
Figure 19 - Junction Box Interconnect Wiring
25
Page 26

Part 5 – Sensor Assembly
5.1 PAA Sensor Preparation
The PAA sensor supplied with the Q46 is shipped dry. It will not operate until it is prepared by
adding electrolyte and a membrane. Preparation of the sensor for operation must be done
carefully. The procedure should be done by a qualified technician, and it should only be done
when the system is ready for operation. Until then, it is best to leave the sensor in the condition in
which it is received.
O&M Manual
Rev F (8/17)
Figure 20 - PAA Sensor Assembly
26
Page 27

ATI Q46H/85 PAA System Part 5 – Sensor Assembly
Submersible PAA sensors are made up of two separate parts, a submersion holder that also contains
the temperature compensating element and a sensing module. The sensing module screws into the
holder, with an o-ring providing a water tight connection.
Follow the procedure below to prepare the PAA sensor for operation:
Figure 21 - Submersible PAA Sensor Assembly
1. Unscrew the electrolyte chamber from the assembled sensor and also remove the fill screw
from the side of the sensor body.
2. Remove the front nut from the bottom of the chamber and discard the protective membrane.
O-rings are contained in grooves on both the bottom and top of the chamber. Be sure that
these o-rings remain in place.
3. From the package of membranes supplied with the sensor, place a new membrane into the
front nut. The membrane is white in color and is separated from other membranes by a
light blue paper spacer.
4. Screw the front nut on to the chamber until you feel the o-ring compress. Hand tight
compression is all that is needed. Do not use tools to tighten. The membrane should be flat
across the bottom of the chamber without wrinkles.
5. Fill the chamber with electrolyte until the level reaches the bottom of the internal threads.
6. Slowly screw the chamber onto the sensor body. A small amount of electrolyte will run out of
the hole from which the fill screw was removed. Place a paper towel around the sensor to
absorb the electrolyte overflow. The electrolyte is harmless and will not irritate skin. Tighten
the chamber until the o-ring at the top of the chamber is compressed. Once again, do not
use tools to tighten.
7. Shake excess electrolyte from the fill hole on the side of the sensor and replace the fill screw.
O&M Manual
Rev F (8/17)
27
Page 28

ATI Q46H/85 PAA System Part 5 – Sensor Assembly
The sensor is now ready for operation. The membrane should be stretched tightly across the tip
of the sensor.
CAUTION: When handling the assembled sensor, do not set the sensor on its tip or damage
to the membrane will result. Severe impacts on the tip of the sensor from dropping
or other misuse may cause permanent damage to the sensor.
5.2 Optional pH Sensor
An optional pH battery powered sensor is available for use with the Q46 system that outputs a
nominal signal of 0.3-1.5 VDC proportional to pH over a range of 0-14 pH units. The Q22P is
also available and outputs a standard 4-20 mA analog signal. Both sensors are shipped with a
protective rubber boot containing a small amount of salt solution to keep the glass elements in
good condition and ready for use.
No special preparations are required for use of this electrode. The protective boot should remain
in place until the system is to be placed into continuous service. Do not remove the protective
boot and allow the sensor to sit in the air for an extended period of time. The pH
electrodes MUST stay wet.
When ready for operation, simply remove the rubber boot from the end of the sensor and place
the sensor into the inlet chamber of the PAA overflow cell. It is placed directly above the sample
inlet tube. You will need to slide the flowcell chamber cover out of the way to put the pH sensor
in place.
O&M Manual
Rev F (8/17)
28
Page 29

ENTER
MENU ICONS
12-CHARACTER
Part 6 – Configuration
6.1 User Interface
The user interface for the Q46 Series instrument consists of a custom display and a membrane
keypad. All functions are accessed from this user interface (no internal jumpers, pots, etc.).
SIGN
RELAY/LO-BAT
INDICATOR
4-KEY USER
INTERFACE
RELAY
INDICATOR
A
B
MENU
ESC
4-DIGIT
MAIN DISPLAY
MENU ICONS
CAL
UNITS
CONF
12-CHARACTER
SECONDARY
DISPLAY
MEMBRANE
KEYPAD
DIAG
FAIL
HOLD
UNITS
SECONDARY
DISPLAY
MEMBRANE
KEYPAD
MENU/ESCAPE
KEY
UP ARROW
KEY
Figure 22 - User Interface
29
O&M Manual
Rev F (8/17)
ENTER KEY
LEFT ARROW
KEY
Page 30

ATI Q46H/85 PAA System Part 6 – Configuration
6.11 Keys
All user configurations occur through the use of four membrane keys. These keys are used as
follows:
MENU/ESC To scroll through the menu section headers or to escape from anywhere
in software. The escape sequence allows the user to back out of any
changes in a logical manner. Using the escape key aborts all changes to
the current screen and backs the user out one level in the software tree.
The manual will refer to this key as either MENU or ESC, depending
upon its particular function. In the battery-powered version of the Q46,
UP (arrow) To scroll through individual list or display items and to change number
LEFT (arrow) To move the cursor from right to left during changes to a number value.
ENTER To select a menu section or list item for change and to store any change.
6.12 Display
The large custom display provides clear information for general measurement use and user
configuration. There are three main areas of the display: the main parameter display, the
secondary message line, and the icon area.
Main Parameter During normal operation, the main parameter display indicates the
this is also the ON button.
values.
present process input with sign and units. This main display may be
configured to display any of the main measurements that the system
provides. During configuration, this area displays other useful set-up
information to the user.
O&M Manual
Rev F (8/17)
30
Page 31

ATI Q46H/85 PAA System Part 6 – Configuration
Lower Line During normal operation, the lower line of the display indicates user-
selected secondary measurements that the system is making. This also
includes calibration data from the last calibration sequence and the
transmitter model number and software version. During configuration,
the lower line displays menu items and set-up prompts to the user.
Finally, the lower line will display error messages when necessary. For a
description of all display messages, refer to Section 10.4 Display
Messages.
Icon Area The icon area contains display icons that assist the user in set-up and
indicate important states of system functions. The CAL, CONFIG, and
DIAG icons are used to tell the user what branch of the software tree the
user is in while scrolling through the menu items. This improves
software map navigation dramatically. Upon entry into a menu, the title
is displayed (such as CAL), and then the title disappears to make way for
the actual menu item. However, the icon stays on.
HOLD The HOLD icon indicates that the current output of the transmitter has
been put into output hold. In this case, the output is locked to the last
input value measured when the HOLD function was entered. HOLD
values are retained even if the unit power is cycled.
FAIL The FAIL icon indicates that the system diagnostic function has detected
a problem that requires immediate attention. This icon is automatically
cleared once the problem has been resolved.
O&M Manual
Rev F (8/17)
31
Page 32

ATI Q46H/85 PAA System Part 6 – Configuration
Relay Area A/B The relay area contains two icons that indicate the state of the system
relays (if the relay card is installed). Relay C is normally configured for
FAIL indication, so it is only displayed on the lower MEASURE display
line.
6.2 Software
The software of the Q46 is organized in an easy to follow menu-based system. All user settings
are organized under five menu sections: Measure, Calibration [CAL], Configuration [CONFIG],
Control [CONTROL] and Diagnostics [DIAG].
Note: The default Measure Menu is display-only and has no menu icon.
6.21 Software Navigation
Within the CAL, CONFIG, CONTROL, and DIAG menu sections is a list of selectable items.
Once a menu section (such as CONFIG) has been selected with the MENU key, the user can
access the item list in this section by pressing either the ENTER key or the UP arrow key. The
list items can then be scrolled through using the UP arrow key. Once the last item is reached, the
list wraps around and the first list item is shown again. The items in the menu sections are
organized such that more frequently used functions are first, while more permanent function
settings are later in the list. See Figure 23 for a visual description of the software.
Each list item allows a change to a stored system variable. List items are designed in one of two
forms: simple single variable, or multiple variable sequences. In the single variable format, the
user can quickly modify one parameter - for example, changing temperature display units from °F
to °C. In the multiple variable sequence, variables are changed as the result of some process.
For example, the calibration of PAA generally requires more than one piece of information to be
entered. The majority of the menu items in the software consist of the single variable format type.
A
B
O&M Manual
Rev F (8/17)
32
Page 33

ATI Q46H/85 PAA System Part 6 – Configuration
Any data that may be changed will be flashing. This flashing indicates user entry mode and is
initiated by pressing the ENTER key. The UP arrow key will increase a flashing digit from 0 to 9.
The LEFT arrow key moves the flashing digit from right to left. Once the change has been
completed, pressing ENTER again stores the variable and stops the flashing. Pressing ESC
aborts the change and also exits user entry mode.
The starting (default) screen is always the Measure Menu. The UP arrow key is used to select
the desired display. From anywhere in this section the user can press the MENU key to select
one of the four Menu Sections.
The UP arrow icon next to all list items on the display is a reminder to scroll through the list using
the UP arrow key.
To select a list item for modification, first select the proper menu with the MENU key. Scroll to the
list item with the UP arrow key and then press the ENTER key. This tells the system that the user
wishes to perform a change on that item. For single item type screens, once the user presses the
ENTER key, part or all of the variable will begin to flash, indicating that the user may modify that
variable using the arrow keys. However, if the instrument is locked, the transmitter will display
the message Locked! and will not enter user entry mode. The instrument must be unlocked by
entering the proper code value to allow authorized changes to user entered values. Once the
variable has been reset, pressing the ENTER key again causes the change to be stored and the
flashing to stop. The message Accepted! will be displayed if the change is within pre-defined
variable limits. If the user decides not to modify the value after it has already been partially
changed, pressing the ESC key aborts the modification and returns the entry to its original stored
value.
In a menu item which is a multiple variable sequence type, once the ENTER key is pressed there
may be several prompts and sequences that are run to complete the modification. The ESC key
can always be used to abort the sequence without changing any stored variables.
O&M Manual
Rev F (8/17)
33
Page 34

ATI Q46H/85 PAA System Part 6 – Configuration
MENU
SECTIONS
LIST
ITEMS
Start
MEASURE
(display only)
Temperature
nA
* PID % Output
Loop Current (#1)
Loop Current (#2)
Slope
Offset
Software Version
** pH
** mV
** pH Slope
** pH Offset
MENU
ESC
CAL CONFIG DIAG
ENTER
or
Cal
** Cal pH
Cal Temp
Set Range
MENU
ESC
ENTER
or
Entry Lock
Set Delay
Contrast
Main Units
Zero Filter
Main Display
I out 1 Mode
I out 2 Mode
Relay A Mode
Relay B Mode
Temp Units
pH Input
* pH Type
** pH Buffer
*** pH Comp.
MENU
ESC
CONTROL
ENTER ENTER
or
*PID 0% #1
*PID 100% #1
*PID Setpoint #1
*PID Prop #1
*PID Int #1
*PID Deriv #1
Set 4mA (#1)
Set 20mA (#1)
Set 4mA (#2)
Set 20mA (#2)
MENU
ESC
or
Set Hold
Fault List
Sim Out
*PID Timer
Fail Out #1
Fail Val #1
Fail Out #2
Fail Val #2
Failsafe
Set Default
MENU
ESC
Relay A= AL
Setpnt A- HI
Relay A= FAIL
Relay B= FAIL
Hyst A- HI
Delay A- HI
Setpnt A- LO
Hyst A- LO
Delay A- LO
Phase A
Figure 23 - Software Map
Relay A= CON
Setpnt A
Hyst A
Delay A
Phase A
Relay B= CON
Setpnt B
Hyst B
Delay B
Phase B
* If PID is enabled
** If pH is enabled
*** If pH is enabled and
Instrument is a Type
Q45H0
O&M Manual
Rev F (8/17)
34
Page 35

ATI Q46H/85 PAA System Part 6 – Configuration
6.22 Measure Menu [MEASURE]
The default menu for the system is the display-only menu MEASURE. This menu is a display-only
measurement menu, and has no changeable list items. When left alone, the instrument will
automatically return to this menu after approximately 30 minutes. While in the default menu, the
UP arrow allows the user to scroll through the secondary variables on the lower line of the
display. A brief description of the fields in the basic transmitter version is as follows:
TRANSMITTER MEAS SCREENS:
25.7C Temperature display. Can be displayed in C or F, depending on user
selection. A small “m” on the left side of the screen indicates the
transmitter has automatically jumped to a manual 25C setting due to a
failure with the temperature signal input.
32.0 nA Raw sensor current. Useful for diagnosing problems.
100% 20.00 mA PID Status screen (if enabled.) Shows the present controller output level
on left, and actual transmitter current on the right. The controller can be
placed in manual while viewing this screen by pressing and holding the
ENTER key for 5 seconds until a small flashing “m” appears on the
screen. At that point the controller output can be adjusted up or down
using the UP and LEFT arrow keys. To return to automatic operation,
press and hold the ENTER key for 5 seconds and the “M” will disappear.
#1 4.00 mA Analyzer output current # 1
#2 12.00 mA Analyzer output current # 2
#3 20.00 mA Analyzer output current #3 (if option included)
Aux relay=D,E,F Auxiliary relay annunciators (if option included.)
Slope = 100% Sensor output response vs. ideal calibration. This value updates after
each calibration. As the sensor ages, the slope reading will decay
indicating sensor aging. Useful for resolving sensor problems.
Offset = 0.0 nA Sensor output current at a zero ppm input. This value updates after a
zero-calibration has been performed. Useful for resolving sensor
problems.
Q46S6 v 4.02 Transmitter software version number.
Note: A display test (all segments ON) can be actuated by pressing and holding the
ENTER key while viewing the model/version number on the lower line of the
display.
The MEASURE screens are intended to be used as a very quick means of looking up critical
values during operation or troubleshooting.
O&M Manual
Rev F (8/17)
35
Page 36

ATI Q46H/85 PAA System Part 6 – Configuration
6.23 Calibration Menu [CAL]
The calibration menu contains items for frequent calibration of user parameters. There are four
items in this list: Cal PAA, Cal Temp, Set Range, and Cal Zero.
Cal PAA The PAA calibration function allows the user to adjust the transmitter
span reading to match a reference solution, or to set the sensor zero
point. See Part 7 – Calibration for more details.
Cal pH The pH calibration function allows the user to adjust the
(if enabled) transmitter offset and span to match the sample or reference buffers.
See Part 7 – Calibration. The temperature calibration function allows the
user to adjust the offset of the temperature response by a small factor of
±5 °C. The temperature input is factory calibrated to very high accuracy.
However, long cable lengths and junction boxes may degrade the
accuracy of the temperature measurement in some extreme situations.
Therefore, this feature is provided as an adjustment. See Part 7 –
Calibration for more details.
Cal Temp The temperature calibration function allows the user to adjust the offset
of the temperature response by a small factor of ±5 °C.The temperature
input is factory calibrated to very high accuracy. However, long cable
lengths and junction boxes may degrade the accuracy of the temperature
measurement in some extreme situations. Therefore, this feature is
provided as an adjustment. See Part 7 - Calibration for more details.
Set Range This function allows the user to set the display range of the transmitter to
a specific application. Once set, all output functions use this display
range to establish configuration settings. Press ENTER to initiate user
entry mode, and the value will flash. Use the arrow keys to modify value;
available ranges include 20.00 ppm, 200.0 ppm, and 2000 ppm. Press
ENTER to store the new value. The display range does not affect the
internal auto ranging scaler that, therefore, sensitivity is to specification
in any user selected range.
6.24 Configuration Menu [CONFIG]
The Configuration Menu contains all of the general user settings:
Entry Lock This function allows the user to lock out unauthorized tampering with
instrument settings. All settings may be viewed while the instrument is
locked, but they cannot be modified. The Entry Lock feature is a toggletype setting; that is, entering the correct code will lock the transmitter and
entering the correct code again will unlock it. The code is preset at a
fixed value. Press ENTER to initiate user entry mode and the first digit
will flash. Use arrow keys to modify value. See end of manual for the
Q46H lock/unlock code. Press ENTER to toggle lock setting once
code is correct. Incorrect codes do not change state of lock condition.
O&M Manual
Rev F (8/17)
36
Page 37

ATI Q46H/85 PAA System Part 6 – Configuration
Set Delay The delay function sets the amount of damping on the instrument. This
function allows the user to apply a first order time delay function to the
PAA measurements being made. Both the display and the output value
are affected by the degree of damping. Functions such as calibration are
not affected by this parameter. The calibration routines contain their own
filtering and stability monitoring functions to minimize the calibration
timing. Press ENTER to initiate user entry mode, and the value will
flash. Use the arrow keys to modify value; range is 0.1 to 9.9 minutes.
Press ENTER to store the new value.
Contrast This function sets the contrast level for the display. The custom display
is designed with a wide temperature range, Super-Twist Nematic (STN)
fluid.
The STN display provides the highest possible contrast and widest
viewing angle under all conditions. Contrast control of this type of
display is generally not necessary, so contrast control is provided as a
means for possible adjustment due to aging at extreme ranges. In
addition, the display has an automatic temperature compensation
network. Press ENTER to initiate user entry mode, and the value will
flash. Use arrow keys to modify the value; range is 0 to 8 (0 being
lightest). Press ENTER to update and store the new value.
Main Units This function allows the user to select either PPM or mg/l for
the PAA measurement.
Zero Filter This function forces the reading to zero when reading is below the
entered value. For example, if the entered value were 0.0020 the display
at 0.0019 would indicate 0.000. This feature is useful in blanking out zero
noise.
Main Display This function allows the user to change the measurement in the primary
display area. The user may select between PAA, sensor temperature, or
output current. Using this function, the user may choose to put
temperature in the main display area and PAA on the secondary, lower
line of the display. Press ENTER to initiate user entry mode, and the
entire value will flash. Use the UP arrow key to modify the desired
display value. Press ENTER to store the new value.
Com Mode Sets digital communication mode of analyzer. Optional digital
communication card must be plugged into the power supply slot for this
function to work. Press ENTER to initiate user entry mode, and the
entire value will flash. Use the UP arrow key to modify the desired value;
selections include 1-None, 2- P-DP for Profibus DP, 3 – Modbus, 4 –
Ethernet IP. Press ENTER to store the new value.
Com Address Sets bus address for digital communication mode of analyzer. Optional
digital communication card must be plugged into the power supply slot
for this function to work.
Press ENTER to initiate user entry mode, and the entire value will flash.
Use the UP arrow key to modify the desired value. Range is 1-125.
Press ENTER to store the new value.
O&M Manual
Rev F (8/17)
37
Page 38

ATI Q46H/85 PAA System Part 6 – Configuration
Iout#1 Mode This function sets analog output #1 to either track PAA (default) or
enables the PID controller to operate on the PAA input. Press ENTER to
initiate user entry mode, and the entire value will flash. Use the UP
arrow key to modify the desired value; selections include 1-ppm for PAA
tracking or 2-PID for PAA PID control. Press ENTER to store the new
value.
*Iout#2 Mode This function sets analog output #2 for temperature (default), PAA, or
pH. Press ENTER to initiate user entry mode, and the entire value will
flash. Use the UP arrow key to modify the desired value; selections
include 1-C/F for temperature, 2-ppm for PAA, or 3-pH for pH. Press
ENTER to store the new value.
*Iout#3 Mode OPTIONAL. This function sets analog output #3 for temperature (default)
or PAA. Press ENTER to initiate user entry mode, and the entire value
will flash. Use the UP arrow key to modify the desired value; selections
include 1-C/F for temperature or 2-ppm for PPA. Press ENTER to store
the new value.
*Rly A Mode Relay A can be used in three different ways: as a setpoint control, as a
fail alarm, or as a HI-LO alarm band. The three settings for Rly A Mode
are CON, FAIL and AL.
The CON setting enables normal control operation for Relay A, with
settings for setpoint, hysteresis, delay and phasing appearing in the
CONFIG menu automatically. See Figure 25 for further details.
The FAIL setting enables the fail alarm mode for Relay A. Relay A will
then trip on any condition that causes the FAIL icon to be displayed on
the LCD. Using this mode allows the User to send alarm indications to
other remote devices.
The AL setting allows two setpoints to be selected for the same relay,
producing a HI-LO alarm band. In this mode, Relay A will trip inside or
outside of the band, depending upon the Phase selected. See Figure 26
for further details.
Relay B Mode Relay B can be used in a number of ways: as a setpoint control, or as an
Relay C Mode alarm. The two settings for Relay B Mode are CON and FAIL.
The CON setting enables normal setpoint operation for Relay B. Relay B
then operates identically to Relay A, with settings for setpoint, hysteresis,
delay and phasing appearing in the CONFIG menu automatically. See
Figure 25 for details.
*Relay D Mode OPTIONAL. Relays D, E, and F can be used in two ways: as a setpoint
*Relay E Mode control, or as an alarm. The two settings for Relay B Mode are CON and
*Relay F Mode FAIL.
O&M Manual
Rev F (8/17)
38
Page 39

ATI Q46H/85 PAA System Part 6 – Configuration
The CON setting enables normal setpoint operation for Relay B. Relay B
then operates identically to Relay A, with settings for setpoint, hysteresis,
delay and phasing appearing in the CONFIG menu automatically. See
Figure 19 for details.
The FAIL setting enables the fail alarm mode for Relay B. Relay B will
then trip on any condition that causes the FAIL icon to be displayed on
the LCD. Using this mode allows the User to send alarm indications to
other remote devices. See Figure 26 for details.
Temp Units This function sets the display units for temperature measurement. Press
ENTER to initiate user entry mode, and the entire value will flash. Use
the UP arrow key to modify the desired display value. The choices are
°F and °C. Press ENTER to store the new value.
pH Input Enables the auxiliary pH input on the instrument. Once enabled, an
optional pH sensor can be added to the instrument to provide for
additional monitoring of pH (dual instrument, PAA + pH output.)
For the relay-based analyzer with two analog outputs, the pH signal can
also be sent to one of the analog outputs for monitoring of pH. Once
enabled, the pH input value is displayed on the lower line of the
MEASURE screens. Press ENTER to initiate user entry mode, and the
entire value will flash. Use the UP arrow key to modify the desired
display value. The choices are OFF and ON. Press ENTER to store the
new value.
pH Type Allows the user to select either 1-Comb or 2-Q22P. The 1-Comb
selection configures the monitor for a standard pH electrode without
using its temperature compensation but in turn, uses the temperature
compensator from the PAA sensor. The 2-Q22P selection configures the
monitor for use with the Q22P sensor or for the 4-20 mA input from any
other pH monitor.
pH Buffer This is a multiple variable function that allows the user to choose which
pH buffer sets that will be utilized in the 2-point calibration mode. The
Q46H contains 3 sets of built-in buffer tables with compensation values
ranging from 0 to 95 °C. During 2-point calibration, the instrument will
automatically identify which buffer is being used and compensate for the
value based on the built-in tables. This allows very quick, highly
accurate calibrations by the user. The order in which the buffers are
used during calibration is unimportant, since the system automatically
chooses the correct buffer.
The default setting for this feature is OFF, which disables the autorecognition function. Press ENTER to change this setting. The buffer
table set options are: 1: [4/7/10], 2: [4/7/9.18], and 3: [4.65/6.79/9.23].
See Figure 24 for buffer tables. Once the buffer set is selected, press
ENTER and the message Accepted! will be displayed on the lower line.
O&M Manual
Rev F (8/17)
39
Page 40

ATI Q46H/85 PAA System Part 6 – Configuration
Table 1 Table 2
4.00 pH 7.00 pH 10.00 pH
ºC pH °C pH °C pH
0
10
20
30
40
50
60
70
80
90
95
4.00
3.99
4.00
4.01
4.03
4.05
4.08
4.12
4.16
4.21
4.24
0
10
20
30
40
50
60
70
80
90
95
7.10
7.06
7.02
6.99
6.97
6.98
6.98
6.97
6.99
7.01
7.01
0
10
20
30
40
50
60
70
80
90
95
10.27
10.15
10.05
9.95
9.87
9.80
9.75
9.73
9.73
9.75
9.77
4.65 pH 6.79 pH 9.23 pH
ºC pH °C pH °C pH
0
4.67
10
20
30
40
50
60
70
80
90
95
4.66
4.65
4.65
4.66
4.68
4.70
4.72
4.75
4.79
4.79
10
20
30
40
50
60
70
80
90
95
Table 3
0
6.89
6.84
6.80
6.78
6.76
6.76
6.76
6.76
6.78
6.80
6.80
4.00 pH 7.00 pH 9.18 pH
ºC pH °C pH °C pH
0
10
20
30
40
50
60
70
80
90
95
0
10
20
30
40
50
60
70
80
90
95
4.00
3.99
4.00
4.01
4.03
4.05
4.08
4.12
4.16
4.21
4.24
9.48
9.37
9.27
9.18
9.09
9.00
8.92
8.88
8.85
8.82
8.82
0
10
20
30
40
50
60
70
80
90
95
7.10
7.06
7.02
6.99
6.97
6.98
6.98
6.97
6.99
7.01
7.01
0
10
20
30
40
50
60
70
80
90
95
9.46
9.33
9.23
9.14
9.07
9.01
8.96
8.92
8.89
8.85
8.83
Figure 24 - Automatic pH Buffer Tables
40
O&M Manual
Rev F (8/17)
Page 41

ATI Q46H/85 PAA System Part 6 – Configuration
6.25 Control Menu [CONTROL]
The Control Menu contains all of the output control user settings:
Set 4 mA These functions set the main 4 and 20 mA current loop transmitter. The
Set 20 mA units displayed depend on the selection made in the CONFIG menu for
[Iout1=PAA] Iout #1 Mode. Also, when the Relay Option Board is installed, the units
will also display #1 or #2 – since there are actually two analog outputs
present in this version.
The value stored for the 4 mA point may be higher or lower than the
value stored for the 20 mA point. The entry values are limited to values
within the range specified in “Set Range”, and the 4 mA and the 20 mA
point must be separated by at least 1% of this range Use the LEFT arrow
key to select the first digit to be modified. Then use the UP and LEFT
arrow keys to select the desired numerical value. Press ENTER to store
the new value.
Set PID 0% If the PID is enabled, this function sets the minimum and maximum
Set PID 100% controller end points. Unlike the standard 4-20 mA output, the controller
[Iout1=PID] does not “scale” output values across the endpoints. Rather, the
endpoints determine where the controller would normally force minimum
or maximum output in an attempt to recover the setpoint (even though
the controller can achieve 0% or 100% anywhere within the range.)
If the 0% point is lower than the 100% point, then the controller action
will be “reverse” acting. That is, the output of the controller will increase
if the measured value is less than the setpoint, and the output will
decrease if the measured value is larger than the setpoint. Flipping the
stored values in these points will reverse the action of the controller to
“direct” mode.
The entry value is limited to a value within the range specified in “Set
Range”, and the 0% and the 100% point must be separated by at least
1% of this range Use the LEFT arrow key to select the first digit to be
modified. Then use the UP and LEFT arrow keys to select the desired
numerical value. Press ENTER to store the new value.
PID Setpnt The measured value which the controller is attempting to maintain by
[Iout1=PID] adjusting output value. It is the nature of the PID controller that it never
actually gets to the exact value and stops. The controller is continually
making smaller and smaller adjustments as the measured value gets
near the setpoint.
PID Prop Proportional gain factor. The proportional gain value is a multiplier on
[Iout1=PID] the controller error (difference between measured value and setpoint
value.) Increasing this value will make the controller more responsive.
PID Int Integral is the number of “repeats-per-minute” of the action of the
[Iout1=PID] controller. It is the number of times per minute that the controller acts on
the input error. At a setting of 2.0 rpm, there are two repeats every
minute. If the integral is set to zero, a fixed offset value is added to the
O&M Manual
Rev F (8/17)
41
Page 42

ATI Q46H/85 PAA System Part 6 – Configuration
controller (manual reset.) Increasing this value will make the controller
more responsive.
PID Deriv Derivative is a second order implementation of Integral, used to supress
[Iout1=PID] “second-order” effects from process variables. These variables may
include items like pumps or mixers that may have minor impacts on the
measured value. The derivative factor is rarely used in water treatment
process, and therefore, it is best in most cases to leave it at the default
value. Increasing this value will make the controller more responsive.
Set 4 mA These functions set the main 4 and 20 mA current loop #1 output points
Set 20 mA for the analyzer when output 1 is in normal, [Iout1= PAA] non-PID, mode
of operation.
The value stored for the 4 mA point may be higher or lower than the
value stored for the 20 mA point. The entry values are limited to values
within the range specified in “Set Range”, and the 4 mA and the 20 mA
point must be separated by at least 1% of this range Use the LEFT arrow
key to select the first digit to be modified. Then use the UP and LEFT
arrow keys to select the desired numerical value. Press ENTER to store
the new value
Set 4 mA #2 These functions set the second 4 mA and 20 mA current loop output
Set 20 mA #2 points for the transmitter. The output may be set to track temperature
[temp/PAA/pH] (default), pH, or PAA. The values stored for the 4 mA point may be
higher or lower than the value stored for the 20 mA point.
The entry value is limited to a value between 0° and 55°C if it is set for
temperature, within the range specified in “Set Range” if the output is set
to track PAA, and must be within 0-14 pH if set to track pH. The 4 mA
and the 20 mA point must be at least 20 units away from each other.
Press ENTER to initiate user entry mode, and the value will flash. Use
arrow keys to modify value. Press ENTER to store the new value.
NOTE: If the temperature units are changed between °C and °F (see
Temp Units in this section), the default settings for this output will be
stored (present data is not converted.)
NOTE: If the battery board option is installed, the menu will be shown as
Set 0 V #2 – since the battery board has two 0-2.5 VDC voltage output
signals instead of current outputs.
*Set 4 mA #3 These functions set the optional third 4 mA and 20 mA current loop
*Set 20 mA #3 output points for the analyzer. The output may be set to track
OPTIONAL. temperature (default) or PAA. The values stored fir the 4 mA point may
[temp/H2O2] be higher or lower than the value stored for the 20 mA point. The entry
value is limited to a value between 0 and 55 °C if it is set for temperature,
within the range specified in “Set Range” if the output is set to track PAA.
The 4 mA and the 20 mA point must be at least 2 units away from each
other. Press ENTER to initiate user entry mode, and the value will flash.
Use arrow keys to modify value. Press ENTER to store the new value.
NOTE: If the temperature units are changed between °C and °F (see Temp
Units in this section), the default settings for this output will be stored
(present data is not converted.)
42
O&M Manual
Rev F (8/17)
Page 43

ATI Q46H/85 PAA System Part 6 – Configuration
e
Temp Units in this section), the default setting for this output
will change between 100
°
C and 212
°
F accordingly.
ON
}
1.050 ppm
1.000 ppm
PHASE: LO
OFF
HYSTERESIS
“DEAD BAND”
X
*A Setpoint This function establishes the PAA trip point for relay A. The entry value
is limited to a value within the range specified in “Set Range”. Use the
LEFT arrow key to select the first digit to be modified. Then use the UP
and LEFT arrow keys to select the desired numerical value. Press
ENTER to store the new value.
*A Hysteresis This function establishes the hysteresis, or “deadband”, for Relay A.
Hysteresis is most often used to control relay chattering; however, it may
also be used in control schemes to separate the ON/OFF trip points of
the relay. Press ENTER to initiate user entry mode, and the value will
flash. Use the arrow keys to modify value. Press ENTER to store the
new value.
*A Delay This function places an additional amount of time delay on the trip point
for relay A. This delay is in addition to the main delay setting for the
controller. The entry value is limited to a value between 0 and 999
seconds. Press ENTER to initiate user entry mode, and the value will
flash. Use arrow keys to modify value; range is 0 to 999 seconds. Press
ENTER to store the new value.
*A Phasing This function establishes the direction of the relay trip. When phase is
HI, the relay operates in a direct mode. Therefore, the relay energizes
and the LCD indicator illuminates when the PAA value exceeds the
setpoint. When the phase is LO, the relay energizes and the LCD
indicator illuminates when the PAA level drops below the setpoint. The
failsafe setting does have an impact on this logic. The description here
assumes the failsafe setting is OFF. Press ENTER to initiate user entry
mode, and the entire value will flash. Use the UP arrow key to modify
the desired value; selections include HI for direct operation or LO for
reverse operation. Press ENTER to store the new value.
See Figure 25 below for a visual description of a typical control relay application.
When value rises to ≥ 1.000 ppm, relay closes.
NOTE: If the temperature units are changed between °C and °F (se
When value rises to ≥ 1.050 ppm, relay opens.
1.000 ppm
PHASE: HI
0.950 ppm
When value falls to ≤ 0.950 ppm, relay opens.
Figure 25 - Control Relay Example, Hystersis and Two opposite Phase Options
O&M Manual
Rev F (8/17)
X
OFF
Settings:
HYSTERESIS
}
OR
“DEAD BAND”
Setpoint: 1.000 ppm
Hyst: 0.050
Delay: 000 Failsafe: OFF
When value falls to ≤ 1.000 ppm, relay closes.
43
ON
OR
Page 44

ATI Q46H/85 PAA System Part 6 – Configuration
*Setpnt A
-
HI
*B Setpoint
ON
ON
}
}
1.050 ppm
1.000 ppm
0.500 ppm
0.450 ppm
PHASE: LO
OFF
HYST - HI
HYST - LO
OFF
X
X
*D,E,F Setpoint
*
If Relay A Mode is set to Alarm Mode, AL, then the following settings will
*Hyst A-HI
*Delay A-HI
*Setpnt A-LO
*Hyst A-LO
*Delay A-LO
Figure 26 is a visual description of a typical alarm relay application.
When value rises to ≥ 1.000 ppm, relay
closes, until value falls back to < 0.950 ppm.
appear in the Config Menu list automatically. In this mode, two setpoints
can be selected on the same relay, to create an alarm band. Phase HI
selection causes the relay to energize outside of the band, and Phase
LO causes the relay to energize inside of the band. This feature enables
one relay to be used as a control relay while the other is used as a HI-LO
Alarm relay at the same time. Setpoint A-LO must be set lower than
Setpoint A-HI. When AL mode is first selected, Setpoint A-LO is
defaulted to 0.
When value falls to < 1.000 ppm, relay
closes, until rises back to > 1.050 ppm.
1.000 ppm
0.950 ppm
PHASE: HI
0.550 ppm
0.500 ppm
When value falls to < 0.500 ppm, relay
closes, until rises back to > 0.550 ppm.
Setpoint A-HI: 1.000 ppm Setpoint A-LO: .500 ppm
Hyst A-HI: 0.050 Hyst A-LO: .0.050
Delay A-HI: 000 Delay A-LO: 000
X
OFF
X
HYST - HI
}
HYST - LO
}
When value rises to ≥ 0.500 ppm, relay
closes, until value falls back to < 0.450 ppm.
Settings:
Figure 26 - Alarm Relay Example
ON
If Relay B Mode is set to CON (see Relay B Mode), then Relay B will
*B Hysteresis
*B Delay
*B Phasing
*C Hysteresis
*C Delay
*C Phasing
C Setpoint
function identically to Relay A. Relay B settings appear in the CONFIG
menu list automatically.
If Relay C Mode is set to CON (see Relay C Mode), then Relay C will
function identically to Relay A. Relay C settings appear in the CONFIG
menu list automatically
If Relay D, E, or F Mode is set to CON (see Relay D, E, F Modes), then
*D,E,F Hystere
*D,E,F Delay
*D,E,F Phasing
the Relay will function identically to Relay A. Relay settings appear in
the CONFIG menu list automatically.
44
O&M Manual
Rev F (8/17)
Page 45

ATI Q46H/85 PAA System Part 6 – Configuration
6.26 Diagnostics Menu [DIAG]
The diagnostics menu contains all of the user settings that are specific to the system diagnostic
functions, as well as functions that aid in troubleshooting application problems.
Set Hold The Set Hold function locks the current loop output values on the present
process value and halts operation of the PID controller. This function
can be used prior to calibration, or when removing the sensor from the
process, to hold the output in a known state. Once HOLD is released,
the outputs return to their normal state of following the process input.
The transfer out of HOLD is bumpless on the both analog outputs - that
is, the transfer occurs in a smooth manner rather than as an abrupt
change. An icon on the display indicates the HOLD state, and the HOLD
state is retained even if power is cycled. Press ENTER to initiate user
entry mode, and entire value will flash. Use the UP arrow key to modify
the desired value, selections are ON for engaging the HOLD function,
and OFF to disengage the function. Press ENTER to store the new
value.
Note: When the Relay Option Board is installed, the Set Hold function
holds BOTH current levels, as well as ALL relay settings.
The Set Hold function can also hold at an output value specified by the
user. To customize the hold value, first turn the HOLD function on.
Press the ESC key to go to the DIAG Menu and scroll to Sim Output
using the UP arrow key. Press ENTER. Follow the instructions under
Sim Output (see following page).
CAUTION: There is no time-out on the hold feature. Once placed
into hold mode, return to normal operation must be done manually.
Fault List The Fault List screen is a read-only screen that allows the user to display
the cause of the highest priority failure. The screen indicates the number
of faults present in the system and a message detailing the highest
priority fault present. Note that some faults can result in multiple
displayed failures due to the high number of internal tests occurring. As
faults are corrected, they are immediately cleared.
Faults are not stored; therefore, they are immediately removed if power
is cycled. If the problem causing the faults still exists, however, faults will
be displayed again after power is re-applied and a period of time elapses
during which the diagnostic system re-detects them. The exception
to this rule is the calibration failure. When a calibration fails, no corrupt
data is stored. Therefore, the system continues to function normally on
the data that was present before the calibration was attempted.
After 30 minutes or if power to the transmitter is cycled, the failure for
calibration will be cleared until calibration is attempted again. If the
problem still exists, the calibration failure will re-occur. Press ENTER to
initiate view of the highest priority failure. The display will automatically
return to normal after a few seconds.
O&M Manual
Rev F (8/17)
45
Page 46

ATI Q46H/85 PAA System Part 6 – Configuration
PID Timer This function sets a timer to monitor the amount of time the PID
controller remains at 0% or 100%. This function only appears if the PID
controller is enabled. If the timer is set to 0000, the feature is effectively
disabled. If the timer value is set to any number other zero, a FAIL
condition will occur if the PID controller remains at 0% or 100% for the
timer value. If one of the relays is set to FAIL mode, this failure condition
can be signaled by a changing relay contact.
Press ENTER to initiate user entry mode, and the entire value will flash.
Use the UP arrow key to modify desired value; range of value is 0-9999
seconds. Press ENTER to store the new value.
Sim Out The Sim Out function allows the user to simulate the PAA
level of the instrument in the user selected display range. The user
enters a ppm value directly onto the screen, and the output responds as
if it were actually receiving the signal from the sensor. This allows the
user to check the function of attached monitoring equipment during setup or troubleshooting. Escaping this screen returns the unit to normal
operation. Press ENTER to initiate the user entry mode, and the rightmost digit of the value will flash. Use arrow keys to modify desired value.
The starting display value will be the last read value of the input. The
output will be under control of the SIM screen until the ESC key is
pressed.
Note: If the HOLD function is engaged before the Sim Output function is
engaged, the simulated output will remain the same even when the ESC
key is pressed. Disengage the HOLD function to return to normal output.
Fail Out #1 This function enables the user to define a specified value that the main
current output will go to under fault conditions. When the Relay Option
Board is installed, the display will read Fail Out #1. When enabled to
ON, the output may be forced to the current value set in Fail Val (next
item.) With the Fail Out setting of ON, and a Fail Val setting of 6.5 mA,
any alarm condition will cause the current loop output to drop outside the
normal operating range to exactly 6.5 mA, indicating a system failure that
requires attention.
Press ENTER to initiate user entry mode, and the entire value will flash.
Use the UP arrow key to modify desired value; selections are ON, OFF.
Press ENTER to store the new value.
Fail Val #1 Sets the output failure value for Iout#1. When Fail Out above is set to
ON, this function sets value of the current loop under a FAIL condition.
When the Relay Option Board is installed, the display will read Fail Out
#1. The output may be forced to any current value between 4-20 mA.
Press ENTER to initiate user entry mode, and the entire value will flash.
Use the UP arrow key to modify desired value; selections are between
4mA, and 20mA. Press ENTER to store the new value.
Fail Out #2 This function sets the fail-mode of current loop output #2 under a FAIL
condition. The settings and operation are identical to Fail Out for output
#1.
O&M Manual
Rev F (8/17)
46
Page 47

ATI Q46H/85 PAA System Part 6 – Configuration
Fail Val #2 This function sets the value of current loop output #2 under a FAIL
condition. The settings and operation are identical to Fail Out for output
#1.
*Fail Out #3 OPTIONAL. This function sets the fail-mode of current loop output #3
under a FAIL condition. The settings and operation are identical to Fail
Out for output #1.
*Fail Val #3 OPTIONAL. This function sets the value of current loop output #3 under
a FAIL condition. The settings and operation are identical to Fail Out for
output #1.
Backlight This function has three options. ON – On all the time, OFF – Off all the
time, AL – Alarm (Default). This function flashes the backlight on and off
whenever the Fail icon is displayed.
*Failsafe This function allows the user to set the optional system relays to a
failsafe condition. In a failsafe condition, the relay logic is reversed so
that the relay is electrically energized in a normal operating state. By
doing this, the relay will not only change state when, for example, an
PAA limit is exceeded, but also when power is lost to the controller.
When failsafe is selected to be ON, the normally-open contacts of the
relay will be closed during normal operation. In an attempt to make this
configuration less confusing, the LCD icon logic is reversed with this
setting, and the icon is OFF under this normal condition. Therefore,
when the trip condition occurs, the closed N.O. contacts will be opened
(relay de-energized), and the LCD icon will illuminate. In addition, a
power fail would also cause the same contacts to open.
Start Delay This function is designed to minimize control or alarm issues arising from
temporary power loss. When power goes down, the monitor records the
analog output values and the status of relays and PID functions. When
power is restored, the analog values and relays will be held at the prepower loss values for a defined period of time. This “start delay” may be
programmed for periods from 0-9.9 minutes. This function is set to 0.0
minutes by default and must be activated by the user if desired by setting
a positive time value
Set Default The Set Default function allows the user to return the instrument back to
factory default data for all user settings or for just the calibration default.
It is intended to be used as a last resort troubleshooting procedure. All
user settings or the calibration settings are returned to the original factory
values. Hidden factory calibration data remains unchanged. Press
ENTER to initiate user entry mode and the value NO will flash. Use the
UP arrow key to modify value to YES and press ENTER to reload
defaults.
O&M Manual
Rev F (8/17)
47
Page 48

Part 7 – Calibration
7.1 PAA Calibration
Once power is applied, the sensor must be given time to stabilize. This is best done by following
the zeroing procedure below. Establishing a stable zero is critical to the proper operation of the
monitor. A complete calibration will include zeroing and spanning the sensor. It is generally
unnecessary to set the zero at every calibration; however, it should be done during the initial
installation.
7.11 PAA Zero Cal
PAA sensors have extremely low offset currents at zero. For this reason, it is normally sufficient
to simply leave the zero at the factory default of 0.0 nA. As an alternative, an electronic zero can
be set by disconnecting the sensor from the cable and performing steps 3-5 below.
The steps below assume that the sensor has been prepared in accordance with 5.1 PAA
Sensor Preparation, earlier in this manual. Note that the 8 hour waiting time in step 2 below is
not required if the monitor has been running for 24 hours prior to zeroing. If the unit has been
running with the sensor connected, the sensor will normally return to a stable zero within 15
minutes.
1. Connect the sensor to the electronics by plugging the cable plug into the receptacle on the
top of the sensor.
2. Place about an inch of water in a small beaker or other convenient container and immerse
the tip of the sensor. The water used need not be distilled, but it must not contain PAA. For
submersible sensors, submerge the entire sensor in a bucket of PAA free water. Allow the
sensor to sit undisturbed for at least 8 hours.
3. Scroll to the CAL menu section using the MENU key and press ENTER or the UP arrow key.
Cal PAA will then be displayed.
4. Press the ENTER key. The screen will display a flashing 1-Ref for span calibration or a 2-
Zer for zero calibration. Using the UP arrow key, set for a 2-Zer zero calibration and press
ENTER.
5. The system now begins acquiring data for the sensor zero calibration value. As data is
gathered, the units for sensor current in nanoamps (nA) and temperature may flash. Flashing
units indicate that this parameter is unstable. The calibration data point acquisition will stop
only when the data remains stable for a pre-determined amount of time. This can be
overridden by pressing ENTER. If the data remains unstable for 10 minutes, the calibration
will fail and the message Cal Unstable will be displayed.
6. If accepted, the screen will display the message PASS with the new sensor zero reading
(offset), then it will return to the main measurement display. If the calibration fails, a message
indicating the cause of the failure will be displayed and the FAIL icon will be turned on. The
range of acceptable value for sensor offset is -25nA to +25 nA. Should a FAIL occur,
carefully inspect the sensor for a tear in the membrane. It will probably be necessary to
rebuild the sensor as described in section 5.1 PAA Sensor Preparation. Should the offset
O&M Manual
Rev F (8/17)
48
Page 49

ATI Q46H/85 PAA System Part 7 – Calibration
value remain high and result in calibration failures, review the Service section of this manual,
and then contact the service dept. at ATI for further assistance.
The sensor zero offset value in nA from the last zero calibration is displayed on the lower line of
the Default Menus for information purposes.
7.12 PAA Span Cal
Span calibration of the system must be done against a laboratory measurement on the same
sample that the sensor is measuring. A sample should be collected from the inlet line feeding the
flow cell and quickly analyzed for PAA. When calibrating, it is best to have a reasonably high
concentration of PAA in the system. The higher the value, the smaller will be the calibration
errors caused by errors in the laboratory analytical procedure. It is generally preferable to
calibrate at values above 10 PPM to reduce calibration errors.
Start flow cell and calibrate system as follows:
1. Place the previously zeroed sensor into the sensor chamber of the flow cell assembly. The
sensor is inserted into the side of the flow cell and is sealed in place with a double o-ring.
The o-rings are lubricated at the factory to allow the sensor to slide smoothly into place. If
insertion becomes difficult, use a small amount of silicon grease to lubricate the o-rings. If
the low-volume flow cell is used, screw the sensor into the flow cell until the membrane cap
bottoms out on the acrylic flow cell. Do not over-tighten
2. Turn on the inlet water flow to the flow cell and adjust the inlet flow rate so that water is
overflowing from the inlet chamber. The best performance will be obtained when some water
is always overflowing. This maintains constant flow and pressure on the sensor at all times.
3. Allow the system to operate undisturbed for 30-60 minutes. Assuming the water contains
PAA, the display will be reading positive sensor current values. If the system is stable, the
value on the display will increase to some PPM value and remain at that level. At that point,
calibration can continue.
4. If the sensor is on-line, the user may want to set the output HOLD feature prior to calibration
to lock out any output fluctuations.
5. Scroll to the CAL menu section using the MENU key and press ENTER or the UP arrow key.
Cal PAA will then be displayed.
6. Press the ENTER key. The screen will display a flashing 1-Ref for span calibration or a 2-
Zer for zero calibration. Using the UP arrow key, set for a 1-Ref span calibration and press
ENTER.
7. The system now begins acquiring data for the calibration value. As data is gathered, the
units for ppm and temperature may flash. Flashing units indicate that this parameter is
unstable. The calibration data point acquisition will stop only when the data remains stable
for a pre-determined amount of time. This can be overridden by pressing ENTER. If the data
remains unstable for 10 minutes, the calibration will fail and the message Cal Unstable will
be displayed.
O&M Manual
Rev F (8/17)
49
Page 50

ATI Q46H/85 PAA System Part 7 – Calibration
8. The screen will display the last measured ppm value and a message will be displayed
prompting the user for the lab value. The user must then modify the screen value with the
arrow keys and press ENTER. The system then performs the proper checks.
9. If accepted, the screen will display the message PASS with the new sensor slope reading,
and then it will return to the main measurement display. If the calibration fails, a message
indicating the cause of the failure will be displayed and the FAIL icon will be turned on. The
range of acceptable values for sensor slope is 20% to 500%. It may be necessary to rebuild
the sensor as described in section 5.1 PAA Sensor Preparation. Should the slope
value remain out of range and result in calibration failures, review the Service Section of this
manual, then contact the service dept. at ATI for further assistance.
The sensor offset value in % from the last span calibration is displayed on the lower line of the
Default Menus for information purposes.
7.2 Temperature Calibration
The temperature calibration sequence is essentially a 1-point offset calibration that allows
adjustments of approximately ±5 °C.
The sensor temperature may be calibrated on line, or the sensor can be removed from the
process and placed into a known solution temperature reference. In any case, it is critical that the
sensor be allowed to reach temperature equilibrium with the solution in order to provide the
highest accuracy. When moving the sensor between widely different temperature conditions, it
may be necessary to allow the sensor to stabilize as much as one hour before the calibration
sequence is initiated. If the sensor is on-line, the user may want to set the output HOLD feature
prior to calibration to lock out any output fluctuations.
1. Scroll to the CAL menu section using the MENU key and press ENTER or the UP arrow key.
2. Press the UP arrow key until Cal Temp is displayed.
3. Press the ENTER key. The message Place sensor in solution then press ENTER will be
displayed. Move the sensor into the calibration reference (if it hasn’t been moved already)
and wait for temperature equilibrium to be achieved. Press ENTER to begin the calibration
sequence.
4. The calibration data gathering process will begin. The message Wait will flash as data is
accumulated and analyzed. The °C or °F symbol may flash periodically if the reading is too
unstable.
5. The message Adjust value - press ENTER will be displayed, and the right-most digit will
begin to flash, indicating that the value can be modified. Using the UP and LEFT arrow keys,
modify the value to the known ref solution temperature. Adjustments up to ± 5 °C from the
factory calibrated temperature are allowed. Press ENTER.
Once completed, the display will indicate PASS or FAIL. If the unit fails, the temperature
adjustment may be out of range, the sensor may not have achieved complete temperature
equilibrium, or there may be a problem with the temperature element. In the event of calibration
failure, it is recommended to attempt the calibration again immediately.
O&M Manual
Rev F (8/17)
50
Page 51

ATI Q46H/85 PAA System Part 7 – Calibration
7.3 pH Calibration
The pH calibration menus will not be seen unless the optional pH sensor input is turned ON and a
special pH sensor is connected to the input of the instrument. See Section 6.24 Configuration
Menu [CONFIG] for more details.
The pH calibration functions appear in the CAL menu listing when the optional pH input is
enabled in the CONFIG menu. When enabled, the pH input signal is used to compensate the
PAA signal. Calibration of pH is performed in one of two methods; one-point or two-point. For
new sensors or for calibration in two different pH buffers with the sensor removed from the
process, choose a two-point calibration. For on-line calibrations with the sensor still mounted in
the process, choose a one-point calibration. For two-point calibrations, it is highly recommended
to use fresh pH buffers of 7 pH and 9.18 pH.
7.31 Two-Point pH Cal
1. Thoroughly clean the pH sensor and place it into the first pH calibration buffer, stirring it
several times before letting it rest in the beaker. Allow sensor to sit in solution long enough to
achieve temperature equilibrium with the pH buffer (maybe 5 minutes.) It is important that
both pH buffers be fresh and at room temperature.
2. Scroll to the CAL menu section using the MENU key and press ENTER or the UP arrow key.
3. Press the UP arrow key until Cal pH Type is displayed.
4. Press the ENTER key. The display will begin to flash. Using the UP arrow key, adjust the
displayed number to a 2 pt calibration type. This will allow the user to offset+slope adjust the
sensor input for two separate pH point. Once value has been adjusted, press the ENTER key
and the message Accepted! will be displayed.
5. Scroll to the next menu item by pressing the UP arrow key once. The menu item Cal pH
buf1 will be displayed.
6. Press the ENTER key. The display will begin to flash. Using the UP and LEFT arrow keys,
adjust the displayed number to the known value of the pH buffer. The exact temperature
compensated number for pH buffers is typically written on the side of the buffers shipping
container. Once value has been adjusted, press the ENTER key.
7. The message Accepted! will be displayed, or an error describing the cause the failure. If the
cal point was accepted, rinse the sensor in distilled or de-ionized water and move it into the
second pH buffer. Stir it slightly several times and let the sensor rest in the beaker.
8. Scroll to the next menu item by pressing the UP arrow key once. The menu item Cal pH
buf2 will be displayed.
9. Press the ENTER key. The display will begin to flash. Using the UP and LEFT arrow keys,
adjust the displayed number to the known value of the second (higher or lower value) pH
buffer. Once value has been adjusted, press the ENTER key.
10. The message Accepted! will be displayed, or an error describing the cause the failure. The
system is now two-point calibrated for pH.
51
O&M Manual
Rev F (8/17)
Page 52

ATI Q46H/85 PAA System Part 7 – Calibration
7.32 One-Point pH Cal
1. For this calibration method, the sensor may be removed, cleaned, and placed into a known
pH buffer, or, it may be calibrated on-line against a known reference value. If the sensor is
removed, thoroughly clean the pH sensor and place it into the pH calibration buffer, stirring is
several times before letting it rest in the beaker. Allow sensor to sit in solution long enough to
achieve temperature equilibrium with the pH buffer (maybe 5 minutes.) It is important that the
pH buffer be fresh and at room temperature.
2. Scroll to the CAL menu section using the MENU key and press ENTER or the UP arrow key.
3. Press the UP arrow key until Cal pH Type is displayed.
Press the ENTER key. The display will begin to flash. Using the UP arrow key, adjust the
displayed number to a 1 pt calibration type. This will allow the user to offset-adjust the
sensor input for one pH point. Once value has been adjusted, press the ENTER key and the
message Accepted! will be displayed.
4. Scroll to the next menu item by pressing the UP arrow key once. The menu item Cal pH
buf1 will be displayed.
5. Press the ENTER key. The display will begin to flash. Using the UP and LEFT arrow keys,
adjust the displayed number to the known value of the pH buffer. If the sensor is till mounted
in the process, enter the known reference value. The exact temperature compensated
number for pH buffers is typically written on the side of the buffers shipping container. Once
value has been adjusted, press the ENTER key.
6. The message Accepted! will be displayed, or an error describing the cause the failure. The
system is now two-point calibrated for pH.
O&M Manual
Rev F (8/17)
52
Page 53

Part 8 – PID Controller Details
8.1 PID Description
PID control, like many other control schemes, are used in chemical control to improve the
efficiency of chemical addition or control. By properly tuning the control loop that controls
chemical addition, only the amount of chemical that is truly required is added to the system,
saving money. The savings can be substantial when compared to a system which may be simply
adding chemical at a constant rate to maintain some minimal addition under even the worst case
conditions. The PID output controller is highly advantageous over simple control schemes that
just utilize direct (proportional only) 4-20 mA output connections for control, since the PID
controller can automatically adjust the “rate” of recovery based on the error between the setpoint
and the measured value – which can be a substantial efficiency improvement..
The PID controller is basically designed to provide a “servo” action on the 4-20 mA output to
control a process. If the user requires that a measured process stay as close as possible to a
specific setpoint value, the controller output will change from 0% to 100% in an effort to keep the
process at the setpoint. To affect this control, the controller must be used with properly selected
control elements (valves, proper chemicals, etc.) that enable the controller to add or subtract
chemical rapidly enough. This is not only specific to pumps and valves, but also to line sizes,
delays in the system, etc.
This section is included to give a brief description of tuning details for the PID controller, and is
not intended to be an exhaustive analysis of the complexities of PID loop tuning. Numerous
sources are available for specialized methods of tuning that are appropriate for a specific
application.
8.2 PID Algorithm
As most users of PID controllers realize, the terminology for the actual algorithm terms and even
the algorithms themselves can vary between different manufacturers. This is important to
recognize as early as possible, since just plugging in similar values from one controller into
another can result in dramatically different results. There are various basic forms of PID
algorithms that are commonly seen, and the implementation here is the most common version;
The ISA algorithm (commonly referred to as the “ideal” algorithm.)
tde
dt
)(
1
tePoutput
)(
∫
I
++=
Dtdte
)()(
Where:
output = controller output
P = proportional gain
I = integral gain
D = derivative gain
t = time
e(t) = controller error (e=measured variable – setpoint)
The most notable feature of the algorithm is the fact the proportional gain term affects all
components directly (unlike some other algorithms - like the “series” form.) If a pre-existing
O&M Manual
Rev F (8/17)
Figure 27 - Q46H ISA (Ideal) Equation
53
Page 54

ATI Q46H/85 PAA System Part 8 – PID Controller Details
controller utilizes the same form of the algorithm shown above, it is likely similar settings can for
made if the units on the settings are exactly the same. Be careful of this, as many times the units
are the reciprocals of each other (i.e. reps-per-min, sec-per-rep.)
PID stands for “proportional, integral, derivative.” These terms describe the three elements of the
complete controller action, and each contributes a specific reaction in the control process. The
PID controller is designed to be primarily used in a “closed-loop” control scheme, where the
output of the controller directly affects the input through some control device, such as a pump,
valve, etc.
Although the three components of the PID are described in the setting area (Section 6.25 Control
Menu [CONTROL]), here are more general descriptions of what each of the PID elements
contribute to the overall action of the controller.
P Proportional gain. With no “I” or “D” contribution, the controller output is simply a factor of
the proportional gain multiplied by the input error (difference between the measured input
and the controller setpoint.) Because a typical chemical control loop cannot react
instantaneously to a correction signal, proportional gain is typically not efficient by itself –
it must be combined with some integral action to be useful. Set the P term to a number
between 2-4 to start. Higher numbers will cause the controller action to be quicker.
I Integral gain. Integral gain is what allows the controller to eventually drive the input error
to zero – providing accuracy to the control loop. It must be used to affect the accuracy in
the servo action of the controller. Like proportional gain, increasing integral gain results
in the control action happening quicker. Set the I term to a number between 3-5 to start
(1-2 more than P). Like proportional gain, increasing the integral term will cause the
controller action to be quicker.
D Derivative gain. The addition of derivative control can be problematic in many
applications, because it greatly contributes to oscillatory behavior. In inherently slow
chemical control processes, differential control is generally added in very small amounts
to suppress erratic actions in the process that are non-continuous, such as pumps and
valves clicking on and off. However, as a starting point for chemical process control, its
best to leave the “D” term set to 0.
Based on these descriptions, the focus on tuning for chemical applications really only involves
adjustment of “P” and “I” in most cases. However, increasing both increases the response of the
controller. The difference is in the time of recovery. Although combinations of high “P’s” and low
“I” will appear to operate the same as combinations of low “P’s” and high “I’s”, there will be a
difference in rate of recovery and stability. Because of the way the algorithm is structured, large
“P’s” can have a larger impact to instability, because the proportional gain term impacts all the
other terms directly. Therefore, keep proportional gain lower to start and increase integral gain to
achieve the effect required.
Many of the classical tuning techniques have the user start with all values at 0, and then increase
the P term until oscillations occur. The P value is then reduced to ½ of the oscillatory value, and
the I term is increased to give the desired response. This can be done with the Q46 controller,
with the exception that the I term should start no lower than 1.0.
If it appears that even large amounts of integral gain (>20) don’t appreciably increase the desired
response, drop I back to about 1.0, and increase P by 1.00, and start increasing I again. In most
chemical control schemes, I will be approximately 3 times the value of P.
O&M Manual
Rev F (8/17)
54
Page 55

ATI Q46H/85 PAA System Part 8 – PID Controller Details
8.3 Classical PID Tuning
Unlike many high speed position applications where PID loops are commonly used, the chemical
feed application employed by this instrument does not require intense mathematical exercise to
determine tuning parameters for the PID. In fact, the risk of instability is far greater with overly
tuned PID control schemes. In addition, many of the classical mathematical exercises can be
damaging or wasteful in the use of chemicals when the process is bumped with large amounts of
input error to seek a response curve. Because of this, the general adjustment guidelines
described in section 8.2 PID Algorithm are sufficient for almost all application tuning for this
instrument. Beyond this, many sources are available for classical tuning methods.
8.4 Manual PID Override Control
The Q46 PID output function allows the user to take manual control of the PID control signal.
This is often useful when starting up a control loop, or in the event that you wish to bump the
system manually to measure system response time.
To access the manual PID control, you must be in the MEASURE mode of operation and you
must have the PID output displayed on the lower line. This line will indicate “XX.X% XX.X mA”
with the X values simply indicating the current values. With this display on the screen, press and
hold the ENTER key for about 5 seconds. You will see a small “m” show up between the % value
and the mA value. This indicates you are now in manual mode.
Once in manual, you may increase the PID output by pressing the UP arrow or you may decrease
the output by pressing the LEFT arrow. This will allow you to drive the PID output to any desired
setting.
To revert to normal PID control, press and hold the ENTER key again until the “m” indicator
disappears.
8.5 Common PID Pitfalls
The most common problem occurring in PID control applications involves the false belief that
proper settings on only the PID controller can balance any process to an efficient level.
Close-loop control can only be effective if all elements in the loop are properly selected for the
application, and the process behavior is properly understood. Luckily, the nature of simple
chemical control processes are generally slow in nature. Therefore, even a de-tuned controller
(one that responds somewhat slowly) can still provide substantial improvements to setpoint
control. In fact, damaging oscillatory behavior is far more likely in tightly tuned controllers where
the user attempted to increase response too much.
When deciding on a PID control scheme, it is important to initially review all elements of the
process. Sticking valves, undersized pumps, or delays in reaction times associated with chemical
addition can have a dramatic effect on the stability of the control loop. When controlling a
chemical mix or reaction, the sensor should be placed in a location that ensures proper mixing or
reaction time has occurred.
The easiest processes to control with closed-loop schemes are generally linear, and symmetrical,
in nature. For example, controlling level in tank where the opening of valve for a fixed period of
time corresponds linearly to the amount that flows into a tank. Chemical control processes can
be more problematic when the nature of the setpoint value is non-linear relative to the input of
chemical added. For example, pH control of a process may appear linear only in a certain range
O&M Manual
Rev F (8/17)
55
Page 56

ATI Q46H/85 PAA System Part 8 – PID Controller Details
of operation, and become highly exponential at the extreme ranges of the measuring scale. In
addition, if a chemical process is not symmetrical, that means it responds differentially to the
addition and subtraction of chemical. It is important in these applications to study steady-state
impact as well as step-change impact to process changes. In other words, once the process has
apparently been tuned under normal operating conditions, the user should attempt to force a
dramatic change to the input to study how the output reacts. If this is difficult to do with the actual
process input (the recommended method), the user can place the control in manual at an
extreme control point such as 5% or 95%, and release it in manual. The recovery should not be
overly oscillatory. If so, the loop needs to be de-tuned to deal with that condition (reduce P
and/or I.)
O&M Manual
Rev F (8/17)
56
Page 57

Part 9 – System Maintenance
9.1 General
The Q46/85 PAA System will generally provide unattended operation over long periods of time.
With proper care, the system should continue to provide measurements indefinitely. For reliable
operation, maintenance on the system must be done on a regular schedule. Keep in mind that
preventive maintenance on a regular schedule is much less troublesome than emergency
maintenance that always seems to come at the wrong time.
9.2 Analyzer Maintenance
No unusual maintenance of the analyzer is required if installed according to the guidelines of this
operating manual. If the enclosure door is frequently opened and closed, it would be wise to
periodically inspect the enclosure sealing gasket for breaks or tears.
9.3 PAA Sensor Maintenance
Sensor maintenance is required for accurate measurements. The primary requirement is simply
to keep the sensor membrane clean. The membrane is a micro-porous polymer that is resistant
to anything that will be encountered in water streams. However, deposits can form on the surface
or in the pores of the membrane, and these deposits will reduce the sensitivity. Certain
constituents in water, mainly iron and manganese will form precipitates. These precipitates can
sometimes form a coating on the membrane.
Because membranes are micro-porous, they can be relatively difficult to clean effectively.
Immersing the tip of the sensor in 1N nitric acid solution will sometimes remove deposits that
cause low sensitivity, but this is not always the case. The recommended practice is to simply
replace the membrane when it becomes fouled. To change a membrane, follow the procedure
(Section 5.1 PAA Sensor Preparation). Do not reuse the electrolyte from the sensor when
changing a membrane. Always refill with fresh electrolyte. The electrolyte is stable and does not
have a limited shelf life.
Refer again to the explanation of the sensor slope number after an accepted span calibration on
the lower MEASURE screen. In normal operation, the slope of the sensor output will decrease
over time as the membrane becomes fouled. This reduction indicates that the sensor is losing
sensitivity to PAA. It is good practice to replace the membrane if the slope number falls to 3040%. The value will not go below 20%.
Even if no buildup is apparent on the membrane, it should be changed on a regular schedule.
The recommended membrane change interval is every 3 months. For high purity water
applications, this can probably be extended if desired, but a more frequent changing interval is a
small price to pay for avoiding membrane failure at the wrong time.
While the sensor is disassembled for membrane changing, examine the condition of the o-rings
on both ends of the electrolyte chamber. If the o-rings show any signs of damage, replace them
with new ones from the spare parts kit. It is good practice to change these o-rings once a year,
regardless of their condition.
O&M Manual
Rev F (8/17)
57
Page 58

ATI Q46H/85 PAA System Part 9 – System Maintenance
WARNING
THIS ACID CLEANING PROCEDURE INVOLVES THE
USE OF HIGHLY CORROSIVE ACID SOLUTIONS. IT
SHOULD ONLY BE COMPLETED BY TRAINED
PERSONNEL USING PROTECTIVE EYEWEAR AND
GLOVES. IF THERE IS ANY DOUBT ABOUT YOUR
S
PROCEDURE, RETURN THE SENSOR TO ATI FOR
9.31 Sensor Acid Cleaning
Over an extended operating period, PAA sensors can slowly accumulate deposits on the surface
of the gold electrode. Typically, this type of buildup occurs over years of operation, but can
sometimes occur more quickly in high levels of manganese, iron, or other metals are dissolved in
the water. The platinum electrode can be “acid cleaned” using nitric acid solutions.
To acid clean the electrode assembly, remove the electrolyte chamber from the sensor so that
the so that both electrodes are exposed. Then follow the procedure below.
1. Place a small amount of 50% nitric acid solution in a beaker. Put in just enough so that the
gold tip of the sensor can be submerged without any contact with the silver coil.
2. Allow the sensor to soak in this acid solution for 2 minutes. Remove the sensor body and
rinse the platinum tip thoroughly with distilled water. Discard the nitric acid safely and
according to all environmental regulations.
3. Fill the beaker with distilled water to the level sufficient to submerge both the tip and the silver
coil. Do not allow the connector at the back of the sensor to be submerged. Allow the
electrodes to soak in distilled water for 30 minutes.
4. Put a new membrane and fresh electrolyte in the electrolyte chamber and reassemble the
sensor. Connect to the PAA monitor electronics and allow the sensor to stabilize for at least
24 hours. The sensor can be placed in the flow cell with ozonated water running through it
during stabilization. However, the readings will not be useful for 24 hours.
9.4 Flow Cell Maintenance
The maintenance on the flow cell is simple cleaning. The flow cell is clear to make examination
of the condition of the sensor easier without interfering with operations. The flow cell may be
cleaned by wiping or by washing with detergents or dilute acids. Do not try to clean with solvents
as the acrylic may craze or crack.
Change the o-ring in the flow cell yearly or if any damage is observed. If insertion of the sensor
into the flow cell becomes difficult, use silicon grease to lubricate the o-rings that hold the sensor
in place. Use only enough grease to provide surface lubrication. Excess grease could foul the
sensor membrane.
ABILITY TO SAFELY ACCOMPLISH THI
FACTORY CLEANING!
58
O&M Manual
Rev F (8/17)
Page 59

Part 10 – Troubleshooting
10.1 General
The information included in this section is intended to be used in an attempt to quickly resolve an
operational problem with the system. During any troubleshooting process, it will save the most
time if the operator can first determine if the problem is related to the analyzer, sensor, or some
external source. Therefore, this section is organized from the approach of excluding any likely
external sources, isolating the analyzer, and finally isolating the sensor. If these procedures still
do not resolve the operational problems, any results the operator may have noted here will be
very helpful when discussing the problem with the factory technical support group.
10.2 External Sources of Problems
To begin this process, review the connections of the system to all external connections.
1. Verify the analyzer is earth grounded. For all configurations of the analyzer, an earth ground
connection MUST be present for the shielding systems in the electronics to be active.
Grounded conduit provides no earth connection to the plastic enclosure, so an earth ground
wiring connection must be made at the power input terminal strip. Verify metal shield is
present over incoming power connections. This shield is for safety purposes, but also blocks
electrical spikes from relay and power wiring.
2. Verify the proper power input is present (115/230/16-35VDC).
3. Verify the loads on any 4-20 mA outputs do not exceed the limits in the Instrument
Specifications. During troubleshooting, it is many times helpful to disconnect all these
outputs and place wire-shorts across the terminals in the instrument to isolate the system and
evaluate any problems which may be coming down the analog output connections.
4. Do not run sensor cables or analog output wiring in the same conduits as power wiring. If low
voltage signal cables must come near power wiring, cross them at 90° to minimize coupling.
5. If rigid conduit has been run directly to the Q46 enclosure, check for signs that moisture has
followed conduit into the enclosure.
6. Check for ground loops. Although the membrane sensor is electrically isolated from the
process water, high frequency sources of electrical noise may still cause erratic behavior in
extreme conditions. If readings are very erratic after wiring has been checked, check for a
possible AC ground loop by temporarily disconnecting feed and drain lines from the flow cell
while there is still water on the inside. The reading should be initially stable and then fall very
slowly in a smooth fashion as PAA is depleted in the static sample.
7. On relay based systems, check the load that is connected to the relay contacts. Verify the
load is within the contact rating of the relays. Relay contacts which have been used for
higher power AC current loads may become unsuitable for very low signal DC loads later on
because a small amount of pitting can form on the contacts. If the load is highly inductive
(solenoids, motor starters, large aux relays), note that the contact rating will be de-rated to a
lower level. Also, due to the large amount of energy present in circuits driving these types of
O&M Manual
Rev F (8/17)
59
Page 60

ATI Q46H/85 PAA System Part 10 – Troubleshooting
loads when they are switched on an off, the relay wiring placement can result in electrical
interference for other devices. This can be quickly resolved by moving wiring, or by adding
very inexpensive snubbers (such As Quencharcs) to the load.
8. Carefully examine any junction box connections for loose wiring or bad wire stripping. If
possible, connect the sensor directly to the analyzer for testing.
9. Check sensor membrane for fouling. Look closely for signs of grease or oil which may be
present. Replace membrane and electrolyte, allow to stabilize, and re-check. The procedure
in Section 5.1 PAA Sensor Preparation, must be followed when replacing the membrane.
10.3 Analyzer Tests
1. Disconnect power and completely disconnect all output wiring coming from the analyzer.
Remove sensor wiring, relay wiring, and analog output wiring. Re-apply power to the
analyzer.
2. Using the Simulate feature, check operation of analog outputs and relays with a DMM.
3. Check cell drive circuit. With a digital voltmeter (DVM), measure the voltage between
ORANGE (-) terminal and WHITE (+) terminals. Verify that the millivolt value is actually -400
mV.
4. Check TC drive circuit. Place a wire-short between the GREEN and BLACK terminals. With
a digital voltmeter (DVM), measure the voltage between the BLACK and RED terminals on
the back of the monitor to verify that the TC drive circuit is producing about 4.8-5.1 VDC open
circuit. Remove DVM completely and connect a 100 Ohm resistor from the BLACK to RED
terminals. The temperature reading should display approximately 0°C and the PAA reading
should display approximately 0 ppm.
10.4 Display Messages
The Q46 Series instruments provide a number of diagnostic messages which indicate problems
during normal operation and calibration. These messages appear as prompts on the secondary
line of the display or as items on the Fault List.
O&M Manual
Rev F (8/17)
60
Page 61

ATI Q46H/85 PAA System Part 10 – Troubleshooting
MESSAGE
DESCRIPTION
POSSIBLE CORRECTION
Max is 200
Min is 200
Cal Unstable
Calibration problem, data too unstable to
calibrate. Icons will not stop flashing if data is too
or, get fresh cal solutions, allow
temperature and conductivity readings to fully
stabilize, do not handle sensor or cable during
Out of Range
Input value is outside selected range of the
limits of the function to be
Locked!
Enter security code to allow modifications to
Unlocked!
Displayed just after security code has been
Offset High
The sensor zero offset point is out of the
Check wiring connections to sensor. Allow
sensor to operate powered a minimum of 12
Sensor High
s too high and
Sensor Low
PAA
High
reading is greater than the maximum of
reading is over operating limits. Set
Temp High
The temperature reading is over operating
limits. Check wiring and expected temp level.
sensor
manual. Recalibrate sensor temperature
Temp Low
TC Error
Check sensor wiring and perform RTD test as
box
Entry failed, maximum user value allowed is 200.
Entry failed, minimum value allowed is 200.
unstable. User can bypass by pressing ENTER.
specific list item being configured.
Transmitter security setting is locked.
Transmitter security has just been unlocked.
acceptable range of -20 to +20 nA.
The raw signal from the sensor i
out of instrument range.
The raw signal from the sensor is too low.
The PAA
the User-selected range.
Reduce value to ≤ 200
Increase value to ≥ 200
Clean sens
calibration.
Check manual for
configured.
settings.
entered.
hours prior to first zero cal.
Check wiring connections to sensor.
Check wiring connections to sensor.
The PAA
measuring range to the next highest level.
The temperature reading is > 55ºC.
Perform RTD test as described in
element if necessary.
The temperature reading is < -10 ºC
TC may be open or shorted.
Same as “Temp High” above.
described in sensor manual. Check jconnections.
Figure 28 - Q46H Dsiaply Messages
O&M Manual
Rev F (8/17)
61
Page 62

ATI Q46H/85 PAA System Part 10 – Troubleshooting
MESSAGE
DESCRIPTION
POSSIBLE CORRECTION
PAA
Cal Fail
calibration. FAIL icon will
not extinguish until successful calibration
nutes passes
with no keys being pressed.
Clean sensor redo zero and span calibration.
If still failure, sensor slope may be less than
25% or greater than 250%. Perform sensor
tests as described in section 10.5. Replace
TC Ca
l Fail
Failure of temperature calibration. FAIL icon
will not extinguish until successful
calibration has been performed, or 30
minutes passes with no keys being
Clean sensor, check cal solution temperature
TC
calibration function only allows adjustments
C. If still failure, perform sensor
tests as described in section 10.5. Replace
EPROM Fail
Chcks
um Fail
Display Fail
Range Cal Fail
Failure of PAA
has been performed, or 30 mi
pressed.
Internal nonvolatile memory failure
Internal software storage error.
Internal display driver fail.
sensor if still failure.
and repeat sensor temp calibration.
of +/- 6 º
sensor if still failure. .
System failure, consult factory.
System failure, consult factory.
System failure, consult factory.
Failure of factory temperature calibration.
Consult factory.
Figure 29 - Display Messages (Continued)
O&M Manual
Rev F (8/17)
62
Page 63

ATI Q46H/85 PAA System Part 10 – Troubleshooting
10.5 Sensor Tests
1. Check the membrane condition. A membrane that is not stretched smoothly across the tip of
the sensor will cause unstable measurements. If necessary, change membrane and
electrolyte.
2. Residual PAA sensors can be tested with a digital voltmeter (DVM) to determine if a major
sensor problem exists. Follow the steps below to verify sensor integrity:
A. Disconnect the five sensor wires from the back of the PAA monitor. Those wires are
color coded white, brown, red, black, and green. Note that the brown wire may be
replaced with an orange wire in some cables.
B. Remove the electrolyte chamber from the sensor and dry the electrodes with a paper
towel.
C. Connect a DVM between the white and brown (or orange) wires. Reading resistance,
you should find an open circuit value of infinite resistance. There must be no measurable
resistance at all between these wires. Any resistance at all indicates either water in the
cable connector or the breakdown in an electrode seal.
D. Connect a DVM between the red and white wires. The red wire is part of the RTD circuit
and the white wire is part of the measuring cell. There should be no connection. Reading
resistance, you should find an open circuit value of infinite resistance. Any resistance at
all indicates either water in the cable connector or the breakdown in an electrode seal.
E. Connect the DVM between the red and black wires. These are the RTD leads, and you
should find a resistance value that depends on the temperature. The table below lists the
resistance values for various temperatures. Reading resistance between the red and
green wires should give exactly the same values as between red and black.
Temperature °C
Resistance Ω
O&M Manual
Rev F (8/17)
0 100.0
5 101.9
10 103.9
15 105.8
20 107.8
25 109.7
30 111.7
35 113.6
40 115.5
45 117.5
50 119.4
Figure 30 - Pt100 RTD Table
If you suspect that water has gotten into a cable connection on a flow type sensor or into
the plug connection of a submersible sensor, disconnect the cable and allow the parts of
the sensor to sit in a warm place for 24 hours. If water in the connector is the problem, it
63
Page 64

ATI Q46H/85 PAA System Part 10 – Troubleshooting
should dry out sufficiently to allow normal sensor operation. However, steps 2c thru 2e
above will have to be repeated after drying to see if the problem is gone.
3. Acid clean the sensor electrodes in accordance with the procedure on the previous page.
O&M Manual
Rev F (8/17)
64
Page 65

Spare Parts
Electronics
03-0385-6 Q46/85 Front lid assembly
07-0310 Q46/85 Monitor, 100-240 VAC
07-0311 Q46/85 Monitor, 12-24 VDC
07-0314 Q46/85 Monitor, 100-240 VAC, w/Profibus
07-0315 Q46/85 Monitor, 12-24 VDC, w/Profibus
23-0029 Fuse, T-Lag, 630mA, 250V, TR-5 (for AC and DC Analyzers)
38-0072 Terminal block plug, 3 position (relays)
38-0073 Terminal block plug, 4 position (outputs)
38-0074 Terminal block plug, 3 position (shields)
38-0081 Terminal block plug, 3 position (power)
38-0084 Terminal block plug, 3 position (power) – VDC version*
*NOTE: prior to Dec 2018, VDC (power) Terminal block used the (38-0081)
03-0407 Q46 P/S Assy, 100-240 VAC
03-0408 Q46 P/S Assy, 100-240 VAC with 3rd 4-20mA output
03-0409 Q46 P/S Assy, 100-240 VAC with 3 relay exp. Board
03-0410 Q46 P/S Assy, 12-24 VDC
03-0411 Q46 P/S Assy, 12-24 VDC with 3rd 4-20mA output
03-0412 Q46 P/S Assy, 12-24 VDC with 3 relay exp. Board
Sensors
00-1620 PAA sensor, flow type
07-0096 Q22 pH Sensor, no cable
63-0101 Conventional pH Sensor with solution ground, 25 ft. cable
Sensor Components
02-0018 Sensing element body, (for #00-1620)
03-0029 Sensor interconnect cable with connector, 25 ft.
45-0007 Electrolyte chamber
45-0290 Membrane holder, type Kynar
05-0090* Membranes, pkg. of 10
05-0004* Spare Parts Kit, screw & o-ring
09-0060* Peracetic acid electrolyte, 4 oz (120 cc)
Flowcells
00-0043 Constant-Head Flowcell assembly with mounting plate
00-1522 Sealed flowcell assembly with mounting plate
00-1527 Sealed pH flowcell assembly with mounting plate
42-0014 Flowcell o-ring (each)
Misc. Components
07-0100 Universal Junction Box, NEMA 4X
07-0382 Junction Box for 2nd Input Sensor
31-0038 Interconnect cable for junction box to monitor wiring .
03-0371 Fixed Flow Regulator assy (w/25’ tubing)
44-0276 Black Polyurethane tubing
05-0101 Vacuum Breaker Assy
Note: Instrument is supplied with sufficient spare parts for 6-12 months of operation. For 2 year spare parts
inventory, 3 each of the items marked with an asterisk are required.
Lock/Unlock Code: 1461
O&M Manual
Rev F (8/17)
65
Page 66

PRODUCT WARRANTY
Analytical Technology, Inc. (Manufacturer) warrants to the Customer that if any part(s) of the
Manufacturer's products proves to be defective in materials or workmanship within the earlier of
18 months of the date of shipment or 12 months of the date of start-up, such defective parts will
be repaired or replaced free of charge. Inspection and repairs to products thought to be defective
within the warranty period will be completed at the Manufacturer's facilities in Collegeville, PA.
Products on which warranty repairs are required shall be shipped freight prepaid to the
Manufacturer. The product(s) will be returned freight prepaid and allowed if it is determined by
the manufacturer that the part(s) failed due to defective materials or workmanship.
This warranty does not cover consumable items, batteries, or wear items subject to periodic
replacement including lamps and fuses.
Gas sensors, except oxygen sensors, are covered by this warranty, but are subject to inspection
for evidence of extended exposure to excessive gas concentrations. Should inspection indicate
that sensors have been expended rather than failed prematurely, the warranty shall not apply.
The Manufacturer assumes no liability for consequential damages of any kind, and the buyer by
acceptance of this equipment will assume all liability for the consequences of its use or misuse by
the Customer, his employees, or others. A defect within the meaning of this warranty is any part
of any piece of a Manufacturer's product which shall, when such part is capable of being
renewed, repaired, or replaced, operate to condemn such piece of equipment.
This warranty is in lieu of all other warranties (including without limiting the generality of the
foregoing warranties of merchantability and fitness for a particular purpose), guarantees,
obligations or liabilities expressed or implied by the Manufacturer or its representatives and by
statute or rule of law.
This warranty is void if the Manufacturer's product(s) has been subject to misuse or abuse, or has
not been operated or stored in accordance with instructions, or if the serial number has been
removed.
Analytical Technology, Inc. makes no other warranty expressed or implied except as stated
above.
O&M Manual
Rev F (8/17)
66
Page 67

WATER QUALITY MONITORS
Dissolved Oxygen
Free Chlorine
Combined Chlorine
Total Chlorine
Residual Chlorine Dioxide
Potassium Permanganate
Dissolved Ozone
pH/ORP
Conductivity
Hydrogen Peroxide
Peracetic Acid
Dissolved Sulfide
Residual Sulfite
Fluoride
Dissolved Ammonia
Turbidity
Suspended Solids
Sludge Blanket Level
MetriNet Distribution Monitor
GAS DETECTION PRODUCTS
NH3 Ammonia
CO Carbon Monoxide
H2 Hydrogen
NO Nitric Oxide
O2 Oxygen
CO Cl2 Phosgene
Br2 Bromine
Cl2 Chlorine
ClO2 Chlorine Dioxide
F2 Fluorine
I2 Iodine
HX Acid Gases
C2H4O Ethylene Oxide
C2H6O Alcohol
O3 Ozone
CH4 Methane
(Combustible Gas)
H2O2 Hydrogen Peroxide
HCl Hydrogen Chloride
HCN Hydrogen Cyanide
HF Hydrogen Fluoride
H2S Hydrogen Sulfide
NO2 Nitrogen Dioxide
NOx Oxides of Nitrogen
SO2 Sulfur Dioxide
H2Se Hydrogen Selenide
B2H6 Diborane
GeH4 Germane
AsH3 Arsine
PH3 Phosphine
SiH4 Silane
HCHO Formaldehyde
C2H4O3 Peracetic Acid
DMA Dimethylamine
 Loading...