

Page 1
WT500 SPECIFICATION
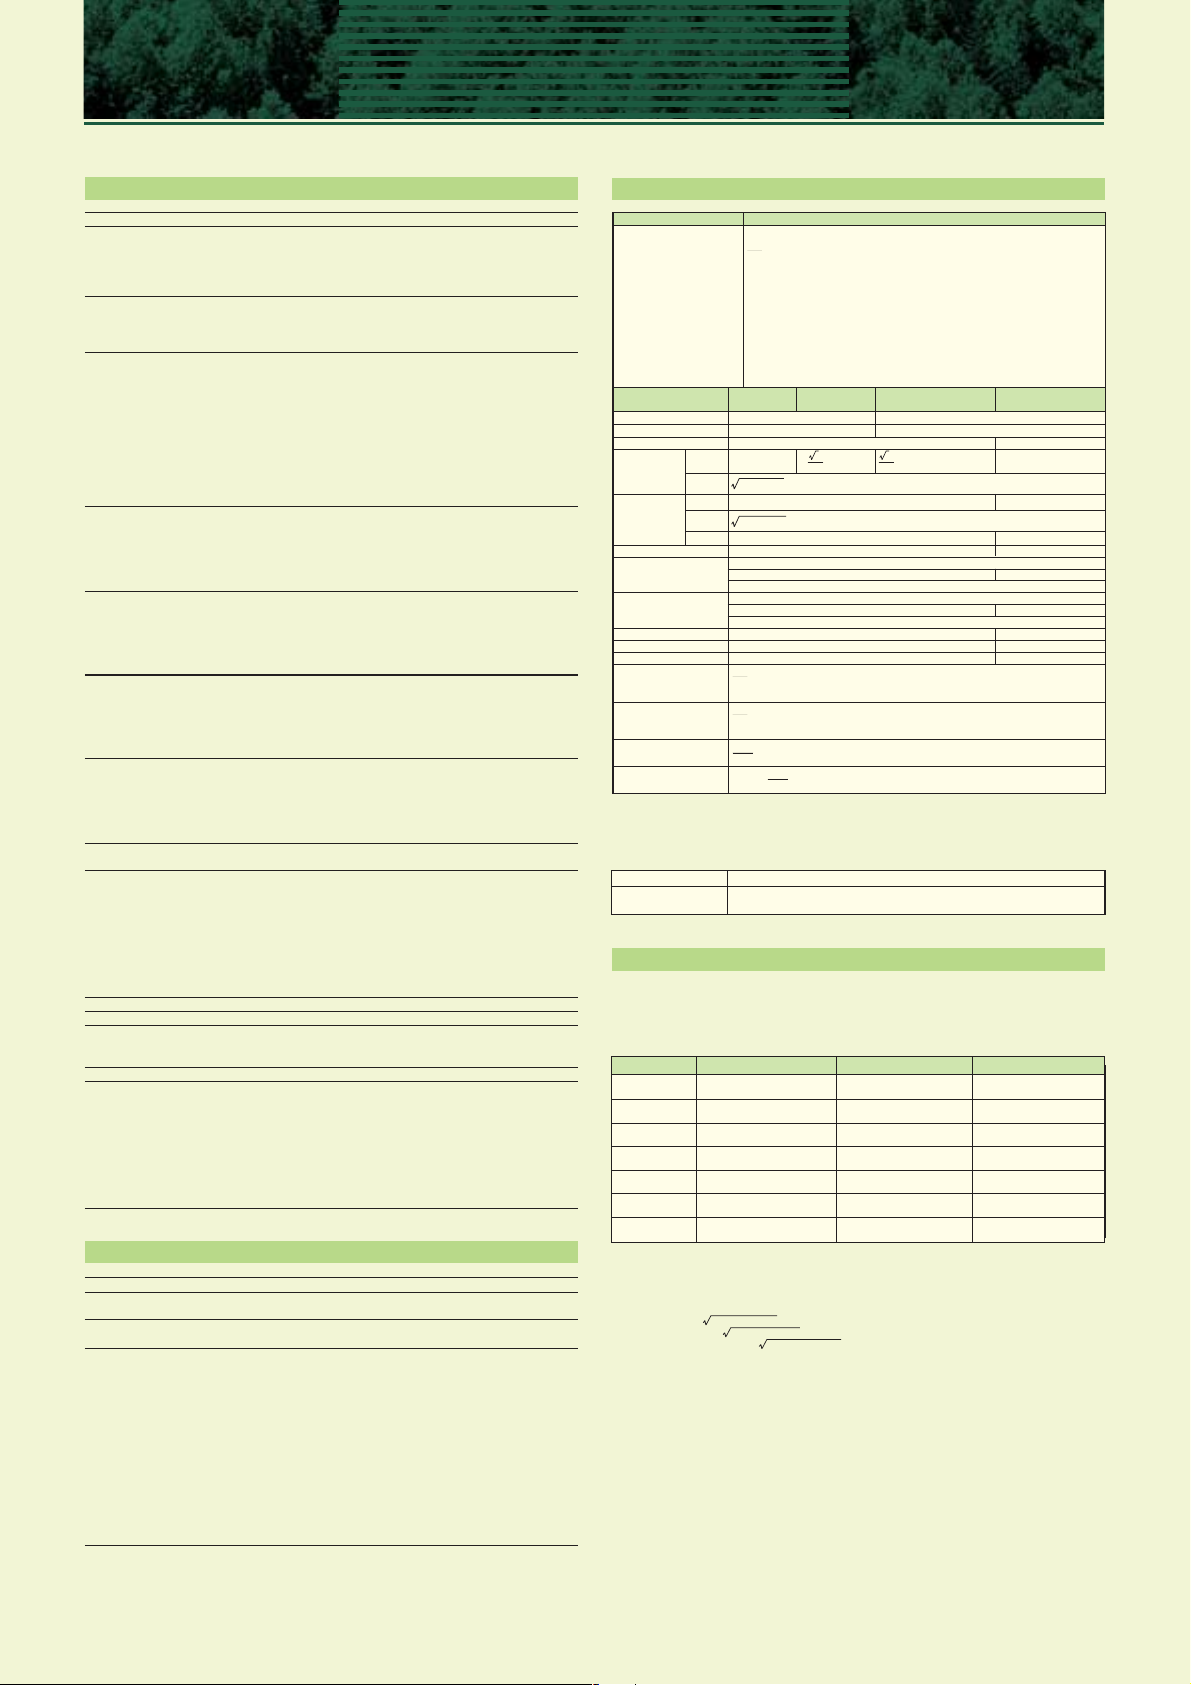
WT500 Specifications
Inputs
Item
Input terminal type
Input type
Measurement
range
Instrument loss (input impedance)
Instantaneous maximum allowable input (20 m second or less)
Instantaneous maximum allowed input (1 second or less)
Continuous maximum allowed input
Continuous maximum common mode voltage (50/60 Hz)
Influence from common mode voltage
Line filter
Frequency filter
A/D converter
Range switching
Auto range functions
Display
Display
Total number of pixels*
Waveform display resolution
Display update rate
* Up to 0.02% of the pixels on the LCD may be defective.
Specification
Voltage
Plug-in terminal (safety terminal)
Current
• Direct input: Large binding post
• External sensor input: Insulated BNC connector
Voltage
Floating input, resistive potential method
Current
Floating input, shunt input method
Voltage
15 V, 30 V, 60 V, 100 V, 150 V, 300 V, 600 V, 1000 V (for crest factor 3)
7.5 V, 15 V, 30 V, 50 V, 75 V, 150 V, 300 V, 500 V (for crest factor 6)
Current
• Direct input
500 mA, 1 A, 2 A, 5 A, 10 A, 20 A, 40 A (for crest factor 3)
250 mA, 500 mA, 1 A, 2.5 A, 5 A, 10 A, 20 A (for crest factor 6)
• External sensor input
50 mV, 100 mV, 200 mV, 500 mV, 1 V, 2 V, 5 V, 10 V (for crest factor 3)
25 mV, 50 mV, 100 mV, 250 mV, 500 mV, 1 V, 2.5 V, 5 V (for crest
factor 6)
Voltage
Approximately 2 MΩ, 13 pF
Current
• Direct input: Approximately 5 mΩ + approximately 0.1 µH
• External sensor input: Approximately 100 kΩ
Voltage
Peak voltage of 2.8 kV or RMS of 2 kV, whichever is lower
Current
• Direct input: Peak current of 450 A or RMS of 300 A, whichever is lower
• External sensor input: Peak not to exceeded 10 times the range
Voltage
Peak voltage of 2 kV or RMS of 1.5 kV, whichever is lower
Current
• Direct input: Peak current of 150 A or RMS of 45 A, whichever is lower
• External sensor input: Peak not to exceed 10 times the range
Voltage
Peak voltage of 1.5 kV or RMS of 1 kV, whichever is lower
Current
• Direct input: Peak current of 100 A or RMS of 45 A, whichever is lower
• External sensor input: Peak not to exceed 5 times the range
1000 Vrms
Apply 1000 Vrms with the voltage input terminals shorted and the
current input terminals open.
• 50/60 Hz: ±0.01% of range or less
• Reference value up to 100 kHz
± (max. range/range)* 0.001 * f% of range or less.
However, 0.01% or more. The units of f are kHz. Current Sensor Input
is 10 times of above equations. The maximum
rated range within equations is 1000 V or 40 A or 10V.
Select OFF, 500 Hz, 5.5 kHz.
Select OFF, or ON (Cut off frequency: 500 Hz)
Simultaneous voltage and current conversion and 16-bit resolution.
Conversion speed (sampling rate): Approximately 10 µs. See
harmonic measurement items for harmonic display.
Can be set for each input element.
Increasing range value
• When the measured values of U rms and I rms exceed 110% of the
range rating
• When the peak value exceeds approximately 330% of the range
rating (or approximately 660% for crest factor 6)
Decreasing range value
• When the measured values of U rms and I rms fall to 30% or less of
the range rating, and Upk and Ipk are 300% or less of the lower range
value (or 600% for crest factor 6)
5.7-inch color TFT LCD monitor
640 (horiz.) 480 (vert.) dots
501 (horiz.) 432 (vert.) dots
Same as the data update rate.
Exceptions are listed below.
• The display update interval of numeric display (4, 8, and 16 items) is
200 ms when the data update rate is 100 ms.
• The display update interval of numeric display (ALL, Single List, and
Dual List) is 500 ms when the data update rate is 100 ms or 200 ms.
• The display update rate of the trend display, bar graph display, and
vector display is 1 s when the data update rate is 100 ms to 500 ms.
• The display update interval of the waveform display is approximately
1 s when the data update rate is 100 ms to 1 s. However, it may be
longer depending on the trigger setting.
• At the setting of SLAVE mode, display update rate depends on the
External clock. However it is adopted under faster external condition
than data update rate.
Calculation Functions
Measurement functions
WP [Wh]
WP+
WP-
UΣ [V]
IΣ [A]
PΣ [W]
SΣ [VA]
QΣ [var]
WPΣ [Wh]
WP+Σ [Wh]
WP–Σ [Wh]
qΣ [Ah]
q+Σ [Ah]
q–Σ [Ah]
WQΣ [varh]
WSΣ [VAh]
λΣ
ØΣ [˚]
Note1) The instrument’s apparent power (S), reactive power (Q), power factor (l), and phase angle (Ø) are
calculated using measured values of voltage, current, and active power. (However, reactive power is calculated
directly from sampled data when TYPE3 is selected.) Therefore, when distorted waveforms are input, these
values may be different from those of other measuring instruments based on different measuring principals.
Note 2) The value of Q in the QS calculation is calculated with a preceding minus sign (-) when the current input
leads the voltage input, and a plus sign when it lags the voltage input, so the value of QS may be negative.
η [%]
User-defined functions
F1–F8
Equations
Power integration
N
1
Σ
N
n=1
N: sampling times during the elapsed period
Time: unit is h
WPTYPE: CHARGE/DISCHARGE
WP+ is summation of product of u (n) i(n) equation which is only positive value
WP- is summation of product of u (n) i (n) equation which is only negative value
WP is sum of WP+ and WPWPTYPE: BOUGHT/SOLD
WP+ is summation of average P which is only positive value
WP- is summation of average P which is only negative value
WP is sum of WP+ and WP-
Single-phase,
3 wire
(U1+U2)/2
(I1+I2)/2
P1+P2
S1+S2
TYPE1,
TYPE2
TYPE3
PΣ
TYPE1
Q1+Q2
TYPE2
SΣ2–PΣ
TYPE3
Q1+Q2
WP1
CHARGE/DISCHARGE setting
WP
When WPTYPE is set to SOLD/BOUGHT, only positive WPΣ value is added
CHARGE/DISCHARGE setting
WP–1
When WPTYPE is set to SOLD/BOUGHT, only negative WPΣ value is added
q1+q2
q
+
1+q+2
q–1
1
N
QΣ(n) is the nth reactive power Σ function , and N is the number of data updates. Unit of Time is h.
1
N
SΣ(
PΣ
SΣ
cos
Set a efficiency calculation up to 2
Create equations combining measurement function symbols, and calculate up to
eight numerical data.
3 phase, 3 wire
3
(S1+S2) (S1+S2+S3)
2
2
2
+QΣ
2
+
WP2
+
1+WP+2
+
WP–2
+
q-2
N
| QΣ(n) | ×Time
Σ
n=1
N
SΣ(n)×Time
Σ
n=1
n
) is the nth apparent power Σ function, and N is the number of data updates. Unit of Time is h.
PΣ
-
1
( )
SΣ
3 phase, 3 wire
(3 voltage 3 current)
(U1+U2+U3)/3
(I1+I2+I3)/3
3
3
P1+P2+P3
S1+S2+S3
Q1+Q2+Q3
Q1+Q2+Q3
WP1
WP+1+WP+2+WP+3
WP-1+WP-2+WP-3
q1+q2+q3
q
+
q-1
3 phase, 4 wire
+
WP2+WP3
1+q+2+q+3
+
q-2+q-3
Accuracy
[Conditions]
Temperature: 23±5°C, Humidity: 30 to 75%RH, Input waveform: Sine wave, Common mode voltage: 0 V, Crest
factor: 3, Line filter: OFF, Frequency filter: 440 Hz ON, λ (power factor): 1, After warm-up. After zero level
compensation or range value change while wired. f is frequency, 6-month
* These conditions are all accuracy condition in this section.
Accuracy ±(reading error + measurement range error) (for crest factor 3)
Frequency Voltage Current Power
DC
0.5 Hzf45 Hz
45 Hzf66 Hz
66 Hzf1 kHz
1 kHzf10 kHz
10 kHzf50 kHz
50 kHzf100 kHz
• Unit of f of reading error is kHz
External Sensor Input, add 50 µV to DC Current accuracy and add
(50 µV / external sensor input rated range) 100% of range to DC power accuracy
Direct current Input, add 500 µA to DC Current accuracy and add
(500 µA / direct current input rated range) 100% of range to DC power accuracy
• Accuracy of waveform display data, Upk and Ipk (reference value)
Voltage: Add 1.5
Current: Direct-add 3
• Influenced by changes in temperature after zero level correction or range value changes.
Add 0.02% of range/°C to the voltage DC accuracy, 500 µA/°C to the current DC accuracy, 50 µV/°C to the
external current DC accuracy, and influence of voltage times influence of current to the power DC accuracy.
• Influence of self heating due to current input
When the input signal is current, for AC add 0.00013 I
0.004 I
influence of self-heating is present until the shunt resistance temperature drops, even when the current input
value is small.
• Additions to accuracy according to the data update rate
Add 0.05% of rdg when it is 100 ms.
• Range of guaranteed accuracy by frequency, voltage, and current
All accuracies between 0.5 Hz and 10 Hz are reference values.
If the voltage exceeds 750 V at 30 kHz–100 kHz, the voltage and power values are reference values.
If the current exceeds 20 A at DC, 10 Hz–45 Hz, or 400 Hz–100 kHz; the current and power accuracies are
reference values.
• Accuracy for crest factor 6: Range accuracy of crest factor 3 for two times range of crest factor 6.
• Influence of self heating due to voltage input
When the input signal is voltage, for AC add 0.0000001 u
of reading + 0.0000001 u
heating is present until the resistance temparature drops, ever when the voltage input value is small.
0.1% of reading
0.1% of reading
0.1% of reading
0.1% of reading
{
0.1 + 0.05
{
0.5 + 0.04
{
0.5 + 0.04
External input-add 3
Effective input range is within ±300% (within ±600% for crest factor 6)
2
mA to the current and power accuracy. I is the reading value of current (A). Please note that the
+ 0.1% of range
+ 0.2% of range
+ 0.1% of range
+ 0.2% of range
(
f-1)}% of reading
+ 0.2% of range
(
f-10)}% of reading
+ 0.3% of range
(
f-10)}% of reading
+0.3% of range
15/range rated % of range
0.5/range rated % of range + 5 mA
0.05/range rated % of range + 2 mV.
2
% of range. u is the reading value of voltage. Please note that the influence of self
0.1% of reading
0.1% of reading
0.1% of reading
0.1% of reading
(
0.1 f)% of reading
{
1 + 0.08
{
1 + 0.08
+ 0.1% of range
+ 0.2% of range
+ 0.1% of range
+ 0.2% of range
+ 0.2% of range
(
f-10)}% of reading
+ 0.3% of range
(
f-10)}% of reading
+ 0.3% of range
2
% of rdg, and for DC add 0.00013 I2% of rdg +
2
% of reading, and for DC add 0.0000001 u2%
0.1% of reading
0.3% of reading
0.1% of reading
0.2% of reading
{
0.2 + 0.1
{
0.2 + 0.1
{
5.1 + 0.18
+ 0.1% of range
+ 0.2% of range
+ 0.1% of range
+ 0.2% of range
(
f-1)}% of reading
+ 0.2% of range
(
f-1)}% of reading
+ 0.3% of range
(
f-50)}% of reading
+ 0.3% of range
Page 2
WT500 SPECIFICATION
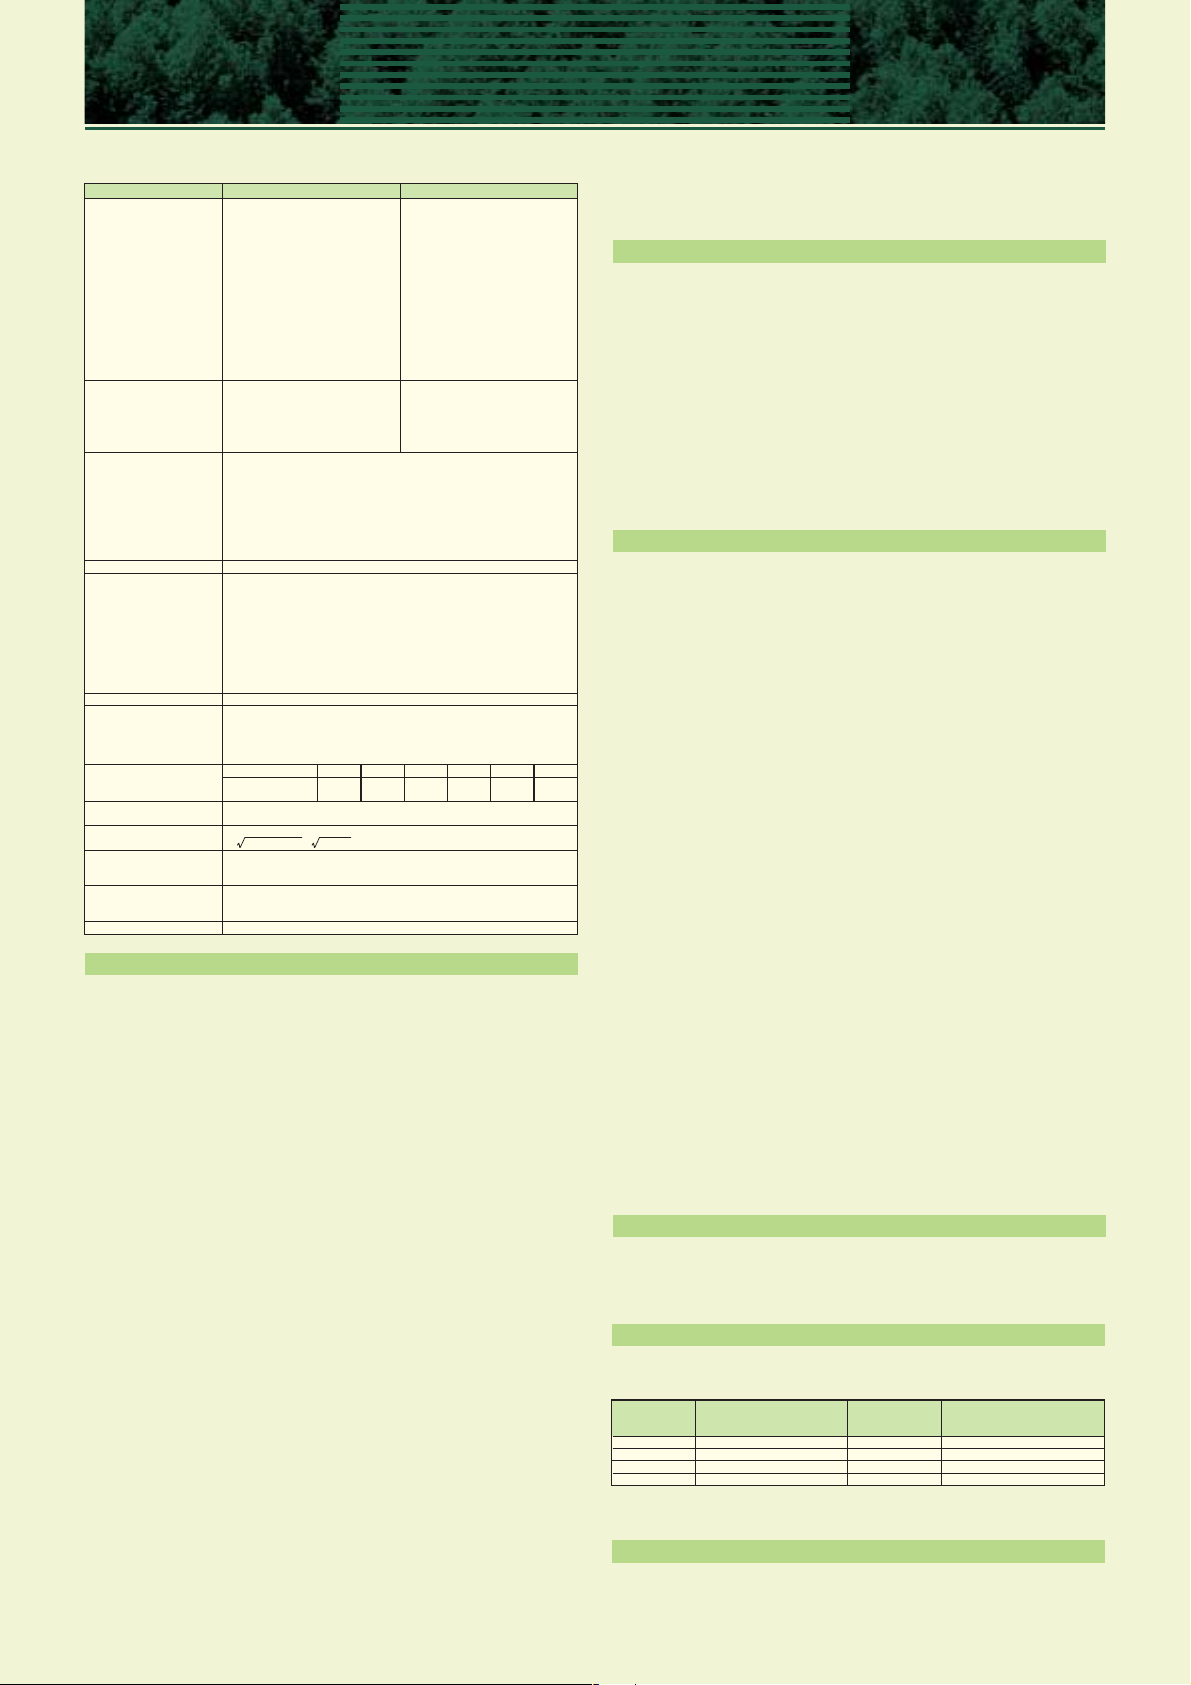
Power
Tot a l power error with
respect to the range for
an arbitrary power
factor λ (exclude λ = 1)
Influence of line filter
Lead/Lag Detection (d
(LEAD) /G (LAG) of the
phase angle and
symbols for the reactive
power Q∑ calculation)
* The s symbol shows
the lead/lag of each
element, and "-"
indicates leading.
Temperature coefficient
Effective input range
Max. display
Min. display
Measurement lower
limit frequency
Accuracy of apparent
power S
Accuracy of
reactive power Q
Accuracy of power factor
λ
Accuracy of phase
difference Ø
One-year accuracy
Voltage/current
–
When cutoff frequency is 500 Hz
"45 to 66 Hz: Add 0.2% of reading
Under 45 Hz: Add 0.5% of reading"
When cutoff frequency is 5.5 kHz
"66 Hz or less: Add 0.2% of reading
66 to 500 Hz: Add 0.5% of reading"
The phase lead and lag are detected correctly when the voltage and current
signals are both sine waves, the lead/lag is 50% of the range rating (or 100%
for crest factor 6), the frequency is between 20 Hz and 2 kHz, and the phase
angle is ±(5° to 175°) or more.
± 0.03% of reading/°C at 5–18° or 28–40 °C.
Udc and Idc are 0 to ±110% of the measurement range
Urms and Irms are 1 to 110%* of the measurement range (or 2%–220% for
crest factor 6)
Umn and Imn are 10 to ±110% of the measurement range
Urmn and Irmn are 10 to ±110%* of the measurement range
Power is 0 to ±110%* for DC measurement, 1 to 110%* of the voltage and
current range for AC measurement, and up to ±110%* of the power range.
However, the synchronization source level falls below the input signal of
frequency measurement.
110% of the voltage range rating.
140% of the voltage and current range rating
Urms, Irms, Uac and Iac are up to 0.5% relative to the measurement range (or
up to 1% for a crest factor of 6).
Umn, Urmn, Imn, and Irmn are up to 2% (or 4% for a crest factor of 6).
Below that, zero suppress. Current integration value q also depends on the
current value.
Data update rate
Measurement lower
limit frequency
Voltage accuracy + current accuracy
Accuracy of apparent power
+ ( (1.0004 – λ
±[ (λ – λ/1.0002) + |cosØ – cos {Ø + sin
when λ = 0%/100) } | ] ±1digit when voltage and current is at rated input of the
measurement range. Ø is the phase difference of voltage and current.
±[ |Ø – cos
λ=0%) /100 } ] deg ±1digit when voltage and current is at rated input of the
measurement range
Add the accuracy of reading error (Six-month) 0.5 to the accuracy six-month
100 ms 200 ms 500 ms 1 s 2 s 5 s
25 Hz 12.5 Hz 5 Hz 2.5 Hz 1.25 Hz 0.5 Hz
2
) – (1 – λ2) ) 100% of range
-1
(λ/1.0002) | + sin-1 { (influence of power factor of power when
When λ = 0
Apparent power reading 0.2% in
the 45 to 66 Hz range
All other frequencies are as follows
(however, these are only reference
values):
Apparent power reading
(0.2 + 0.2 f (kHz))%
0 < λ < 1
(Power reading) [(Power reading
Error (%)) + (power range error (%)
(Power range/Apparent power
reading)+power reading {tanØ
(influence when λ = 0%)] Ø is the
phase difference of voltage and current
When cutoff frequency is 500 Hz
"45 to 66 Hz: Add 0.3% of reading
Under 45 Hz: Add 1% of reading"
When cutoff frequency is 5.5 kHz
"66 Hz or less: Add 0.4% of reading
66 to 500 Hz: Add 1.2% of reading"
-1
(influence of power factor of power
Functions
Measurement method
Crest factor
Measurement period
Wiring
Scaling
Input filter
Averaging
Data update rate
Response time
Digital multiplication method
3 or 6 (when inputting rated values of the measurement
range), and 300 relative to the minimum valid input.
Interval for determining the measurement function and
performing calculations.
Period used to determine and compute the measurement
function.
• The measurement period is set by the zero crossing of the
reference signal (synchronization source) (excluding watt
hour WP as well as ampere hour q during DC mode).
• For harmonic measurement (/G5 option), the measurement
period is from the beginning of the data update interval to
1024 points at the harmonic sampling frequency.
You can select one of the following five wiring settings.
1P2W (single phase, two-wire), 1P3W (single phase, 3 wire),
3P3W (3 phase, 3 wire), 3P4W (3 phase, 4 wire),
3P3W(3V3A) (3 phase, 3 wire, 3 volt/3 amp measurement).
However, the number of available wiring settings varies
depending on the number of installed input elements. Up to
four, or only one, two, or three wiring settings may be
available.
When inputting output from external current sensors, VT, or
CT, set the current sensor conversion ratio, VT ratio, CT ratio,
and power coefficient in the range from 0.0001 to
99999.9999.
Line filter or frequency filter settings can be entered.
• The average calculations below are performed on the
normal measurement parameters of voltage U, current I,
power P, apparent power S, reactive power Q. Power factor
λ and phase angle Ø are determined by calculating the
average of P and S.
Select exponential or moving averaging.
• Exponential average
Select an attenuation constant of 2, 4, 8, 16, 32, or 64.
• Moving average
Select the number of averages from 8, 16, 32, or 64.
• The average calculations below are performed on the
harmonic display items of voltage U, current I, power P,
apparent power S, reactive power Q. Power factor λ is
determined by calculating the average of P and Q.
Only exponential averaging is performed. Select an
attenuation constant of 2, 4, 8, 16, 32 or 64
Select 100 ms, 200 ms, 500 ms, 1 s, 2 s, or 5 s.
At maximum, two times the data update rate (only during
numerical display)
Hold
Single
Zero level compensation/Null
Holds the data display.
Executes a single measurement during measurement hold.
Compensates the zero level. the range: ±10% of range
Integration
Mode
Timer
Count over
Accuracy
Time accuracy
Select a mode of Manual, Standard, Continuous (repeat),
Real Time Control Standard, or Real Time Control
Continuous (Repeat).
Integration can be stopped automatically using the integration
timer setting. 0000 h 00 m 00 s~10000 h 00 m 00 s
If the count over integration time reaches the maximum
integration time (10000 hours), or if the integration value
reaches max/min display integration value (±999999 MWh or
±999999 Mah), the elapsed time and value is saved and the
operation is stopped.
Powe r: ±(power accuracy + 0.02% of WS)
Current: ±(current accuracy + 0.02 elapsed time (h) % of
range) (when select dc)
±(current accuracy + 0.02% of reading) (when
selected others)
It does not sample for approximately 70µs at each
data update. The period is compensated.
±0.02% of reading
Display
• Numerical display function
Display resolution
Number of display items
• Waveform display items
No. of display rasters
Display format
Time axis
Sample rate
Tr iggers
Tr igger Type
Tr igger Mode
Tr igger Source
Tr igger Slope
Tr igger Level
Ver tical axis Zoom
ON/OFF
Format
Interpolation
Graticule
Other display ON/OFF
Cursor measurements
Zoom function
* Since the sampling frequency is approximately 100 kHz, waveforms that can be accurately
reproduced are those of about 5 kHz.
• Vector Display/Bar Graph Display (/G5 option is required)
Vector display
Bar graph display
• Trend display
Number of measurement channels Up to 8 parameters
• Simultaneous display
60000
Select 4, 8, 16 matrix, all, single list, or dual list.
501
Peak-peak compressed data
Range from 1 ms – 500 ms/div. However, it must be 1/10 th of
the data update rate.
Approximately 100 ks/s
Edge type
Select Auto or Normal. Triggers are turned OFF automatically
during integration.
Select voltage, current, or external clock for the input to each
input element.
Select (Rising), (Falling), or (Rising/Falling).
When the trigger source is the voltage or current input to the
input elements. Set in the range from the center of the screen
to ±100% (top/bottom edge of the screen). Setting resolution:
0.1%
When the trigger source is Ext Clk, TTL level.
Voltage and current input to the waveform vertical axis zoom
input element can be zoomed along the vertical axis.
Set in the range of 0.1 to 100 times.
ON/OFF can be set for each voltage and current input to the
input element.
You can select 1, 2, 3 or 4 splits for the waveform display.
Select dot or linear interpolation.
Select graticule or cross-grid display.
Upper/lower limit (scale value), and waveform label ON/OFF.
When you place the cursor on the waveform, the value of that
point is measured.
No time axis zoom function
Vector display of the phase difference in the fundamental
waves of voltage and current.
Displays the size of each harmonic in a bar graph.
Displays trends (transitions) in numerical data of the
measurement functions in a sequential line graph.
Two windows can be selected (from numerical display,
Not available
Storage
• Saving and Loading Data
Settings, waveform display data, numerical data, and screen
image data can be saved to media*.
Saved settings can be loaded from a media*.
*USB memory
Store function
Internal memory size Approximately 20 MB
Store interval (waveform OFF) Maximum 100 msec to 99 hour 59 minutes 59 seconds.
Guideline for Storage Time (Waveform Display OFF, Integration Function OFF)
Number of
measurement
channels
1 ch
1 ch
3 ch
3 ch
Note: Depending on the user-defined math, integration, and other settings, the actual
measurement time may be shorter than stated above.
Store interval to memory depends on number of stored data and kind og the media
Measured Items
(Per CH)
3
10
10
20
Storage Interval
100 ms
1 sec
100 ms
1 sec
Storable Amnt. of Data
Approx. 40 hr
Approx. 120 hr
Approx. 4 hr
Approx. 20 hr
Added Frequency Measurement (/FQ Optional)
Device under measurement
Select up to two frequencies of the voltage or current input to
the input elements for measurement. If the frequency option (/
Page 3

WT500 SPECIFICATION
FQ) is installed, the frequencies of the voltages and currents
Measurement method
Measurement range
Accuracy
Max. display resolution
Min. frequency resolution
Frequency Filter
being input to all input elements can be measured.
Reciprocal method
Data Update Rate Measuring Range
100 ms 25 Hzf100 kHz
200 ms 12.5 Hzf100 kHz
500 ms 5 Hzf100 kHz
1 s 2.5 Hzf100 kHz
2 s 1.5 Hzf50 kHz
5 s 0.5 Hzf20 kHz
±0.06% of reading
When the input signal levels are greater than or equal to 25
mV (current external sensor input) and the signal is greater
than or equal to 30% (0.1 Hz–440 Hz, frequency filter ON), of
the measurement range.
However, when the measuring frequency is smaller or equal
to 2 times of above lower frequency, the input signal is
greater than or equal to 50%.
Add 0.05% of reading when current external input is smaller
than or equal to 50 mV input signal level for each is double for
crest factor 6.
99999
0.0001 Hz
Select ON/OFF
Delta Calculation Function (/DT Optional)
Item
Voltage
Current
Delta Calculation Setting
difference
3P3W→3V3A
DELTA→STAR
STAR→DELTA
difference
3P3W→3V3A
DELTA→STAR
STAR→DELTA
왕U1: Differential voltage determined by computed u1 and u2
왕U1: Line voltage determined in the calculation for a 3 phase 3 wire connection
왕U1, 왕U2, 왕U3: Phase voltage determined in the calculation for 3 phase
3 wire (3V3A) connection
왕U1, 왕U2, 왕U3: Line voltage determined in the calculation for a 3 phase 4
wire connection
왕11: Differential current determined by computation
Phase current that are not measured can be computed
Neutral line current
Neutral line current
Symbols and Meanings
RGB Video Signal (VGA) Output Section (/V1 Optional)
Connector type
Output format
15-pin D-Sub (receptacle)
VGA compatible
Harmonic Measurement Function (/G5 Optional)
Measure source
Method
Frequency range
PLL source
Data length for FFT
Window function
Anti-aliasing filter
Sample rate (sampling frequency), window width, and upper limit of analyzed orders for PLL
synchronization.
• During Harmonic Display
Fundamental Frequency
10 Hz to 75 Hz
75 Hz to 150 Hz
150 Hz to 300 Hz
300 Hz to 600 Hz
600 Hz to 1200 Hz
Accuracy ±(reading error + measurement range error) (for crest factor 3)
• When Line Filter is ON (5.5 kHz)
Sampling Frequency Voltage Current Power
10 Hz≤f<45 Hz
45 Hz≤f≤440 Hz
440 Hz<f≤1 kHz
1 kHz<f≤2.5 kHz
• When Line Filter is OFF
Sampling Frequency Voltage Current Power
10 Hz≤f<45 Hz
45 Hz≤f≤440 Hz
440 Hz<f≤1 kHz
1 kHz<f≤2.5 kHz
2.5 kHz<f≤5 kHz
However, all the items below apply to all tables.
• When the crest factor is set to 3
• When λ (power factor) = 1
• Power figures that exceed 440 Hz are reference values.
• For nth order component input, add {n/(m+1)}/50% of (the nth order reading) to the n + mth order and n-mth
order of the voltage and current.
For the n+mth order and n-mth order of power, add {n/(m+1)/25} of the nth order reading.
• Add (n/500)% of reading to the nth component of the voltage and current, and add (n/250)% of reading to the
nth component of the power.
• Accuracy when the crest factor is 6: The same as when the range is doubled for crest factor 3.
• The accuracy guaranteed range by frequency and voltage/current is the same as the guaranteed range of
normal measurement. If the amplitude of the high frequency component is large, influence of approximately
1% may appear in certain orders. The influence depends on the size of the frequency component. Therefore, if
the frequency component is small with respect to the range rating, this does not cause a problem.
All Installed Elements
PLL synchronization
PLL source of the fundamental frequency is in the range 10
Hz–1.2 kHz.
Select voltage, current, or external clock for each input
element.
32 bits
Rectangular
Set using a line filter (5.5 kHz or OFF)
Sample Rate
f*1024
f*512
f*256
f*128
f*64
0.4% of reading + 0.35% of range
0.75% of reading + 0.35% of range
1.2% of reading + 0.35% of range
5% of reading + 0.35% of range
0.15% of reading
+ 0.35% of range
0.15% of reading
+ 0.35% of range
0.2% of reading
+ 0.35% of range
0.8% of reading
+ 0.35% of range
3% of reading
+ 0.35% of range
Window Width
1
2
4
8
16
0.15% of reading
+ 0.35% of range
0.15% of reading
+ 0.35% of range
0.2% of reading
+ 0.35% of range
0.9% of reading
+ 0.35% of range
3% of reading
+ 0.35% of range
Upper Limit of Analyzed orders
0.85% of reading + 0.5% of range
1.5% of reading + 0.5% of range
2.4% of reading + 0.5% of range
10% of reading +0.5% of range
50
32
16
8
4
0.35% of reading
+ 0.5% of range
0.25% of reading
+ 0.5% of range
0.4% of reading
+ 0.5% of range
1.7% of reading
+ 0.5% of range
6% of reading
+ 0.5% of range
Ethernet Communications (/C7 Optional)
Number of communication ports
Connector type
Electrical and mechanical specifications
Transmission system
Transmission rate
Protocol
Supported Services
1
RJ-45 connector
Conforms to IEEE 802.3.
Ethernet 100BASE–TX
Max.100 Mbps
TCP/IP
FTP server, DHCP, DNS, Remote control (VXI-11)
USB port (PC)
Connector
Electrical and Mechanical Specifications Conforms to USB Rev.1.1
Speed
Number of Ports
Supported service
Supported Systems
Power Supply
Type B connector (receptacle)
Max.12 Mbps
1
Remote control (USB-TMC)
Models with standard USB ports that run Windows 2000,
Windows XP, or Windows Vista with USB port
as a standard.
Self Power
USB port (Peripheral)
Connector
Electrical and Mechanical Specifications
Speed
Number of Ports
Supported keyboards
Supported USB memory devices
Power supply
Type A connector (receptacle)
Conforms to USB Rev.2.0
Max. 480 Mbps
2
104 keyboard (US) and 109 keyboard (Japanese) conforming
to USB HID Class Ver.1.1devices
USB (USB Mass Storage Class) flash memory
5 V, 500 mA (per por t)
However, device whose maximum current consumption
exceeds 100 mA cannot be connected simultaneously to the
two ports.
Master/Slave Synchronization Signal Input/External Clock Input (Select)
Master/Slave Synchronization Signals
Connector type
External Clock Input
Connector type
Input level
Inputting the synchronization source as the Ext Clk of normal measurement.
Frequency range
Input waveform
Inputting the PLL source as the Ext Clk of harmonic measurement. (/G5 option is required)
Frequency range
Input waveform
For Triggers
Minimum pulse width
Trigger delay time
BNC connector: Both slave and master
BNC connector
TTL
Same as the measurement range for frequency
50% duty ratio square wave
10 Hz to 1.2 kHz
50% duty ratio square wave
1 µs
Within (1 µs + 1 sample rate)
GP-IB Interface (/C1 optional)
Card driver
Conforms electrically and mechanically
Functional specification
Conforms to protocol
Encoding
Mode
Address
Clear remote mode
Use one of the following by NATIONAL INSTRUMENTS:
• AT-GPIB
• PCI-GPIB, PCI-GPIB+, and PCIe-GPIB
• PCMCIA-GPIB and PCMCIA-GPIB+
Use driver NI-488.2M version 1.60 or later.
IEEE St'd 488-1978 (JIS C 1901-1987).
SH1, AH1, T6, L4, SR1, RL1, PP0, DC1, DT1, and C0.
IEEE St'd 488.2-1992.
ISO (ASCII)
Addressable mode
0–30
Remote mode can be cleared using the LOCAL key (except
during Local Lockout).
General Specifications
Warm-up time
Operating temperature:
Operating humidity:
Operating altitude
Operating area
Storage environment:
Storage humidity:
Rated supply voltage
Allowed supply voltage fluctuation range
Rated supply frequency
Allowed supply frequency fluctuation
Maximum power consumption
Weight
Approximately thirty minutes.
5–40°C
20–80% (when printer not used)
(No condensation may be present)
2000 m or less
Inside of room
-25–60°C (no condensation may be present)
20 to 80% RH (no condensation)
100–240 VAC
90–264 VAC
50/60 Hz
48 to 63 Hz
80 VA (when using built-in printer)
Approximately 6.5 kg (including main unit, 3 input elements,
and options)
Page 4

Model and Suffix Codes
Power Analyzer WT500
Model
760201
760202
760203
Power cord
Options
Note: Adding input modules after initial product delivery will require rework at the factory. Please choose your
models and configurations carefully, and inquire with your sales representative if you have any questions.
Standard accessories
Power cord, Rubber feet, current input protective cover,
User’s manual, Communication interface user’s manual
(CD-ROM), Safety terminal adapter 758931(provided two
adapters in a set times input element number)
* Cable B9284LK (light blue) for external current sensor input is
sold separately. Safety terminal adapter 758931 is included with
the WT500. Other cables and adapters must be purchased by
the user.
Suffix Codes Description
-D
-F
-R
-Q
-H
/C1
/C7
/EX1
/EX2
/EX3
/G5
/DT
/FQ
/V1
WT500 1 input element model
WT500 2 input elements model
WT500 3 input elements model
UL/CSA standard
VDE standard
SAA standard
BS standard
GB standard
GP-IB interface
Ethernet interface
External sensor input for 760201
External sensor input for 760202
External sensor input for 760203
Harmonic Measurement
Delta computation (760202/03 only)
Add-on Frequency Measurement (760202/03 only)
VGA Output
Safety terminal adapter
758931
Exterior
(6.97)(0.77)
±5
12.3
±0.2
213
(8.39)(0.48
)
REAR VIEW
19.6 177
408.5
(16.08)
28.5
(1.12)
40.8
(1.61)
Rack Mount
Model Product Description
751533-E4
751533-J4
751534-E4
751534-J4
Model/parts number
758917
758922
758929
758923
758931
758924
366924
366925 *
758921
B9284LK
Due to the nature of this product, it is possible to touch its metal parts. Therefore, there is a risk of electric
shock, so the product must be used with caution.
* Use these products with low-voltage circuits (42V or less).
760122 WTViewer Data acquisition software 1
701960
701961
701962
751521
751523
Supply voltage
Power cord
* 751523-10 is designed for WT500, WT3000, PZ4000 and WT1600. 751523-20 is designed for the WT2000,
and WT200 Series.
* 751521/751523 do not conform to CE Marking.
751552
751574
* For detailed information, see Power Meter Accessory Catalog Bulletin 7515-52E
Rack mounting kit
Rack mounting kit
Rack mounting kit
Rack mounting kit
For EIA Single mount
For JIS Single mount
For EIA Double mount
For JIS Double mount
Accessory (sold separately)
Test read set
Small alligator-clip
Large alligator-clip
Safety terminal adapter
Safety terminal adapter
Conversion adapter
*
BNC-BNC cable
BNC-BNC cable
Fork terminal adapter
External sensor cable
Product
A set of 0.8m long, red and black test leads
Rated at 300V and used in a pair
Rated at 1000V and used in a pair
(spring-hold type) Two adapters to a set.
(screw-fastened type) Two adapters to a
set. 1.5 mm hex Wrench is attached
BNC-banana-jack(female) adapter
1m
2m
Banana-fork adapter. Two adapters to a set
Current sensor input connector. Length 0.5m
Description
Application Software
Model Product Description
Instrument Carts
Model
Suffix and codes
/A
/A
Description Description
Compact cart
Deluxe cart
General-purpose cart
500*560*705 mm (W, D, H)
Key board and mouse table
570*580*839 mm (W, D, H)
Key board and mouse table
467*693*713 mm (W, H, D)
Current Sensor Unit
Suffix code
-10
-20
-30
-1
-3
-7
-D
-F
-R
-J
-H
Description
Single-phase
Three-phase U, V
Three-phase U, W
Three-phase U, V, W
100 V AC (50/60 Hz)
115 V AC (50/60 Hz)
230 V AC (50/60 Hz)
UL/CSA standard
VDE standard
SAA standard
BS standard
GB standard
DC to 100 kHz (-3 dB). -600 A to 0 A to +600 A (DC)
Basic accuracy: (0.05% of rdg* + 40 mA) Superior noise
withstanding ability and CMRR characteristic due to
optimized casing design
Model
Clamp on Probe / Current transducer
Model Product Description
Clamp-on probe
Current transducer
30 Hz to 5 kHz, 1400 Apk (1000 Arms)
DC to 100 kHz (-3 dB), 600 Apk
Order Q’ty
1
1
1
1
1
1
1
1
1
1
Order Q’ty
 Loading...