

Page 1
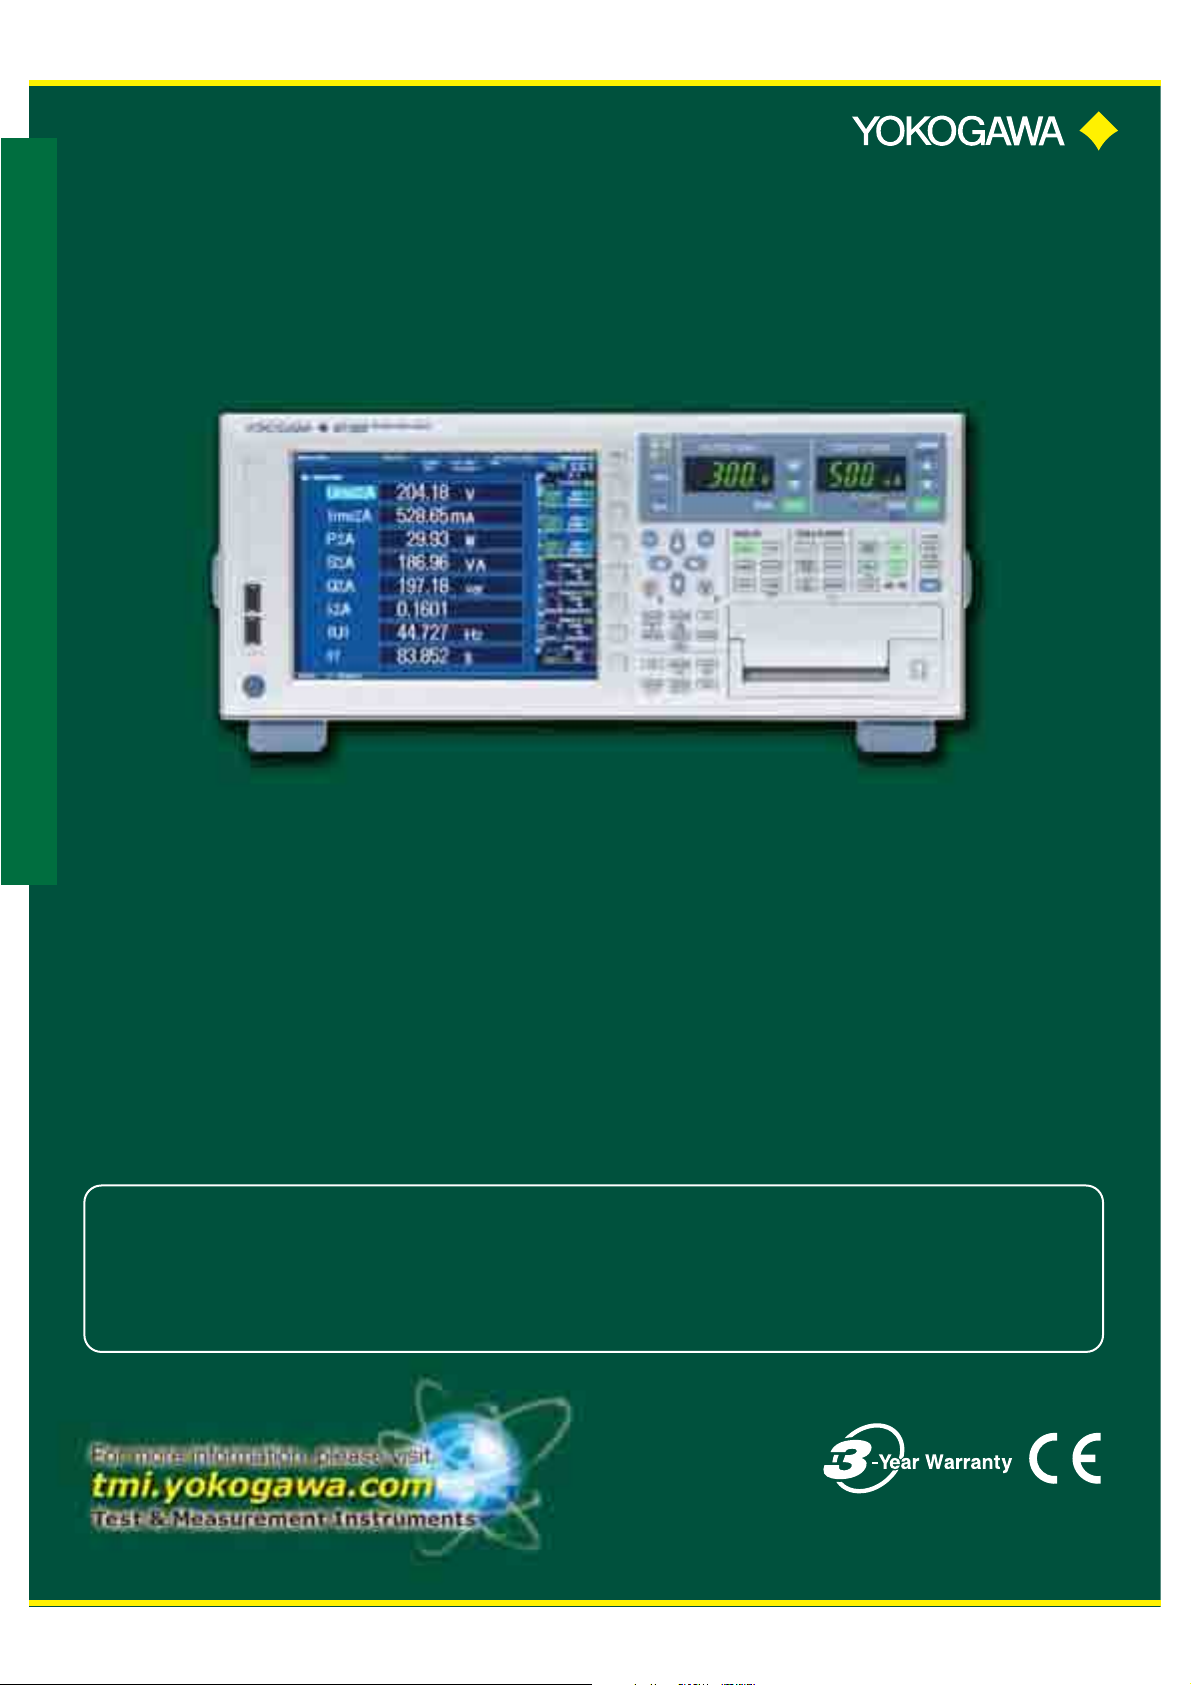
High Performance Power Analyzer WT1800
WT1800
High Performance Power Analyzer
Broad Ranges Power Measurement
with One Unit
Basic Power Accuracy ±0.1%
DC Power Accuracy ±0.05%
Voltage/Current Bandwidth 5 MHz
Sampling Rate Approx. 2 MS/s (16-bit)
Input Elements Max. 6
Current Measurement 100 μ A to 55 A
Innovative Functions Help Improve Measurement Efficiency
Motor, Inverter, Lighting, EV/HEV, Battery, Power Supply,
Aircraft, New Energy, Power Conditioner
*1
(-3 dB, Typical)
*1: Excluding direct current input with the 50 A input element
Bulletin WT1800-00EN
Page 2
V
e
t
0
n
op
* H
ibl
.
(
).
)
.
)
T
m
)
.
)
.
G
d
The
perspect
ive
of
th
e e
ffi
cie
nt
use
of en
erg
y i
s b
oos
tin
g d
ema
nd
for
in
ver
ter
s t
o c
onv
ert
50
H
60
H
AC
er,
occ
urr
ing
du
e t
o e
.
TheT WT
180
0 i
s c
apa
ble
of
si
mul
mul
tan
eou
eou
sly
m
th
e h
e h
arm
arm
oni
oni
c d
ortioion
off t
th
inp
ut
and
ou
tpu
t c
urr
ent
th
ese
de dvic
es.
“h
sin
gle
gle
gle
li
ne,
ne,
ne” t the WT1
800
is
is
ca
ca
pab
pab
le
of
per
for
min
g t
wo-
lin
e s
e s
imu
imu
lta
neo
us
har
mon
mon
ic
meamea
sur
emeeme
ntsnts
. T
WT1
8008 isis
cy.
y
Wit
h Y
oko
gawas pr
evi
ous
po
wer
an
aly
zer
model, you
hav
e to select numerical formats suc
h
ou
can
fl
exi
bly
di
spl
ay
a
s
d
po
.
The
WT
180
0 h
as
bro
ken
th
e m
old an
d i
d
s
ing
us
er-
er-ccre
ate
d i
mag
e
e
fil
es
(BM
P)
as
dis
pla
y s
cre
ens
to
al
d
mor
dly
an d e
asy
-readad
man
ner
Product Features Functions/Displays Applications Software Comparisons Explanations Specifications
Measurement
5-fold wider than
5-fold wider than
previous model
previous model
2/3 of
2/3 of
previous model
previous model
InheritanceInheritance
5-fold wider than
5-fold wider than
previous model
previous model
First in industryFirst in industry
* Comparison with Yokogawa’s previous model WT1600
2
High-precision, wide-range, fast-sampling, simultaneous harmonic measurement
High-precision, wide-range, fast-sampling, simultaneous harmonic measurement
oltage and current frequency bandwidth 5 MHz (-3 dB, typical)
Faster switching frequencies increasingly require measurements in a wider range. The WT1800 provides a voltage and current frequency bandwidth (5
MHz) 5-fold wider than the previous measurement range and is capable of more correctly capturing fast switching signals.
Reduction of low power-factor error to 0.1% of apparent power (2/3 of previous model
A power-factor error is one of the important elements to ensure high-accuracy measurements even at a low power factor. The WT1800 has achieved a
power-factor error (0.1%) that is 2/3 of the previous model, in addition to a high basic power accuracy of ±0.1%
Wide voltage and current range allowing direct input
Direct input of measurement signals makes it possible to measure very small current that can hardly be measured with a current sensor. The WT1800
provides a direct input voltage range from 1.5 V to 1000 V (12 ranges) and a direct input current range from 10 mA to 5 A (9 ranges) or from 1 A to 50 A
6 ranges
.1 Hz low-speed signal power measurement and max. 50 ms high-speed data collectio
The frequency lower limit has been reduced to 0.1 Hz from the previous 0.5 Hz (5-fold lower than the previous model) to meet the requirement for power
measurements at a low speed. Furthermore, high-speed data collection at a data update rate of up to 50 ms has been inherited. In addition to normal
measurement data, up to the 500th order harmonic data can be measured and saved simultaneously. The data update rate can be selected from nine
tions from 50 ms to 20 s.
Particular voltage and current range selectabl
Wide voltage and current input ranges have the advantage of extending the measurement application range. However, the downside is
hat the response time of the auto range tends to slow down. A range configuration function solves this problem. Since only the selected
range (effective measurement range) can be used, the range can be changed up or down more quickly.
armonic measurement at the 50 ms data update rate is poss
*1: Applicable to a general-purpose high-precision three-phase power analyzer as of February 2011 (according to Yokogawa’s survey
e up to the 100th order
For details, see
Pages
5
First in industryFirst in industry First in industryFirst in industry
z or
easuring
Challenging the common wisdom that
armonic measurement is limited to a
also capable of measuring up to the 500th
order harmonic even at high fundamental
frequencies such as a 400 Hz frequen
For details, see Pages 5 and 6 For details, see Pages 5
Dual Harmonic Measurement
z
power to DC pow
xcess power, and battery chargers/dischargers
grid connection controllers to control reverse power flow
ist
e
of
he
Customize Display Screen
as 4-value, 8-value, and 16-value view to display screens, so y
creen to view the desired parameter in the desired size and at the desire
capable of read
viewing data in a flexible format. Thus the
isplay screen can be customized in a
e user-frien
.
low
-to
not
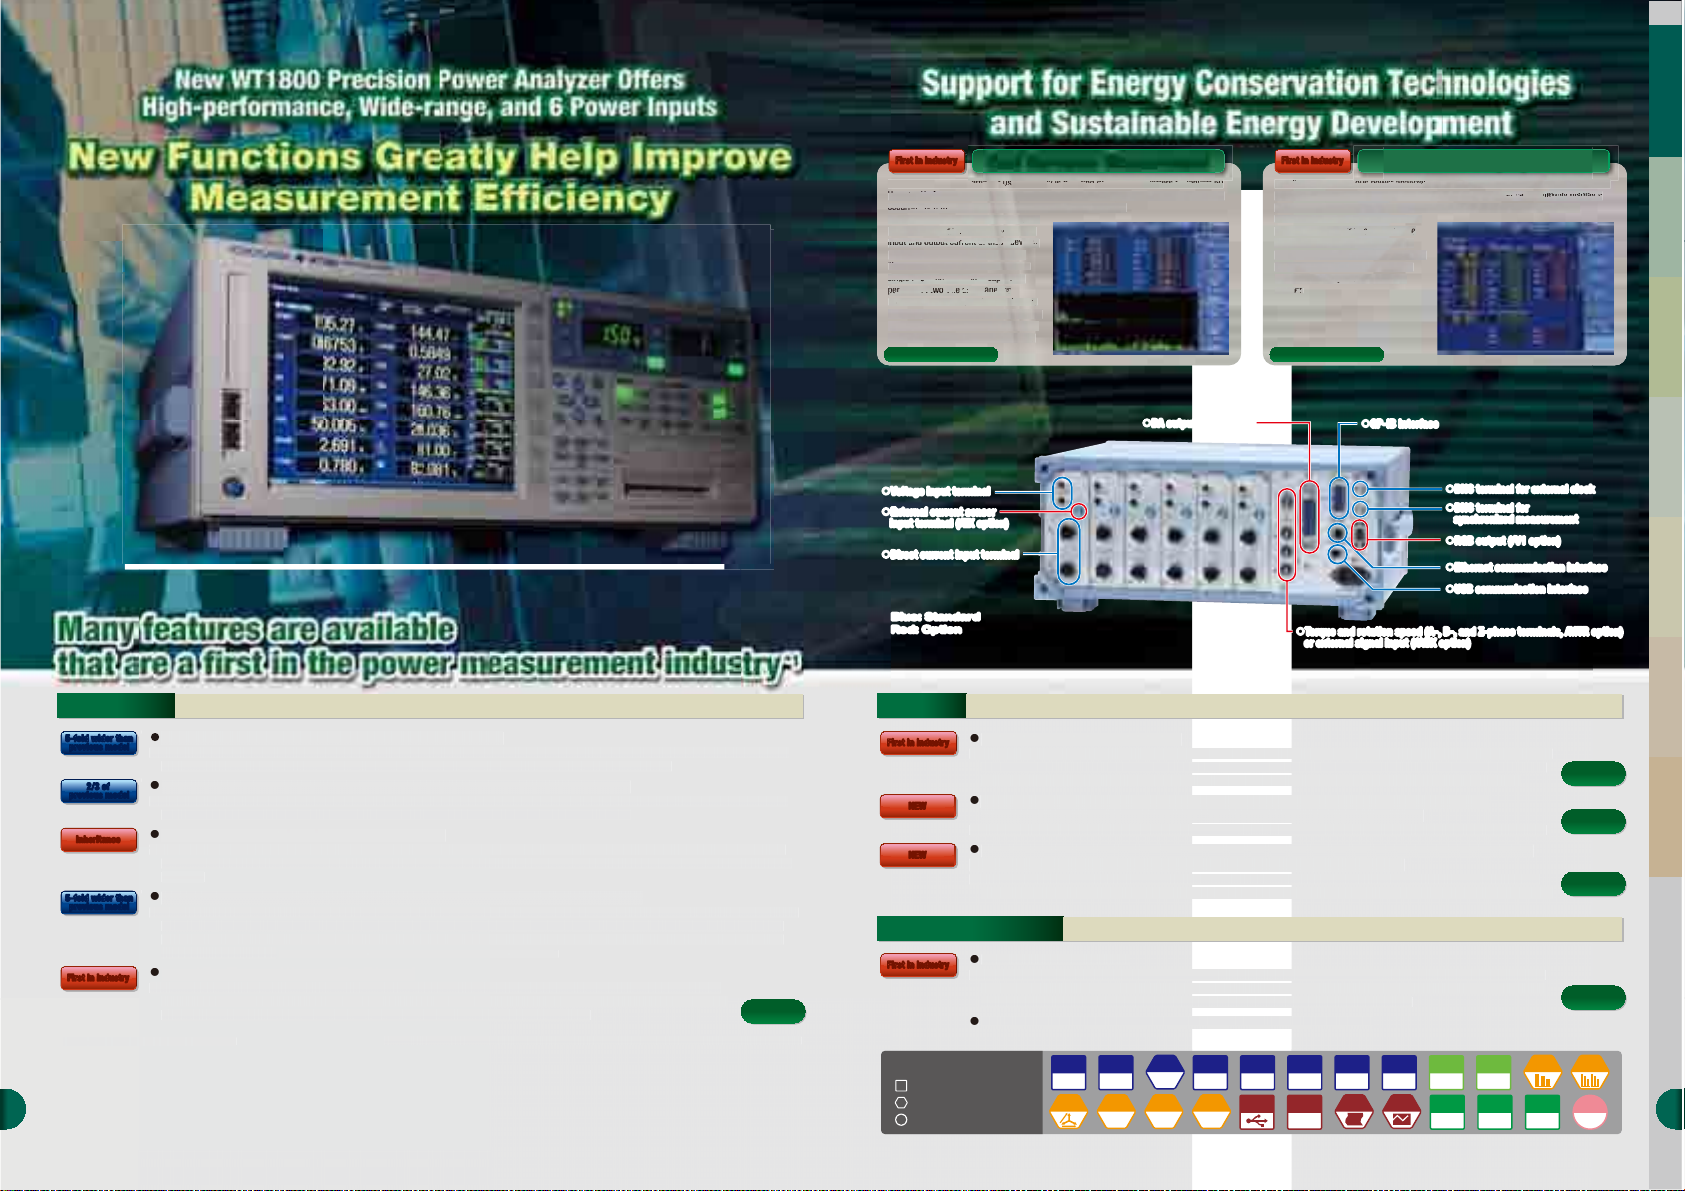
Many features are available that are a first in the power measurement industry
DA output (/DA option)lDA output (/DA option)
Rear panel
l
Voltage input terminallVoltage input terminal
External current sensor
lExternal current sensor
l
input terminal (/EX option)
input terminal (/EX option)
Direct current input terminallDirect current input terminal
l
Blue: Standard
Blue: Standard
Red: Option
Red: Option
Functions
First in industryFirst in industry
NEWNEW
NEWNEW
New functions greatly support power measurements
New functions greatly support power measurements
Dual harmonic measurement (option)
The industry’s first two-line simultaneous harmonic measurement is available, in addition to simultaneous measurement of harmonic and
normal measurement items such as voltage, current, and power values. Previously, harmonic measurements of input and output signals
had to be performed separately. With the WT1800, harmonic measurements of input and output can be performed simultaneously.
wo-channel external signal input is available for power measurement and analog signal data
easurement (option available in combination with the motor evaluation function
Power measurements can be performed together with physical quantity data such as solar irradiance or wind power in wind generation
Electrical angle measurement is also supported. Motor evaluation function allowing A-phase, B-phase,
and Z-phase inputs (option available in combination with external signal input
Pulse or analog signals can be input for rotation speed and torque signal measurements. The motor evaluation function of the WT1800
makes it possible to detect the rotation direction and measure the electrical angle, which is not possible with Yokogawa’s previous model
Saving/Communication
First in industryFirst in industry
List of Available Functions
Standard feature
Option
Software (sold separately)
User-defined event function
For the first time in the high-precision power analyzer industry, an event trigger function is available to meet the requirement to capture
only a particular event. For example, a trigger can be set for measured values that fall out of the power value range from 99 W to 101 W
and only data that meets the trigger condition can be stored, printed, or saved to a USB memory device.
P-IB, Ethernet, and USB communication functions available as standar
l
The photograph shows the model with the /MTR option.
A wide variety of communication and data saving functions
A wide variety of communication and data saving functions
First in industry means functions and capabilities available for the first time in the high-precision three-phase power analyzers (according to Yokogawa’s survey).
Voltage
range
1.5-1000V
Delta
Computation
External
Current
sensor
range
range
1-50A
0.05-10V
10mA-5A
Add-on
Frequency
12ch
/DT
/EX
Motor
Evaluation
Speed
Torque
/FQ
/MTR
Power
Frequency
range
1MHz
Auxiliary
Inputs
Analog
2 inputs
Voltage/Current
/US
Torque and rotation speed (A-, B-, and Z-phase terminals, /MTR option)
lTorque and rotation speed (A-, B-, and Z-phase terminals, /MTR option)
l
or external signal input (/AUX option)
or external signal input (/AUX option)
Frequency
Inputs
bandwidth
1,2,3,
5MHz
(typical)
4,5,6
USB
Internal
memory
Memory
32MB
Basic
Power
Accuracy
±0.1%
Printer
l
GP-IB interfacelGP-IB interface
Crest
factor
300(6)
RGB
/B5 /V1
lBNC terminal for external clocklBNC terminal for external clock
BNC terminal for
lBNC terminal for
l
synchronized measurement
synchronized measurement
l
RGB output (/V1 option)lRGB output (/V1 option)
l
Ethernet communication interfacelEthernet communication interface
USB communication interfacelUSB communication interface
l
Update
Display
8.4-XGA
Comm
USB
rate
50ms-20s
Comm
GP-IB
Harmonic
Comm
Ethernet
sition
For details, see
Pages
For details, see
For details, see
For details, see
Pages
Harmonics
/G5
Software
WT Viewer
Pages
Pages
Dual
760122
*1
5 and 6
9
7
4 and 8
/G6
3
Page 3
M
s
.
With the WT
f
F
1
b
l
(
.
S
i
T
l
l
.
T
b
f
T
y
s
l
l.
O
I
m
motor evaluatio
D
F
perf
Y
f
udes a bu
e
o
.
g
s
f
F
s
Cap
Functions/DisplaysFunctions/Displays
Eng
lish hel
d
c
g
e
Functions/Displays
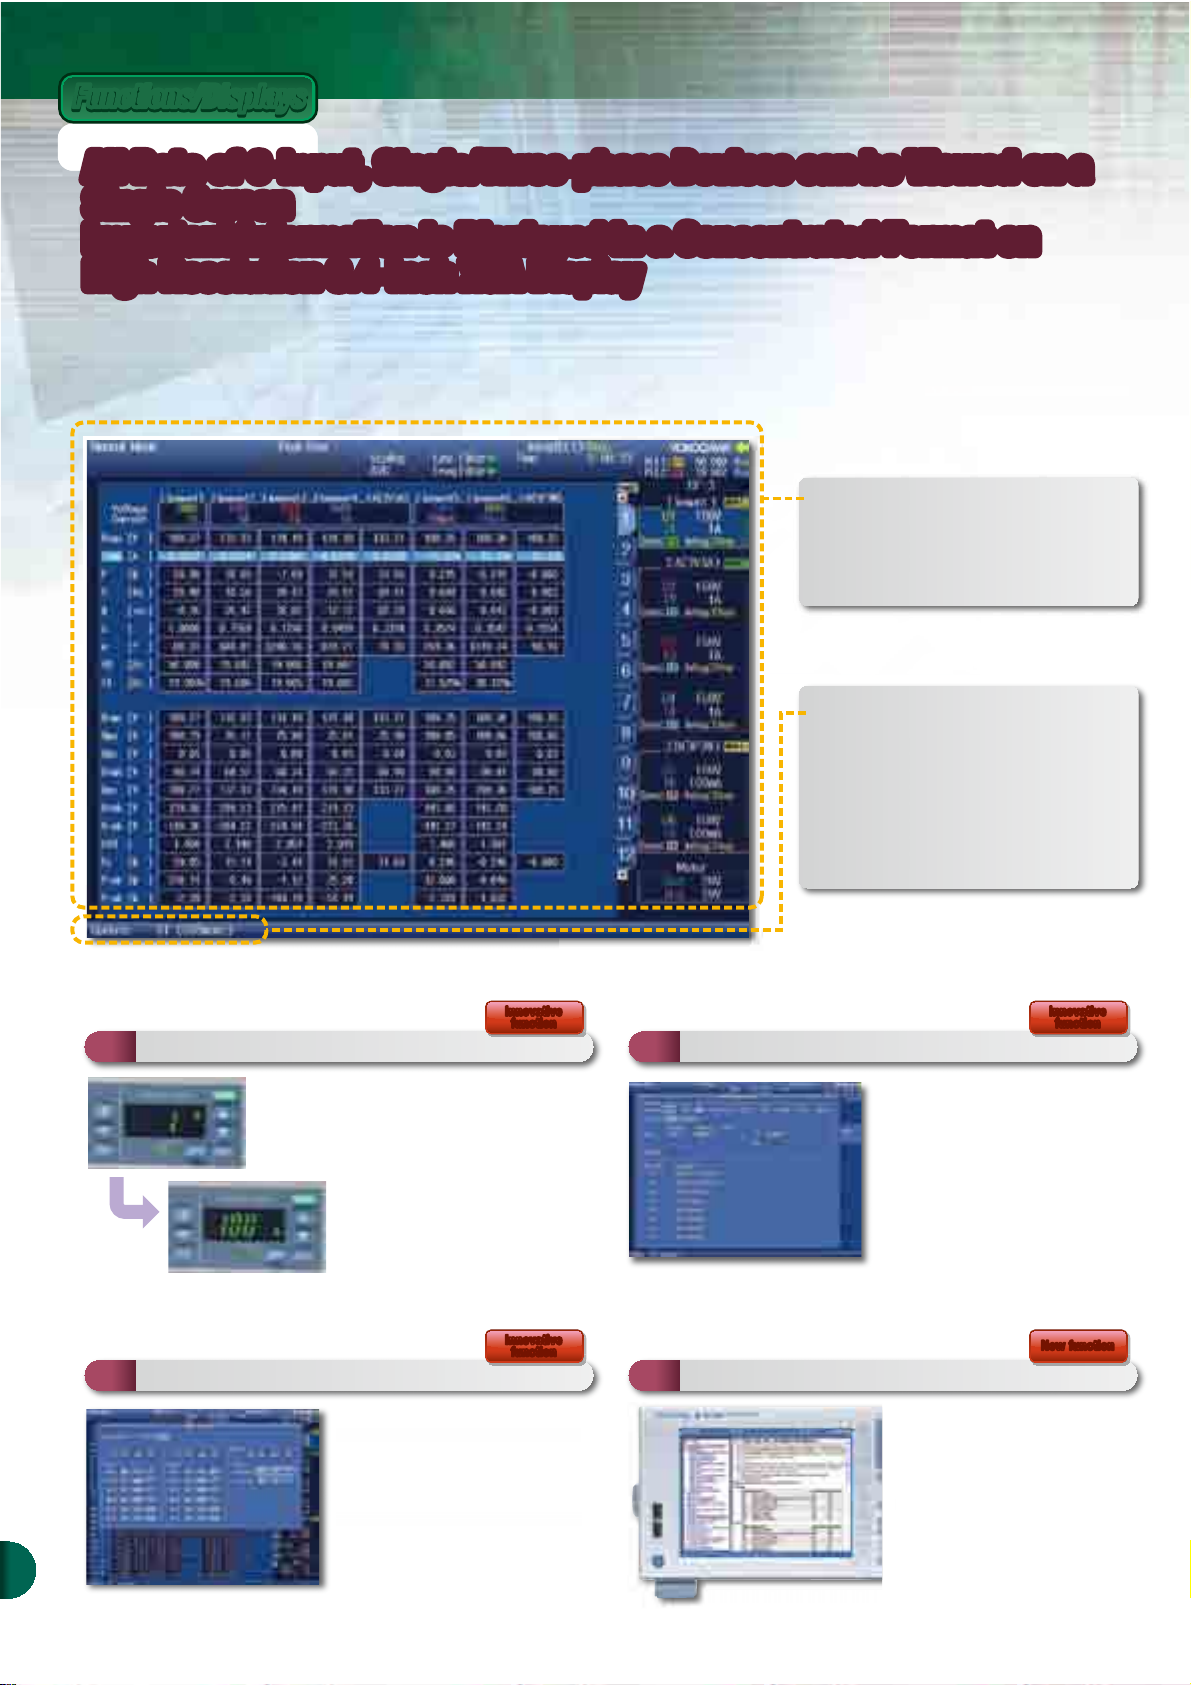
All Data of 6-input, Single/Three-phase Devices can be Viewed on a
All Data of 6-input, Single/Three-phase Devices can be Viewed on a
Single Screen
Single Screen
Important Information is Displayed in a Concentrated Format on
Important Information is Displayed in a Concentrated Format on
High Resolution 8.4-inch XGA Display
High Resolution 8.4-inch XGA Display
A high resolution display with a resolution about 2.6-fold higher than Yokogawa’s previous
*
model
is employed. More setting information and measurement data can be displayed.
* Comparison with Yokogawa’s previous model WT1600
A lot of information can be
displayed on a single screen
easurement data can be displayed on a single screen,
along with the respective detailed setting information of 6
inputs, such as a voltage range, current range,
ynchronization source, wiring system, and filter. You do
not need to switch display screens frequently to confirm
the settings
Data update rate changeable
Computation range display
irect display of primary current value
he setting ranges of voltage and current are
usually displayed with voltage and current signa
evels that are input to the power analyzer
he WT1800 provides not only this direct display
ut also added a new computation range display
unction to the external current sensor range.
his function allows you to display the primar
current range for the voltage output type current
ensor. It allows you to intuitively set a range that
is suited to the primary measurement signal
eve
Display example of
omputation ran
Display example of
irect input range
Innovative
Innovative
function
function
1800, the data update rate can be selected
rom 9 options from the fastest data update rate of 50 ms
to an update rate of 20 s for low-speed measurements.
or example, if you want to save the average data at a
-minute interval and inappropriately set the update rate
of 50 ms, measurement results may be not correct
ecause data can be saved only at a 1-minute interva
once every 20 times)
uch a risk can be avoided by setting the update rate that
s suited to the interval at which you want to save data.
User-defined event function
ture only a particular event
The data saving function of the WT Series is
capable of continuously saving data for a lon
period of time. However, to check an irregular
event, data must be retrieved using spreadsheet
oftware.
The event trigger function allows you to set the
high and low limits and only trigger data that
alls into or out of that range to be saved.
Innovative
Innovative
function
function
4
Individual null function
unction to reset only a particular input signal to zero
A null function allows you to reset the offset
value to zero in the connected state. Previously,
all inputs could only be collectively set to ON or
FF. With the WT1800, the null value for each
input can be set to ON, HOLD, or OFF.
n a motor evaluation test, the offset value for
only a particular input can be reset to zero. This
akes it possible to perform a more accurate
n test.
Innovative
Innovative
function
function
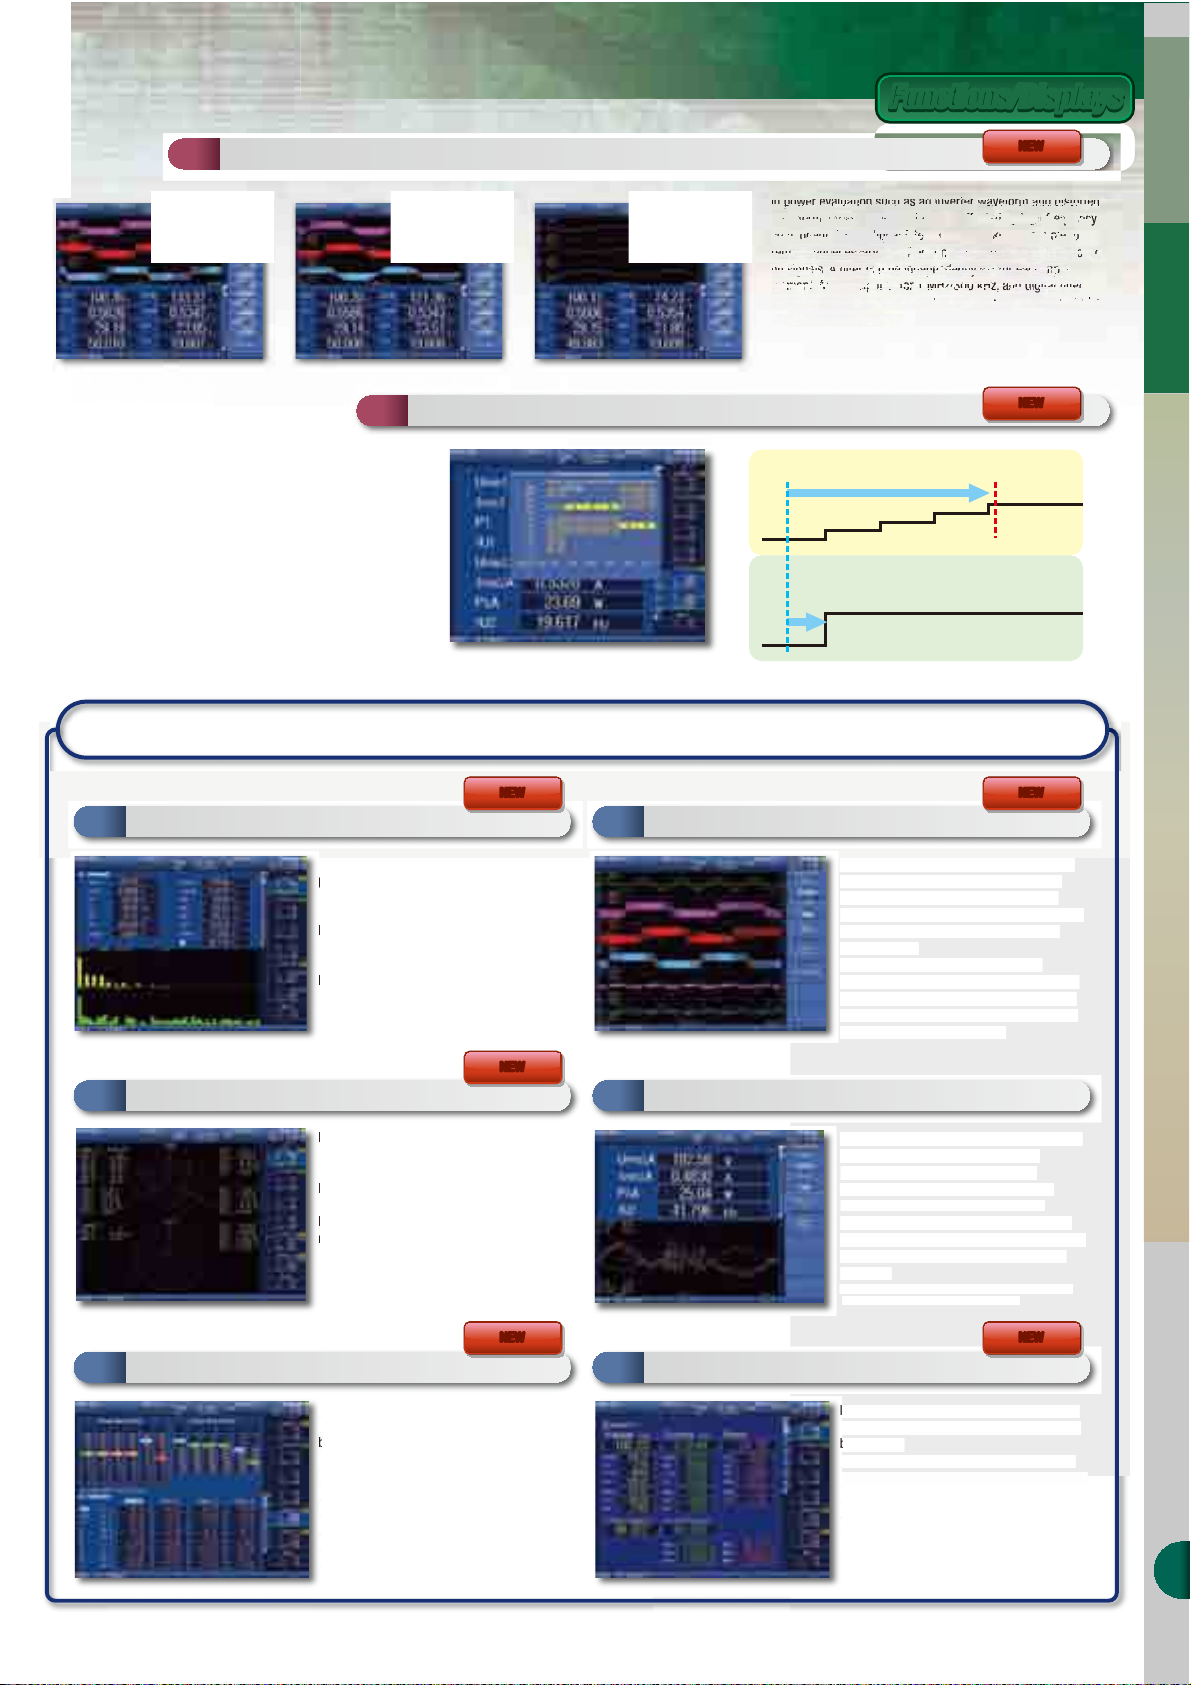
Help function
Display the manual on the screen
p menu supports meas
New functionNew function
isplay the manual on the screen
requently used functions (keys) can be
ormed without the instruction manual.
ou may, however, want to use a new
unction during evaluation. The WT1800
incl
functions, so if a new operation is required,
you can read the explanation of the function
n the screen
urement
ilt-in instruction manual on th
Page 4
In
pow
pow
pow
er
er
er
evaeva
lualua
luauatiotio
n sn s
uchuch
uch
as
an
an
in in
ver
ver
ter
wawavefvorm
orm
anand dd d
d ddist
ist
ist
ort
ort
ed ed
e
wav
efo
rm,
rm,
rm,
me
asu
rem
ent
ent
va
lue
lue
lue
s as a
re
re
r
aff
aff
ect
ect
ect
ect
e
ed
ed
ed
by
by
by
by
hig
hig
hig
hig
h f
f
h f
h f
req
req
req
req
req
req
eqqu
uenuen
uen
cy cy
cy
cy
y
y
cy
com
pon
pon
ent
ent
. A
ne nw d
igi
igi
tal
fi
fi
lte
lte
r frunc
tio
n m
akekes i
t p
oss
ss
ibl
ibl
e t
e to o
rem
oveove
un
un
nec
ess
ary
aryary
y
hi hi
gh
gh
frefre
quequeqnc
ncy
co
mpoop
nen
ts
sup
sup
eri
eri
mpo
mpo
sedsed
on
on
on
on
sig
sig
sig
nal
nalnanal
s.
s.
s.
A f
A f
ilt
ilt
ilt
ilt
er
er
er cacan
can
can
bebe be
in
in
dep
dep
dep
p
p
end
end
ent
ent
ent
ly
y
set
set
fo
r e
e
ach
ach
in in
put
put
pp
ele
ele
ele
men
men
men
men
t.
An
An
ana
a
log
fi
fi
lte
lte
r f
r f
or
or
or
1 M
1 M
1 M
1 M
Hz/
Hz/
Hz/
Hz/
300
300
300
300
kH
kH kH
z,
z,
z,
and
and
and
andan di
di
di
git
git
git
git
g
al
al
filfifil
fil
fil
terteterter
that can be se
00
Hz
to
10
0 k
inc
rem
ent
s o
f 1
00
Hz
a
d.
A
p
range)
If
e
A
A
p
ibl
p
g
g
vi
l
ly.v
I
ddition,
I
f
f
and displ
l
a
h
h
A high
ibl
sp
s
d
of
s
W
a
t
d
T
T
T
Fund
F
s
s
Y
Y
limited
l
l
v
v
I
I
n
ibl
Thi
n
y
y
v
v
d
.
W
s
.
T
ibl
easureme
ues and measureme
o
d
*
T
a
b
s
G
A
t
a
i
I
t
b
T
t
o
y
e
t
C
s
u
a
easurement
Supp
C
Functions/DisplaysFunctions/Displays
eeds to be loaded from a
*
US
Functions/Displays
Product Features Functions/Displays Applications Software Comparisons Explanations Specifications
Line filter
apture an original signal masked by high frequency component
Range configration function
new range configuration function is available. It allows you to select a
articular voltage and current input range (effective measurement
. Eliminating unnecessary ranges has made it possible to achieve
optimal range setting that is faster than Yokogawa’s previous model*.
This allows more quicker tracking of signal changes.
the peak goes over the limit, you can switch to a preset range. This is
ffective in reducing the production time for a repeat test, such as
setting to OFF, 100 V, OFF and so on, which is performed frequently on
the production line.
re available as standar
High-speed range setting suited to input signals
Input signal changes
* Comparison with Yokogawa’s previous model WT1600
t from 1
Action of Yokogawa’ s previous model*
Change available ranges stepwise
Action of WT1800 range configration
Range change ends
Hz in
Change to selected
next range
NEWNEW
NEWNEW
Range
change ends
A Wide Variety of Display Formats Ranging from Numerical to Custom Display
Numerical and harmonic bar graphs
D
l harmonic m
harmonic measurement option (/G5) makes it
oss
e to display both numerical data and bar
raphs to help understand measurement data
sua
n a
a dual harmonic measurement
unction (/G6) makes it possible to measure
ay two-line harmonic bar graphs (dua
armonic) simultaneously.
he /G5 or /G6 option is required
Dual vector
Simultaneous two vector display
amental harmonic voltage and current
ignal phase vectors can be displayed. With
okogawa’s previous model, vector display is
to a single line. With the WT1800, Dua
ectors can be displayed.
n addition, combination display of vectors and
umerical values is also poss
ou to view the numerical parameters and
oltage and current phase status visually.
he /G5 or /G6 option is require
NEWNEW
e.
s allows
Waveform
ort for 6 split screen displays
Trend
Capture efficiency changes visually
NEWNEWNEWNEW
resolution display makes is poss
lit the waveform display into up to 6 split
creens. This makes it possible to split the
isplay of signals between the input and output
a three-phase inverter and display them
imultaneously.
aveform display allows you to display
waveforms for the voltage alone or the current
lone, or arbitrarily set the display position, so
you can also display only the signals you want
o compare one above the other.
hen evaluating inverter efficiency, sometimes
mall efficiency changes can hardly be
recognized with just numerical values
rend display makes it poss
m
efficiency as trend data in time series to help
capture even small changes visually. Trend data
nt val
ver several minutes or several days can be
isplayed.
Trend display can be saved with the screen hardcopy function.
To save numerical data, a store function is used.
e to display
nt
e to
Setting information
ombination display of Information and Numerical screens
Custom
NEWNEWNEWNEW
Customize display screen
he screen can be split into two, with one
bove the other, and two types of screens can
e displayed simultaneously. Screen can be
elected from Numerical, Waveform, Trend, Bar
raph, and Vector displays.
nother new function allows you to press the
NFO button on the Numerical screen to display
I
he setting information in the upper row and
utomatically scale down the numerical
nformation displayed in the lower row.
mage data can be loaded onto the screen an
he position and size of the numerical data can
e specified
e display screen can be customized so that
he corporate logo of your company is displayed
n the screen, or only the measurement items
ou want to view, such as input and output
iciency or frequency, are displayed one above
he other.
The data for the created screen n
B storage device.
5
Page 5
ApplicationsApplications
*Also refer to the features of other applications
Inveertrt
er
* With th
m
.
In
InInInpupu
t
t
C
s
v
M indi
D
Motor
/
or
Load
(p
)
.
Applications
Converter section
KeywordKeyword
Keyword
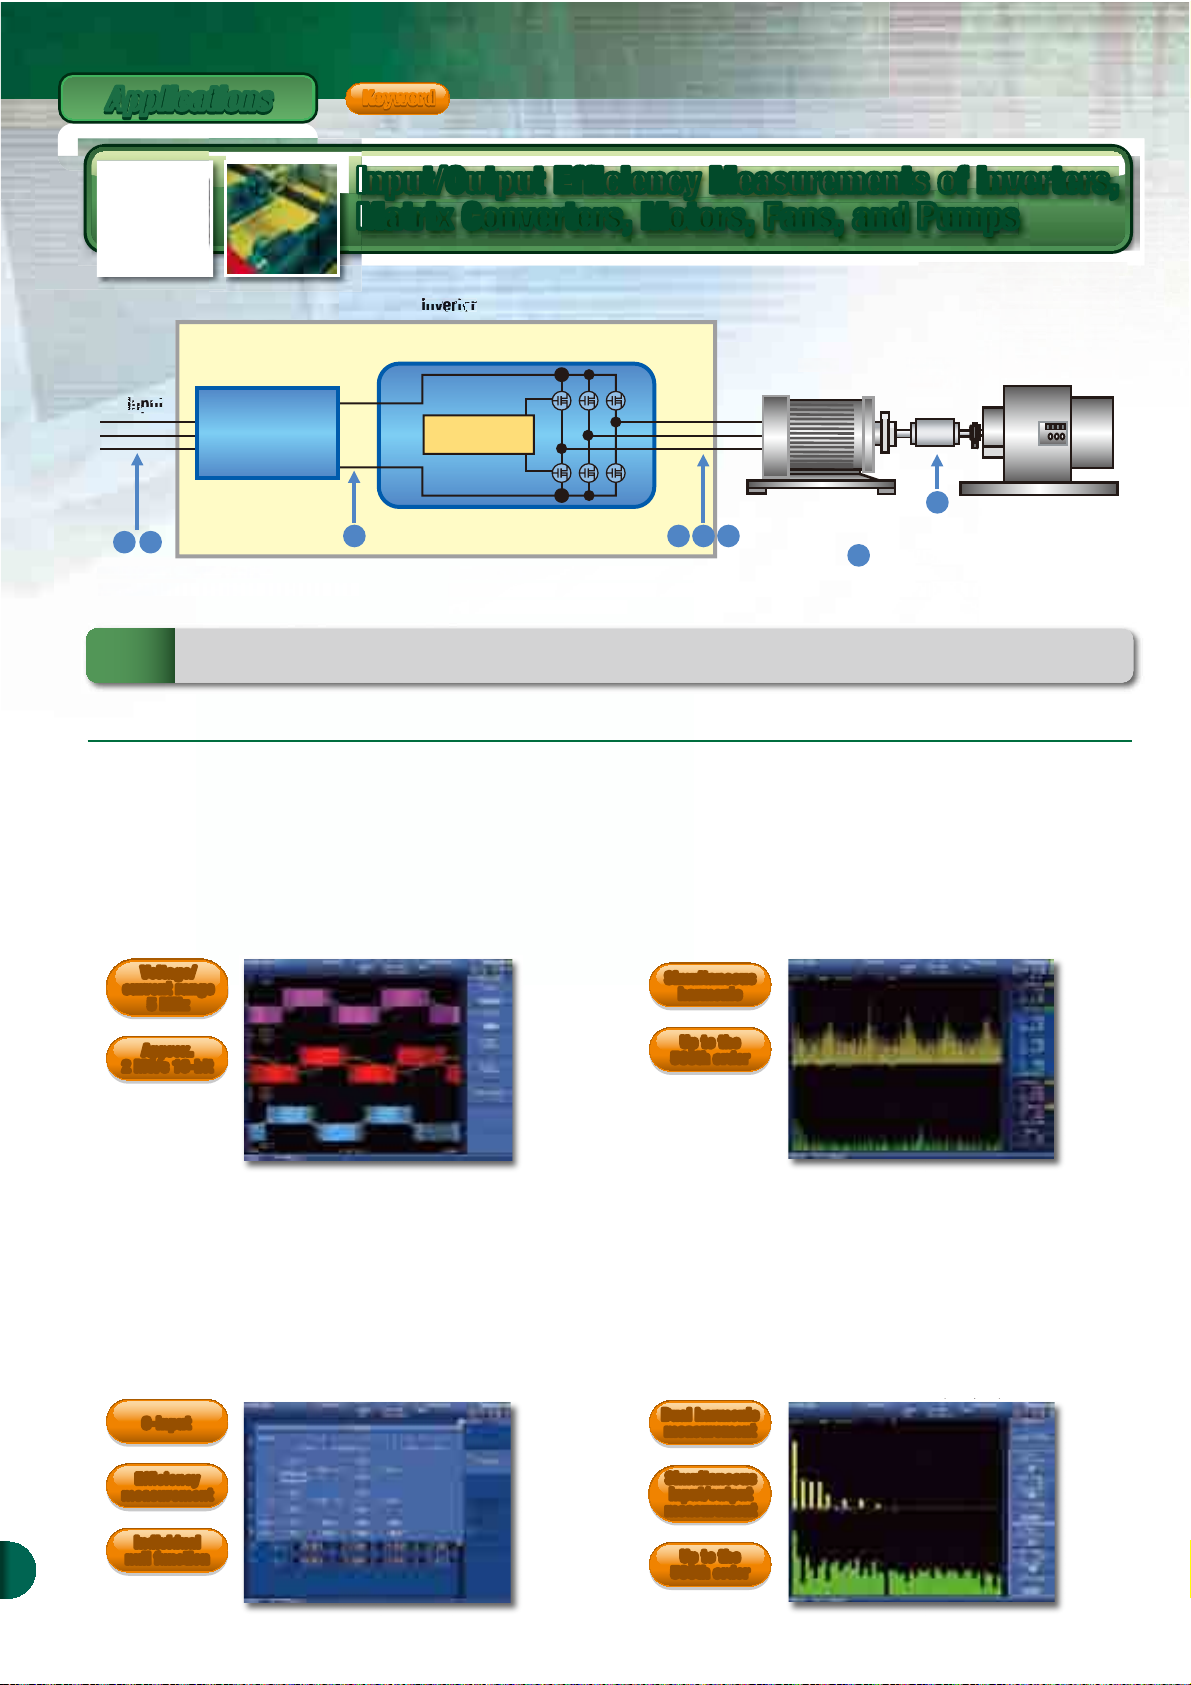
Input/Output Efficiency Measurements of Inverters,
Input/Output Efficiency Measurements of Inverters,
Matrix Converters, Motors, Fans, and Pumps
Matrix Converters, Motors, Fans, and Pumps
Torque
Inverter section
rotation
sens
rive circuit
.
onvert AC to DC signals
1 2
ree-phase input, power is
easured with the three-phase three-wire system
Overview
The WT1800 is capable of performing up to 6 power input measurements to make it possible to perform an inverter efficiency test between the input and output in inverter evaluation.
In addition, a motor evaluation function (option) makes it possible to simultaneously monitor voltage, current, and power changes, as well as rotation speed and torque changes
Modulate DC signal and convert to any AC signal
3 4 5 6
* In this example, measurement is performed with
the three-phase three-wire system (at 3V3A) to verify the (inter-phase)
oltage and current of each phase.
M
indicates measurement points and input to the
power analyzer.
cates connecting the motor output to the
motor signal input (/MTR) of the power analyzer
Advantages of WT1800
n 5 MHz range and 2 MS/s high-speed sampling n Up to the 500th order harmonic measurement
The vertical resolution in power measurements is one of the important elements for
high-precision measurements.
The WT1800 is capable of 16-bit high resolution and approximately 2 MHz sampling to make
it possible to measure faster signals with higher precision.
Voltage/
Voltage/
current range
current range
5 MHz
5 MHz
Approx.
Approx.
2 MS/s 16-bit
2 MS/s 16-bit
(/G5 and /G6 options)
Yokogawa’s previous model* provides two different measurement modes, called Normal and
Harmonic, and each of the measurements is performed separately. The WT1800 makes it
possible to simultaneously measure voltage, current fundamental wave, harmonic
components, and harmonic distortion factor (THD) in the Harmonic measurement mode,
along with the conventional voltage and current RMS values in the Normal measurement
mode. You do not need to switch modes and can measure all data at high speed. In addition,
up to the 500th order harmonic can be measured for fundamental frequencies.
Simultaneous
Simultaneous
harmonic
harmonic
Up to the
Up to the
500th order
500th order
*Comparison with Yokogawa’s previous model WT1600
n Boost converter efficiency and inverter efficiency
evaluation
To evaluate the inputs and outputs of inverters including boost converters, at least 5 power
measurement inputs are required. The WT1800 provides 6 inputs to make it possible to
evaluate all aspects of inverters. In addition, a new individual null function makes it possible
to set the DC offset only on a particular input channel as the null value. This makes it
possible to perform more accurate measurements.
6-input6-input
Efficiency
Efficiency
measurement
measurement
Individual
Individual
null function
6
null function
n Dual harmonic measurement (/G6 option)
In previous models, harmonic measurement has been limited to a single line. The WT1800 is
capable of performing two-line simultaneous harmonic measurements with one unit for the
first time in the industry.
The ability to simultaneously measure harmonics for the input and output signals not only
reduces the switching time but also makes it possible to perform simultaneous data analysis
for the input and output, which has not been possible with the previous models.
The following measurements can be performed for up to the
500th order
Single harmonic measurement (/G5 option)
Dual harmonic measurement (/G6 option)
Dual harmonic
Dual harmonic
measurement
measurement
Simultaneous
Simultaneous
input/output
input/output
measurement
measurement
Up to the
Up to the
500th order
500th order
Page 6
T
ApplicationsApplications
Also refer to the features of other applications
s
Applications
Product Features Functions/Displays Applications Software Comparisons Explanations Specifications
n Delta computation function (/DT option) n Electrical angle/rotation direction measurements
Differential
Differential
voltage/current
voltage/current
Star-delta
Star-delta
conversion
conversion
Delta-star
Delta-star
conversion
conversion
U1
T-phase S-phase
Figure 1 Line voltage/phase current
Typical Product Configuration
Direct input measurements at less than 50 A: WT1806-06-D-HE/B5/G6/DT/V1/MTR
6 power inputs, current measurement range 10 mA to 55 A, built-in printer, dual harmonic, delta computation, RGB output, motor evaluation function
Measurements at more than 50 A using a current sensor: WT1806-60-D-HE/B5/G6/DT/V1/MTR
6 power inputs, current measurement range 100 μA to 5.5 A (measure AC/DC current sensor output), built-in printer, dual harmonic, delta computation, RGB output, motor evaluation function
It is possible to obtain the differential voltage, line voltage, phase
voltage, etc. by obtaining the sums and differences of
instantaneous measurement values of voltage and current in each
element.
Differential voltage/current: Differential voltage and current
between two elements are computed in the three-phase
three-wire system.
lLine voltage/phase current: Line voltage and phase current that
are not measured are computed in the three-phase three-wire
system (Figure 1).
lStar-delta conversion: Line voltage is computed from the phase
voltage using the three-phase four-wire system data.
Delta-star conversion: Phase voltage is computed from the line
voltage in the three-phase three-wire system (3V3A system)
(Figure 2).
R-phase
Phase
current
Computed
value
Line
voltage
I1
I2
U2
*For detailed specifications, see the page on the specifications. You need to provide a cable for voltage measurements when wiring.
T-phase S-phase
R-phase
Phase
U1
voltage
Phase
voltage
U2
Figure 2 Delta-star conversion
Phase
voltage
Computed
value
U3
of motors
Electrical angle*Electrical angle*
A-, B-, and
A-, B-, and
Analog/pulse
Analog/pulse
DL850 ScopeCorder
*1: Detailed switching waveforms of inverters cannot
be viewed with the WT1800. If you need to verify
the waveforms, you can use the DL850
ScopeCorder, which is capable of 100 MS/s, 12-bit
isolated input. For details, please see Yokogawa’s
website or catalog (Bulletin DL850-00EN).
(/G5 and /G6 options) (/MTR option)
A motor evaluation function makes it possible to measure the
rotation speed, torque, and output (mechanical power) of motors
from rotation sensor and torque meter signals. The input signal
from the rotation sensor and torque meter can be selected from
analog signal or pulse signal.
Z-phases
Z-phases
inputs
inputs
Furthermore, A-phase, B-phase, and Z-phase input terminals
have been newly added. The A-phase and B-phase make it
possible to detect the rotation direction of motors. In addition,
electrical angle* can be measured using Z-phase signals.
* Electrical angle measurements require the /G5 or /G6 option.
* Please purchase a torque sensor and rotation sensor separately.
Pulse/analog inputs are available for the motor evaluation function of the WT1800.
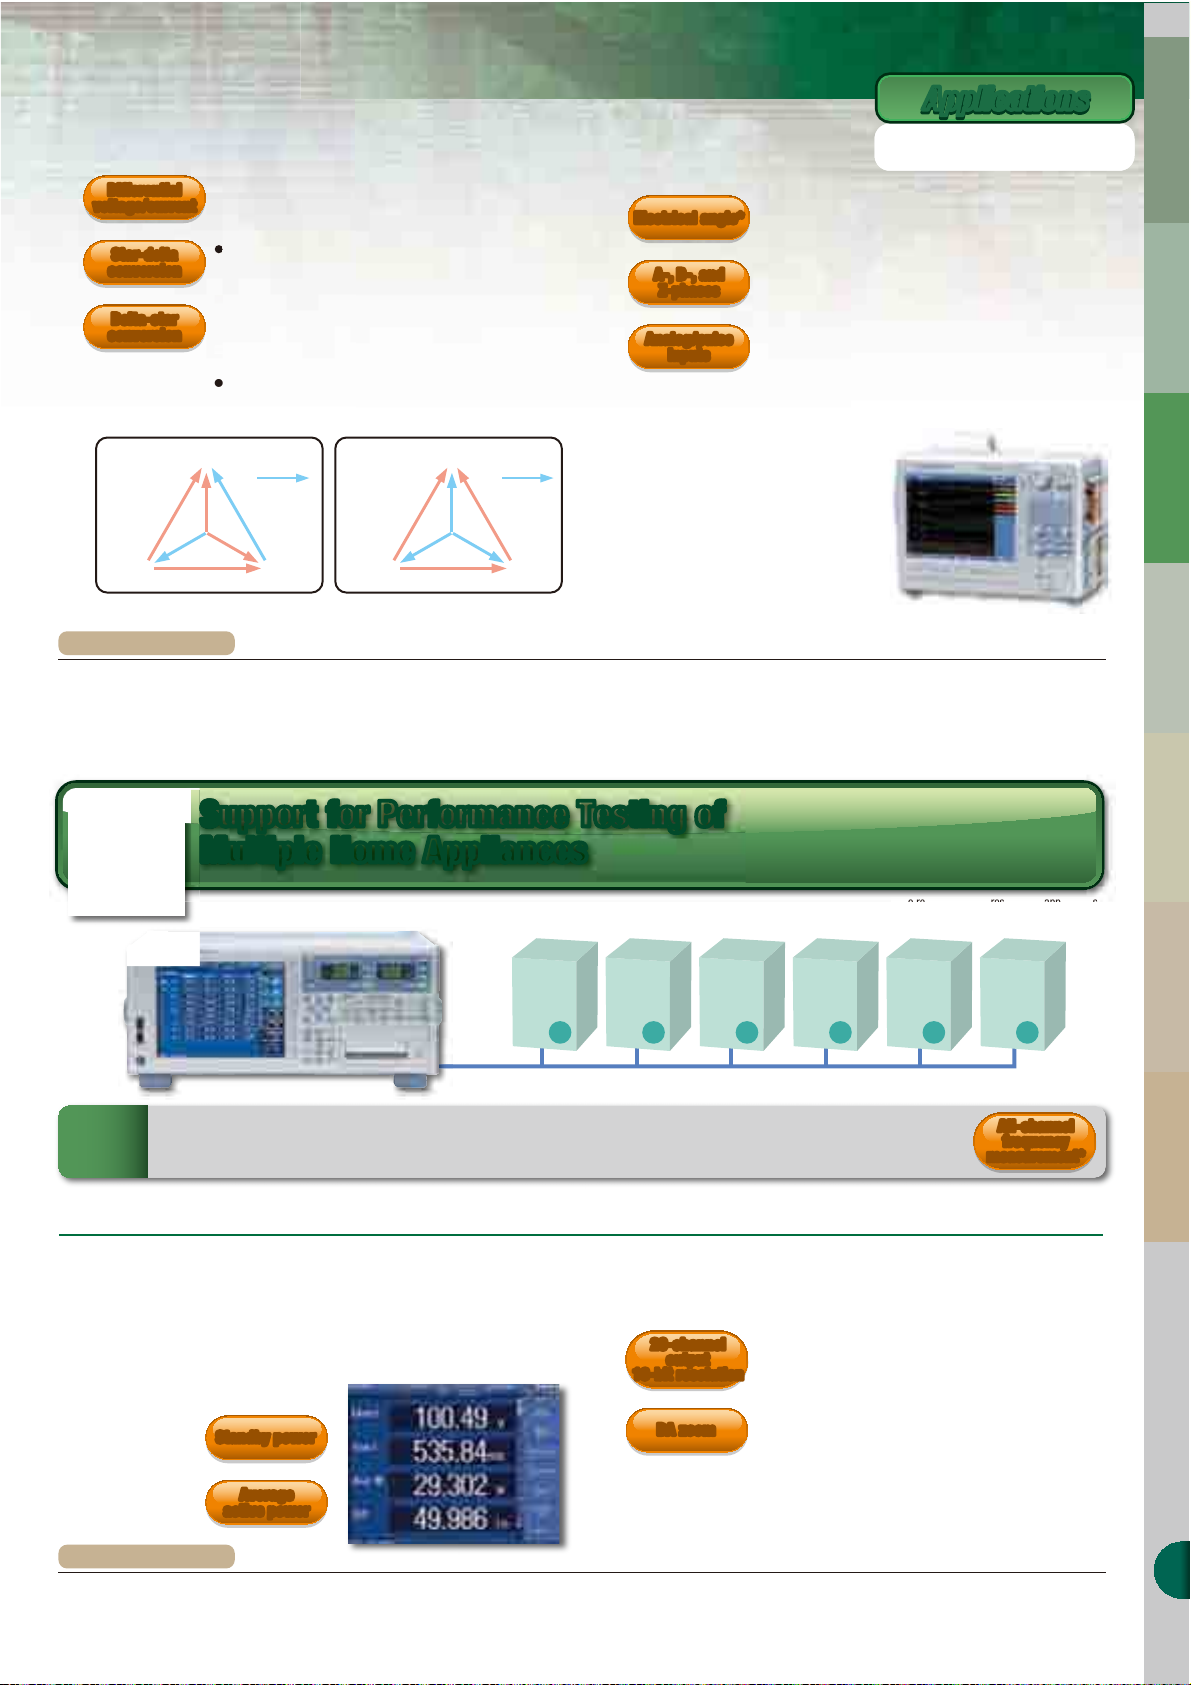
Support for Performance Testing of
Support for Performance Testing of
Multiple Home Appliances
Multiple Home Appliances
1 to 6 home appliance
o perform high precision power evaluation on the production line, a single WT1800 unit does the work for up to six single-phase power analyzers to
Overview
measure voltage, current, power, frequency, power factor, and harmonic distortion factor*. Also an independent integration function is available for each input
element to start and stop integration. Since data can be collected remotely by communicating with just a single WT1800 unit, it is easy to create programs.
Advantages of WT1800
n Standby and operation power measurements of
up to six devices with a single unit
Power measurements of up to six devices can be performed with a single unit. In standby
power measurement, 1 mA or less measurement is supported since measurements can be
performed from an effective input of 1% of the small current range in the rated 10 mA range.
Also, an average active power function allows you to calculate the mean power* by
intermittent oscillation control signals.
*User-defined computation is used.
Standby powerStandby power
1 2 3 4 5 6
All-channel
All-channel
frequency
frequency
measurement*
measurement*
*The /G5 or /G6 option is required for the harmonic distortion factor measurement. Also, the /FQ option is required to measure four or more frequencies.
n Combined use with ScopeCorder for analog output
(/DA option)
A D/A output connector on the rear panel allows you to convert a
20-channel
20-channel
output
output
16-bit resolution
16-bit resolution
DA zoomDA zoom
measurement value to ±5 V (rated value), 16-bit high resolution
DC voltage value and output it. Up to 20 items can be output
simultaneously.
Also, the ability to set the upper and lower limits for an arbitrary
range of input signals and scale up and down the D/A output in
the range from -5 V to +5 V allows you to enlarge a changing
part of the input signals to monitor it with a ScopeCorder, etc.
* 0 to 5 V is fixed for some items, such as frequency measurement.
.*
Average
Average
active power
active power
Typical Product Configuration
WT1806-06-M-HE/EX6/B5/G6/FQ/V1/DA: 6 power inputs, current measurement range 10 mA to 55 A, or clamp measurement (with a clamp input terminal), built-in printer, all-channel frequency
measurement (×12), RGB output, dual harmonic, DA output
*For detailed specifications, see the page on the specifications. You need to provide a cable for voltage measurements when wiring.
*An external input terminal (EX) allows you to perform both direct input measurement and clamp measurement. *Direct input and current sensor input cannot be connected Simultaneously.
7
Page 7

ApplicationsApplications
Also refer to the features of other applications
So
SoSo
Solalala
r
r
ce
ce
ll m m
od
dduluuue
e
(o
(o
(o
(o
(o
ut
ut
dodooror
s)
s)
s)
s)
s)
s)
Megaga
gaga
s soloar
s
ys
ys
ys
tetete
te
m
m (o(o
(o
(o
(o(o(o
utdododooror
or
s)
s)
s
s)
s)
Py
Pyr
PyrPyr
ano
)
Van
)
i
t
(A) indi
a
.
r
B
converte
C
converte
C
l
P
m
P
Load
batter
Storage
HV, etc
Plug-in
E
Applications
KeywordKeyword
Keyword
Power Generation and Conversion Efficiency
Power Generation and Conversion Efficiency
Measurements in New Energy Markets, including
Measurements in New Energy Markets, including
Photovoltaic and Wind Power Generation
Photovoltaic and Wind Power Generation
Power conditione
.
1
oost
5
meter (photovoltaic power generation
A
e anemometer (wind power generation
urrent
charge
contro
ower storage syste
ower Flow of Photovoltaic Power Generation
nergy generated by photovoltaic cell modules and wind turbines is converted from DC to AC by a power conditioner. Furthermore, the voltage is converted by a charge control unit
Overview
for the storage battery. Minimizing losses in these conversions improves efficiency in the overall energy system. The WT1800 is capable of providing up to 6 channels of power inputs
per unit to make it possible to measure the voltage, current, power, and frequency (for AC) before and after each converter, as well as converter efficiency and charging efficiency.
Advantages of WT1800
n Max. 1000 V/50 A × 6-line direct measurement
Wide voltage/
Wide voltage/
current range
current range
Efficiency
Efficiency
measurement
measurement
Synchronized
Synchronized
operation
operation
Direct input terminals in a voltage range from 1.5 V to 1000 V and
current range from 10 mA to 5 A or 1 A to 50 A make it possible
to perform high-precision measurements without using a current
sensor.
Furthermore, power conditioner evaluation requires
multiple-channel power measurements, such as inputs/outputs
from a boost converter, inverter, and storage battery. The WT1800
is capable of providing up to 6 channels of power inputs to make
it possible to simultaneously perform power measurements at
multiple points with one unit. In addition, two units can be
operated in synchronization for multi-channel power evaluation.
2 3
AC/D
Power
sold/bought
4
Charge/discharge
6
n Maximum Power Peak Tracking (MPPT) measurement
In photovoltaic power generation, an MPPT control is performed
MPPTMPPT
Maximum power
Maximum power
peak value
peak value
to effectively utilize voltage generated by photovoltaic cells in an
attempt to maximize the harvested power.
The WT1800 is capable of measuring not only the voltage,
current, and power but also the voltage, current, and power peak
values (plus (+) and minus (-) sides, respectively). Also, the
maximum power peak value (plus (+) and minus (-) sides) can be
measured.
Reverse power flow
Grid interconnection or smart grid
(next-generation power network)
ndicates measurement points and input
o the power analyzer.
connecting the sensor signals to the
uxiliary input (/AUX) of the power analyzer
Max. power value
cates
n Power integration
measurements
Power
Power
sold/bought
sold/bought
Charge/
Charge/
discharge
discharge
Average active
Average active
power
power
n Trigger when an error occurs
Data saving
Data saving
when an
when an
error occurs
error occurs
8
(power sold and bought/charge and discharge)
A power integration function makes it possible to measure the
amount of power sold/bought in grid interconnection and of
battery charge/discharge. The WT1800 provides a current
integration (q), apparent power integration (WS), reactive power
integration (WQ), as well as effective power integration capable of
integration in the power sold/bought and charge/discharge
modes.
Furthermore, a user-defined function makes it possible to
calculate the Average active power within the integration period.
This makes it possible to more accurately measure the power
consumption of an intermittent oscillation control unit in which
power fluctuates greatly.
(User-defined event function)
An event trigger function is helpful in verifying that voltage or
current changes are within the design tolerance range. Setting
the normal power generation range as a judgment condition
(trigger) detects measurement data that falls out of that range
and save it to the memory.
Current
value
* This is just an illustration.
Actual measurements are
affected by noise.
Voltage value
Typical voltage, current, and power measurements in MPPT contro
plus (+) side (P+pk) and minus (-) side (P-pk) of max. power peak value
Typical measurement of power value (P1),
power
value
Page 8

ApplicationsApplications
Ballas
C
o
e
I1
I2
I
T
t
L
2
AC pow
ly
Switchi
ng
regulato
*Also refer to the features of other
app
lications.
e
Example of fluorescent lamp
c
onne
ctio
n
Applications
Product Features Functions/Displays Applications Software Comparisons Explanations Specifications
n Ripple factor and power loss measurements using
user-defined function
A user-defined function makes it possible to compute not only the conversion efficiency but
also the power loss, DC voltage and DC current ripple factors between the input and output.
This is helpful in multiplying a factor or slightly changing the arithmetic expression according
to the purpose. Up to 20 arithmetic expressions can be set. Display names for the arithmetic
operations F1, F2, and so on can be changed freely.
Ripple factorRipple factor
Power lossPower loss
s4YPICALARITHMETICEXPRESSIONS
1. DC voltage ripple factor =
[(Voltage peak value (+) – Voltage peak value (-))/2 × DC voltage value (mean)] × 100
2. Power loss = Output power – Input power
Typical Product Configuration
Direct input measurements at less than 50 A: WT1806-06-F-HE/EX6/B5/G6/AUX
6 power inputs, current measurement range 10 mA to 55 A, or clamp measurement (with clamp input terminals), built-in printer, dual harmonic, auxiliary input
Measurement at more than 50 A using a current sensor: WT1806-60-F-HE/EX6/B5/G6/AUX
6 power inputs, current measurement range 100 μA to 5.5 A (measure AC/DC current sensor output), external current sensor input (for clamp measurement), built-in printer, dual harmonic, external signal input
*Direct input and current sensor input cannot be connected simultaneously.
*For detailed specifications, see the page on the specifications. You need to provide a cable for voltage measurements when wiring.
Power Measurements of Fluorescent and
Power Measurements of Fluorescent and
Light Emitting Diode (LED) Lights
Light Emitting Diode (LED) Lights
n Harmonic distortion factor (THD) measurement
(/G5 and /G6 options)
Harmonic
Harmonic
distortion factor
distortion factor
Voltage fluctuations and harmonic flow into the power system
due to reverse power flow. A harmonic measurement function
makes it possible to compute and display the harmonic distortion
factor (THD) by measuring harmonic components.
n Immediately print out screens (/B5 option)
Print outPrint out
Multiple engineers may want to verify detailed data during a test.
A built-in printer makes it possible to print data immediately on
the spot and for multiple engineers to verify the data
simultaneously.
wire
U
I
onnected by general
power wire connection
n the primary sid
* Lamp current can be obtained either by measuring the output of a wide range current sensor as shown in the
figure, or by obtaining the differential current using computation (delta computation function).
Overview
Since the switching frequency of fluorescent lamp is sometimes as fast as approximately tens of kHz, a wide range power measurement is required. Also, sometimes dimming control
by a PWM modulation circuit is performed for the LED lights. The WT1800 provides a wide range from DC to up to 5 MHz to allow you to evaluate these kinds of harmonic signals.
Advantages of WT1800
t
A
wisted wire for voltage measuremen
* An external input terminal (EX) allows you to perform both direct input measurement and clamp measurement.
amp current = I1−I
2
1
n Tube current measurements of fluorescent lamps
(/DT option)
A ballast uses harmonic frequency signals to illuminate the fluorescent lamp.
The frequency is generally as fast as tens of kHz. A wide range capability of
power measurement is important to reliably
capture the signals. Also, since tube current
cannot be measured directly, it is obtained either
by measuring the difference between the output
current of the ballast and the cathode current
using a current sensor, or by using the delta
computation of the WT1800 (/DT option).
Note: Tube current is obtained by the computation of a difference in the
instantaneous values instead of the effective current values.
Tube current
5 MHz range5 MHz range
Tube current
measurement
measurement
Delta computation
Delta computation
Differential current
Differential current
supp
1 2
A
* Be careful of the current range. Since the current value is
generally small, use the 5A input element (in the 10 mA to 5 A range).
nanc
umIll
eretm
n Light emitting efficiency and power measurements
of LED lights (/AUX option)
It is important for LED lights to increase the light emitting efficiency while at the
same time reducing the current and power consumption.
The WT1800 allows you to measure voltage, current, and power, as well as
compute the light emitting efficiency (lamp efficiency) by connecting the output
of an illuminance meter, etc. to the external signal input terminal (/AUX option).
DC/ACDC/AC
Light emitting
Light emitting
efficiency
efficiency
Typical Product Configuration
WT1806-06-H-HE/EX6/G6/DT/DA: 6 power inputs, current input range 10 mA to 55 A, or clamp measurement (with a clamp input terminal), dual harmonic, delta computation (differential current
measurement), DA output
*For detailed specifications, see the page on the specifications. You need to provide a cable for voltage measurements when wiring.
*Direct input and current sensor input cannot be connected simultaneously.
9
Page 9

ApplicationsApplications
InInve
vevrtrterer s
s ss
ecectitiionononon
In
pupupupu
t
D
Moto
Torq
rotatio
senso
Load
Batteries
p
n
pufor
fo
fo
and
and
and
and
e
p
.
*Also refer to the features of other
app
lications
Applications
Input/Output Efficiency Measurements of Inverter Motors
Input/Output Efficiency Measurements of Inverter Motors
for Hybrid Electric Vehicles
for Hybrid Electric Vehicles (HEV), Electric Vehicles (EV),
and Plug-in Hybrid Electric Vehicles (PHEV)
and Plug-in Hybrid Electric Vehicles (PHEV)
KeywordKeyword
Keyword
(HEV), Electric Vehicles (EV),
.
1
The WT1800’s ability to perform up to 6 power input measurements makes it possible to evaluate the battery’s charge and discharge characteristics, and test and evaluate the
Overview
fficiency between the input and output of inverters. A motor evaluation function (/MTR option) makes it possible to simultaneously monitor changes in the voltage, current, and
ower, as well as changes in the rotation speed and torque
Advantages of WT1800
Booster
Converter
section
r
rive circuit
2 3 4 5 M
Modulate and convert DC to AC signals
n
(/G5 and /G6 options)
Harmonic measurements from a 0.5 Hz low frequency
In motor testing, evaluation is performed at
various rotation speeds from low to high speeds.
The WT1800 supports the lower limit frequency
of 0.5 Hz to make it possible to measure
harmonics at a very low motor rotation speed
without using an external sampling clock.
Harmonic
Harmonic
measurements
measurements
from 0.5 Hz
from 0.5 Hz
ue/
n
r
n Inverter, motor, and DC/DC converter efficiency
measurements
A single WT1800 unit is capable of measuring the effective power, frequency, and motor
output in order to measure the total efficiency, including inverter and motor efficiency and
battery DC/DC conversion efficiency.
DC power accuracy has been improved to ±0.05% to ensure more accurate measurements.
Inverter/motor
Inverter/motor
efficiency
efficiency
measurements
measurements
DC power ±0.05%
DC power ±0.05%
AC power±0.1%
AC power±0.1%
n Offset correction measurement by null function
After you finish connecting the wires for inverter motor testing,
NullNull
Individual
Individual
offset adjustment
offset adjustment
10
Typical Product Configuration
WT1805-50-H-HE/B5/G6/DT/DA/MTR: 5 power inputs, current input range 100 μA to 5.5 A (measuring AC/DC current sensor output), built-in printer, dual harmonic, delta computation, DA output, motor
evaluation function
you may find a value will not become zero due to the influence of
the ambient environment or other reasons and the offset value
will be applied inappropriately even before starting
measurements.
With the previous power analyzer model*, there is no choice
other than to turn all inputs on and off collectively, so unintended
offset adjustment is performed even for inputs for which you do
not want adjust.
With the WT1800, only an input for which you want to perform
offset adjustment can be turned on and off.
*Comparison with Yokogawa’s previous model WT1600
*For detailed specifications, see the page on the specifications. You need to provide a cable for voltage measurements when wiring.
n Battery charge and discharge measurements
In integrated measurement, the battery charge and discharge can be evaluated.
Instantaneous positive and negative values captured at an approximately 2 MS/s high-speed
sampling rate are integrated, respectively, and each of the total values is displayed.
Typical repetitive high-speed charging and
Battery
Battery
charge/discharge
charge/discharge
Approx. 2 MS/s
Approx. 2 MS/s
high-speed
high-speed
sampling
sampling
discharging signals
Effective power
amount (Wh+)
Effective power
amount (Wh-)
Charge current amount Ah (power amount Wh) and discharge
current amount Ah (power amount Wh) can be integrated, respectively.
n DA output and remote control (/DA option)
20-channel
20-channel
output
output
Integration by
Integration by
remote control
remote control
Sometimes you may want to check changes in data, along with
other measurement data (temperature, etc) at the same time
when you acquire communication data, such as voltage, current,
power, and efficiency data. A DA output function allows you to
retrieve analog signals on up to 20 channels.
Also, remote control signals make it possible to control the start,
stop, and reset of integration by external analog signals.
Furthermore, integration can be linked by inputting an analog
trigger signal from another device.
Charge
Discharge
Page 10

800
2
gngg
ng
RootaRta
intient
p
p
meequeq
q
uuii
p
p
t
MotorConverter
Converter
Generator
Storage
batterie
Eng
Harmonic Measurements
G
G
N
hil
s
all
*Als
o re
fer
to t
to t
he f
eatu
res
res
of oother
ther
app
app
app
app
lic
lic
liclica
lica
tion
ion
s.s.s.*Als*Als
o reo re
fer
fer
to t
to
he f
eatueatu
res
of o
ther
app
app
lica
lica
tion
tion
s.s.
Harmonic Measurements
of Aircraft Power Systems
of Aircraft Power Systems
ApplicationsApplications
Applications
Power Measurements of
Power Measurements of
Green IT Data Center Servers
Green IT Data Center Servers
SoftwareSoftware
Software
Product Features Functions/Displays Applications Software Comparisons Explanations Specifications
ew large data centers based on cloud computing are being constructed w
the importance of energy conservation is growing. Since the WT1800 is
capable of measuring up to 6 power inputs, the current and power
consumption of up to six servers can be measured with a single unit. The
tandard GP-IB, USB, and Ethernet communication functions allow the operator
to monitor data in multiple locations by collecting data via communication.
Overview
High order harmonic measurements are important in the aircraft industry.
The WT1800 provides a function to measure up to 150 kHz harmonics and
ows you to measure up to the 500th order harmonic.
Overview
Advantages of WT1800 Advantages of WT1800
n Measurement of up to the 255th order component
even at a 1 kHz fundamental wave
Up to the 500th order harmonic can be measured at
a 400 Hz fundamental frequency. Also, up to the
255th order harmonic can be measured at 1 kHz. Up
to 150 kHz harmonic measurements are supported
for aircraft testing that requires high order harmonic
measurements.
400 Hz
150 kHz
150 kHz
harmonic
harmonic
Typical Product Configuration
WT1806-60-H-HE/G6/DA: 6 power inputs, current input range 100 μA to 5.5 A (measurement
using a current sensor), dual harmonic, DA output
400 Hz
fundamental wave
fundamental wave
Up to the 500th order
Up to the 500th order
*For detailed specifications, see the page on the specifications.
You need to provide a cable for voltage measurements when wiring.
(/G5 and G/6 options)
1 kHz
1 kHz
fundamental wave
fundamental wave
Up to the 255th order
Up to the 255th order
n Integrated Power and Harmonic Distortion Factor
Measurements
The WT1800 is capable of measuring long hours of integrated current (Ah) and power (Wh) in
order to understand the amount of power consumption. It is not only possible to measure
50/60 Hz AC signals, but also perform high precision DC measurement indispensable for the
DC power supply evaluation. Also, the /AUX option input allows you to monitor heat
generation, etc.
In addition, a DA output function (/DA option) allows you to output analog signals to an
external recorder (ScopeCorder, etc.) and perform long hours of monitoring of current and
power along with the temperature and other data.
Integrated
Integrated
current
current
Typical Product Configuration
WT1806-06-H-HE/EX6/G6/DA: 6 power inputs, current input range 10 mA to 55 A, or clamp
measurement (with a clamp input terminal), dual harmonic, DA output
*An external input terminal (EX) allows you to measure both direct input measurement and clamp measurement.
*Direct input and current sensor input cannot be connected simultaneously.
Harmonic
Integrated power
Integrated power
DC current ±0.05%
DC current ±0.05%
*For detailed specifications, see the page on the specifications.
You need to provide a cable for voltage measurements when wiring.
Harmonic
distortion factor
distortion factor
e
760122 WTViewer Software760122 WTViewer Software
n Multi-channel synchronized measurements using
WTViewer
Two-unit
Two-unit
synchronized
synchronized
operation
operation
12-power
12-power
measurements
measurements
GP-IB connection
Ethernet
communication
USB communication
* Memory media (USB storage device) is required.
WTViewer is application software that allows you to read
numerical data measured with a WT1800 Precision Power
Analyzer to a PC via Ethernet, GP-IB, or USB communication,
and display and save the numerical values.
Up to 12 power inputs can be measured simultaneously in
synchronized measurements between two units. Also, the
ability to collect data of up to four WT1800 units allows you
to measure the conversion efficiency, power, and power loss
of up to 24 power inputs.
Note: Make sure the model and suffix codes of the two units are the same.
Measurable number
of units
1 to 4 units
1 to 4 units
1 to 4 units
M 1 2 3
ID1Pm
FTP server
function
×
×
ID1P
∑
A
Up to 20 inverter/converter efficiency
computations can be set.
s#OMPUTATIONSETTINGEXAMPLES
Inverter discharge efficiency ID1P
Inverter charge efficiency ID1P1/ID1P
Synchronization cable
(BNC-BNC cable)
ID2P1ID1P1
∑
4 5
6
COMING SOON
A/ID1P1×100[%], Converter charge efficiency ID2P1/D2P
∑
A×100[%], Motor efficiency ID1Pm/ID1P
WT1
-ID
7 8 9
∑
ID2P
A
∑
A×100[%]
∑
A×100[%]
ine
Typical Product Configuration
WT1805-50-H-HE/G5/MTR × 2 units: 5 power inputs, current input range 100 μA to 5.5 A (using a current sensor), or clamp measurement (with a clamp input terminal), harmonic measurement
*For detailed specifications, see the page on the specifications. You need to provide a cable for voltage measurements when wiring.
11
Page 11

ComparisonsComparisons
Comparisons
Comparison between WT1600 and WT1800Comparison between WT1600 and WT1800
g
Comparison with the previous model (main changes)
Voltage input terminal
Current input terminal
External sensor input terminal
Basic voltage/current accuracy
Basic power accuracy
Frequency range
Voltage/Current frequency range (-3 dB, typical)
Sampling speed
Wiring setting method
Selects specified range
Effective input range
Screen size and resolution
Data update rate
Line filter
Frequency filter
Harmonic measurement
Harmonic mode
Fundamental frequency of the PLL source
Upper limit of the measured order
Harmonic analysis number
Integration
Integration mode
Delta computation function
Auto printing function
Screen print-out function
Printer width/length
Crest factor (CF=peak/minimum rms)
Average (moving average)
Store function
Store items
Screen shot image format
Frequency measurements
Rotation speed input
Universal analog inputs
SCSI interface
Internal HDD
DA output channels numbers
DA output resolution
Data memory
Communication command compatibility
GP-IB communication
Ethernet communication
Ethernet communication protocol
USB communication
RS232 communication
Plug-in terminal (safety terminal)
Large binding post
Insulated BNC connector (option)
+/-0.1%
+/-0.05%
DC, 0.1Hz to 1 MHz
5 MHz (-3 dB, typical)
approximately 2 MS/s
Selects wiring and element numbers
Yes
1% to 110% of range rating
8.4-inch (1024×768)
50 m, 100 m, 200 m, 500 m, 1, 2, 5, 10, 20 [sec]
OFF, digital filter 100 Hz to 100 kHz (100 Hz step)
analog filter 300 kHz, 1 MHz
OFF, 100 Hz or 1 kHz
/G5 option or /G6 option
Simultaneous normal and harmonic measurement
0.5 Hz to 2600 Hz (internal sampling clock)
(without external sampling clock function)
Up to 500 order
select from 1 system (/G5 option) or 2 systems (/G6 option)
Active power, current, a pparent power, reactive power
Charge/discharge, sold/bought mode
/DT option
Yes
Built-in printer
80 mm / 10 m
300
Sets between from 2 to 64 counts
Store
Numeric
BMP, PNG and JPEG
3 sources (standard), 12 sources (/FQ option)
A-phase, B-phase, Z-phase input (/MTR option)
Two analog inputs (/AUX option)
N/A
N/A
20 ch (/DA option)
16 bits
Direct save to USB device up to 1 GB
Approximately 90% command compatibility
Standard
Standard (No HDD and No SCSI)
VXI11
USB-TMC
N/A
Plug-in terminal (safety terminal)
Large binding post
Insulated BNC connector (standard)
+/-0.1%
+/-0.1%
DC, 0.5 Hz to 1 MHz
No definition
approximately 200 kS/s
Selects wiring system pattern
N/A
1% to 110% of range rating
6.4-inch (640×480)
50 m, 100 m, 200 m, 500 m, 1, 2, 5 [sec]
OFF, 500 Hz, 5.5 kHz, 50 kHz
OFF or ON
Standard
Selects normal or harmonic mode
1 to 10 Hz (use external sampling clock)
10 Hz to 440 Hz (internal sampling clock)
Up to 100 order
1 system
Active power, current
Charge/discharge mode
Standard
N/A
Built-in printer, Ethernet network printer
80 mm / 10 m
300
Selects from 8, 16, 32 or 64 counts
Store / Recall
Numeric, waveform (1002 peak to peak data)
TIFF, BMP, Post Script, PNG and JPEG
3 sources (standard)
1 input (/MTR option)
N/A
Yes (/C7)
Yes (10 GB, /C10)
30 ch (/DA option)
12 bits
approximately 11 MB (internal), FDD, HDD
--Standard (select GP-IB or RS-232)
Option (with HDD and SCSI option)
Yokogawa original protocol
N/A
Standard (select GP-IB or RS-232)
WT1600WT1800
* There are restrictions on some specifications and functions.
For details, refer to the specifications.
* A table comparing commands between the two models will be
published on the Products page of the Yokogawa website.
Characteristics comparisonCharacteristics comparison
g
Examples of frequency characteristics of the WT series and the PZ4000
Examples of frequency and power accuracy characteristics Total power error with rated range input for an arbitrary power factor (at 50/60 Hz)
2
1
0
-1
-2
-3
WT230
150 V / 1 A range
-4
WT500
100 V / 0.5 A range
-5
WT1800
150 V / 1 A range
-6
WT3000
100 V / 5 A range
-7
PZ4000
Accuracy (cos Ø = 1) [% of range]Error [% of range]
300 V pk / 1 A pk range
-8
-9
1 10 100 1000 10000 100000 1000000
Frequency [Hz]
Influence of the common-mode voltage on the readings Example of the frequency and power accuracy for zero power factor
3
WT230
150 V
WT230
1 A range
WT500
15 V range
2
WT500
0.5 A range
WT1800
100 V range
WT1800
1 A range 5 A element
1
WT1800
1 A range 50 A element
12
0
1 10 100 1000 10000 100000
WT3000
100 V range
WT3000
0.5 A range
PZ4000
200 V pk range
PZ4000
2 A pk range
Frequency [Hz] Frequency [Hz]
1
0.1
0.01
1.5
0.5
-0.5
Accuracy [% of range] Total error for the power range value [% of range]
-1.5
WT230 WT500 WT1800 WT3000 PZ4000
0.001 0.01 0.1 1
1
0
WT230
150 V / 1 A range
WT500
100 V / 0.5 A range
-1
WT1800
150 V / 1 A range
1 10 100 1000 10000
cos Ø = power factor
WT3000
100 V / 5 A range
PZ4000
300 V pk / 1 A pk range
Page 12

Comparison of Power Analyzer WT Series and PZComparison of Power Analyzer WT Series and PZ
0.2
0
k k
g
Comparison of the specifications and functions of the WT series and the PZ4000
WT1800 WT3000 WT500 WT210/WT230 PZ4000
Basic power accuracy (50/60 Hz)
DC power accuracy
Power frequency range
Voltage/Current frequency range
Input elements
Voltage range
InputMeasurement parametersDisplayMeasurement /functionsOther features
Current range (direct input)
Current range (external sensor input)
Guaranteed accuracy range
for voltage and current
Main measurement parameters
Crest factor
MAX hold
Voltage RMS/MEAN
simultaneous measurement
Average active power
Active power integration (WP) (Wh)
Apparent power integration (WS) (VAh)
Reactive power integration (WQ) (varh)
Frequency measurement
Efficiency measurement
Motor evaluation
Auxiliary inputs
FFT spectral analysis
User-defined functions
Display
Display format
Sampling frequency
Harmonic measurement
Dual harmonic measurement
IEC standards-compliant
harmonic measurement
IEC flicker measurement
Cycle by cycle measurement
Delta calculation function
DA outputs
Storage
(internal memory for storing data)
Interfaces
Synchronous measurement
Data update interval
Removable storage
Built-in printer
There are limitations on some specifications and functions. See the individual product catalogs for details.
0.1% of reading +0.05% of range
0.05% of reading +0.1% of range
DC, 0.1 Hz to 1 MHz
5 MHz (typical)
1, 2, 3, 4, 5, 6
1.5, 3, 6, 10, 15, 30, 60, 100, 150, 300, 600,
1000 [V]
10 m, 20 m, 50 m, 100 m, 200 m, 500 m,
1, 2, 5 [A]
or, 1, 2, 5, 10, 20, 50 [A]
50 m, 100 m, 250 m, 500 m, 1, 2.5, 5, 10 [V]
(opt.)
1% to 110%
Voltage, current, active power, reactive power,
apparent power, power factor, phase angle,
frequency, peak voltage, peak current,
crest factor, integration (Wh, Ah, varh, Vah)
Maximum 300
Yes
Yes
Yes (user defined unction)
Yes
Yes
Yes
3 ch (up to 12 channels with option /FQ)
Yes
Torque, A / B / Z phase signal inputs (/MTR),
6 inputs, and motor evaluation (opt.)
Yes (2 inputs) (opt.)
No
Yes (20 functions)
8.4-inch XGA TFT color LCD
Yes (numeric, waveform, trend)
/G5 (opt.) or /G6 (opt.) (bar graph, vector)
Approximately 2 MS/s
(/G5) (opt.)
(/G6) (opt.)
No
No
No
(/DT) (opt.)
20 channels (/DA) (opt.)
Approximately 32 MB
GP-IB, USB, Ethernet
RGB output (/V1) (opt.)
Yes
50 m, 100 m, 200 m, 500 m, 1, 2, 5, 10,
20 [S]
USB
front side (/B5) (opt.)
0.02% of reading +0.04% of range
0.05% of reading +0.1% of range
DC, 0.1 Hz to 1 MHz
1 MHz
1, 2, 3, 4
15, 30, 60, 100, 150, 300, 600, 1000 [V]
5 m, 10 m, 20 m, 50 m, 0.1, 0.2, 0.5, 1, 2 [A]
or, 0.5, 1, 2, 5, 10, 20, 30 [A]
50 m, 100 m, 200 m, 500 m, 1, 2, 5, 10 [V]
1% to 130%
Voltage, current, active power, reactive power,
apparent power, power factor, phase angle,
frequency, peak voltage, peak current,
crest factor, integration (Wh, Ah, varh, Vah)
Maximum 300
Yes
Yes
Yes (user defined unction)
Yes
Yes
Yes
2 ch (up to 8 channels with option /FQ)
Yes
Torque, rotating speed input (/MTR),
4 inputs, and motor evaluation (opt.)
No
Yes (/G6) (opt.)
Yes (20 functions)
8.4-inch VGA TFT color LCD
Yes (numeric, waveform, trend)
/G6 (opt.) (bar graph, vector)
Approximately 200 kS/s
(/G6) (opt.)
No
(/G6) (opt.) (10 cycle / 50 Hz, 12 cycle / 60 Hz,
16 cycles (50 and 60 Hz)
(/FL) (opt.)
(/CC) (opt.)
(/DT) (opt.)
20 channels (/DA) (opt.)
Approximately 30 MB
GP-IB, RS-232 (/C2) (opt.)
USB (/C12) (opt.), VGA output (/V1) (opt.)
Ethernet (/C7) (opt.)
Yes
50 m, 100 m, 250 m, 500 m, 1, 2, 5, 10,
20 [S]
PC card interface, USB (/C5) (opt.)
front side (/B5) (opt.)
0.1% of reading +0.1% of range
0.1% of reading +0.1% of range
DC, 0.5 Hz to 100 kHz
100 kHz
1, 2, 3
15, 30, 60, 100, 150, 300, 600, 1000 [V]
500 m, 1, 2, 5, 10, 20, 40 [A]
50 m, 100 m, 200 m, 500 m, 1, 2, 5, 10 [V]
(opt.)
1% to 110%
Voltage, current, active power, reactive power,
apparent power, power factor, phase angle,
frequency, peak voltage, peak current,
crest factor, integration (Wh, Ah, varh, Vah)
Maximum 300
Yes
Yes
Yes (user defined unction)
Yes
Yes
Yes
2 ch (up to 6 channels with option /FQ)
Yes
No
No
No
Yes (8 functions)
5.7-inch VGA TFT color LCD
Yes (numeric, waveform, trend)
/G5 (opt.) (bar graph, vector)
Approximately 100 kS/s
(/G5) (opt.)
No
No
No
No
(/DT) (opt.)
No
Approximately 20 MB
USB, GP-IB (/C1) (opt.)
Ethernet (/C7) (opt.)
VGA output (/V1) (opt.)
Yes
100 m, 200 m, 500 m, 1, 2, 5 [S]
USB
No
0.1% of reading +0.1% of range
0.3% of reading +0.2% of range
DC, 0.5 Hz to 100 kHz
100 kHz
1 (WT210), 2 or 3 (WT230)
15, 30, 60, 100, 150, 300, 600 [V]
5 m, 10 m, 20 m, 50 m, 0.1, 0.2, 0.5, 1, 2, 5,
10, 20 [A] (WT210)
0.5, 1, 2, 5, 10, 20 [A] (WT230)
50 m, 100 m, 200 m [V] or 2.5, 5, 10 [V] (opt.)
1% to 130%
V
oltage, current, active power, reactive power,
apparent power, power factor, phase angle,
frequency, peak voltage, peak current,
crest factor, integration (Wh, Ah)
Maximum 300
Yes
No
Yes
Yes
No
No
1 ch
Yes (WT230)
No
No
No
No
7-segment display
numeric (3 values)
Approximately 50 kS/s
(/HRM) (opt.)
No
No
No
No
No
4 channels (/DA4) (opt.) (WT210)
12 channels (/DA12) (opt.) (WT230)
Maximum 600 samples (WT210)
Maximum 300 samples (WT230)
* Only reading in the WT is possible.
GP-IB or RS-232 (WT210) (opt.)
GP-IB or RS-232 (WT230)
No
100 m, 250 m, 500 m, 1, 2, 5 [S]
No
No
ComparisonsComparisons
Comparisons
0.1% of reading +0.025% of range
0.2% of reading +0.1% of range
DC, 0.1 Hz to 1 MHz
5 MHz (typical)
1, 2, 3, 4, or 1, 2, 3 +Motor module
30, 60, 120, 200, 300, 600, 1200, 2000 [Vpk]
5 A module:
0.1, 0.2, 0.4, 1, 2, 4, 10 [Apk] (5 A rms)
20 A module:
0.1, 0.2, 0.4, 1, 2, 4, 10 [Apk] (5 A rms)
1, 2, 4, 10, 20, 40, 100 [Apk] (20 A rms)
0.1, 0.2, 0.4, 1 [Vpk]
5% to 70% (peak range)
Voltage, current, active power, reactive power,
apparent power, power factor, phase angle,
frequency, peak voltage, peak current,
crest factor
Maximum 20
No
Yes
No
No
No
No
2 ch / module
Yes
Torque and rotational velocity input
(requires sensor input module 253771) (opt.)
No
Yes
Yes (4 functions)
6.4-inch VGA TFT color LCD
Yes (numeric, waveform, trend, X-Y,
bar graph, vector)
Maximum 5 MS/s
Yes
No
No
No
No
Yes
No
None, but acquisition memory has
100 kW/channel (up to 4 MW/channel
can be installed with /M3 option)
GP-IB, RS-232, Centronics, SCSI (/C7) (opt.)
Yes
Depends on waveform acquisition
length and calculations
FDD
top side (/B5) (opt.)
(opt.) : Optional
Product Features Functions/Displays Applications Software Comparisons Explanations Specifications
g
Comparison of the accuracy and range between the WT series and PZ
.05
0.1 Hz WT3000 basic power accuracy 0.06% 1 MHz
Industrial electric equipment
Inverter (R&D and inspection)
(Power supply, motor, air-conditioner, etc.)
0.1
Power measurements on production and
inspection lines
0.1 Hz PZ4000 basic power accuracy 0.125% 1 MHz
Basic power accuracy [%]
0.1 Hz WT1800 basic power accuracy 0.15% 1 MHz
0.5 Hz WT500 basic power accuracy 0.2% 100 kHz
0.5 Hz WT210/WT230 basic power accuracy 0.2% 100 kHz
Battery
Power consumption measurements of home appliances and OA equipment
Maintenance of plant equipment related to heavy electric machinery, power, and process automation
13
Power measurement range [Hz]
Page 13

ExplanationsExplanations
k
C
r
RMS value
C
=
S)
t
Explanations
SUPPORTS Crest Factor 6
The crest factor is the ratio of the waveform peak value and the RMS value.
rest facto
(CF, peak factor)
waveform peak
When checking the measurable crest factor of our power measuring instruments,
please refer to the following equation.
rest factor (CF)
{measuring range
measured value (RM
* However, the peak value of the measured signal must be less than or equal to the continuous maximum allowed inpu
* The crest factor on a power meter is specified by how many times peak input value is
allowed relative to rated input value. Even if some measured signals exist whose crest
factors are larger than the specifications of the instrument (the crest factor standard at
the rated input), you can measure signals having crest factors larger than the
specifications by setting a measurement range that is large relative to the measured
Calculation Method of Voltage and Current and Procedure to Set Synchronous Source
AC signals are repeatedly changing waveforms in terms of instantaneous values. An averaging
calculation by the repeated periods is required to be performed to measure the power value of
the AC signals. The WT1800 uses an ASSP method to perform averaging processing by the
periods for the instantaneous data measured at an approximately 2 MS/s rate to obtain the
measurement value.
CF setting (3 or 6)}
signal. For example, even if you set CF = 3, CF 5 or higher measurements are possible
as long as the measured value (RMS) is 60% or less than the measuring range. Also,
for a setting of CF = 3, measurements of CF = 300 are possible with the minimum
effective input (1% of measuring range).
Voltage
waveform
waveform
pea
MS value
ASSP Method
An ASSP (Average for the Synchronous Source Period) method is used to calculate the
measurement value by performing calculation processing for the sampling data within the data
update period (with the exception of the integrated power value WP and integrated current value
q in the DC mode). This method uses a frequency measurement circuit to detect the period of
the input signal set in the synchronous source and performs calculation using the sampling data
in the interval equivalent to the integral multiple of the input period. Since the ASSP method
basically is able to obtain the measurement value by just performing an averaging calculation
for the interval of one period, it is effective for a short data update period or efficient
measurement of low frequency signals. If this method cannot detect the period of the set
synchronous source signal correctly, the measurement values will not be correct. Therefore, it is
necessary to check to make sure the frequency of the synchronous source signal is measured
and displayed correctly. For the notes of the settings of the synchronous source signal and
frequency filter, refer to the instruction manual.
Selecting formulas for calculating apparent power and reactive power
There are several types of power––active power, reactive power, and apparent
power. Generally, the following equations are satisfied:
Active power P = UIcosØ (1)
Reactive power Q = UIsinØ (2)
Apparent power S = UI (3)
In addition, these power values are related to each other as follows:
(Apparent power S)
U : Voltage RMS
I : Current RMS
Ø : Phase between current and voltage
Three-phase power is the sum of the power values in the individual phases.
These defining equations are only valid for sinewaves. In recent years, there has
been an increase in measurements of distorted waveforms, and users are measuring
sinewave signals less frequently. Distorted waveform measurements provide
different measurement values for apparent power and reactive power depending on
which of the above defining equations is selected. In addition, because there is no
defining equation for power in a distorted wave, it is not necessarily clear which
equation is correct. Therefore, three different formulas for calculating apparent
power and reactive power for three-phase four-wire connection are provided with
the WT1800.
2
= (Active power P)2 + (Reactive power Q)2 (4)
l TYPE1 (method used in normal mode with older WT Series models)
With this method, the apparent power for each phase is calculated from equation (3), and reactive power
for each phase is calculated from equation (4). Next, the results are added to calculate the power.
Active power: PΣ=P1+P2+P3
Apparent power: SΣ=S1+S2+S3(=U1×I1+U2×I2+U3×I3)
Reactive power: QΣ=Q1+Q2+Q3
l TYPE2
The apparent power for each phase is calculated from equation (3), and the results are added together to
calculate the three-phase apparent power (same as in TYPE1). Three-phase reactive power is calculated
from three-phase apparent power and three-phase active power using equation (4).
Active power: PΣ=P1+P2+P3
Apparent power: SΣ=S1+S2+S3(=U1×I1+U2×I2+U3×I3)
Reactive power:
l TYPE3 (method used in harmonic measurement mode with WT1600 and PZ4000)
This is the only method in which the reactive power for each phase is directly calculated using equation
(2). Three-phase apparent power is calculated from equation (4).
Active power: PΣ=P1+P2+P3
Apparent power:
Reactive power: QΣ=Q1+Q2+Q3
Current
waveform
Setting Synchronous Source
In the case of such a signal, the synchronous source is set to the current signal side with less
harmonic components. Even if harmonic components (noise) are superimposed on the current
waveforms, measurements can be stabilized by turning on the frequency filter to detect a zero
crossing reliably.
When the frequency measurement results are correct and stable, you can consider the filter
settings are right. A frequency filter also functions as a filter to detect a zero crossing of the
synchronous source. That’s why a frequency filter is also called a synchronous source filter or a
zero crossing filter.
2
(= )(U1×I1)
*S1, S2, and S3 are calculated with a positive sign for the leading phase and a negative sign for the lagging phase.
QΣ=SΣ2-PΣ
SΣ=PΣ2+QΣ
2
2
-P12+ (U2×I2)2-P22+ (U3×I3)2-P3
2
14
Page 14

SpecificationsSpecifications
M
S
3-wire
3-wire
(
t
3
e
e
Curre
[A]
/3
Acti
[W]
P1+P2
P1+P2+P3
A
∑
[VA]
TYPE2
S1-S2
3/2 ( S1+S2)
3/3 ( S1+S2+S3 )
S1+S2+S3
TYPE3
∑
2
Q
∑
2
Q
[
]
Q1+Q2Q1+Q2+Q3
TYPE2
∑
∑
T
3
Q1+Q2Q1+Q2+Q3
Corrected Powe
c2Pc
c3
I
[Wh]
WP1+WP2
WP1+WP2+WP3
)
∑
E
3
added
I
)
]
E
3
OUG
g
a
d
q2
q1+q2+q3
]
2q+1
3
q
[Ah]
q-1+q-2
q-1+q-2+q-3
Q
[
h]
Q
∑
f
f
I
∑
(n) indi
f
Power Facto
∑
P
/S
∑
]
(P
∑
)
(
λ
a
.
t
f
Q
t
Item
S
g
g
Voltage (V)
t
C
t
A
)
A
S
R
)
Q
λ
Ph
)
Ø
F
)
fU (
y
A freq
all el
Maxi
(V)
U+pk: Maxi
I+pk: Maxi
(W)
Cres
g
r
App
)
)
)
t
)
)
,
a
m
S
Inp
e
)
C
t
• Di
t
•
Inp
V
e
Fl
d
C
t
d
M
ge
1
)
C
t
•
:
(
)
5
p
(
)
5
)
• E
5
)
)
Instrume
loss
Vol
e
I
M
1
Current
• Di
:
H
App
μH
• E
M
1
I
Voltage
r
Current
•
r
•
hichever is lower
•
ge
I
)
Voltage
r
Current
•
r
•
hich
r
•
ge
C
t
Voltage
s
C
t
•
,
r
•
cheve
er
• E
C
)
000 Vrms
I
ge
h
sh
•
•
1
L
S
Freq
r
S
z
r
n
Resolutio
C
.
R
t
s
Rang
p
•
ge
•
)
Rang
W
.
•
•
r
)
•
)
y
py
m
S
Display
y
T
s
e
S
.
(
i
)
(
5
p
Specifications
Product Features Functions/Displays Applications Software Comparisons Explanations Specifications
nputs
Ite
ut terminal typeVoltag
ut type
easurement rangeVolta
nt
nstantaneous maximum allowable input (20 ms or less)
nstantaneous maximum allowable input (1 second or less
ontinuous maximum allowable inpu
ontinuous maximum common mode voltage (50/60 Hz
nfl uence from common volta
ine fi lter
uency fi lte
A/ D converte
ange switchingA range can be set for each input elemen
Auto range function
pecification
Plug-in terminal (safety terminal
urren
rect input: Large binding pos
External current sensor input: Insulated BNC connector
oltag
oating input, resistive potential metho
urren
Floating input, shunt inpu t metho
.5 V, 3 V, 6 V, 10 V, 15 V, 30 V, 60 V, 100 V, 150 V, 30 0 V, 600 V, 1000 V (for crest f actor 3
0.75 V, 1. 5 V, 3 V, 5 V, 7.5 V, 15 V, 30 V, 50 V, 75 V, 150 V, 300 V, 5 00 V (for crest factor 6)
urren
Direct input
50 A input element
1 A, 2 A, 5 A, 10 A, 20 A, 50 A
00 mA, 1 A, 2.5 A, 5 A, 10 A, 25 A (for crest factor 6)
ut element
5 A in
10 mA, 20 mA, 50 mA, 100 mA, 200 mA, 500 mA, 1 A, 2 A, 5A
mA,10 mA, 25 mA, 50 mA, 100 mA, 250 mA, 500 mA, 1 A, 2.5 A (for crest factor 6
xternal current sensor input:
0 mV, 100 mV, 200 mV, 500 mV, 1 V, 2 V, 5 V, 10 V (for crest factor 3
25 mV, 50 mV, 100 mV, 250 mV, 500 mV, 1 V, 2.5 V, 5 V (for crest factor 6
tag
nput resistance :Approx. 2
Input capacitance : Approx. 10 pF
rect input
50 A input element: A pproximately 2 m1 + approximately 0.07 μ
5 A input element:
xternal current sensor input: Approximately 1
Peak voltage of 4 kV or RMS of 2 kV, whichever is lowe
Direct input (50 A input element): Peak current of 450 A or RMS of 300 A,
whichever is lowe
Direct input ( 5 A input element): Pea k current of 30 A or RMS of 15 A,
w
External current sensor input: Peak current is less than 10 times the ran
Peak voltage of 3 kV or RMS of 1.5 kV, whichever is lowe
Direct input (50 A input element): Peak current of 150 A or RMS of 55 A,
whichever is lowe
Direct input ( 5 A input element): Peak current of 10 A or RMS of 7 A,
w
ever is lowe
External current sensor input: Peak current is less than 10 times the ran
Peak voltage of 2 kV or RMS of 1.1 kV, whichever is lower
If the frequency of the input volt age exceeds 100 kHz, (1200-f) Vrms or les
The letter f indicates the frequency of the input voltage and the unit is kHz.
urren
Direct input ( 50 A input element): Peak current of 150 A or RMS of 55 A
whichever is lowe
Direct input (5 A input element): Peak current of 10 A or RMS of 7 A,
whi
r is low
xternal current sensor input: Peak current is less than 5 times the range
1
Apply 1000 Vrms for input terminal and c ase with the voltage input terminals shorted,
t
e current input terminals open, and the external current sensor input terminals
orted.
50/60 Hz: ±0.01% of range or less
Reference value up to 100 kHz: ±{ (maximum r ated range ) / (rated range) × 0.00
× f% of range} or less. For external current sensor input, add max. rated range /
rated r ange × {0.0125 × log (f × 1000)-0.021}% of range. However, 0.01% or
more. The unit of f is kHz.
The maximum rated range within the equation is 1000 V or 50 A or 5 A or 10 V.
elect OFF, 100 Hz to 100 kHz ( in increments o f 100 Hz), 30 0 kHz, or 1 MHz
elect OFF, 100 H z, or 1 kH
Simultaneous voltage and current input conver sio
n: 16-bit
onversion speed (sampling period):
Approximately 500 ns. See harmonic measuremen t items for harmonic measurement
e u
When the measured values of Urms and Irms exceed 110% of the ran
When the peak value of the input signal exceed s approximately 3 30% of the range
(or approximately 660% for cr est factor 6
e down
hen the following conditions are met, the range setting switches down
When the measured values of U RMS and I RMS fall to 30% or less of the range
When the measured values of U RMS and I RMS fall to 105% or less of the lowe
range (range to which the range set ting switches down
When the measured values of Upk and Ipk fall to 300% or less of the lower range
(600% or less for crest f actor 6
roximately 100 m + approximately 0.07
for crest factor 3
for crest factor 3
isplay Items
Calculation Functions
easurement Function
Voltage U∑ [V] (U1+U2)/2(U1+U2+U3)/3
∑
nt I
ve power P ∑
pparent Power S
Reactive Power
var
ntegrated Power WP
Integrated Power (Positive
ntegrated Power (Negative
-∑[Wh
Integrated Current q ∑[Ah]q1+
Integrated Current (Positive)
q+[Ah
Integrated Current (Negative)
-∑
Integrated reactive Power
∑
W
ntegrated apparent Power
WS ∑ [VAh]
Phase angle Ø ∑ [°
Note 1) The ins trument’s apparent po wer (S), reactive power (Q), power factor
(However, reactive power is calculated directly from sampled data when T YPE3 is selected.) Therefore,
Note 2) The value of Q for each phase in th e Q ∑ calculation is calculated with a preceding minus sign (-) when
Numerical Display
Measurement functions obtained for each input elemen
urrent (A ) Urms: True RMS value, Imn: Rectifi ed mean value calibrated to the RMS value,
ctive power (W
pparent power (VA )
eactive power (var
Power factor
ase angle (°
requency (Hz
Maximum and minimum current values ( A)
Maximum and minimum p ower values
t factorCfU: Volta
Corrected power (W)Pc
Integration Time: Integration time
∑
r Pc ∑ [W] Pc1+P
[Wh]
var
r
re calculated using measured values of voltage, current, and active power.
when distorted waveforms are input, these values may be different from those of other measuring
instrument s based on different measuring principals
he current input leads the volt age input, and a plus sign when it lags the voltage input, so the value o
∑may be negative.
mum and minimum voltage values
ingle-phase
(I1+I2)/2(I1+I2+I3)
S
YPE
When WPTYPE is set to CHARGE/DISCHARG
WP+1+WP+
When WPT YPE is set to SOLD/B OUGHT
Whenever data is updated, only the positive value of active power WP ∑is
When WPTYPE is set to CHARGE/DISCHARG
-
When WPT YPE is set to SOLD/B
Whenever data is updated, only the ne
dde
q+1+q+
∑(n) indicates the
number o
S
number o
∑
COS
ymbol and Meanin
Urms: True RMS value, Umn: Rectifi ed mean value calibrated to the RMS value,
Udc: Simple mean value, Urmn: Rect ifi ed mean value, Uac: AC componen
Idc: Simple mean value, Irmn: Rectifi ed mean value, Iac : AC componen
FreqU): Voltage frequency, fl (Freql): Current frequenc
Three fU and fI of all elements included can be measured simultaneously.
uency measurement option allows you to simultaneously measure all fU and fIof
ements.
Unselected signals are displayed wi th “………” indicating no data .
mum voltage value, U-pk: Minimum voltage value
mum current value, I-pk: Minimum current value
P+pk: Maximum power value, P-pk: Minimum power value
e crest fac tor, CfI : Current cres t facto
licable st andards
IEC76-1 (1976), IEC76 -1 (199 3
WP: Sum of the amount of both positive and negative power
WP+: Sum of positive P (amount of power consumed
WP-: Sum of negative P (amount of power returned to the grid
q: Sum of the amount of both positive and negative curren
q+: Sum of positive I (amount of current
q-: Sum of negative I (amount of current
WS: Amount of apparent power
WQ: Amount of reactive power
However, the amount of current is integrated by selecting any one of Irms,Imn,Idc,Iac
nd Irmn depending on the setting of the current mode.
3-phase
-
unction of the nth reactive power, N indicates the
data updates, and the unit of Time is h
cates the∑function of the nth apparent power, N indicates the
data updates, and the unit of Time is h
/S∑
3-phase 3-wire
3-voltage 3-curren
measurement)
1+Pc2+P
WP+1+WP+2+WP+
HT
ative value of active power W P∑ is
WP-1+WP-2+WP-
+q+2+q+
), and phase difference (Ø )
-phas
4-wir
Displa
Ite
Display update rat
*U
pecification
otal number of pixels*1024 (horizontal) × 768 (vertical) dot
to approximately 0.002% of the pixels on the LCD may be defective.
8.4-inch color TF T LCD displa
ame as the dat a update rate
1) The display update interval of numeric display alone is 200 ms to 500 ms
which varies depending on the number of display items) when the data update rate
s 50 ms, 100 ms, and 200 ms.
2
The display update interval of display items other than numeric display
including custom displays) is approximately 1 second when the data update rate is
0 ms, 200 ms , and 500 ms.
15
Page 15

SpecificationsSpecifications
Measurement function
(
(∑for each connected unit (
functio
n) o
btained fo
)
(
∑
,
∑
,
∑
C)
)
Item
S
g
g
Voltage (V)
U
∑
t
C
)
Irms
I
t
A
(VA)
S
∑
R
)
Q
∑
Power factor
C
)
Pc
∑
)
I
n
Time
WP
∑
:
r
∑
)
W
)
q
t
q
)
q
)
W
∑
W
∑
M
t
m
S
g
g
Vol
(V)
U
k
,
U
e
*
)
C
)
I
,
I: C
Acti
(W)
P (k)
)
)
S
S
)
R
)
Q (k)
,
Q
)
Power factor
λ
:
)
P
Ø
e
Ø
)
Ø
)
I
(
)
Z (k)
R
)
Rs (k)
,
s
,
s
Rp (k)
l
l
H
U
I
I
P
P
T
U
U
I
I
P
T
r
U
T
U
r
H
r
*
hvf
r
Harmonic curre
facto
*4
h
K-f
r
R
e
sq
g
a
o
.
.
M
a
T
Item
g
g
P
)
Ø
Ph
)
Ø
Ph
)
Ø
)
P
)
Ø
2
)
Ph
)
Ø
EaU
)
P
i
N
Measurement function (
(∑function) obtained for each connected unit (
)
(
∑A,∑B,∑
C)
)
Item
S
g
g
Voltage (V)
U
∑
(1)
U
∑
:
)
C
∑
I
∑
Acti
(W)
P
∑
(1)
P
∑
: T
)
)
S
(1)
S
∑
)
R
)
Q
∑
Q
∑
)
Powe
or
∑
(1)
∑
:
)
c
b
.
Item
g
g
S
g
g
Voltage (V)
e
Δ
U
b
n
3P3W->3V3A
U
c
S
Δ
U
Δ
b
Δ
U
(
Δ
U
Δ
U
Δ
U3)
S
A
Δ
U
Δ
d
f
m
Δ
U
∑
(
Δ
U
Δ
U
Δ
)
C
)
difference
Δ
ffere
ed
by
n
3
A
Δ
S
S
A
I: Neutral line curre
P
)
e
3P3
3A
U1, U2,
U
by
c
m
∑
3
S
A
Item
Sp
W
T
y
g
m
B
.
V
d
A
y
Item
C
s
Temp
P
(
λ
)
F
F
Vol
F
y
A
±
C
±
)
0
z
±(
)
z
±
5 H
Hz
±(
)
±(
)
z
±
)
50
kHz
±(
)
±{(
}
500
±
}
Freq
l)
Curre
F
y
A
±
C
±
)
0
z
±(
)
z
±
5 H
f
66 Hz
±
)
±(
)
kHz
±(
)
±
50
kHz
±
)
00
}
f
}
500 kHz
t
}
500
t
}
F
t
t
Specifications
A
ymbol and Meanin
rms ∑ : True RMS va lue, Umn ∑: Rectifi ed mean value calibrated to the RMS value, Udc
urrent (A
Active power (W)
pparent power
eactive power (var
orrected power (W
ntegratio
Harmonic Measurement (Option)
easurement function obtained for each input elemen
Ite
tage
urrent (A
ve power
Apparent power (VA
eactive power (var
hase angle (°)Ø (k) : Phase angle between the harmonic voltage and curr ent of order k,
mpedance of the load circuit
esistance and reactance of the load circuit (
armonic content [%]Uhdf (k): Ratio of the harmonic voltage U ( k) to U (1) or
otal harmonic distortion [%]
elephone harmonic facto
elephone infl uence factor
armonic voltage facto
acto
*1: Order k is an inte
DC current compo nent (dc). The upper limit value for the measured order is automatically determined up t
the 500th order depending on the frequency of the PLL source
*2: The t otal value is ca lculated by obt aining the fundamental wave (the 1st order ) and all harmonic
c omponents ( from the 2nd order to the upper limit value for the mea sured order). Also, t he DC component (dc)
can be added to the equation
*3: Th e total har monic is calcula ted by obtaining the total harmonic component (from the 2nd order to the upper
limit value for the measured order)
*4: The equations may vary depending on the defi nitions in the standards, etc. Check the standards for details.
easurement function indicating the phase difference of the fundamental wave between the voltage
nd current between input elements
his is a measurement function indica ting the phase angle of the fundamental wave U (1) or I (1) of another
element to the fundamental wave U(1) of the element with the smallest number among input elements assigned
to the conne cted unit. T he following table shows measurement functions for the connected unit with a
combination of the elements 1, 2, and 3.
hase angle U1-U2 (°
ase angle U1-U3 (°
ase angle U1-I1 (°
hase angle U2-I2 (°
ase angle U3-I3 (°
1 to EaU6 (°), EaI1 to EaI6 (°
: Simple mean value, Urmn: Rectifi ed mean va lue, Uac ∑: AC componen
∑: True RMS value, Imn∑ : Rectifi ed mean value calibrated to the RMS value,
dc ∑ : Simple mean value, Irmn∑ : Recti fi ed mean value, Iac ∑ : AC componen
∑
∑
Applicable standards IEC76-1 (1976), IEC76 -1 (199 3
∑: Integr ation time
Sum of the amount of both positive and negative powe
: Sum of positive P (amount of power consumed
P-∑ : Sum of negative P (amount of power returned to the grid
∑: Sum of the amount of both positive and negative curren
+∑ : Sum of positive I (amount of current
- ∑ : Sum of negative I (amount of current
S∑ : Integration of S
Q ∑: Integration of Q
ymbol and Meanin
(k): RMS value of the harmonic voltage of order
: Voltage RMS value (Tot al va lu
(k): RMS value of the harmonic current of order k
urrent RMS value (Total value)
: Active power of the harmonic of order k, P: Active power (Tot al va lue
(k): Apparent power of the harmonic of order k,
: Total apparent power (Total value
: Reactive power of the harmonic of order k
: Total reactive power (Total value
(k): Power factor of the harmonic of order k,
Tot al po wer fa ctor (Tot al va lue
: Total phase a ngl
U (k): Phase angle of each harmonic voltage U (k) relative to the fundamental wave U (1
I (k) : Phase angle of each harmonic current I ( k) relative to the f undamental wave I (1
: Impedance of the load circuit for the harmonic of order k
: Resistance of the load circuit to the harmonic of order k when the resistance R
the inductance L, and the cap acitor C are connected in serie
Xs (k): Reactance of the load circuit t o the harmonic of order k when the resistance R
the inductance L, and the capacitor C are connected in serie
: Resistance of the load circuit to the harmonic of order k when the resistance R,
the inductance L, and the capacitor C are connected in paralle
Xp (k): Reactance of the load circuit to the harmonic of order k when the resistance R,
the inductance L, and the capacitor C are conne cted in paralle
hdf (k): Ratio of the harmonic current I (k) to I (1) or
hdf (k): Ratio of the active harmonic power P (k) to P (1) or
thd: Ratio of the total harmonic*3voltage to U (1) or
thd: Ratio of the total harmonic current to I (1) or
thd: Ratio of the total harmonic active power to P (1) or P
thf: Voltage telephone harmonic factor, Ithf: Current telephone harmonic factor
Applicable standard: IEC34-1 (1996)
tif: Voltage telephone infl uence factor, Itif: Current telephone infl uence facto
Applicable standard: IEEE Std 100 (19 96)
4
: harmonic voltage facto
nt
r
cf: harmonic current factor
atio of the sum of the squares of weighted harmonic components to the sum of th
uares of the orders of harmonic current
er in the range from 0 to the upper limit value for the measured order. The 0th order is
Symbol and Meanin
U1-U2: Phase angle of the fundamental wave (U2 (1)) of the voltage of the element
2 to the fundamental wave (U1 (1) ) of the voltage of the element 1
U1-U3: Phase angle of the fundamental wave (U3 (1)) of the voltage of the element
3 to U1 (1)
U1-I1: Phase angle of the fundamental wave ( I1 (1)) of the current of the element 1
to U1 (1
U2-I2: Phase angle of the fundamental wave (I2 (1)) of the current of the element
to U2 (1
U3-I3: Phase angle of the fundamental wave (I3 (1)) of the current of the element 3
to U3 (1)
hase angle Ø of the fundamental waves of U1 to I6 based on the rise of the Z terminal
nput in the motor evaluation function (option).
is the set value f or the number of poles in the motor evaluation function.
2
B
urrent (A)
ve power
Apparent power (VA
eactive power (var
r fact
*1: The tot al value is calculated by obt aining the fundamental wave (the 1st order ) and all harmoni
c omponents ( from the 2nd order to the upper limit value for the mea sured order). Also, t he DC component (dc )
e added to the equation
can
Delta Calculation (Option)
*1
urrent (A
ower (W
Waveform/Trend
aveform display Displays the waveforms of the voltage and current from elements 1 through 6, torque,
rend displa
Bar Graph/Vector (Option)
Ite
ar graph display Displays the size of each harmonic in a bar graph
ector display Displays the vector of the phase difference in the fundamental waves of voltage an
ymbol and Meanin
: RMS of the harmonic voltage of order 1,
(1): RMS of the harmonic current of order 1,
: Harmonic active power of order 1,
∑
: Harmonic apparent power of order 1,
(1): Harmonic reactive power of order 1,
: Harmonic power factor of order 1,
Delta Calculation Settin
differenc
TAR
DELTA->
TAR-> DELT
P3W->3V3
DELTA->
TAR
TAR-> DELT
differenc
W->3V
DELTA->STAR
TAR-> DELT
ecification
speed, AUX1, and AUX2.
Displays trends in numer ical data of the measurement functions in a sequential line
raph.
Number of measurement channels: Up to 16 parameters
Specification
current.
ymbol and Meanin
1: Differential voltage betwee n u1 and u2 determined
y computatio
1: Line voltage that is not measured but can be
omputed for a three-phase, three-wire system
1,
y a three-phase, three-wire (3V3A) system
∑ =
1,
or a three-phase, four-wire syste
=
I1: Di
computatio
I: Phase current that is not measured
I: Neutral line current
omputation for a three-phase, three-line (3V3A) syste
=
RMS of the voltage (Tot al va lue
: RMS of the current (Total value)
otal active power (Total value
: Total apparent power (Tot al va lue
: Total reactive power (Total value
Tot al po wer fa ctor (Tot al va lue
U2,ΔU3: Pha se voltage that can b e computed
1 +
U2,ΔU3: Line voltage that can be compute
1 +
ntial current between i1 and i2 determin
2 +
/3
U3
2 +
/3
nt
3: Phase power determined
P
ccurac
Voltage and Current
Accuracy (six-month)
Specification
ondition
erature: 23 ±5°C, Humidity: 30 to 75% RH, Input waveform: Sine wave,
ower factor
requency fi lter: 1 kHz or less when ON, after warm-up.
After zero level compensation or range value changed while wired. The unit of f within
the accuracy equation is kHz.
requenc
D
.1 Hz
10 Hz) f < 45 H
4
66 Hz < f
1 kHz < f
kHz < f
100 k Hz < f) 500 kHz
requenc
D
.1 Hz
10 Hz) f < 45 H
4
66 Hz < f
1 kHz < f
kHz < f 100
1
200 kHz < f
requency bandwidth 5 MHz (-3 dB, typical) 5 A input elemen
: 1, Common mode vol tage: 0 V, Crest factor: 3, Line fi lter: OF
tage
f < 10 H
z
f66
50 kH
100
kHz < f
uency bandwidth5 MHz (-3 dB, typica
nt
f < 10 H
z
1 kHz
50
kHz < f 200 kHz±{(0.00725 × f - 0.125)% of reading + 0.5 % of range
kHz < f
ccuracy
(Measurement reading error + Setting range error)
(0.05% of reading + 0.1% of range
0.1% of reading + 0.2% of r ange
(0.1% of reading + 0.1% of range)
0.1% of reading + 0.05% of range
0.1% of reading + 0.1% of range
(0.3% of reading + 0.1% of range
0.6% of reading + 0.2% of r ange
0.006 × f)% of reading + 0.5% of range
{(0.022 × f - 8)% of reading + 1% of range
ccuracy
(Measurement reading error + Setting range error)
(0.05% of reading + 0.1% of range
0.1% of reading + 0.2% of r ange
(0.1% of reading + 0.1% of range)
(0.1% of reading + 0.05 % of range
0.1% of reading + 0.1% of range)
Direct input of the 50 A input element
±( 0.2% of reading + 0.1% of range
0.3% of reading + 0.1% of range
50 mV, 100 mV, 200 mV rang e of the external current sensor input
(0.5% of reading + 0.1% of range)
Direct input of t he 50 A input element
±{( 0.1 × f + 0.2) % of reading + 0.1% of range}
(0.6% of reading + 0.2 % of range
Direct input of t he 50 A input element
±{( 0.1 × f + 0.2) % of reading + 0.1% of range}
Direct input of t he 50 A input element
±{( 0.05 ×
Direct input of the 5 A input elemen
±{(0.00725 × f - 0.125)% of reading + 0.5% of range
Direct input of the 5 A input elemen
±{(0.022 × f - 8)% of reading + 1% of range
External current sensor input of the 50 A input elemen
+ 5)% of reading + 0.5 % of range
16
Page 16

SpecificationsSpecifications
em
Sp
A
h)
Cond
s
S
F
y
)
C
)
0
0
z
H
)
< f
kHz
}
f
z
p
{(
}
{(
}
500
f
.
(
f
A
e
A
)
Voltage i
3
(15/range) + 0.5}% of range
ge
3
(1/range) }% of range + 10 mA
3
(10 m/ra nge) + 0.5 }% of range
3
(0.01/range ) + 0.5}% of range
3
(0.05/range) + 0.5} % of range
A
.
C
D
C
DC
fl
t
U
% of
U
2
U
2
ge
A
g
A
.
g
g
.
t
.
e
A
t
A
accuracies between 0
eference values.
.
eference values
.
em
Sp
n
I
(
)
λ
= 0
A
)
%
%
P
[(P
×
λ
I
t
U
3
{1/(1 + (f/fc)
4
P
U
3
{1/(1 + (f/fc)
ff f
g
t
U
g
U
g
L
)
Th
i
.
• S
e
•
• F
kHz
•
Sy
∑
calculatio
g
g.
T
C
e
Udc and Idc: 0 to ±110% of the mea
Urms and Irms: 1 to 110% of the measurement range
U
U
Power
%
ge i
.
H
f
freq
.
M
e
g
e
.
•
•
)
B
.
C
.
y
M
D
s
M
z
A
S
V
y
A
Q
Accuracy of apparent power + ( (1.0004 -
λ
2
) - (1 -
λ
2
)
A
±
λ λ
n
λ
=
e
m
.
A
Ø
±
=
m
O
y
M
5
s
Item
S
n
Cres
3
lid i
)
3
)
.
•
l
•
y
1
3
)
f
i
.
S
g
m
0.0001 to 99999.9999.
A
g
•
S
Q.
•
g.
ge
Moving
S
.
• Harmonic measureme
O
.
D
e
.
e
A
)
d
SingleE
ld.
C
g
.
•
•
e
• AUX1 and AUX2
Item
Sp
n
f
and
M
d
Reci
d
50 ms
1
200 ms
500 ms
1 s
2 s
5 s
1
20 s
2
12.5
500
5 H
2
1.25
z
0.5 H
0.15
z
A
y
±
z
g
.
•
y
•
•
Display
n
99999
z
,
Item
Sp
n
Mod
S
(
Specifications
Product Features Functions/Displays Applications Software Comparisons Explanations Specifications
Power
It
ccuracy (six-mont
ollowing value to the above accuracy for the external current sensor range
• Add the
Current DC accuracy: 50 μV
Power DC accuracy:
• Add the
ollowing value to the above accuracy for the direct cur rent input range.
50 A input element
Current DC accuracy: 1 m
Power DC accuracy: (1 mA/Direct current input range rating ) × 100% of range
5 A input element
Current DC accuracy: 10 μA
Power DC accuracy: (10 μA/Direct current input range rating ) × 100% of rang
• Accura cy of the waveform display data, Upk and Ipk
dd the following value to the above accuracy (reference value). The eff ective input r ange is within ±3 00% of
range (within ±6 00% for crest factor 6
nput: {1.5 ×
Direct curren t input ran
50 A input element ; 3 ×
5 A input element: {10 ×
External current sensor input range
50 mV to 20 0 mV range: {10 ×
500 mV to 10 V range: {10 ×
• Infl uence from a temperature change after zero level compensation or range change
dd the following value to the above accuracy
Voltage DC accuracy; 0.02% of range/°C
DC accuracy of the direct current input
50 A input element: 1 mA/°
5 A input element: 10 μA/°C
C accuracy of the external current sensor input: 50 μV/°
power accuracy: Infl uence from the voltage × Infl uence from the current
• In
uence from the self-heating caused by voltage inpu
• Add the foll owing value to the voltage and power accuracy.
AC input signal: 0.0000001 ×
DC input signal: 0.0000001 ×
U is the voltage reading (V).
The infl uence from the self-heating continues until the temperature of the input resistor decreases, even if the
voltage input changes to a small value.
• Infl uence from the self-heating caused by current input
dd the following value to the current and power accuracy of the 50 A element.
AC input signal: 0.00006 × I2% of readin
DC input signal: 0.00006 × I
dd the following value to the current and power accuracy of the 5 A element
AC input signal: 0.006 × I2% of readin
DC input signal: 0.006 × I% of reading + 0.004 × I
I is the curren t reading (A )
The infl uence from the self-heating continues until the tempera ture of the shunt resistor decreases, even if
he current input changes to a small value
• Addition to the accuracy according to the data update rat
dd 0.1% of reading when the data update rate is 50 ms and 0.05% of reading when 100 ms.
• Range of guaranteed accuracy by frequency, voltage, and curren
ll
If the voltage exceeds 750 V at 30 kHz to 100 k Hz, the voltage and power values are reference values
If the current exceeds 20 A at DC, 10 Hz to 45 Hz, or 400 Hz to 100 kHz, the current and power ac curacies are
r
• Accuracy f or crest fac tor 6: Same as the range accuracy o f crest fac tor 3 for twice the range
It
nfl uence of power factor
nfl uence of line fi lterWhen the cutoff frequency (fc) is 10 0 Hz to 100 kH z
ead/lag phase detection (D ( LEAD)/G (LAG) of the phase angle
mbol s for the reactive power Q
emperature coeffi cient±0.03% of reading/°C at 5 to 18°C or 28 to 40°
ecification
ition
requenc
D
.1 Hz
f < 10 Hz±( 0.3% of re ading + 0.2% of r ange)
1
Hz
f < 45 H
z f66 Hz±(0.1% of reading + 0.05% of range
45
66 Hz < f
50
1 kHz
100 k H
50 kHz <
)
100 k Hz < f 200 kH z ±{ (0.0105 × f - 0.25) % of reading + 1% of range}
200 kHz < f )500 kHz±{(0.0105 × f - 0.25) % of reading + 1% of range}
kHz < f
50 μV/External current sensor range rating) × 100% of r ange
% of reading + 0.004 × I
.1 Hz and 10 Hz are r
.
ecificatio
When
pparent power reading × 0.1% for the range from 45 to 66 Hz
For frequencies other than the above (Reference values
5 A input element and external sensor inputs:
Apparen t power reading × ( 0.1 + 0.05 × f (kHz))
Direct input of the 50 A input element:
Apparen t power reading × ( 0.1 + 0.3 × f ( kHz))
When 0 << 1
ower reading ×
(Power range /Apparent power reading) + {tan Ø × (Infl uence % when
Ø is the phase a ngle betwee n the voltage and current .
Voltage/curren
p to (fc/2) Hz: Add 2 × [1 -
ower
p to (fc /2) Hz: A dd 4 × [1 -
When the cuto
Volta
p to (fc /10) Hz: Add ( 20 × f/fc) % of readin
Power
p to (fc/10) Hz: Add (40 × f/ fc)% of readin
e phase lead and lag can be detected correctly when the voltage and current
nput signals are as follows
ine wav
50% or more of the measurement range (100% or more for crest factor 6)
requency: 20 Hz to 10
Phase angle: ±(5° to 175°)
The symbol s shows the lead /la
ame as the accuracy of the voltage and curren t
Accuracy
±(R eading error + Measurement range error
±(0.05% of reading + 0.1% of range
±(0.1% of reading + 0.2 % of range)
±(0.2% of reading + 0.1% of range)
±(0.3% of reading + 0.2 % of range)
50 mV, 100 mV, 200 mV range of the external current sensor input
±( 0.5% of reading + 0.2 % of range)
Direct input of the 50 A input element
±{(0.1 × f + 0.2)% of reading + 0.2% of r ange
±(0.7% of reading + 0.3 % of range)
ut of the 50 A input element
Direct in
±
0.3 × f - 9.5)% of reading + 0.3% of r ange
Direct input of the 50 A input element
±
0.09 × f + 11)% of reading + 1% of range
1 MHz±{(0.048 × f - 20) % of reading + 2% of range}
reading
% of reading + 0.0000001 ×
ower reading error %) + (Power range error %)
requency (fc) is 300 kHz and 1 MHz
e/curren
n
% of ran
% of readin
}] × 100 + ( 20 × f/300 k) % of reading
}] × 100 + (4 0 × f/300 k )% of reading
of each element, and “-” indicates leadin
= 0)}]
Effective input rang
mn and Imn: 10 to 110% of the measurement range
rmn and Irmn : 10 t o 110% of the measurement range
DC measurement: 0 to ±110
AC measurement: ±110% of the power range when the voltage and current
owever, the synchr onization source level s hall meet the inpu t signal level o
ax. display valu
Min. display valu
Measurement lo wer limit frequenc
ccuracy of apparent power
ccuracy of reactive power
ccuracy of power factor
ccuracy of pha se angle
ne-year accurac
140% of the voltage and current r ange ratin
Displays the following values relative t o the measurement ra nge
Urms, Uac, Irms, Iac: Up to 0.3% (up to 0.6% for crest factor 6)
Umn, Urmn, Imn, Irmn: Up to 2 % (up to 4% for cres t factor 6
elow that, zero suppress
urrent integration value q also depends on the current value
Data update rate: 50 ms 100 ms 20 0 ms 500 ms
easurement lower limit frequency: 45 Hz 25 Hz 12.5 Hz 5 Hz
ata update rate : 1 s 2 s 5 s 10 s 20
easurement lower limit frequenc y: 2.5 Hz 1.25 Hz 0.5 Hz 0.2 H z 0.1 H
oltage accuracy + Current accurac
[(
easurement range. Ø is the phase difference of voltage and curren t
[| Ø – {cos-1 ( /1.0002)| + sin-1{(infl uence of power factor of power when
easurement range.
ultiply the reading error of the six-month accuracy by a factor of 1.
ran
uency measurement. Each of the lower limits is doubled for crest factor 6
/1.0002) +|cosØ -cos {Ø+ si
0%/100 )}|] ±1 digit when voltage a nd current is at rated input of th
0%)/100}] deg ±1 digit, when voltage and current is a t the rated input of the
s 1 to 110%
-
(infl uence of power factor of power when
) × 100 % of range
nction
Measurement Functions and Conditions
t factor
Measurement periodInterval for determining the measurement function a nd performing calculations
Wiring
calin
veragin
ata update rat
Response tim
Hol
Zero level compensation/Null
Frequency Measurement
Number of measurement Select up to three frequencies of the voltage or current input to t he input elements
easurement metho
Measurement rangeData update rate Measuring range
ccurac
resolutio
Min. frequency resolution0.0001 H
Frequency measurement fi lter
Integration
e Select a mode from Manual, Standard, Continuous (repeat), Real Time C ontrol
pecificatio
00 (relative to the minimum va
or 6 (when inputting the rated values of the measurement range
The measurement period is set by the zer o crossing of the reference signa
(synchronization source) excluding watt hour WP and ampere hour q during DC mode
Harmonic displa
The measurement period is from the beginning of the data update interval to 1024
or 8192 points at the harmonic sampling frequency.
P2W (single-phase, tw o-wire) , 1P3W (single-phase, 3-wire) , 3P3W (3-phase,
-wire), 3P4W (3-phase, 4-wire), 3P3W (3V3A) (3-phase, 3-wire, 3-volt/3-amp
measurement
However, the number of available wiring systems varies depending on the number o
nstalled input elements
When inputting output from external current sensors, VT, or CT, set the current
sensor conversion ratio, VT ratio, CT ratio, and power coeffi cient in the range f ro
The average calculations below are per formed on the normal measurement
par ameters of voltage U, curren t I, power P, ap parent power
Power factor
Select exponential or moving averagin
Exponential avera
Select an at tenuation constant from 2 through 64.
Select 50 ms, 100 m s, 200 ms, 500 ms, 1 s, 2 s, 5 s, 10 s, or 20 s
t maximum, tw ice the data up date rate (only during numerical display
Holds the data display.
xecutes a single measurement during measurement ho
ompensates the zero level. Null compensation range: ±10% of range
Null can be set indi vidually for each o f the followin
Voltage and current of each input element
Rotation speed and torqu
ecificatio
or measurement. If the frequency option is installed, the frequencies of the voltages
00 ms
0 s
0.06% of reading ±0.1 mH
When the input signal level is 30 % or more of the measur ement range
(60% or more for crest factor 6). However:
The input si
The frequency is smaller or equal to 2 times of above lower frequenc
10 mA range set ting of 5 A input element
1 A range setting of 50 A input element
The 100 Hz frequency fi lter is ON at 0.15 Hz to 100 Hz, and the 1 kHz frequency fi lter
is ON at 100 Hz to 1 kHz.
Select OFF
ecificatio
tandard, and Real Time Control Continuous (Repeat).
and phase angle are determine d by calculating the average of P and S.
average
elect the number of averages from 8 through 64
nly exponential averaging is available
currents being input to all input elements can be measured.
procal metho
nal is 50% or more of the range
100 Hz or 1 kHz
nput
, and reactive power
nt
input signals
45 Hz
f
1 MHz
5 Hz
)
Hz
z
.5 Hz
Hz
0.25 Hz
Hz
kHz
f
200 kHz
100 k Hz
50 kH
z
f
20 kHz
10 kH z
)
5 kH
17
Page 17

SpecificationsSpecifications
I
Integra tion can be stopp
10000h00m00
C
r
If
/
,
:
q
: ±999999 MAh
MVAh
Q
:
h
A
y
Ti
g
)
em
Sp
M
All i
M
d
P
F
F
PLL
.
,
PLL
.
.
.
.
.
FFT d
h
s
Window functio
R
r
S
r
FFT
)
U
r
F
y
S
easured values
600 Hz
f*10241500th orde
der
2
r
600 Hz
f*256
100
der
der
H
.
FFT
)
U
r
F
e
Wind
h
U, I, P, Ø, ØU, Ø
s
0.5 H
Hz
f*81921500th orde
der
2
5
r
f
5
r
600 Hz
48500th orde
der
16
2
r
600 Hz
f*25632100
der
der
m
S
A
.
W
F
y
V
e
C
0.5
0
0
g
+
ge
0
g
0
g
g
+
ge
45 H
0
g
0
g
g
+
ge
6
0
0
g
g
+
e
440
z
0
0
g
g
+
ge
kHz
0
g
0
g
1
g
+
ge
e
0
1
e
ge
ge
2
ge
ON
e
facto
3
1
.
V
ge
C
μA
e
eleme
C
(
ge
/
(
o
.
g
f
.
.
g)
f
.
e
.
Item
Sp
n
l
p
App
M
I
C
Item
Sp
n
ge
1 V,
e
±110%
er
z
t
e
±
k
S
A
n
1
y
±
p
±
C
S
of
encoder for electric angle mea surement.
g
Item
S
n
e
±
F
2 H
MHz
Maxi
ge
±
k
y
±
z
e
Withi
etectio
L l
App
e
Auxiliary
t
)
Item
S
n
l
A
2
Inp
ype
Analog
A
1
ype
C
Range
5
V
ge
±
e fi
er
OFF/100
z
t
C
e
±
S
A
n
1
t
A
y
±
)
•
n
p
C
l
m
S
n
esolutio
t
ge
±
e
S
t
2
)
y
±
V
oad
100 k
C
e
±
em
Sp
n
Sig
EXT STOP
,
T
,
I
USY
D
,
I
l
V
n
em
Sp
n
User-de
on
f
.
s
f
.
Specifications
ntegration timer
ount ove
ccurac
mer accuracy ± 0.02% of readin
Harmonic Measurement
It
easured source
etho
requency range
source • Select the voltage or current of each inpu t element or the external clock
ata lengt
Anti-aliasing fi l t e r
Sample rate, window width, and upper limit of the measured order
Ite
ccuracyAdd the following accuracy to the normal measurement accuracy
n
1024
undamental frequenc
15 Hz to
600 Hz to 1200 Hz f*512
1200 Hz to 2
owever, the maximum measured order is 100 at a date update rate of 50 ms
8192
undamental frequency Sampling rat
1.5 Hz to 5Hzf*4096
5 Hz to 10 Hz
10 Hz to
600 Hz to 1200 Hz f*512
1200 Hz to 2
the integration time reaches the maximum integration time (10000 hours ),
or if the integr ation value reaches max
the elapsed time and integration value is saved and the operation is stopped.
*
WS: ±999999
W
±( Normal measurement accuracy + 0.02% of reading)
LL synchronization method (without external sampling clock function)
undamental frequency of the PLL source is in the range of 0.5 Hz to 2.6 kHz.
• If the /G6 option is selected, two PLL sources can be selected, and dual
harmonic measurement can be performed. If the /G5 option is selected
one
• Input level
15 V or more of range for voltage input.
50 mA or mor e of range for direct current input
200 mV or more of range for external current sensor input
50% or mo re of the measurement range rating for crest factor 3.
100% or more of the measurement range rating for crest factor 6
20 Hz to 1 kHz for the 1 A or 2 A range of the 50 A input element.
• The frequency fi l t e r ON condition is the same as with frequency measurement
1024 when the data update rate is 50 ms, 100 ms, or 200 ms
8192 when the data update rate is 500 m, 1 s, 2 s, 5 s, 10 s, or 20
ectangula
et using a line fi lte
points (data update rate 50 ms, 100 ms, 20 0 ms
points (data update rate 500 m, 1 s, 2 s, 5 s, 10 s, 20 s
z to 1.5
pecification
hen the line fi lter is OFF
requenc
Hz f < 10 Hz
10 Hz
f < 45 Hz
z f 66 Hz
6 Hz < f)440 Hz
Hz < f 1 kH
1 kHz < f
10
10 kHz < f100 kHz0.5% of rang
100 kHz < f
• When the line fi l ter is
Add the accuracy of the line fi lter to the accuracy of when the line fi lter is OFF
s
min display integration value
±999999 MWh
±999999 Mvar
(Option
ecification
nstalled elements
source is selectable
ampling rateWindow widthU, I, P, Ø, ØU, ØI orother m
*2048
f*102
oltag
.05% of reading
+ 0.25% of range
.05% of readin
+ 0.25% of range
.05% of readin
+ 0.25% of range
.05% of reading
+ 0.25% of range
.05% of reading
+ 0.25% of range
.5% of readin
+ 0.25% of range
260 kHz 1% of ran
pper limit of measured orde
55th order 100th orde
pper limit of measured orde
ow widt
00th order 100th orde
00th order 100th orde
55th order 100th orde
urrent Power
.05% of reading
+ 0.25% of range
.05% of readin
+ 0.25% of range
.05% of readin
+ 0.25% of range
.05% of readin
+ 0.25% of range
.05% of readin
+ 0.25% of range
.5% of readin
+ 0.25% of range
.5% of range
1% of ra n
th or
th or
r100th or
100th or
I or other measured value
r100th or
r100th or
100th or
*1
0.1% of readin
0.5% of ra n
0.1% of readin
0.5% of ra n
0.1% of readin
0.5% of ra n
0.1% of readin
0.5% of rang
0.1% of readin
0.5% of ra n
% of readin
0.5% of ra n
% of rang
% of ran
Motor Evaluation Function
Input termina
In
ut resistance
nput connector type Insulated BN
Analog Input ( Speed is input to the A terminal)
Ran
Input rang
Line fi l t
Continuous maximum allowable inpu
Maximum co mmon mode volt ag
ampling rate
Resolutio
Accurac
Tem
erature coef fi cient
Pulse Input
peed is input to the A ter minal if the direction is not detected. If the direction is detected, the A and B phases
the rotary encoder are input to the A and B te rminals. The Z phase is input to the Z terminal of the rotary
Input rang
requency measurement range
mum common mode volta
Accurac
Rise of the Z terminal input and elec tric angle measurement star t tim
D
n level H level: Approximately 2 V or more
Pulse width 500 ns or mor
Harmonic measurement option (/G5 or /G6) is required for electric angle meas urement.
Inpu
Input termina
ut t
Input resistance
Input connector t
Input ran
Lin
lt
Continuous maximum allowable inpu
ommon mode voltag
ampling rate
Resolutio
ccurac
Tem
erature coeffi cient±0.03% of range/°
Insulated BN
or range change.
ecificatio
Torque, speed ( A, B, Z)
roximately 1
ecificatio
2 V, 5 V, 10 V, 20 V
OFF, 100, 1 kH
42 Vpea
pproximately 200 kS /s
6-bit
(0.05% of reading + 0.05 % of range)
0.03% of range/°
(Option
pecificatio
UX1/AUX
pproximately 1 M
0 m, 100 m, 200 m, 500 m, 1 V, 2 V, 5 V, 10 V, 20
110 %
Hz/1 kH
42 V
pproximately 200 kS /s
6-bi
(0.05% of reading + 0.05 % of range
Add 20 μV /°C to the change in temperatur e after zero level compensat io
A Output and Remote Contro
DA Output
Ite
D/A conversion r
Output volta
Update rate
Outpu
Accurac
Minimum l
Temperature coef fi cient±0.05% of FS /°C
ontinuous maximum common mode voltag
Remote Control
It
nal
nput leve
pecificatio
n16-bi
5 V FS (max. approximately ±7.5 V) relative to each rated va lu
ame as the data update rate
0 channels (Output par ameter can be set for each channel
(Accuracy of each measurement function +0.1% of FS) FS=5
42 Vpeak or less
ecificatio
EXT START,
0 to 5
(Option)
pecificatio
12 Vp eak
z to 1
42 Vpea
(0.05 + f/500 )% of reading ±1 mH
n 500 ns
evel:
roximately 0.8 V or less
(Option)
EXT RESE
NTEG B
,EXT HOL
EXT SINGLE, EXT PRINT
All the items below apply to any of t he tables.
n the crest
• Wh
• When (power factor) =
• Power fi gures that exceed 2.6 kHz are reference values
• For the vol tage range, add the follow ing values.
Voltage accuracy: 25 m
Power accuracy: (25 mV/voltage range rating) × 100% of r an
• For the direc t current input r ange, add the following values.
5 A element
urrent accuracy: 50
Power accur acy: (5 0 μA/current range rating ) × 100% of rang
50 A
nt
urrent accuracy: 4 mA
Power accuracy:
• For the external current sensor range, add the following values.
Current accuracy: 2 mV
Power accuracy: (2 mV
n/500)% of reading to the n-th component of the voltage and curren t, and add (n/250)% of reading t
• Add
the n-th component of the power
• Accuracy when the crest factor is 6: Same as when the range is doubled for crest factor 3
uaranteed accuracy range by frequency and voltage/cur rent is the same a s the guaranteed range o
• The
normal measurement
• The adjacent orders of the input order may be affected by the side rope
• For n-th order component input when the PLL source frequency is 2 Hz or more, add ({ n/(m+1)}/50)% of (the
n-th order readin
(the n-th order reading) to the (n+m)th order and (n-m)th order of the power
o
18
• For n-th order component input when the PLL source frequency is less than 2 Hz, add ({n/(m+1)}/20)% of (th
n-th order reading) to the (n+m )th order and (n-m)th order of the voltage and curr ent, and add ({n/(m+1)}/10 )%
of (the n-th order reading) to the (n +m)th order and (n-m)th order of the power
r is set to
4 mA /current range rating) × 100% of r an
external current sensor range rating) × 100% of range
to the (n+m)th order and (n-m)th order of the voltage and current, and add ({n/(m+1)}/25)%
Calculation and Event Functio
It
fi ned functi
Effi ciency calculationUp to 4 effi ciencies can be dis played by set ting measurement parameter
User-defi ned event Event: Set conditions for measured values
ecificatio
Compute th e numerical dat a (up to 20 equations) with a combination o
measurement function symbols and operators
or the effi ciency equations.
The funct ions triggered by the event are A uto Print, Store, and DA Output.
Page 18

SpecificationsSpecifications
Comp
Item
s
N
s
+
+
S
U
r
C
s
0
C
E
SO
)
ModeAdd
Address
0 to 30
e
R
(
)
Item
s
1
RJ
fi
Conforms to
3
T
d
E
C
l
TCP/IP
Applicabl
s
F
Item
Sp
1
C
T
p
C
A
HS
Applicabl
ls
U
)
A
t
T
V
.
USB for Peripheral Devices
p
Item
Sp
2
U
)
Conforms to US
0
A
HS
LS (
)
A
s
M
1
1
1
M
5
t
Item
S
Therma
od
D
y
8
m
m
A
d
v
G
s
Item
S
W
e
App
t
T
H
)
000
less
n
I
s
S
t
Temp
C
Humidi
)
100 to
C
A
ge
9
C
y
5
z
A
e
48 to 63 H
Maxi
1
D
)
A
(W)
(H)
(D) (Excluding the handl
WeightA
)
B
p
b
.
y
m
S
n
l
digi
N
m
m
S
n
t
Peak
g
S
e
App
S/s
Ti
is
T
r
•
e
E
• Tri
de
S
during i
•
e
S
clock
•
e
S
•
l
S
The se
esolutio
%.
•
T
e
s
.
m
S
n
Store
S
)
S
S
)
N
measureme
channels
N
m
l)
S
3 ch550 ms
5 days
h
s
5
3 ch
E
C
a
50 ms
4 hours
6 ch
5
1 sec
h201
s
E
C
,
and
4
s
E
C
,
and
s
4
s
*O
ion
m
S
n
Save
S
d
Read
O
Item
S
n
C
e
e
I/O leve
TTL: Applicabl
e
M
e
r
Withi
Applicabl
e
Common
Item
S
n
C
e
r
Inp
l
L
W
t
em
Sp
n
F
ge
I
S
W
m
S
n
F
e
z
I
gg
gg
m
S
n
h
1 μs
Trigg
Within (
)
em
Sp
n
C
e
D
)
O
t
A
t
Specifications
Product Features Functions/Displays Applications Software Comparisons Explanations Specifications
Displa
Numerical Display
Ite
Display digit (display resolution)
umber of display itemsSelect 4, 8, 16, Matrix, ALL, Harmonic Single List, Harmonic Dual List, and Custo
Waveform Display
Ite
Display forma
ampling rat
me ax
rigge
ime axis zoom f unctionNot availabl
* Waveforms can be represented faithfully at up to approximately 100 kHz because the sampling rate i
approximately 2 MS/ s
Data Store Function
Ite
tore interval 50 ms (when waveform display is OFF) to 99 hours 59 minutes 59 seconds
torage time when using 1 GB memory ( Numerical Store and Waveform Display OFF
umber of
nt
3 c
6 c
6 ch
6 ch
ne piece of dat a is 4 bytes, and the limit to the number of store operations is 9999999 counts.
File Funct
Ite
pecificatio
ess than 60000: 5
60000 or more: 4 digits
pecificatio
-to-peak compression data
If the time axis is set so tha t there will be insuf fi cient samplin
lacking data is fi lled with the preceding sampling data.
roximately 2 M
Range from 0.05 ms to 2 s/div. However, 1/10 or less of the data update rate.
Trigger typ
gger mo
Trigger sourc
Trigger slop
Trigger Leve
TTL level if the trigger source is Ext Clk (external clo ck).
pecificatio
tore numerical data in media. ( Media: USB storag e device, max . 1 GB
umber of
easurement items (each channe
20 50 m
ach harmo nic component data of D
to the 100th order of voltage, current,
nd power
ach harmonic component data of D
to the 100th order of voltage, current
power
ach harmonic component data of D
to the 100th order of voltage, current
power
pecificatio
ave sett ing informatio n, waveform display d ata, numerical data, and scr een image
ata to media
Read the saved setting information from media.
ts
data, the part
dge type
elect OFF, Auto, and N ormal. Automatica lly turned OFF
ntegration.
elect voltage or current input to the inpu t element or external
elect Rise, Fall, or Rise/Fall
et the trigger level in the range of ±100% from the center of the
screen (from top to bottom of the screen) if the trigger source is
the voltage or current input to the input element.
t r
n is 0.1
torage interval Storable time (Approx.)
6 hours
sec 24 day
1 sec
100 m
86 days
0 hour
9 minute
Auxiliary I/
I/O Section for Master/Slave Synchronization Signals
onnector typ
l
easurement start delay tim
External Clock Input
onnector typ
ut leve
hen a synchronization source for normal measurement is used as the external clock for inpu
It
requency ran
nput waveform
hen a PLL source for harmonic measurement is used as the external clock for input
Ite
requency rang
nput waveform Square waveform with a duty ratio of 50%
er
Tri
Ite
Minimum pulse widt
er delay time
RGB Output (Option)
It
onnector typ
utput forma
pecificatio
BNC connector: Applicable to both master and salv
Within 15 sample intervals: Applica ble to maste
BNC connecto
TT
Same as the measurement range of frequency measurement.
Harmonic measurement (/G5 or /G6) option: 0.5 Hz to 2.6 kH
e to both master and slav
n 1 μs + 15 sample intervals:
pecificatio
ecificatio
quare waveform with a duty ratio of 50%
pecificatio
pecificatio
1 μs + 15 sample intervals
ecificatio
-sub 15- pin (receptacle
nalog RGB outpu
e to slav
uter Interface
GP-IB Interface
Compatible device
Electrical and mechanical specifi cations
Functional specifi cation
Protocol
ncoding
Clearing remote mod
Ethernet Interface
Number of communication port
Connector type
Electrical and mechanical speci
ransmission metho
ommunication protoco
e service
USB PC Interface
Number of ports
onnector
Electrical and mechanical s
pplicable transfer st andards
e protoco
pplicable system environmen
Number of ports
Connector type
Electrical and mechanical specifi cations
pplicable transfer standards
pplicable device
Power supply
lt-in Printer
Printing method
ot densit
Paper width 80 m
Effective recording width
uto Print A llows you to set t he interval time for printing to automatically print the measure
Specification
ational Instrument
• PCI-GPIB or PCI-GPIB
• PCIe-GPIB or PCIe-GPIB
• PCMCIA-GPIB and PCMCIA-GPIB+
• GPIB-USB-H
se an NI-488.2M Version 1.60 or later drive
onforms to the IEE Standard 488-1978 (JIS C 190 1-198 7)
SH1, AH1, T6, L4, SR1, RL1, PP0, DC1, DT1, C
onforms to the IEEE Standard 488.2-1992
(ASCII
ressable mode
emote mode can be cleared by pressing the LOCAL key
except during Local Lockout
Specification
-45 connector
cations
the IEEE802.
thernet 1000BA SE-T, 100 BAS E-T X, 10B ASE-T
TP server, DHCP, D NS, remote co ntrol ( VXI-11), SNTP, FTP client
ecification
ype B connector (receptacle)
ecifi cations
onforms to the USB Rev. 2.0
(High Speed) mode (480 Mbps ), FS (Full Speed) mode (12 Mbps)
SBTMC-USB488 (USB Test and Measurement Class Ver.1.0
he PC must run the J apanese or English version of Windows 7 (32-bit) ,
ista (32-bit), or XP (SP2 or later, 32-bit), and be equipped with a USB port
ecification
SB type A connector (receptacle
B Revision 2.
(High Speed) mode (480 Mbps ), FS (Full Speed) mode (12 Mbps),
Low Speed) mode (1.5 Mbp s
ass storage device conforming to USB Mass Storage Class Version 1.
09 and 104 keyboards conforming to USB HID Class Version 1.
ouse conforming to USB HID Class Version 1.1
V, 500 mA (for each port). However, devices that exceed the maximum curren
consumption of 100 mA canno t be connecte d to two ports simultaneously.
(Option)
pecification
l line dot meth
dots/m
2 mm
alues. The start/stop time can also be set.
eneral Specifi cation
arm-up tim
Operation environmen
Operating altitude 2
Installation locatio
torage environmen
Rated power supply voltage
llowable power supply voltage fl uctuation ran
Rated power supply frequenc
llowable power supply frequency fl uctuation rang
mum power consumption
imensions (see s ection 12.13
attery backu
roximately 30 minutes
emperature : 5 to 40°C
umidity: 20 to 80%RH (no condensation
m or
ndoor
erature: -25 to 60°
ty: 20 to 80%RH (no condensation
240 VA
0 to 264 VA
0/60 H
50 VA (wh en using a built-in print er)
pproximately 426 mm
other projections when the printer is stored in the cover)
pproximately 15 kg (including the main body, 6 input elements, and options
Setting informati on and built-in clock co ntinue to opera te with a lithium backup
attery
pecification
z
×177 mm
×459 mm
e and
19
Page 19

g
-01 50 A
-10 5 A
WT1801
-02 50 A 50 A
WT1802 -11 5 A 50 A
-20 5 A 5 A
-03 50 A 50 A 50 A
-12 5 A 50 A 50 A
-21 5 A 5 A 50 A
WT1803
-30 5 A 5 A 5 A
-04 50 A 50 A 50 A 50 A
-13 5 A 50 A 50 A 50 A
WT1804 -22 5 A 5 A 50 A 50 A
-31 5 A 5 A 5 A 50 A
-40 5 A 5 A 5 A 5 A
-05 50 A 50 A 50 A 50 A 50 A
-14 5 A 50 A 50 A 50 A 50 A
-23 5 A 5 A 50 A 50 A 50 A
-32 5 A 5 A 5 A 50 A 50 A
WT1805
-41 5 A 5 A 5 A 5 A 50 A
-50 5 A 5 A 5 A 5 A 5 A
-06 50 A 50 A 50 A 50 A 50 A 50 A
-15 5 A 50 A 50 A 50 A 50 A 50 A
-24 5 A 5 A 50 A 50 A 50 A 50 A
WT1806 -33 5 A 5 A 5 A 50 A 50 A 50 A
-42 5 A 5 A 5 A 5 A 50 A 50 A
-51 5 A 5 A 5 A 5 A 5 A 50 A
-60 5 A 5 A 5 A 5 A 5 A 5 A
-D UL/CSA standard
-F VDE standard
Power cord -R AS standard
-Q BS standard
-H GB standard
Languages -HE English menu
gg g
/EX1 External current sensor input for WT1801
p
/EX2 External current sensor input for WT1802
p
/EX3 External current sensor input for WT1803
p
/EX4 External current sensor input for WT1804
p
/EX5 External current sensor input for WT1805
p
/EX6 External current sensor input for WT1806
p
/B5 Built-in printer
p
Options /G5 Harmonic Measurement
/G6 Simltaneous Dual Harmonic Measurement
/DT Delta Computation
p
/FQ Add-on Frequency Measurement
qy
/V1 RGB output
p
/DA 20-channel DA Outputs
p
/MTR Motor Evaluation Function
/AUX Auxiliary Sensor Inputs
yp
ModelProduct
D
751535-E
Rack
kit
For EIA
751535-J
t
g
S
r
Product
D
O
y
589
ead set
s
1
58922
p
R
1
8929
L
lli
R
ir
8923
S
(
8931
(
set
d
C
r
B
r
366924 *
B
e
366925 *
BNC
cable
2 m1
959
S
p
H
1
58921
Fork
B
1
B9284LK
External sensor cable
C
1
B
FX
Pri
Th
ll)
10
*
Select one
Select one
Typical Voltage/Current Connections
Measurement using current sensor
Connection example
Unit whose current
is to be measured
CT1000
(B8200JQ)
* A burden resistor is required for the CT1000, CT200, CT60, and 751574.
g
Model and Suffix Codes
Model Suffix codes Description
Connector
Four load resistors*
(B8200JR)
connected inparallel
DC power supply
(±15 V, 1 A)
WT1800 Single input element
Power meter’s
current
input terminals
WT1800 2 input elements
WT1800 3 input elements
WT1800 4 input elements
WT1800 5 input elements
Measurement using clamp-on probe
Unit whose voltage
is to be measured
751552
Current output type
758917
Current measurement using direct input terminal
Unit whose voltage
is to be measured
758923
758931
g
Model/parts numbe
Due to the nature of this product, it is possible to touch its metal parts. Therefore, there is a risk of electric shock,
so the product must be used with caution.
* Use these products with low-voltage circuits (42 V or less).
g
Power meter’s current
direct input terminal
758921
Power meter’s voltage
input terminal
758921
Accessory (sold separately)
7
17 Test r
7
75
75
75
7
701
758924
9316
Small alligator-cli
arge a
gator-clip
afety terminal adapter
Safety terminal adapter
terminal adapter
afety mini-cli
onversion adapte
NC-BNC cabl
-BNC
nter roll pager
Rack Mount
4
4 Rack mounting ki
mounting
Measurement using voltage input terminal
Unit whose current
is to be measured
701959
758921
758922
758929
A set of 0.8 m long, red and black test lead
ated at 300 V and used in a pair
ated at 1000 V and used in a pa
spring-hold type) Two adapters to a set
screw-fastened type) Two adapters to a
1.5 mm hex Wrench is attache
anana-fork adapter, Two adapters to a set
ook type, Two in a set
NC-banana-jack (female) adapte
urrent sensor input connector, Length 0.5 m
ermal paper, 10 meters (1 ro
For JI
758917
758923
758931
escription
escription
Power meter’s
voltage
input terminal
rder Q’t
WT1800 6 input elements
Standard option
Additional option
* The numbers in the "Description" column have the following meanings.
50 A: 50 A input element, 5 A: 5 A input element
Elements are inserted in the order shown starting on the left side on the back.
* GPIB, Ethernet and USB communication come standard.
Note: Adding input elements after initial product delivery will require rework at the factory. Please
choose your models and configurations carefully, and inquire with your sales representative if you
have any questions
Standard accessories
Power cord, Rubber feet, current input protective cover, User’s manual, expanded user’s manual,
communication interface user’s manual, printer roll paper (provided only with /B5), connector
(provided only with /DA) Safety terminal adapter 758931 (provided two adapters in a set times
input element number)
CT1000 AC/DC Current sensor
Current: 1000 Apk
Basic Accuracy:
±(0.05% of rdg + 30 μA)
Measurement Range:
DC to 300 kHz
Input/output ratio: 1500: 1
751574 Current transducer
Current: 600 Apk
Basic Accuracy:
±(0.05% of rdg + 40 μA)
Measurement Range:
DC to 100 kHz
Input/output ratio: 1500: 1
CT200 AC/DC Current sensor CT60 AC/DC Current sensor
Current: 200 Apk
Basic Accuracy:
±(0.05% of rdg + 30 μA)
Measurement Range:
DC to 500 kHz
Input/output ratio: 1000: 1
g
Exterior WT1800
13 426 13
Current: 60 Apk
Basic Accuracy:
±(0.05% of rdg + 30 μA)
Measurement Range:
DC to 800 kHz
Input/output ratio: 600: 1
32 427 43
17720
unit: mm
32
Yokogawa's Approach to Preserving the Global Environment
O Yokogawa's electrical products are developed and produced in facilities that
have received ISO14001 approval.
O In order to protect the global environment, Yokogawa's electrical products are
designed in accordance with Yokogawa's Environmentally Friendly Product
Design Guidelines and Product Design Assessment Criteria.
YOKOGAWA METERS & INSTRUMENTS CORPORATION
Global Sales Dept.
/Phone: +81-42-534-1413 Facsimile: +81-42-534-1426
E-mail: tm@cs.jp.yokogawa.com
YOKOGAWA CORPORATION OF AMERICA Phone: (1)-770-253-7000, Fax: (1)-770-254-0928
YOKOGAWA EUROPE B.V. Phone: (31)-88-4641000, Fax: (31)-88-4641111
YOKOGAWA ENGINEERING ASIA PTE. LTD. Phone: (65)-62419933, Fax: (65)-62412606
NOTICE
O Before operating the product, read the user's manual thoroughly for proper
and safe operation.
O If this product is for use with a system requiring safeguards that directly
involve personnel safety, please contact the Yokogawa sales offices.
Subject to change without notice.
[Ed : 01/b] Copyright ©2011
Printed in Japan, 102(KP)
 Loading...