

Page 1
Recognized with eight technical
Emmy awards and one Oscar for
outstanding contributions to the
television industry, Tektronix
world class core competencies
have enabled it to design and
deliver the most comprehensive
solutions in the industry.
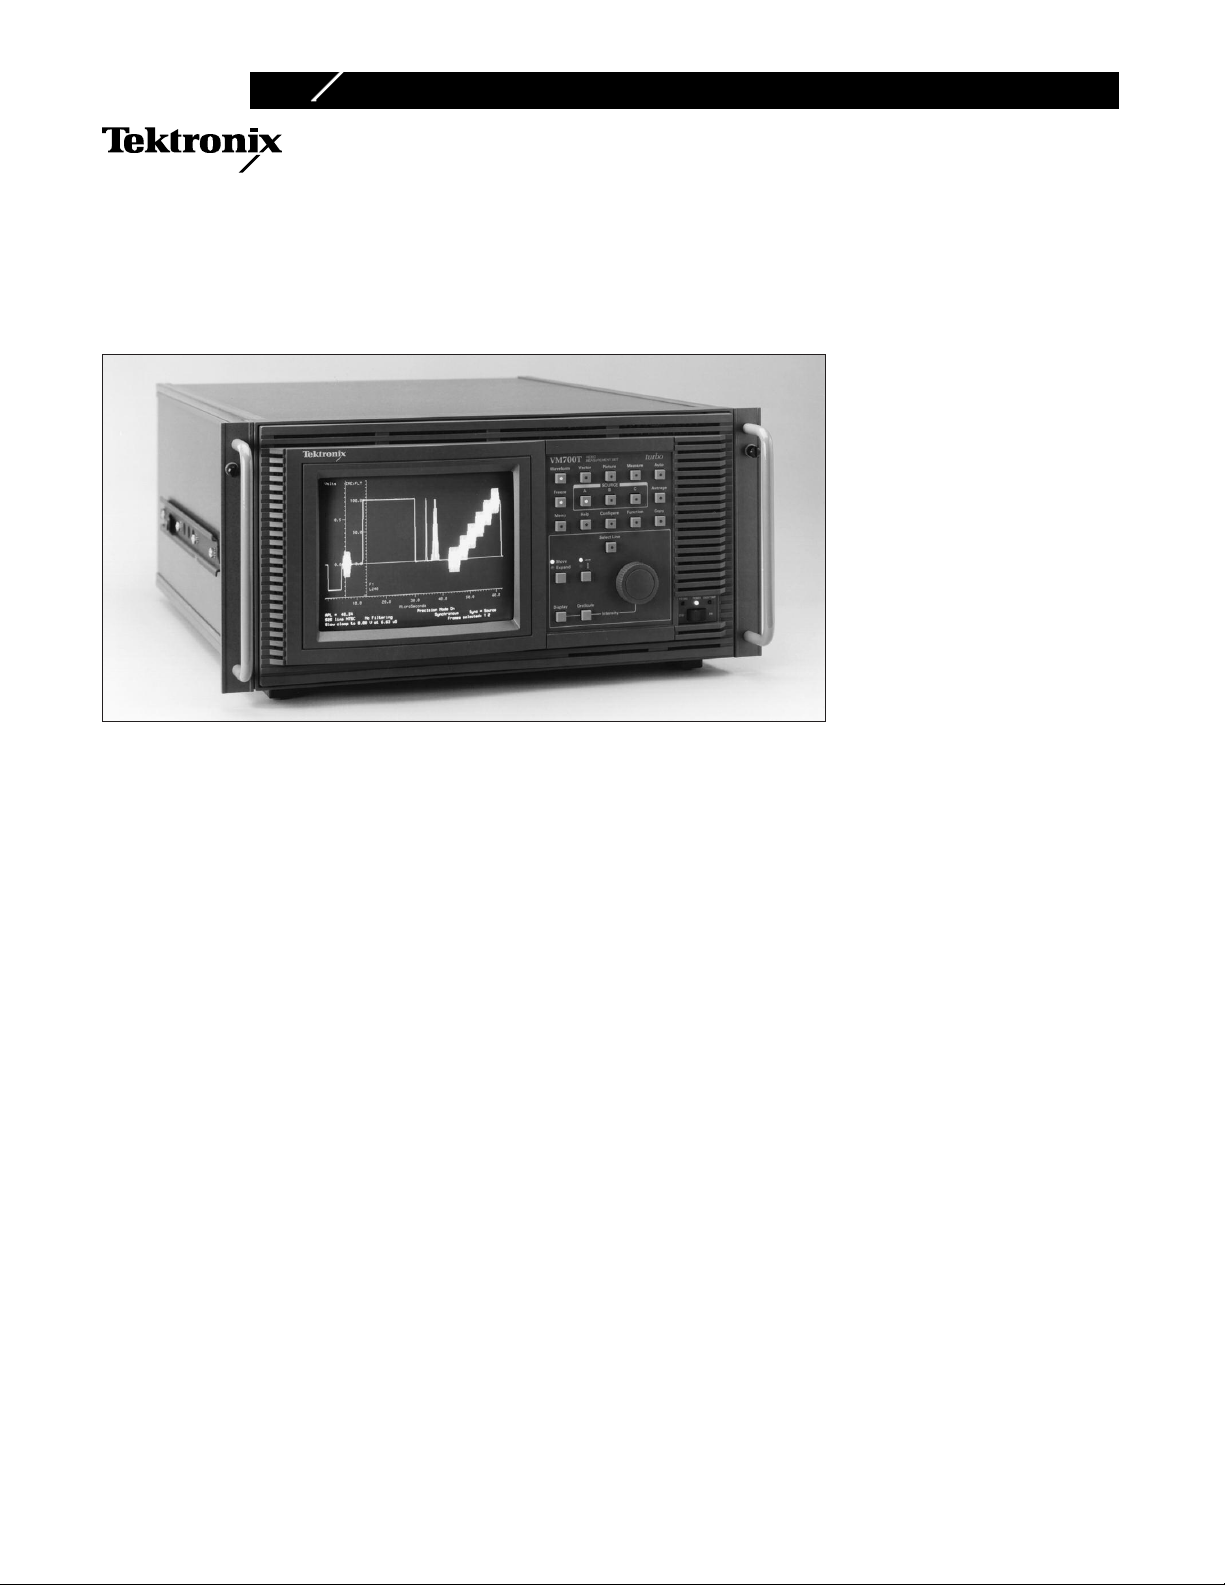
The VM700T is a product of this
core competency. Recognized as
the defacto industry standard
that keeps pace with evolving
customer needs, the VM700T is a
total solution for your baseband
video and audio
measurement needs. Features
such as an extremely fast and
fully automatic measurement
mode as well as full manual oper-
ovides the first time user
pr
ation
as well as the seasoned professional
an unequaled value for their test
and measur
Automatic video measur
The VM700T Auto mode makes
standard video transmitter mea-
ements quickly and automati
sur
cally, including those specified
in RS-250C/EIA-250C, NTC-7
and RS170A. Both vertical interval
and full field measur
be made and compar
1
Option 40 audio measurement package.
Copyright © 1996, T
1
monitoring and
ement investment.
ement set
ements can
ed with
onix, Inc. All rights reserved.
ektr
VM700T (turbo)
Video Measurement Set
Option 01
NTSC Video Measurements
Many capabilities in one instrument
– Digital waveform monitor
– Digital vectorscope
– Picture Display
– Group delay and frequency
response
– Noise measurement set
– Automatic measurement set
Auto mode
– Unattended monitoring of NTSC
video signals from studios, STLs,
Earth Stations, and transmitters
– User-specified limits
Measure mode provides graphic
display of measurements
user-defined limits. A dual limit
verification system is employed
to generate a caution or alarm
message when either limit is violated. Reports can be generated
and printed automatically at
operator scheduled times or
triggered from a conditional event.
Graphic displays of measurements
Measur
real time graphic displays of
measurement results automatically. Vertical interval or full
field measurements including
noise spectrum, group delay,
K-factor, differential gain and
differential phase are presented
as clever
interactive digital displays. Such
displays ar
extremely fast measurement
update rates (up to 30 times a
second) ar
instant feedback of critical
adjustments and analysis of signal variations. User definable
limits ar
into each graphic display and
can be used to trigger
ment report or a user definable
macro function. Such a function
can, for example, dial out through
e mode pr
, easy to understand
e visually integrated
ovides virtual
e indispensable when
e required to provide
a measur
– ICPM
– K factor
– Differential gain and phase
– Chrominance to luminance delay
– Noise spectrum
– Group delay with sin x/x
– Color bars
– Relative to reference on most
measurements
– Configurable for all standard
test signals
Award winning user interface
State-of-the-art architecture
Extremely fast update rate
Parallel and serial printer ports
Three input channels
Channel difference modes
nal VGA display port
Exter
Fully documented r
operation
-
e
dcopy for analysis and
Har
documentation
emote contr
ol
Page 2

a modem to report measurement
results or control a signal router.
A relative to reference mode
llows normalizing to a signal
a
source or eliminate signal path
errors from the desired
measurement. Up to 2 video
eferences can be stored in
r
NVRAM. Additionally, after
downloading to a PC through the
VM700T FTP driver, the video
reference can be uploaded to
nother VM700T for reuse. A
a
running averaging mode can be
used to reduce the effect of noise.
When additional measurement
data is required a user can custom
configure measurement parameters
and report format.
A powerful Test Signal search
capability quickly and automatically locates and identifies valid
test signals required for a selected
measurement, eliminating the
annoying and time consuming
task of manually locating
test signals.
Digital waveform monitor/
vectorscope
The VM700T Waveform mode
application provides real time
graphics displays of the video
signal allowing many additional
measurements to be made manually. Easy to use measurement
cursors are available to measure
time, frequency and amplitude
parameters of a video signal. These
cursors allow a very quick and
precise location of the 10%, 50%
and 90% points on any transition. Cursor mode also employs
an automatic calculation in the
wave shape in the center of the
display. The parameters calculated
are sine peak-to-peak amplitude,
frequency, and offset from blanking
level. This is very useful for
equency response measur
fr
ements
with the Multiburst signal.
The waveform display can be
expanded ar
ound any point both
vertically and horizontally. Since
the data is digitized, the display
emains bright and easy to ready
r
at all expansion factors. The
scales automatically expand with
the waveform, so all units are
ect as displayed. A channel
r
cor
difference mode (A-B, A-C, B-A,
B-C, C-A, and C-B) is also pr
ovided.
A screen memory selection
enables Envelope mode, which
is useful for looking at teletext,
Jitter, or other changes over time.
Vector mode provides the normal
vectorscope display. The vectors
ay be rotated or expanded,
m
with the rotation angle and gain
values displayed numerically on
the screen.
A unique “Find ColorBars”
feature searches all video for
ColorBars and displays the
ectors if found. The vectors can
v
be referenced to either the
selected channel’s burst or the
burst of one of the other two
channels or continuous subcarrier.
The phase difference between
the selected channel and the
reference is always displayed.
Select Line in both Waveform
and Vector modes can be used
to quickly specify any line for
display or automatic measurement
if it is the proper signal.
Picture mode
The signal source can be quickly
verified using the picture display.
Additionally, a “bright-up” line
select mode allows a user to
select any video line for use in
Measure mode or for viewing in
Waveform or Vector mode.
User programmable functions
Function mode is an extremely
powerful feature that allows a
user to store a sequence of user
operations as a macro function
for later “playback.”
For example, a set of measure
ments (complete with hardcopy
commands) to be made on a
transmitter demodulator video
output, could be stored as a
function labeled “DEMOD.” The
function “playback” could then
be initiated manually, remotely
or completely automatically as a
user specified timed event. Function
files can be stor
ed as a text file
on a PC for editing, copying or
uploading to another VM700T.
Other function capabilities
include controlling of external
serial devices such as video/audio
routers, switchers, signal
generators, telephone modems
and many other devices which
t RS232 communications.
suppor
Hardcopy
All information on the screen
may be printed in high resolution
graphics on printers supporting
ostScript
P
®
Hewlett-Packard
,
®
LaserJet™, DeskJet™, and
ThinkJet™, or 24-pin Epson
®
graphics via the Centronics
ompatible parallel port or
c
tandard RS-232C interface.
s
Automatic measurement results
n text format can be printed on
i
most ASCII printers using the
parallel or serial ports.
Remote Operation
The VM700T has a powerful and
fully documented remote control
language. The VM700T can thus
be operated from a remote terminal
via RS-232C to monitor unattended
transmission systems. In addition,
all files can be uploaded to a
main computer, and downloaded
to other VM700Ts. Two different
protocols are supported: FTP
(File Transfer Protocol) and
TELNET
. The user can also select
a “no protocol” mode of the
RS-232C interface when dealing
with low baud rates. However,
file transfers can only take place
with FTP.
Specifications
The performance requirements
cited in this section are valid
only within the following
environmental limits:
emperatur
T
e range of 0 to 50
degrees Celsius, with a
minimum warm-up time of 20
minutes. The following tables
list each measurement and its
formance requirement.
per
The range specifies the extremes
between which a measurement
can be made.
All measurement accuracies
specified ar
e valid only with
nominal input signals of 1 volt
6 dB) with an unweighted
±
pk-pk (
signal-t-noise ratio of at least
60 dB on the incoming signal
and a termination accuracy of
onix PN 011-
0.025% (T
±
ektr
0102-01 or equivalent).
2
Page 3
E
0.5
0.0
Volts
S
ound-In-Sync On
S
ound-In-Sync On
P
recision Mode Off
P
recision Mode Off
F2
L16
F2
L17
MicroSeconds
20.0 40.0 60.0 80.0 100.0 120.0
Sync = SourceSync = Source
1
00.0
5
0.0
0.0
IRE:FLT
F
rames selected:
F
rames selected:
11 22
525 line NTSC525 line NTSC Synchronous Synchronous
S
low clamp to 0.00 V at 6.72 uS
S
low clamp to 0.00 V at 6.72 uS
No Filtering No Filtering
A
PL = 56.3%
A
PL = 56.3%
Center
L
eft
Center
L
eft
Lock
L
eft
Lock
L
eft
Center
R
ight
Center
R
ight
Lock
R
ight
Lock
R
ight
Reset
C
ursors
Reset
C
ursors
Reset
D
iffs
Reset
D
iffs
Cursors
S
tay On
Cursors
S
tay On
Sinewave at middle of screen is too small or frequency too low for measurement. Sinewave at middle of screen is too small or frequency too low for measurement.
0.0
-0.2
Volts
Sound-In-Sync On Sound-In-Sync On Precision Mode OffPrecision Mode Off
T
ime from L to R: 4.664 MicroSeconds
T
ime from L to R: 4.664 MicroSeconds
Frequency (1/T): 0.214389 MHzFrequency (1/T): 0.214389 MHz
F2
L17
M
icroSeconds
-2.0 -1.0 0.0 1.0 2.0 3.0 4.0 5.0 6.0
Sync = SourceSync = Source
0.0
-
20.0
-40.0
IRE:FLT
V
ertical delta: -0.243 Volts
V
ertical delta: -0.243 Volts
F
rames selected:
F
rames selected:
11 22
525 line NTSC525 line NTSC Synchronous Synchronous
S
low clamp to 0.00 V at 6.72 uS
S
low clamp to 0.00 V at 6.72 uS
No Filtering No Filtering
APL = 52.7% APL = 52.7%
Field
T
oggle
Field
T
oggle
Find
Colorbars
Find
Colorbars
Vector
Line
Vector
Line
Field 1
Line 17
Field 1
Line 17
Field 1
Line 18
Field 1
Line 18
R-Y
B-Y
75%
100%
I
Q
-I
-Q
M
g
R
Yl
G
Cy
B
Setup 7.5%
APL = 42.4% APL = 42.4%
System LineSystem Line
Angle (deg) 0.0Angle (deg) 0.0
Gain x 1.178Gain x 1.178
1.425 dB1.425 dB
L 20 F2L 20 F2
B
urst from source
B
urst from source
5
25 line NTSC
5
25 line NTSC
R-Y
B-Y
75%
100%
I
Q
-I
-Q
M
g
R
Yl
G
Cy
B
Setup 7.5%
Auto
Scan
Auto
Scan
ExitExitManual
Steps 6
Manual
Steps 6
RefPacket
6.7uSec
RefPacket
6.7uSec
1st Step
10.7uSec
1st Step
10.7uSec
Last Step
25.8uSec
Last Step
25.8uSec
Measure
Cycles 6
Measure
Cycles 6
Measurement Location for the DGDP MeasurementMeasurement Location for the DGDP Measurement
u secu sec
5.0 10.0 15.0 20.0 25.0 30.0 35.0 40.0 45.0 50.0 55.0 60.05.0 10.0 15.0 20.0 25.0 30.0 35.0 40.0 45.0 50.0 55.0 60.0
Field = 1 Line = 16 FCC Composite
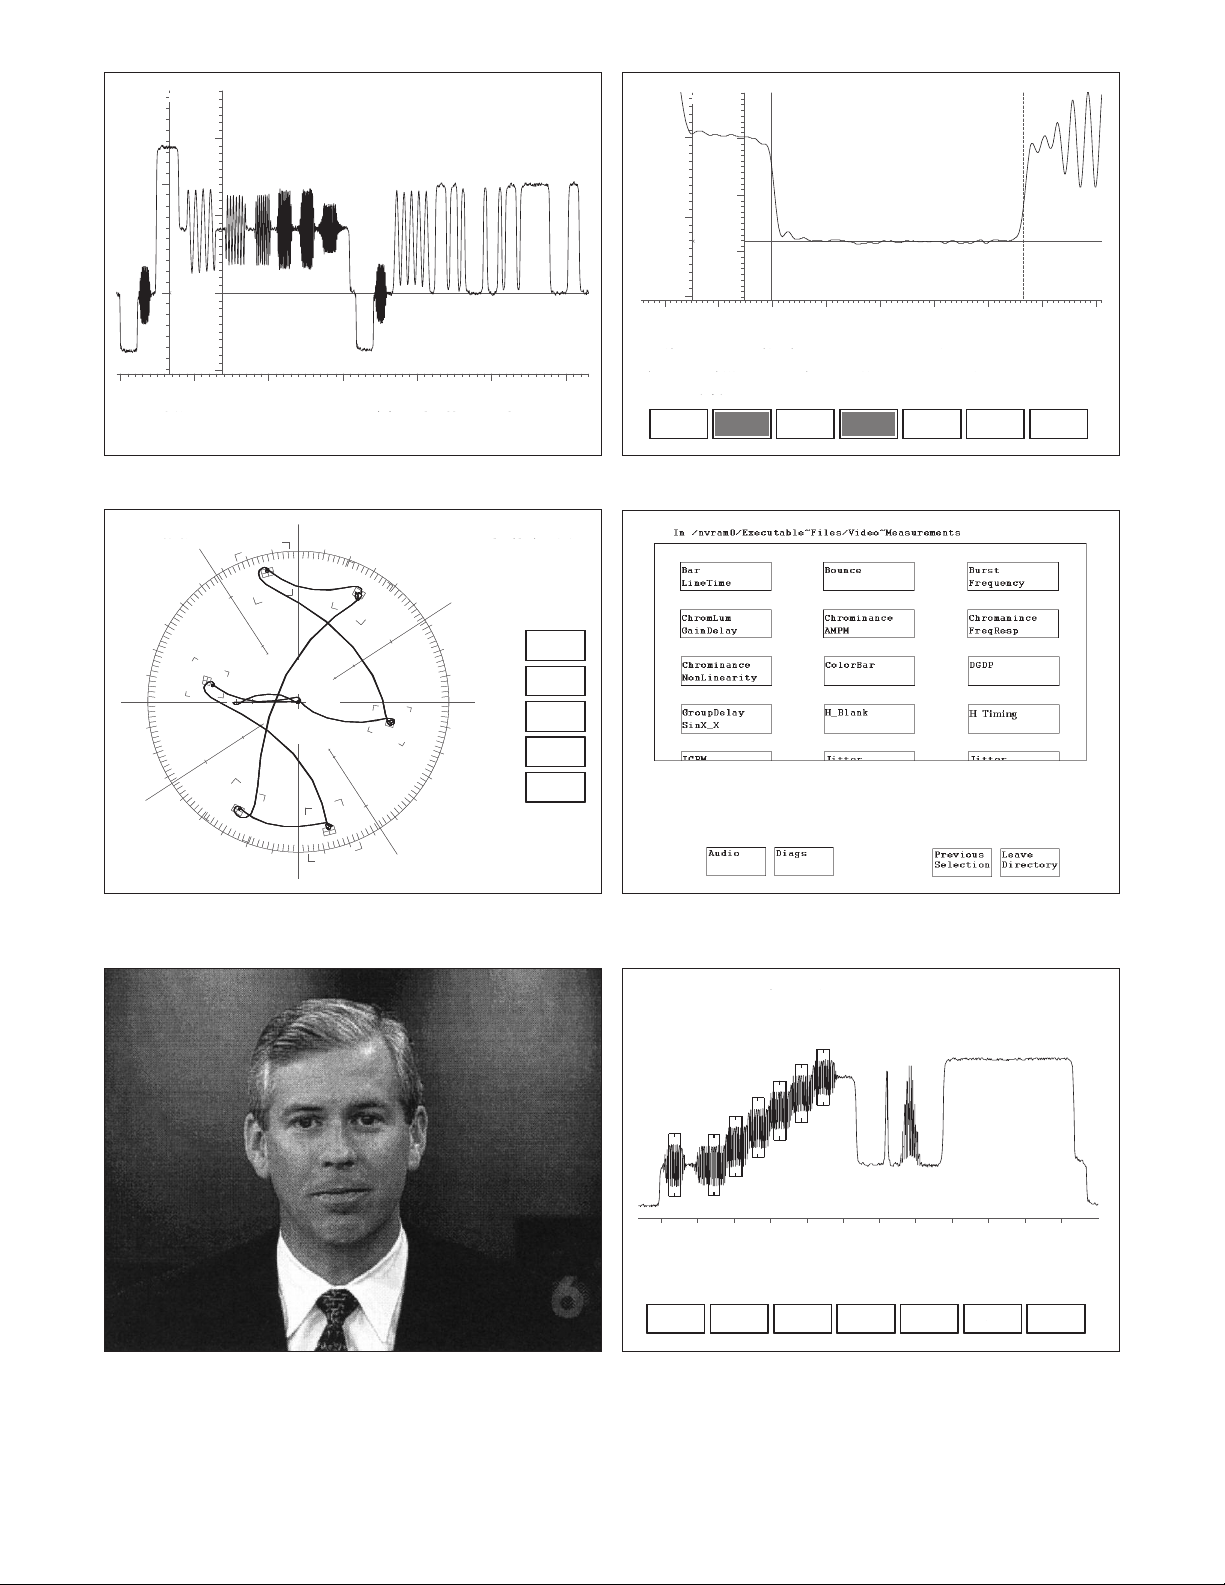
B
ertical interval test signals can be seen very clearly for additional analysis of the signal.
V
These can be printed as support documentation for automatic measurement results.
C
In Vector Mode, the VM700T becomes a digital vectorscope with an electronic graticule. A
“Color Bar Search’’ feature makes it easy to quickly display a line containing a color bar
test signal.
ven a single horizontal synchronization pulse can be displayed at a high intensity.
E
F
Main Measure Mode display of available measurements.
D
Picture Mode display. (Video courtesy of KOIN-TV, Portland, Oregon.) Measure Mode DGDP special position acquisition feature.
G
3
Page 4
,2
0.0
10.0
20.0
30.0
40.0
5
0.0
60.0
70.0
80.0
90.0
100.0
1
10.0
120.0
0.0
10.0
20.0
30.0
40.0
5
0.0
60.0
70.0
80.0
90.0
100.0
1
10.0
120.0
Bar & LineTime (NTSC) Wfm --> Bar & LineTime (NTSC) Wfm -->
100 % = Bar Level100 % = Bar Level
FCC Composite
3
2 -> 32
B
ar Level = 93.5 IRE
(Ref. b1)
Bar Level = 93.5 IRE
(Ref. Back Porch)
Sync Level = 35.8 IRE
Sync to Bar Top = 129.3 IRE
Sync/Bar Ratio = 95.8 %
(100% = 4/10)
LineTime Dist. = 1.8 %
(
Rec. 567)
Bar Tilt = 1.2 %
(Rec. 569)
Bar Width = 18.0 u sec
Field = 1 Line = 16 Field = 1 Line = 16
A
verage
A
verage
Average
Num 32
Average
Num 32
Relative
to Ref
Relative
to Ref
ReferenceReference AcquireAcquire VITS
Search
VITS
Search
RescaleRescale
Chroma Gain (%)Chroma Gain (%)
Chroma Delay (n sec)Chroma Delay (n sec)
80.0
85.0
90.0
95.0
100.0
105.0
110.0
115.0
-60.0 -40.0 -20.0 0.0 20.0 40.0 60.0
80.0
85.0
90.0
95.0
100.0
105.0
110.0
115.0
-60.0 -40.0 -20.0 0.0 20.0 40.0 60.0
Chrom/Lum Gain Delay (NTSC) Wfm --> Chrom/Lum Gain Delay (NTSC) Wfm --> FCC Composite
32 -> 32
Field = 1 Line = 16 Field = 1 Line = 16
Average Average
Chroma Gain = 85.3 %
Chroma Delay = 9.3 n sec
MEASURE MODE
1
BAR LINE TIME
bsolute Relative
easurement Range Mode Mode
M
ar Level 50 to 200 IRE ±0.5% ±0.2%
B
ync Level 20 to 80 IRE ±0.5% ±0.2%
S
ync to Bar Top 70 to 280 IRE ±0.5% ±0.2%
S
Sync/Bar Ratio 10% to 125% ±0.5% ±0.2%
00% nominal
1
Bar Tilt (Rec 569) 0 to 20% ±0.2% ±0.1%
Line Time Distortion 0 to 20% ±0.2% ±0.1%
Rec 567)
(
Bar Width 10 µS to 30 µS ±100 nS NA
H
A
ccuracy Accuracy
A
HROMINANCE TO LUMINANCE GAIN AND DELAY
C
bsolute Relative
Measurement Range Mode Mode
A
ccuracy Accuracy
A
Chrominance to Luminance Delay ±300 ns ±5 ns ±1.0 ns
Chrominance to Luminance Gain Ratio 0 to 160% ±1.0% ±0.1%
I
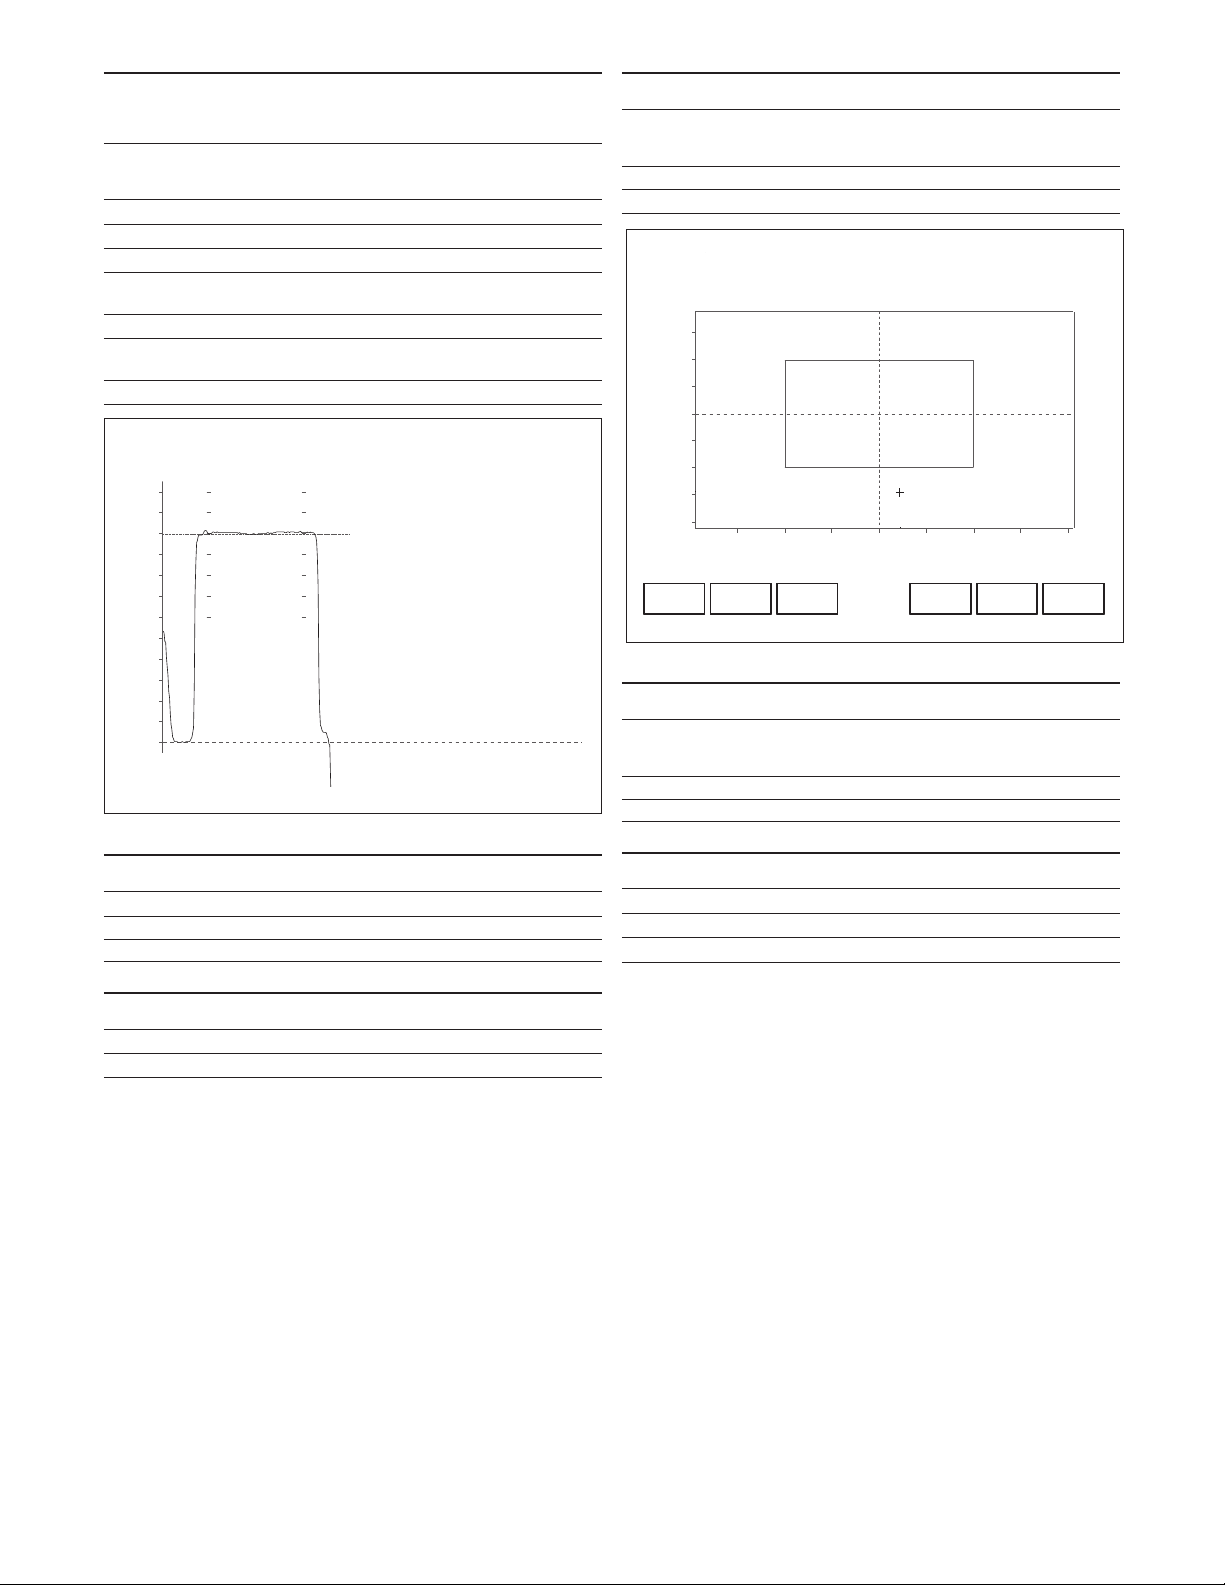
hrominance to Luminance Gain and Delay measurement.
C
Bar Line Time measurement.
BOUNCE
Measurement Range Accuracy
Peak Deviation 0 to 50% ±1%
Settling Time 0 to 10 sec ±100 msec
BURST FREQUENCY
Measurement Range Relative Mode Accuracy
Burst Frequency Error ±100 Hz ±0.5 Hz
1
All accuracies for measur
2
All accuracies for measurements with relative to reference mode assume an average of 256 was used to
eate the r
cr
3
Requires a reference signal.
4
ence.
efer
3
ements with averaging capabilities assume the default average of 32.
CHROMINANCE FREQUENCY RESPONSE
Measurement Range Mode Mode
Reference Amplitude 0 to 100 IRE ±1% ±0.5%
Frequency Response 0 to 100 IRE ±1% ±0.5%
Absolute Relative
Accuracy Accuracy
CHROMINANCE NOISE
Measurement Range Absolute Mode Accuracy
AM Noise –20 to –80 dB ±1 dB (–20 to –60 dB)
PM Noise –20 to –70 dB ±1 dB (–20 to –60 dB)
Page 5
MEASURE MODE (continued)
Chrominance Amplitude Error (%) Ref = 40 IRE PacketChrominance Amplitude Error (%) Ref = 40 IRE Packet
Chrominance Phase Error (deg) Ref = 40 IRE PacketChrominance Phase Error (deg) Ref = 40 IRE Packet
Chrominance Luminance Intermodulation (% of 714 mV)Chrominance Luminance Intermodulation (% of 714 mV)
20 IRE20 IRE 40 IRE40 IRE 80 IRE80 IRE
-0.06
-0.04
-0.02
0.00
0.02
0.04
-0.06
-0.04
-0.02
0.00
0.02
0.04
-0.04
-0.02
0.00
-0.04
-0.02
0.00
0.00
0.05
0.10
0.00
0.05
0.10
C
hrominance Nonlinearity (NTSC) Wfm -->
C
hrominance Nonlinearity (NTSC) Wfm --> NTC-7 Combination
2
56 -> 256
Field = 1 Line = 16 Field = 1 Line = 16
A
verage
A
verage
-0.0 0.0 -0.1
0
.0
0
.0
-
0.0
0.1 0.0 0.0
Luminance Level (IRE)Luminance Level (IRE)
Chrominance Level (IRE)Chrominance Level (IRE)
Chrominance Phase (deg)Chrominance Phase (deg)
Gray Gray Yellow Yellow Cyan Cyan Green Green MagentaMagenta Red Red Blue Blue Black Black
0.0
50.0
100.0
0.0
50.0
100.0
0.0
50.0
100.0
0.0
50.0
100.0
0.0
100.0
200.0
300.0
400.0
0.0
100.0
200.0
300.0
400.0
ColorBar (NTSC) Wfm --> ColorBar (NTSC) Wfm --> FCC Color Bar
32 -> 32
Field = 2 Line = 20 Field = 2 Line = 20
Average Average
94.0 68.0 55.8 48.7 37.0 29.5 16.9 9.3
0.4 49.9 73.6 68.6 70.1 77.3 53.9 0.5
------- 168.3 283.6 241.1 60.0 103.5 346.1 -------
Differential Gain (%)Differential Gain (%)
Differential Phase (deg)Differential Phase (deg)
1st. 1st. 2nd. 2nd. 3rd. 3rd. 4th. 4th. 5th.5th. 6th. 6th.
-15.0
-10.0
-5.0
0.0
5.0
-15.0
-10.0
-5.0
0.0
5.0
-0.4
-0.2
-0.0
0.2
0.4
-0.4
-0.2
-0.0
0.2
0.4
DG DP (NTSC) Wfm --> DG DP (NTSC) Wfm --> FCC Composite
3
2 -> 32
Field = 1 Line = 16 Field = 1 Line = 16
A
verage
A
verage
0.00 -0.61 -2.40 -5.40 -8.14 -12.18
min =-12.18 max = 0.00 p-p/max = 12.18
0.00 0.29 -0.11 -0.21 0.23 0.21
min = -0.21 max = 0.29 pk-pk = 0.50
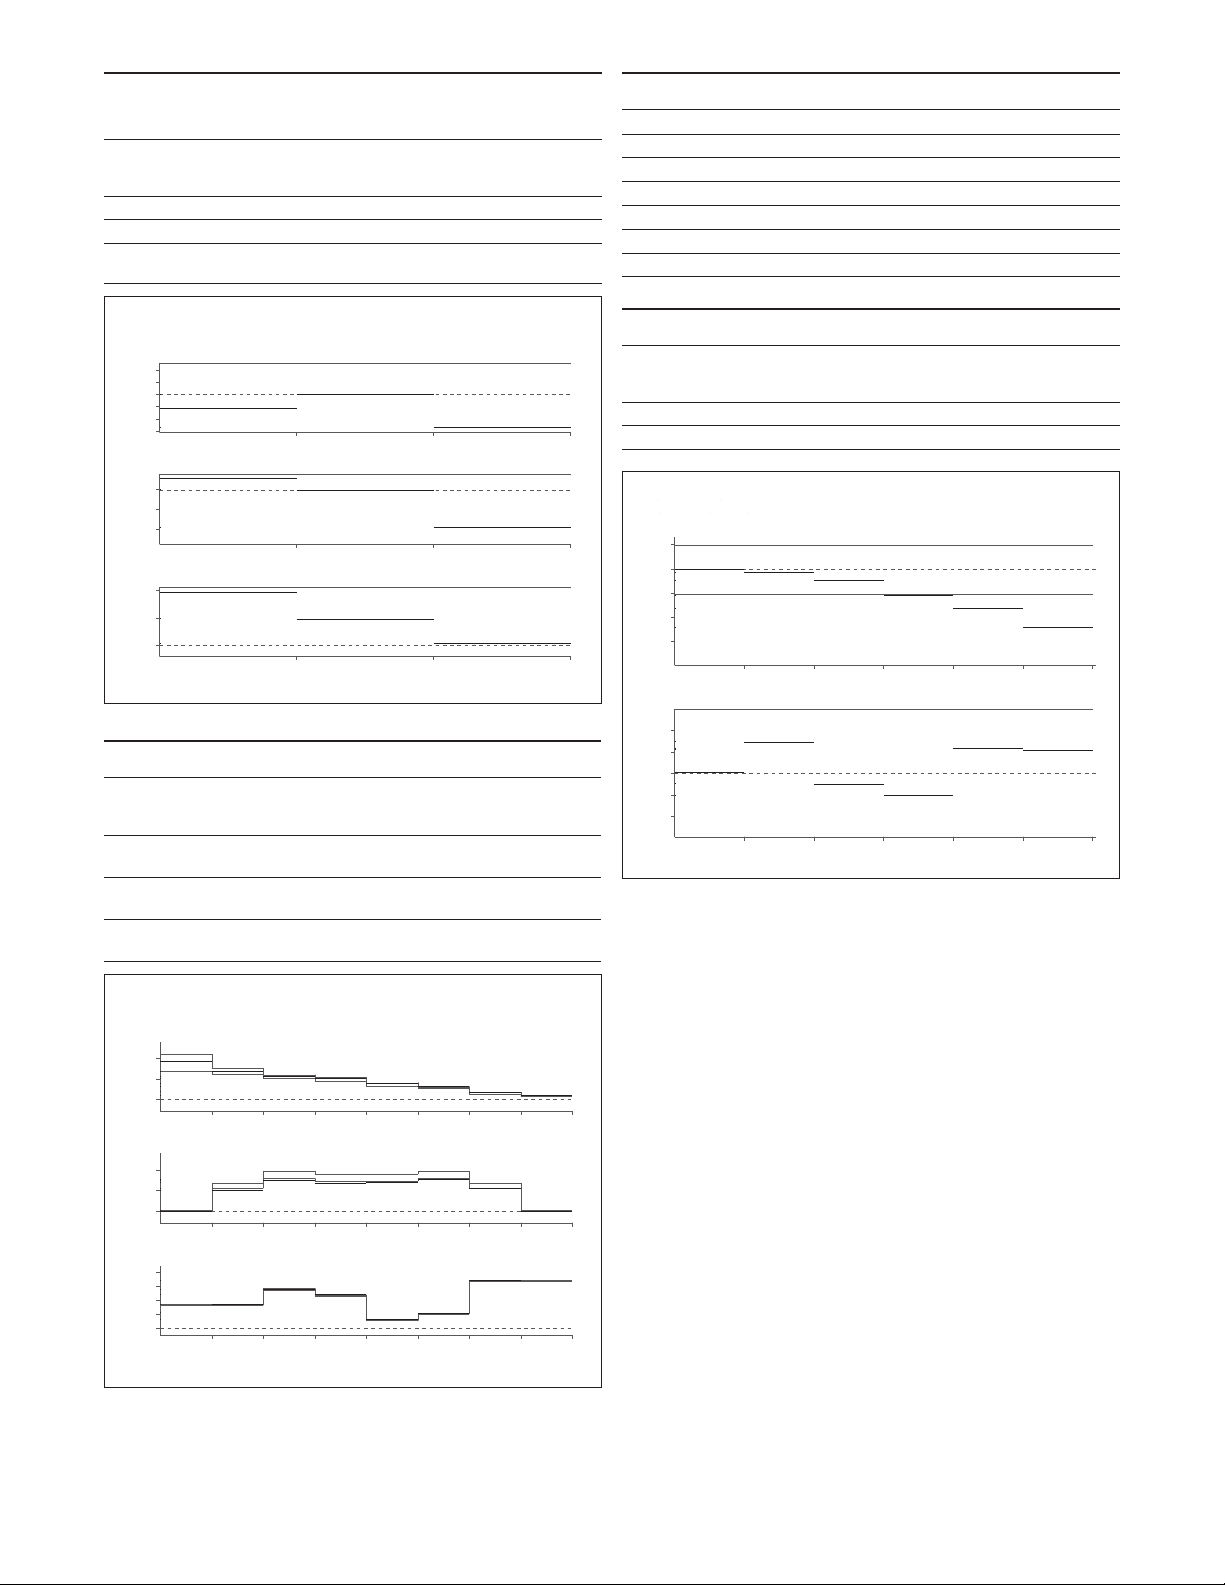
CHROMINANCE NON-LINEARITY
easurement Range Mode Mode
M
hrominance Amplitude 0 to 100% ±0.4% ±0.2%
C
hrominance Phase 0 to 360 deg ±1 deg ±0.2 deg
C
hrominance to Luminance –50 to +50% ±0.2% ±0.2%
C
ntermodulation
I
4
bsolute Relative
A
Accuracy Accuracy
J
MPTE COLOR BARS NOMINAL VALUES
S
olor LUM (mV) Chroma P-P (mV) Phase (degrees)
C
ellow 494.6 444.2 167.1
Y
yan 400.4 630.1 283.4
C
reen 345.9 588.5 240.8
G
agenta 256.7 588.5 60.8
M
Red 202.2 630.1 103.4
Blue 108.1 444.2 347.1
IFFERENTIAL GAIN AND PHASE
D
bsolute Relative
Measurement Range Mode Mode
A
Accuracy Accuracy
Differential Gain 0 to 100% ±0.3% ±0.03%
Differential Phase 0 to 360 deg ±0.3 deg ±0.03 deg
Chrominance Non-Linearity measurement.
COLOR BAR
Measurement Range Mode Mode
Luminance Level 0 to 100 IRE ±0.5 IRE ±0.2%
(0 to 714.3 mV)
Chrominance Level 0 to 100 IRE ±1.0% of ±0.2%
(excluding gray and black) (0 to 714.3 mV) nominal
Chrominance Phase ±180 deg of ±0.5 deg of ±0.1 deg
nominal nominal
K
Color Bar measurement.
4
4
Accuracies for chrominance non-linearity amplitude and phase measurements assume an average of 256.
Absolute Relative
Accuracy Accuracy
Differential Gain and Phase measurement.
5
Page 6

MEASURE MODE (continued)
Amplitude (dB)Amplitude (dB)
Group Delay (n sec)Group Delay (n sec)
(Ref. at 0.20 MHz)(Ref. at 0.20 MHz)
0.00.0 1.01.0 2.02.0 3.03.0 4.04.0 4.64.6
-0.20
-0.15
-0.10
-0.05
0.00
0.05
0.10
0.15
-0.20
-0.15
-0.10
-0.05
0.00
0.05
0.10
0.15
0.00.0 1.01.0 2.02.0 3.03.0 4.04.0 4.64.6
-10.0
-8.0
-6.0
-4.0
-2.0
0.0
2.0
4.0
6.0
8.0
-10.0
-8.0
-6.0
-4.0
-2.0
0.0
2.0
4.0
6.0
8.0
Group Delay & Gain (NTSC) Wfm -->Group Delay & Gain (NTSC) Wfm --> Sin X/X
32 -> 32
Field = 2 Line = 15Field = 2 Line = 15
AverageAverage
H
Timing Measurement RS-170A (NTSC)
H
Timing Measurement RS-170A (NTSC)
32 -> 32
5
.36 u sec
9
.0 cycles
37.3 IRE
3
5.7 IRE
4.64 u sec 1.78
u
sec
9.61 u sec
1
89 n sec
2
12 n sec
Field = 2 Line = 15 Field = 2 Line = 15
Average Average
Average
Num 32
Average
Num 32
Max HoldMax Hold Extract
VCR.HD.SW
Extract
VCR.HD.SW
Meas.Line
Start 20
Meas.Line
Start 20
Meas.Line
End 250
Meas.Line
End 250
RescaleRescale
LineLine
(n sec)(n sec)
-15.0 -10.0 -5.0 0.0 5.0 10.0 15.0-15.0 -10.0 -5.0 0.0 5.0 10.0 15.0
FF
FF
II
II
EE
EE
LL
LL
DD
DD
11
22
1111
525525
H Sync Jitter in a Frame (NTSC) H Sync Jitter in a Frame (NTSC)
32 -> 32
Jitter (Line 20 to 250) -- 4 n sec p-p
Average Average
FREQUENCY RESPONSE AND GROUP DELAY
bsolute Relative
easurement Range Mode Mode
M
requency Response ±40 dB ±1.0 dB ±0.3 dB
F
roup Delay ±1.0 µs ±20 ns ±5 ns
G
M
A
Accuracy Accuracy
ORIZONTAL TIMING
H
easurement Range Absolute Mode Accuracy
M
urst Level 10 to 80 IRE ±0.5%
B
orizontal Sync Rise and Fall Time 80 ns to 1 µs ±10 ns
H
orizontal Sync Width 3 to 7 µs ±10 ns
H
urst Width 6 to 13 cycles ±0.1 cycles (FCC)
B
ync to Burst Start (RS-170A) 4 to 10 µs ±150 ns
S
ync to Burst End (FCC) 4 to 10 µs ±25 ns
S
Front Porch 0.1 to 3.5 µs ±10 ns (FCC)
0.5 cycles (RS-170A)
±
10 ns (RS-170A)
±
Sync to Setup 8.8 to 13.0 µs ±10 ns
Breezeway (FCC) 0.1 to 5 µs ±25 ns
Sync Level 20 to 80 IRE ±0.5%
N
Frequency Response and Group Delay measurement using Sin X/X.
HORIZONTAL BLANKING
Measurement Range Absolute Mode Accuracy
Blanking Start 0.1 to 4.2 µs ±50 ns
Blanking End 6.8 to 12.2 µs ±50 ns
Blanking Width 6.9 to 16.4 µs ±50 ns
6
Horizontal Timing measurement.
INCIDENTAL CARRIER PHASE MODULATION
Measurement Range Accuracy
ICPM (requires zero Carrier Pulse 0 to 90 deg ±1.0 deg
and the quadrature output of the
demodulator on Channel C)
JITTER
ement
Measur
Jitter (2 Field) ±20 µs ±10 ns
Jitter Long Time ±20 µs ±10 ns
O
H_Jitter.
Range Absolute Mode Accuracy
Page 7

MEASURE MODE (continued)
2T Pulse K Factor (NTSC) Wfm --> 2T Pulse K Factor (NTSC) Wfm --> FCC Composite
32 -> 32
EIA-2T 5.0% K-2T = 2.3 % KF
K-PB = -3.1 % KF
PB Ratio = 89.1 %
H
AD = 258.3 n sec
F
ield = 1 Line = 16
F
ield = 1 Line = 16
Average Average
107.3
91.6
84.0
86.0
88.0
90.0
92.0
94.0
96.0
98.0
100.0
102.0
104.0
106.0
108.0
110.0
112.0
107.3
91.6
84.0
86.0
88.0
90.0
92.0
94.0
96.0
98.0
100.0
102.0
104.0
106.0
108.0
110.0
112.0
IREIRE
Level Meter (NTSC) Wfm --> Level Meter (NTSC) Wfm --> FCC Composite
32 -> 32
#000
Level(b-a)
= 94.4 IRE
Field = 1 Line = 16 Field = 1 Line = 16
Average Average
(a) at 42.0 u sec, (b) at 53.2 u sec(a) at 42.0 u sec, (b) at 53.2 u sec
L
uminance Non Linearity (%)
L
uminance Non Linearity (%)
1st. 1st. 2nd. 2nd. 3rd. 3rd. 4th. 4th. 5th.5th.
8
0.0
82.0
8
4.0
86.0
88.0
90.0
9
2.0
9
4.0
9
6.0
98.0
100.0
1
02.0
104.0
106.0
8
0.0
82.0
8
4.0
86.0
88.0
90.0
9
2.0
9
4.0
9
6.0
98.0
100.0
1
02.0
104.0
106.0
L
uminance Non Linearity (NTSC) Wfm -->
L
uminance Non Linearity (NTSC) Wfm --> FCC Composite
32 -> 32
100.0 97.3 93.6 89.7 85.7
p
k-pk = 14.3
Field = 1 Line = 16 Field = 1 Line = 16
Average Average
(dB)(dB)
(MHz)(MHz)
-7.5
-7.0
-6.5
-6.0
-5.5
-5.0
-4.5
-4.0
-3.5
-3.0
-2.5
-2.0
-1.5
-1.0
-0.5
0.0
0.5
1.0
1.5
-7.5
-7.0
-6.5
-6.0
-5.5
-5.0
-4.5
-4.0
-3.5
-3.0
-2.5
-2.0
-1.5
-1.0
-0.5
0.0
0.5
1.0
1.5
Multi Burst (NTSC) Wfm --> Multi Burst (NTSC) Wfm --> FCC Multi Burst
32 -> 32
-0.68
0.5
-2.28
1.3
-2.09
2.0
-1.15
3.0
-1.05
3.6
-5.48
4.1 1.25 3.58
60 % of 94.5 IREAmplitude (0 dB = Flag)
Field = 2 Line = 16 Field = 2 Line = 16
Average Average
K-FACTOR
easurement Range Absolute Mode Accuracy
M
T Pulse K-Factor 0 to 10% Kf ±0.3%
2
PB 10 to 5% KPB ±0.3%
K
ulse to Bar Ratio 10 to 125% ±0.7%
P
ulse Half Amplitude Duration (HAD) 100 to 500 ns ±5 ns
P
P
INE FREQUENCY
L
easurement Range Accuracy
M
ine Frequency ±3% ±0.1%
L
ield Frequency ±3% ±0.1%
F
LUMINANCE NON-LINEARITY
bsolute Relative
easurement Range Mode Mode
M
uminance Non-Linearity 0 to 100% ±0.4% ±0.2%
L
R
A
ccuracy Accuracy
A
K-factor measurement.
LEVEL METER
Measurement Range Accuracy
Level Meter 0 to 1.4 V ±3.5 mV
Q
Level Meter measurement.
5
Total Harmonic Distortion on packets must be ≤46 dB.
Luminance Non-Linearity measurement.
MULTIBURST
5
Absolute Relative
Measurement Range Mode Mode
Accuracy Accuracy
Reference Flag or Packet Amplitude 30 to 130 IRE ±1% NA
Other Packets –40 to +6 dB ±0.1 dB ±0.03 dB
S
Multiburst measurement.
7
Page 8

MEASURE MODE (continued)
Amplitude (0 dB = 714 mV p-p)Amplitude (0 dB = 714 mV p-p)
(MHz)(MHz)
-85.0
-80.0
-75.0
-70.0
-65.0
-60.0
-55.0
-50.0
-45.0
-40.0
-35.0
-30.0
-25.0
-20.0
-15.0
-10.0
-5.0
0.0
5.0
10.0
1.0 2.0 3.0 4.0 5.0
-85.0
-80.0
-75.0
-70.0
-65.0
-60.0
-55.0
-50.0
-45.0
-40.0
-35.0
-30.0
-25.0
-20.0
-15.0
-10.0
-5.0
0.0
5.0
10.0
1.0 2.0 3.0 4.0 5.0
Noise Spectrum (NTSC) Wfm --> Noise Spectrum (NTSC) Wfm --> Pedestal
3
2 -> 32
Cursor1 0.81 MHz(+-28 kHz Band) -52.3 dB p-p
Cursor2 4.50 MHz(3.69 MHz above) -60.7 dB p-p ( -8.4 dB Diff)
Noise Area in Cursors -50.2 dB rms
Noise Level = -49.1 dB rms
Band width 10kHz to Full Band width 10kHz to Full
Field = 2 Line = 13 Field = 2 Line = 13
A
verage
A
verage
Source
Only
Source
Only
Source and
Chan. A
Source and
Chan. A
Source and
Chan. B
Source and
Chan. B
180
170
160
150
140
130
120
1
10
100
90
80
7
0
60
50
40
30
20
10
0
-10
-20
-30
-40
-50
-60
-70
-80
-90
-100
-110
-120
-130
-140
-150
-160
-170
S
CH Phase Measurement
S
CH Phase Measurement
5
25 line NTSC
5
25 line NTSC
C
h B SCH -62.1 deg
Ch A SCH -61.0 deg
R
el Burst 24.3 deg
Rel Sync -17 nsec
Color Frame Derived
from Channel A SCH
Sync Relative Timing (nsec)
1000-1000 100-100 10-10 0
Burst Relative Phase (deg)
180-180 30-30 10-10 3-3 0
Average Off
Field 1Field 1 Field 2Field 2
VITS Identification (NTSC) VITS Identification (NTSC)
Line 15 --> Chroma Freq Resp Line 15 --> Chroma Freq Resp
>> Line 16 --> NTC-7 Combination Line 16 --> NTC-7 Combination >>
Line 17 --> FCC Multi Burst Line 17 --> FCC Multi Burst
>>
Line 18 --> FCC Composite Line 18 --> FCC Composite
>>
Line 19 --> VIRS Line 19 --> VIRS
>>
Line 20 --> Pedestal Line 20 --> Pedestal
>>
Line 15 --> Sin X/X Line 15 --> Sin X/X
>> Line 16 --> Pedestal Line 16 --> Pedestal >>
Line 17 --> Luminance Bar Line 17 --> Luminance Bar
>>
Line 18 --> NTC-7 Composite Line 18 --> NTC-7 Composite
>>
Line 19 --> VIRS Line 19 --> VIRS
>>
Line 20 --> Pedestal Line 20 --> Pedestal
>>
Field = 1 Line = 16 NTC-7 Combination
Full DisplayFull Display
F1F1
F2F
2
F3F
3
F4F
4
Vertical Blanking (NTSC) Vertical Blanking (NTSC)
Field = 1 Line = 16 Field = 1 Line = 16 Field = 1 Line = 16 Field = 1 Line = 16
Blanking
Display
Blanking
Display
Equalizer
Pulse
Equalizer
Pulse
Serration
Pulse
Serration
Pulse
V Sync
Display
V Sync
Display
Average
Num 32
Average
Num 32
RescaleRescale
Timing DisplayTiming Display
Vertical Blanking (NTSC) Vertical Blanking (NTSC)
4.78 u sec
4.58 u sec
193 n sec
208 n sec
Average Off Average Off
NOISE SPECTRUM
easurement Range Absolute Mode Accuracy
M
nweighted Signal-to-Noise Ratio –20 to –80 dB ±0.4 dB
U
5 MHz Low Pass) (–20 to –60 dB)
(
Weighted Signal-to-Noise Ratio –20 to –80 dB ±1.0 dB
(5 MHz Low Pass and (–20 to –0 dB)
nified Weighting) ±2.0 dB
U
1.0 dB
±
(–60 to –70 dB)
–60 to –70 dB)
(
V
T
Noise Spectrum measurement.
SCH PHASE
Measurement Range Absolute Mode Accuracy
SCH Phase ±90 deg ±5 deg
Sync Timing ±1 µS ±10 nS
Burst Timing ±180 deg ±5 deg
VITS ID display.
VERTICAL BLANKING
Measurement Range Absolute Mode Accuracy
Equalizing Pulse Width 80 ns to 1 µs ±10 ns
Serration Pulse Width 80 ns to 1 µs ±10 ns
W
Vertical Blanking display.
U
SCH Phase measur
8
ement.
X
Vertical Blanking Serration Pulse measurement.
Page 9

AUTO MODE
RS-170A HORIZONTAL BLANKING INTERVAL TIMING MEASUREMENTS
easurement Range Accuracy Test Signal
M
Color Burst Width 6 to 13 cycles ±0.1 cycles Horizontal Blanking
Front Porch Duration 0.5 to 2 µs ±20 ns Horizontal Blanking
Horizontal Blanking Width 6 to 30 µs ±50 ns Horizontal Blanking
orizontal Sync Rise 80 to 120 ns –10 to +30 ns Horizontal Blanking
H
Time and Fall Time 120 to 300 ns ±20 ns
Horizontal Sync Width 1 to 8 µs ±10 ns Horizontal Blanking
SCH Phase ±90 deg ±5 deg Horizontal Blanking
Sync to Setup 5 to 18 µs ±20 ns Horizontal Blanking
ync to Start of Burst 4 to 8 µs ±140 ns Horizontal Blanking
S
RS-170A VERTICAL BLANKING INTERVAL
Measurement Range Accuracy Test Signal
qualizing Pulse Width 1 to 20 µs ±10 ns Vertical Blanking
E
erration Width 1 to 20 µs ±10 ns Vertical Blanking
S
ertical Blanking Width 19 to 29 lines –0.1 lines to Vertical Blanking
V
FCC HORIZONTAL BLANKING INTERVAL TIMING MEASUREMENTS
Measurement Range Accuracy Test Signal
Breezeway Width 0.2 to 3.5 µs ±25 ns Horizontal Blanking
Color Burst Width 6 to 13 cycles ±0.1 cycles Horizontal Blanking
Front Porch Duration 0.5 to 2 µs ±10 ns Horizontal Blanking
Horizontal Blanking Width 6 to 30 µs ±10 ns Horizontal Blanking
Horizontal Sync Rise Time 80 to 120 ns –10 to +30 ns Horizontal Blanking
and Fall Time 120 to 300 ns ±20 ns
Horizontal Sync Width 1 to 8 µs ±10 ns Horizontal Blanking
Sync to Setup 5 to 18 µs ±20 ns Horizontal Blanking
Sync to End of Burst 6 to 15 µs ±20 ns Horizontal Blanking
FCC VERTICAL BLANKING INTERVAL TIMING MEASUREMENTS
ement Range Accuracy Test Signal
Measur
Equalizing Pulse Width 25 to 100% ±0.3% Vertical Blanking
Serration Width 1 to 20 µs ±10 ns Vertical Blanking
tical Blanking Width 19 to 29 lines –0.1 lines to Vertical Blanking
er
V
AMPLITUDE AND PHASE MEASUREMENTS
ement Range Accuracy Test Signal
Measur
verage Pictur
A
Bar Top 0 to 90% of ±0.1% FCC/NTC-7 Composite
Bar Amplitude 0 to 200 IRE ±0.3 IRE FCC/NTC-7 Composite
Chrominance to ±300 ns ±5 ns FCC/NTC-7 Composite
Luminance Delay
(Relative Chroma Time)
ominance to
Chr
Luminance Gain
(Relative Chroma Level)
fer
Dif
e Level (APL)
ential Gain
00 ns to 1.0 µs ±30 ns
3
(0.5 cycles)
20 ns
±
+0.2 lines
300 ns to 1.0 µs ±30 ns
of nominal
horizontal sync
pulse width
+0.2 lines
3.0% Full Field
0 to 200%
Maximum Car
0 to 160%
0 to 100%
±
rier
1% FCC/NTC-7 Composite
±
±0.3% FCC/NTC-7 Composite
MPLITUDE AND PHASE MEASUREMENTS (continued)
A
easurement Range Accuracy Test Signal
M
ifferential Phase 0 to 360 deg ±0.3 deg FCC/NTC-7 Composite
D
uminance Non-linear 0 to 50% ±0.4% FCC/NTC-7 Composite
L
istortion
D
elative Burst Gain ±100% ±0.3% FCC/NTC-7 Composite
R
elative Burst Phase ±180 deg ±0.3 deg FCC/NTC-7 Composite
R
urst Amplitude 25 to 200% ±1.0% Horizontal Blanking
B
% of sync) of sync
(
urst Amplitude 10 to 80% of Bar ±0.4% Horizontal Blanking
B
% of Bar) (10 to 80 IRE when (±0.4 IRE)
(
Sync Amplitude 20 to 80% of Bar ±0.3% Horizontal Blanking
(% of Bar) (20 to 80 IRE when (±0.3 IRE)
lanking Level 0 to 90% of ±0.2% Horizontal Blanking
B
ync Variation 0 to 50% of ±0.3% for Horizontal Blanking
S
Blanking Variation 0 to 50% of ±0.3% for Horizontal Blanking
Bar is not used)
ar is not used)
B
aximum Carrier
M
aximum Carrier Zero Carrier
M
(0 to 50% of Bar (±0.3% for Bar
when Zero Carrier and ±0.3 IRE
s not used and for no Zero
i
to 50 IRE when Carrier and
0
Zero Carrier and no Bar)
Bar are not used)
aximum Carrier Zero Carrier
M
0 to 50% of Bar (±0.3% for Bar
(
hen Zero Carrier and ±0.3 IRE
w
s not used and for no Zero
i
0 to 50 IRE when Carrier and
Zero Carrier and no Bar)
Bar are not used)
FREQUENCY RESPONSE MEASUREMENTS
Measurement Range Accuracy Test Signal
Multiburst Flag 0 to 90% of ±0.5% for FCC Multiburst or
Amplitude Maximum Carrier Zero Carrier NTC-7 Combination
Multiburst Packet 0 to 100% of Flag ±1% of Flag FCC Multiburst or
Amplitudes NTC-7 Combination
(20 to 130% of (±0.5% for Bar
Bar when Zero and ±0.5 IRE
Carrier is not used for no Zero
and 20 to 130 IRE Carrier and
when Zero Carrier no Bar)
and Bar are
not used)
INCIDENTAL CARRIER PHASE MODULATION
Measurement Range Accuracy Test Signal
es Zero 0 to 30 deg ±1.0 deg FCC or NTC-7
equir
ICPM (r
Carrier Pulse and the
e output of the
quadratur
demodulator on
channel C)
Composite
COLOR BAR MEASUREMENTS
Measurement Range Accuracy Test Signal
Color Bar Amplitude Er
Color Bar Phase Er
Color Bar Chr
Luminance Gain Ratio
rors ±100% of nominal ±1.0% FCC Color Bars
rors ±180 deg from ±0.5 deg FCC Color Bars
ominance to
nominal
0 to 200% of ±2% FCC Color Bars
nominal
9
Page 10

A
0
–
55
08
MHz
dBV
–5
–10
–15
–
20
–25
–30
–35
–40
–45
–50
1234567
0
–14
05
MHz
dBV
.5 1 1.5 2 3 4
–12
–10
–8
–6
–4
–2
2.5 3.5 4.5
0
–70
08
MHz
dBV
1234567
–60
–50
–40
–30
–20
–10
0
–14
0
MHz
dBV
.5 1 1.5 2 3 4
–12
–10
–8
–6
–4
–2
2.5 3.5 4.5
UTO MODE (continued)
UT-OF-SERVICE MEASUREMENTS
O
easurement Range Accuracy Test Signal
M
ield Time Distortion 0 to 40% ±0.5% Field Square Wave
F
WAVEFORM DISTORTION MEASUREMENTS
Measurement Range Accuracy Test Signal
ine Time Distortion 0 to 40% of Bar ±0.2% FCC or NTC-7
L
Composite
Pulse to Bar Ratio 10 to 125% ±0.7% FCC or NTC-7
Composite
Short Time Waveform 0 to 25% SD ±0.5% SD NTC-7 Composite
istortion (IEEE 511)
D
Chrominance Non-linear 5 to 35 IRE ±0.4 IRE NTC-7 Combination
ain Distortion (20 IRE chroma)
G
5 to 160 IRE
4
(80 IRE chroma)
hrominance Non-linear 0 to 360 deg ±1.0 deg NTC-7 Combination
C
Phase Distortion
Chrominance to ±50 IRE ±0.2 IRE NTC-7 Combination
Luminance Intermodulation
2T K-Factor 0 to 10% Kf ±0.3% Kf FCC or NTC-7
Composite
VIRS MEASUREMENTS
Measurement Range Accuracy Test Signal
VIRS Setup –20 to 130% of ±0.2% VIRS
(Reference Black) Bar (–20 to (±0.5 IRE
VIRS Chrominance 0 to 200% of ±1% VIRS
Reference Amplitude burst amplitude (±0.1% when
VIRS Chrominance Phase ±180 deg ±0.5 deg VIRS
Relative to Burst
VIRS Luminance Reference 30 to 100% of Bar ±0.2% VIRS
130 IRE when when Bar is
Bar is not used) not used)
(0 to 80% of Bar burst is not
when burst is not used and
used and 0 to ±1 IRE when
80 IRE when burst and Bar
burst and bar are not used)
are not used)
(30 to 100 IRE (±0.2 IRE)
when Bar is
not used)
Unified Unweighted filter response curve per CCIR Recommendation 567.
Unified Luminance weighted filter r
esponse curve per CCIR Recommendation 567.
SIGNAL-TO-NOISE RATIO MEASUREMENTS
Measurement Range Accuracy Test Signal
Unified Unweighted SNR
Unified Luminance 26 to 60 dB ±1.0 dB Quiet Line
Weighted SNR 61 to 70 dB ±2.0 dB
NTC 7 Unweighted SNR
NTC 7 Luminance 26 to 60 dB ±1.0 dB Quiet Line
W
eighted SNR 61 to 70 dB ±2.0 dB
Periodic SNR 26 to 60 dB ±1.0 dB Quiet Line
10
26 to 60 dB ±1.0 dB Quiet Line
61 to 70 dB ±2.0 dB
26 to 60 dB
61 to 70 dB
±1.0 dB Quiet Line
2.0 dB
±
61 to 70 dB ±2.0 dB
NTC 7 Unweighted filter response.
NTC 7 Luminance weighted filter response.
Page 11

VM700T Video Measurement Set
hannel A System Default 07-Aug-96 19:19:46
C
System Default Violated Limits
Source ID ------ Not Found
Bar Top 0.5 % Carr ** 10.0 15.0
Blanking Level 71.7 % Carr ** 72.5 77.5
Bar Amplitude 97.7 IRE
ync Amplitude 38.9 % Bar
S
Blanking Variation 2.0 % Carr
Blanking Variation 2.8 % Bar
Sync Variation 2.5 % Carr
Sync Variation 3.5 % Bar
Burst Amplitude 99.6 % Sync
Burst Amplitude 38.8 % Bar
FCC H Blanking 10.98 us
FCC Sync Width 4.91 us
FCC Sync-Setup 9.60 us
FCC Front Porch 1.38 us * 1.40 -----Sync to Burst End 7.97 us ** 5.00 7.90
Breezeway Width 0.57 us
FCC Burst Width 8.9 Cycles
ync Risetime 247 ns * 0 190
S
Sync Falltime 256 ns ** 0 250
RS-170A H Blanking 11.91 us ** 10.65 11.15
RS-170A Sync Width 4.65 us
RS-170A Sync-Setup 9.48 us
RS-170A Front Porch 1.50 us
Sync to Burst Start 5.33 us
RS-170A Burst Width 9.1 Cycles
V Blank 4 IRE F1 20.0 Lines
V Blank 4 IRE F2 20.1 Lines
V Blank 20 IRE F1 20.0 Lines * 20.1 20.9
V Blank 20 IRE F2 20.1 Lines
FCC Equalizer 51.3 % S.W.
FCC Serration 4.51 us
RS-170A Equalizer 2.26 us
RS-170A Serration 4.78 us
Line Time Distortion 1.6 % * 0.0 1.4
Pulse/Bar Ratio 96.6 %
2T Pulse K-Factor 1.6 % Kf
IEEE-511 ST Dist ------ % SD ** 0.0 3.0 No NTC-7 Comp VITS
S/N NTC7 Unweighted 51.6 db ** 57.0 ------ RMS
S/N NTC7 Lum-Wghtd 57.5 db RMS
S/N Unif Unweighted 51.4 db ** 57.0 ------ RMS
S/N Unif Lum-Wghtd 58.0 db RMS
S/N Periodic ------ db Random >> Periodic
S/N.2 NTC7 Unwghtd 51.9 db ** 57.0 ------ RMS
S/N.2 NTC7 Lum-Wghtd 57.1 db RMS
S/N.2 Unif
S/N.2 Unif Lum-Wghtd 57.7 db RMS
Chroma-Lum Delay -20.0 ns
Chroma-Lum
Differential Gain 10.69 % ** 0.00 10.00 At 33% APL
Differential Phase
Lum Non-Linearity 11.04 % ** 0.00 10.00 At 29% APL
Relative Burst Gain -2.91 % At 33% APL
Relative Burst Phase -5.90 Deg At 33% APL
FCC Multiburst Flag 101.4 % Bar
FCC MB Packet #1 57.0 % Flag** 57.1 63.0
FCC MB Packet #2
FCC MB Packet #3
FCC MB Packet #4 59.0 % Flag
FCC MB Packet #5 57.4 % Flag
FCC MB Packet
SCH Phase -47.8 Deg * -45.0 45.0
Field Time Dist ------
FCC Color Bars
Yellow -6.8 4.6 -10.1
Cyan -3.6 4.4 -7.2
Green -3.3 5.6 -8.0
Magenta -0.6 4.9 -5.6
Red -0.7 5.8 -8.5
Blue 1.0 5.3 -4.2
Unwghtd 51.8 db ** 57.0 ------ RMS
Gain
#6
Amplitude Error Phase Error Chr/Lum Ratio Error
( % ) ( Deg ) ( % )
VM700T Video Measurement Set
Lower Upper
89.5
1.26
51.4
53.8 % Flag** 54.8 65.6
33.1
% ** 93.0 107.0
Deg
56.2 64.2
**
% Flag
% Flag
** -3.00 3.00 Not Found
% Bar
At 33% APL
Measurement results are displayed in an easy-to-read format indicating the time, signal source, measurement, and whether the measured value exceeded caution (*) or alarm (**) limits.
11
Page 12

Measurement Methods —
Auto-Mode
The following paragraphs
describe the measurement
methods for each measurement.
ach timing measurement
E
method is written for the FCC
method. If there is an RS-170A
method for that same measure-
ent, and the RS-170A method
m
iffers from the FCC method, the
d
RS-170A requirement is
enclosed within square brackets
in the FCC description.
Horizontal Interval Timing
Measurements
These timing measurements are
made within the active picture
area, averaging the results over
32 lines starting at line 50 and
skipping 1
-frame plus 5 lines for
each successive sample (i.e.,
average over line 50 of first field,
line 56 of second field, line 62 of
the third field, etc.).
Breezeway Width: Measured
from the 10% point on the
trailing edge of horizontal
sync (nominally –4-IRE) to the
leading half-amplitude point
of the burst envelope.
Color Burst Width: Measured
from the leading half-amplitude point on the burst envelope [leading zero crossing of
the first half-cycle of burst
that exceeds 50% of burst
amplitude] to the trailing halfamplitude point on the burst
envelope [trailing zero cross-
of the last half-cycle of
ing
burst that exceeds 50% of burst
amplitude].
Front Porch Duration:
Measured from the 10% point
n the trailing edge of setup
o
(+4 IRE nominally) to the 10%
[50%] point on the leading
edge of sync (nominally –4
20] IRE).
[
Horizontal Blanking Width:
Measured between the points
n the leading and trailing
o
edges of horizontal blanking
that are at an amplitude of
10% [50%] of sync above
lanking level (nominally +4
b
[+20] IRE).
Horizontal Sync Rise Time
and Fall Time:
Measured
between the 10% and 90%
points on the leading and
trailing edges of horizontal
sync, respectively (nominally
–4 IRE and –36 IRE).
Horizontal Sync Width:
Measured between the
10% [50%] points on the
leading and trailing edges
of horizontal sync (nominally
–4 [–20] IRE).
SCH Phase: Phase at the
middle of burst relative to
the 50% point on the sync
leading edge.
Sync to Setup: Measured from
the 10% [50%] point on the
leading edge of sync (nominally –4 [–20] IRE) to the point
on the trailing edge of blanking that is equivalent to 10%
of sync (nominally +4 IRE).
Sync-to-Start-of-Burst:
Measured from the 50%
point on the leading edge
of sync (nominally –20 IRE)
o the leading zero crossing
t
of the first half-cycle of burst
that exceeds 50% of burst
amplitude.
Sync-to-End-of-Burst:
Measured from the 10%
point on the leading edge of
orizontal sync (nominally
h
–4 IRE) to the half-amplitude
point on the trailing edge of
the burst envelope.
Vertical Interval Timing
Equalizing Pulse Width:
Measured between the
10% [50%] points on the
equalizing pulse (nominally
–4 [–20] IRE).
Serration Width: Measured
between the 10% [50%]
points of serration (nominally
–4 [–20] IRE).
Vertical Blanking Width:
Measured between the points
on setup [active picture] at a
level equal to 10% [50%] of
sync amplitude (nominally
+4 [+20] IRE), where setup
[active picture] immediately
precedes and follows the
vertical blanking interval.
12
Page 13

Color Bar Measurements
Color Bar Amplitude Error:
Measured as deviation of
the peak-to-peak amplitude
f each color bar from the
o
nominal value for that color
bar expressed as a percent
of the nominal value. Six
alues reported.
v
Color Bar Phase Error:
Measured as deviation of the
hase of each color bar from
p
the nominal phase for that
color bar, relative to burst
phase. Six values reported.
Color Bar ChrominanceLuminance Gain Ratio:
Measured as ratio of chrominance level to luminance level
of each color bar, relative to
the nominal ratio for each
color bar. Six values reported.
olor Amplitude Phase C/L Gain
C
llow 67.36% 167.59 deg 1.0092
Ye
Cyan 94.74% 283.54 deg 1.8045
Green 89.04% 240.67 deg 2.0123
Magenta 89.04% 60.67 deg 2.8957
Red 94.74% 103.54 deg 4.2106
Blue 67.36% 347.59 deg 8.1652
FCC Color Bars Nominal Values
(Source: FCC Rule 73.699, Figure 14).
Ratio
Amplitude and Phase Measurements
(FCC or NTC-7 Composite VITS)
Bar Top: Measured as the ratio
of the bar top to Zero Carrier
amplitude to the blanking (at
back porch) to the Zero Carrier
amplitude. Result expressed as
a percent of Max Carrier.
Bar Amplitude: Measured
from the reference blanking
level (at back porch) contained
ithin the test line to the level
w
at the center of the bar.
urst Amplitude:VITS not
B
required. Burst amplitude
must be at least 10 IRE.
Measured as peak-to-peak
amplitude of the color burst at
urst center.
b
Chrominance-Luminance
elay Inequality (Relative
D
Chrominance Time):
Measured
as the time difference between
the luminance component and
chrominance component of
the modulated 12.5T pulse.
Chrominance-Luminance
Gain Inequality (Relative
Chrominance Level):
Measured as the peak-to-peak
amplitude of the chr
ominance
component of the modulated
12.5T-pulse.
Differential Gain: Measured
as the absolute amplitude
difference between the smallest
and largest staircase chrominance packets. Result expressed
as a percent of the largest
packet amplitude.
Differential Phase: Measured
as the largest difference in
phase between any two
staircase chrominance packets.
Luminance Non-linear
Distortion:
Measured as the
difference between the largest
nd smallest step amplitudes
a
of the staircase at the center of
each step. Result expressed as
a percent of the largest step
mplitude difference.
a
Relative Burst Gain: Measured
as the difference between the
eak-to-peak amplitude of burst
p
and the staircase chrominance
packet located at blanking.
Result expressed as a percent
f the packet amplitude.
o
Relative Burst Phase:
Measured as the difference in
phase between the color burst
and the staircase packet
located at blanking.
Sync Amplitude: Measured
from the tip of the horizontal
sync pulse to blanking level.
Blanking Level: Measured as
the ratio of the blanking (at
back porch) to Zero Carrier
amplitude to the sync tip to
Zero Carrier amplitude. Result
expressed as a percent of
Max Carrier.
Sync Variation: Measured as
the peak-to-peak variation of
the horizontal sync pulse
amplitude within every third
line of a field.
13
Page 14

Blanking Variation: Measured
as the peak-to-peak variation
of the blanking level within
very third line of a field.
e
Frequency Response Measurements
FCC Multiburst or NTC-7
(
Combination VITS)
Multiburst Flag Amplitude:
easured from back porch
M
blanking to the center point of
the flag top.
ultiburst Amplitude:
M
Measured as the peak-to-peak
amplitude of each of the
multiburst packets. Six results
reported.
Waveform Distortion Measurements
(FCC or NTC-7 Composite VITS)
Line Time Distortion:
Measur
ed as the peak-to-peak
amplitude change of the bar
top, excluding the first
microsecond and the last
microsecond.
Pulse-to-Bar Ratio: Measured
as the peak amplitude of the
2T pulse, expressed as a
percent of the bar amplitude.
Short-Time Waveform
Distortion:
Measured as a
weighted function of time, the
result is the peak deviation
from flatness within 1
microsecond of the center of a
bar transition. ANSI/IEEE
Std.-511-1979, Section 4.4,
Appendix B.
Chrominance Non-linear Gain
Distortion:
Measured as the
peak-to-peak amplitude of the
first (nominally 20 IRE) and
last (nominally 80 IRE)
chrominance packets in the
3-level chrominance signal,
referenced to the peak-to-peak
amplitude of the middle
packet (nominally 40 IRE).
Chrominance Non-linear
Phase Distortion:
Measured
as the difference between the
argest and the smallest
l
deviation in phase among the
3-level chrominance test signal
subcarrier packets.
Chrominance to Luminance
Intermodulation:
Measured
using the 3-level chrominance
est signal. Result is the maxi-
t
mum amplitude departure of a
filtered part of the luminance
pedestal from a part of the
edestal upon which no sub-
p
carrier has been superimposed.
2T Pulse K-factor: Measured
as the greatest weighted amplitude of a positive-going or
negative-going echo-term
half-wave which is within one
microsecond before the 2T
pulse leading edge halfamplitude point or within
one microsecond after the 2T
pulse trailing edge half-amplitude point. Result expressed as
a K-factor which is the ratio of
the weighted amplitude of the
echo-term half-wave to the
sampled amplitude of the
2T pulse.
VIRS Measurements
VIRS Setup (Reference Black):
Measured from the blanking
level included in the test
signal to setup level.
VIRS Chrominance Reference
Amplitude:
Measured as the
amplitude of the VIRS chrominance packet, expressed as a
percent of burst (or percent of
bar if no burst).
VIRS Chrominance Phase
Relative to Burst:
Measured as
the difference between the
IRS chrominance packet
V
phase and color burst phase.
IRS Luminance Reference:
V
Measured from the blanking
level included in the test
signal to luminance reference
level (nominally 50 IRE).
Signal-to-Noise Ratio Measurements
nweighted SNR:Measured as
U
the ratio of bar amplitude to
the unweighted rms amplitude
of the noise on a quiet line.
Luminance Weighted SNR:
Measured as the ratio of bar
amplitude to the luminance
weighted rms amplitude of the
noise on a quiet line.
Periodic SNR: Measured as
the ratio of bar amplitude to
the peak-to-peak value of the
periodic noise.
Out-of-Service Measurements
Long Time Distortion: Measured
as the peak overshoot and
settling time in a flat field test
signal switched from 10% to
90% APL in less than 10 µsec.
Field Time Distortion:
Measured as the peak-to-peak
amplitude change of the 100
IRE field squarewave top.
The first and last 250 µsec
are excluded. Expressed as
a percent of the field
squarewave amplitude.
14
Page 15

ower Requirements
P
Mains Voltage Range — 87 Vac to 132 Vac or 174 Vac to 250 Vac.
ains Frequency — 47 Hz to 63 Hz.
M
Power Consumption — 250 Watts.
nvironmental
E
Operating Temperature Range — 0°C to 50°C ambient.
Physical Characteristics
Dimensions mm in
Width
Height 222 8.75
Depth 556 21.90
Weight Kg lb
Net ≈20 ≈45
483 19.00
Ordering
Information
VM700T
Option 01
NTSC Video
Measurement Set
dering, please use the nomenclature given here. The standard instrument is shipped as a rack mount product.
When or
Included Accessories
Instruction manual; 75 Ω terminators (3) 011-0102-00; power cord.
Additional Options
Option 11 — PAL Measurements
Option 01/11 — Dual Standard Measurements
Option 20 — Teletext Measurements
Option 21 — Camera Measurements
Option 30 — Component Measurements
Option 40 — Audio Measurement Module
Option 41 — 6 Channel Audio Measurement Module
Option 42 — Audio to Video Delay Measurement
Option 48 — GPIB Interface
Option 1C — Cabinet Version
Option 1G — Echo/Rounding Measurements
Option 1P — Printer
Option 1Z — Probe Adapter (067-1429-00)
Option 3Z — Probe Adapter (3 each of 067-1429-00)
VM700T Softwar
e Utilities
VMBKUP — VM700T Backup Utility
VMREMGR — Remote Graphics Software for the VM700T
VMT — VM700T Remote Control Software
Optional Accessories
VM7FC1 — Field installable conversion kit to conver
VM7FR1 — Field installable conversion kit to conver
t rack mount unit to cabinet.
t cabinet to rack mount unit.
15
Page 16

C
ontact Tektronix:
ASEAN / Australasia / Pakistan (65) 6356 3900
ustria +41 52 675 3777
alkan, Israel, South Africa and other ISE Countries+41 52 675 3777
B
razil & South America55 (11) 3741-8360
B
entral East Europe, Ukraine and Baltics+41 52 675 3777
C
entral Europe & Greece+41 52 675 3777
C
rance & North Africa+33 (0) 1 69 86 81 81
F
A
elgium07 81 60166
B
anada1 (800) 661-5625
C
enmark+45 80 88 1401
D
inland+41 52 675 3777
F
Germany +49 (221) 94 77 400
Hong Kong (852) 2585-6688
India (91) 80-22275577
Italy +39 (02) 25086 1
Japan 81 (3) 6714-3010
Luxembourg +44 (0) 1344 392400
Mexico, Central America & Caribbean 52 (55) 56666-333
Middle East, Asia and North Africa +41 52 675 3777
The Netherlands 090 02 021797
orway800 16098
eople’s Republic of China86 (10) 6235 1230
P
epublic of Korea82 (2) 528-5299
R
N
oland+41 52 675 3777
P
ortugal80 08 12370
P
ussia & CIS7 095 775 1064
R
South Africa +27 11 254 8360
pain (+34) 901 988 054
S
Sweden 020 08 80371
Switzerland +41 52 675 3777
Taiwan 886 (2) 2722-9622
United Kingdom & Eire +44 (0) 1344 392400
USA 1 (800) 426-2200
For other areas contact Tektronix, Inc. at: 1 (503) 627-7111
Last Updated June 15 2005
For Further Information
Tektronix maintains a comprehensive, constantly expanding collection
of application notes, technical briefs and other r
neers working on the cutting edge of technology. Please visit
tronix.com
Copyright © 2005, Tektronix, Inc. All rights reserved. Tektronix products are covered by U.S. and foreign patents, issued and pending. Information in this publication supersedes that in all previously
published material. Specification and price change privileges r
ed trademarks of Tektronix, Inc. All other trade names referenced are the service marks,
egister
r
trademarks or registered trademarks of their respective companies.
11/05 FLG/WOW 25W-11139-1
ces to help engi
esour
www.tek-
eserved. TEKTRONIX and TEK ar
-
e
 Loading...