

Page 1
Spectrum Analyzers
Choice of 4 Types To Fit the Application
R9211Series
■ 2-Channel, 16-Bit Resolution, Wide
Dynamic Range of 90 dB (Typical
Value)
■ Maximum Input Sensitivity of -140
dBV (2 kHz Range, Typical Value)
■ 10 mHz to 100 kHz Frequency Range
(1-2-5 Steps)
■ Domain Method (Measurement
Domain Mode) For Ease of Operation
■ Portable With Large 8 Inch CRT
Screen
■ Frequency Analysis Resolution of 25
to 3200 Lines
■ Built-In Power Supply For Measurement of Accelerometers
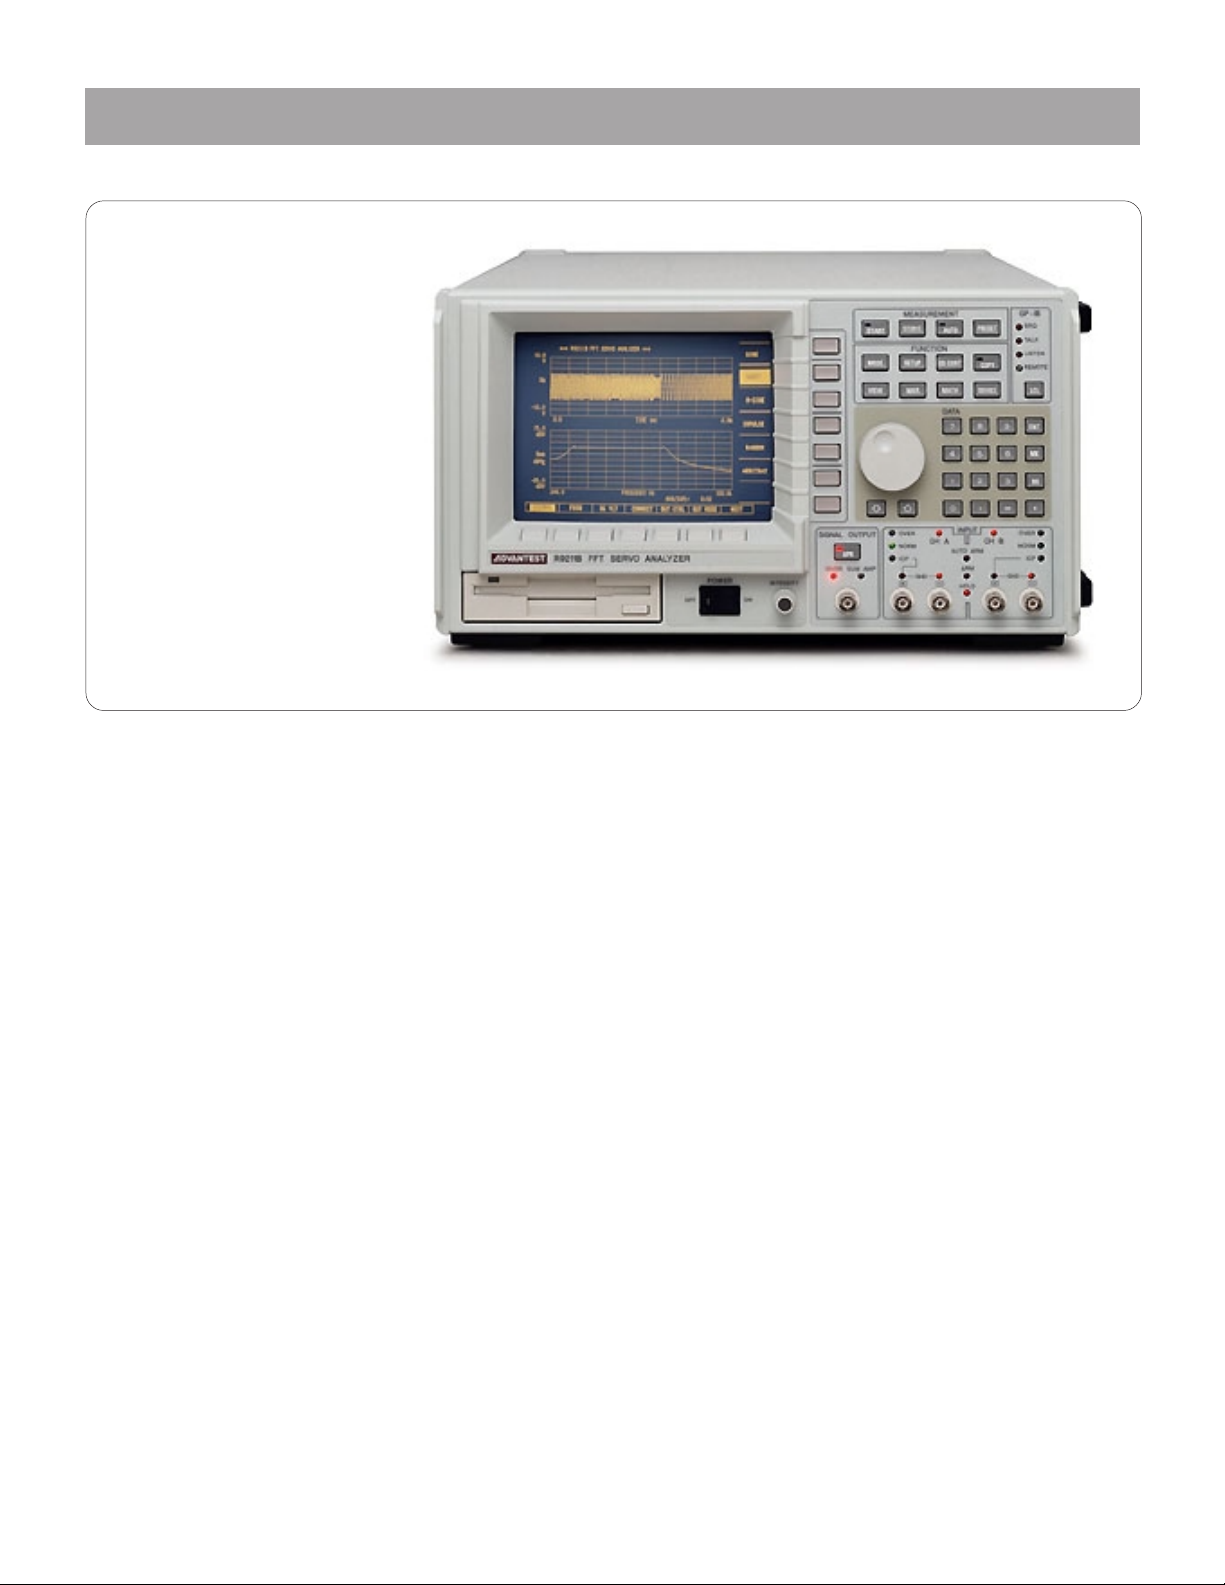
R9211A/9211B/9211C/9211E
FFT Analyzer Series
R9211 Series are portable high performance digital spectrum
analyzers which gather the essence of ADVANTEST’s accumulated technologies such as usage of dedicated LSI circuits and
high density mounting technology as well as development of
circuits with low power consumption.
The R9211 Series consists of 4 types so that the best choice can
be made to suit the application. These types are the economical
R9211E; the R9211A capable of running zoom; the R9211B ideal
for servo analysis; and the R9211C which can do servo analysis
as well as curve fitting and frequency response function synthesis.
All these types have the wide measurement frequency range of
10 mHz to 100 kHz, a high 16-bit resolution and a wide dynamic
range of 90 dB (typical value). The series also has high sensitivity
input of -140 dBV (typical value, 2 kHz range) and a function
which allows variation of the frequency resolution from 25 to
3200 lines. These features are effective in isolated measurement
of micro-level signals and adjacent spectrum. Of course, the
series offers more than just these excellent functions. By means
of ADVANTEST’s exclusive systematized domain method (measurement domain mode), measuring time has been shortened
over conventional FFT analyzers and operation simplified for a
wide range of user applications.
Other features include an increased memory capacity, built-in
floppy disk drive and 16-bit direct digital input analysis which
are available as standard (optional for some models). These
features meet a wide range of applications.
■ Wide Measuring Frequency Range of 10 mHz to 100 kHz
By using high precision analog and digital filters, aliasing
filters can be set in all frequency ranges from 10 mHz to 100
kHz. Frequency resolution can also be set from 25 to 3200 lines
in all frequency ranges according to the purpose of the analysis.
The scale function can be used to display the spectrum of only
the required frequency band on the CRT.
(Photo is R9211B)
■
16-Bit Resolution, 90 dB (Typical Value) Wide Dynamic Range
90 dB (typical value) wide dynamic range spectrum measurement has been made possible through ADVANTEST’s advanced
analog/digital signal processing technology. In order to take full
advantage of the functions of the built-in A/D converter, the input
sensitivity range can be varied in 1 dB steps. This is a powerful
feature for use in measurements of mechanical characteristics of
magnetic optical disks, distortion analysis or transient signal
analysis of audio signals and transfer function measurement
using an impulse hammer.
■
High Sensitivity Measurement of -140 dBV (Typical Value)
When used with a difference input, the R9211 Series attains highly
sensitive measurement of -140 dBV (at 0.1 µV, 2 kHz (typ.) range). This
is effective for analysis of noise in semiconductors or other devices.
■
‘I/O + Memory’ Function Allows Direct 16-Bit Digital Input
The ‘I/O + Memory’ function is effective in evaluating A/D
converters or DSPs used in digital audio equipment such as DAT
and CD players. Spectrum or distortion analysis can be done by
inputting a digital signal directly after the A/D converter of the
R9211 Series in ‘16-bit + EOC’ (twos complement) data format.
■
A Wide Variety of Marker Analysis and Display Functions
The R9211 Series has a wide variety of marker analysis functions
which are effective for analyzing or making evaluations and
allowing for a reduction in measurement time. These include
a peak marker, next peak marker, harmonics marker, band
marker, overall power, attenuation power, partial power, average
power, dispersion and X dB marker. The series has been made
easier to use, offering simultaneous display of 1 to 4 screens,
overlapping display in the same domain or same analysis range
and 3-D display of up to 50 lines. There is also a bar display
function where the state of one of overall power, partial power,
average power or power dispersion can be checked at a glance.
130
Page 2
Spectrum Analyzers
16-Bit Resolution, 100 kHz Portable Type
R9211Series
■ Measurement Domain Modes For Various Measurement Domains
Since digital spectrum analyzers have many measurement
applications, there is a tendency for them to have many analysis
functions and for their operations to become complicated. In
order to free the user from such complicated operations, the
R9211 Series has separate measurement domain modes
according to the measurement application. The user can select
the desired measurement mode without having to trouble with
unused analysis functions or setting conditions. The soughtafter results can be obtained easily by making only the software
key settings necessary for the measurement.
• Waveform Measurement Mode
By using this mode, time domain signal analysis can be done
more quickly than was possible previously. Further, an antialiasing filter can be turned on and off so that the series can be
used as a 16-bit/ 256 kHz sampling oscilloscope. This is ideal
for time domain transient phenomenon analysis of the sound
of acoustic instruments, starting characteristics tests of engines
or motors, waveform analysis of power on reset signals or
differential linearity tests of D/A converters.
• Time/Frequency Analysis Mode
In evaluation of musical instruments’ sound or hall reverberation
characteristics, time variation analysis can be done which
focuses on a specified spectrum. Further, analysis can be done
of the time characteristics of spectrum variations in the wow
and flutter component of VCRs or other equipment (frequency
monitor function). The time characteristics of phase variations
such as jitter can also be analyzed (phase monitor function).
• Spectrum Measurement Mode
Measurement is possible with a wide dynamic range of 90 dB
(typ.) and high sensitivity of -140 dBV (typ., at a 2 kHz range).
This is effective in harmonic distortion analysis and microlevel noise analysis.
• Frequency Response Function Measurement Mode
In this mode, frequency resolution can be varied from 25 to 800
lines. Also, since 2 power supply channels for acceleration
sensors are built-in, direct measurements of transfer functions
of structural components are possible by connection of a sensor
with a built-in amp or an impulse hammer.
• Servo Analysis Mode (R9211B, R9211C)
The R9211 Series features a built-in summation amplifier for
open loop characteristics evaluation, servo measurement with
up to a 5 decade log sweep and a point servo measurement
function with a frequency table of only specified frequencies.
■ Features of each type
• 16 Bit Resolution, 90 dB (Typ.) Wide Dynamic Range
• 10 mHz to 100 kHz Frequency Range
• Maximum Input Sensitivity: -140 dBV (2 kHz Range, Typ.)
R9211E
• 12 kg Portable Type, 8 Inch CRT
• Easy-to-Use Separate Measurement Domain Modes
• Running Zoom Function With Minimum Span of 10 mHz
• 15 Bit Resolution, 90 dB (Typ.) Wide Dynamic Range
• 10 mHz to 100 kHz Frequency Range
R9211A
• Easy-to-Use Separate Measurement Domain Modes
• 3.5 Inch Floppy Disk Drive Provided Standard
• 130 dB Minimum Wide Dynamic Servo Analysis
• 10 mHz to 100 kHz Frequency Range
• High Speed Auto-Range Function, Frequency Resolution Variation
R9211B
Function (25 to 800 Lines), SSS Format High Speed Measurement
• Built-in Addition Amplifier Ideal For Servo Analysis
• Curve Fit Function, Frequency Response Function Synthesis Function
• 130 dB Minimum Wide Dynamic Servo Analysis
• High Speed Auto Range Function, Frequency Resolution Variation
R9211C
Function (25 to 800 Lines), SSS High Speed Measurement
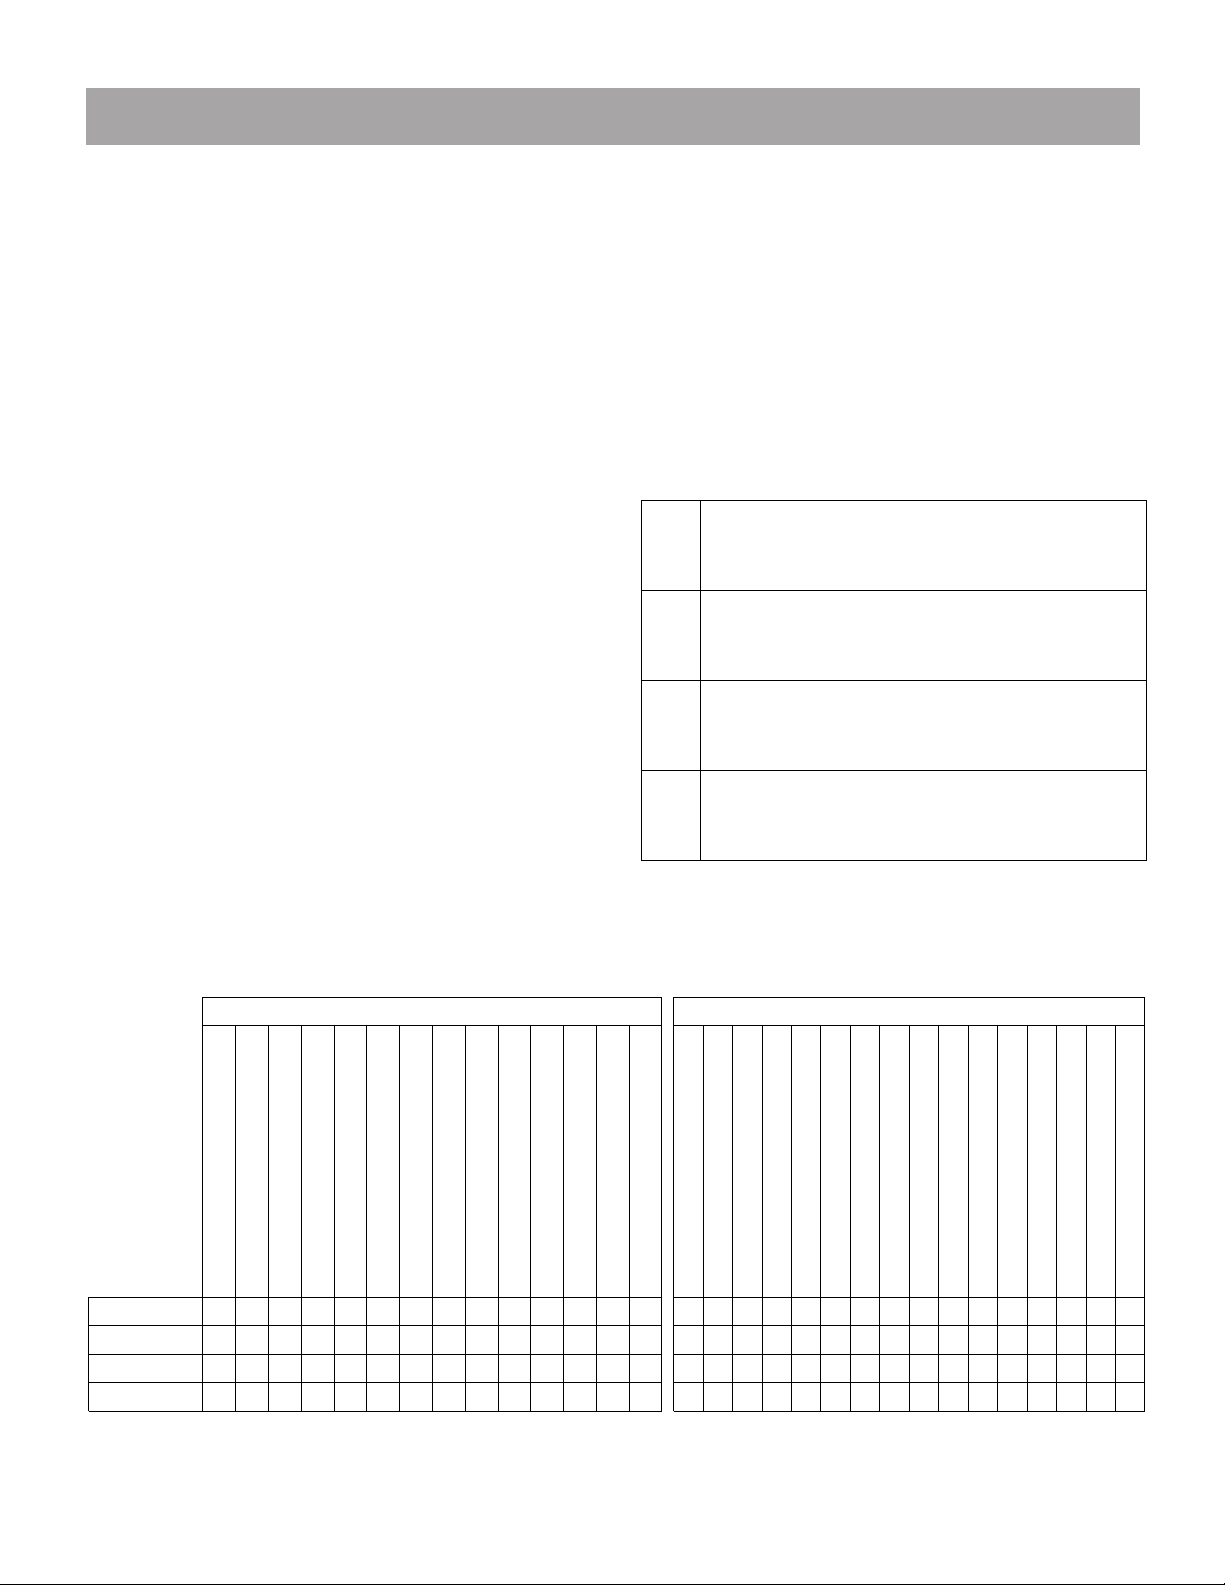
Functions and Options Applications
SG with output up to ±15 V
SG with digital signal generation
Curve fitting and synthesizer function
R9211B
R9211C
R9211E
R9211A
Note: Selection of only one possible of the items marked with ▲.
●●●
Running zoom with 10 mHz resolution
GO-NO GO decisions by comparator function
SG with built-in summation amplifier
Power supply for acceleration sensor with built-in amp
●●●●●● ●
●●●●●● ●
●
●●●●
Sign, multi-sign, swept sign, impulse, random or
Difference input
Floppy disk drive
arbitrary waveform output
●
High speed thermal printer
Opt. Opt. Opt.
Opt. Opt.
Opt.
Opt. Opt. Opt. Opt.
‘I/O + memory’ card
CMOS memory (1 M words)
High speed calculation processor
Oscillation/structural components analysis
●●
▲▲▲
Device noise evaluations
Acoustics/noise/sound analysis
Digital audio sound output evaluations
Telephone line terminal equipment evaluations
Optical disk mechanical characteristics evaluations
●●●●●●●●●● ● ●●●
●●●●●●●●●● ● ●●●●●
●●●●●●● ● ●
●●●●●●● ● ●
Digital servo evaluations
A/D, D/A converter evaluations
Evaluations of servos in CD/DAT/video disk players
High speed octave analysis
1/1 and 1/3 octave analysis
Digital amp/digital filter evaluations
Opt.
Analog servo evaluations
130 dB wide dynamic range servo analysis
Analysis by frequency response function synthesis
Transient signal characteristics (indoor, in-car acoustic analysis)
131
Page 3

Spectrum Analyzers
Choice of 4 Types, To Fit the Application
R9211Series (Continued From Previous Page)
Specifications
Input and Analysis Characteristics
Number of input channels: 2
Input format: Difference input format, signal ended format
Input impedance: Approx. 1 MΩ/100 pF (at signal ended)
Input coupling: AC, DC, GND
A/D converter resolution: 16 bits
Frequency range: 10 mHz to 100 kHz, 22 ranges in 1, 2, 5 steps
Frequency accuracy:± 50 ppm of frequency range ± measurement
resolution (at +23˚C ± 5˚C)
Input filter: Anti-aliasing filter (roll off characteristic -148 dB/oct.) is
applied to each frequency range and automatically set
However, at ranges of 1 kHz and below, analog and digital filters
are used together
Common-mode rejection ratio (CMRR):
50 dB min. (with DC coupling, at 50/60 Hz)
Maximum difference input voltage: ± 200 V
Maximum in-phase input voltage: ± 200 V
Input range: +30 to -60 dBV (variable in 1 dB steps)
Voltage display 44.7 V to 1.41 mV, rms display, 31.6 V to 1 mV
Auto range: Set at the optimum range stated above according to the
input signal (5 dB steps)
Maximum in-phase signal voltage:
± 14 V (-60 to -6 dBV range)
± 140 V (-5 to +14 dBV range)
± 200 V (+15 to +30 dBV range)
Maximum input sensitivity: -125 dBV (approx. 0.56 µVrms) (at
-140 dBV, 2 kHz range)
Dynamic range: All dynamic ranges are those measured at full
scale in spectrum mode, 0 to 90% of frequency range, sine wave
input with -3 dB amplitude level, 32 averagings, rectangular
wave weighting, filter on, 400-spectrum-line condition.
Also, 1/f noise is excluded. (23˚C ± 5˚C)
85 dB min. (+30 to -30 dBV) (90 dB typ.)
80 dB min. (-31 to -40 dBV)
70 dB min. (-41 to -50 dBV)
60 dB min. (-51 to -60 dBV)
Residual noise: All residual noise values are those measured at full
scale in spectrum mode, 32 averagings, rectangular wave
weighting, filter on, 400-spectrum-line condition. Also, 1/f noise is
excluded. However, at 0 to 90% of frequency range (23 ± 5˚C)
-85 dB min. (+30 to -40 dBV)
-75 dB min. (-41 to -45 dBV)
-60 dB min. (-46 to -60 dBV)
Amplitude linearity ±0.2 dB max.
(within -40 dB from full scale, +23 ± 5˚C)
Frequency flatness: ± 0.3 dB max. (at 23 ± 5˚C)
At 0 to 90% of frequency range, AC coupled -3 dB point is
approx. 0.2 Hz
Amplitude accuracy: Amplitude linearity + frequency flatness (at
23 ± 5˚C)
Amplitude difference between channels: In same sensitivity range,
at 0 to 90% of frequency range (at 23 ± 5˚C)
R9211E/9211A R9211B/9211C
Within ± 0.3 dB Within ± 0.1 dB
Phase difference between channels: In same sensitivity range, at 0
to 90% of frequency range (at 23 ± 5˚C)
R9211E/9211A R9211B/9211C
Within ± 3.0˚ Within ± 1.0˚
Power supply for accelerometers: Only AC input coupling,
4 mA source current, + side of channel A or B
Max. operating voltage +18 V, open circuit voltage 24 V max.
Overload display: LED
Test signal: At frequency ranges from 100 to 2 kHz,
amplitude level: approx. -4 dBV, frequency: sine wave, 8% of range
Trigger
Trigger modes: Free run mode, manual trigger mode, external
trigger mode, input signal trigger mode, automatic repeat trigger
mode
Trigger source: Input signal trigger through channel A or B signal;
external signal trigger by EXT signal
Trigger level:
Input signal trigger; Set by number keys with a resolution of 1/
256 of amplitude range
External signal trigger; TTL, rising or falling edge can be selected
(rear panel BNC connector)
Trigger slope: +, -, ± (input signal trigger)
Trigger position: -128 K to +1 M sample, with 1 channel measure
ment
-64 K to +1 M sample, with 2 channel measurement
Averaging
Frequency domain averaging modes: Addition (SUM), subtraction
(SUB), exponential function moving average (EXP), peak value
detection (PEAK)
Time domain averaging modes: Addition (SUM)
Delay domain averaging modes: Addition (SUM)
Amplitude domain averaging modes: Addition (SUM)
Number of averagings: 1 to 32767
Overlapping: 0%, 50%, 75%, MAX
Start/stop control: Start, stop, +1, continue (except for servo mode)
(erasing done automatically during start)
Measurement Modes
• Waveform measurement mode
• Spectrum measurement mode
• Time/frequency analysis mode
• Frequency response function measurement mode
• Servo analysis mode (R9211B/C)
Waveform Measurement Mode
Measurement functions:
Time domain instantaneous data, time domain average data, autocorrelation function, cross-correlation function, probability
density function, cumulative distribution function
Amount of analysis data: 64 to 8192 points (1 channel),
64 to 4096 points (2 channels)
Amount of delay domain data: 64 to 2048 points
Averaging: Time domain averaging
Delay domain averaging
Amplitude domain averaging
Conversion function: Engineering units
Marker analysis functions: Peak value, rise time, fall time, pulse
width, root-mean-square value
132
Page 4

Spectrum Analyzers
16-Bit Resolution, 100 kHz Portable Type
R9211Series
Calculation functions: Differentiation, integration, smoothing, trend
elimination, basic arithmetic, pre-envelope
Display functions: Time/amplitude, amplitude/probability density,
orbit
Spectrum Measurement Mode
Measurement functions: Complex spectrum, power spectrum, cross-
spectrum, time waveform
Averaging: Frequency domain averaging
Amount of analysis data: 64 to 8192 points (1 channel)
64 to 4096 points (2 channels)
Frequency resolution:
Linear 25 to 3200 lines (1 channel)
25 to 1600 lines (2 channels)
Log 3 decades max., 80 lines/decade
Other 1/3 octave, 1/1 octave
Window functions: Rectangular, Hanning, minimum, flat-pass,
force/response
* With log frequency resolution and octave resolution, window
functions are Hanning, minimum or rectangular
Weighting: A, B, C weighting, C message weighting
Conversion functions: Engineering units
Marker analysis functions: Peak marker, next peak marker, band
marker, harmonics marker, sideband marker, overall power, partial
power, average power, dispersion
Calculation functions: Basic arithmetic, pre-envelope, liftered spec-
trum, power cepstrum, jw, 1/jw, smoothing
Display functions: Frequency/amplitude, frequency/phase, frequency/
real number component, frequency/imaginary number component,
Nyquist diagram
Time/Frequency Analysis Mode
Basic measurement functions: Time waveform, complex spectrum,
power spectrum, cross-spectrum
Time/frequency analysis mode: Level monitor, phase monitor, fre-
quency monitor
Averaging: Frequency domain averaging
Frequency resolution:
Linear 25 to 800 lines
Log 3 decades max., 80 lines/decade
Other 1/3 octave, 1/1 octave
Window functions: Rectangular, Hanning, minimum, flat-pass,
force/response
* With log frequency resolution and octave resolution, windows
functions are Hanning, minimum or rectangular
Weighting: A, B, C weighting, C message weighting
Conversion functions: Engineering units
Marker analysis functions: Peak marker, next peak marker, band
marker, harmonics marker, sideband marker, overall power, attenuation power, partial power, average power, dispersion
Calculation functions: Basic arithmetic, pre-envelope, liftered spec-
trum, power cepstrum, jw, 1/jw, smoothing, cumulative level monitor
Display functions: Frequency/real number component, frequency/
imaginary number component, frequency/amplitude, frequency/
phase, Nyquist diagram, time/level, time/phase, time/frequency
Frequency Response Function Measurement Mode
Measurement functions:
Frequency response function, group delay, coherence function,
power spectrum, phase spectrum, impulse response function, time
waveform
Averaging: Frequency domain averaging
Amount of analysis data: 64 to 2048 points
Frequency resolution:
Linear, 25 to 800 lines
Window functions: Rectangular, Hanning, minimum, flat-pass,
force/response
Weighting: A, B, C weighting, C message weighting
Conversion functions: Engineering units
Marker analysis functions: Peak marker, next peak marker, band
marker, harmonics marker, sideband marker, overall power, partial
power, average power, dispersion, + peak marker, - peak marker, X
dB marker, shape factor marker, ripple marker
Calculation functions: Basic arithmetic, unwrapped phase, jw, 1/jw,
reciprocal, impulse response, equalize, phase correction, COP (coherent output power)
Display functions: Frequency/amplitude, frequency/phase, frequency/
real number component, frequency/imaginary number component,
frequency/delay, frequency/associativity function, Nyquist diagram,
Cole-Cole diagram, Nichols diagram
Servo Analysis Mode (R9211B/9211C)
Measurement functions:
Frequency response function, group delay, coherence function,
power spectrum, cross-spectrum, time waveform
Sweep modes: Linear sweep, log sweep
Signal source for servo measurement: Linear/log sign sweep signal,
linear multi-sign sweep signal, log multi-sign signal
Output impedance: 1 Ω max.
Maximum output voltage:
±15 V (when output impedance is 1 Ω or less)
Maximum output current:
100 mA (when output impedance is 1 Ω or less)
DC offset: ±10 V (0.1 V resolution)
Summation amplifier: Can be turned on or off
Number of averagings: Fixed or automatic
Signal source bandwidth: Fixed or automatic
Frequency table servo function: Measurement can be done by
grouping together output waveform, output voltage, DC offset,
measurement frequency range and number of averagings (20
groups max.)
Linear f table
Log f table
Frequency resolution:
Linear 25 to 800 lines
Log 1 to 6 decades (25 to 200 lines/decade)
However, setting of up to only 5 decades is possible at 200 lines.
Conversion functions: Engineering units
133
Page 5

Spectrum Analyzers
Choice of 4 Types To Fit the Application
R9211Series (Continued From Previous Page)
Marker analysis functions: Peak marker, next peak marker, band
marker, harmonics marker, sideband marker, overall power, partial
power, average power, dispersion, + peak marker, - peak marker, X
dB marker, shape factor marker, ripple marker, open loop Bode
diagram marker, open loop gain marker
Calculation functions: Basic arithmetic, unwrapped phase, jw, 1/jw,
reciprocal, impulse response, equalize, phase correction, COP (coherent output power), open/closed loop conversion
Display functions: Frequency/amplitude, frequency/phase, frequency/
real number component, frequency/imaginary number component,
frequency/ group delay, frequency/associativity function, Nyquist
diagram, Cole-Cole diagram, Nichols diagram
Curve Fitting Function
Up to 20 groups of range poles and zeroes are sampled from
frequency response function data
Weighting: Auto weight, uniform weight, user weight
Conversion function: Sampled range poles and zeroes can be con-
verted to range poles and residue or polynomials
Synthesis Function
Frequency response function, impulse response and step response
can be synthesized from sampled range poles and zeroes or values of
entered range poles and zeroes.
Signal generator (R9211B/9211C) Except for servo analysis mode
Output waveform: Sine wave (spot), swept sign, multi-sign, impulse,
random, user selected waveform (max. memory size: 64 K words)
Maximum output voltage: ± 15 V (at 1 Ω max. output impedance)
Maximum output current: 100 mA (at 1 Ω max. output impedance)
DC offset: ± 10 V (0.1 V resolution)
Output impedance: 1 Ω max., 50 Ω, 600 Ω
Output modes: Continuous, internal, external, external gate, manual
Taper function: 200 ms max.
Summation amplifier: Can be turned on or off
Running zoom function: (R9211A/9211C)
When the stop frequency is less than 10 kHz, the minimum span is
10 mHz. When the stop frequency is 10 kHz or more, zoom analysis
can be done with a minimum span of 100 mHz.
Comparator Function (R9211C)
Setting modes: Table mode, reference mode
Table mode: Up to 20 groups of comparative sections can be set
Reference mode: Comparator can be done against a reference
waveform
Target waveform: Comparator can be done against frequency
domain data
Comparator results:
• PASS/FAIL displayed on screen
• Buzzer
• Output from rear by TTL O/C
Display Specifications and Functions
Display functions: 8-inch raster scan CRT
Engineering units: Marker readout values and vertical axis scaling can
be displayed as freely specified physical quantities
Scaling: Linear/log scaling, scaling can be done independently for each
channel
Units: Up to any 2 characters among those specified can be set
Display modes: 1, 2, 3 or 4 screen display
Overlapping display mode: Data in the same domain or analysis
range can be displayed in overlapping format
Lattice display: Can be turned on or off
3-D display: Up to 50 lines of the desired display data can be displayed
in 3-D
Bar display: Overall power, partial power, average power or power
dispersion can be shown as a bar display at the right edge of the CRT
screen
Labels: Up to 40 alphanumeric or special characters can be displayed
and moved up and down
List modes:
Single mode 20 spectrum frequency values and level values in
the display can be selected by cursor and listed in a digital
display
Harmonics mode When the basic spectrum is set by entering the
values, the level values are listed in a digital display, and THD
(total harmonic distortion) and THP (total harmonic power) are
calculated and displayed.
Sideband mode When carrier frequency and modulated signal
frequency are set by entering the values, the upper waveband
and lower waveband power up to the 10th degree is calculated
and displayed
Horizontal axis: Linear, log
Vertical axis: Can be freely set by entering the values
Calendar/clock function: Calendar (year/month/day) and hour/
minutes display
Memory function:
R9211E R9211A R9211B R9211C
Memory (128 K words) Standard Standard Standard -
I/O + memory (1 M words) Option 11 Option 11 Option 11 Standard
CMOS memory (1 M words) Option 10 Option 10 Option 10 Option 10
Transient waveform data memory: In time/frequency analysis mode
Panel memory: Remembers panel settings (battery backup, settings
last about 1 month)
Input/Output Functions
GPIB interface: Provided as standard
Plotter output: Direct plotting can be done with any ADVANTEST
plotter with a GPIB interface, or a plotter with HPGL function and
GPIB cable
External sampling clock input: BNC type, TTL level
External trigger input: BNC type, TTL level
Sampling clock output: BNC type, TTL level
Trigger output signal: BNC type, TTL level
Floppy Disk Drive
R9211E R9211A R9211B R9211C
Option 06 Standard Standard Standard
Type: 3.5 inch micro floppy disk
Media: 2DD/2HD (automatically identified)
Capacity: 720 K/1.2 M bytes (when formatted)
Format: Can be converted to MS-DOS format
File format: Data file, view file, table file
Data file operations: List, create, erase, search, copy
I/O + Memory Function
R9211E R9211A R9211B R9211C
Option 11 Option 11 Option 11 Standard
Memory capacity: 1 M words (2 M bytes)
Digital input: Digital input can be done with the internal A/D con-
verter, or an external digital signal (max. sampling rate 256 kHz)
Data format: 16 bit + EOC signal (offset binary)
134
Page 6

Digital output: Internal A/D converter data is output
Data format: 16 bit + channel identifier signal + strobe signal
(offset binary)
Comparator output: (R9211C) Comparator function output is
possible using O/C output
CMOS Memory Function
R9211E R9211A R9211B R9211C
Option 10 Option 10 Option 10 Option 10
1 M words (2 M bytes) battery backup memory
Thermal Printer
R9211E R9211A R9211B R9211C
Option 07 Option 07 Option 07 Option 07
Hard copy of CRT screen
Printing method: Thermal line/dot method
Dot configuration: 640 dots/line
Paper used: A09075
Paper width: 114 mm
Spectrum Analyzers
16-Bit Resolution, 100 kHz Portable Type
R9211Series
High speed calculation processor functions
R9211E R9211A R9211B R9211C
— Option 12 — Standard
High speed numerical calculations
Running Zoom Analysis Function (R9211A/9211C)
When the stop frequency is less than 10 kHz, the minimum span is
10 mHz. When the stop frequency is 10 kHz or more, zoom analysis
can be done with a minimum span of 100 mHz.
General Specifications
Operating conditions: Temperature +5 to +35˚C, RH 80% max.
Storage conditions: Temperature -20 to +60˚C
Power supply: Specify at time of ordering
Option no. Standard 32 42 44
Power voltage (V) 90 to 110 103 to 132 198 to 242 207 to 250
48 to 66 Hz
Power consumption: Standard
R9211E R9211A R9211B R9211C
140 VA max. 160 VA max. 170 VA max. 190 VA max.
External dimensions: Approx. 330 (W) × 177 (H) × 450 (D) mm
Mass: Main unit
R9211E R9211A R9211B R9211C
12 kg max. 14 kg max. 14 kg max. 16 kg max.
Accessories
Power Cable: A01402 (one)
Input Cables: MI-77 (two)
T-Type Connector
Accessories (Sold Separately)
A02804 Front Cover
R16211 Carrying Case
R16055 Transit Case
A02034 Panel Mount Set
A02255 Rack Mount Set (JIS standard)
A02455 Rack Mount Set (EIA standard)
135
 Loading...