

Page 1

Affordable, portable, ready for
cable system technicians: digital
channel 64 and 256QAM
transmission performance
verification measurements
The DMA120 Series Digital
Modulation Analyzers provide answers to nagging questions about how to test and
verify performance of your
digital plant. Quantification
of digital transmission performance – at any point in your
system – will greatly enhance
technical management and
decision making. The
DMA120 provides analysis of
ITU-T-J.83, Annex B 64 and
256QAM and the DMA121
verifies 64 and 256QAM formatted per DVB-C.
The DMA120 Series provides
the intelligence cable TV
technicians need to efficiently install and maintain
HFC distribution plant using
64 or 256QAM transmission.
Measurement results provide
a clear picture of system performance, minimizing the
need to re-visit an installation site or make additional
service calls. The DMA120
Series field tools are housed
in a rugged, weather resistant
package and are powered by
an easy-to-change NiMh battery. Standard accessories
include a protective soft case,
mains power supply, and
user’s manual.
Copyright © 1999 Tektronix, Inc. All rights reserved.
DMA120, DMA121
Digital Modulation
Analyzers
64 and 256QAM Analysis
In-service Digital Channel
Performance Verification
Measurements at an Affordable
Price
Measurements Compliant with DVB
(ETSI) Standard ETR290
Troubleshooting Aided by
Constellation, Spectrum, and
Equalization Display Modes
Most Measurements Require Only
Two Keystrokes
Pass/fail Indication Reduces
Training Requirements for
Technicians New to Digital Signal
Measurements
PC Card (PCMCIA) Slot for Easy
Memory Expansion
Small and Light Weight
Easy-change Battery
Page 2

page 2
Qualify System Performance
The built-in digital demodulator makes possible in-service measurements of:
• Modulation Error Ratio
(MER)
• Error Vector Magnitude
(EVM)
• Estimated Noise Margin
• BER before Reed-Solomon
(R-S) decoder
• Estimated BER after R-S
decoder with system availability statistics
Modulation Error Ratio
(MER): ETSI ETR290 indi-
cates that MER is the best
overall “figure of merit” measurement to determine QAM
signal quality. Although bit
error rate (BER) has been
widely addressed as an
important digital transmission “figure of merit” measurement, MER provides a
much earlier indication of
transmission impairments.
MER indicates the ratio of
average total signal power in
the ideal constellation to
average error power in the
constellation as received by
the DMA120 Series. The measurement includes error
power due to any impairment. If the only impairment
in the test channel spectrum
is noise, MER is equal to signal-to-noise. Technicians will
feel familiarity with MER
because results are expressed
in dB, similar to analog transmission carrier-to-noise or
signal-to-noise measurements. The DMA120 Series
measurement screen (see
Figure 1) shows MER vs.
time, providing trend information.
Error Vector Magnitude
(EVM): EVM is an alternative
“figure of merit” measurement. It has been a performance measurement for digital communication systems
in the past and provides a
means of system comparability for some engineers. The
same distortion elements are
measured as in MER. However, the calculation of error
is different and is expressed
as a percentage (%) of the
maximum voltage in the constellation (at sampling times)
as received by the DMA120
Series.
Estimated Noise Margin: The
legacy of rf broadband system
maintenance has been based
on measurements in the frequency domain. Technicians
are conditioned to thinking of
system “headroom” in terms
of dB carrier-to-noise or dBc
for CSO, CTB, or cross modulation. Estimated Noise Margin indicates the “headroom”
for digital channels and
results are reported in dB,
similar to legacy analog measurements. Essentially, simulated gaussian noise is added
to the input signal until a
critical pre-FEC BER of 10
–4
is measured. The added, simulated noise equals the Estimated Noise Margin which
answers the question, “how
many dB until subscribers are
receiving impaired digital
services?”
Bit Error Rate (BER) before
Reed-Solomon (R-S) decoding: BER is an important mea-
surement to document system performance. The typical
system operating goal is to
achieve a BER of 10–9. Service impairment will typically be observed at bit error
rates greater than 10–4. The
BER measurement is the average ratio of bit errors to total
bits received in a specified
time period. The DMA120
Series BER measurement may
be set for any period from 1
to 60 minutes. Results from
successive periods can be
compared to show a
24-period trend.
Figure 1. MER and Estimated Noise Margin screen.
Figure 2. BER screen.
Page 3
page 3
Estimated BER after R-S
decoding: BER after R-S
decoding represents the service level that the cable system is providing to the subscriber’s TV receiver or computer. The R-S decoder is
typically able to correct
errors up to an input BER of
approximately 10–4. Beyond
this value, uncorrected errors
pass through the decoder
– this is the value reported by
Estimated BER (see Figure 2).
System availability statistics
are also reported by the
DMA120 Series, including:
• Errored seconds (number of
seconds that include an
errored block)
• Severely errored seconds
(one-second periods with
greater than specified number of errored blocks)
• Severely disturbed periods
(duration of sync loss)
• System unavailability time
(time period containing at
least 10 consecutive
severely errored seconds)
System availability statistics
are very useful for tracking
intermittent impairments that
may not be observable based
on MER or average BER measurements.
Maintain and Troubleshoot Your
Digital Video Plant
When performance quality
measurements indicate transmission problems, the
DMA120 Series can provide
assistance to find out what’s
wrong. Additional measurements and display modes
that can help the technician
include:
• Channel Average Power
(Signal Level)
• Adjacent Channel Levels
• Spectrum Display Mode
• Constellation Display Mode
with zoom capability
• Adaptive Equalizer Display
Mode
Digital Channel Average
Power: RF signal level mea-
surement is made by integrating all the channel power
through a channel bandwidth
IF filter. A user-settable offset
is available to accommodate
probe loss. The Signal Level
measurement screen plots
signal levels vs. time, providing a convenient display from
which to make gain or attenuation adjustments or judge
other variables that can
impact signal level.
Adjacent Channel
Levels: Potential interference
to adjacent channels can be
verified using this measurement. The Adjacent Channel
Levels display compares the
test channel average power to
the average power in each of
the two higher and two lower
adjacent channels. The measurement results screen
includes a bar graph comparing the test channel and adjacent channels power. This
measurement may be used to
check flatness across five
channels or verify spectral
purity of a QAM modulator.
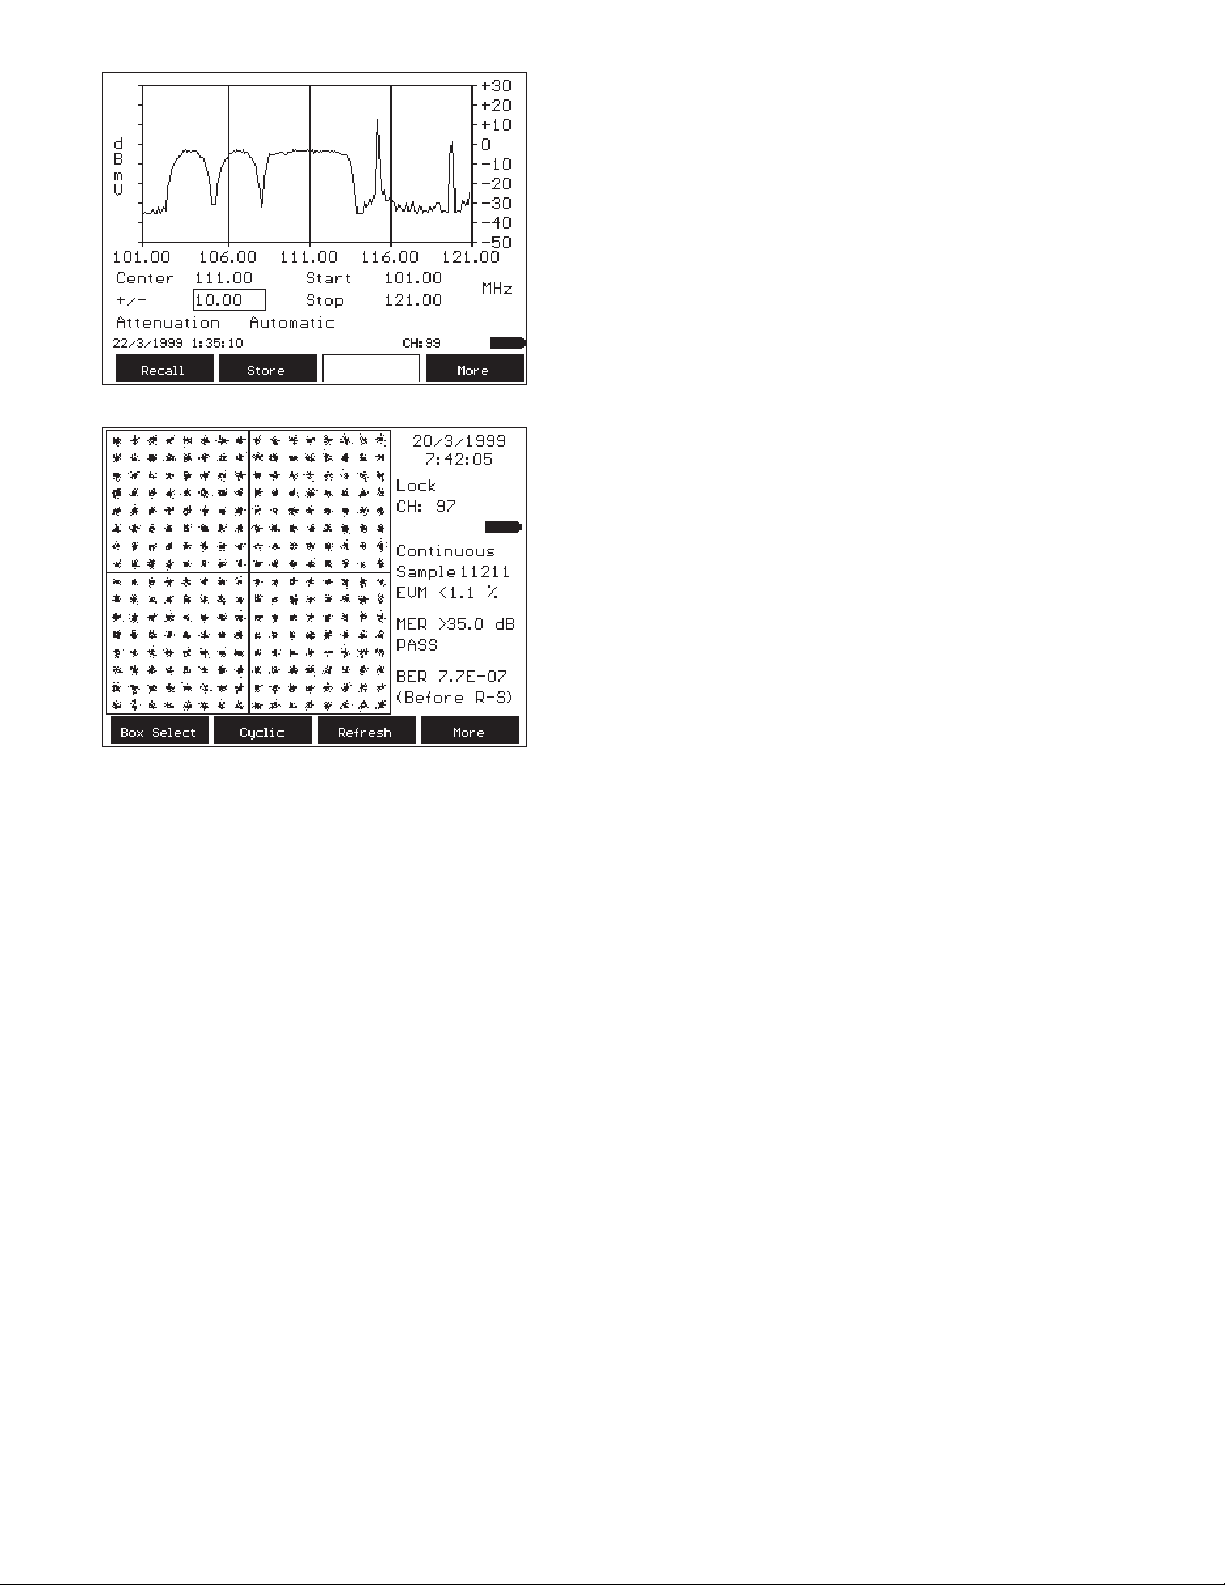
Spectrum Display Mode: The
channel or system spectrum
can be viewed in this mode
– channel symmetry and flatness, and relative signal levels can be visually confirmed
(see Figure 3).
Constellation Display
Mode: Digital modulation
quality can be visually estimated by viewing the constellation of the transmitted
signal (see Figure 4). Distribution impairments can be
identified including noise
and coherent interferers or
modulator impairments such
as I/Q imbalance or quadrature error. The DMA120
Series also includes two
zoom modes – a constellation
quadrant view and a single
constellation box can be
selected to closely examine
the distribution of symbol
landings. Decision boundaries are displayed along
with adjacent boxes to make
it easy to see the symbol
landing patterns (see
Figure 5).
Figure 3. Spectrum mode.
Figure 4. Constellation display mode.
Page 4

page 4
Adaptive Equalizer Display
Mode: This display indicates
linear impairments such as
poor frequency response and
reflections. Tap values show
how hard the equalizer is
working to compensate for
impairments. The display
includes a bar graph which
compares the values of the
different taps against a DVB
template. Bars approaching
or exceeding the template
value indicate that there is
noticeable system impairment detected at the test
point.
New Measurement Technology
That’s Easy-to-Use
Using the DMA120 Series is
easy. Most measurement
functions are no more than
two menus deep. Navigation
through menus is straight forward and there’s a MENU key
on the front panel that
instantly gets the user to the
instrument’s Main Menu
screen. Universal set up
parameters are part of a Set
Up screen. Measurement specific set up parameters are
part of the individual measurement screens.
Digital transmission is new to
most cable TV system technicians and so are measurements to verify performance.
Technicians may not understand exactly how these measurements function or how to
interpret measurement
results. However, measurements are still required to
continue system installation
and maintenance activities.
The DMA120 Series helps
technicians to continue working by providing measurement pass/fail indicators. The
system engineer or chief technician can determine the
measurement-result threshold values. This enables the
technician to continue working if measurements are passing or follow an Engineering
directive if failures are
encountered. Pass/fail indicators are available for: MER,
RF Signal Level, Adjacent
Channel Level, Channel
Power-to-Noise, Severely
Errored Seconds (BER mode).
Status indicators also help
clarify measurement conditions: the DMA120 Series
notes if it’s locking to the
incoming QAM signal and
also if it’s locking to the R-S
decoder output. The actual
received symbol rate is also
reported.
Operating Convenience
The DMA120 Series uses a
moisture– and dust-proof
keypad. It uses a high-resolution LCD display with backlight. Contrast controls are
conveniently located on the
front panel.
The DMA120 Series includes
many capabilities designed to
simplify the job of digital
plant installation and maintenance. Ancillary enhancements include:
• Print screen: Any measurement or display mode
screen can be directly
printed via RS-232 interface
• Up to 30 constellations or
100 other measurement
results can be stored in
internal memory with realtime clock/date stamp,
measurement site name,
operator name, and ambient temperature
• User-changeable input
adapter (type F or BNC
– optional accessory)
• PC Card (PCMCIA) input
for 2 and 20 Megabyte
memory cards to store
additional measurement
results and/or system channel tables
• User-changeable, NiMH
battery to extend the operating day; battery capacity
indicator; user-selectable
automatic power down
Figure 5. Constellation Box Evaluate mode.
Page 5

page 5
DMA 120
Series
Characteristics
NOTE: All specifications apply across the
operating temperature range (–5 to +40°C)
unless otherwise stated. All values refer to
measurement after 25-minute warmup. All
power measurements referenced to 75 Ω
impedance.
RECEIVER
Frequency Range (channel center
frequency) –
DMA120: 54 to 860 MHz.
DMA121: 50 to 866 MHz.
Resolution Bandwidths (typical) –
DMA120: 135 kHz, 6 MHz.
DMA121: 135 kHz, 8 MHz.
Input Impedance – 75 Ω, nominal.
Maximum Input –
RF Power: 120 dBµV (60 dBmV).
AC Volts: 90 V peak.
Distortion-free Dynamic Range – >40 dB.
Sensitivity – <20 dBµV (–40 dBmV).
DISPLAY MODES
Spectrum –
Displayed Level (average power of 64QAM
signal at 6.875 Msymb/s):
Minimum: 40 dBµV (–20 dBmV).
Maximum: 100 dBµV (40 dBmV).
Attenuation Steps: 5 dB, typical.
Attenuation Range: 35 dB, typical.
Vertical Scale: 10 dB/div, 10 to
90 dBµV, –50 to 30 dBmV, –100
to –20 dBm.
Span Settings: 2 to 824 MHz (fixed to
135 kHz RBW).
Flatness: ±1 dB.
Constellation –
Sizes: 64QAM, 256QAM.
Evaluation: Full constellation, quadrant,
single point (box).
Adaptive Equalizer –
Number of Taps:
DMA120: 8 feed-forward; 8 feed-back.
DMA121: 8 feed-forward; 24 feed-back.
Scale: +10 to –40 dBc.
Mask: DVB.
MEASUREMENT MODES
Signal Level –
Channel Bandwidth:
DMA120: 6 MHz.
DMA121: 8 MHz.
Level (channel average power):
Minimum: 40 dBµV/–20 dBmV.
Maximum: 100 dBµV/40 dBmV.
Accuracy:
64QAM: ±1.5 dB, referenced to 25°C.
256QAM: ±1.8 dB, referenced to 25°C.
Reference Units
(selectable): dBµV, dBmV, dBm, dBpW.
Pass/Fail Indication: User-adjustable
threshold.
In-service Measurement.
Channel Power-to-Noise –
Channel Bandwidth:
DMA120: 6 MHz.
DMA121: 8 MHz.
Maximum Ratio: 40 dB.
Accuracy: ±2.1 dB.
Pass/Fail Indication: User-adjustable
threshold.
In-service Measurement: Noise measurement frequency out of channel.
Adjacent Channel Level –
Difference Amplitude Range:
DMA120: +10 to –25 dB.
DMA121: +15 to –25 dB.
Accuracy: ±2.1 dB referenced to 25°C.
Display Vertical Scale: 40 to 100 dBµV,
–20 to 40 dBmV, –65 to –5 dBm, 25 to
85 dBpW.
Pass/Fail Indication: User-adjustable
threshold.
In-service Measurement.
Modulation Error Ratio (MER) –
Range:
64QAM: 22 to 35 dB.
256QAM, DMA120: 28 to 35 dB.
256QAM, DMA121: 30 to 35 dB.
Accuracy: ±1.5 dB at 65 dBµV/5 dBmV,
referenced to 25°C.
Pass/Fail Indication: User-adjustable
threshold.
In-service Measurement.
Error Vector Magnitude (EVM) –
Range:
64QAM: 1.2 to 4.1%.
256QAM: 1.1 to 1.9%.
Accuracy: ±0.4% over 1.2 to 2.0% range;
±0.8% over 2.1 to 4.1% range at
65 dBµV/5 dBmV.
In-service Measurement.
Average Bit Error Rate (BER), Before R-S
Decoding –
Range:
64QAM: 10–4to 10–9.
256QAM, DMA120: 10–4to 10–8.
256QAM, DMA121: 10–4to 10–6.
User-selectable Time Period: 1 to 60
minutes.
Number of Periods Comparable: 24.
In-service Measurement.
Estimated Average Bit Error Rate (BER),
After R-S decoding –
User-selectable Time Period: 1 to 60
minutes.
Number Periods Comparable: 24.
In-service Measurement.
System Availability Statistics –
User-selectable Time Period: 1 to 60
minutes.
Errored Seconds.
Severely Errored Seconds:
Pass/Fail indication: User-settable
threshold.
Unavailable Time.
Severely Disturbed Period.
In-service Measurement.
Estimated Noise Margin –
Range:
DMA120: 64QAM – 1 to 12 dB,
256QAM – 2 to 7 dB.
DMA121: 64QAM – 1 to 10 dB,
256QAM – 3 to 5 dB.
Accuracy: ±1.5 dB at 65 dBµV/5 dBmV.
Symbol Rate –
Range:
DMA120: 5.057 to 5.360 Msymb/s.
DMA121: 5.000 to 6.956 Msymb/s.
Page 6

page 6
DMA 120
Series
Characteristics
Continued
ENVIRONMENTAL
Temperature –
Operating: –5 to +40°C.
Altitude –
Operating: Up to 4,600 m (15,000 ft.).
Non-operating: Up to 15,000 m (50,000 ft.).
EMC COMPLIANCE
Qualified Per The Following Standards –
U.S.A./FCC: CFR 47, Part 15, Subpart B,
Class A.
Australian EMC Framework: AS/NZS
2064.1/2.
EU (EMC Directive 89/336EEC):
EN 55011 Class A.
IEC 1000-4-2 (ESD immunity).
IEC 801-3 (RF field immunity).
IEC 1000-4-4 (EFT/burst immunity).
POWER
DC Input Range – 12 V, 2 A.
Battery Run Time – >2.5 hours, typical.
Battery Charge Time (instrument off) –
4 hours, typical.
PHYSICAL CHARACTERISTICS
Dimensions cm in.
Height 32 12.5
Width 17 6.75
Depth 6 2.25
Weight kg lb.
Net 2.1 4.6
WARRANTY
One year parts and labor.
OTHER
Communication Interface – RS-232, speed
9600 to 115,200 baud.
Channel Tables – User-defined tables in
standard memory. Additional stored in PC
Card (PCMCIA) memory cards.
Page 7

page 7
DMA 120
Ordering
Information
DMA120
Digital Modulation Analyzer for ITU-T-J83,
Annex B 64QAM.
DMA121
Digital Modulation Analyzer for DVB-C
64QAM.
Both Include
User’s Manual, Reference Card, Padded
Carrying Case, 120 VAC North American
Power Pack with DMA120, 220 VAC Euro
Universal Power Pack with DMA121, Precision Female-Female Type F Adapter,Vehicle
Power Adapter, Channel Table Loader Software with Manual, RJ45 to 9-pin Adapter,
RJ45 Cable.
DMA120 Series Options
Option C3 – Three years calibration
services.
Option C5 – Five years calibration services.
Option R3 – Three years post-warranty
repair protection.
Option R5 – Five years post-warranty repair
protection.
AC Adapter Options
Option A0 – North American 115 V, 60 Hz
(standard with DMA120).
Option A1 – Euro Universal 220 V, 50 Hz
(standard with DMA121).
Option A2 – U.K. 240 VAC, 50 Hz.
Option A3 – Australian 240 V, 50 Hz.
DMA120 Series Recommended Accessories
Type F-to-BNC Input Adapter –
103-0310-00.
Additional Battery – DMABAT.
External Battery Charger for DMABAT –
DMACHG (specify power cord Option A2 or
A3, as applicable).
Thermal Printer – DMAPRN.
Includes: Five Rolls Paper, Battery, AC
Adapter.
Select one of following AC Adapter options:
Option A0 – North American 115 V, 60 Hz.
Option A1 – Euro Universal 220 V, 50 Hz.
Page 8

5/99 HB/XBS 21W-12235-2
Copyright © 1999, Tektronix, Inc. All rights reserved. Tektronix products are covered by U.S. and foreign patents, issued and pending. Information in this
publication supersedes that in all previously published material. Specification and price change privileges reserved. TEKTRONIX and TEK are registered
trademarks of Tektronix, Inc. All other trade names referenced are the service marks, trademarks or registered trademarks of their respective companies.
For further information, contact Tektronix:
Worldwide Web: for the most up-to-date product information visit our web site at: www.tektronix.com
ASEAN Countries (65) 356-3900; Australia & New Zealand 61 (2) 9888-0100; Austria, Central Eastern Europe, Greece, Turkey, Malta,& Cyprus +43 2236 8092 0; Belgium +32 (2) 715 89 70;
Brazil and South America 55 (11) 3741-8360; Canada 1 (800) 661-5625; Denmark +45 (44) 850 700;Finland +358 (9) 4783 400; France & North Africa +33 1 69 86 81 81; Germany + 49 (221) 94 77 400;
Hong Kong (852) 2585-6688; India (91) 80-2275577; Italy +39 (2) 25086 501; Japan (Sony/Tektronix Corporation) 81 (3) 3448-3111; Mexico, Central America, & Caribbean 52 (5) 666-6333;
The Netherlands +31 23 56 95555; Norway +47 22 07 07 00; People’s Republic of China 86 (10) 6235 1230; Republic of Korea 82 (2) 528-5299; South Africa (27 11)651-5222; Spain & Portugal +34 91 372 6000;
Sweden +46 8 477 65 00; Switzerland +41 (41) 729 36 40; Taiwan 886 (2) 2722-9622; United Kingdom & Eire +44 (0)1628 403300; USA 1 (800) 426-2200.
From other areas, contact: Tektronix, Inc. Export Sales, P.O. Box 500, M/S 50-255, Beaverton, Oregon 97077-0001, USA 1 (503) 627-6877.
 Loading...