

Page 1
Technical Datasheet
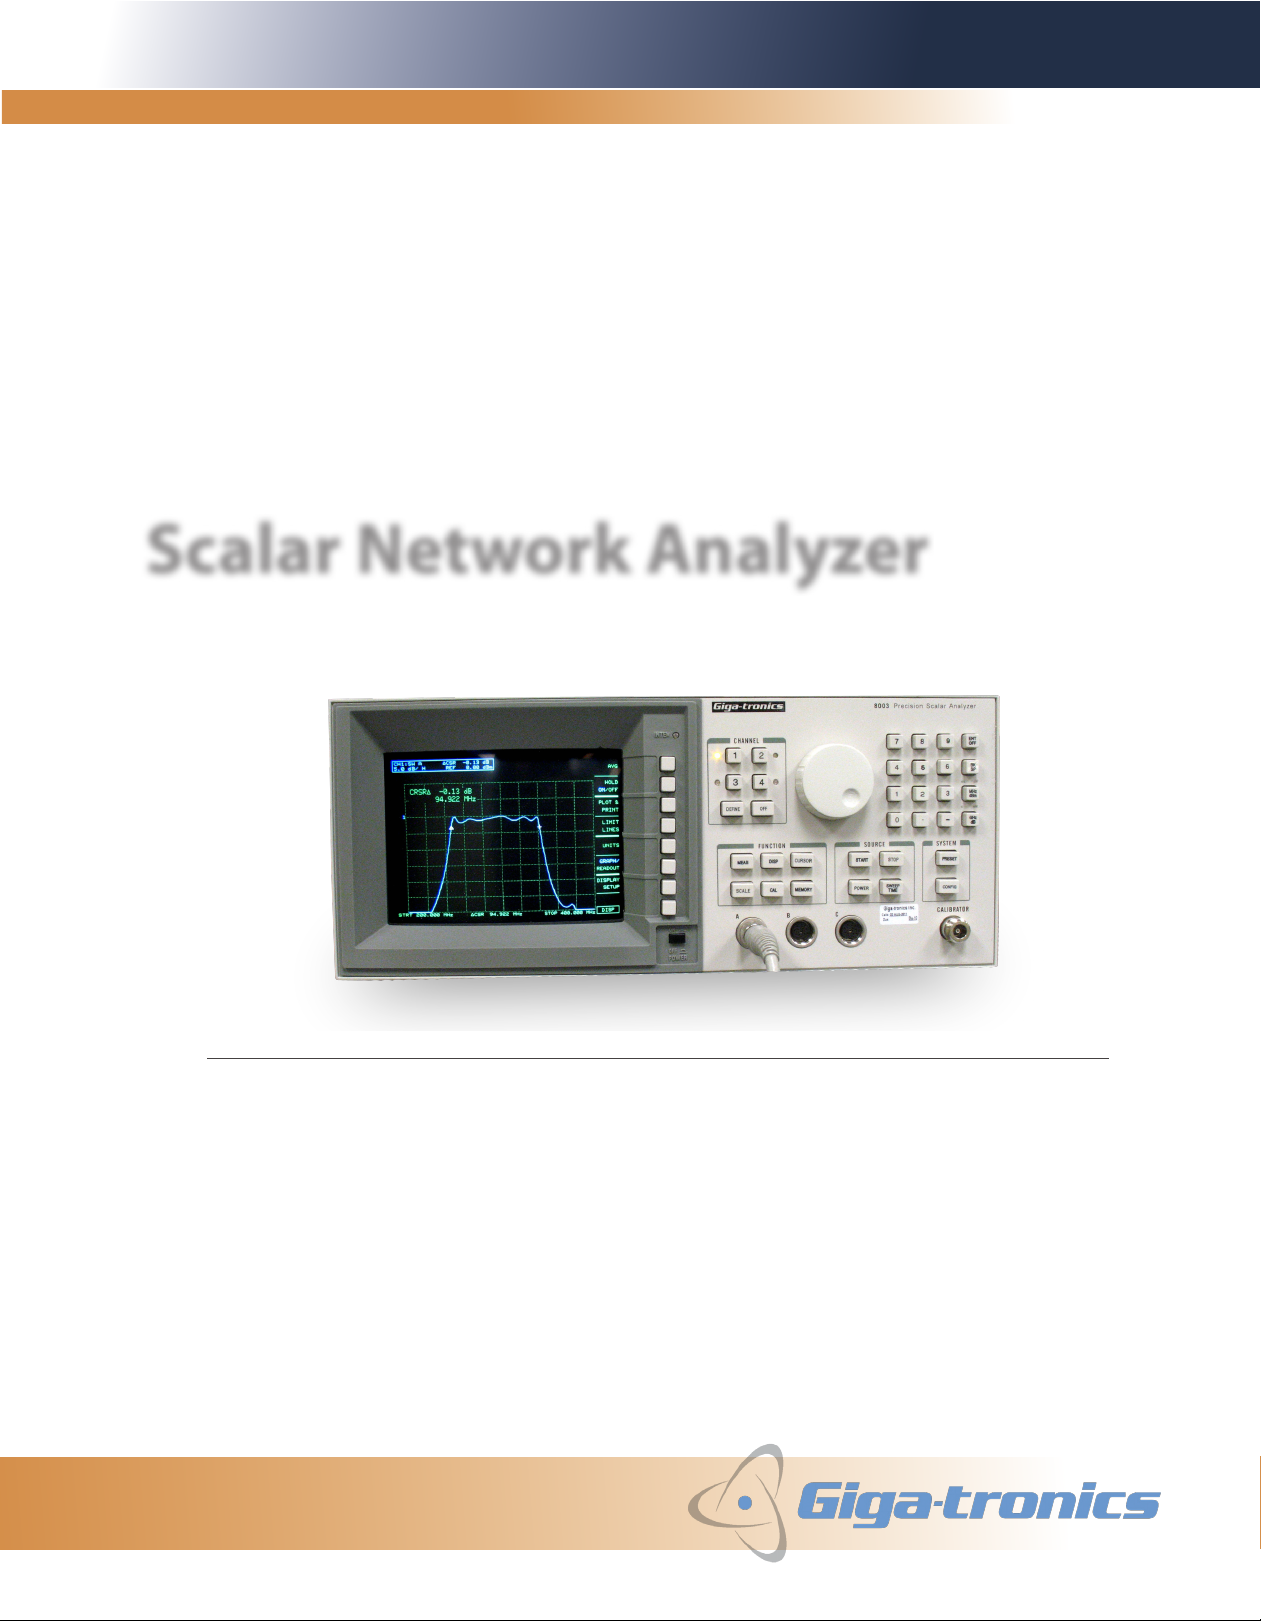
Scalar Network Analyzer
Model 8003 - 10 MHz to 40 GHz
The Giga-tronics Model 8003 Precision Scalar Network Analyzer combines a 90 dB wide
dynamic range with the accuracy and linearity of a power meter in a signal instrument.
35142Rev.A / US032012
Page 2
8003 Precision Scalar Network Analyzer
Wide Dynamic Range
The Model 8003 Precision Scalar Network Analyzer can make
accurate, single sensor power measurements over a frequency
range of 10 MHz to 40 GHz with a dynamic range of –70 to +20
dBm.
This wide dynamic range results from our unique use of switched
linear gain stages, with a maximum gain of more than 100 dB,
rather than the log ampliers typically used in other scalar
analyzers. In addion to wide dynamic range, our approach also
delivers extremely accurate low level measurements all the way
down to –70 dBm.
Power Meter Linearity
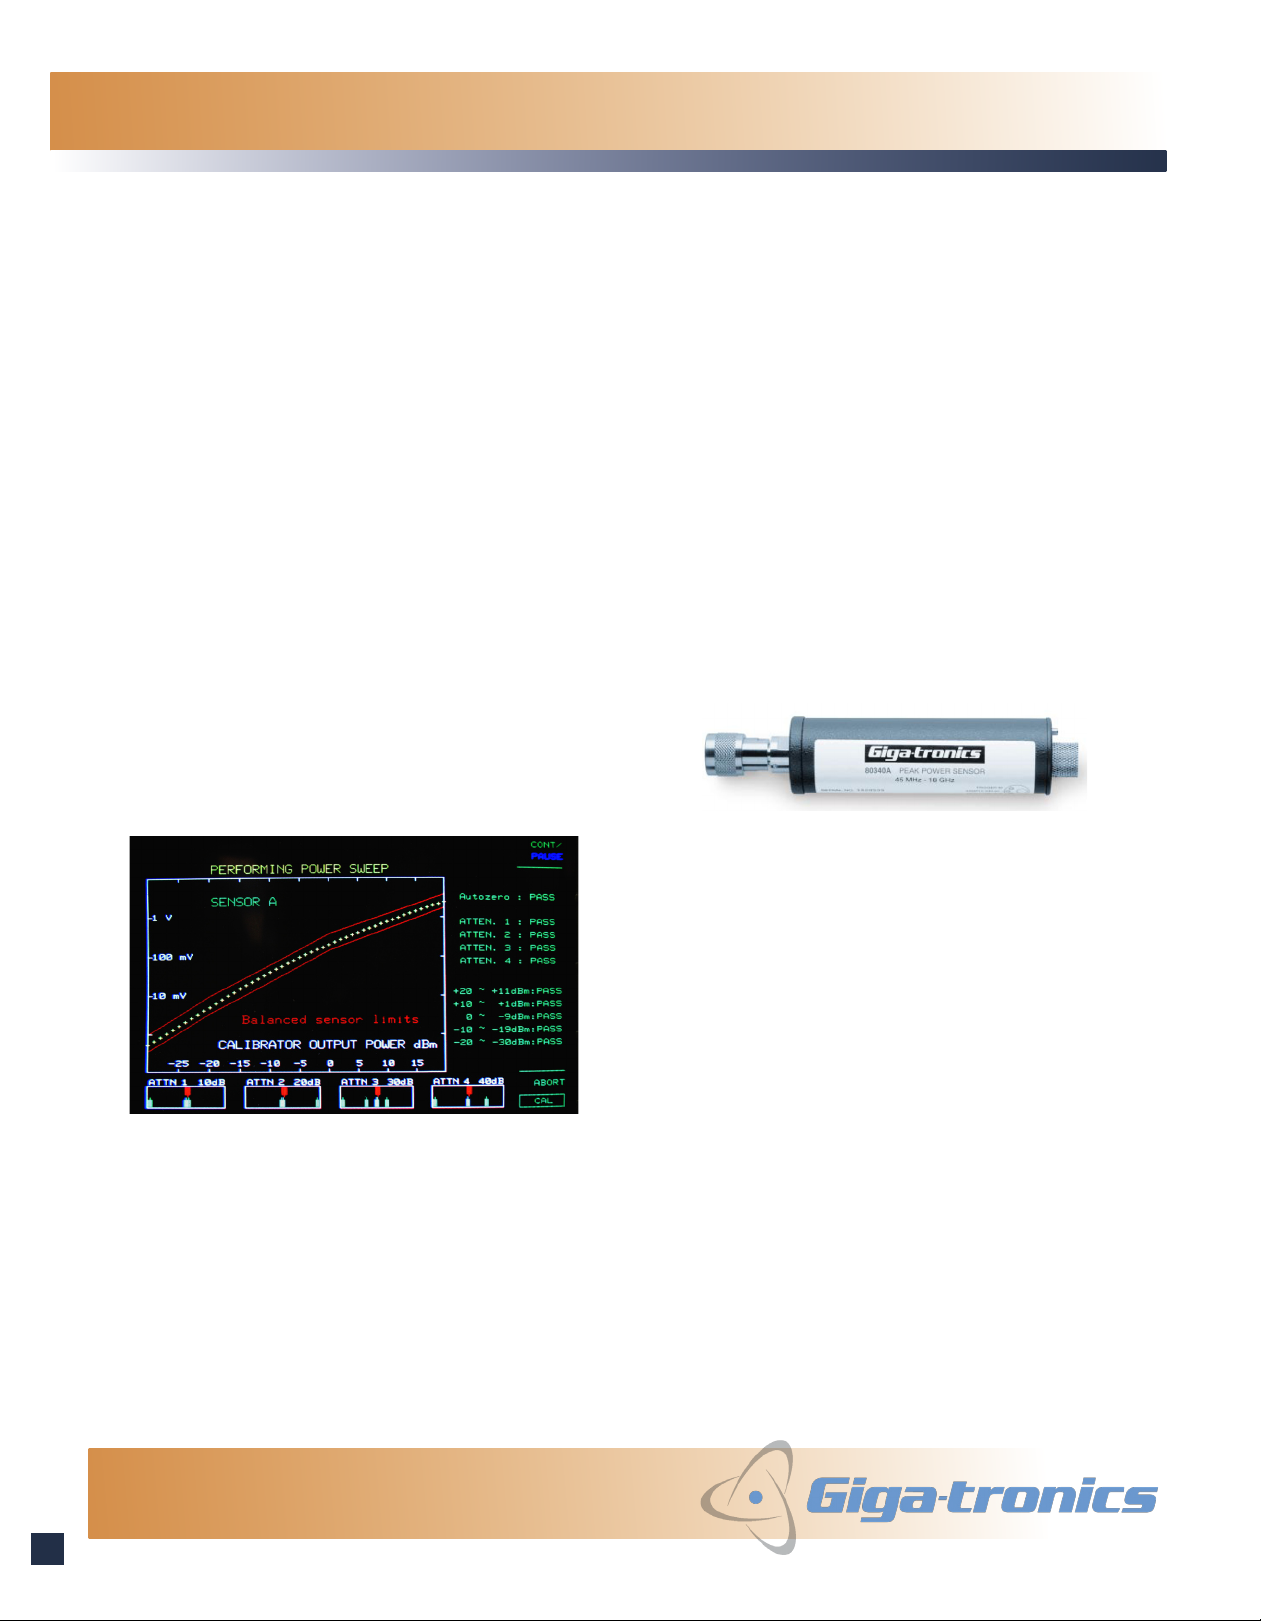
The Model 8003 also incorporates a unique, built-in power
sweep calibrator that linearizes the sensor’s diode response in
the non-square-law region, from –30 to +20 dBm. The calibraon
system uses the inherent linearity and stability of an ovenized
thermistor to accurately calibrate the high-speed diode sensors
from 0°C to 50°C. The result is a linearity specicaon of ± 0.02
dB (0.5%) over any 20 dB span and ± 0.04 dB (1%) over the
enre 90 dB dynamic range to ensure accurate rao or relave
measurements.
Absolute Power Measurements
The same built-in calibrator that linearizes the sensor provides a
1 mW signal accurate to within ±0.7%, stable over temperature
and me, and traceable to NIST. Each Giga tronics power sensor
contains an EEPROM programmed with the frequency calibraon
factors measured at the factory, or in your Cal Lab. When you
key in the frequency at which power is being measured, the
meter automacally applies the correct calibraon factor from
the sensor EEPROM.
The combinaon of an accurate, traceable calibraon reference
and an accurate frequency response curve for each power
sensor ensures absolute power measurements with power
meter accuracy.
Power Sensors to meet your Applicaon
Giga-tronics oers an extensive line of power sensors for
the Model 8003 to address a variety of power measurement
The Model 8003 incorporates a unique, built-in power sweep
calibrator.
The 80340 Series triggerable pulse sensors let you display
the response from a pulsed source.
applicaons. This includes standard CW power sensors, low
VSWR CW power sensors, true RMS sensors, and our unique
triggerable pulse sensors.
The 80340 Series triggerable pulse sensors let you display
the response from a pulsed source. You can choose between
two modes of operaon - measure with either a pulsed xed
frequency (CW mode), or with a pulsed swept frequency (start/
stop mode) signal from a sweeper (swept signal generator). The
sensors can also be used to display the response of devices with
no pulse modulaon on the signal generator.
35142-Rev.A/ US032012
1
Page 3

8003 Technical Specications
System Specicaons
Specicaons describe the instrument’s warranted performance,
and apply when using 80300A Series Power Sensors and 80500A
Series Bridges.
Frequency Range: 10 MHz to 40 GHz in coax using the Gigatronics 80300 Series power sensors and 80500 Series bridges.
Readout Modes:
dBm: single channel power measurement.
dB: relave power measurement
Lin: nW, μW, mW and Was: signal channel measurement.
%: dual channel measurement.
% Rel: dual channel measurement relave to a reference.
Power Range: +30 to -70 dBm, see power sensor specicaons.
System Dynamic Range:
CW Measurements: 90 dB
Peak Measurements: 40 dB
Swept Measurements: AC Mode 90 dB, DC Mode 80 dB
Inputs: Three idencal inputs, A, B and C, accept detected
outputs from the Giga-tronics power sensors and bridges.
Display
Screen: Full color display. Each channel can be assigned a
dierent color. Gracule color is selectable (default green).
Menus for so keys use color.
Display resoluon: 608 X 430 points.
Channels: Four channels can be used to select and
simultaneously display inputs from A, B and C sensors in single
channel or rao mode.
Display Modes
Graph/Readout: Graph mode displays swept frequency response
on screen. Readout mode displays power level at cursor
frequency or CW power levels in digital format on screen.
Graph Modes:
dBm: single channel power measurement.
dB: relave power measurement (rao or relave to trace
memory).
Display Mode Display Scale
Resoluon
dBm/dB 0.1 dB/div to 20
dB/div (1, 2, 5
sequence)
Display Range Vercal
Resoluon
-99.99 to +99.99 0.01
Channel Oset: -90 dB to +90 dB in .01 dB increments.
Autoscale: Automacally sets the scale factor, reference level
and reference posion to provide opmum display of acve
channel.
Averaging: 2, 4, 8, 16, 32, 64, 128, or 256 successive traces
(swept) or readings (CW) can be averaged to reduce eects of
noise on measurement.
Smoothing: Provides a linear moving average of adjacent data
points. The smoothing aperture denes the trace width (number
of data points) to be averaged. The smoothing aperture can be
set from 0.1% to 20% of the trace width.
Trace Memory: Ten traces can be individually labeled and stored
in non-volale memory and recalled. Stored traces can be
displayed, and trace dierences from any measurement can be
displayed.
Adapve Path Calibraon (Normalizaon): Traces are stored in
non-volale memory and normalized with the highest resoluon,
independent of display scale/division or oset. Up to 4,096
points for each trace are stored over the full frequency range of
the sweeper or any user selected frequency range. Normalizaon
data is automacally interpolated for ranges within the original
normalized range.
Sengs Store/Recall: Allows up to nine front panel setups, plus
a power down last instrument state, to be stored and recalled
from non-volale memory.
Limit Lines: Horizontal, sloped, and/or single point lines for each
trace can be set as go/no-go data limits. Limit lines are stored in
non-volale memory. Complex limit lines can be entered through
the front panel or via GPIB interface.
35142-Rev.A/ US032012
2
Page 4
8003 Precision Scalar Network Analyzer
Cursors and Markers
Cursor: The cursor can be posioned with the tuning knob or via the numeric keypad. The frequency and amplitude test data at the
cursor on all acve channels is digitally displayed.
Cursor Delta: Displays dierences in dB and frequency between the reference cursor and the main cursor.
Cursor Min/Max: Automacally moves the cursor to the minimum or maximum value of test data.
Cursor “x” dB: Automacally moves the cursor to the point on the trace equal to the value of “x” in dB or dBm.
Cursor “x” Bandwidth: Automacally displays cursors right and le of the cursor at the frequencies where the test data is equal to
the value of “x” dB, and displays the bandwidth between the cursors.
Ref to Cursor: Automacally changes the Ref Level to the level at the cursor.
Markers: Displays up to 10 markers generated by the 8003. The cursor can be moved directly to any marker or moved sequenally
through the markers.
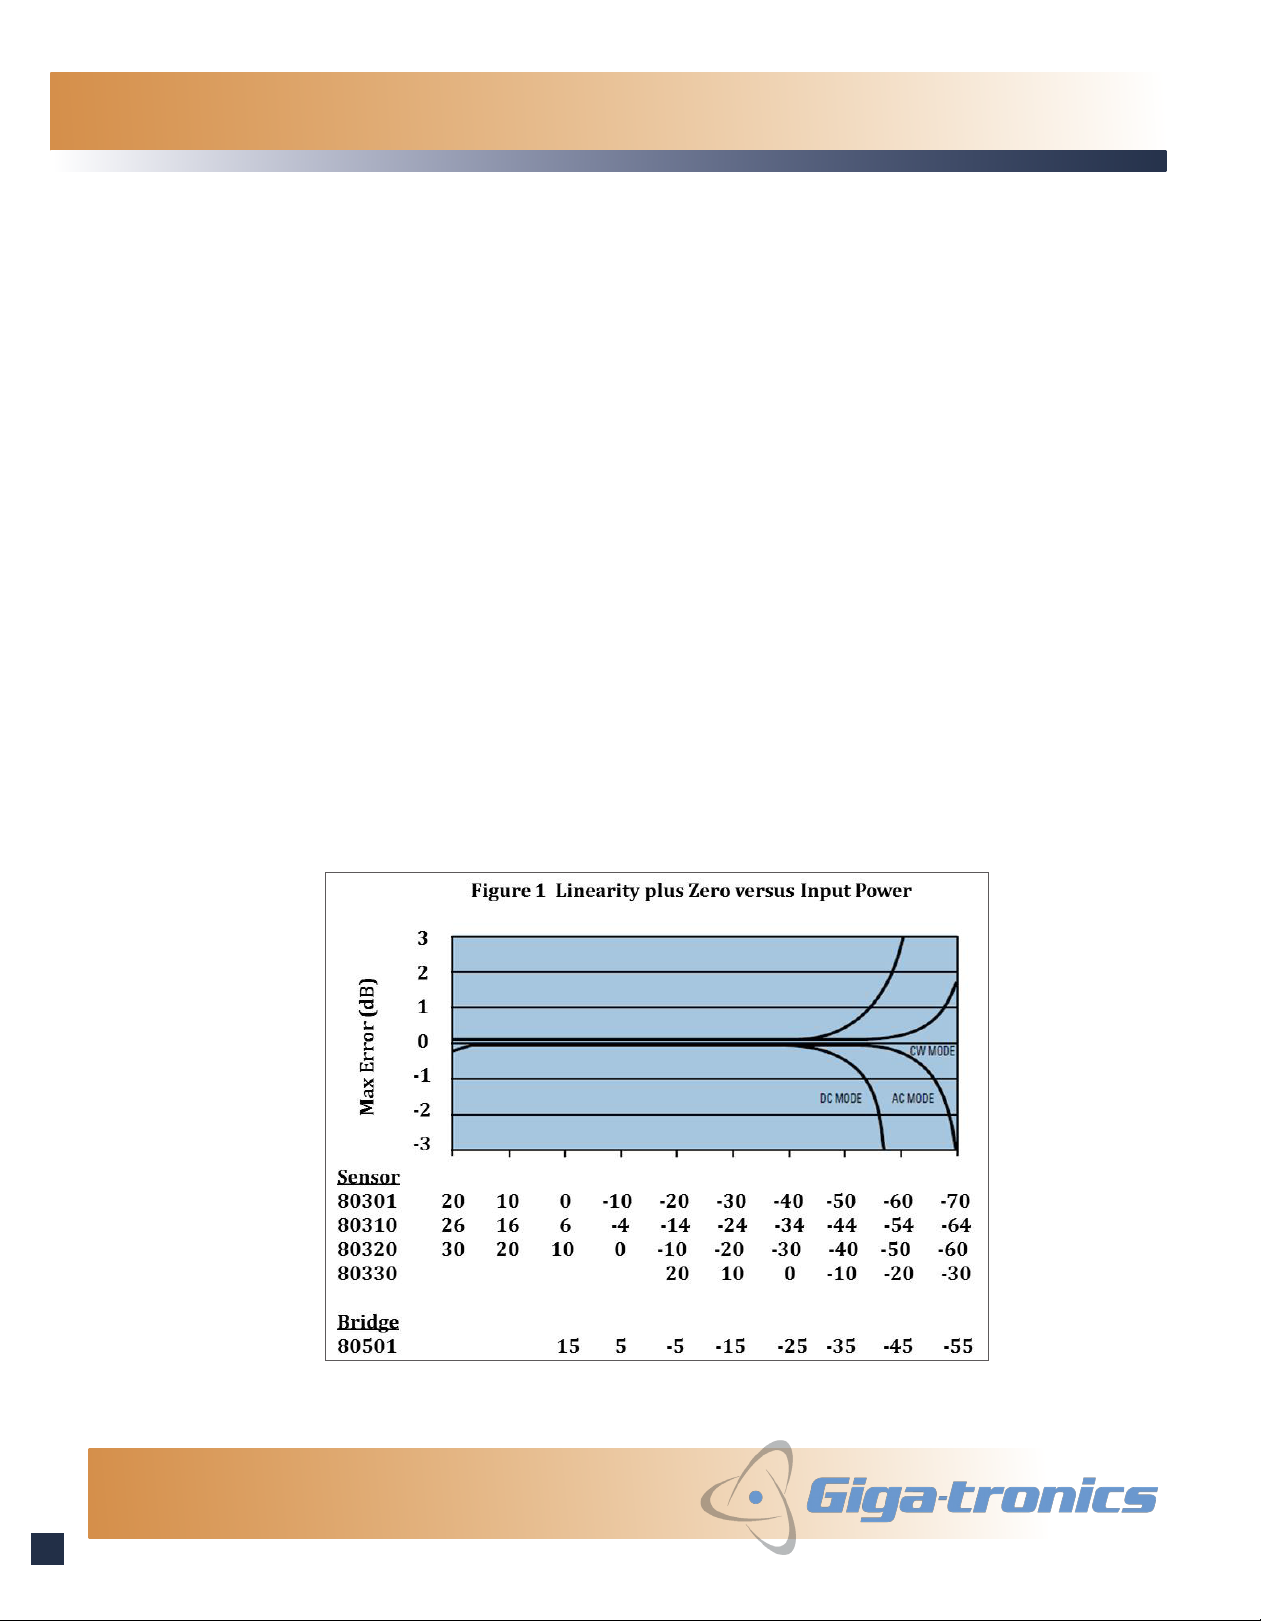
Accuracy
Transmission Loss or Gain Measurement: Transmission loss or gain measurements are made relave to a 0 dB reference point
established during calibraon. Therefore, frequency response errors of the source, sensors, and signal spling device are removed.
The remaining elements of uncertainty are mismatch error, instrument linearity (Fig. 1) and noise uncertainty given in the absolute
power accuracy secon.
35142-Rev.A/ US032012
3
Transmission Accuracy = Instrument Accuracy + Mismatch Uncertainty
Page 5

8003 Technical Specications
Reecon Measurements: When measuring devices with high return loss (>10 dB), reecon accuracy is typically dominated by the
eecve system direcvity (Fig. 2), instrument linearity errors, and noise uncertainty. With low return loss devices (<10 dB), reecon
accuracy is typically dominated by source match (Fig. 3). Calibraon with an open and short eecvely removes uncertaines due to
frequency response of the source, sensors, and signal spling device.
Reecon Accuracy = Instrument Accuracy + Reecon Bridge Accuracy
35142-Rev.A/ US032012
4
Page 6

8003 Precision Scalar Network Analyzer
Absolute Power Measurement Accuracy: The absolute power
measurement accuracy is determined by a number of factors
including calibrator accuracy, noise, sensor calibraon factor
error, and the mismatch uncertainty between sensor and device
under test.
Calibrator: Provides a 50 MHz calibraon signal at 51 very
accurately controlled levels from +20 to -30 dBm to dynamically
linearize the sensors.
Calibrator Frequency: 50 MHz nominal
Calibrator Connector: Type-N (f) precision connector, 50 Ω.
Seability: The 1.00 mW level in the power sweep is factory set
to ±0.7% traceable to the Naonal Instute of Standards and
Technology (NIST).
Accuracy: ±1.2% worst case for one year, over temperature
range 15°C to 35°C.
Calibrator VSWR: < 1.05:1 (Return Loss > 33 dB)
Instrument plus Power Sensor Linearity:
Temperature Coecient of Linearity: < 0.3%/°C temperature
change aer calibraon
Zeroing Accuracy, (CW Mode, Averaging Factor = 32):
Zero set: ±50 pW
Zero dri: < ±200 pW (typical) in 1 hour at constant
temperature aer at 24 hour warm-up.
Zeroing Accuracy, (Swept Mode, Averaging Factor = 32):
Zero set: ±50 pW (AC Detecon), ±800 pW (DC Detecon)
Zero dri: 2 nW (DC detecon), typical, in 1 hour at constant
temperature aer 24 hour warm-up. Zero dri not applicable
in AC detecon.
Noise Uncertainty: < 50 pW, typical, at constant temperature,
measured over a 1 minute interval, two standard deviaons.
Cal Factor Correcon: Manual or automac correcon to power
readings to compensate for frequency response variaons of the
power sensors and bridges.
Standard Sensors, CW Mode:
±0.02 dB (±0.5%) over any 20 dB range from +16 to -70 dBm
±0.02 dB + (+0 dB, -0.05 dB/dB) from +16 to +20 dBm
±0.04 dB (±1.0%) from +16 to -70 dBm
Standard Sensors, Swept Mode:
±0.03 dB (±0.7%) over any 20 dB range from +16 to -70 dBm
±0.03 dB + (+0 dB, -0.05 dB/dB) from +16 to +20 dBm
±0.06 dB (±1.4%) from +16 to -70 dBm
Low VSWR Sensors:
-64 to +20 dBm: Same as for Standard Sensors.
+20 to +30 dBm: Same as for Standard Sensors, plus an
addional ±0.13 dB (typical).
High Power Sensors:
-60 to +20 dBm: Same as for Standard Sensors.
+20 to +30 dBm: Same as for Standard Sensors, plus an
addional ±0.13 dB (typical).
True RMS Sensors, CW Mode:
±0.02 dB (±0.5%) over any 20 dB range from +20 to -30 dBm
±0.04 dB (±1.0%) from +20 to -30 dBm
True RMS Sensors, Swept Mode:
±0.03 dB (±0.7%) over any 20 dB range from +20 to -30 dBm
±0.06 dB (±1.4%) from +20 to -30 dBm
Manual: Cal Factor, Cal Frequency, O
Automac: Sweeper
General Specicaons
Temperature Range: Operang: 0°C to 50°C, Storage: -40°C to
70°C
Power Requirements: 100/120/220/240 V ±10%, 48 to 440 Hz,
200 VA
Physical Characteriscs: Dimensions: 45.1 cm (17.76 in) wide,
17.8 cm (7.00 in) high, 48.3 cm (19.00 in) deep. Weight: 16.6 Kg
(36.5 lbs)
35142-Rev.A/ US032012
5
Page 7

8003 Technical Specications
Rear Panel Inputs and Outputs
Sweep In (Sweep Voltage Requirements): (BNC connector). 0 to
+10 V nominal.
Blanking Input: (BNC connector) Used to blank the sweep
oscillator (swept signal generator) band switching points on the
8003 display. Voltage level: Blanked > 2 V; Un-blanked < 0.8 V
(typical)
Input 1: (BNC connector) TTL levels, used with some sweepers
(swept signal generator) to provide synchronizaon.
Direconal Bridges
The 80500 Series of Direconal Bridges are designed specically
for use with the 8003 to measure the return loss of a test device.
The bridges can be used in AC or DC detecon mode. Each
bridge includes an EEPROM which has been programmed with
idencaon data for that bridge.
Bridge Frequency Response: Calibrated return loss
measurements using the 8003 can be frequency compensated
using the standard “Open/Short” supplied with the bridge.
AC Modulaon Output: (BNC connector) Provides drive to
modulaon input on sweeper (swept signal generator) or
external modulator for use in AC detecon mode.
Bias Output: (BNC connector). Programmable output voltage
used to display family of curves.
Voltage range: +/-10 V.
Current compliance: Source or sink 150 mA max.
System GPIB: (GPIB connector) Used to connect 8003 to GPIB
system controller.
Private GPIB: (GPIB connector) Used to connect 8003 to
dedicated signal generator, ploer or printer.
RS232 Port: Serial Communicaons Interface for driving legacy
serial printers and ploers.
Inseron Loss: 6.5 dB nominal from input port to test port.
Detector Polarity: Negave
Maximum Input Power: +27 dBm (0.5 W)
Direconal Bridge Accessories: Open/Short is included
for establishing the 0 dB return loss reference during path
calibraon.
35142-Rev.A/ US032012
6
Page 8

8003 Technical Specications
Giga-tronics CW Power Sensor Selection Guide
Frequency Range /
Power Rangee
200 mW CW Power Sensors
80301A
80302A
80303A
80304A
10 MHz to 18 GHz
-70 to +20 dBm
10 MHz to 18 GHz
-70 to +20 dBm
10 MHz to 26.5 GHz
-70 to +20 dBm
10 MHz to 40 GHz
-70 to 0 dBm
Low VSWR CW Power Sensors
80310A
80313A
80314A
10 MHz to 18 GHz
-64 to +26 dBm
10 MHz to 26.5 GHz
-64 to +26 dBm
10 MHz to 40 GHz
-64 to +6 dBm
1 W CW Power Sensors
80320A
80323A
80324A
10 MHz to 18 GHz
-60 to +30 dBm
10 MHz to 26.5 GHz
-60 to +30 dBm
10 MHz to 40 GHz
-60 to +10 dBm
Maximum Power
+23 dBm (200 mW)
+23 dBm (200 mW)
+23 dBm (200 mW)
+23 dBm (200 mW)
+29 dBm (800 mW)
+29 dBm (800 mW)
+29 dBm (800 mW)
+30 dBm (1 W)
+30 dBm (1 W)
+30 dBm (1 W)
Power Linearity
(Frequency > 8 GHz)
-70 to -20 dBm: ±0.00 dB
-20 to +20 dBm: ±0.05 dB/10 dB
-70 to -20 dBm: ±0.00 dB
-20 to +20 dBm: ±0.05 dB/10 dB
-70 to -20 dBm: ±0.00 dB
-20 to +20 dBm: ±0.1 dB/10 dB
-70 to -20 dBm: ±0.00 dB
-20 to 0 dBm: ±0.2 dB/10 dB
-64 to -14 dBm: ±0.00 dB
-14 to +26 dBm: ±0.05 dB/10 dB
-64 to -14 dBm: ±0.00 dB
-14 to +26 dBm: ±0.1 dB/10 dB
-64 to -14 dBm: ±0.00 dB
-14 to +6 dBm: ±0.2 dB/10 dB
-60 to -10 dBm: ±0.00 dB
-10 to +30 dBm: ±0.05 dB/10 dB
-60 to -10 dBm: ±0.00 dB
-10 to +30 dBm: ±0.1 dB/10 dB
-60 to -10 dBm: ±0.00 dB
-10 to +10 dBm: ±0.2 dB/10 dB
1
RF
Connector
Type N(m)
50 Ω
APC-7
50 Ω
Type K(m)
50 Ω
Type K(m) 2
50 Ω
Type K(m) 2
50 Ω
Length Diameter Weight VSWR
2
114.5 mm
(4.5 in)
114.5 mm
(4.5 in)
114.5 mm
(4.5 in)
114.5 mm
(4.5 in)
127 mm
(5.0 in)
32 mm
(1.25 in)
32 mm
(1.25 in)
32 mm
(1.25 in)
32 mm
(1.25 in)
32 mm
(1.25 in)
0.18 kg
(0.4 lb)
0.18 kg
(0.4 lb)
0.18 kg
(0.4 lb)
0.18 kg
(0.4 lb)
0.23 kg
(0.5 lb)
1.12 : 0.01 - 2 GHz
1.22 : 2 - 12.4 GHz
1.29 : 12.4 - 18 GHz
1.12 : 0.01 - 2 GHz
1.22 : 2 - 12.4 GHz
1.38 : 12.4 - 18 GHz
1.43 : 18 - 26.5 GHz
1.92 : 26.5 - 40 GHz
1.13 : 0.01 - 2 GHz
1.16 : 2 - 12 GHz
1.23 : 12 - 18 GHz
1.29 : 18 - 26.5 GHz
1.50 : 26.5 - 40 GHz
Type K(m) 2
50 Ω
127 mm
(5.0 in)
32 mm
(1.25 in)
0.23 kg
(0.5 lb)
1.11 : 0.01 - 2 GHz
1.12 : 2 - 12 GHz
1.18 : 12 - 18 GHz
1.22 : 18 - 26.5 GHz
1.36 : 26.5 - 40 GHz
Giga-tronics True RMS Power Sensors Selection Guide (fm > 1.5 MHz)
Frequency Range /
Power Range
Maximum Power
True RMS Sensors (-30 dBm to +20 dBm)
80330A
80333A
80334A
1
Includes System Linearity.
2
The K connector is electrically and mechanically compatible with the APC-3.5 and SMA connectors. Note: Use a Type N(m) to SMA(f) adapter (part no. 29835) for calibration of power sensors with Type K(m)
connectors.
10 MHz to 18 GHz
10 MHz to 26.5 GHz
10 MHz to 40 GHz
+33 dBm (2 W) -30 to +20 dBm: ±0.00 dB
Power Linearity 1
(Frequency > 8 GHz)
RF
Connector
Type K(m)
50 Ω
Length Diameter Weight VSWR
2
152 mm
(6.0 in)
32 mm
(1.25 in)
0.27 kg
(0.6 lb)
1.12 : 0.01 - 2 GHz
1.15 : 12 - 18 GHz
1.18 : 18 - 26.5 GHz
1.29 : 26.5 - 40 GHz
35142-Rev.A/ US032012
7
Page 9

8003 Technical Specications
Giga-tronics Triggerable Pulse Power Sensors Selection Guide
Frequency Range /
Power Range
200 mW Triggerable Pulse Power Sensors
80340A
80343A
80344A
50 MHz to 18 GHz
-20 to +20 dBm (Triggered)
-30 to + 20 dBm (Free Run)
50 MHz to 26.5 GHz
-20 to +20 dBm (Triggered)
-30 to + 20 dBm (Free Run)
50 MHz to 40 GHz
-20 to +0.0 dBm (Triggered)
-30 to +0.0 dBm (Free Run)
Maximum Power
+23 dBm (200 mW)
+23 dBm (200 mW)
+23 dBm (200 mW) ±0.13 dB, 0 dBm to -30 dBm Type K(m)
Giga-tronics Bridge Selection Guide
Frequency Range /
Power Range
Precision CW Return Loss Bridges
80501
80502
80503
80504
10 MHz to 18 GHz
-35 to +20 dBm
10 MHz to 18 GHz
-35 to +20 dBm
10 MHz to 26.5 GHz
-35 to +20 dBm
10 MHz to 40 GHz
-35 to +20 dBm
Maximum Power
+27 dBm (0.5 W)
+27 dBm (0.5 W)
+27 dBm (0.5 W)
+27 dBm (0.5 W)
Power Linearity 1
(Frequency > 8 GHz)
±0.13 dB, 0 dBm to -30 dBm
±0.13 dB, ±0.01 dB dB/dB
from 0 dBm to +20 dBm
±0.13 dB, 0 dBm to -30 dBm
±0.13 dB, ±0.01 dB dB/dB
from 0 dBm to +20 dBm
Power Linearity
(Frequency > 8 GHz)
-35 to +10 dBm: ±0.1 dB
+10 to +20 dBm: ±0.1 dB
±0.005 dB/dB
-35 to +10 dBm: ±0.1 dB
+10 to +20 dBm: ±0.1 dB
±0.005 dB/dB
-35 to +10 dBm: ±0.1 dB
+10 to +20 dBm: ±0.1 dB
±0.005 dB/dB
-35 to +10 dBm: ±0.1 dB
+10 to +20 dBm: ±0.1 dB
±0.005 dB/dB
RF
Connector
Type N(m)
Type K(m)
1
Input Test Port Directivity Weight VSWR
Type N(f)
50 Ω
Type N(f)
50 Ω
SMA(f)
50 Ω
Type K(f)
50 Ω
Length Diameter Weight VSWR
14.6 cm
(5.75 in)
14.6 cm
(5.75 in)
14.6 cm
(5.75 in)
Type N(f)
50 Ω
APC-7(f)
50 Ω
SMA(f)
50 Ω
Type K(f)
50 Ω
3.7 cm
(1.44 in)
3.7 cm
(1.44 in)
3.7 cm
(1.44 in)
38 dB 0.340 kg
40 dB 0.340 kg
35 dB 0.340 kg
30 dB 0.198 kg
0.3 kg
(0.7 lb)
0.3 kg
(0.7 lb)
0.3 kg
(0.7 lb)
1.12 : 0.5 - 2 GHz
1.22 : 2 - 12.4 GHz
1.37 : 12.4 - 18 GHz
1.50 : 18 - 26.5 GHz
1.92 : 26.5 - 40 GHz
<1.17:0.01 - 8 GHz
<1.27:8 - 18 GHz
<1.13:0.01 - 8 GHz
<1.22:8 - 18 GHz
<1.22:0.01 - 8 GHz
<1.27:18 - 26.5 GHz
<1.35:0.01 - 26.5 GHz
<1.44:26.5 - 40 GHz
Sensor Calibration Factor Uncertainties
Frequency (GHz) Root Sum of Squares (RSS) Uncertainties (%)
80303A
80301A 80304A 80310A 80320A 80330A
80302A 80343A 80313A 80323A 80333A
Lower Upper 80340A 80344A 80314A 80324A 80334A
0.1 1 1.04 1.64 1.58 1.58 1.58
1 2 1.20 1.73 1.73 1.73 1.73
2 4 1.33 1.93 1.91 1.91 1.90
4 6 1.41 2.03 2.02 2.01 2.01
6 8 1.52 2.08 2.07 2.06 2.06
8 12.4 1.92 2.55 2.54 2.53 2.53
12.4 18 2.11 2.83 2.80 2.79 2.78
18 26.5 - 3.63 3.68 3.62 3.59
26.5 40 - 6.05 5.54 5.39 5.30
3
Square root of sum of the individual uncertainties squared (RSS)
3
35142-Rev.A/ US032012
8
Page 10

8003 Technical Specications
Swept Signal Generator Control
The Model 8003 Precision Scalar Network Analyzer can control the Giga-tronics 2500B
series Microwave Signal Generators covering 10 MHz to 40 GHz, as well as several
swept microwave signal generators from other manufacturers.
Giga-tronics 2500B Series Microwave Signal Generator
Compable Signal Generators
System Integrated: The Model 8003 Precision Scalar Network Analyzer can control the Giga-tronics 2500B series Microwave Signal
Generators covering 10 MHz to 40 GHz, as well as several swept microwave signal generators from other manufacturers.
Operator Integrated: The 8003 is compable with any signal source meeng the following requirements:
Horizontal Ramp: Provides 0 to +10 V nominal ramp signal.
Blanking Signal: Provides a TTL level during retrace and band switching.
Modulaon:
AC Detecon Mode: A square wave is provided by the analyzer to modulate the signal source.
Frequency: 1 KHz nominal
On/O rao: > 30 dB
35142-Rev.A/ US032012
9
Page 11

Ordering Information
Giga-tronics has a network of RF and Microwave instrumentation sales engineers and a staff of factory support personnel to help you find the best, most economical
instrument for your specific applications. In addition to helping you select the best instrument for your needs, our staff can provide quotations, assist you in placing
orders, and do everything necessary to ensure that your business transactions with Giga-tronics are handled efficiently.
Model Number Descripon
8003 Microwave Scalar Network Analyzer (includes three 20954-001 sensor cables)
Opons for 8003:
Opon 01 Rack Mount Kit
Power Sensor Opons:
20954-001 1.5 meter cable (5 feet)
20954-002 3.0 meter cable (10 feet)
20954-003 7.6 meter cable (25 feet)
20954-004 15.2 meter cable (50 feet)
Recommended Accessories:
21044 18 GHz Aenuator Calibraon Kit
21049 26.5 GHz Aenuator Calibraon Kit
Oponal Accessories:
JRNA-00000 Type-N (f) to (f) Adapter
JRNC-00000 Type-N (f) to (m) Adapter
JRNT-00050 Type-N (m) 50 Ohm Terminaon
Giga-tronics Support Services
At Giga-tronics, we understand the challenges you face. Our support services begin from the moment you call us. We help you achieve both top-line growth and
bottom-line efficiencies by working to identify your precise needs and implement smart and result orientated solutions. We believe and commit ourselves in
providing you with more than our superior test solutions. For technical support, contact:
Toll free: 1-800-726-4442(USA & Canada) / +1 925.328.4650 (International)
Email: support@gigatronics.com
Updates
All data is subject to change without notice. For the latest information on Giga-tronics products and applications, please visit:
http://www.gigatronics.com
35142-Rev.A/ US032012
10
Page 12

©2012 Giga-tronics Incorporated. All Rights Reserved. All trademarks are the property of their respecve owners.
 Loading...