

Page 1
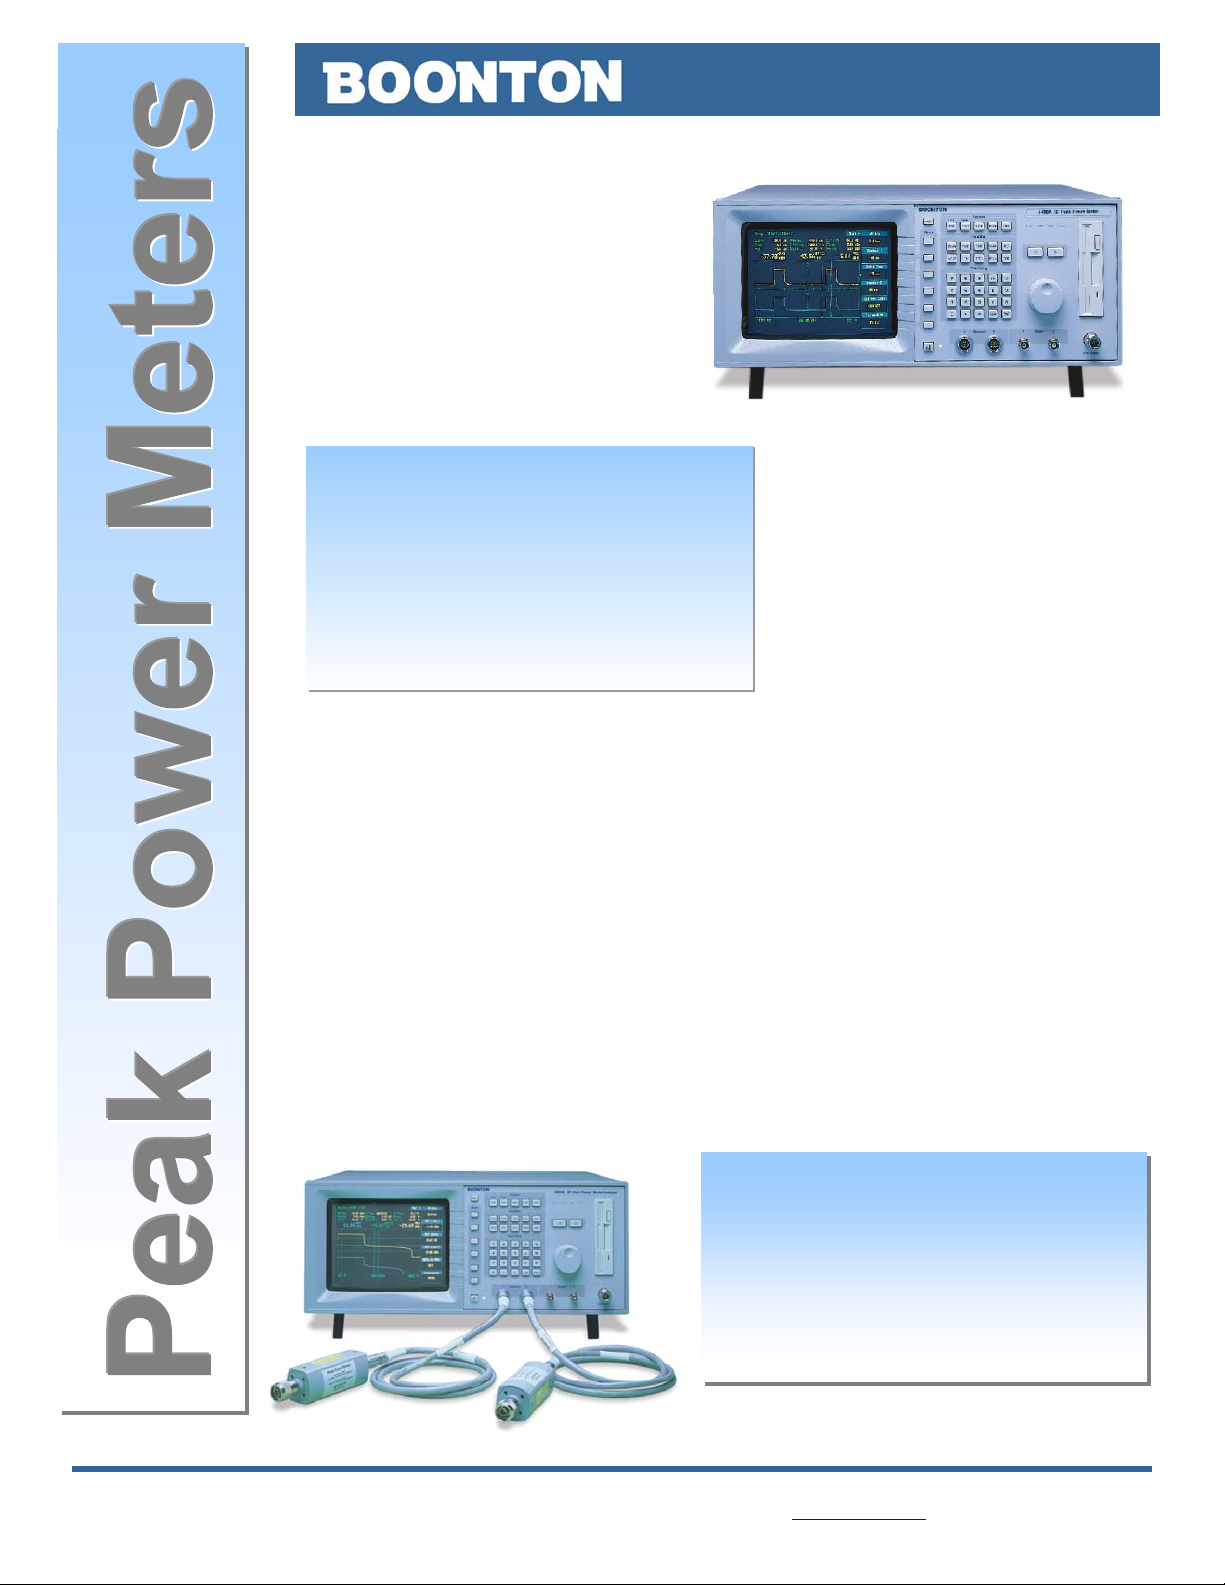
4400A RF Peak Power Meter
The Boonton Model 4400A is the
instrument of choice for viewing and
analyzing RF power in the time domain.
Whether you are analyzing radar, pulse
bursts, GSM or TDMA wireless signals,
broadcast TV and radio transmitters, or
any RF signal in which the powerversus-time relationship must be
accurately measured and recorded, the
Model 4400A is the instrument for you.
Fast display updates and GPIB
· >60-dB dynamic range
· Frequency range: 30 MHz to 40 GHz
· 1-GHz NIST Traceable Calibrator
· Color VGA display
· 1-Msa/sec. Sampling rate
· 14 automatic measurements
· Parallel printer port
· PC-compatible 1.44-MB floppy
60-dB dynamic range (sensor dependent) without any range switching, channel math on
active and reference (saved) traces, and Boonton’s wide selection of Peak Power Sensors
round out the Model 4400A’s industry-leading capabilities.
measurements save you time and
gather data faster than ever
before. The PC-compatible 1.44MB floppy drive can store data
such as front panel setups and
trace waveforms, and you can
print or plot the display to disk for
later printing or to import into your
documents.
Flexible triggering, greater than
4500A RF Peak Power Meter/Analyzer
For analyzing RF signals with digital modulation, multiple carriers or today’s complex
coding techniques, the Boonton Model 4500A yields the answers that designers and
manufacturers of state-of-the-art wireless communications systems demand. Hard-tomeasure HDTV and spread-spectrum signals like CDMA and WCDMA are now easy to
view and analyze, thanks to the innovative capabilities of the Model 4500A.
Along with all the time-domain measurements of Boonton’s Model 4400A, the Model
4500A adds a host of statistical measurements that are made on a continuously sampled
RF signal. Adding the second input channel to these capabilities allows you to monitor two
sources, such as input and output power, simultaneously. Powerful math functions can be
used to analyze the differences between channels, making difficult measurements like
output stage compression and intermodulation distortion easy to identify and to correct.
· >60-dB dynamic range
· Frequency range: 30 MHz to 40 GHz
· Dual-channel CDF/PDF
· 1-GHz NIST Traceable Calibrator
· Synchronous/asynchronous
measurements
· Color VGA display
· PC-compatible 1.44-MB floppy
BOONTON ELECTRONICS (A Wireless Telecom Group Company)
P.O. Box 465, Parsippany, New Jersey 07054-0465 · Tel: (973) 386-9696 · Fax: (973) 386-9191 · E-mail: sales@boonton.com · Website: www.boonton.com
Page 2
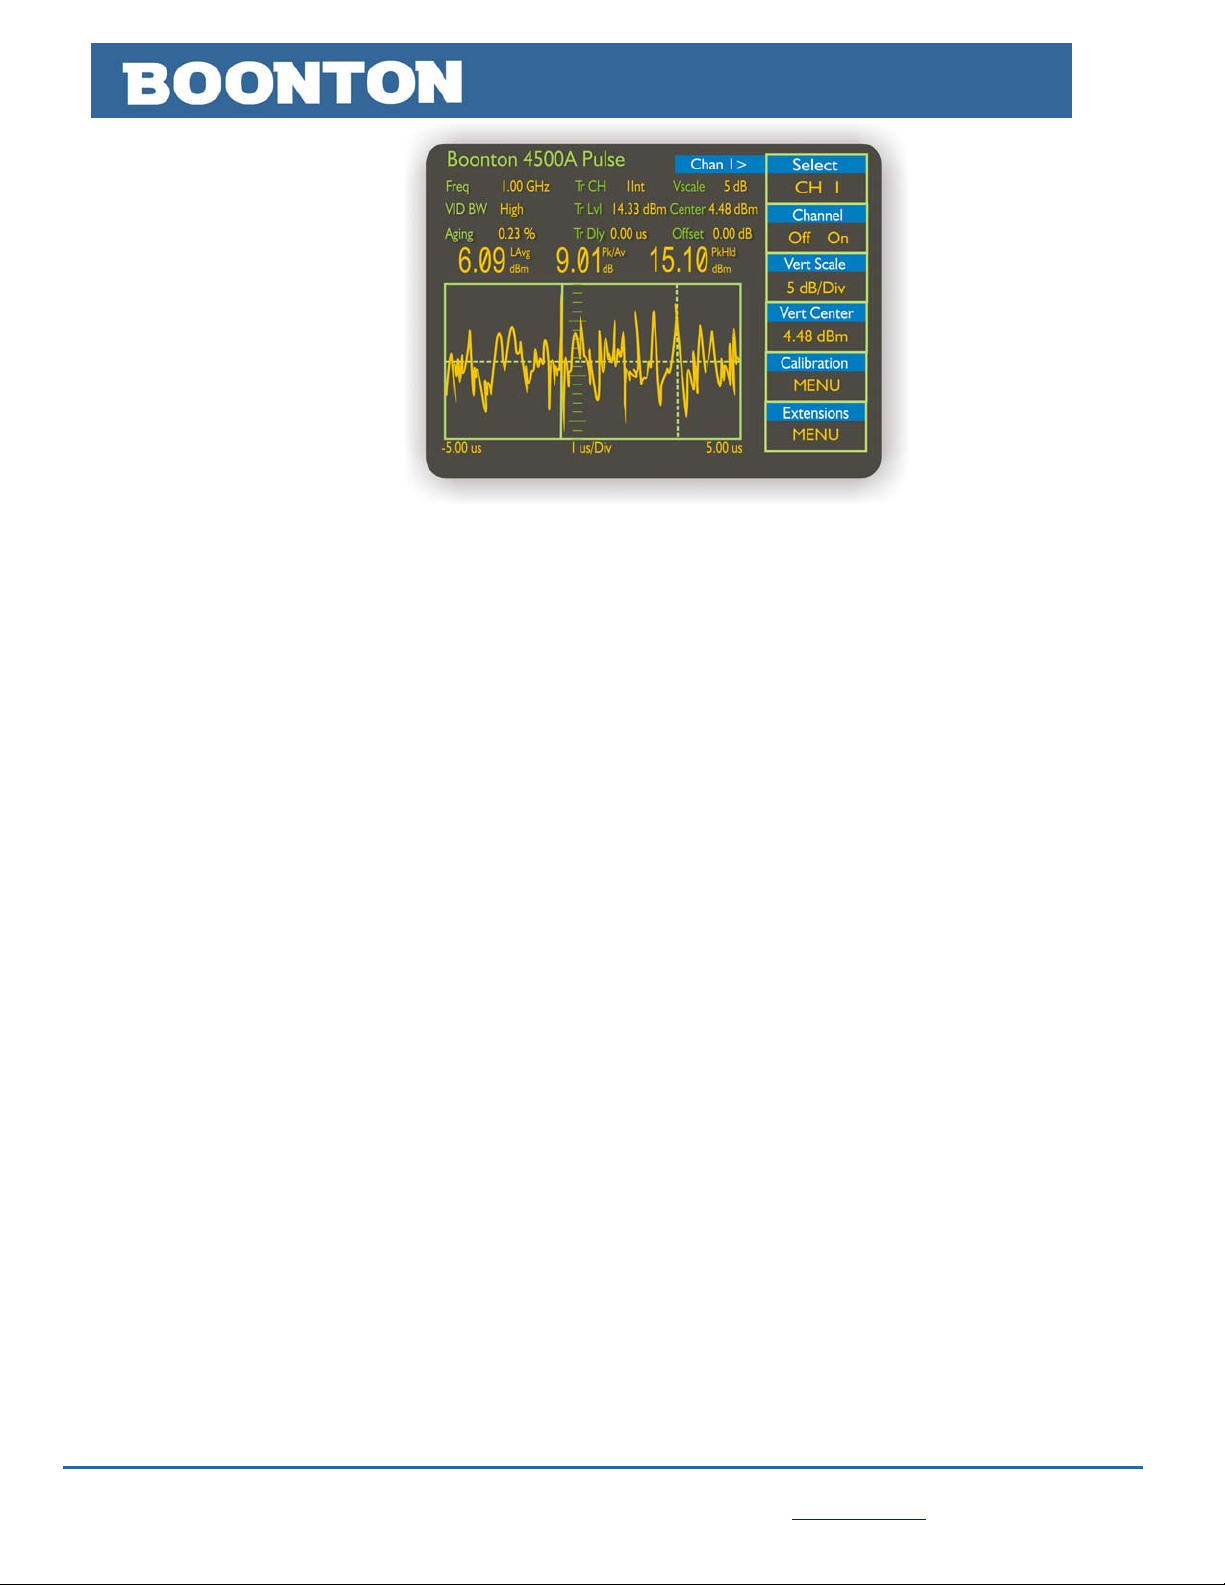
THE MODEL 4400A IS THE
LEADER IN PULSE
MEASUREMENTS
The Model 4400A provides powerversus-time waveform analysis of repetitive
RF signals. Applications include AM, radar,
TDMA, and GSM, as well as RF amplifier
linearity testing. The time base extends to
10 nanoseconds per division with internal
and external triggering. The logarithmic
power display permits the entire dynamic
range of more than 60 dB to be seen at the
same time.
Convenient scale and centering controls
allow vertical expansion of any portion of
the display. A linear display scale is also
provided covering power levels from
nanowatts to megawatts. Two adjustable
markers can read the power at any point
across the waveform. In addition, the markers
can be used to define a region on the
waveform in which maximum power (peak
hold), minimum power, long-term average
power, and peak-to-average ration are
measured.
This function is especially useful for
characterizing the power level over a portion
of the top of a pulse, such as top-level power.
Two adjustable reference lines can be used
with the markers to identify and measure
particular power levels.
The reference lines also have the ability to
automatically track the following:
· Markers
· Top/Bottom Power
· Distal/Mesial Power
· Distal/Proximal Power
An Automeasure function measures and
calculates 14 common parameters of a pulse
waveform and makes them available at all
times in a both a summary text table and
individually as a user-defined display
parameter. The 14 Automeasure functions
are:
· Peak Power · Pulse Power
· Average Power · Overshoot
· Risetime · Falltime
· Top Amplitude · Bottom
Amplitude
· Pulse Width · Pulse Period
· Duty Cycle · Offtime
· Delay · Pulse
An Autosetup function is provided to assist
the user in obtaining a useful time-domain
display of the input signal by just pressing a
key. Appropriate vertical scaling, time base,
and trigger settings are determined
Time-domain waveform of 8 carriers spaced 700 kHz apart from
1.8 GHz to 1.8049 GHz and phase aligned for highest peak power.
automatically. The Model 4400A is made even
more powerful by the addition of a second
measurement channel. Comparisons between
signals are facilitated by a Math channel that
displays the sum or difference of the inputs. The
full-color display provides unambiguous data,
with each trace clearly identified. Two
Reference channels are used to save
waveforms for comparison purposes. The
Reference channels can be displayed with their
own unique colors, just as the input channels,
and compared using the Math channel. For
archival purposes, the Reference waveforms
can be saved on a floppy disk using the built-in
3.5-inch, 1.44-Mbyte floppy drive.
The problem of diode non-linearity for levels
above –30 dBm, which occurs in all
conventional power meters, is eliminated in the
Model 4400A. Each individual sample is
converted to power before averaging. Since the
sampling rate is one megasample per second,
the system completes the analog-to-digital
conversion, interpolates the level in a calibration
table, and stores the result in less than one
microsecond.
To create the calibration tables, a 1-GHz
step calibrator, traceable to NIST, is built-in to
the Model 4400A. This precision source
provides calibrated power levels from +20 dBm
(100 milliwatts) to –40 dBm (100 nanowatts) in
steps as small as 0.1 dB. An Autocalibration
function makes the process completely
automatic. At all other times, the calibrator is
available as a test source with both CW and
pulsed output.
MODEL 4500A ADDS STATISTICAL
MEASUREMENTS CAPABILITY
Many modern communications systems use
modulation methods that result in
pseudorandom or noise-like signals. Examples
of this are CDMA, WCDMA, multi-carrier,
power as well as the average power. The
Pulse Measurement mode described above
can measure peak power over relatively short
time intervals as required for time-based
systems. However, CDMA, in particular,
requires the measurement of infrequent power
peaks over long time periods. It is also
necessary to know how often various power
levels occur as a percentage of the total run
time.
This is achieved by calculating a cumulative
distribution function (CDF) from a large
number of power measurements. The Model
4500A can accumulate 500,000 power
readings per second from one channel and
internally create a histogram containing 4,096
discrete power levels of better than 0.02-dB
resolution. Each power level bin is a 31-bit
counter that records the number of
occurrences of the corresponding power level.
This process can be performed for two
channels simultaneously at a rate of 250,000
power readings per second.
The histogram data is displayed as a
cumulative distribution function (CDF) or a
complementary cumulative distribution function
(CCDF) for each channel. CCDF is also
referred to as 1-CDF. A statistical
measurement begins by clearing the histogram
array to zero and resetting the elapsed time
and sample counters. The measurement can
be allowed to continue until one of the count
bins fills to the maximum allowable number of
counts: 2,100,000,000. At the maximum
sampling rate, the running time exceeds one
hour. The advantage of this method is that
even a single occurrence of the highest power
level during the running time will be recorded
and appear on the distribution function display.
HDTV, and DAB. The
traditional methods of RF
power measurement are
not adequate for these
systems. A CW power
meter can measure the
average power of these
signals provided care is
taken not to overload the
sensor or operate above
the linear power region for
diode sensors. Since the
peak power can be 16 dB
higher than the average
power and these peaks
are often compressed by
amplifiers and other
components of the
communication system,
some method is needed
to measure the peak
BOONTON ELECTRONICS (A Wireless Telecom Group Company)
P.O. Box 465, Parsippany, New Jersey 07054-0465 · Tel: (973) 386-9696 · Fax: (973) 386-9191 · E-mail: sales@boonton.com · Website: www.boonton.com
Page 3

SOPHISTICATED SIGNAL
r
PROCESSING FOR FAST,
AUTOMATIC MEASUREMENTS
Both the Models 4400A and 4500A
have a dedicated floating point digital
signal processor that performs shaping,
filtering, calibration, offset compensation,
and conversion of the test signal. Random
repetitive sampling and selectable
averaging provide accurate, stable
measurements of all user-programmed
waveform parameters. Digital signal
processing permits pre-trigger information.
Logarithmic detection provides the best
dynamic range of 60 dB (-40 to +20 dBm)
for peak power measurments.
Measurements are fast…two marker
values and their delta are available 80
times per second over the bus, and all 14
automatic measurements are available 20
times per second.
SETUP & WAVEFORM
STORAGE
Up to 10 complete panel setups can be
stored and recalled from internal memory
for applications in which the same
instrument setups are used repetitively.
For permanent hard-copy documentation,
complete display data can be transmitted
to a plotter or printer via an RS-232 serial,
IEEE-488 port, or LPT port, supporting
LaserJet, ThinkJet, and HPGL formats.
COLOR DISPLAY
The display is a VGA-compatible
seven-inch diagonal color CRT with a
resolution of 640 x 480 pixels. Waveforms
are displayed at 501 x 281 resolution.
PEAK POWER SENSORS TO
MATCH YOUR APPLICATION
Boonton Electronics offers a wide
selection of sensors that are optimized for
different characteristics such as frequency,
risetime, and dynamic range.
All sensors feature a balanced diode
configuration for high sensitivity and eveorder harmonic suppression. Low VSWR
minimizes mismatch errors. Calibration
factors traceable to NIST standards are
stored in EEPROM, and an internal
temperature sensor tracks temperature
change. Calibration factor information and
other sensor data are automatically
downloaded to the instrument when the
sensor is connected.
PRECISION 1-GHz
CALIBRATION FOR
PERFORMANCE VERIFICATION
A spectrally pure, 1-GHz NIST
measurement reliability. The userselectable automatic routine calibrates the
sensor and instrument over the full
dynamic range of the instrument. An
output of –40 to +20 dBm (CW or pulsed)
makes this a versatile source.
DISK DRIVE
The display is a VGA-compatible
seven-inch diagonal color CRT with a
resolution of 640 x 480 pixels. Waveforms
are displayed at 501 x 281 resolution.
traceable calibrator guarantees
MMOODDEELL 44440000AA && 44550000AA PPEERRFFOORRMMAANNCCEE SSPPEECCIIFFIICCAATTIIOONNS
Sensor Inputs
Fre quen cy Ra nge 30 MHz to 40 GHz, selectable
Pulse Measurement Rage -40 to +20 dB
CW Measurement Range -50 to +20 dB
Risetime (10 – 90%) See sensor specifications
Single-Shot Bandwidth 100 kHz (based on 10
samples per pulse)
Pulse Repetition Rate 25 MHz
Minimum Pulse Width 30 ns
1
1
Vertical Scale
Relative Offset Range
Log +99.99 dB
Linear 0 to 99 divisions
Vertical Scale
Lo g 0.1-20 dB/div in 1-2-5 sequence
L in ea r 1 nW -50 MW in 1-2-5 s equence
Time Base Pulse Mode
Time Base Range 10 ns to 1 s/div
Time Base Accuracy 0.01%
Time Base Resolution 200 ps
Statistical Mode (Model 4500A only)
X-Axis 0.1, 0.2, 0.5, 1, 2, 5, 10% pe
Percent Offset Range 0 – 99% (x-axis dependent)
Percent Resolution 0.002%
division
Trigger Pulse Mode Only
Tr igg er Sou rce Channel 1 internal or exter nal; or
Trigger Slope + or –
Pre-Trigger Delay:
Time Base Setting Delay Range
10 ns to 50 ms -500 ms
100 ms to 1 sec -10 div
Post-Trigger Delay:
Time Base Setting Delay Range
10 ns to 1 ms 10,000 div
2 ms to 50 ms2 ms
100 ms to 1 sec 200 div
Trigger Delay Resolution 0.02 divisions
Trigger Holdoff Range 65 ms
Trigger Holdoff Resolution 62.5 ns
Trigger View
Vertical Scal e 0.1V to 1V in 1-2-5 sequence
Relative Offset +3 volts
Internal Trigger Range -27 to +20 dBm
External Trigger Range +3 volts
External Trigger Input 50 ohms, dc coupled
Channel 2 internal or external
1
Statistical Pricessing (Model 4500A only)
1
CDF, 1-CDF, PDF Modes
Sampling Rate 500,000 samples per second
Number of Sam pling Bins 4,096
Size of Sample Bins 32 bits
Bin Power Resolution <0.02 dB
Percent Resoluti on CDF, 1-CDF in log or linear
Automatic Meas urements Peak max. power, average
2
2
Calibration Source
Operating M odes CW, internal or external pulse
Frequency 1.024 GHz + 0.1%
Level Range -40.0 to +20.0 dBm
Resolution 0.1 dB
Output SWR (Refl. Coeff.) 1.20, (0.091)
Accuracy (NIST traceable)
(-30 to +20 dBm)
Absolute +0.065 (1.5%) at 0 dB and
Linearity +0.03 dB per 5 dB
Internal Pulse Period 100 ms, 1 ms or 10 ms
5
Int ern al Pul se Dut y Cycl e 10% to 90% in 10% increments
Internal/External
Pulse Polarity + or –
Connector Type N
4
Power Measurement Accuracy
Measurement Uncertainty Total measurement
Mismatch Uncertainty +2 x sensor reflection
S
1
scales and plots normalized
to average power PDF log
or linear scales and plots
normalized to average
power
power, peak to average
ratio, minimum power, total
samples, sampling time,
confidence band of
measurements, dynamic
range, and tolerance
3
25OC, +0.001 dB per OC
uncertainty (worst case) is
the sum of the calibrator
uncertainty, source
mismatch error, sensor
calibration factor
uncertainty, sensor
temperature coefficient,
sensor shaping, noise and
drift.
coefficient x source
reflection coefficient x 100%
BOONTON ELECTRONICS (A Wireless Telecom Group Company)
P.O. Box 465, Parsippany, New Jersey 07054-0465 · Tel: (973) 386-9696 · Fax: (973) 386-9191 · E-mail: sales@boonton.com · Website: www.boonton.com
Page 4

p
p
CUMULATIVE DISTRIBUTION
FUNCTION (CDF)
The Model 4500A CDF is a plot of
power on the vertical axis versus
probability on the horizontal axis. The
logarithmic power capability allows the
entire dynamic range to be viewed at one
time or a small region to be expanded up
to 0.1 dB/division for detailed analysis.
Likewise, the probability scale can be
expanded up to 0.1%/division. Both scales
can be offset over their full range to bring
any portion of the magnified CDF into
view. For every possible power level (p)
within the total dynamic range, the CDF
shows the probability in percent that the
measured power is less than or equal to p.
The maximum power level during the
entire run will appear at 100% probability.
The adjustable markers allow the power
to be read at any probability value along
the curve, interpolating to a resolution of
0.01%. Adjustable reference lines allow
the probability to be read for any power
level to a resolution of 0.01 dBm.
Summary results are continually updated
and appear at the top of the display, as
follows:
· Peak Power
· Average Power
· Peak-to-Average Ratio
· Total Elapsed Time
· Total Number of Samples
· Tolerance
· Reference Line Value
Alternatively, a TEXT display may be
selected to display the above in addition to
the following:
· Minimum Power
· Dynamic Range
· Confidence
· Marker Position and Value
· Reference Line Position and Value
When the second channel is installed,
the CDFs for the two channels can be
compared using the Math channel. CDFs
can also be saved into REF1 and REF2
and to the floppy disk. The confidence
level of the CDF is determined by the
number of samples taken. For many
purposes, useful results are obtained in
just a few seconds of run time. For events
with a low probability of occurrence, the
run time must be increased to ensure
capture.
COMPLEMENTARY
CUMULATIVE DISTRIBUTION
FUNCTION
The same histogram data can be used
to display the complement of the CDF or
CCDF, which is also called the 1-CDF
because of the manner in which it is
calculated. For every possible power level
(p) within the totally dynamic range, the
CCDF shows the probability in percent that
the measured power is greater than p.
This definition flips the CDF curve from left
to right placing the maximum power value
on the zero percentage axis. This form is
often more convenient to use, but contains
the same information as the CDF.
CCDF of 8 carriers spaced 700 kHz
apart from 1.8 GHz to 1.8049 GHz
and phase aligned for highest peak
ower.
PROBABILITY DENSITY
FUNCTION (PDF)
The cumulative distribution
function can be further
processed to obtain an
approximate probability density
function or PDF. The PDF
shows the relative occurrence
of the various power levels.
The probability that the power
lies between any two values on
the power axis is equal to the
integral of the PDF between
the two values. When the
difference between the two
values is equal to zero, the
integral of the PDF is also zero.
This means that it is not
possible to determine the
probability of occurrence of a
particular power level. Strictly
speaking, a discrete array such
as the histogram of power
values described above does not have a
density function. However, it is useful for
qualitative analysis to create an
approximate PDF from the first-order
derivative of the CDF. The process of
differentiation exaggerates any errors in
the CDF values. For this reason,
measurements should always be made
from the CDF or CCDF. The PDF is useful
for visualizing QAM and other signals that
have a finite number of discrete levels. For
random noise signals, A Gaussian
amplitude distribution will appear as a
Rayleigh distribution in the linear power
domain.
PDF of 8 carriers spaced 700 kHz
apart from 1.8 GHz to 1.88049 GHz
and phase aligned for highest peak
ower.
The TEXT display of measurements for
the PDF is the same as for the CDF and
CCDF. Adjustable markers and reference
lines are also provided; there are no
marker measurements in the PDF mode.
BOONTON ELECTRONICS (A Wireless Telecom Group Company)
P.O. Box 465, Parsippany, New Jersey 07054-0465 · Tel: (973) 386-9696 · Fax: (973) 386-9191 · E-mail: sales@boonton.com · Website: www.boonton.com
Page 5

SSUUPPPPLLEEMMEENNTTAALL IINNFFOORRMMAATTIIOON
N
Measurement Characteristics
Measurement Techniques
Stat Mode (4500A only): Continuous sampling 0.5 M Samples per
Power Mode: Random repetitive sampling system that
Maximum Sample Rate 1MHz
Memory Depth 4 K/Channel
Vertical Resolution 0.025%, 12-bit A/D converter
Waveform Averaging 1 to 10,000 samples per data point
Waveform Storage Two reference waveforms in internal non-
Trigger Channel Bandwidth: > 30 MHz typical
second
provides pre- and post-trigger data
volatile memory
Sensor Characteristics
Power Detection Technique: Dual diode with selectable detector bandwidth
Log Amplifier: The logarithmic amplifier in the sensor enables
Internal Data Sensor calibration factors, frequency range,
Sensor Cable The sensor cable is detachable from both the
the instrument to measure and analyze
changes in power exceeding 60 dB in a single
display range.
power range, sensor type, serial number and
other sensor dependent information are stored
in EEPROM within the peak power sensor.
sensor and instrument. The standard c able
length is 5 feet. Other cable lengths are 10 feet,
20 feet, 25 feet and 50 feet.
Rear Panel Connections
External Calibrator
Pulse Input Provides a means of applying an external TTL
IEEE-488 Interface Complies with IEEE-488-1978. Implements
RS-232 Interface 1 Serial Printer/Plotter interface
RS-232 Interface 2 Diagnostic interface
Parallel Port Parallel Pinter/Plotter interface
Optional Connectors
level signal to control the pulse rate and duty
cycle of the calibrator output (50 ohm input
impedance)
AH1, SH1, T6, LE0, SR1, RL1, PP0, DC1, C0,
and E1
5
Rear Panel
Channel 1 and 2, Trigger 1 and 2, calibr ator
output
Physical and Environmental
General Manufactured to the intent of MIL-T-28800E,
Disk Drive 3.5-inch, 1.44-MB (DOS compatible)
Display VGA-compatible, seven-inch diagonal color
Operating Temperature 0 to 50
Storage Temperature -40 to 75
Humidity 95% + 5% maximum (non-condensing)
Altitude Operati ng: 10,000 feet (3,000 meters)
Power Requirements 90 to 260 VAC, 47 to 440 Hz, 200 VA maximum
Dimensions 17.25 inches (43.8 cm) wi de, 7 inches (17.8 cm)
Weight 38 pounds (17.2 kg) with second channel
Hard Copy Output The screen can be output to a printer or plotter
HPGL Plotters HP7475, HP7470, ATT 435
Printers ThinkJet, LaserJet II
Type III, Class 5, Style E
CRT with 640 x 480-pixel resolution. Waveform
display area resolution is 501 x 281.
O
C
O
C
high, 22 inches (55.9 cm) deep
installed
on the RS-232m parallel, IEEE-488 devices, or
to a file on disk.
Sensors
See Appendix D or the Boonton Electronics Sensor Data Manual for detailed
specifications of Boonton P eak Power Sensors.
CE Mark
Boonton Electronics Corporation declares conformity of the Model 4400A
RF Peak Power Meter and the Model 4500A RF Peak Power
Meter/Analyzer to the following European Community Council (ECC)
regulations:
Directives: 89/336/EEC/93/68/EEC and 73/23/EEC/93/68/EEC
Standards: EN55011, EN50082-1, EN61010-1
Notes
1
Sensor dependent
2
Sensitives ar e decreased by a factor of two in the split-screen mode.
3
CW mode
4
CW mode, 0 to 40OC
5
Available with optional second channel
ADDITIONAL PRODUCTS AND SERVICES
AVAILABLE* FROM BOONTON ELECTRONICS
CORPORATION
Service and Support You Can Count On
Boonton Electronics backs all of its products with a
full range of test, repair, upgrade and calibration
services assuring that all your instrumentation
Model 4530 series RF Peak Power Meter 10 kHz to 40 GHz
Model 4230A series RF Power Meter 10 kHz to 40 GHz
Model 9230 series RF Voltmeter 200m to 300 V, 10 Hz to 2.5 GHz
Model 5230 series Universal RF Power Meter/Voltmeter 200 mV
to 300 V, 10 Hz to 100 GHz
Model 4300 RF Power Meter, multi-channel 10 kHz to 40 GHz
Model 92EA RF Millivoltmeter 200mV to 300 V, 10 Hz to 1.2 GHz
Model 7200 Capacitance Meter 0 to 2,000 pF, 1 MHz, Analog
display
Model 72B Capacitance Meter 1 pF to 3,000 pF, 1 MHz, Analog
display
Model 8201 Modulation Analyzer 100 kHz to 2.5 GHz
Model 8701 VXI Modulation Analyzer 100 kHz to 2.5 GHz
Model 1121 Audio Analyzer 10 Hz to 140 kHz
remains accurate, reliable and conforms to original
factory specifications.
Services include:
· Certified Repairs (NIST Traceable)
· Repair Warranty (Six Months, Materials and
Labor)
· Automatic Instrument/Software Upgrades*
· 10-day Turnaround
· Priority Service
· Flexible Service, Repair, and Calibration
Contracts
Contact our Customer Service Department at
(973) 386-9696 for details and pricing information.
* Available on most models.
BOONTON ELECTRONICS (A Wireless Telecom Group Company)
P.O. Box 465, Parsippany, New Jersey 07054-0465 · Tel: (973) 386-9696 · Fax: (973) 386-9191 · E-mail: sales@boonton.com · Website: www.boonton.com
 Loading...