

Page 1

Active Technologies S.r.l.
www.activetechnologies.it
AT-LA500
USB Logic Analyzer
USER MANUAL
RELEASE 3.4 – JUNE 2009 1
Page 2

Page 3

AT-LA500 – USER MANUAL CONTENTS
Contents
ACTIVE TECHNOLOGIES S.R.L. .................................................................................................................................. 1
USB LOGIC ANALYZER .................................................................................................................................................. 1
INTRODUCTION ................................................................................................................................................................ 7
OVERVIEW .......................................................................................................................................................................... 7
OPERATING PRINCIPLES...................................................................................................................................................... 7
GETTING STARTED ......................................................................................................................................................... 9
HARDWARE REQUIREMENTS .............................................................................................................................................. 9
Minimum system requirements ..................................................................................................................................... 9
Suggested requirements ................................................................................................................................................ 9
INSTRUMENT DESCRIPTION .............................................................................................................................................. 10
PROBES DESCRIPTION ....................................................................................................................................................... 12
INSTRUMENT DISCONNECTION ......................................................................................................................................... 13
PROBE CONNECTION ......................................................................................................................................................... 13
SOFTWARE LOADING ........................................................................................................................................................ 14
GUIDE TO THE FIRST ACQUISITION ................................................................................................................................... 15
Probe connection ........................................................................................................................................................ 15
Software loading ......................................................................................................................................................... 15
Create a Workspace .................................................................................................................................................... 15
AT-LA500 SOFTWARE ................................................................................................................................................... 19
MENU BAR ........................................................................................................................................................................ 20
File .............................................................................................................................................................................. 20
View ............................................................................................................................................................................. 20
Tools ............................................................................................................................................................................ 20
Window ....................................................................................................................................................................... 20
Help ............................................................................................................................................................................. 20
STATUS BAR ..................................................................................................................................................................... 21
TOOL BAR ......................................................................................................................................................................... 21
SOLUTION EXPLORER ....................................................................................................................................................... 22
SIGNAL DEFINITION ......................................................................................................................................................... 22
Adding a signal ........................................................................................................................................................... 23
Adding a bus ............................................................................................................................................................... 23
Removing a signal or a bus ........................................................................................................................................ 23
Editing a signal or bus name ...................................................................................................................................... 24
SETTINGS .......................................................................................................................................................................... 24
SAMPLING......................................................................................................................................................................... 24
Normal Timing Analysis ............................................................................................................................................. 24
State Analysis .............................................................................................................................................................. 26
NORMAL AND STATE ANALYSIS TRIGGER ....................................................................................................................... 28
Trigger Levels ............................................................................................................................................................. 28
Edges and Levels ........................................................................................................................................................ 29
Conditions on edges.................................................................................................................................................... 29
Conditions on logic levels .......................................................................................................................................... 29
Relationship between trigger conditions .................................................................................................................... 30
Pretrigger, PretriggerHS and DelayHS ..................................................................................................................... 30
I2C TRIGGER ..................................................................................................................................................................... 32
Address ........................................................................................................................................................................ 32
Address&Data ............................................................................................................................................................ 34
Pretrigger .................................................................................................................................................................... 35
SPI/µWIRE TRIGGER ........................................................................................................................................................ 36
SPI Trigger Options.................................................................................................................................................... 37
Pretrigger .................................................................................................................................................................... 37
UART/RS232 TRIGGER ................................................................................................................................................... 38
UART Trigger Options ............................................................................................................................................... 39
Pretrigger .................................................................................................................................................................... 39
RELEASE 3.4 – JUNE 2009 3
Page 4

AT-LA500 – USER MANUAL CONTENTS
PROBES ............................................................................................................................................................................. 40
DATA ACQUISITION ...................................................................................................................................................... 42
CHANNEL STATUS ............................................................................................................................................................ 42
Signal Definition Values ............................................................................................................................................. 42
Pod Status ................................................................................................................................................................... 42
START A DATA ACQUISITION ............................................................................................................................................ 43
STOPPING THE ACQUISITION ............................................................................................................................................. 43
TIPS FOR A GOOD ACQUISITION ........................................................................................................................................ 43
DATA VISUALIZATION ................................................................................................................................................. 45
MIXED SIGNAL DISPLAY MODE ....................................................................................................................................... 45
Analog-Digital Delay Alignement window ................................................................................................................ 45
WAVEFORM VIEW ............................................................................................................................................................ 46
Create a Waveform View window .............................................................................................................................. 46
Zoom ........................................................................................................................................................................... 48
Graph Property ........................................................................................................................................................... 49
Cursors ........................................................................................................................................................................ 50
Go To a Selected Target ............................................................................................................................................. 51
Search ......................................................................................................................................................................... 53
Serial Protocol Interpreter ......................................................................................................................................... 55
STATE LISTING ................................................................................................................................................................. 56
Create a State Listing window ................................................................................................................................... 56
Cursors ........................................................................................................................................................................ 57
Browse the State Listing window and export data ..................................................................................................... 58
Search ......................................................................................................................................................................... 59
Serial Protocol Interpreter ......................................................................................................................................... 60
AT-XSS EXPANSION BUS .............................................................................................................................................. 60
DIGITAL PATTERN GENERATOR-SAMPLER (OPTIONAL) ............................................................................... 62
PROBES DESCRIPTION ....................................................................................................................................................... 63
SIGNALS DESCRIPTION ..................................................................................................................................................... 64
COMMAND BAR ................................................................................................................................................................ 65
PROJECT WINDOW ............................................................................................................................................................ 65
TREE FUNCTIONALITIES ................................................................................................................................................... 66
SETTINGS .......................................................................................................................................................................... 66
GENERAL .......................................................................................................................................................................... 66
SERIALIZER (SDK ONLY) ................................................................................................................................................. 67
CLOCK GENERATOR ......................................................................................................................................................... 69
TRIGGERING ..................................................................................................................................................................... 70
Edges and Levels ........................................................................................................................................................ 70
Conditions on edges.................................................................................................................................................... 71
Conditions on logic levels .......................................................................................................................................... 71
Relationship between trigger conditions .................................................................................................................... 72
SIGNAL DEFINITION ..................................................................................................................................................... 73
Add a signal ................................................................................................................................................................ 73
Add a bus .................................................................................................................................................................... 73
Remove a signal or a bus ........................................................................................................................................... 74
Edit a signal or bus name ........................................................................................................................................... 74
STROBE .............................................................................................................................................................................. 75
DIGITAL EDITOR ............................................................................................................................................................ 76
Basic Waveform Commands ....................................................................................................................................... 76
New Waveform window .............................................................................................................................................. 76
Digital Editor Window ............................................................................................................................................... 77
Zoom ........................................................................................................................................................................... 78
Digital Editor Window Toolbar ................................................................................................................................. 80
Data Editor ................................................................................................................................................................. 83
RELEASE 3.4 – JUNE 2009 4
Page 5

AT-LA500 – USER MANUAL CONTENTS
Waveform View Settings ............................................................................................................................................. 83
Cursors ........................................................................................................................................................................ 85
Go To a Selected Target ............................................................................................................................................. 86
Search ......................................................................................................................................................................... 86
Waveform Sequencer Editor ....................................................................................................................................... 88
DATA VISUALIZATION ................................................................................................................................................. 91
WAVEFORM VIEW ............................................................................................................................................................ 91
Create a Waveform View window .............................................................................................................................. 91
STATE LISTING ................................................................................................................................................................. 94
Create a State Listing window ................................................................................................................................... 94
Cursors ........................................................................................................................................................................ 95
Search ......................................................................................................................................................................... 97
RELEASE 3.4 – JUNE 2009 5
Page 6

Page 7
AT-LA500 – USER MANUAL INTRODUCTION
Introduction
Overview
AT-LA is an instrument able to acquire digital data through 36 channels, divided in 4 banks of 9
channels each and to visualize their time behavior thanks to the dedicated software.
AT-LA is available in different configurations, depending on the maximum available memory
(varying from 2M to 4M samples).
AT-LA is connected to the system under test by means of probes with different electrical
characteristics, depending on the signals to be acquired. Each probe supports 18 channels, divided
in two banks of 9 channels each. Each probe is hot pluggable and is automatically recognized. Four
independent and programmable thresholds are available (one for each bank of 9 channels) and used
by active probes to discriminate between low and high levels.
Data acquisition starts when a triggering event is detected by the instrument. The trigger can be
configured by the user by selecting the suitable conditions on signal edges or on the input signal
levels. Furthermore, it is possible to generate internally a trigger event so that data acquisition is
independent of applied signals and it is performed automatically (free acquisition) or enabled by the
user (manual acquisition).
AT-LA can also trigger on events occurring on many serial protocols (i.e. I2C, SPI, RS232) and
then analyze the packets of data transferred.
Once data acquisition is terminated, data are transferred to the PC through a USB 2.0 or a USB 1.1
connection and then visualized as waveforms or values.
AT-LA can sample input signals by using an internal clock signal (Time Analysis), whose
frequency can be reduced on the basis of the signal to be acquired, or it can synchronize signal
sampling to a signal clock provided by the system under test (State Analysis).
Operating principles
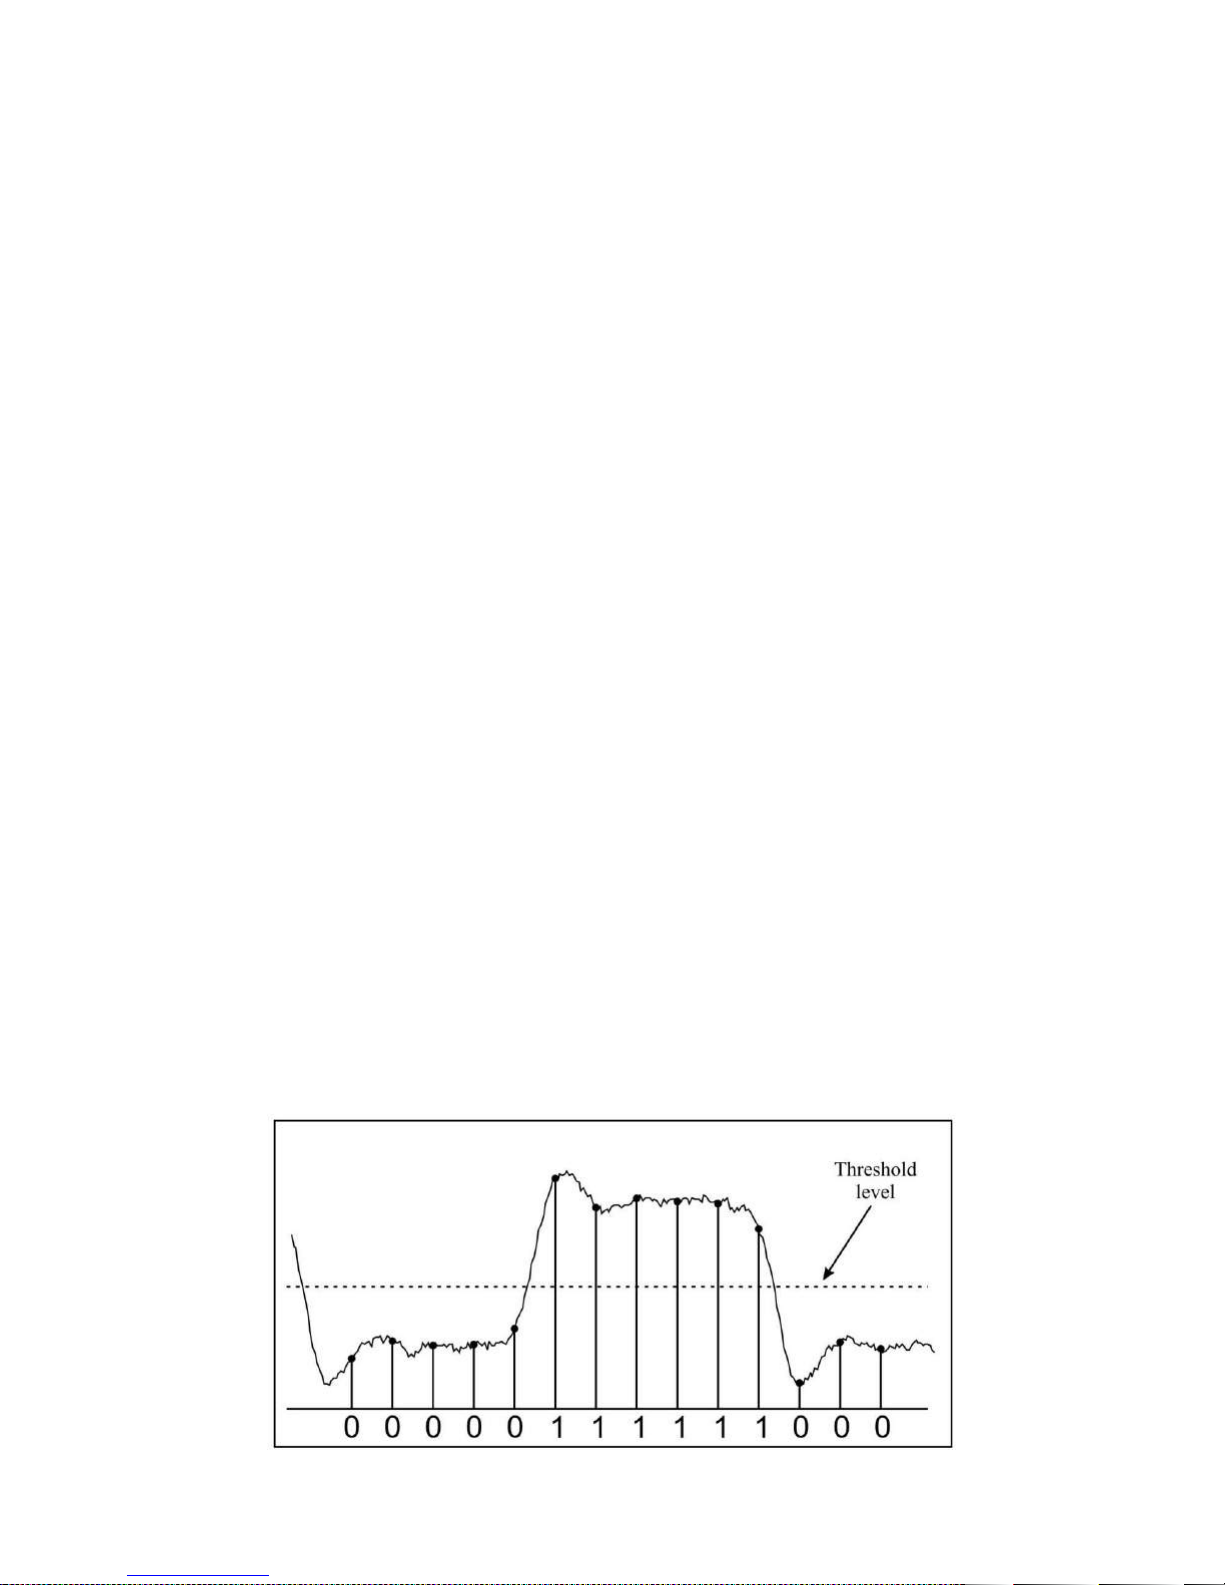
Digital signals acquisition means: i) to sample input signals, ii) to convert this values in logic values
(0 and 1), iii) to organize these values in a set of waveforms.
To establish the logic value of a sampled signal, it is necessary to compare the input value to a
reference voltage, called threshold, that can assume a fixed value or can be varied depending on the
used probe. If the input value is greater then the threshold, it will be converted to a high logic state
(1), otherwise it will be converted to a low logic state (0).
RELEASE 3.4 – JUNE 2009 7
Page 8
AT-LA500 – USER MANUAL INTRODUCTION
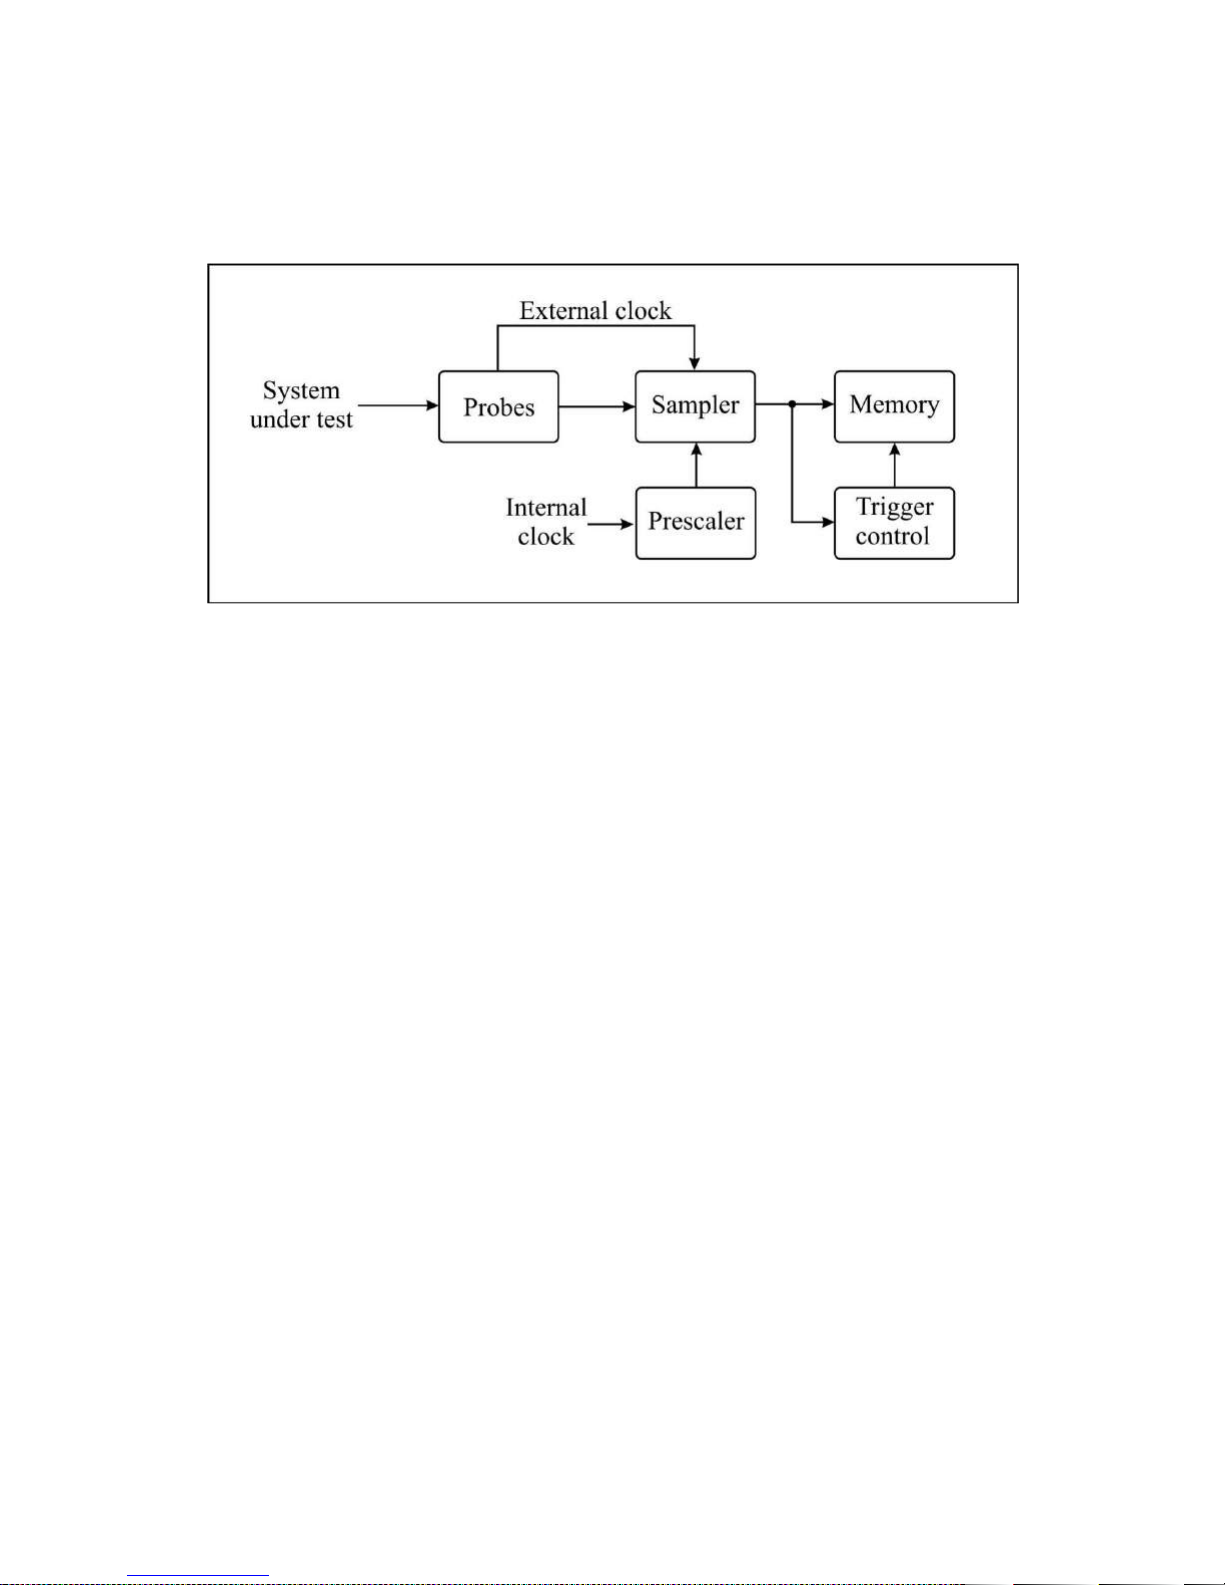
To detect the trigger event starting data acquisition the signal status must be monitored
continuously. The operating principle of a Logic Analyzer can then be schematically represented as:
Note: This manual refers to a single AT Logic Analyzer. However, since up to 8 AT-LA can be
connected together to increase the number of examined channels up to 288.
RELEASE 3.4 – JUNE 2009 8
Page 9

AT-LA500 – USER MANUAL
Getting started
Hardware requirements
Minimum system requirements
• Microsoft™ Windows® 2000 or XP operating system;
• Pentium® III processor;
• 128 MBytes RAM;
• 100 MBytes available on hard disk for software installation;
• 800x600 video resolution;
• USB 1.1 connection.
Suggested requirements
• Microsoft™ Windows® XP operating system;
• Pentium® IV processor;
• 512 MBytes RAM;
• 1024x768 video resolution;
• USB 2.0 connection.
RELEASE 3.4 – JUNE 2009 9
Page 10
AT-LA500 – USER MANUAL
Instrument description
AT-LA500
50 0 MS/s USB Log ic A nal yze r
Ch. 35 - 18 Ch. 17 - 0
Pod B
AT-LA500 – Front view
USBAT EXPANSION BUSTRIGGER OUT TRIGGER IN DC INPOWER
Status
Pod A
O
I
RELEASE 3.4 – JUNE 2009 10
AT-LA500 – Rear view
Page 11

AT-LA500 – USER MANUAL
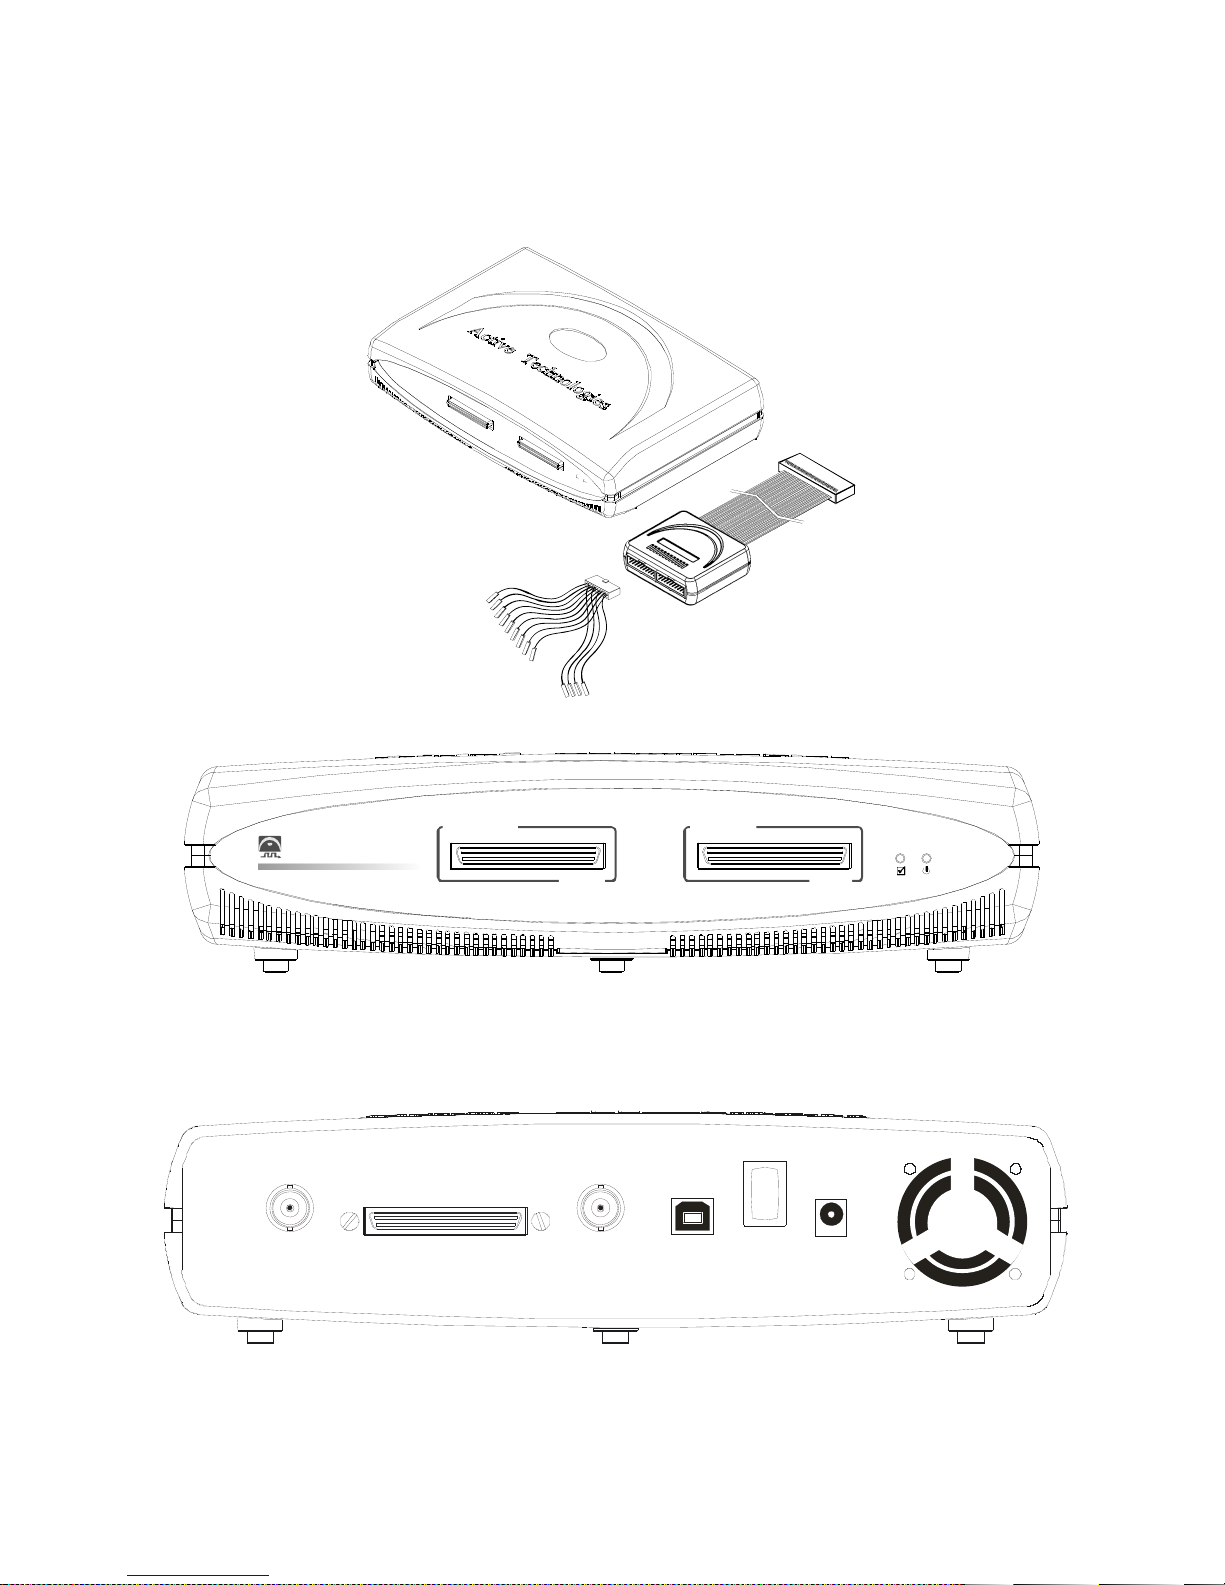
• Pods A and B: probe connectors;
• Power led: it indicates whether the instrument is ON;
• Status led: it indicates the instrument status as further specified;
• Power connector: connector for the external power supply
• Power-on switch;
• USB connector;
• AT expansion bus connector: connector for the AT-expansion bus, a dedicated cable used
to connect several instruments and also to connect an external device, like an oscilloscope,
(with optionally AT-scope card);
Status Led
The status led may be: ON, OFF, or blinking and it indicates different operating conditions.
The status led is ON when:
• The instrument is ON, it is connected to the PC and its drivers have been correctly installed.
The status led is OFF when:
• The instrument is switched on but is not connected to the PC;
• The instrument is switched on and it is connected to the PC but its drivers have not been
installed;
• The instrument has been disconnected following the procedure described in the Remove an
AT Logic Analyzer paragraph.
The status led is blinking when:
• The instrument is reconfiguring;
RELEASE 3.4 – JUNE 2009 11
Page 12
AT-LA500 – USER MANUAL
Probes description
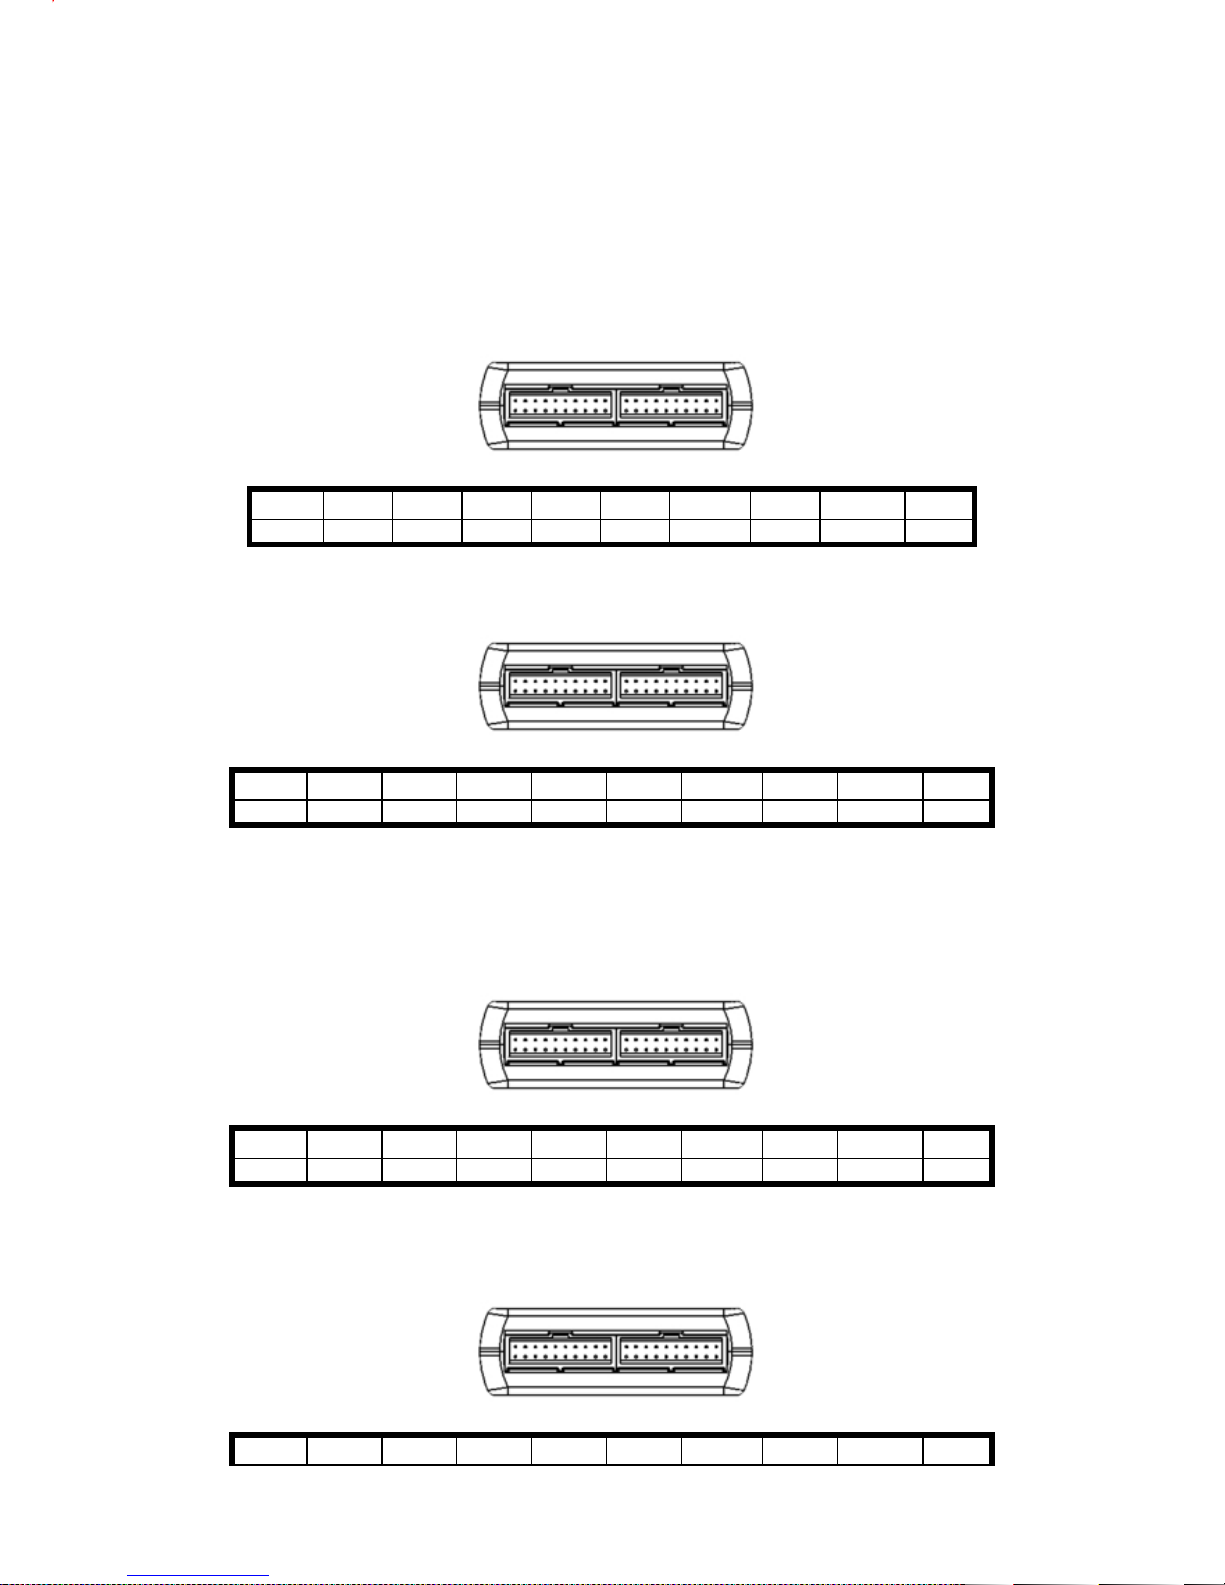
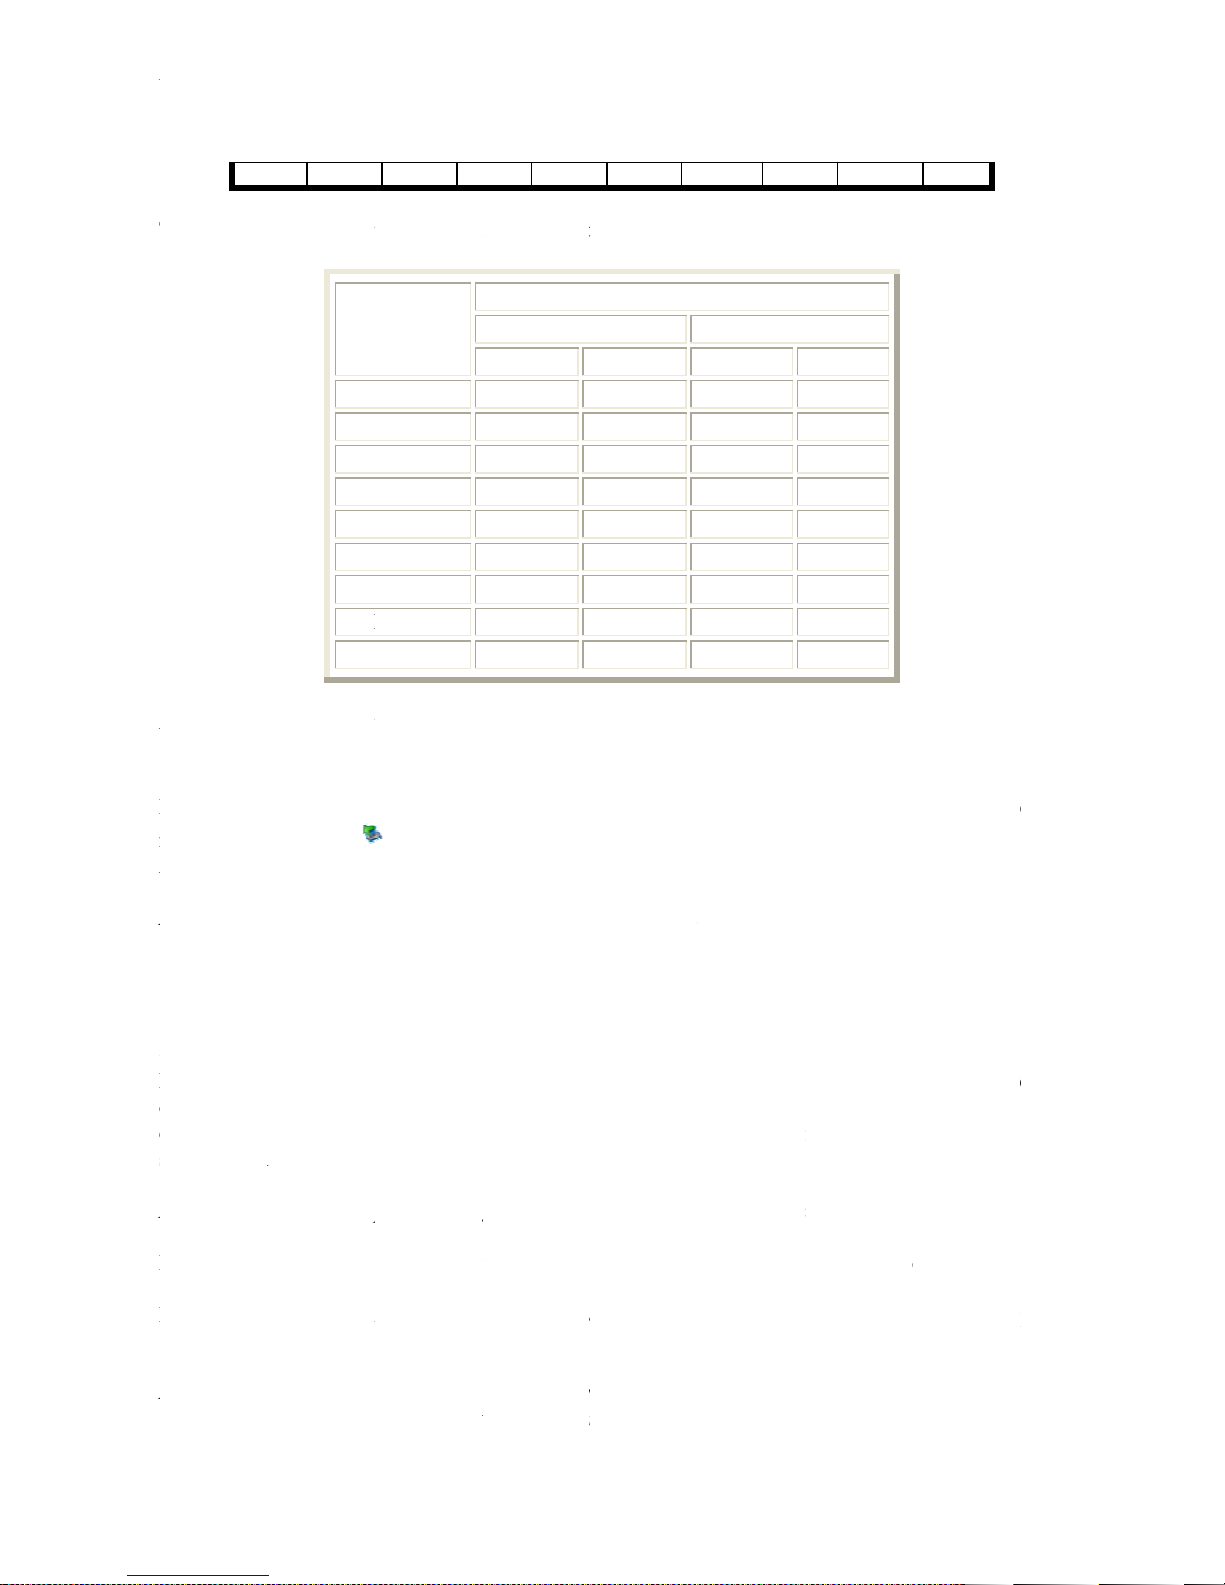
Probes have to be connected to the testing board by means of opportune connectors. Regarding the
probes connected to the Pod A the correspondence between the pins and the number of channels is
reported in the following tables:
Bank 0 (Ch. 8..0):
Ch.8 Ch.7 Ch.6 Ch.5 Ch.4 Ch.3 Ch.2 Ch.1 Ch.0
n.c. GND n.c. GND n.c. GND
n.c.
GND
n.c.
Bank 1 (Ch 17..9):
n.c.
n.c.
Ch.17 Ch.16 Ch.15 Ch.14 Ch.13 Ch.12 Ch.11 Ch.10 Ch.9
n.c.
GND
n.c.
GND
n.c.
GND
n.c.
GND
n.c.
n.c.
n.c.
Regarding the probes connected to the Pod B the correspondence between the pins and the number
of channels is reported in the following tables:
Bank 2 (Ch. 26..18):
Ch.26 Ch.25 Ch.24 Ch.23 Ch.22 Ch.21 Ch.20 Ch.19 Ch.18
n.c.
GND
n.c.
GND
n.c.
GND
n.c.
GND
n.c.
n.c.
n.c.
Bank 3 (Ch. 35..27):
Ch.35 Ch.34 Ch.33 Ch.32 Ch.31 Ch.30 Ch.29 Ch.28 Ch.27
RELEASE 3.4 – JUNE 2009 12
n.c.
Page 13
AT
The
All
I
Before disconnecting or switching OFF an
mouse
Analyzer”.
Note
Probe connection
Data acquisition requires at least
or removed even when the instrument is on and the software is under execution. Any time a probe is
connected or removed, the software notifies the event and consequently enables or disables t
setup parameters.
Note
Probes must be connected to the system under test by mean
the corresponding enumeration for signals and
Pod A correspond to channels 0..17, while those present on a probe connected to Pod B correspond
to channels 18..35
Note
AT
-LA500 – U
SER MANUAL
n.c.
The
correspondence
All
cables are ground connected
I
nstrument disconnection
Before disconnecting or switching OFF an
mouse
button
Analyzer”.
Note
If an instrument that has not been disabled is switched off or disconnected, its software may
not work properly.
Probe connection
Data acquisition requires at least
or removed even when the instrument is on and the software is under execution. Any time a probe is
connected or removed, the software notifies the event and consequently enables or disables t
setup parameters.
Note
Never remove a probe during data acquisition: acquired data may not be coherent.
Probes must be connected to the system under test by mean
the corresponding enumeration for signals and
Pod A correspond to channels 0..17, while those present on a probe connected to Pod B correspond
to channels 18..35
Note
All ground connectors are electrically connected. A wrong connection may cause shor
circuits and damage the system under test.
between the channels and the pod cables
Colours
Brown
Orange
Yellow
Purple
GND
icon on the application bar and by selecting “
one probe connected to
Pod A
-
Channels
, it must be disabled by clicking with the left
he
grounds. Signals present on a probe connected to
GND
is the following:
Pod B
instrument. Probes can be plugged
of the provided connectors, following
Safely remove
USB Logic
white
GND
n.c.
Black
Red
Green
Blue
Gray
n.c.
Bank 0
0
1
2
3
4
5
6
7
8
GND
Bank 1
9
10
11
12
13
14
15
16
17
n.c.
colours
Bank 2
18
19
20
21
22
23
24
25
26
Bank 3
27
28
29
30
31
32
33
34
35
n.c.
n.c.
.
:
:
on the
AT
LA500
t
-in
he
s
:
t
Page 14
AT-LA500 – USER MANUAL
Software loading
Note: Before loading the AT-LA500 control software it is necessary that the instrument is switched
ON and connected to the PC and that the drivers have been correctly installed. If the Logic
Analyzer is switched OFF or if it is non connected to the PC, the software DEMO version
will be loaded.
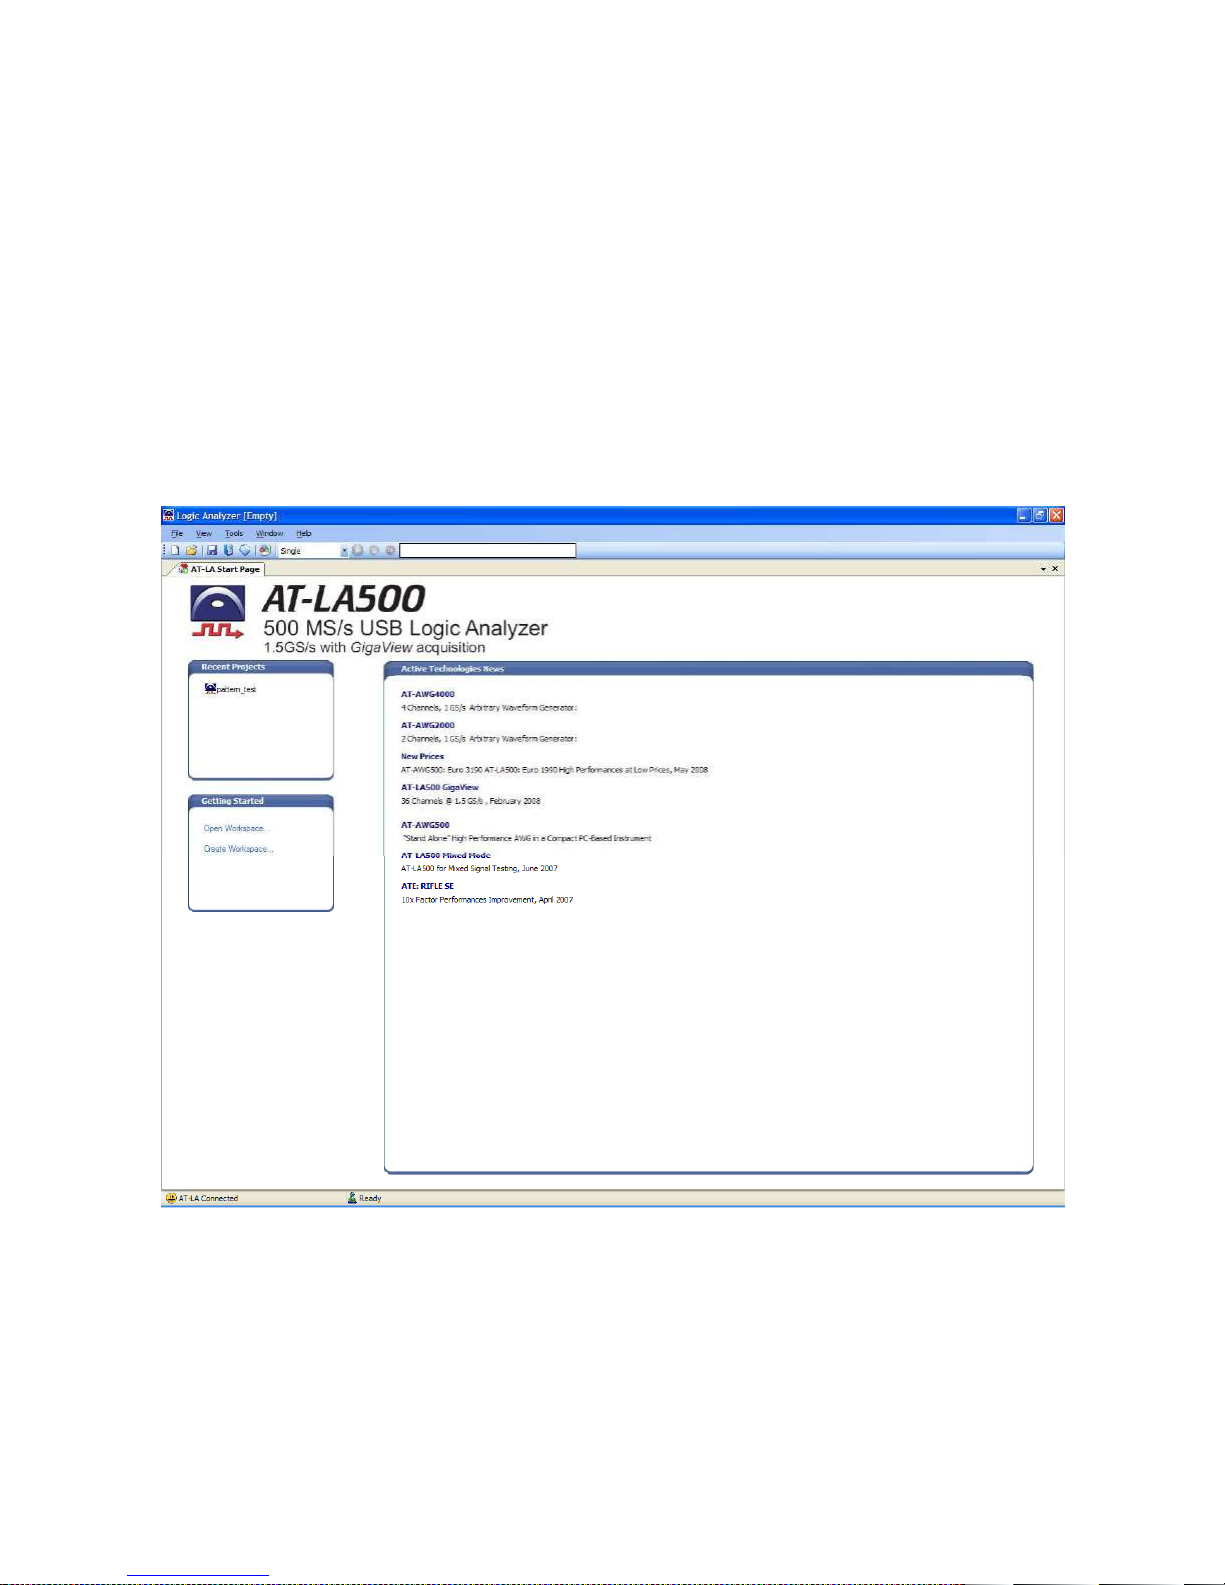
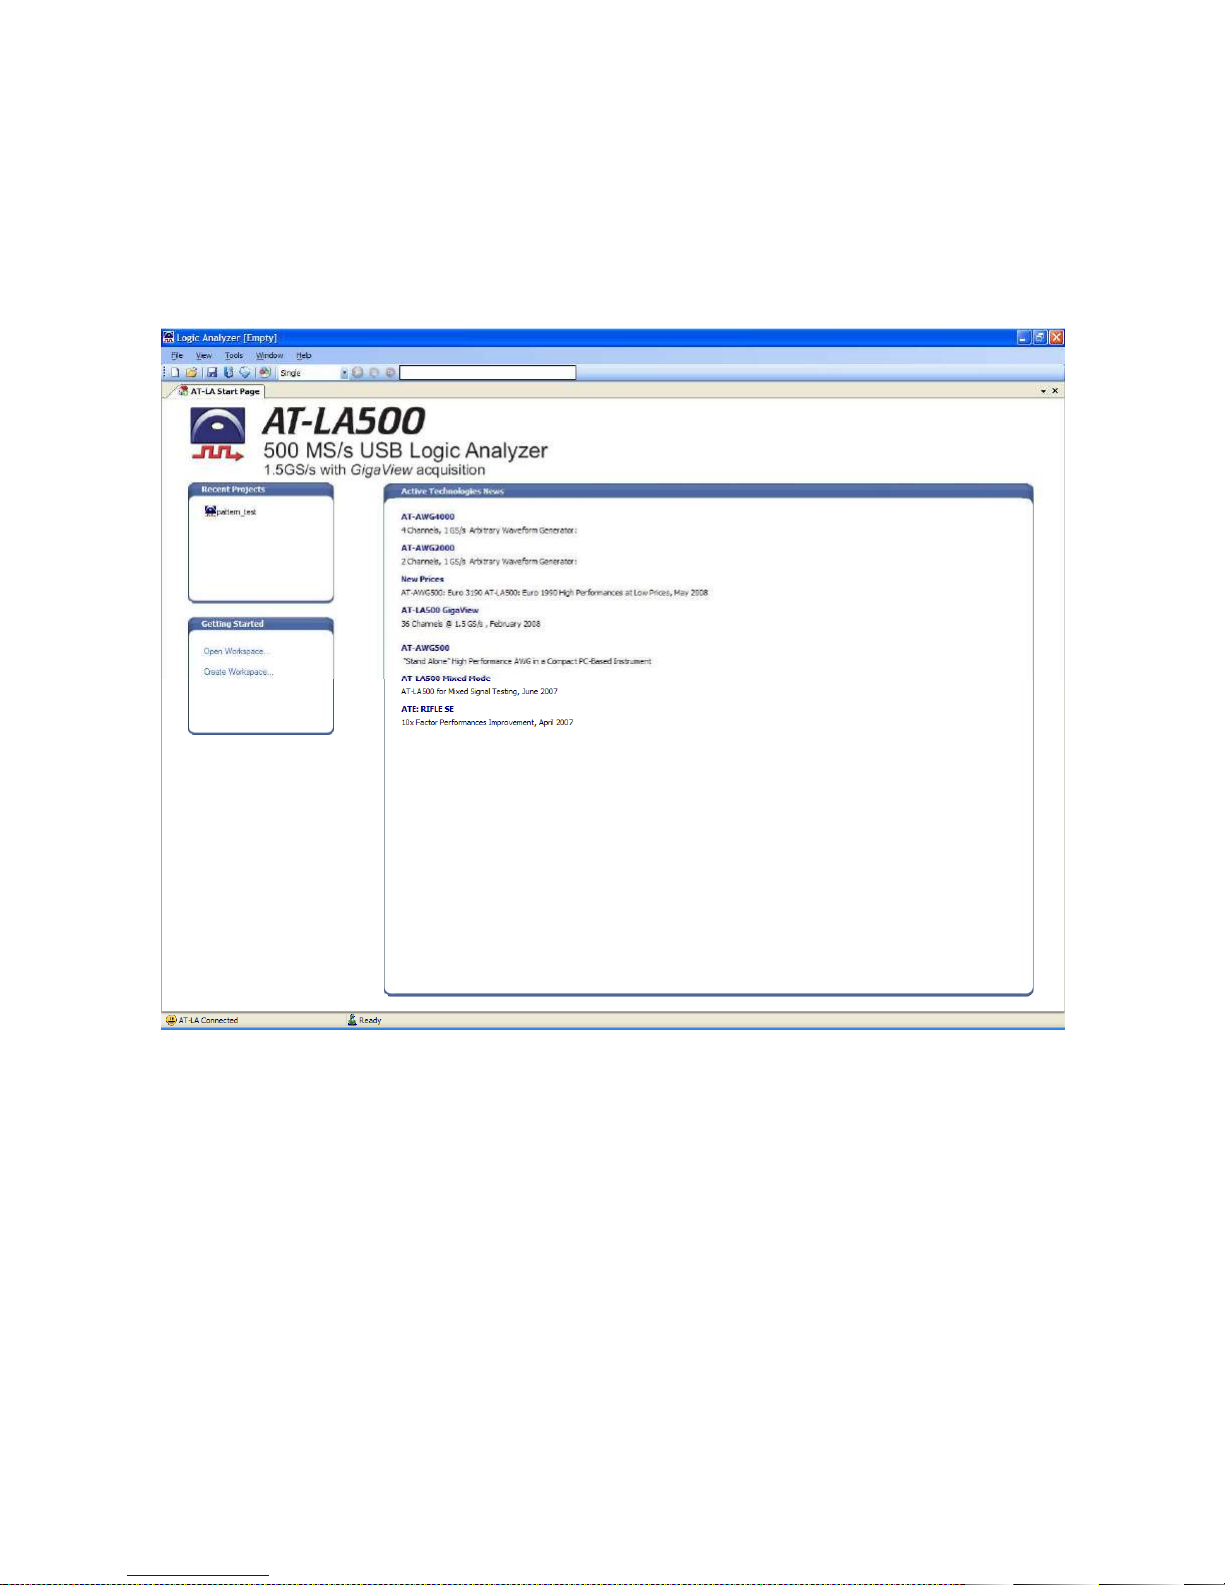
Once the software has been loaded, the AT-LA Start Page window appears. At this point a new
project can be created, or an existing project can be opened. If available, the list of the recent
projects appears on the left of the main window. If an Internet connection is available, the Active
Technologies website news are shown in the Start Page.
RELEASE 3.4 – JUNE 2009 14
Page 15
AT
Guide to the first acq
The procedure required to perform a data acquisition
Probe connection
Software loading
C
AT
-LA500 – U
SER MANUAL
Guide to the first acq
The procedure required to perform a data acquisition
Probe connection
Connect a probe to Pod A;
Connect channel 0 of the probe to a signal source of the system under test (for instance a
signal clock) whose
Connect the probe round to the signal ground;
Software loading
Check whether the instrument is connected to the PC and that is switched ON. Drivers must
have been correctly installed;
Launch
C
Workspace
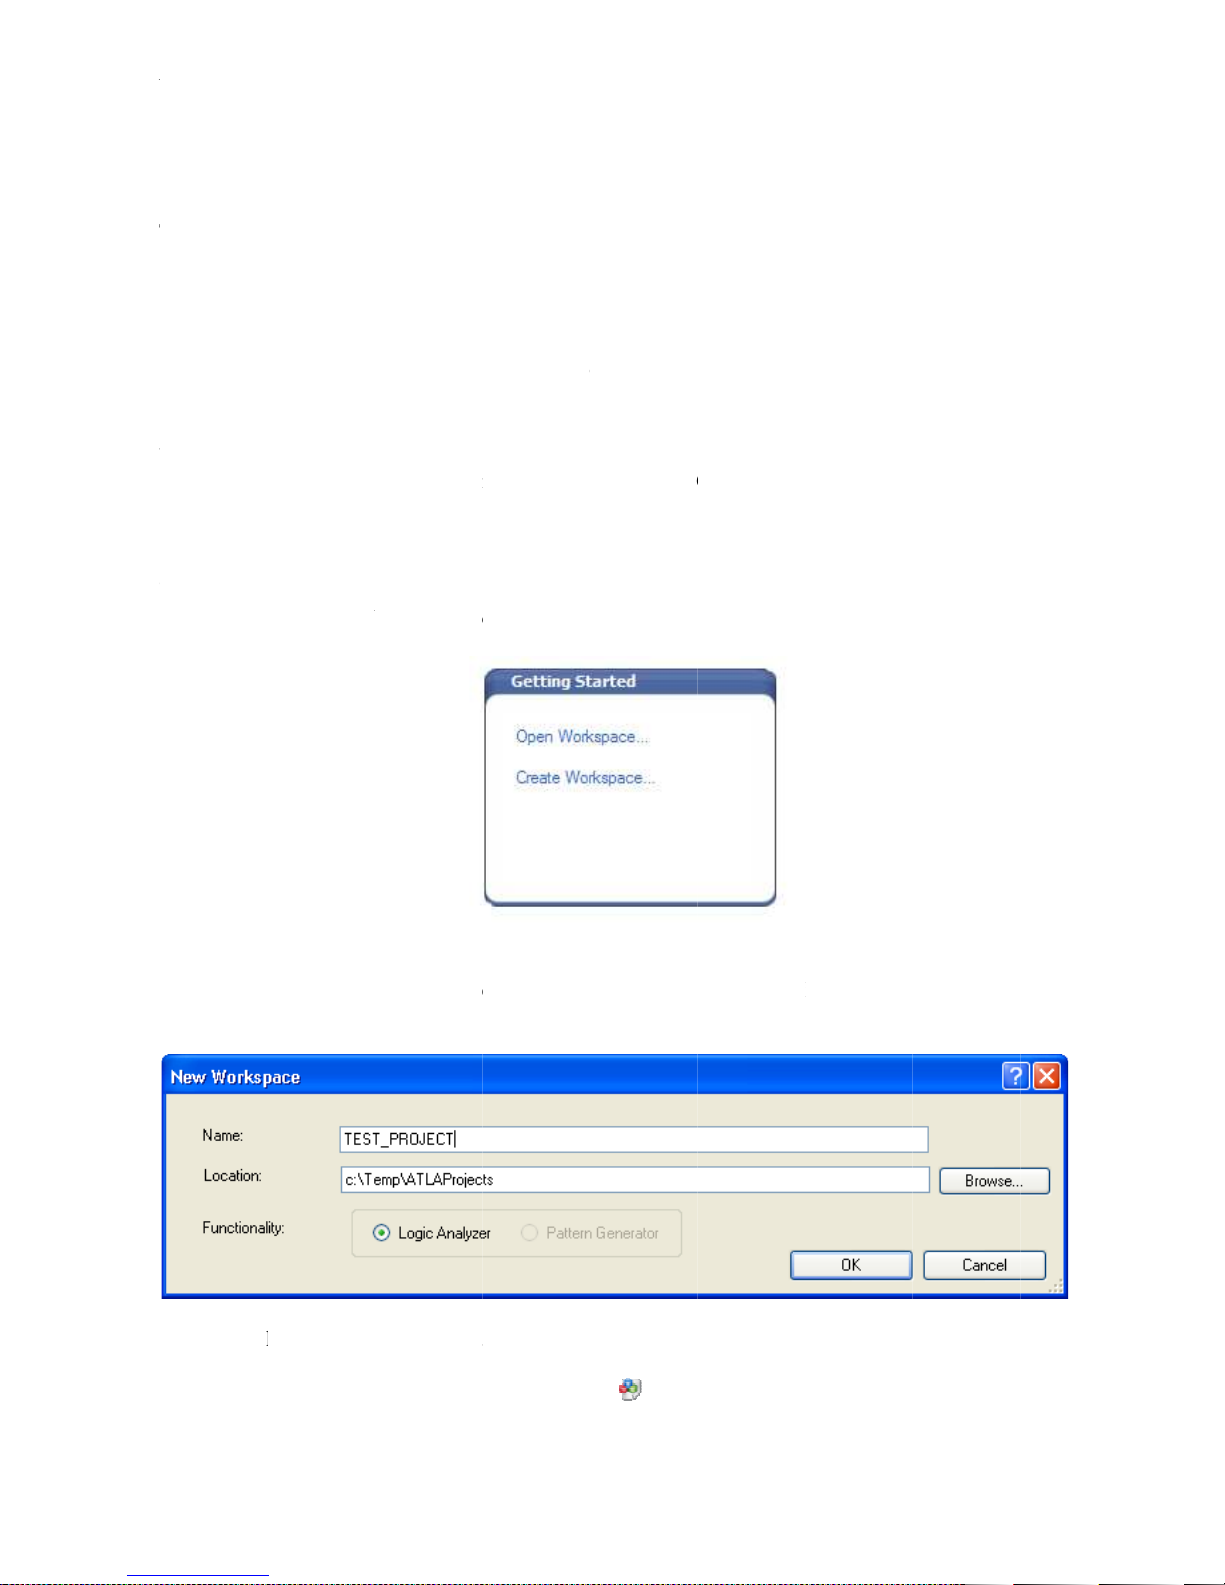
Click on Create Workspace on the
In the
folder path where the acquired
press OK;
On the left of the main window will appear the project tree column;
Double click on the Signal Definition icon
LA software;
New Workspace window, you can insert the desired name for the project, and the
uisition
amplitude does not exce
Getting Started
and settings
here described
the probe limit;
box
data will be stored.
: the Signal Definition window will appear;
step
on the left of the main window.
Insert required data then
.
•
•
•
•
•
reate a
•
AT-
is
-by-step
ed
•
•
•
Page 16
AT
AT
-LA500 – U
SER MANUAL
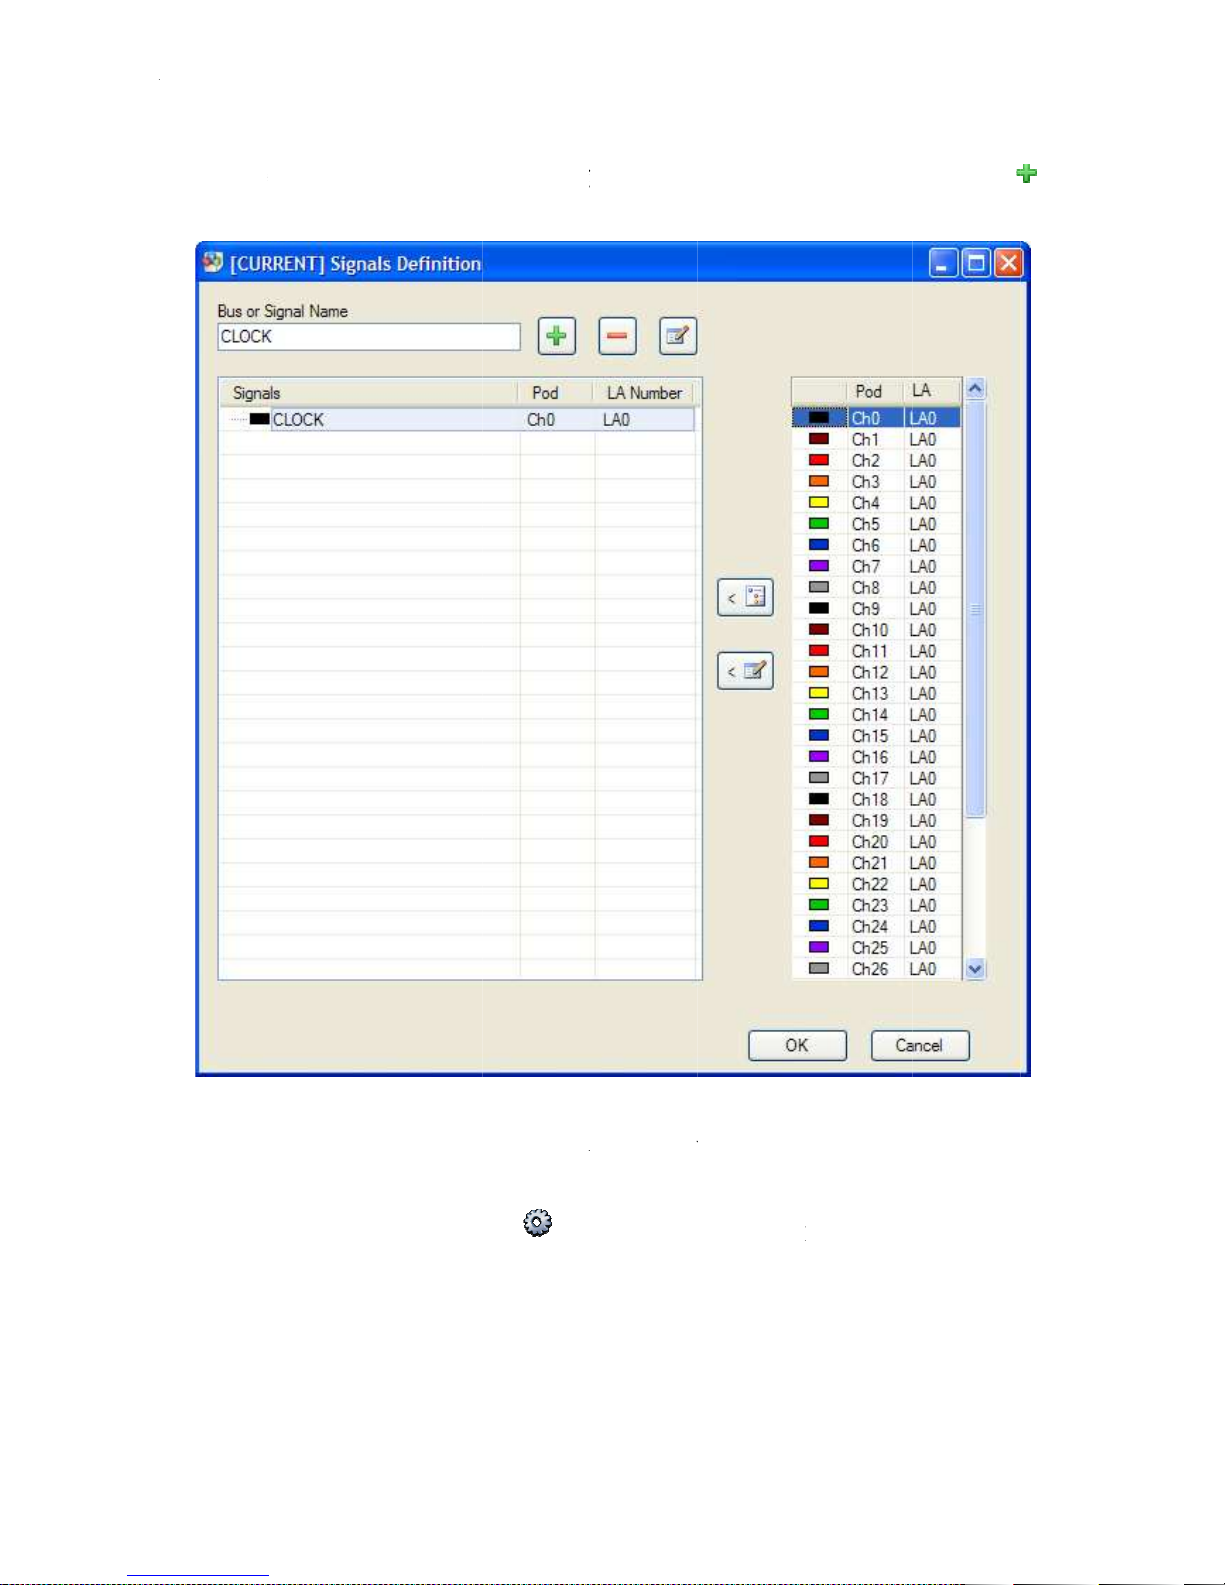
Enter a name of a signal in the
button to add it to the list of the signals;
Double click the Ch0 row on the channel list available on the right. This will set the
correspondence of the channel 0 of the AT
previous point. Click OK to close the Signal
Double click on the Setting icon
Bus or Signal Name
: the Settings window will appear;
box, i.e. CLOCK
LA500 with the signal “CLOCK” defined at
Definition window.
then click on the
•
,
•
s
•
the
Page 17
AT-LA500 – USER MANUAL
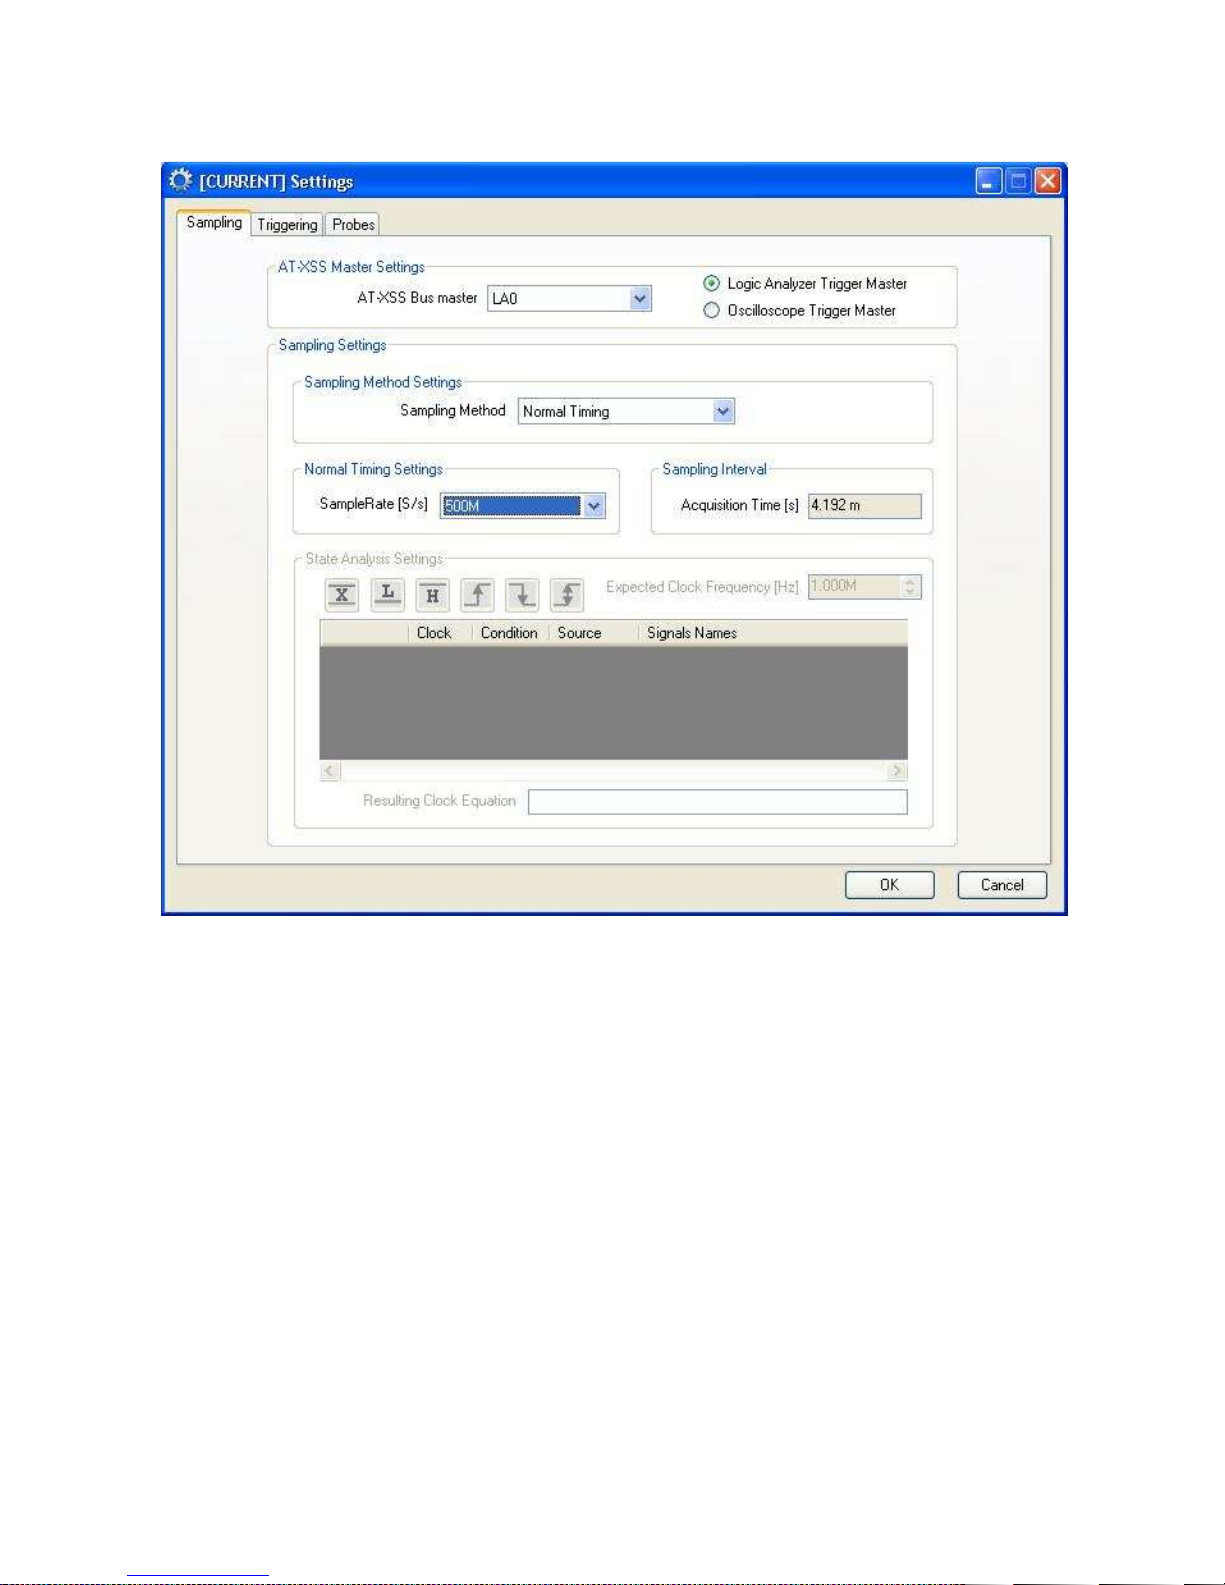
• In the Sampling tab, choose the better Sample Rate (i.e. 5x the frequency of the signal to
acquire);
RELEASE 3.4 – JUNE 2009 17
Page 18
AT
AT
-LA500 – U
SER MANUAL
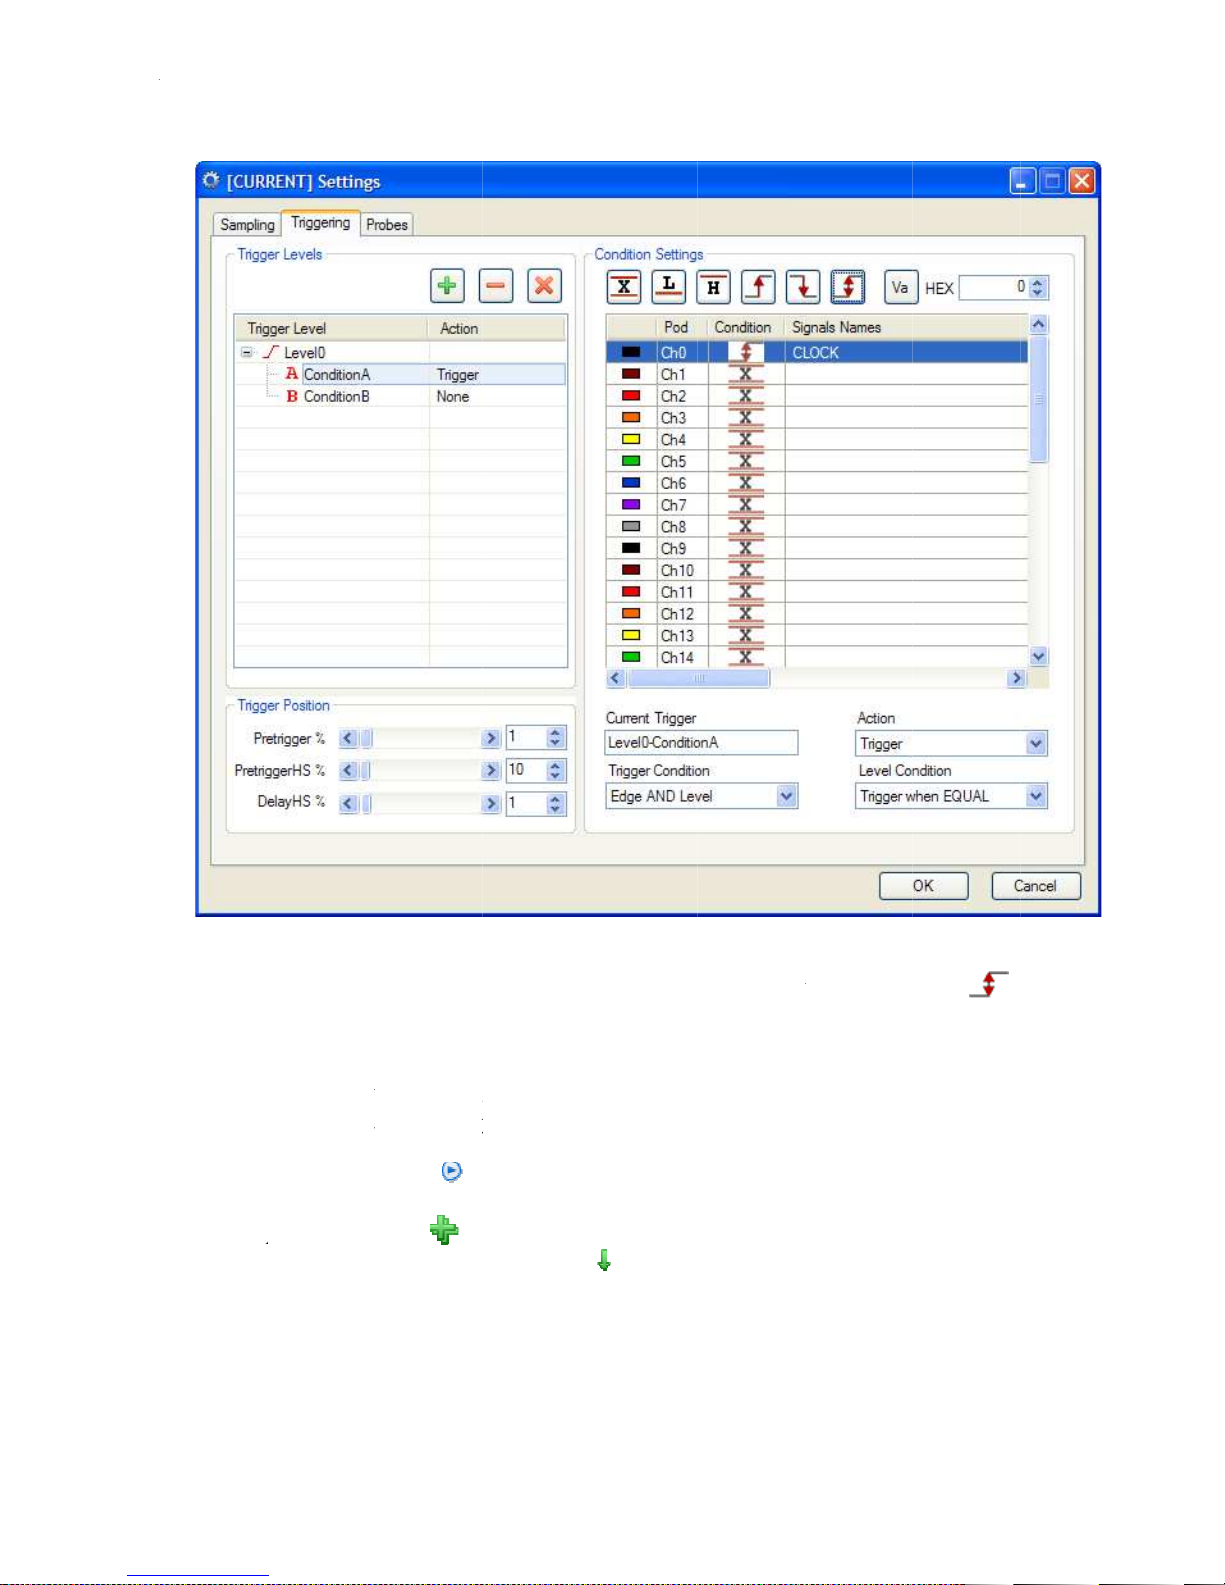
In the Triggering tab, click on
(it now contains also the signal name: CLOCK); click on the “both edges” icon
the condition A of the trigger level 0 is verified on every event occurring on
the AT
In the Probes tab you can set the threshold of the logic levels detected by the AT
This options is available only for active probes. Press OK to close the window;
Press the Start button
channel
the Add All button
Waveform View. Cli
window on the trigger event.
0, the instrument will trigger,
on the toolbar to start the acquisition. At the first edge on the
then click OK. Now you can examine acquired data on the
ck on the
ConditionA
hen a
branch of the Level0 tree; click on the Ch0 row
Signal Selection window will appear. Click on
button on the toolbar to center the Waveform
. Now
the channel 0 of
LA500.
•
•
•
-LA500;
-
t
,
Go to
Page 19
AT-LA500 – USER MANUAL
AT-LA500 Software
AT-LA Software allows controlling all settings related to the instrument and to the open acquisition
windows. Closing the AT-LA Navigator means to exit from the instrument control program.
RELEASE 3.4 – JUNE 2009 19
Page 20

AT-LA500 – USER MANUAL
Menu bar
The following menu are available on the menu bar:
File
• New Workspace: it allows creating a new workspace, by specifying its name and its work
directory;
• Open Workspace…: it allows opening an already existing project;
• Open Settings…: it allows loading settings already saved;
• Open Signal Definition… : it allows loading signal definitions already saved;
• Save Settings As…: it allows saving current settings with another name;
• Save Context: it allows saving current project;
• Save Acqisition As...: it allows saving current acquisition data with another name
• Save Signal Definition As…: it allows saving current signal definition with another name;
• Import Acquisition…: it allows loading acquisitions data previously saved;
• Close Current Window: Closes the window currently selected;
• Close All Window: Closes all the windows in the project;
• Exit: it allows closing the program.
View
• AT-LA Solution Explorer: it shows the project explorer tree;
• AT-LA Start Page: it shows the Start Page, with the recent projects list.
Tools
• Pod Status…: it opens the Pod Status Reader window, that shows the current logic status of
all the inputs;
• Options: it allows changing the default projects folder;
• Analog Delay...: it opens the Analog Delay window, that allows aligning correctly digital
and analog data in the Mixed Signal Display Mode (see Analog-Digital Delay Alignement
window chapter for details)
Window
• Lists the name of the project windows and allow showing the one which is selected.
Help
• About…: it shows the information related to the current software release.
RELEASE 3.4 – JUNE 2009 20
Page 21
AT
Status
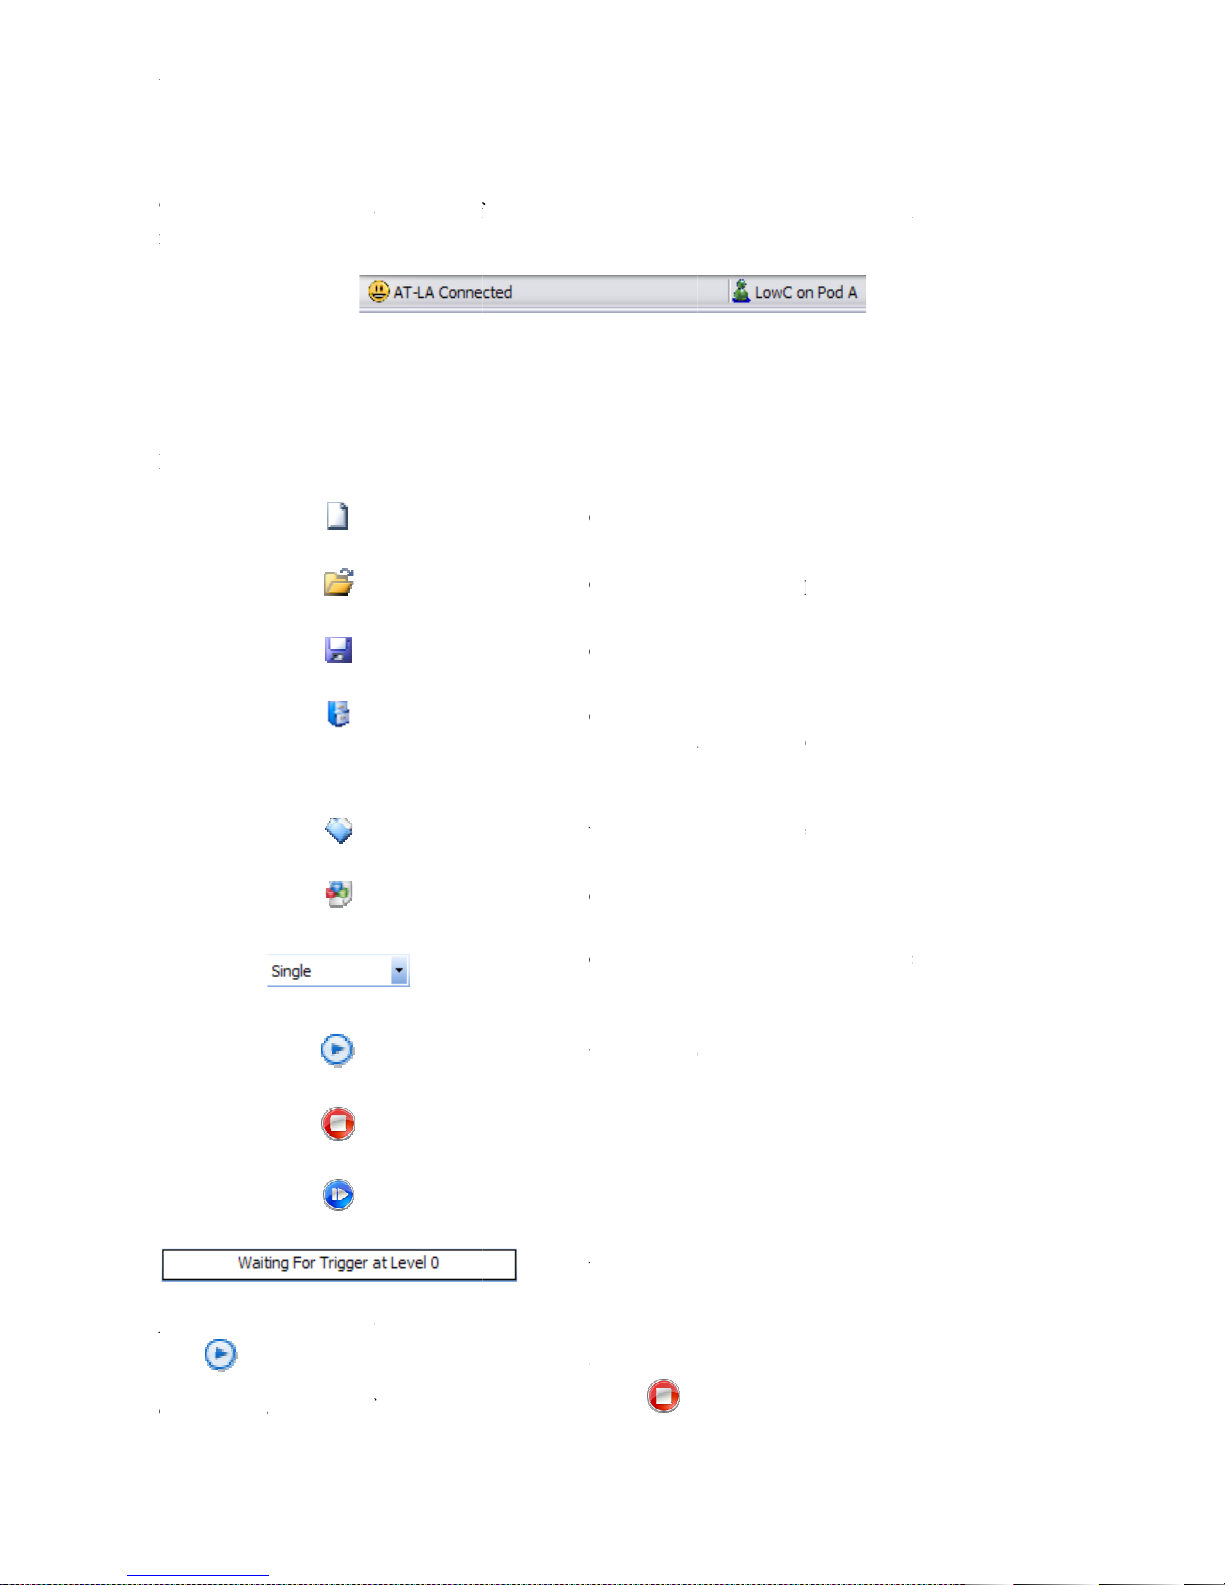
The status bar
notify the insertion or removal of a probe.
Tool
Following controls and indicators are available on the main tool bar
Note:
the
automatically restart after every acquisition until the
AT
-LA500 – U
SER MANUAL
Status
bar
The status bar
notify the insertion or removal of a probe.
Tool
Following controls and indicators are available on the main tool bar
Note:
When Single acquisition is selected, the AT
the button is pressed
automatically restart after every acquisition until the
on the bottom side of the main window shows the status of the AT
; when Co
It allows creating a new project;
allows opening an existing project;
It allows saving the current project;
It allows saving the current acquisition
will be stored
the Solution Explorer tree;
It shows the Solution
It allows visualizing the status of inputs in real time;
It allows choosing between
acquisition
It starts the data acquisition;
stops the data acquisition;
force
shows the
ntinuous acquisition is selected, the AT
and the saved acquisition will be added to
trigger event;
current status of the acquisition.
LA500 will perform only one acquisition
button is pressed.
Explorer;
ingle
LA500. It also
: all parameters
ontinuous
when
LA500 will
bar
-
:
It
S
or C
s;
It
It
It
s the
-
-
Page 22
AT-LA500 – USER MANUAL
Solution Explorer
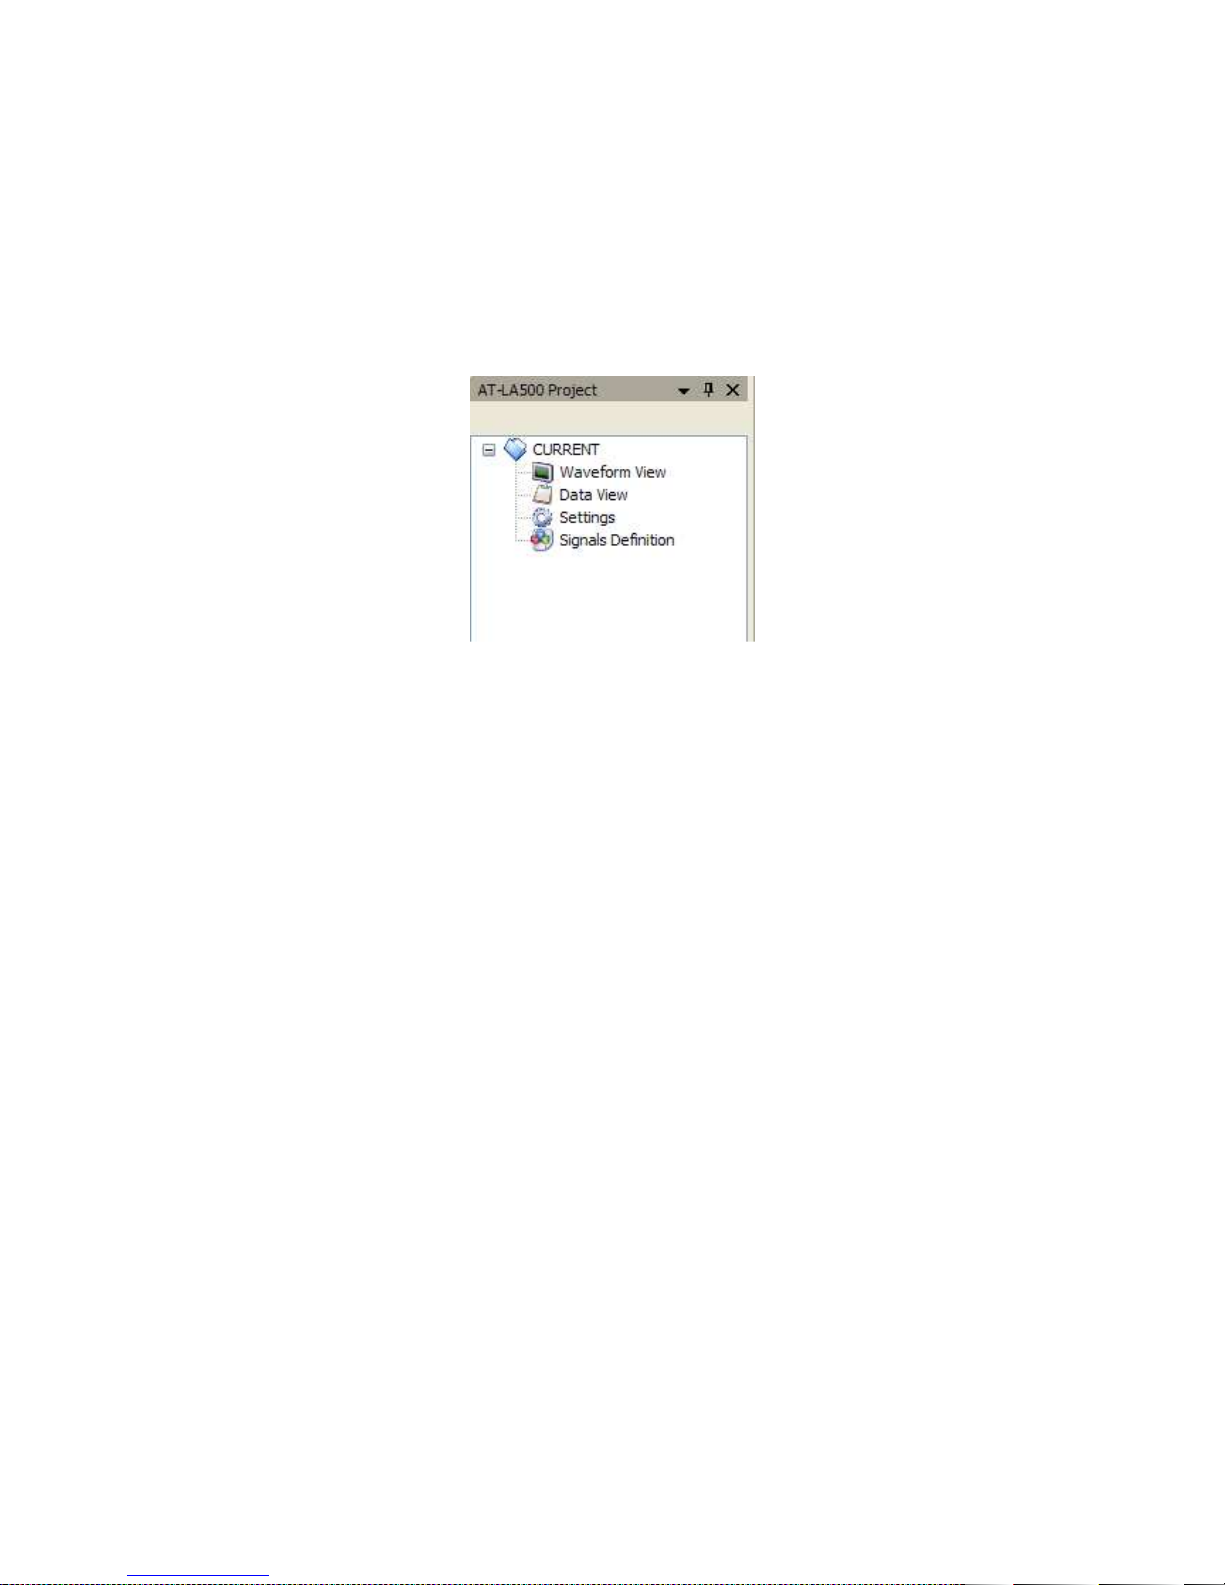
This area contains a list of shortcuts to open the Waveform View, the State Listing, the Settings
window and the Signal Definition window. It also contains user saved acquisitions. By double
clicking with the left mouse button on the Waveform View icon, on the State Listing icon, on the
Settings icon or on the Signal Definition icon, the corresponding window will be opened or created.
Signal Definition
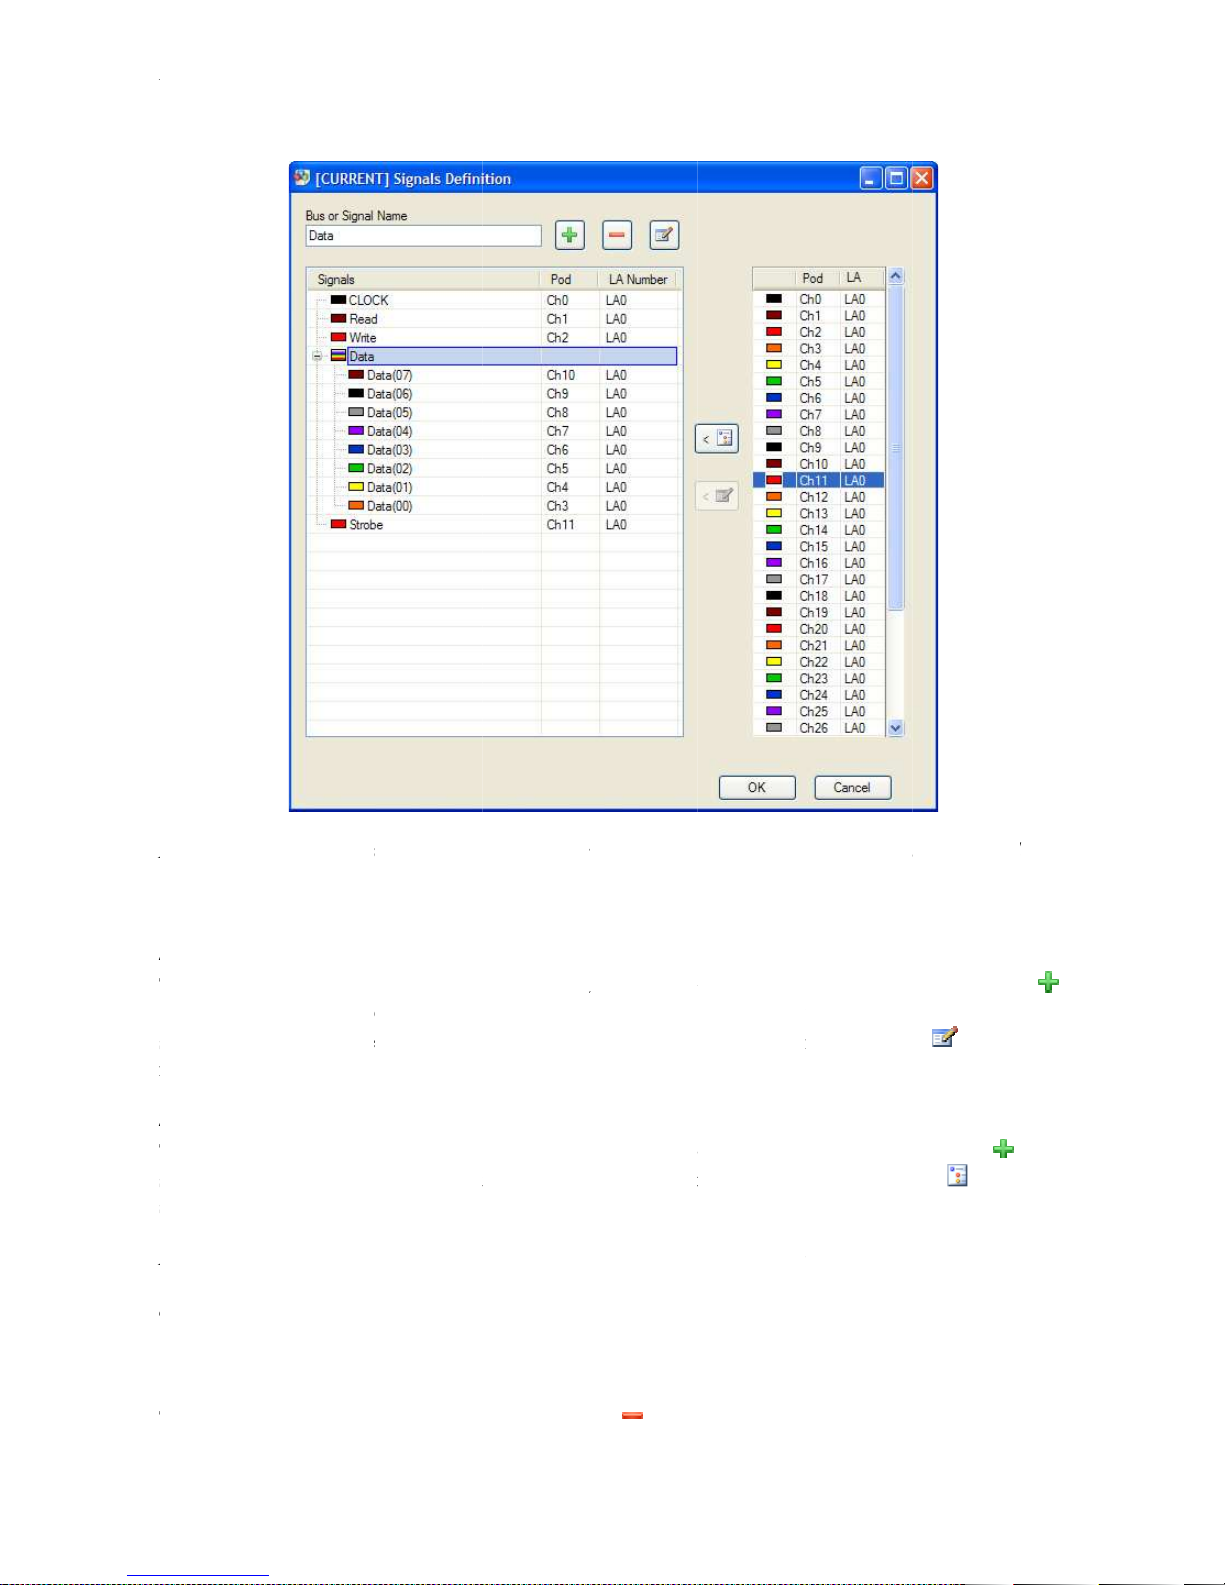
This panel allows defining a list of signals or bus and choosing their correspondence to the
channels of the AT-LA500. Only the signals defined in this panel can be viewed in the Waveform
View or State Listing windows. The right table shows all the AT-LA500 channels and the colors of
the correspondent wires.
RELEASE 3.4 – JUNE 2009 22
Page 23
AT
Note
the projects (i.e. for the I
Adding a signal
To add a signal to the list, write the desired name in the
then double click on the desired channel
signal name and channel. You can also select the desired channel row and click on
methods can be used also to change any previously defined correspondence.
Adding a bus
To add a bus to the list, write the desired name in the
select the rows of the channels that will form the bus in the right table. Click on
selected signals to the bus.
Note
To chose a group of consecutive channels, click on the first one, keep pressed the Shift key, then
click on the last one. All the
Removing a signal or a bus
To remove a signal or a bus,
AT
-LA500 – U
SER MANUAL
Note
When a signal protocol trigger is selected, their standard signals are automatically added to
the projects (i.e. for the I
Adding a signal
To add a signal to the list, write the desired name in the
then double click on the desired channel
signal name and channel. You can also select the desired channel row and click on
methods can be used also to change any previously defined correspondence.
Adding a bus
To add a bus to the list, write the desired name in the
select the rows of the channels that will form the bus in the right table. Click on
selected signals to the bus.
Note
To chose more than one channel keep pressed the Ctrl key and click on the desired c
To chose a group of consecutive channels, click on the first one, keep pressed the Shift key, then
click on the last one. All the
Removing a signal or a bus
To remove a signal or a bus,
C the SCL and SDA
channels between the first and the last will be selected.
select it then click on
signals)
row of the right table
Bus or Signal Name
Bus or
to set the correspondence
Signal Name
<
click on
between
Both these
to add all
hannels
:
2
.
box
and
,
.
:
box and
click on ,
<
then
.
.
Page 24

AT-LA500 – USER MANUAL
Editing a signal or bus name
To change the name of a signal, select it, change its name in the Bus or Signal Name box and click
on .
Settings
The Settings panel allows configuring AT-LA500 for a correct acquisition. It is divided in several
tabs: Sampling, Triggering, and Probes. The Sampling tab and Triggering tab change depending on
the selected Sampling Method.
Sampling
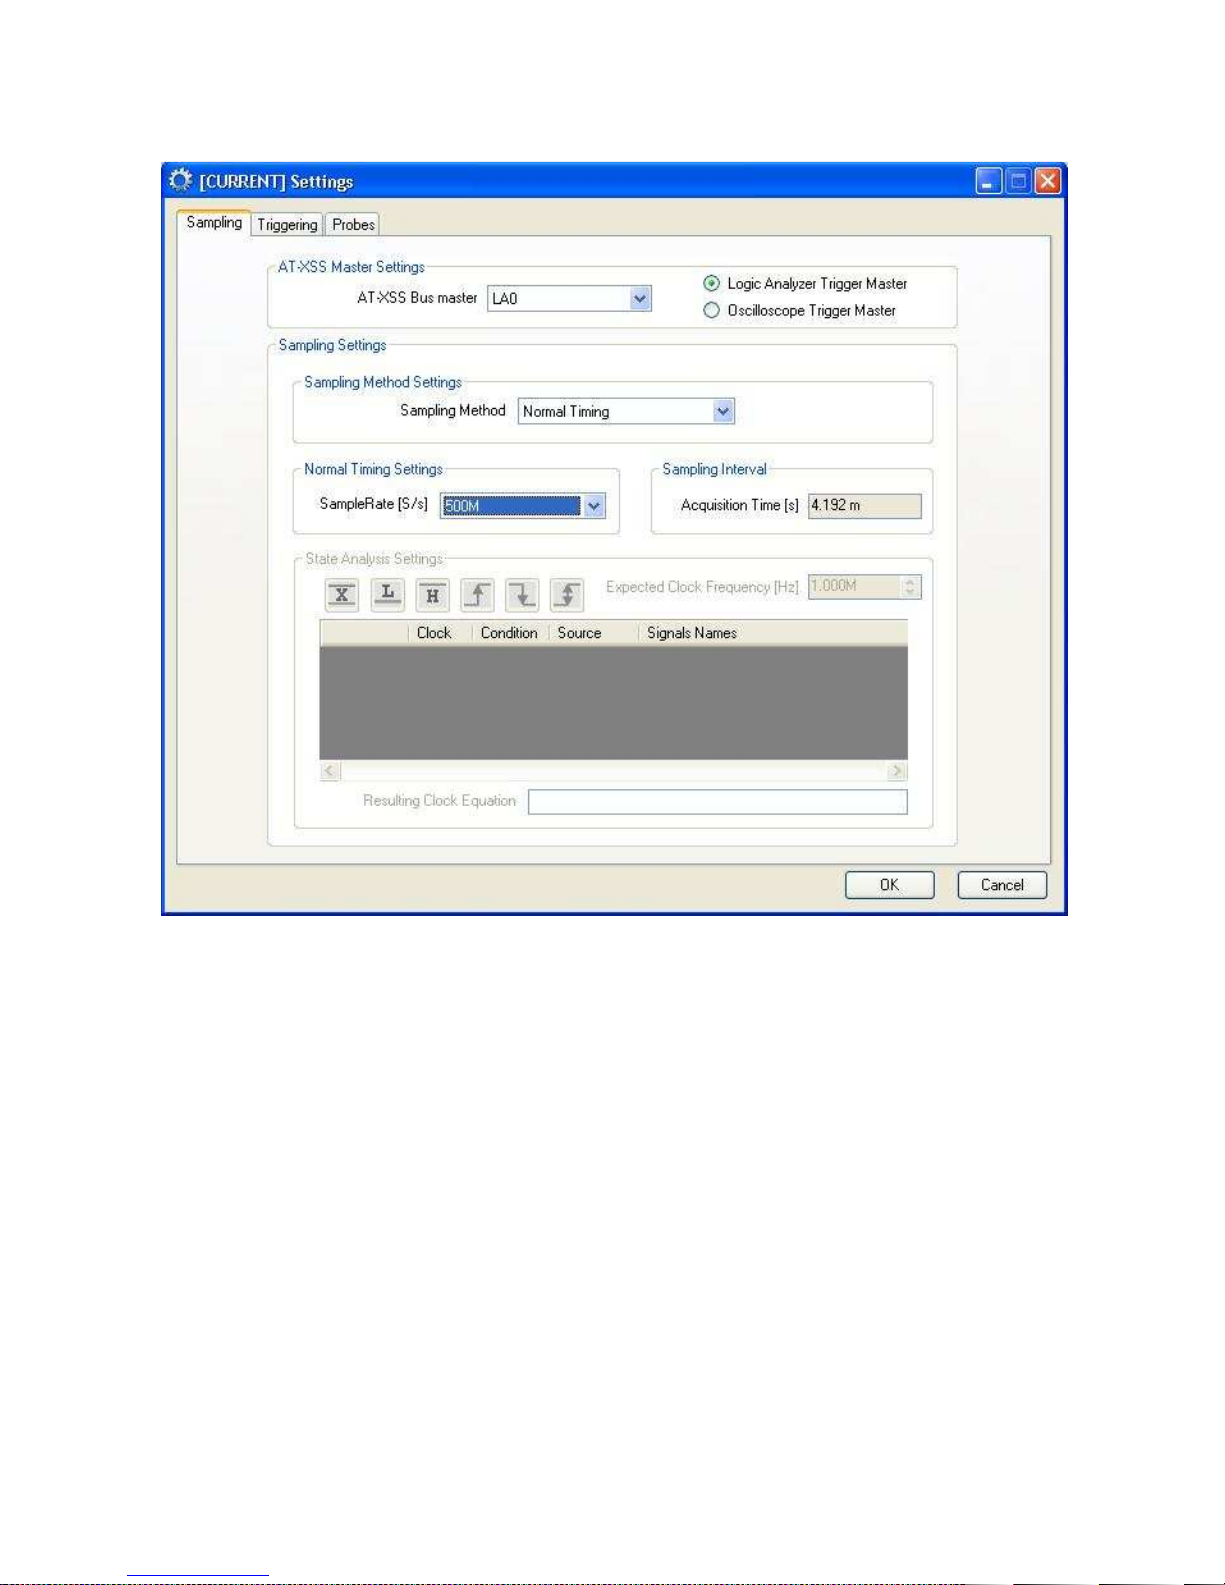
Within the Sampling tab it is possible to set the clock source, the sampling method, the sampling
frequency and the AT-XSS Bus master if available. Furthermore, the acquisition time is shown.
Five sampling modes are available within the Sampling Method menu ring:
• Normal Timing
• State Analysis
• I2C
• SPI/µWire
• UART/RS232
If more than one instrument are connected together by means of the AT-XSS Expansion Bus, the
user can select the instrument where to set the trigger by using the menu ring AT-XSS Bus Master.
Using the radio buttons Logic Analyzer Trigger Master and Oscilloscope Trigger Master it’s
possible to select the trigger signal source, if an oscilloscope is present and connected; all the ATLA500 instruments connected together, can be triggered by the oscilloscope.
Note: The trigger event will be always generated evaluating only one of the connected instruments.
For a better acquisition is suggested to set the trigger settings on a middle positioned Logic
Analyzer.
Normal Timing Analysis
When this sampling mode is selected, data acquisition is performed by AT-LA500 by using an
internal clock. The sampling frequency can be selected by means of the Sample Rate [S/s] menu
ring. In addition, when configured in Normal Timing Analysis, the AT-LA500 also acquires data at
1.5GS/s. This is useful to detect glitches or skew between signals. These data are identified with the
“HS” (High Speed) prefix. The High Speed sample rate is fixed, and the correspondent memory
depth is 1kSample for each channel. However, it is possible to set a pretrigger and a delay specific
for the HS acquisition data.
RELEASE 3.4 – JUNE 2009 24
Page 25
AT-LA500 – USER MANUAL
Note: For a correct acquisition, the sampling frequency should be at least 4 or 5 times higher than
the maximum frequency of the signals to be acquired.
RELEASE 3.4 – JUNE 2009 25
Page 26
AT-LA500 – USER MANUAL
State Analysis
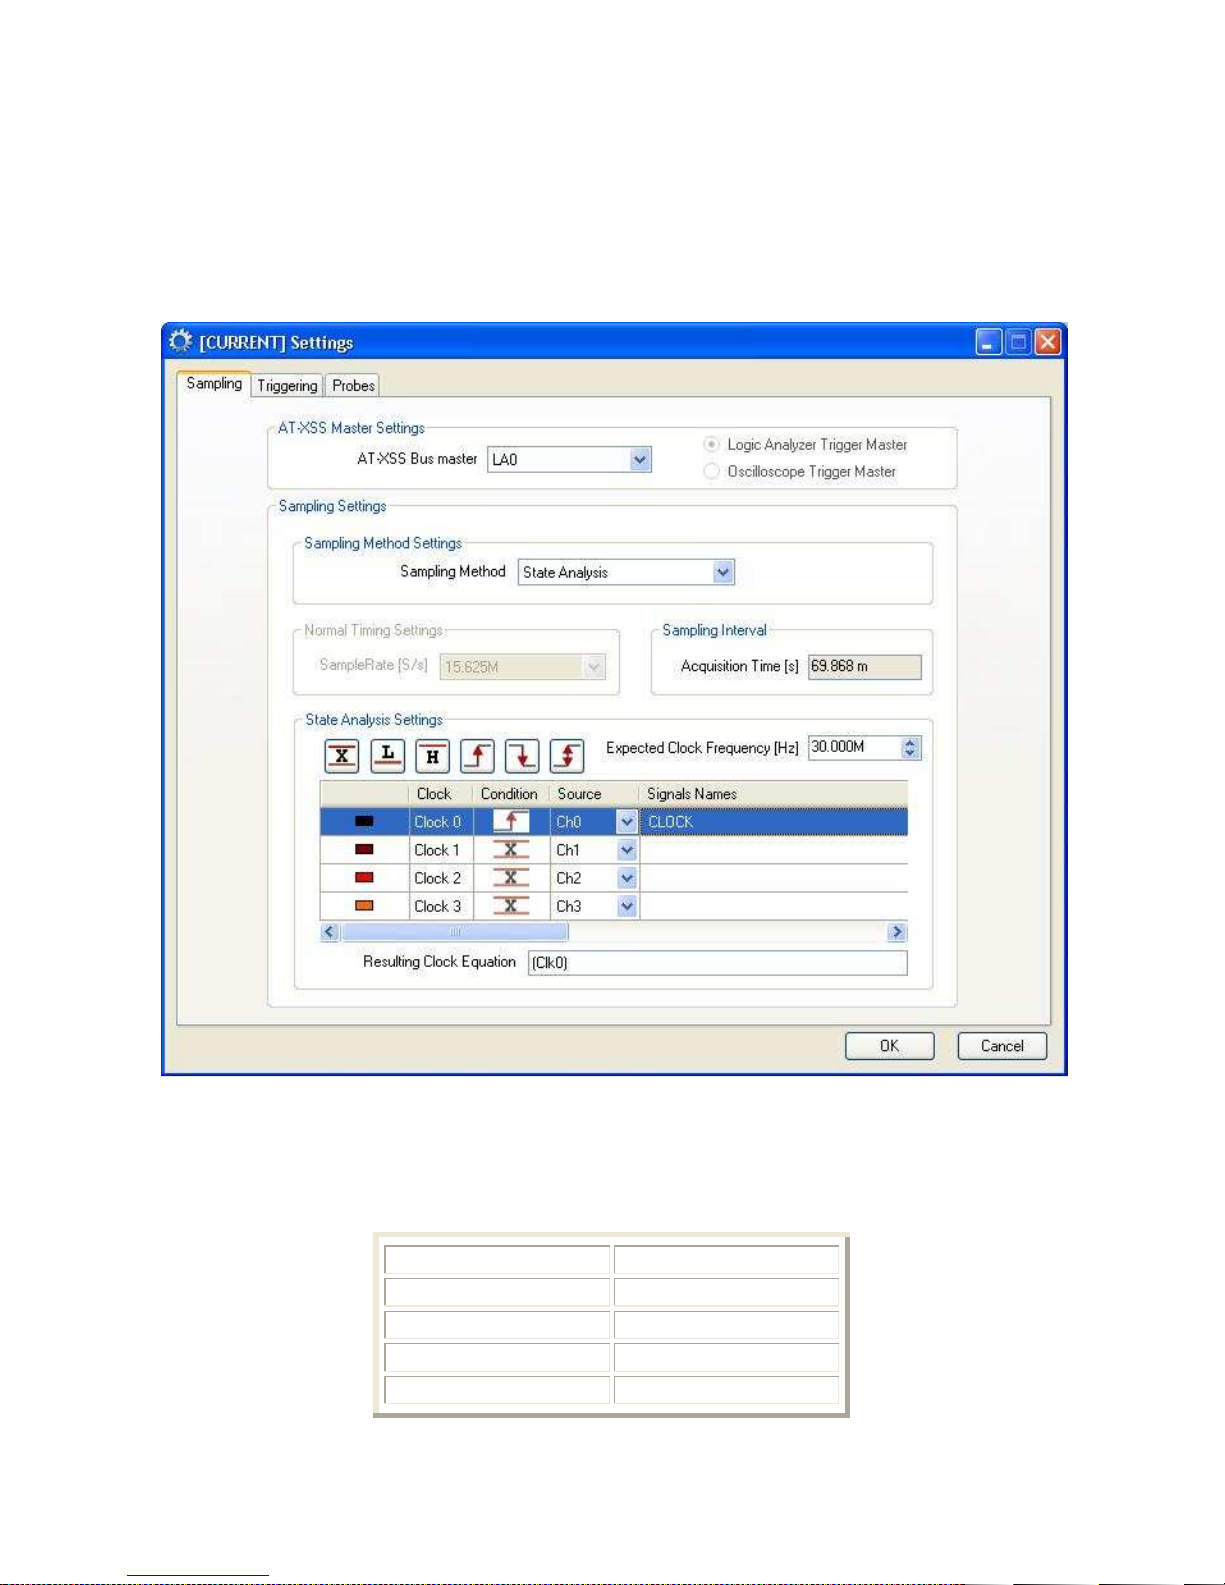
When this sampling mode is selected, data acquisition is triggered by a specific event. If a clock
signal is present in the system under test, this sampling mode allows synchronizing the data
acquired by AT-LA500.
In the Expected Clock Frequency [Hz] control the clock frequency applied to the instrument can be
entered. This feature allows dimensioning correctly the time bars in the visualization windows.
Signals determining the clocks are divided in 4 groups of 4 signals, one for each bank. The division
is the following:
RELEASE 3.4 – JUNE 2009 26
Clock Channel
0 0, 9, 18, 27
1 1, 10, 19, 28
2 2, 11, 20, 29
3 3, 12, 21, 30
Page 27

AT
For each clock it is possible to select one channel among four available. This feature allows using
all the programmable thresholds with the maximum flexibility.
For each clock it is possible to select the event triggering data acquisition. The possible c
Each sample will be acquired when at least one condition is verified on the signal edges and at least
one condition on the signal levels. The
condition that has been set.
Note
Not
Samples acquired during this phase are meaningless.
AT
-LA500 – U
SER MANUAL
For each clock it is possible to select one channel among four available. This feature allows using
all the programmable thresholds with the maximum flexibility.
For each clock it is possible to select the event triggering data acquisition. The possible c
Each sample will be acquired when at least one condition is verified on the signal edges and at least
one condition on the signal levels. The
condition that has been set.
Note
t least one condition on an edge of at least one clock must be set.
Not
efore commuting to an external clock, the instrument requires an initialization phase.
Samples acquired during this phase are meaningless.
Don’t care (the signal will be ignored);
High logic value;
Low logic value;
Rising edge;
Falling edge;
Any edge.
Resultin
E
indicator summarizes the logic
hoices are:
: A
e: B
g Clock
quation
Page 28
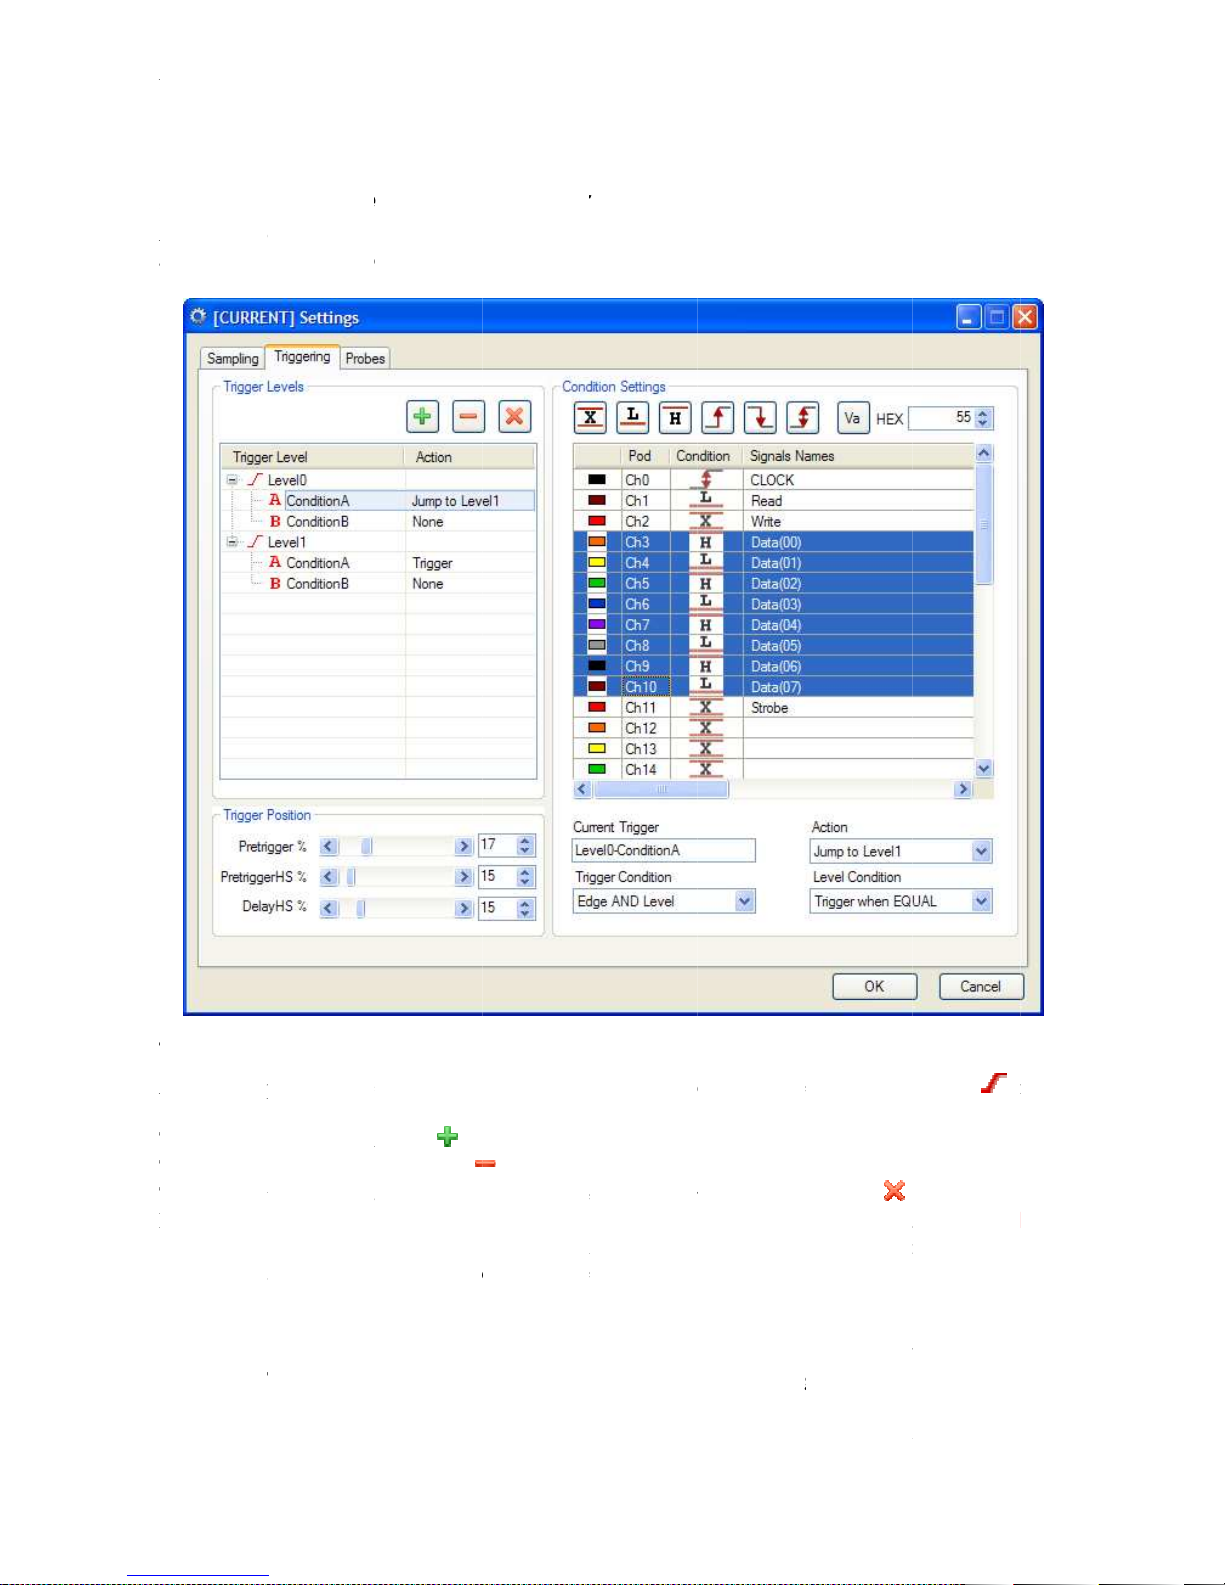
AT
Normal and State Analysis
All trigger
and the name of this tab changes depending on the Sampling Method selected.
Trigger Levels
AT
tree positioned on the left side of this tab.
To add a trigger level click on
To remove a trigger level click on
To
Each trigger level has 2 trigger condition “A” and “B”. Selecting one of the conditions
the tree, the correspondent settings pattern will be automatically updated on controls/indicators at
the right side o
the action to do when the condition appears.
AT
-LA500 – U
SER MANUAL
Normal and State Analysis
All trigger
levels and conditions
and the name of this tab changes depending on the Sampling Method selected.
Trigger Levels
AT-LA500 permits to edit up to 31 trigger levels,
tree positioned on the left side of this tab.
To add a trigger level click on
To remove a trigger level click on
To
clear all the trigger settings and to
Each trigger level has 2 trigger condition “A” and “B”. Selecting one of the conditions
the tree, the correspondent settings pattern will be automatically updated on controls/indicators at
the right side o
the action to do when the condition appears.
• None
• Trigger
Jump to
f this tab. For each condition
Level
necessar
a new trigger level will be added at the end of the list.
The condition happening will be ignored (Never Trigger);
The condition happening leads to a Trigger event;
The condition happening leads to a jump at trigger Level
where
Trigger
for data acquisition can be set in this tab.
this command will remove the last l
get the default trigger conditions click on
the user, by using the menu ring
e
is the number of one of the present trigger levels.
are represented with the symbol
possible actions
evel from the list.
Action,
The controls
in the
B
can also set up
B
ies
which
:
:
Th
•
n
n
are:
.
A or
on
n,
Page 29

AT
Note
Edges and Levels
In order to set the condition “A” or “B” the user must properly set the state of the Logic Analyzer
channels.
.
To set
correspondent to the channel to set in the table on the right side of the window (note that the column
Signal Names
on the desired button on the top. If more than one signal
will be applied to all selected signals. Also, it is possible to set a level setting to all selected signals
by writing
Note:
mode.
C
For each signal it is possible to indicate whether the trigger conditi
edge, on a
edges of several signals, the trigger event will be determined by the
condition. If no trigger cond
will never
C
For each signal it is possible to indicate whether the trigger condition must be detected on a high or
a low logic level. When the trigger conditions have been set on logic levels of several signals, the
trigger event will be determined by
If no trigger conditions on logic levels have been set for any signal, the trigger conditions on logic
levels
The trigger condition set on logic levels is useful when the trigger event
specific pattern.
By using the
events on logic levels.
AT
-LA500 – U
SER MANUAL
Note
henever the acquisition starts the Logic Analyzer waits for the conditions at Level0.
Edges and Levels
In order to set the condition “A” or “B” the user must properly set the state of the Logic Analyzer
channels.
ach channel state can assume the following attribute:
.
Don’t care (the signal will be ignored);
High logic level;
Low logic level;
Rising edge;
Falling edge;
Any edge;
Sets the value entered in the near control box to a bus
To set
on a
correspondent to the channel to set in the table on the right side of the window (note that the column
Signal Names
on the desired button on the top. If more than one signal
will be applied to all selected signals. Also, it is possible to set a level setting to all selected signals
by writing
its value in hexadecimal format then clicking the
Note:
Some channels can’t also be available if they are used as Clock sources on State Analysis
mode.
C
onditions on edges
For each signal it is possible to indicate whether the trigger conditi
edge, on a
falling
edges of several signals, the trigger event will be determined by the
condition. If no trigger cond
will never
occur
C
onditions on logic levels
For each signal it is possible to indicate whether the trigger condition must be detected on a high or
a low logic level. When the trigger conditions have been set on logic levels of several signals, the
trigger event will be determined by
If no trigger conditions on logic levels have been set for any signal, the trigger conditions on logic
levels
always
The trigger condition set on logic levels is useful when the trigger event
specific pattern.
By using the
events on logic levels.
channel, first select the condition A or B of the desired level, then click on the row
contains the user defined names for the signals to ac
edge or for any
considered as
Level Condition
of the two
itions on edges have been set
the occurrence
verified.
: menu ring it is possible to select among several conditions for trigger
edge
the occurrence
are
. When the trigger conditions have been set on
f all conditions simultaneously.
quire). To set a condition, click
selected, the same level or edge setting
on must be detected on a
for any signals
occurrence
, trigger
must be detected for a
rising
at least one
on edges
Va
: W
it
E
.
are
Va button.
s
of
events
.
o
Page 30

AT-LA500 – USER MANUAL
•
•
•
•
•
•
•
•
•
Trigger when EQUAL:
The trigger event occurs when the state of the evaluated
signals is equal to the specified pattern;
Trigger when NOT EQUAL:
The trigger event occurs when the state of the evaluated
signals is different from the specified pattern;
Trigger when CHANGED:
The signals selected for a trigger event on logic levels are
examined when data acquisition starts. These sampled values
will constitute the reference pattern. The trigger event occurs
when the state of the selected signals is different from the
reference pattern.
The conditions chosen by the user on logic levels are ignored.
AT-LA500 will simply use the information related to which
channels are to be examined for trigger detection.
Relationship between trigger conditions
A relationship between trigger conditions on edges and trigger conditions on logic levels can be set
by the user, by using the Trigger condition menu ring. Several options are available:
Edge OR Level:
Edge AND Level:
Edge BEFORE Level:
Edge AFTER Level:
ALWAYS:
NEVER:
Note: The trigger event is detected in an asynchronous way, independently of the sampling
frequency. If this frequency is too low or an external clock is used, the trigger event, even if
correctly detected, may not be visualized in the Waveform or Data Windows.
A trigger condition occurs when one between an edge condition or a
logic level condition is detected;
A trigger condition occurs when an edge condition and a logic level
condition are satisfied simultaneously;
A trigger condition occurs when an edge condition has been detected
at least once before that on logic levels;
A trigger condition occurs when an edge condition has been detected
at least once after that on logic levels;
A trigger condition occurs automatically when data acquisition starts.
Any setting on edges or on logic levels will be ignored;
Trigger is inhibited. Any setting on edges or on logic levels will be
ignored. A trigger event, however, can be activated manually during
data acquisition.
Pretrigger, PretriggerHS and DelayHS
The Pretrigger control allows specifying the position in which the trigger event will be located with
respect to the AT-LA500 memory. If the most meaningful data must be sampled after the trigger
detection, low pretrigger percentage must be selected. On the contrary, if signal evolutions before
trigger event must be analyzed, a high pretrigger percentage is more suitable.
The High Speed data have a dedicated PretriggerHS control to set the trigger position respect to the
1kSample HS memory.
It is also possible to insert a programmable delay to shift the High Speed data acquisition to help to
focus the event to examine if this is far from the trigger instant.
RELEASE 3.4 – JUNE 2009 30
Page 31

AT-LA500 – USER MANUAL
Note: The PretriggerHS can only assume values in the range 10% - 90%.
RELEASE 3.4 – JUNE 2009 31
Page 32

AT-LA500 – USER MANUAL
I2C Trigger
In this mode, the AT-LA500 can trigger when a selected event occurs on a I2C (Inter Integrated
Circuit) bus. Furthermore, the acquired data are decoded and shown in the Waveform View and
State Listing windows.
To set up the AT-LA500 for an I2C acquisition, the following steps are required:
• Connect a Passive Probe or a High-Z Probe to the pod A. In this case you also have to
correctly set the threshold voltage in the Probes tab of the Settings window;
• Connect at least one grounded pin (white wires) to the ground of the board to test;
• Connect the Channel 0 (black wire) to the SDA line of the I2C bus to test;
• Connect the Channel 1 (brown wire) to the SCL line of the I2C bus to test.
Note: It is not possible to use a Low-C Probe to analyze an I2C bus: this could prevent the system
under test to work properly.
The I2C trigger has 2 different options: Address and Address&Data. These options are selectable by
using the I2C Trigger Type control.
Address
In this mode, the AT-LA500 can trigger when the I2C bus addresses one or more peripheral.
In the Trigger On control, it is possible to choose which operation has to be triggered. The available
options are:
• Read or Write: trigger on every operation on the bus;
• Read: trigger when the bus is performing a read operation, ignoring the ACK bit;
• Write: trigger when the bus is performing a write operation, ignoring the ACK bit;
• ACK R/W: trigger on every acknowledged operation on the bus;
• ACK Read: trigger on an acknowledged read operation on the bus;
• ACK Write: trigger on an acknowledged write operation on the bus;
• NACK R/W: trigger on every not acknowledged operation on the bus;
• NACK Read: trigger on a not acknowledged read operation on the bus;
• NACK Write: trigger on a not acknowledged write operation on the bus;
RELEASE 3.4 – JUNE 2009 32
Page 33
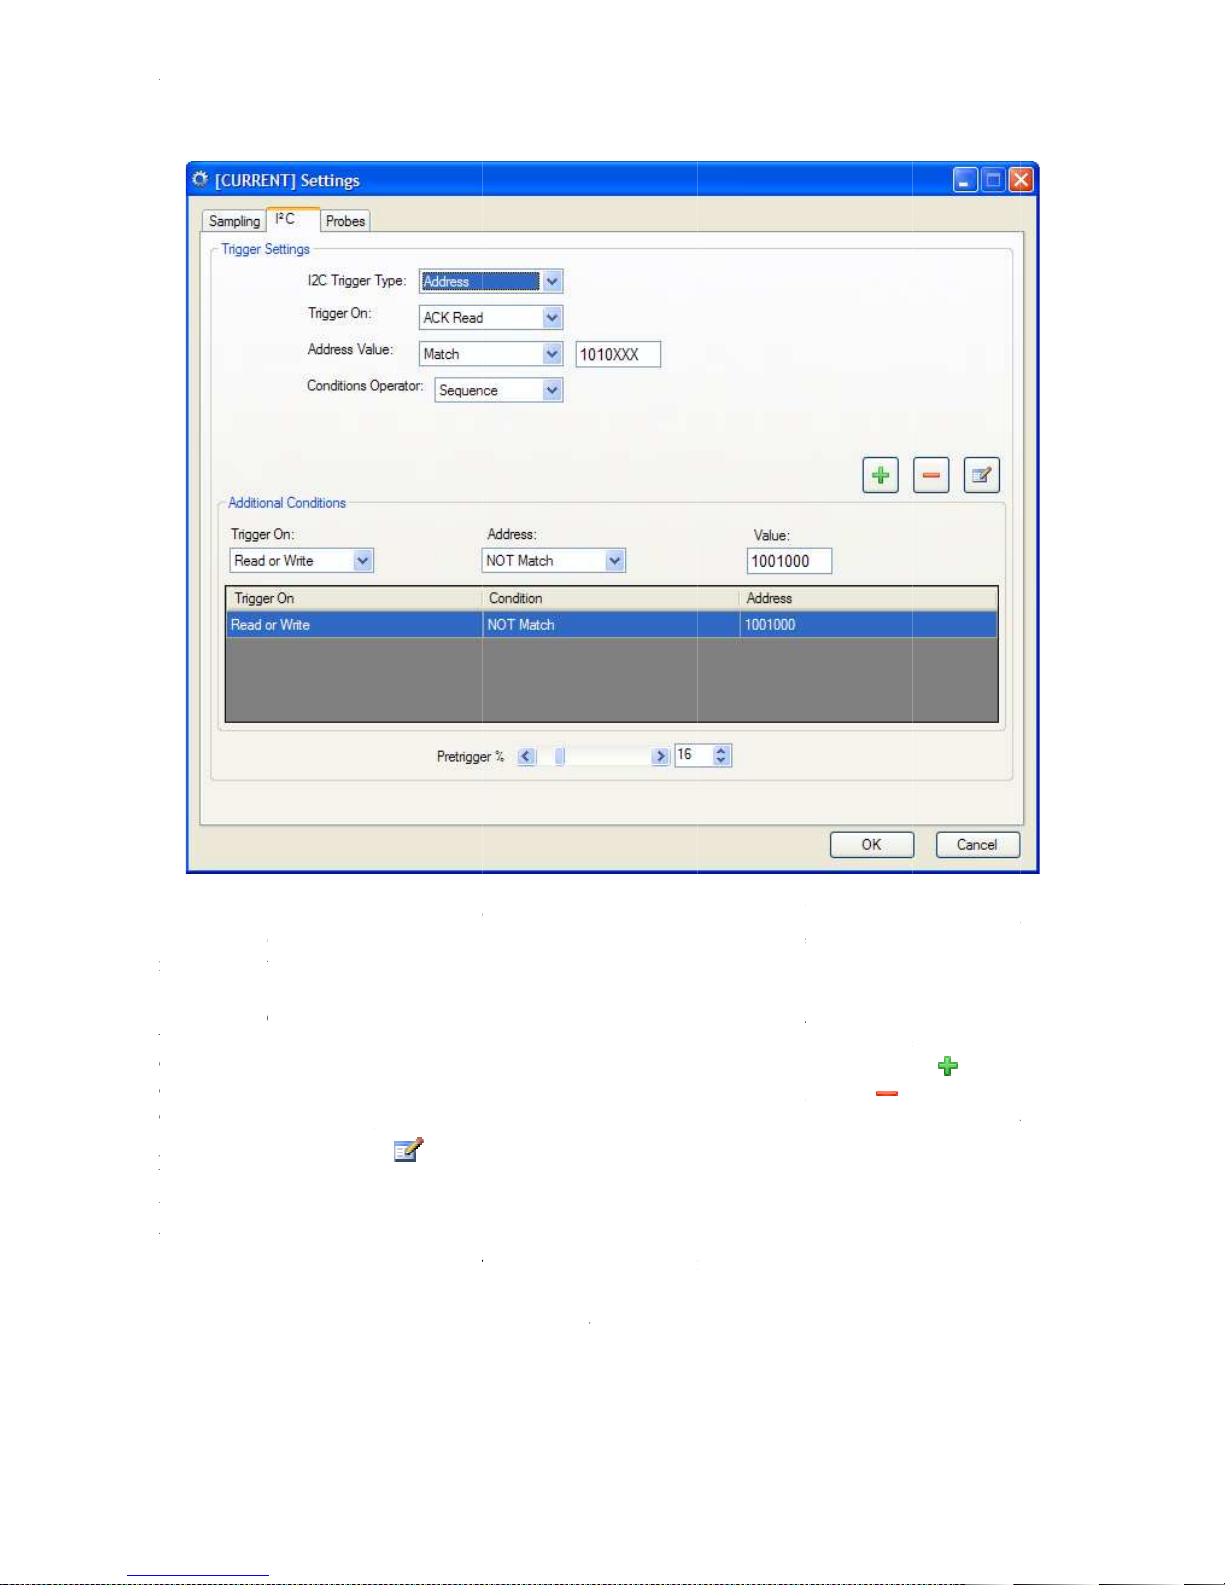
AT
In the
leaving X on the don’t care bits. Furthermore, it is possible to choose if the inserted value should
match or not match the one to trigger on.
It is possible to add other
bottom side of the window. The controls have the same meaning of the ones just described.
To add a condition, fill the controls on the
To remove a condition, select the correspondent row in the table, then click on
To edit a condition, double click on the correspondent row in the table, modify the required
parameters, then click on
When more than one address condition
which is possible to choose between:
AT
-LA500 – U
SER MANUAL
In the
Address Value
leaving X on the don’t care bits. Furthermore, it is possible to choose if the inserted value should
match or not match the one to trigger on.
It is possible to add other
bottom side of the window. The controls have the same meaning of the ones just described.
To add a condition, fill the controls on the
To remove a condition, select the correspondent row in the table, then click on
To edit a condition, double click on the correspondent row in the table, modify the required
parameters, then click on
When more than one address condition
which is possible to choose between:
Sequence
specified
: the AT
control it is possible to insert the 7
: the AT
LA500 trigger
address conditions (up to 15) in the
to apply them.
LA500 triggers when all the
Additional Conditions
set, the
when at least one of the
bit binary value of the address to trigger,
Conditions Operator
entered
Additional Conditions
frame, then click on
address conditions are verified in the
address conditions
control is enabled, by
on the
verified.
•
• OR
order;
-
-
frame
.
.
are
-
s
entered
is
Page 34
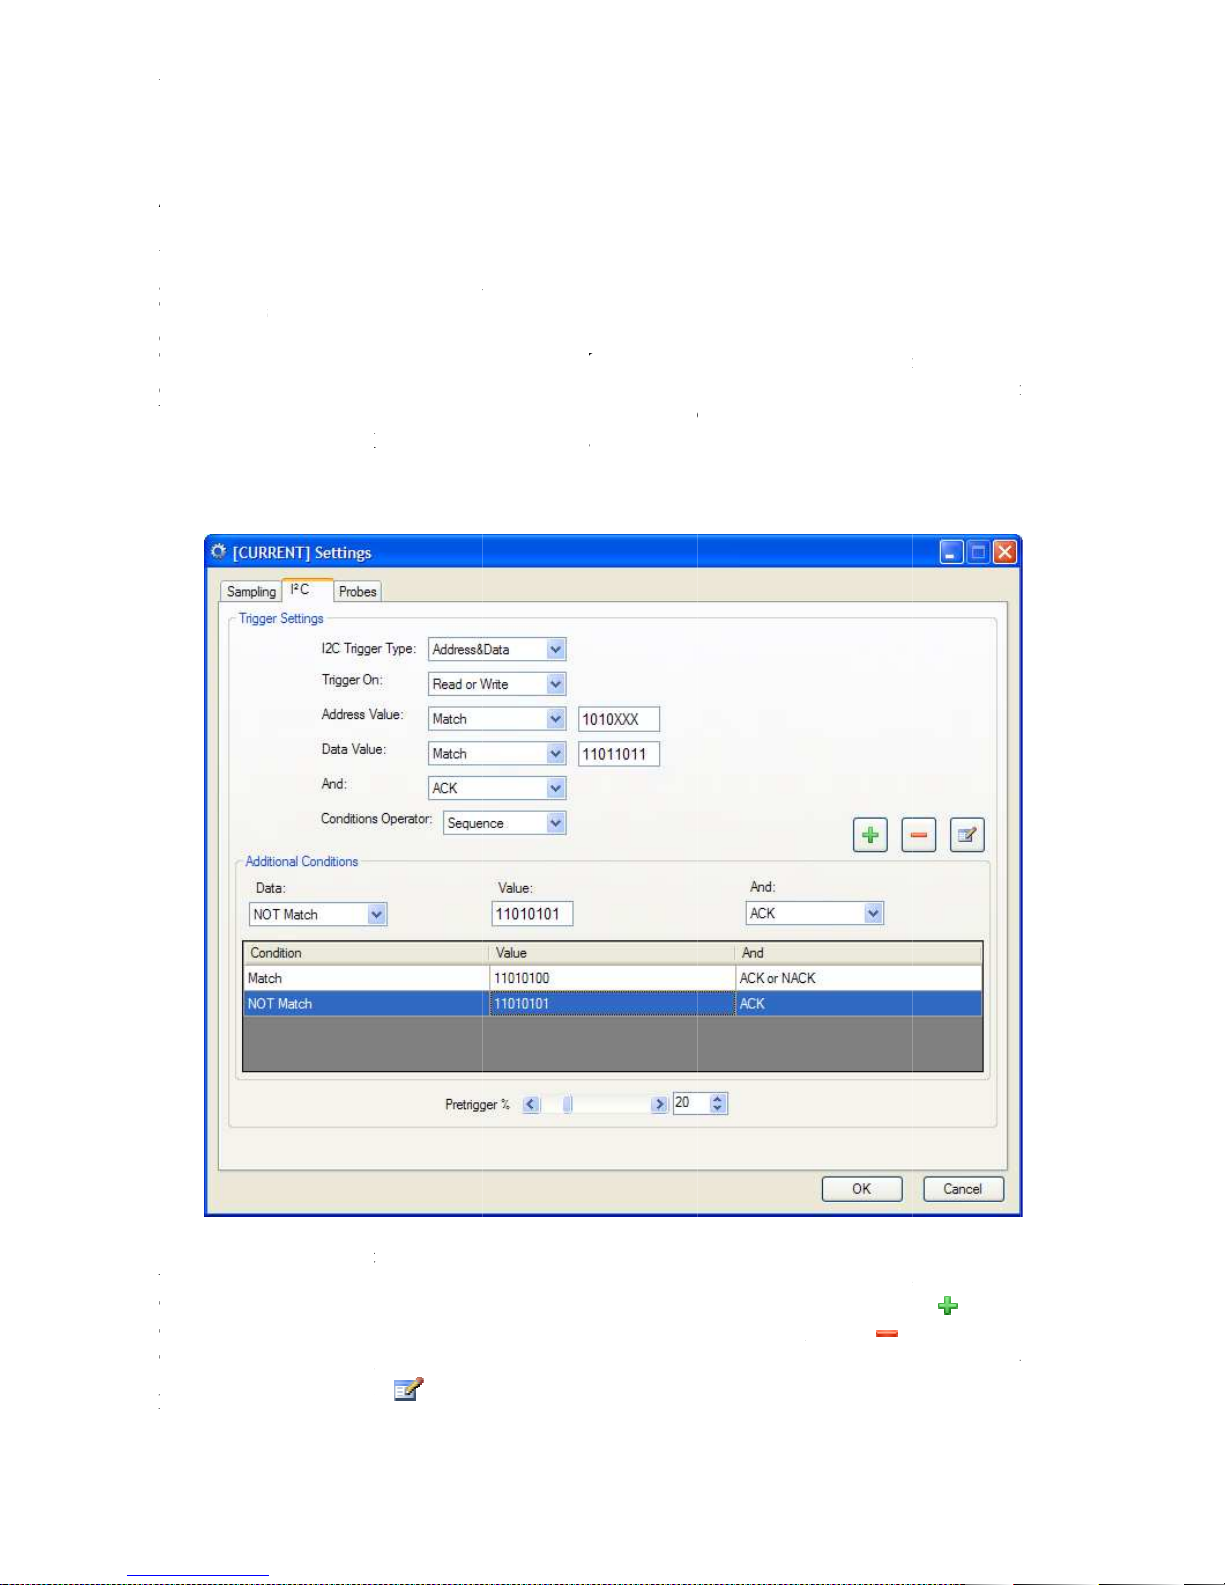
AT
Address&Data
When this option is selected, the AT
address followed by one or more data bytes.
The controls related to the address have the same meaning of t
described
To set the data, it is necessary to fill the
data byte to trigger
bus. Furthermore, with the
It is possible to add other
bottom side of the window. The controls have the same meaning of the ones just described.
To add a condition, fill the controls on the
To remove a condition, select the correspondent row in the table, then click on
To edit a condition, double click on the correspondent row in the table, modify the required
parameters, then click on
AT
-LA500 – U
SER MANUAL
Address&Data
When this option is selected, the AT
address followed by one or more data bytes.
The controls related to the address have the same meaning of t
described
To set the data, it is necessary to fill the
data byte to trigger
bus. Furthermore, with the
ACK or NACK
ACK
NACK
It is possible to add other
bottom side of the window. The controls have the same meaning of the ones just described.
To add a condition, fill the controls on the
To remove a condition, select the correspondent row in the table, then click on
To edit a condition, double click on the correspondent row in the table, modify the required
parameters, then click on
, and choose if this value should match or not match the one
: trigger on an acknowledged data;
: trigger on a not acknowledged data.
control, it is possible to choose between:
: the acknowledge bit is ignored;
conditions (up to 15) in the
to apply them.
LA500 triggers when a on the bus is detected the selected
Data Value
Additional Conditions
controls by writing the 8
Address
Additional Conditions
frame, then click on
trigger type case
bit binary value of the
detected on the
frame on the
•
•
•
-
he
.
on
And
just
-
data
.
.
Page 35

AT-LA500 – USER MANUAL
When more than one data condition are set, the Conditions Operator control is enabled, by which is
possible to choose between:
• Sequence: the AT-LA500 triggers when the address condition and all the entered data
conditions are verified in the specified order;
• OR: the AT-LA500 triggers when the address condition and at least one of the entered data
conditions are verified.
Pretrigger
The Pretrigger control on the bottom side allows specifying the position in which the trigger event
will be located with respect to the AT-LA500 memory. If the most meaningful data must be
sampled after the trigger detection, low pretrigger percentage must be selected. On the contrary, if
signal evolutions before trigger event must be analyzed, a high pretrigger percentage is more
suitable.
RELEASE 3.4 – JUNE 2009 35
Page 36
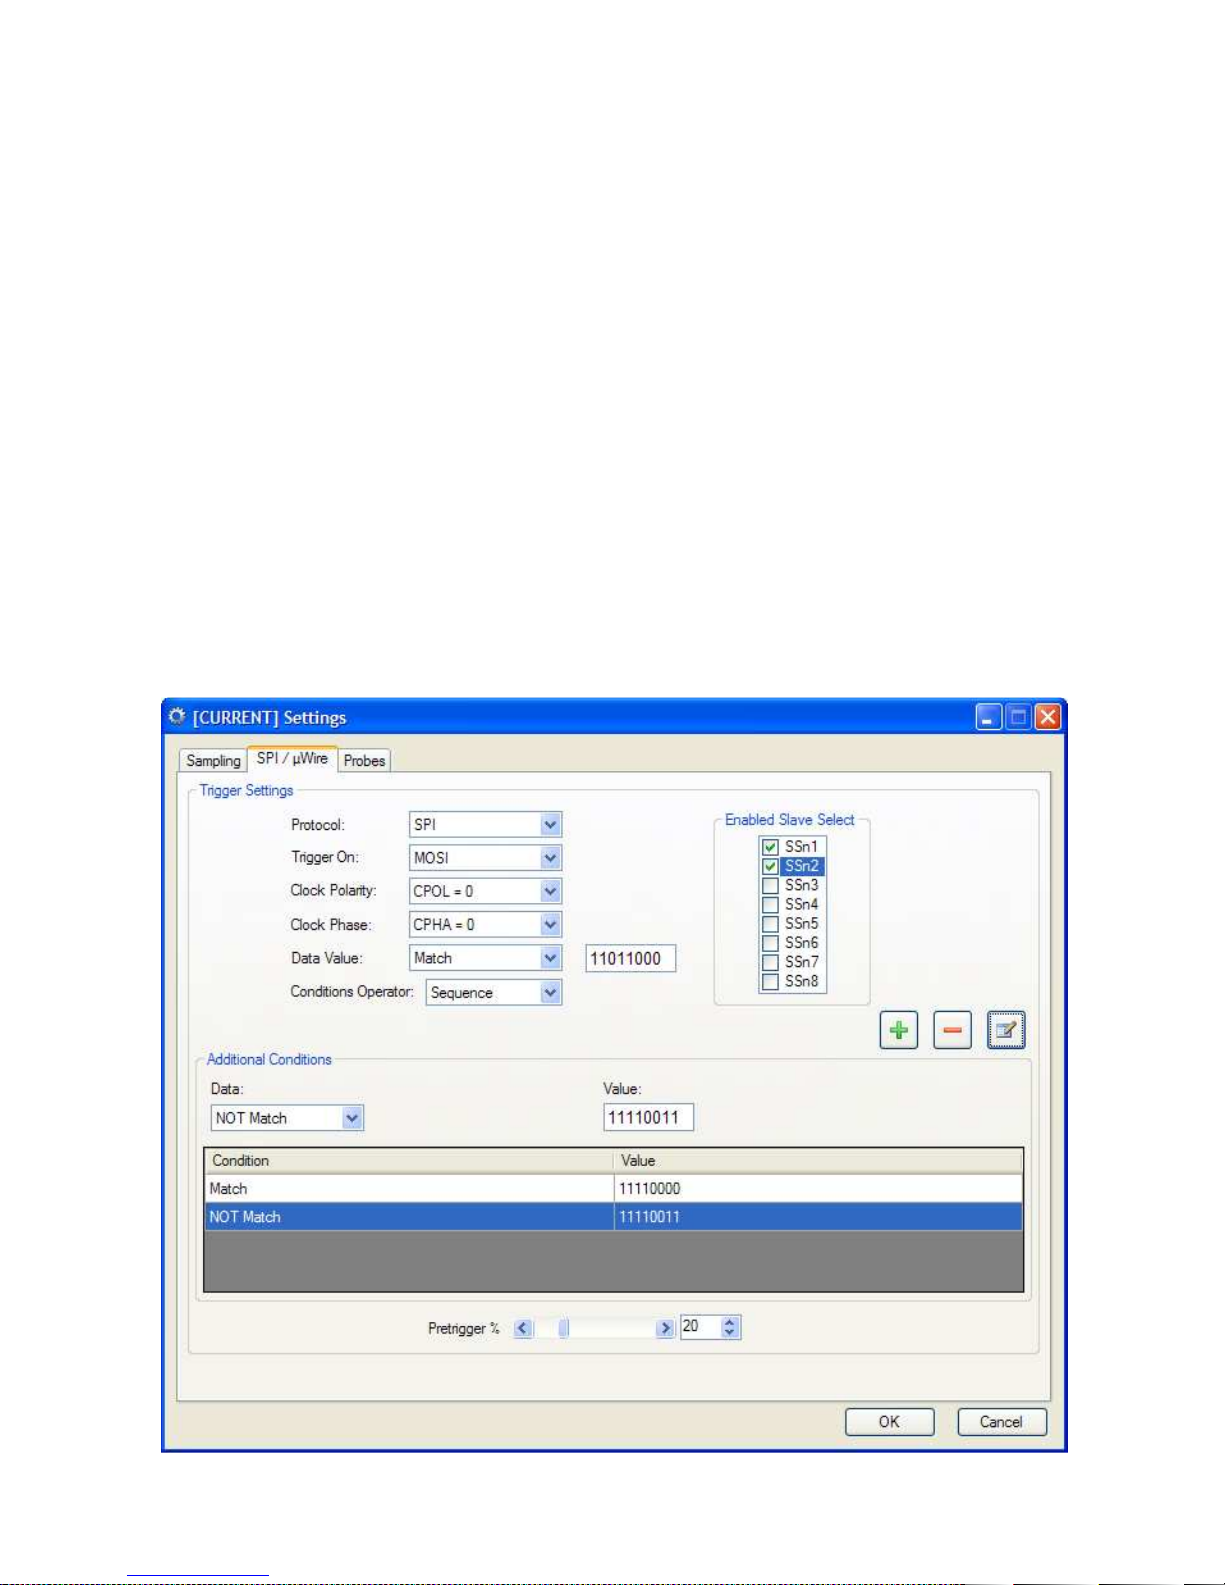
AT-LA500 – USER MANUAL
SPI/µWire Trigger
In this mode, the AT-LA500 can trigger when a selected event occurs on a SPI (Serial Peripheral
Interface) or µWire bus. The AT-LA500 can trigger on SPI operations addressing up to 8 different
peripherals by monitoring the related SSn (Slave Select) signals. Furthermore, the acquired data are
decoded and shown in the Waveform View and State Listing windows.
The Protocol control allows to select between SPI and µWire protocol. When the µWire protocol is
selected, some controls are disabled. The following description refers to the more general SPI
protocol trigger settings options.
To set up the AT-LA500 for a SPI acquisition, the following steps are required:
• Connect a probe to the pod A of the AT-LA500;
• Connect at least one grounded pin (white wires) to the ground of the board to test;
• Connect the Channel 0 (black wire) to the SCLK line of the SPI bus to test.
• Connect the Channel 1 (brown wire) to the MOSI line of the SPI bus to test;
• Connect the Channel 2 (red wire) to the MISO line of the SPI bus to test.
• Optionally, connect Channels 3 to 10 to the SSn lines of the SPI peripherals of the board
under test;
RELEASE 3.4 – JUNE 2009 36
Page 37

AT
SPI Trigger Options
The AT
Trigger On
SPI peripherals have 2 configuration bits to allow 4 working modes, depending on the clock
polarity (CPOL) and phase (CPHA). The four mode are:
The
Since every SPI peripheral has its own SSn enable signal, it is possible to connect these lines to the
channels 3 to 10 of the AT
detection. The
have to be enabled. For example, if the SSn1 and SSn2 box are checked, the AT
when the selected condition is verified on the SPI peripheral whose SSn signal is connected to
channel 3 or on the one whose SSn signal is connected to channel 4.
select, all these lines will be ignored.
To set the data
binary value of the data byte
or not match the one
It is possible to add other data
bottom side of the window. The controls have the same meaning of the ones just described.
To add a condition, fill the controls on the
To remove a condition, select the correspondent row in the table, then click on
To edit a condition, double click on the correspondent row in the table, modify the required
parameters, then click on
When more than one data condition
possible to choose between:
Pretrigger
The
will be located with respect to the
sampled after the trigger detection, low pretrigger percentage must be selected. On the contrary, if
signal evolutions before trigger event must be analyzed, a high pret
suitable.
AT
-LA500 – U
SER MANUAL
SPI Trigger Options
The AT
LA500 can trigger on SPI events occurring on the MOSI or on the MISO lines
Trigger On
control allows to s
SPI peripherals have 2 configuration bits to allow 4 working modes, depending on the clock
polarity (CPOL) and phase (CPHA). The four mode are:
Mode 0
Mode 1
Mode 2
Mode 3
The
Clock Polarity
Since every SPI peripheral has its own SSn enable signal, it is possible to connect these lines to the
channels 3 to 10 of the AT
detection. The
have to be enabled. For example, if the SSn1 and SSn2 box are checked, the AT
when the selected condition is verified on the SPI peripheral whose SSn signal is connected to
channel 3 or on the one whose SSn signal is connected to channel 4.
select, all these lines will be ignored.
To set the data
binary value of the data byte
or not match the one
It is possible to add other data
bottom side of the window. The controls have the same meaning of the ones just described.
To add a condition, fill the controls on the
To remove a condition, select the correspondent row in the table, then click on
To edit a condition, double click on the correspondent row in the table, modify the required
parameters, then click on
When more than one data condition
possible to choose between:
Sequence
conditions are verified in the specified
: the AT
conditions are verified.
Pretrigger
The
Pretrigger
will be located with respect to the
sampled after the trigger detection, low pretrigger percentage must be selected. On the contrary, if
signal evolutions before trigger event must be analyzed, a high pret
suitable.
control allows to s
: CPOL = 0; CPHA = 0;
: CPOL = 0; CPHA = 1;
: CPOL = 1; CPHA
: CPOL = 1; CPHA = 1;
and
Enabled Slave Select
gger on
detected on the bus.
: the AT
LA500 triggers when
on the bottom side
elect between these two options.
= 0;
Clock Phase
LA500 and
, it is necessary to fill the
leaving X on the don’t care bits
conditions (up to 15) in the
to apply them.
LA500 triggers when the address condition and all the entered data
= 0;
controls allows to select between these modes.
to select which ones should be evaluated during the trigger
frame lists all the SSn
Additional Conditions
set, the
order;
the address condition and at least one of the
allows specifying the position in which the trigger event
LA500
Data Value
Conditions Operator
memory. If
available signals. Check the ones that
controls by writing the 8
, and choose if this value should match
Additional Conditions
frame, then click on
control is enabled, by which is
most
LA500 will trigger
If none of the SSn boxes is
meaningful data must be
r percentage is more
. The
frame on the
entered data
-
•
•
•
•
to tri
-
-
-bit
,
.
.
•
• OR
control
are
-
-
AT-
the
rigge
Page 38
AT-LA500 – USER MANUAL
UART/RS232 Trigger
In this mode, the AT-LA500 can trigger when a selected event occurs on a UART (Universal
Asynchronous Receiver and Transmitter) bus. Furthermore, the acquired data are decoded and
shown in the Waveform View and State Listing windows.
To set up the AT-LA500 for an UART acquisition, the following steps are required:
• Connect a High-Z Probe to the pod A. In this case you also have to correctly set the threshold
voltage in the Probes tab of the Settings window;
• Connect at least one grounded pin (white wires) to the ground of the board to test;
• Connect the Channel 0 (black wire) to the RxD line of the UART bus to test;
• Connect the Channel 1 (brown wire) to the TxD line of the UART bus to test.
Note: It is not possible to use a Low-C Probe or a Passive Probe to analyze a RS232 bus: this could
prevent the system under test to work properly and damage the probes.
RELEASE 3.4 – JUNE 2009 38
Page 39

AT
UART Trigger Options
The AT
Trigger On
The
The
The
from 5 bits to 9 bits.
The
300, 600,
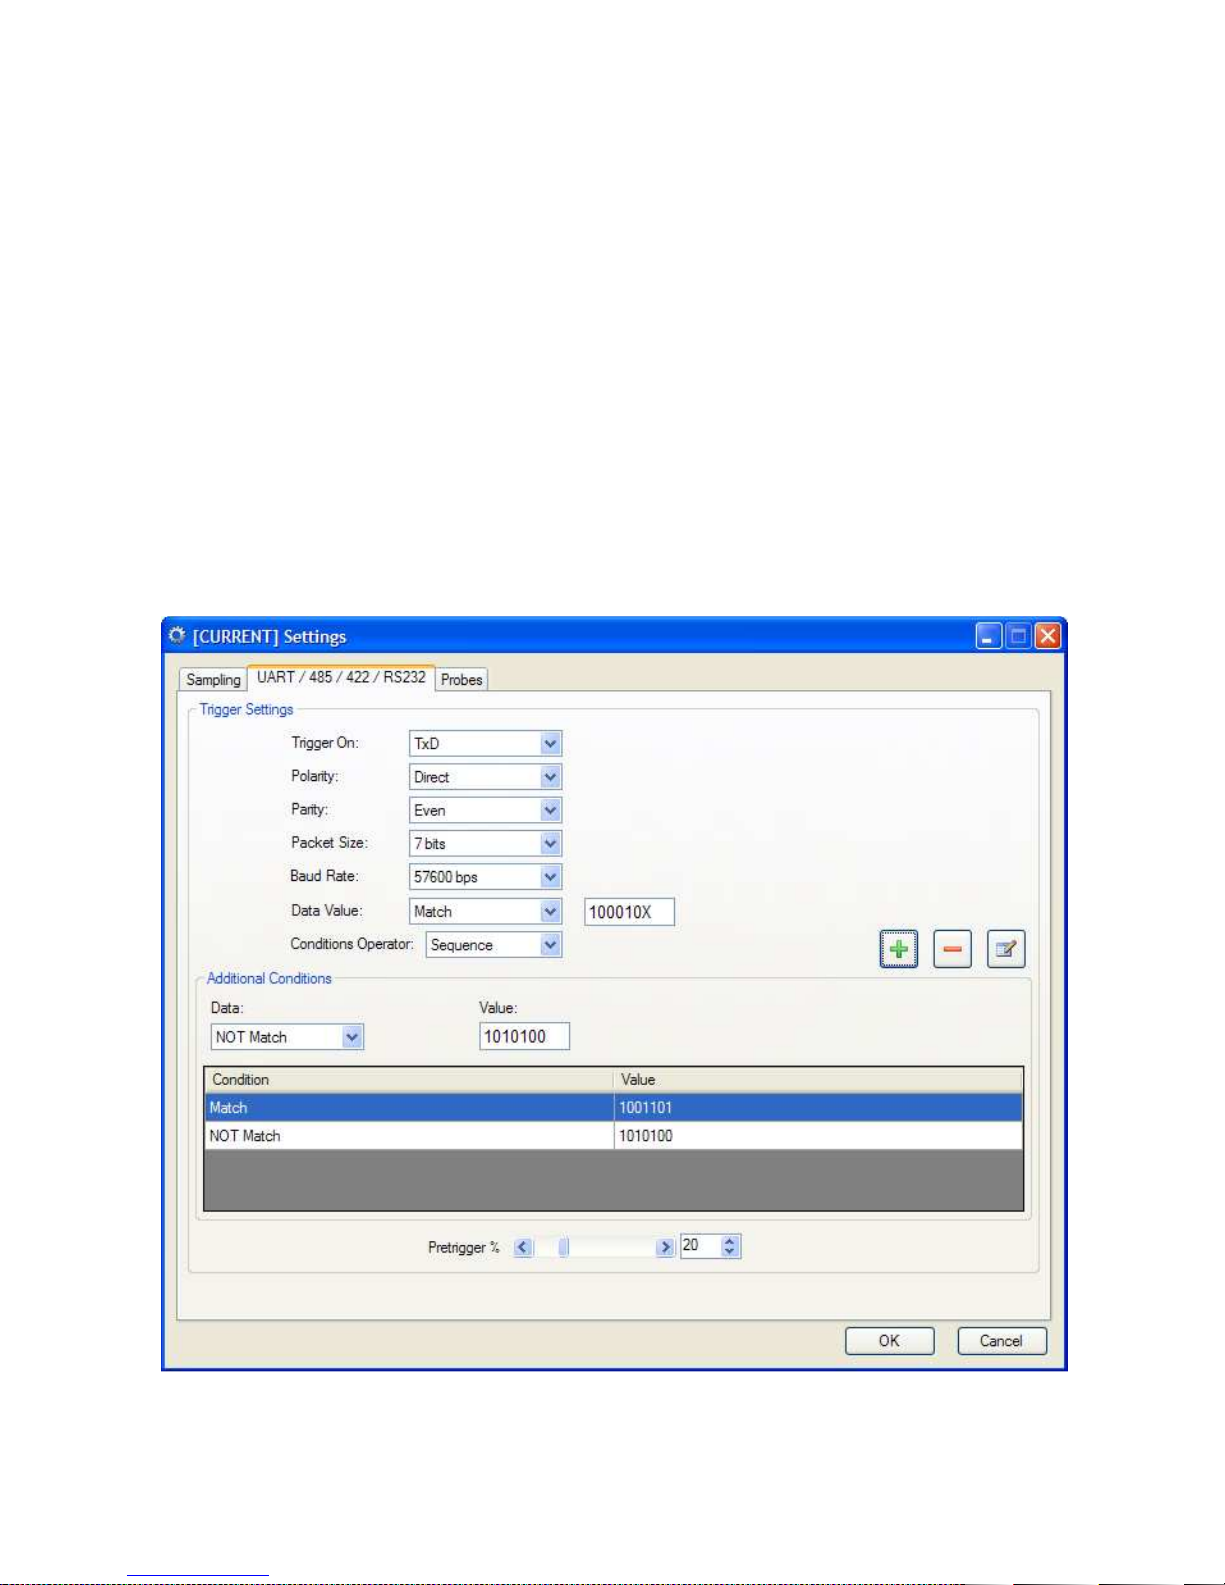
To set the data to trigger on, it is necessary to fill the
binary value of the data byte,
or not match the one detected on the bus.
It is possible to add other data conditions (up to 15) in the
bottom side of the window. The controls have the same meaning of the ones just d
To add a condition, fill the controls on the
To remove a condition, select the correspondent row in the table, then click on
To edit a condition, double click on the correspondent row in the table
parameters, then click on
When more than one data condition
possible to choose between:
Pretrigger
The
will be located with respect to the
sampled after the trigger detection, low pretrigger percentage must be selected. On the contrary, if
signal evolutions before
suitable.
AT
-LA500 – U
SER MANUAL
UART Trigger Options
The AT
LA500 can trigger on
Trigger On
control allows to select betwee
The
Polarity
The
control allows to choose the parity bit type to trigger on. The options are:
None
Don’t care
Even
Odd
Mark
Space
The
Packet Size
from 5 bits to 9 bits.
The
Baud Rate
300, 600,
1200, 2400, 4800, 9600, 19200, 38400, 57600, 76800, 115200, 128000 and 153600 bps.
To set the data to trigger on, it is necessary to fill the
binary value of the data byte,
or not match the one detected on the bus.
It is possible to add other data conditions (up to 15) in the
bottom side of the window. The controls have the same meaning of the ones just d
To add a condition, fill the controls on the
To remove a condition, select the correspondent row in the table, then click on
To edit a condition, double click on the correspondent row in the table
parameters, then click on
When more than one data condition
possible to choose between:
Sequence
conditions are verified in the specified
: the AT
conditions are verified.
Pretrigger
The
Pretrigger
will be located with respect to the
sampled after the trigger detection, low pretrigger percentage must be selected. On the contrary, if
signal evolutions before
suitable.
control allows to select betwee
control allows to select the polarity of the UART signal to analyze.
: use this option if the parity bit is not present in the
: the parity bit will be ignored during the trigger detection;
: trigger on data followed by even parity bit;
: trigger on data followed by odd parity bit;
: trigger on data followed by a mark bit;
on data
control selects the number of data bits for every transfer on the bus. The range is
control re
: the AT
LA500 triggers when
on the bottom side
UART
followed by a space bit.
presents the data rate of the UART bus. The available values are 75, 150,
leaving X on the don’t care bits,
to apply them.
LA500 triggers when the address condition and
trigger event must be analyzed, a high pret
events occurring on the
n these two options.
Additional Conditions
set, the
order;
the address condition and at least one of the
allows specifying
LA500
Data Value
Conditions Operator
memory. If
RxD
protocol;
controls by writing the
nd choose if this value should match
Additional Conditions
frame, then click on
control is enabled, by which is
the position in which the trigger event
the most
or on the
escribed.
, modify the required
all the entered data
meaningful data must be
r percentage is more
lines. The
5 to 9
frame on the
entered data
-
Parity
•
•
•
•
•
•
: trigger
TxD
•
• OR
control
a
bit
.
.
are
-
-
AT-
rigge
Page 40
AT-LA500 – USER MANUAL
Probes
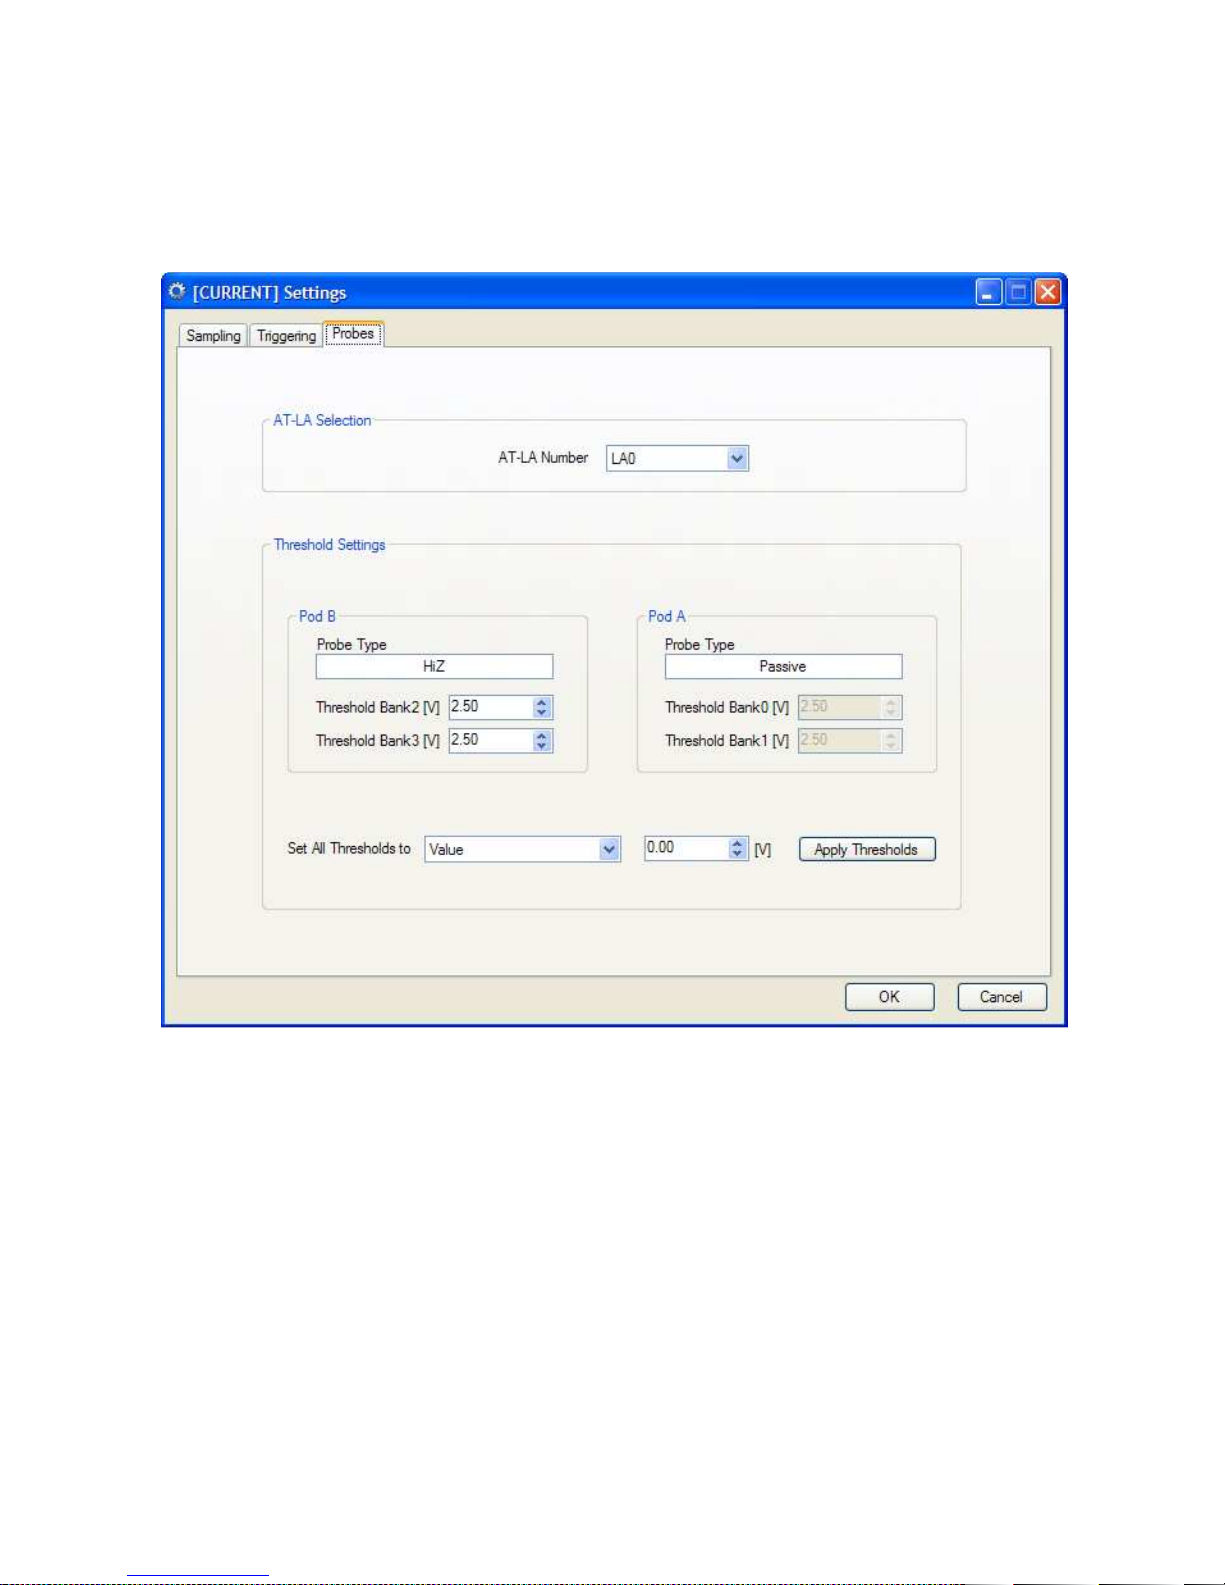
This tab allows setting the threshold levels for each bank (only for probes supporting this option).
If more than one AT-LA500 are connected used, the AT-LA Number menu ring allows to select the
instrument to set.
The threshold for each bank can be set manually by writing its value in V in the corresponding
control. Depending on the probe type, the threshold voltage must be confined in a range
automatically set by AT-LA500 when the probe is plugged-in.
Furthermore it is possible to set all thresholds to the same value by entering the selected value in the
Set All Thresholds to control and by clicking on Apply Thresholds.
In addition, for sake of simplicity, some threshold voltages are already available for the mostly used
logic families in the Set All Thresholds to menu ring:
• TTL (1.5V)
• CMOS (2.5V)
RELEASE 3.4 – JUNE 2009 40
Page 41

AT-LA500 – USER MANUAL
• ECL (-1.3V)
• PECL (3.7V)
• LVPECL (2V)
• LVCMOS 1,5 (750mV)
• LVCMOS 1,8 (900mV)
• LVCMOS 2,5 (1.25V)
• LVCMOS 3,3 (1.65V)
• LVDS (100mV)
The appropriate value can be selected by means of the Threshold Presets menu ring and then the Set
all key must be pressed.
Note: If an active probe is not connected to a Pod, it is not possible to set a specific threshold
voltage for the corresponding banks.
RELEASE 3.4 – JUNE 2009 41
Page 42
AT
Data Acquisition
Channel Status
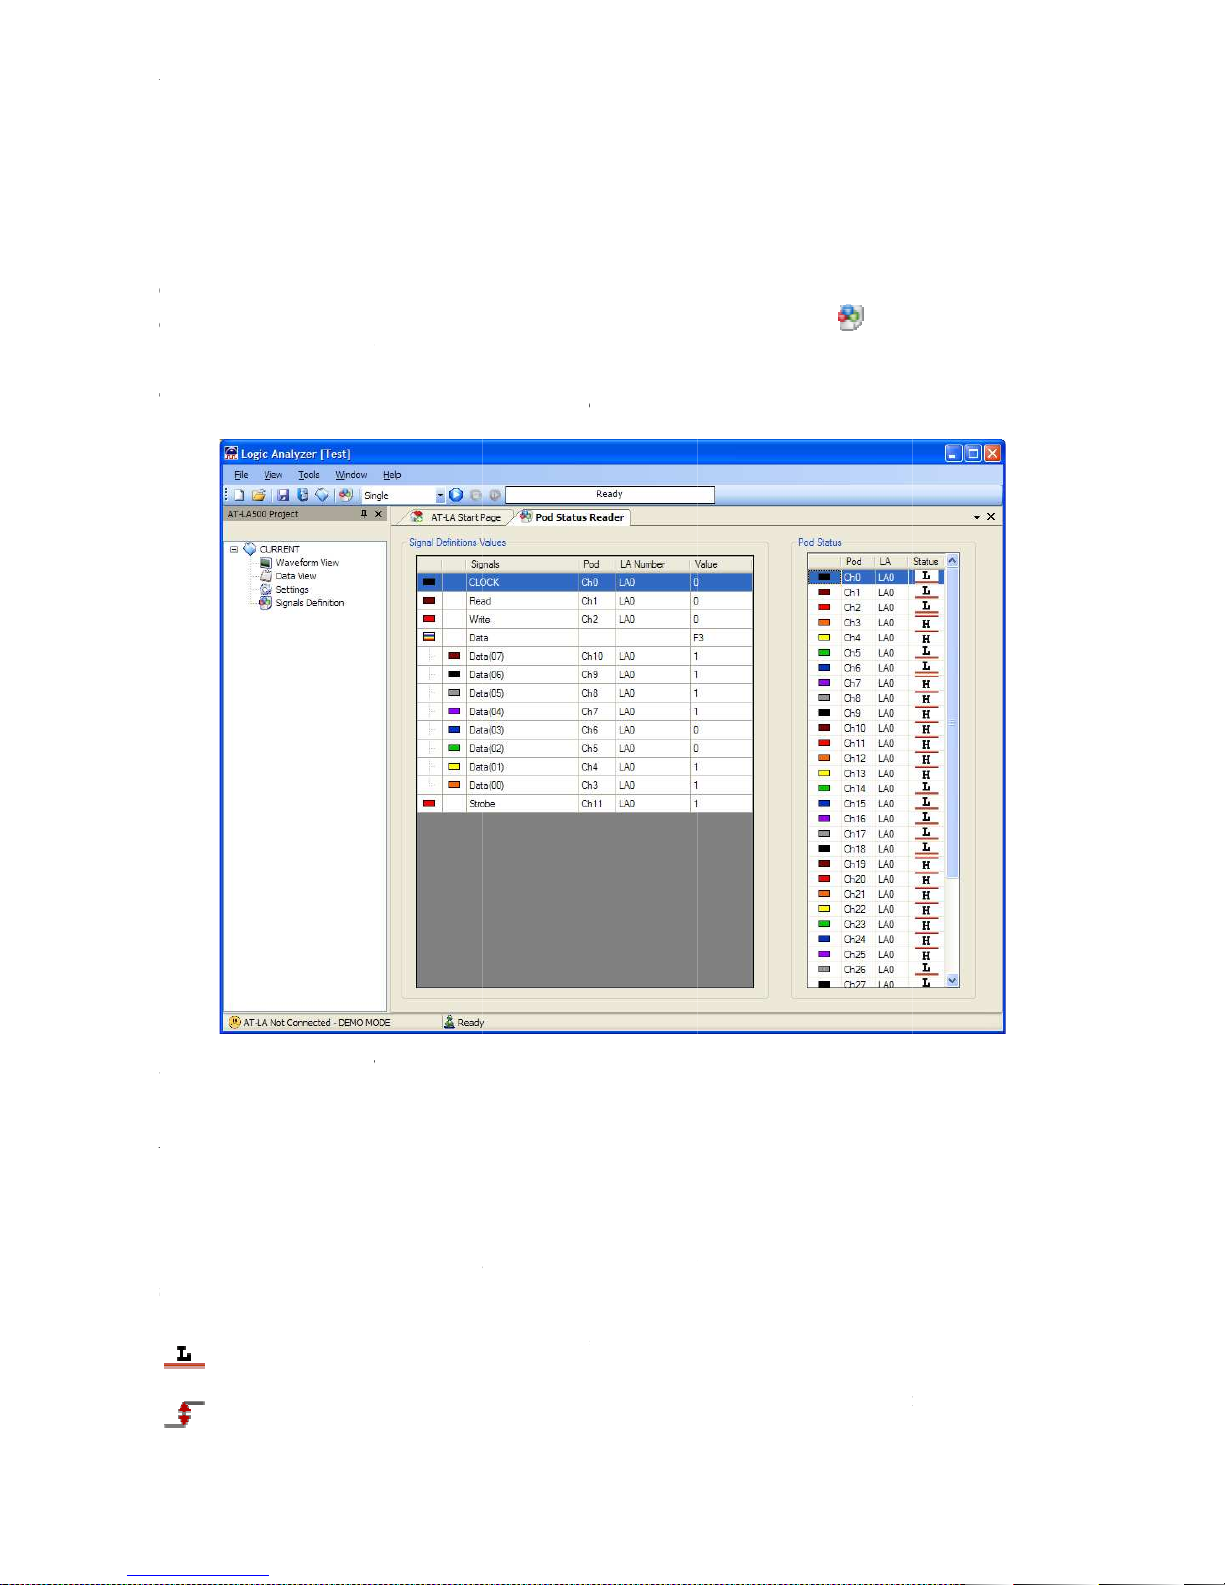
Once one or more probes have been connected to the system u
can be examined in real time. This feature is activated by clicking on the
from the
The opened panel is formed by two tab
Signal Definition Values
If signals have been associated to the
tab
bus are represent
Pod Status
In the
symbols:
AT
-LA500 – U
SER MANUAL
Data Acquisition
Channel Status
Once one or more probes have been connected to the system u
can be examined in real time. This feature is activated by clicking on the
from the
Tools
The opened panel is formed by two tab
Signal Definition Values
If signals have been associated to the
tab
This option is useful, for instance, to detect the values of b
bus are represent
Pod Status
In the
Pod Status
symbols:
It indicates that a voltage below the threshold value is present on the corresponding
channel;
It indicates
edge);
Pod Status…
ed with its own value.
frame
that a commutation is present on the corresponding channel (rising or falling
the status of each
Signal Definitions Value
channels
channel
, they will be represented in the
is represented in real time by means of three
, the logic level of each input
and
us signals, since every signal and
key in the
Status
Signal Definition
tool bar
menu,
nder test
command.
or
les:
s
Pod
le.
Page 43
AT
Start a data acquisition
Once
button
The
Note
or they m
If the trigger event does not occur, it can
data
If the sampling frequency is very low or if an external clock is used whose
longer verified, data acquisition may stop
Memories
Stopping the acquisition
Data acquisition may be stopped at any time by
If the
terminated.
If the
filling), data already acquired will be transferred to the PC for their visualization and/or storage.
Tips
Some tips allow improving data acquisition:
AT
-LA500 – U
SER MANUAL
It indicates that a voltage above the threshold value is present on the corresponding channel.
Start a data acquisition
Once
LA500
button
of the
The
status box on the tool bar shows
•
• Waiting for trigger at Level
• Waiting for
• Waiting for Serial Protocol Trigger
• Trigger Detected
• Reading
• Acquisition Data R
Note
f the sampling frequency is extremely high, these messages may appear only for few instants
or they m
y even not appear.
If the trigger event does not occur, it can
data acquisition.
If the sampling frequency is very low or if an external clock is used whose
longer verified, data acquisition may stop
Memories
may remains visualized for a long time.
Stopping the acquisition
Data acquisition may be stopped at any time by
If the
terminated.
If the
button
filling), data already acquired will be transferred to the PC for their visualization and/or storage.
Tips
for a good acquisition
Some tips allow improving data acquisition:
lectrical contact
has been set correctly, data acqu
External Trigger
Acquisition Data
is pressed before a trigger event occurred, data acquisition is automatical
is pressed after a trigger event occurred (for instance to abort a too slow memory
Filling Memories
must be checked when connecting probes
the acquisition status.
The project has been loaded and the AT
ready to acquire;
AT
AT
(AT
AT
selected serial protocol;
AT
data;
Data acquisition is terminated and data are
transferring to the PC;
Data acquisition is terminated and data have been
transferred to the PC.
forced manually by clicking on the
or i
isition can be starte
The possible options are:
LA500 is waiting for the trigger event at Level
LA500 is waiting for an external trigger event
card is needed);
LA500 is waiting for a
LA500 detected a trigger event and it is sampling
t can proceed very slowly and
button
by clicking on the
trigger event on the
trigger
the
LA500 is
during
condition is no
Filling
AT-
Ready
: I
a
tool bar.
-
eady
d
-
n
-
-
-scope
-
n;
-
• E
button
be
button
message
clicking on
the
.
ly
s
;
Page 44

AT-LA500 – USER MANUAL
• Connect as many grounds as possible to the system under test. All grounds are connected
together, therefore it is important to check all ground connections to avoid short circuits;
• Once probes have been connected, check the input status on the Channels Status window to
verify that the visualized behavior corresponds to the expected one;
• When active probes are used, set the threshold level to a value suitable to the signal nature;
• If data acquisition is performed in the State Analysis mode, it is convenient to use active
probes for signal clocks. In this case a correct setting of threshold values allows using the
clock signal with the correct duty-cycle. Signal clocks, furthermore, must be (if possible...)
not affected by noise or disturbs that may activate erroneous acquisitions. Depending on
clock signal frequencies, it could be necessary to invert the trigger setting on edge
conditions to get a better acquisition;
• If data acquisition is performed in the Timing Analysis mode or in the serial protocol
analysis, select the most suitable sampling frequency. If the sampling frequency is too low,
acquired data may be not coherent, while a too high frequency can evidence spikes or
propagation delays, furthermore reducing the useful acquisition time window.
RELEASE 3.4 – JUNE 2009 44
Page 45

AT-LA500 – USER MANUAL
Data Visualization
Two different window types are available to visualize the acquired data: Waveform View and State
Listing. It is also possible to visualize digital signals and analog data (acquired by an external
device) together. This feature is called Mixed Signal Display Mode.
Mixed Signal Display Mode
The Mixed Signal Display Mode allows the user to visualize digital and analog data in the same
window. To acquire Analog data the AT-LA500 software can be installed on a PC based
oscilloscope connected to the AT-LA500 by means of the TriggerIN and TriggerOUT rear
connectors (use 1m length BNC cable) and the USB 2.0 connection.
The AT-LA500 TriggerIN input must be connected to the oscilloscope TriggerOUT, and the ATLA500 TriggerOUT output to the oscilloscope TriggerIN.
The Mixed Signal Display Mode is available for Normal Timing and Serial Protocol Analysis
acquisition modes. In Normal Timing mode, the AT-LA500 can send/ receive the Trigger pulse
to/from the oscilloscope. For Protocol Analysis AT-LA500 can only send the trigger pulse to the
oscilloscope through the TriggerOUT output.
If the AT-LA500 is set to receive the Trigger pulse from the oscilloscope, the Trigger condition
must be set manually, if AT-LA500 is the Trigger master, the oscilloscope settings will be set by
the AT-LA500 software automatically.
Note: The analog data visualized on the Waveform View are the same shown by the oscilloscope.
Thus, only the channels of the oscilloscope that are turned on will be visualized in the Waveform
View.
The names associated with the analog data are Analog Ch0, Analog Ch1, Analog Ch2, Analog Ch3.
The analog data properties can be changed as for any digital data.
Analog-Digital Delay Alignement window
To open the Analog-Digital Delay Alignement window, click on the Analog Delay item of the
Tools menu on the menu bar.
The Analog Samples Delay(ns) box allows to change (if it’s necessary), the delay between digital
and analog signals, to obtain the correct alignement. For example, if in the Waveform Window,
analog and digital signals are affected by a delay of 3ns, Analog Samples Delay(ns) value must be
changed by 3ns.
RELEASE 3.4 – JUNE 2009 45
Page 46
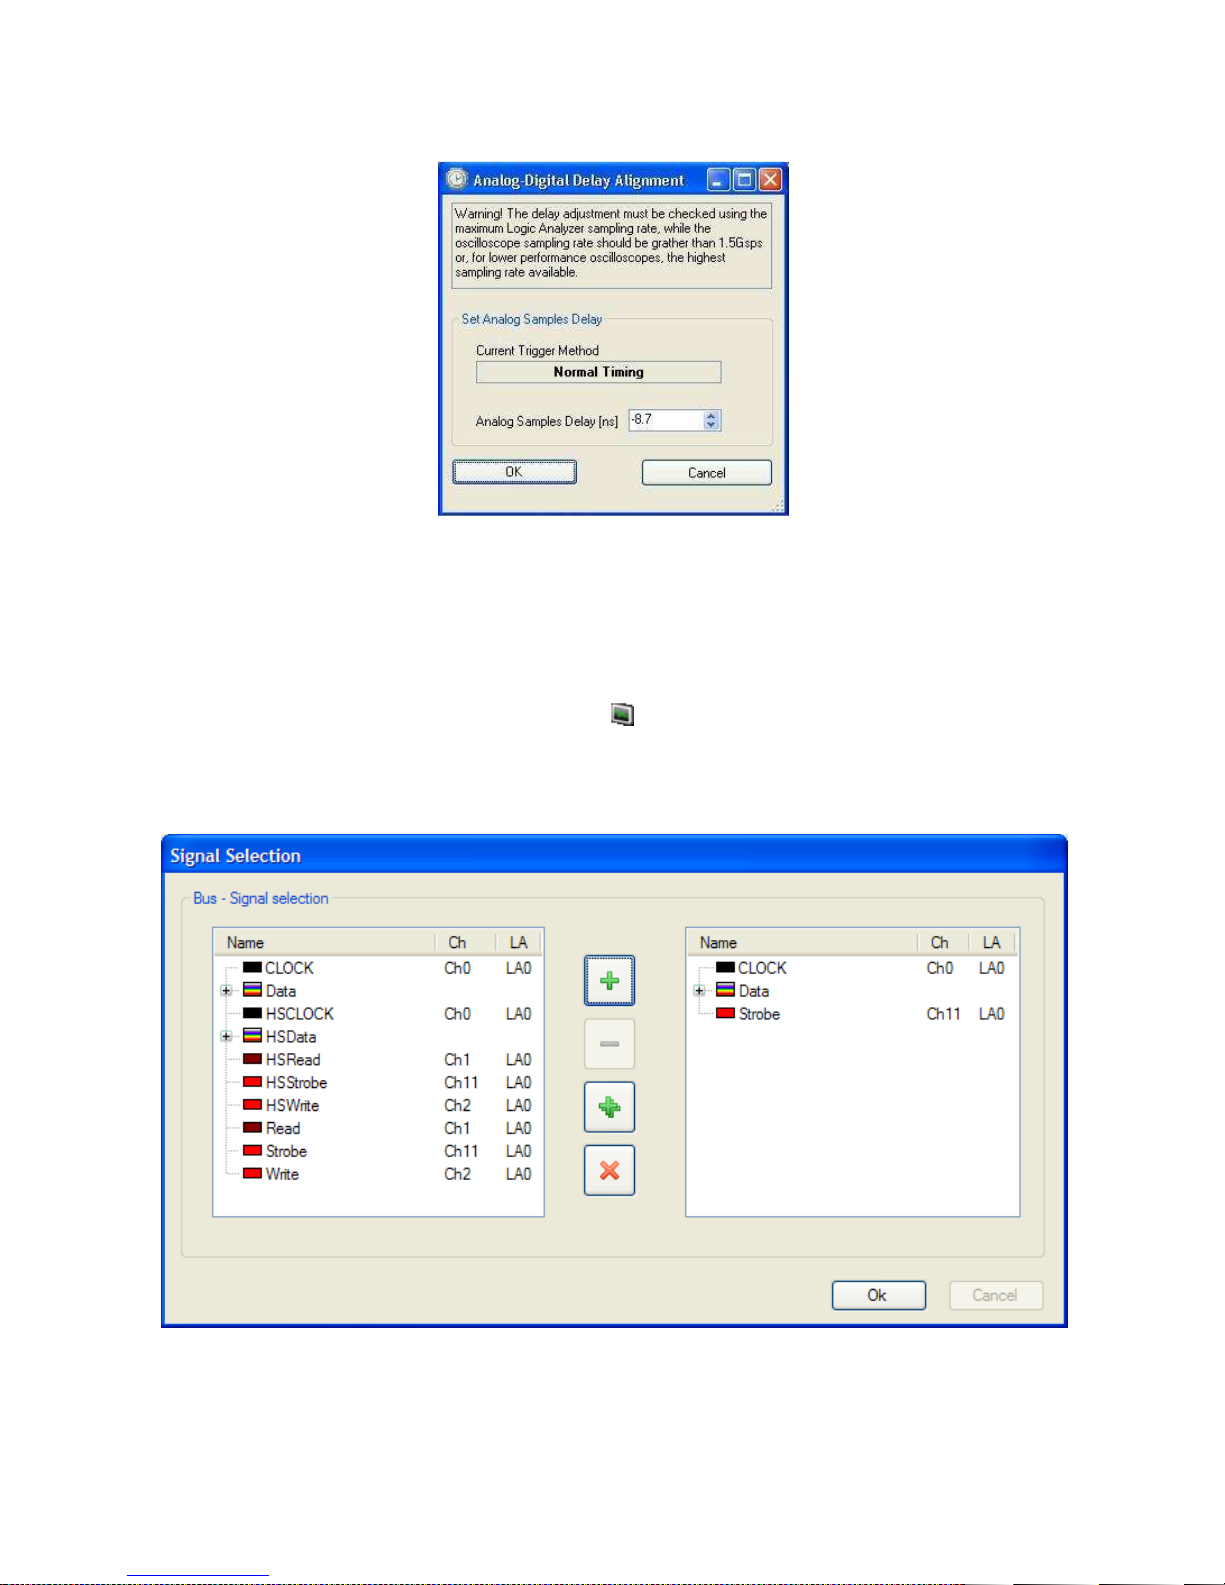
AT-LA500 – USER MANUAL
Waveform View
Create a Waveform View window
To open the Waveform view, double click on the icon in the Solution Explorer.
When a new acquisition is complete, and the Waveform View window is not yet open, a Signal
Selection window will appear to select which signals or groups of signals among those that have
been acquired are to be visualized, then the Waveform View window will be shown.
Note: The High Speed signals acquired will appear with the user defined name and the “HS”
prefix. Analog data will not be shown in this list: they will be automatically added to the Waveform
View.
RELEASE 3.4 – JUNE 2009 46
Page 47
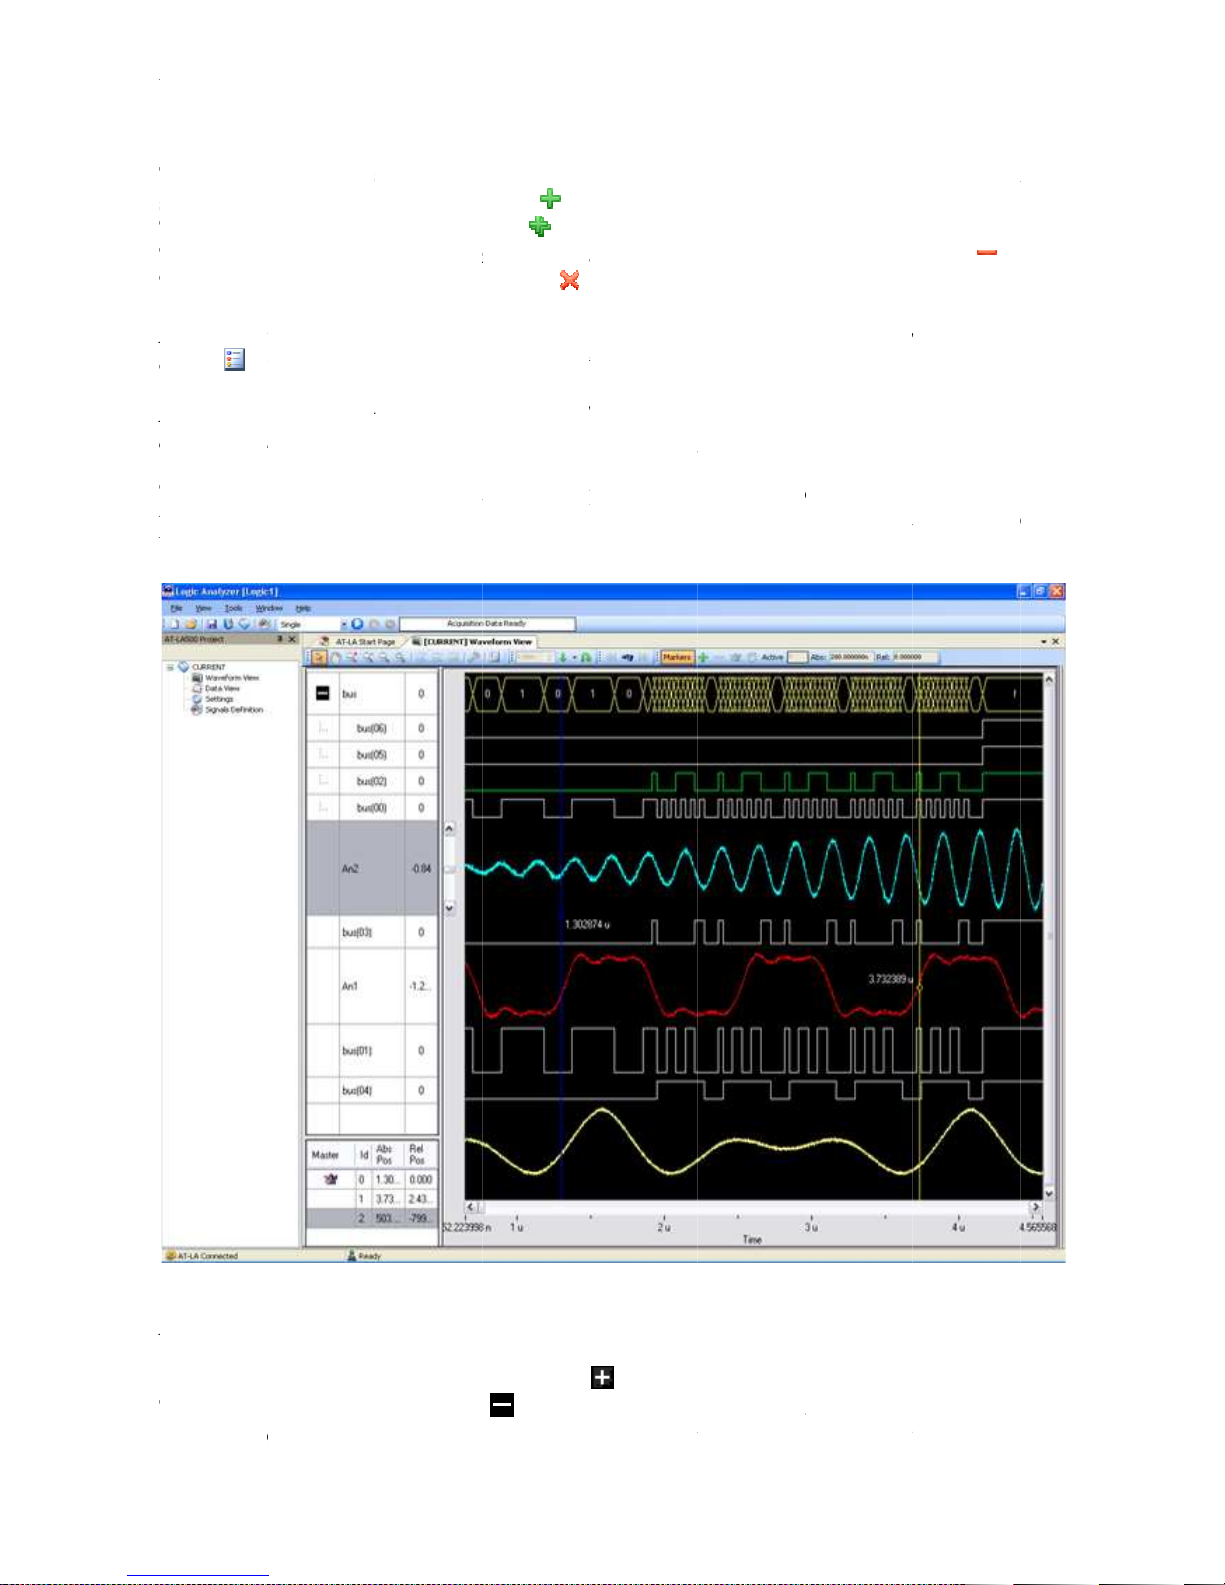
AT
To add a signal or a bus to the list of the ones that will be shown in the
select it on the left side table and click on
To add all signals at a time
To remove a signal from the visualization list, select it on the right side table and click on
To remove all signal at a time, just click on
Note
on the
Note
automatically
The Waveform Window allows analyzing acquired data in a graph containing digital
waveforms.
b
Note
In the Waveform View,
The icon of an opened bus becomes
It is possible to drag and drop the waveforms and change their order, to help the user to focus the
time relationship between edges. To do this, click on a signal name and drag it in the new position.
AT
-LA500 – U
SER MANUAL
To add a signal or a bus to the list of the ones that will be shown in the
select it on the left side table and click on
To add all signals at a time
To remove a signal from the visualization list, select it on the right side table and click on
To remove all signal at a time, just click on
Note
Signals
on the
icon in the Waveform View window toolbar
Note
hen the trigger is set on a serial protocol mode, the signal protocol names are
automatically
The Waveform Window allows analyzing acquired data in a graph containing digital
waveforms.
b
Note
Waveform
In the Waveform View,
The icon of an opened bus becomes
It is possible to drag and drop the waveforms and change their order, to help the user to focus the
time relationship between edges. To do this, click on a signal name and drag it in the new position.
can be added in
shown. They can’t be removed from the Waveform View window.
Single signals are visualized as digital signals, while grouped signals are represented as
View w
, just click on
(removed from) the Waveform View
can be opened only a
indicated by a
. Double click on it to
fter the first data acquisition
icon on the left.
window at any time
Double click on it to open a bus.
close a bus.
rm View
window,
by clicking
and analog
:
: W
uses.
Wavefo
.
.
.
.
.
:
indow
a bus is
.
Page 48

AT
In the same way, it is also possible to in
from it.
To resize the signals amplitude, just drag the line between signals name
On the right of every signal or bus name, a number indicates the value that this signal or bus
assumes at the time
Cursors
By clicking with the right mouse button on the signal name column, a shortcut menu will appear
with these options:
Zoom
To
instruments, placed on the upper side toolbar:
AT
-LA500 – U
SER MANUAL
In the same way, it is also possible to in
from it.
To resize the signals amplitude, just drag the line between signals name
On the right of every signal or bus name, a number indicates the value that this signal or bus
assumes at the time
Cursors
chapter).
By clicking with the right mouse button on the signal name column, a shortcut menu will appear
with these options:
• Add samples scale
Remove samples scale
• Analog mode display
•
-
Waveform View Settings
MSB on top
LSB on top
Zoom
To
move along the waveforms and to zoom, the Waveform View window provides many
instruments, placed on the upper side toolbar:
position of the master cursor (the cursors properties are described in the
Remove signals
Select
series of interval that represents the number of samples.
Select this option to remove the selected sample scale.
This option (available only for the buses) will represent a b
as an analog
or a DAC has to be tested.
This option allow
View.
Select this option to open the
window (see
This option (available only for the buses) will represent a bus
with the most significative
This option (available only for the buses) will represent a bus
with the less significative signal displayed as first;
Selection tool
tool.
Click and drag to move it.
Zoom In auto. Click to zoom in.
Zoom Out au
Zoom Manual. Select this tool to manually select the
area to zoom. Click in the
View and drag the cursor to the end point keeping the
left mouse button pressed.
Zoom All. Click to fit the visualization to view all the
acquisition time.
Analog Zoom in. Click to zoom in the selected analog
waveform (if
Analog Zoom out. Click to zoom out the selected
analog waveform (if present)
Analog Autoscale. Click to fit the selected analog
waveform amplitude in the
sert a signal into a
Select
this option to a
series of interval that represents the number of samples.
Select this option to remove the selected sample scale.
This option (available only for the buses) will represent a b
as an analog
or a DAC has to be tested.
This option allow
View.
Select this option to open the
window (see
This option (available only for the buses) will represent a bus
with the most significative
This option (available only for the buses) will represent a bus
with the less significative signal displayed as first;
Use the hand tool to
o. Click to zoom out.
present)
dd a signal, i
waveform. This is useful for example if an ADC
to add or remove signals to the Waveform
Graph Property
pan the acquisition.
start point of the Waveform
opened bus
n
The Waveform View Settings
chapter for details)
signal displayed as first;
to extract a waveform
dicated by a
, with a
•
Add
•
•
•
n
or
.
icon
us
s
Hand
t
Page 49
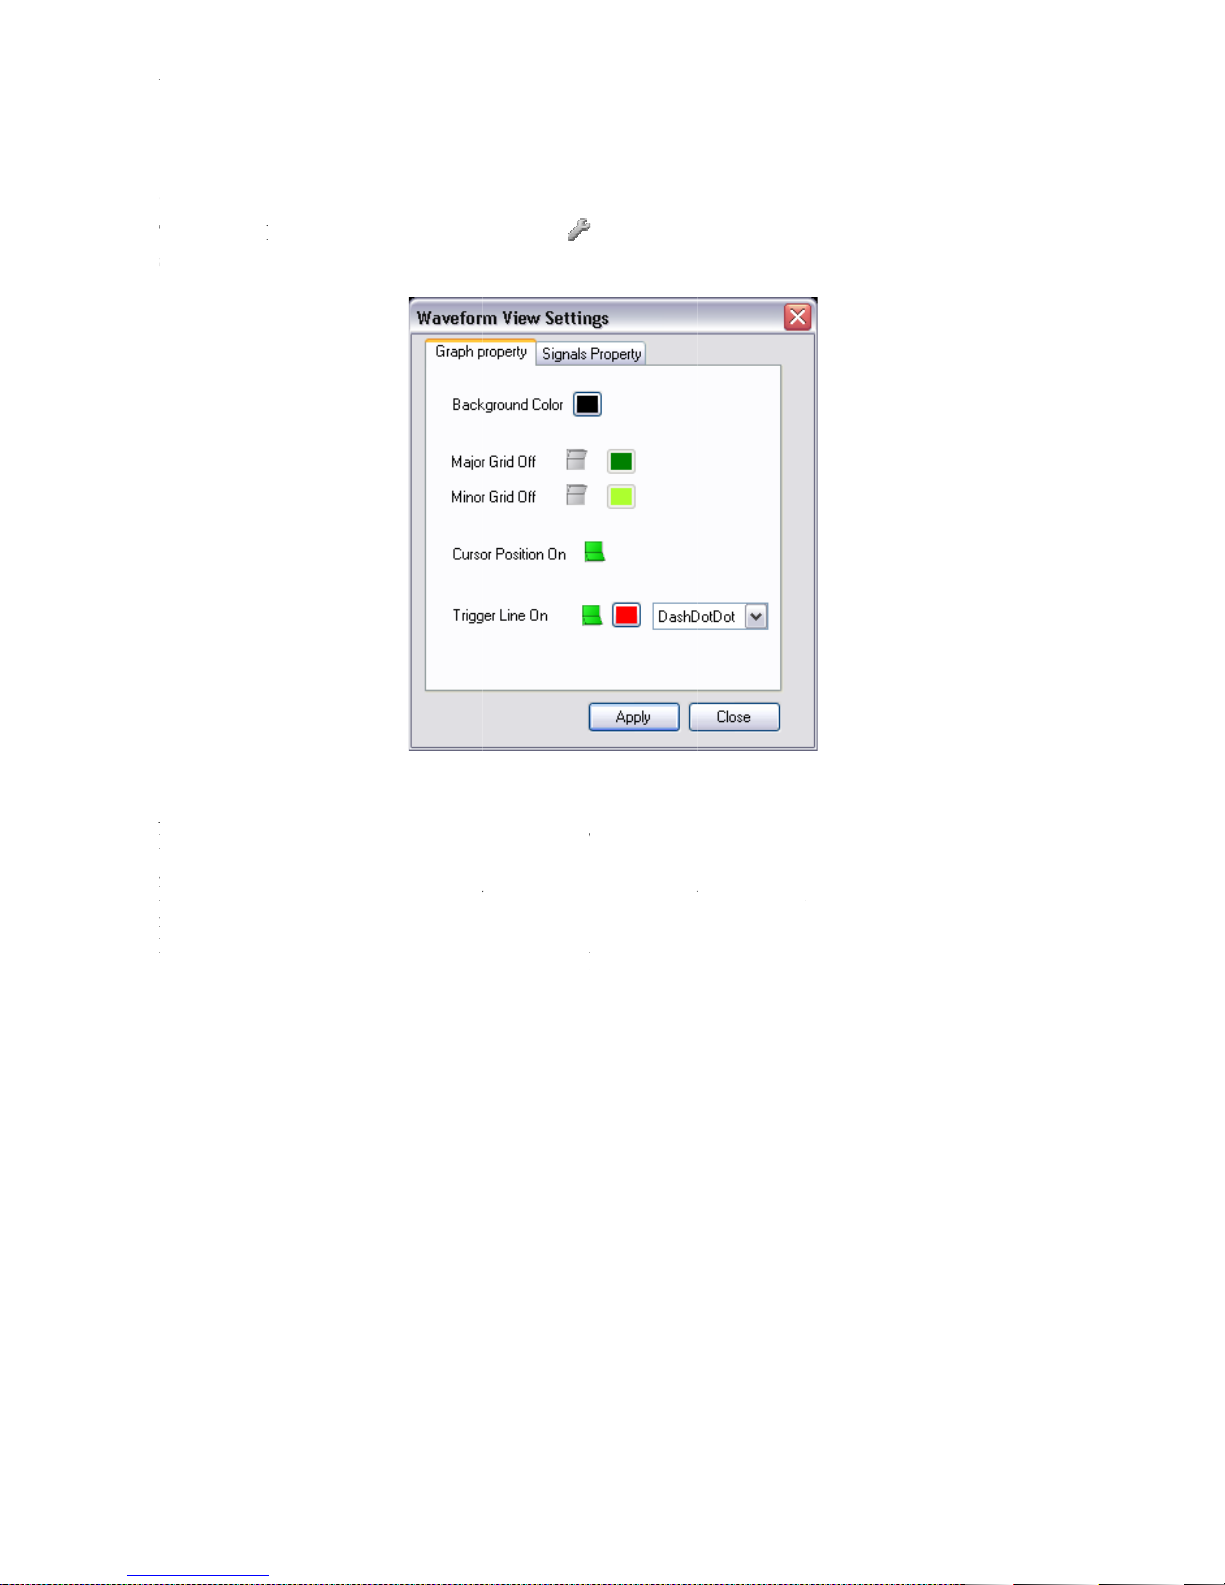
AT
Graph Property
To change the graph properties, click on the
shown.
In the
Background Color
By clicking the
grids and to choose their colors.
By clicking the
near the cursors.
By clicking the
trigger position: it is possible also to select the line color and the linr style.
AT
-LA500 – U
SER MANUAL
Graph Property
To change the graph properties, click on the
shown.
In the
Graph property
Background Color
By clicking the
grids and to choose their colors.
By clicking the
near the cursors.
By clicking the
trigger position: it is possible also to select the line color and the linr style.
tab it is possible to change the graph background color by clicking on the
Major Grid
P
Trigger Line
and the
switch it is possible to show or hide the cursor position indication
switch it is possib
Minor Grid
le to show or hide a line that always identify the
. The Waveform Vi
switches it is possible to show or hide the vertical
ew Settings window will be
icon
box.
Cursor
osition
Page 50
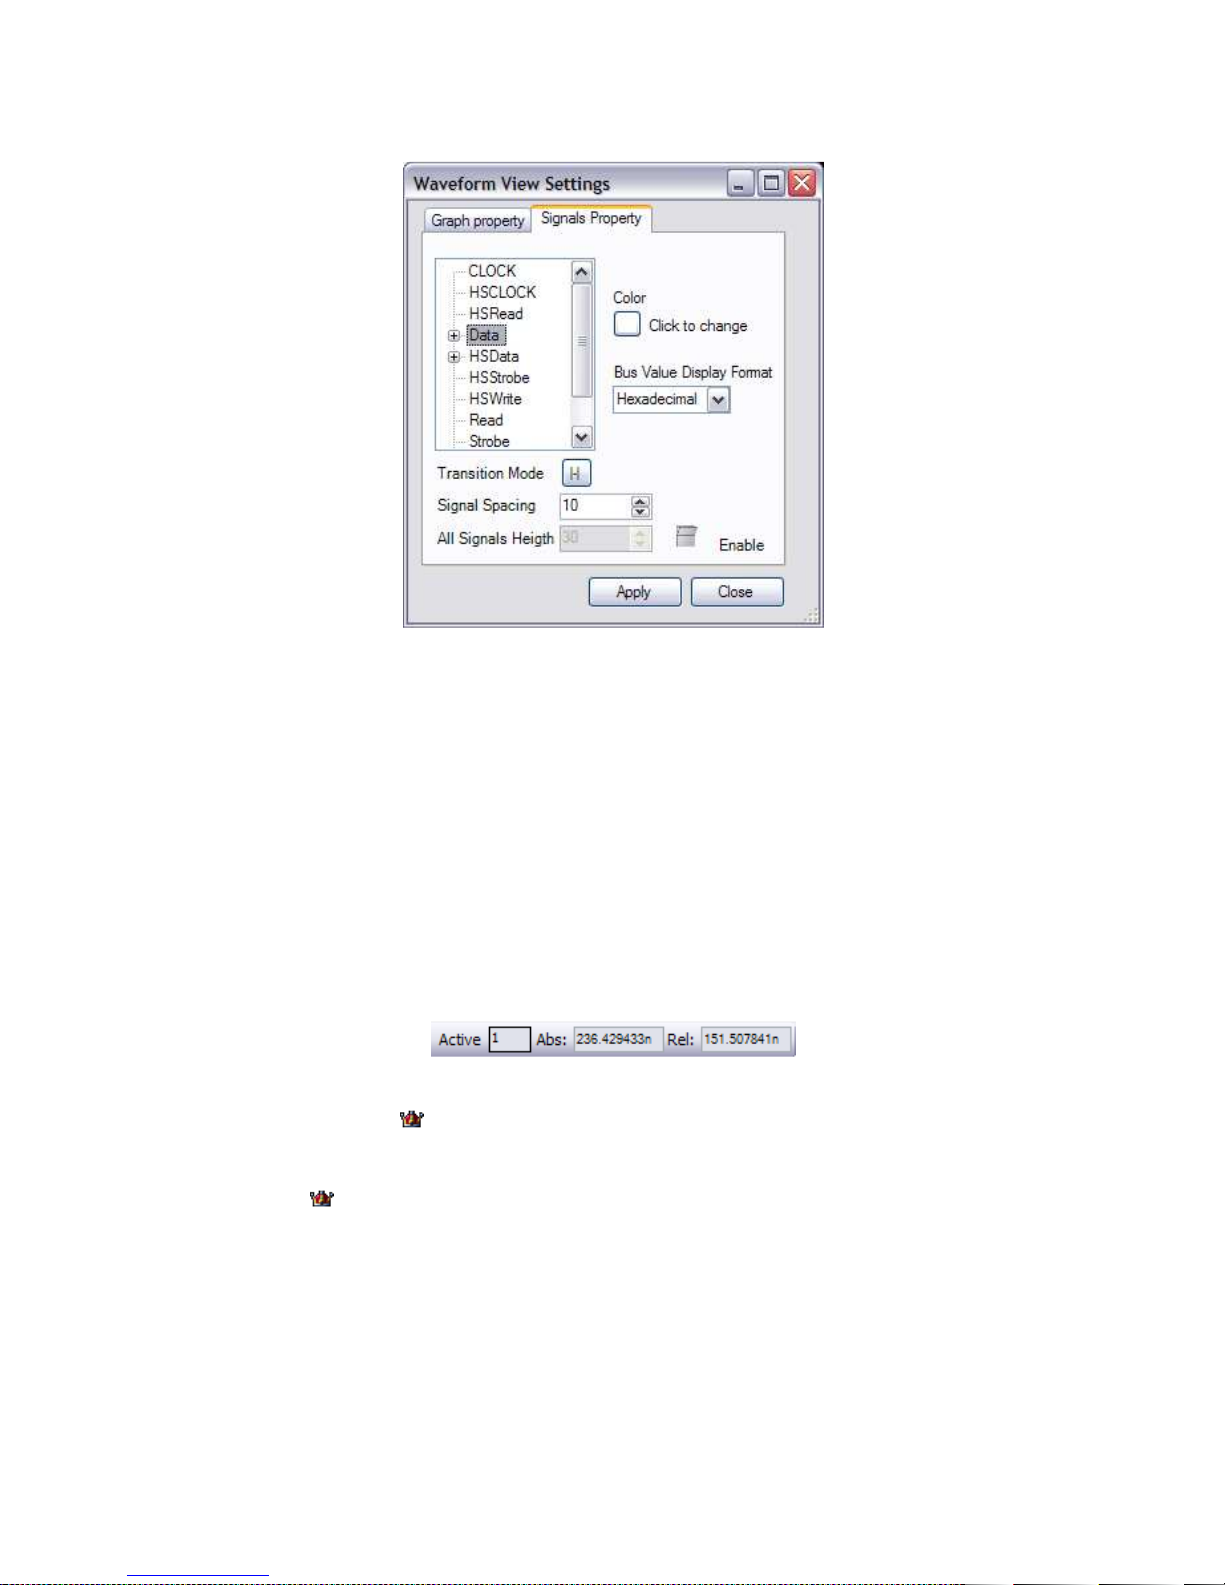
AT-LA500 – USER MANUAL
In the Signals Property tab it is possible to change the color of a single signal, the representation of
the value of a bus, the transition visualization mode, the space between signals and the height of all
signals.
Note: The minimum All Signals Height value is 4.
Cursors
Cursors (also called markers) are useful to identify and enlighten data that, therefore, may be
recognized or found easier. In addition cursors can be used to measure and to analyze acquired data.
By clicking on Markers label in the Waveform View toolbar, it is possible to show or hide the
marker window. In the Waveform View toolbar are also available indicators that show the active
cursor (that is, the Id of the cursor currently selected), and the Absolute and Relative Positions,
whose means are described below.
In the marker window are listed all cursors present in the Waveform View window. The master
cursor is identified by the icon. All relative positions will be calculated respected to the position
of the master cursor. Furthermore, the master cursor is moved automatically during a data search
operation to show results. To change the master cursor, select the new cursor in the marker window
and click on the icon in the Waveform View toolbar.
Note: In the Waveform View window, the master cursor is drawn in blue; all others cursors are
drawn in yellow.
RELEASE 3.4 – JUNE 2009 50
Page 51
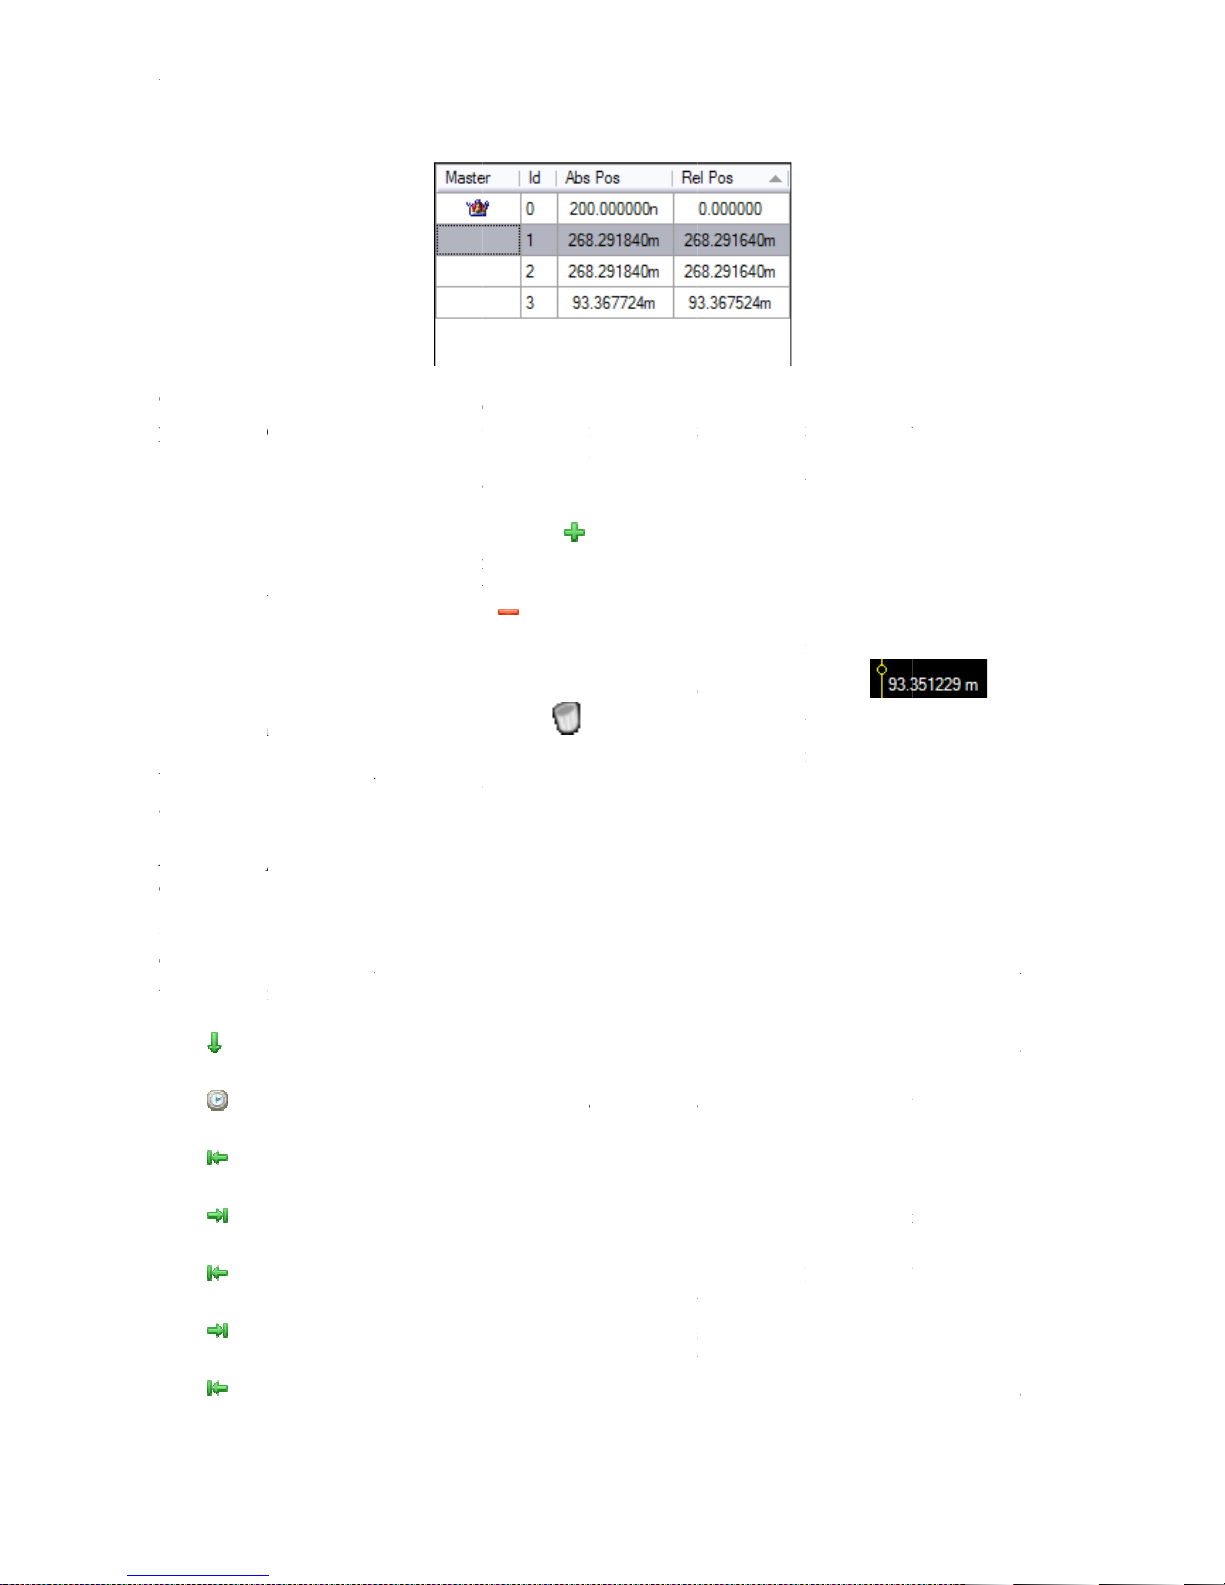
AT
The columns
position (the time distance between the cursor position and the start of the acquisition) and the
relative time position (the time distance between the
the cursors is moved, all the values are automatically updated and shown.
It is also possible to add or remove cursors
button in the marker windows and by selecting the desired option in the shortcut menu that will
appear.
Note
cursors as needed.
Go To
The
within the visualization area. The possible options in the
AT
-LA500 – U
SER MANUAL
The columns
position (the time distance between the cursor position and the start of the acquisition) and the
relative time position (the time distance between the
the cursors is moved, all the values are automatically updated and shown.
•
dd a cursor:
•
emove a
•
ove a cursor:
To remove all cursors:
It is also possible to add or remove cursors
button in the marker windows and by selecting the desired option in the shortcut menu that will
appear.
Note
: It is
possible to remove all the cursor
cursors as needed.
Go To
Selected Target
The
menu ring
within the visualization area. The possible options in the
•
Go to trigger
•
Go to time:
•
Go to normal samples start:
Go to normal samples end:
•
Go to Gigaview start:
•
Go to Gigaview en
•
Go to Analog samples start:
of the marker window
cursor:
possible to remove all the cursor
allows
Click on the
cursor will be added to the visualization area
Select the cursor to be removed in the
on the
Drag on the selected cursor.
possible to move
Click on the
selecting the position where the
show the progressive cursor identifier, the absolute time
and set the master
s
master cursor
visualization area is centered on it;
the master cursor is moved to the time
the box near the control;
master cursor
visualization area starts with the acquisition begin;
master cursor
visualization area starts with the acquisition begin;
master cursor
acquisition and the visualization area is centered on it;
master cursor
acquisition and the visualization area is centered on it;
master cursor
acquisition and the visualization area is centered on it. This
option is available only with oscilloscope integration;
cursor and the master cursor).
of the Waveform View w
cursor position indication:
key of the Waveform View window.
The user, however, can create
Go to
is moved to the trigger event and the
is moved at the acquisition begin and the
is moved at the acquisition end and the
is moved at the begin of the High Speed
is moved at the end of the High Speed
marker window
By dragging the
by clicking with the right mouse
aster cursor
menu ring are:
is moved at the begin of the analog
indow
cursor
going to
position specified in
Any time one of
. A new
and click
it is
as many
be moved
To a
To r
To m
•
Go to
•
key
.
key.
the
dot
.
but one.
a
:
the
m
is
the
the
the
d:
the
the
Page 52

AT
The
menu ring)
To move the selected
AT
-LA500 – U
SER MANUAL
•
Go to Analog samples end:
•
Cursor
The
button
menu ring)
To move the selected
must be pressed
curs
to activate this operation (it shows the icon selected in the
to the middle of the current visualization, click on the
master cursor
acquisition and the visualization area is centered on it. This
option is available only with oscilloscope integration;
The visualization area is centered on the cursor
is moved at the end of the analog
Go to
Go to
n:
the
n.
or
icon.
Page 53
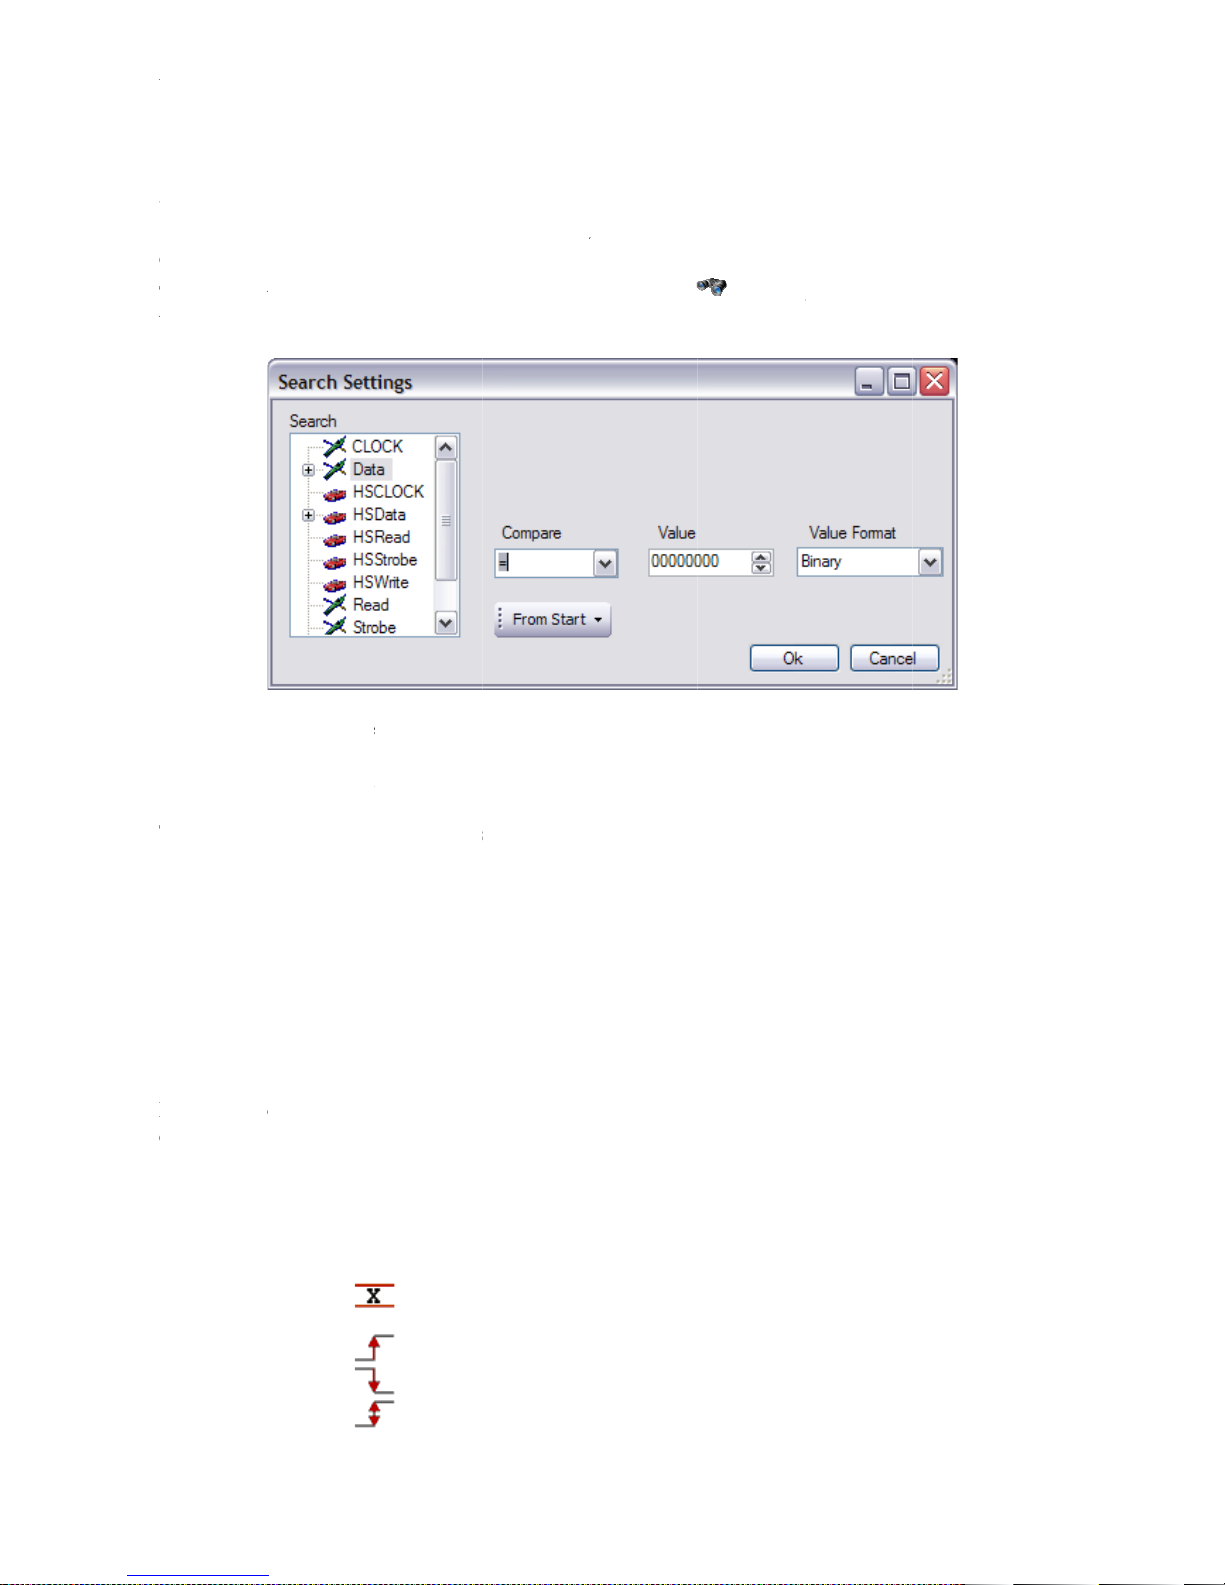
AT
Search
In the Waveform View
edge or a
To activate the search option, click on the
will
In the
to select the signal or bus where to search a specified value.
In the
The menu ring allows selecting the start location for searching. Possible options are:
Depending on the signal type selected in the
contains different options.
If a single signal is selected, the
AT
-LA500 – U
SER MANUAL
Search
In the Waveform View
edge or a
falling
To activate the search option, click on the
will be opened, and
In the
Search
to select the signal or bus where to search a specified value.
In the
Value
The menu ring allows selecting the start location for searching. Possible options are:
• From Start:
From End:
• From Trigger:
From Gigaview Start:
• From Gigaview End:
• Cursor
Depending on the signal type selected in the
contains different options.
If a single signal is selected, the
i
search criteria can be entered.
list, all defined signals and bus (also the High Speed signals) are shown.
box, the value or the edge to search ca
• 0
•
•
i
t is possible to search a value related to a bus or, for a single signal, a
Search starts from the acquisition begin;
Search starts from the acquisition end;
Search starts from the trigger
Search starts from the High Speed acquisition begin;
Search starts from the High Speed acquisition end;
Search starts from the cursor
Value
Change
Search Settings
S
box can assume these values:
Search for a logic 0;
Search for a logic 1;
Search for a High Impedance (only for
Pattern
Search for a rising edge;
Search for a falling edge;
Search for any edge;
n be entered.
position;
n
, the
Generator Mode);
key and the
Compare
Search Settings
Value
rising
window
It is possible
menu ring
edge.
•
•
n;
location;
earch list
and the
1
•
HiZ
•
•
Rise
Fall
Page 54

AT
The
To make active the selected criteria, click the
closed.
In the
key. The
AT
-LA500 – U
SER MANUAL
The
Compare
To make active the selected criteria, click the
closed.
In the
visualization window,
key. The
master cursor
menu ring allows
• =
!=
•
•
HiZ
will move to the
select
Find if equal
Find if not equal
Find greater values
selected)
Find minor values (enabled only if a bus is
selected)
High Impedance (only for Pattern Generator
Mode);
click on the
between
Search Forward
found value.
the search option:
(enabled only if a bus is
and the
Search Settings
key or on the
Search Backward
window will be
to
;
•
;
>
;
<
;
•
OK button
next
Page 55
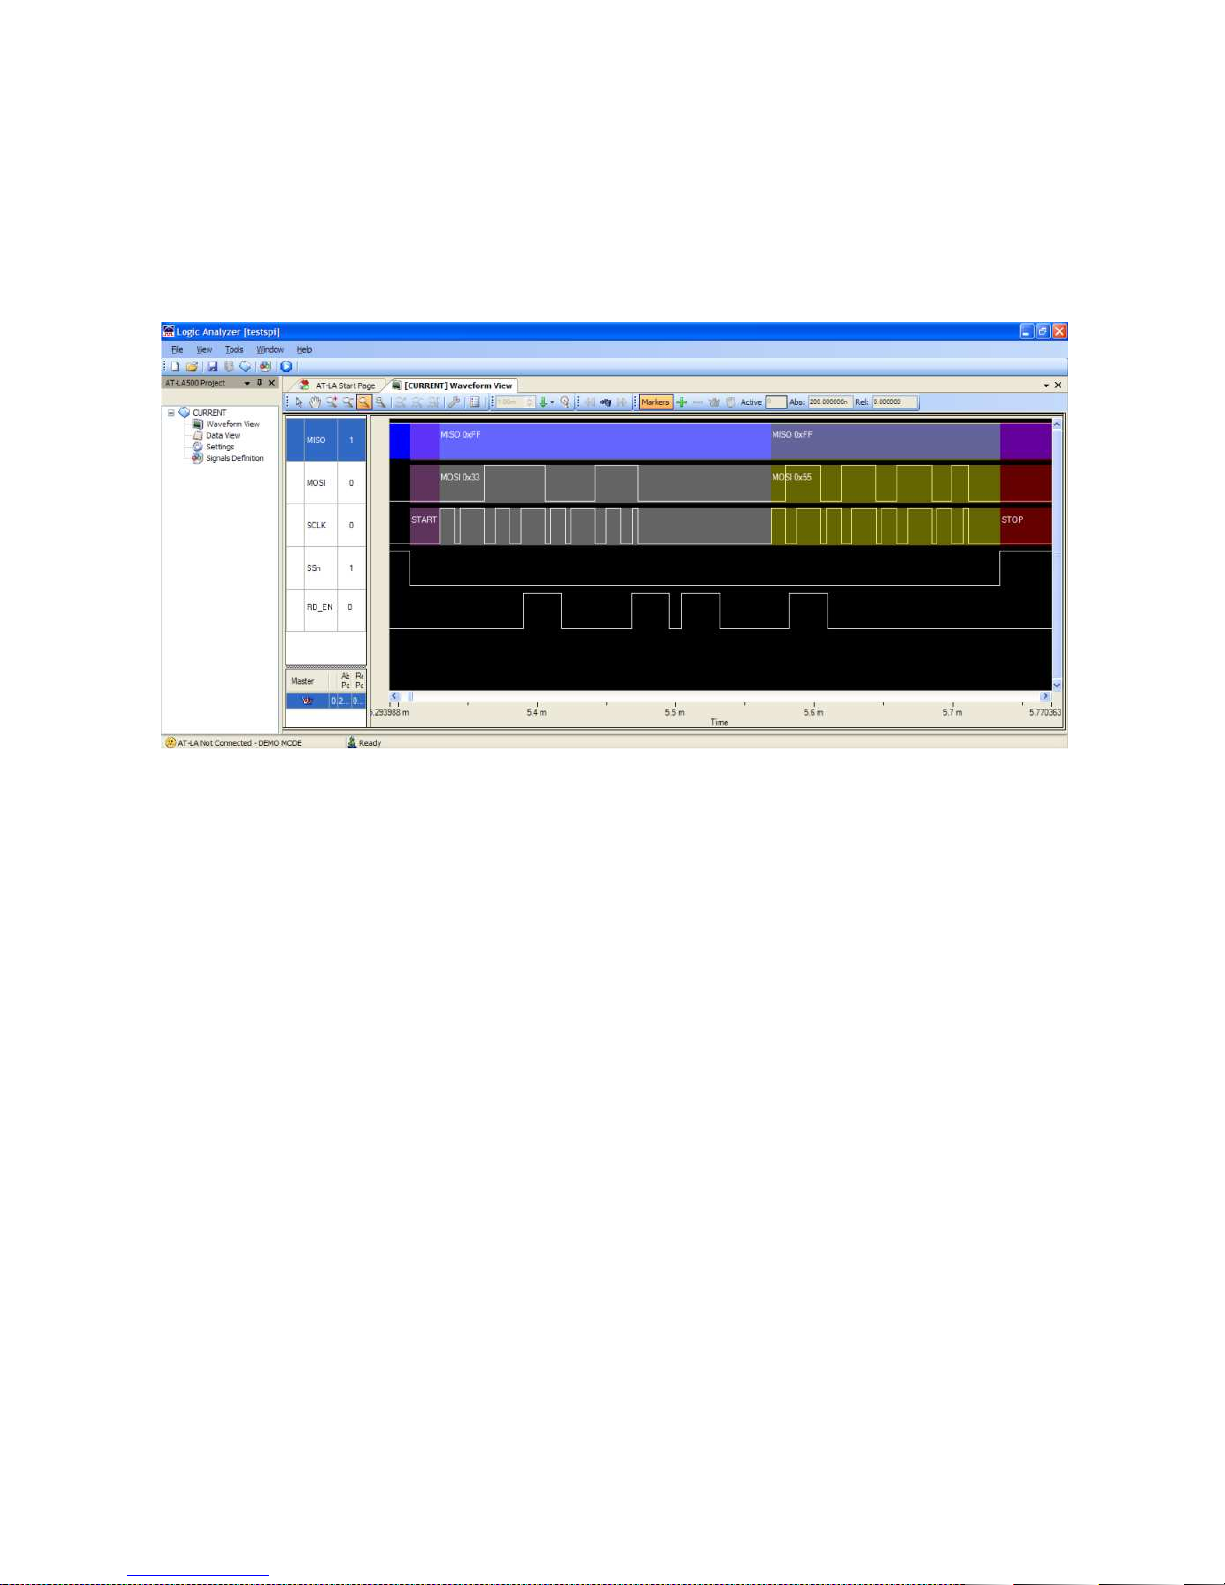
AT-LA500 – USER MANUAL
Serial Protocol Interpreter
When a Serial Protocol trigger is selected, the serial bus acquired data are visualized and their
interpretation is indicated in the Waveform View window: coloured rectangles will show where the
bus operations begin and end; a string will specify which operation is represented.
The following table indicates the information that are shown for every protocol:
Protocol Interpreted operations
I2C START: Start bus condition detected;
Addr: Hexadecimal indication of the I2C address;
R: Read operation;
W: Write operation;
ACK: Acknowledged operation;
NACK: Not acknowledged operation;
Data: Hexadecimal indication of the I2C data;
STOP: Stop bus condition detected.
SPI START: Start bus condition detected;
MOSI: Hexadecimal indication of the data transferred on the MOSI line;
MISO: Hexadecimal indication of the data transferred on the MISO line;
STOP: Stop bus condition detected.
UART TxD: Hexadecimal indication of the data transferred on the TxD line. If
possible, an ASCII representation is also shown;
RxD: Hexadecimal indication of the data transferred on the RxD line. If
possible, an ASCII representation is also shown.
RELEASE 3.4 – JUNE 2009 55
Page 56
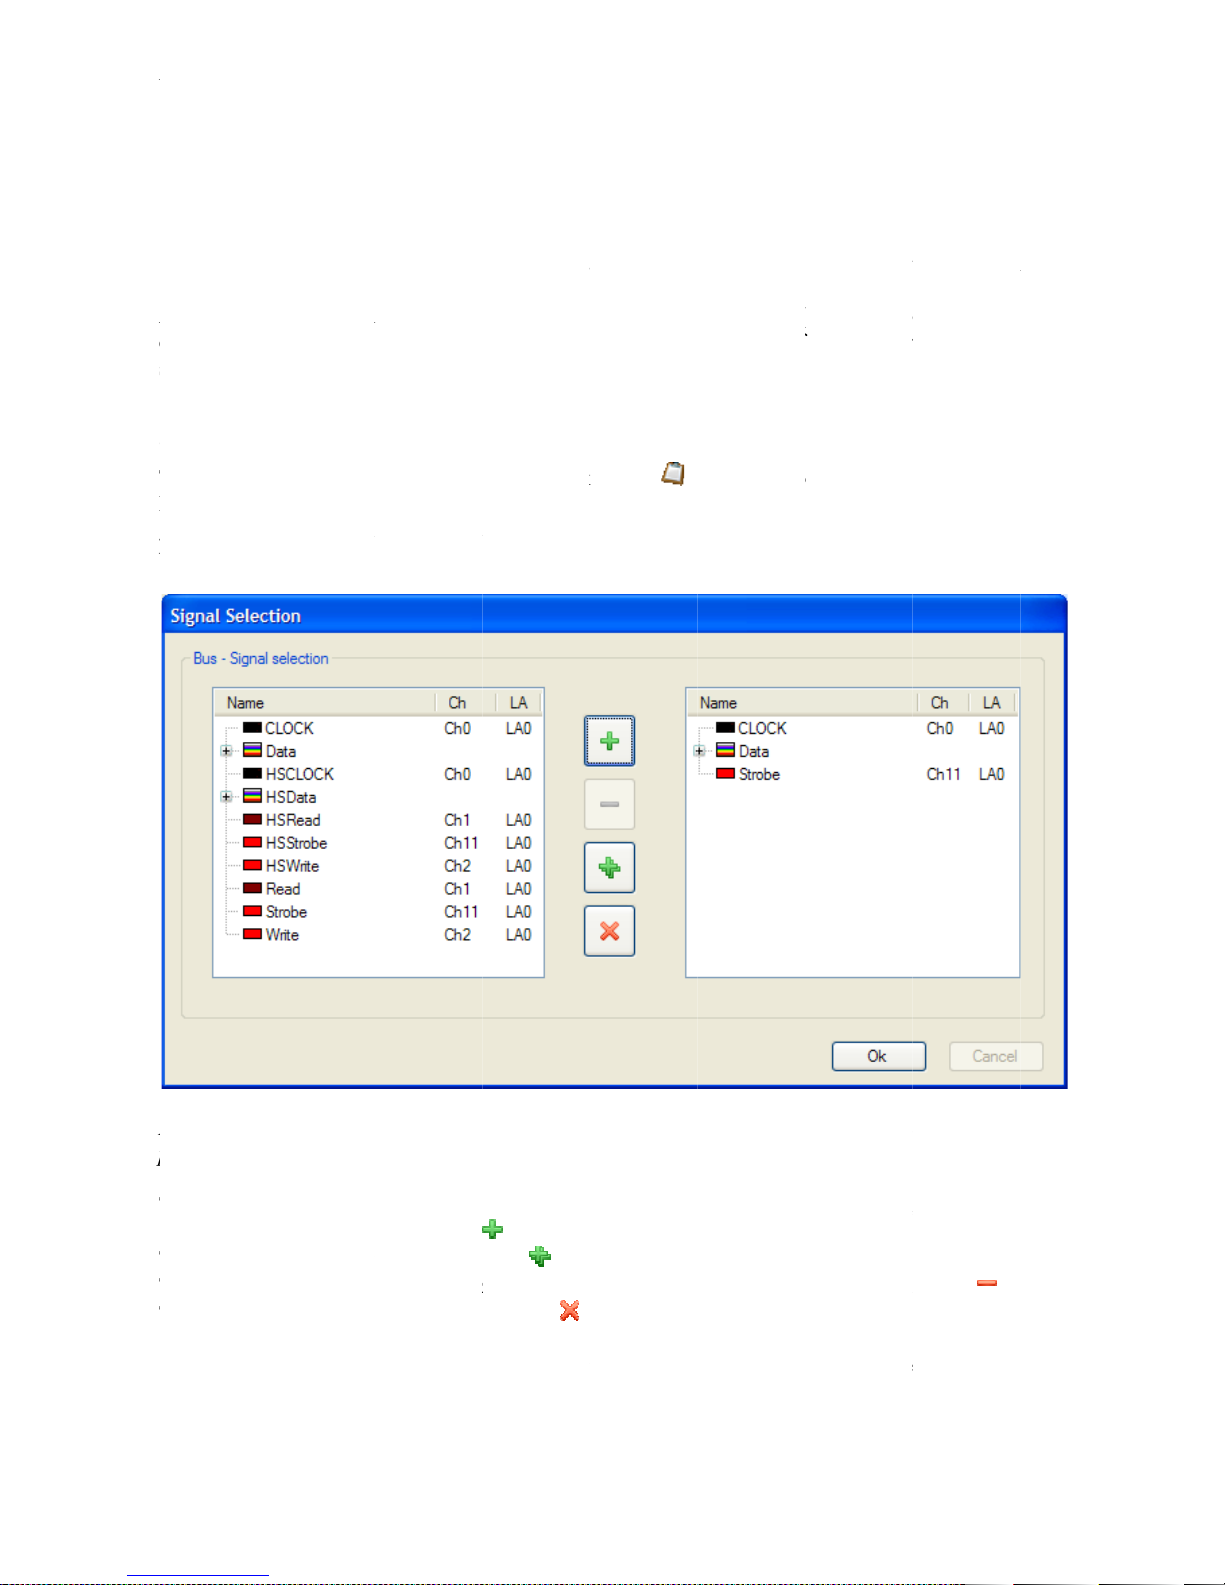
AT
State Listing
In the
representing a signal or a group of signals.
A
column
selected.
Create a
To open the
Listing
groups of signals among those that have been acquired are to be visualized, then the
window will be shown.
Note
prefix.
To add a signal or a bus to the list of the ones that will be shown in the
it on the left side table and click on
To add all signals at a time, just click on
To remove a signal from the visualization list,
To remove all signal at a time, just click on
AT
-LA500 – U
SER MANUAL
State Listing
In the
State Listing
representing a signal or a group of signals.
A
dditional columns indicate the sample number (
column
) and the
selected.
Create a
State Listing
To open the
Listing
window is not yet open,
groups of signals among those that have been acquired are to be visualized, then the
window will be shown.
Note
he High Speed signals acquired will appear with the user defined name and the
prefix.
To add a signal or a bus to the list of the ones that will be shown in the
it on the left side table and click on
To add all signals at a time, just click on
To remove a signal from the visualization list,
To remove all signal at a time, just click on
If some High Speed data are added, the
window
interpretation of the serial protocol bus operations, if t
State Listing
acquired data
window
, double click on the
Signal Selection
are visualized numerically in columns, each one
select it on the right side table and click on
State Listing
are visualized numerically in columns, each one
Sample
icon in the Solution Explorer.
window will appear to select which signals or
will be split in two independent sections.
),
),
the absolute time (
his trigger option has been
State Listing
Time
State
State Listing
“HS”
window, select
State
s column
Time
window
a
If the
: T
.
.
.
.
Page 57
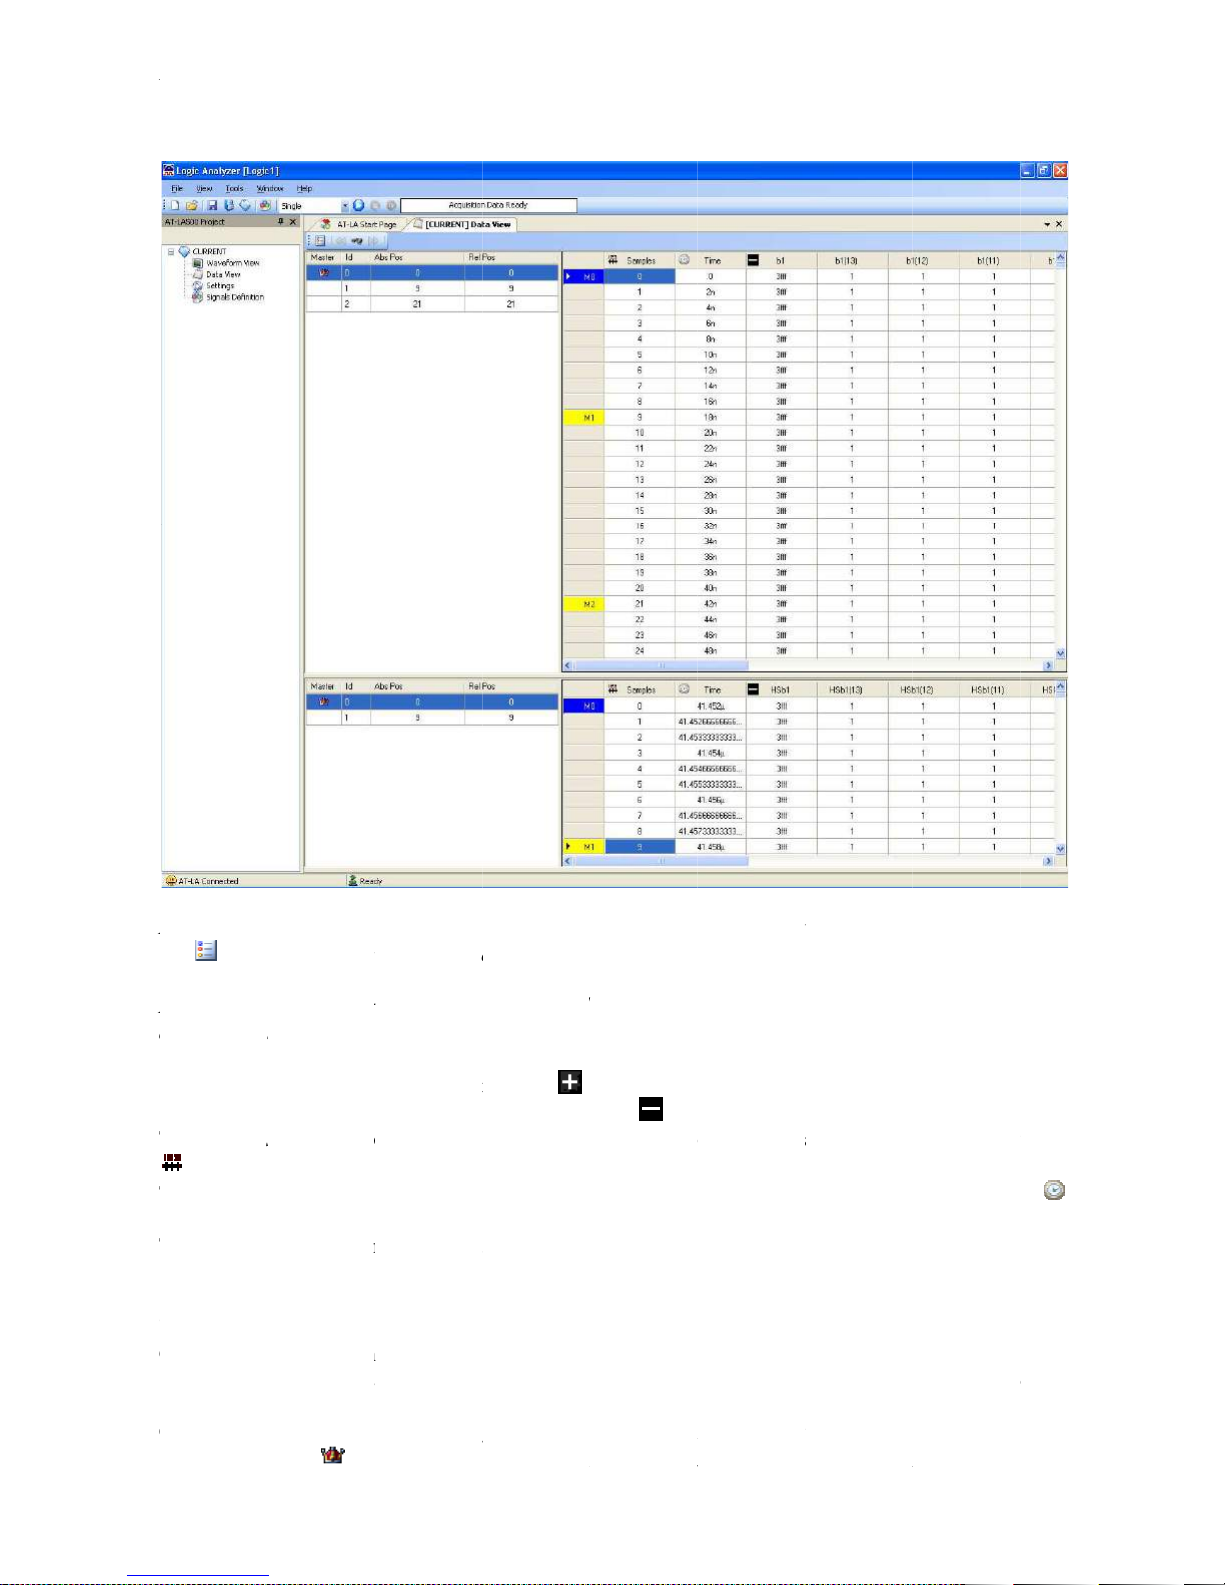
AT
Note
the
Note
automatically shown. They can’t be removed from the
In the
it to open a bus. The icon of an opened bus becomes
The
The
icon.
To resize the
Cursors
Cursors
recognized or found easier.
On the left side of the
identified by the
AT
-LA500 – U
SER MANUAL
Note
Signals can be added in (removed from) the
the icon in the
Note
hen the trigger is set on a serial protocol mode, the signal protocol names are
automatically shown. They can’t be removed from the
In the
State Listing
it to open a bus. The icon of an opened bus becomes
The
Samples
The
column contains the progressive absolute time of every sample. It is indicated by the
icon.
To resize the
Cursors
Cursors
(also called markers)
recognized or found easier.
On the left side of the
identified by the
State Listing
, a bus is indicated by a
column contains the progressive number of the acquired s
amplitude, just drag the line between signals name.
icon. All relative positions will be calculated respected to the position of the
window toolbar
are useful to identify and enlighten data that, therefore, may
In addition cursors can be use
State Listing
icon on the left of its name. It is possible to click on
window are listed all available cursors. The mast
Listing
State Listing
lick on it to close a bus.
d to measure and to analyze acquired data.
window at any time
window.
amples. It is indicated by the
amples. It is indicated by the
by clicking on
er cursor is
:
: W
icon.
Time
columns
State
.
. C
be
Page 58

AT-LA500 – USER MANUAL
•
•
•
master cursor. Furthermore, the master cursor is moved automatically during a data search
operation to show results.
It is possible to operate with cursors by clicking with the right mouse button on the cursor list and
select one of these options in the shortcut menu that will appear:
• Add marker
Add a cursor to the State Listing
Window;
Delete marker
Set master
Clear marker list
• Go to this marker
Remove the selected cursor;
Set the selected cursor as the master;
Delete all cursors but one;
Move the State Listing list to show
the position of the selected cursor;
• Representation…
Allows to select the Absolute and
Relative Position representation. It is
possible to choose between Time and
Samples.
Note: It is possible to remove all the cursors but one. The user, however, can create as many
cursors as needed.
The markers are indicated by the string Mn in the first column of the State Listing, where n is the
progressive identification number.
Browse the State Listing window and export data
To jump quickly to the desired position of the State Listing list, it is possible to click with the right
mouse button on the data and to select one of these options in the shortcut menu that will appear:
• Add marker
• Move selected marker here
• Show this sample on Waveform
View
• Go to selected marker
• Go to trigger
• Go to samples…
• Go to time…
• Save to txt file…
Add a cursor in the selected point of
the State Listing window;
Places the selected cursor to the
specified position of the State
Listing;
Center the Waveform View on the
selected sample (only if the
Waveform View is already open);
Move the State Listing list to show
the position of the selected cursor;
Move the State Listing list to show
the trigger position;
Move the State Listing list to show
the samples which number is
specified in the Go to sample…
window that will appear;
Move the State Listing list to show
the samples which absolute time is
specified in the Go to time…
window that will appear;
Allows to export data in text file. A
window will appear to select which
RELEASE 3.4 – JUNE 2009 58
Page 59
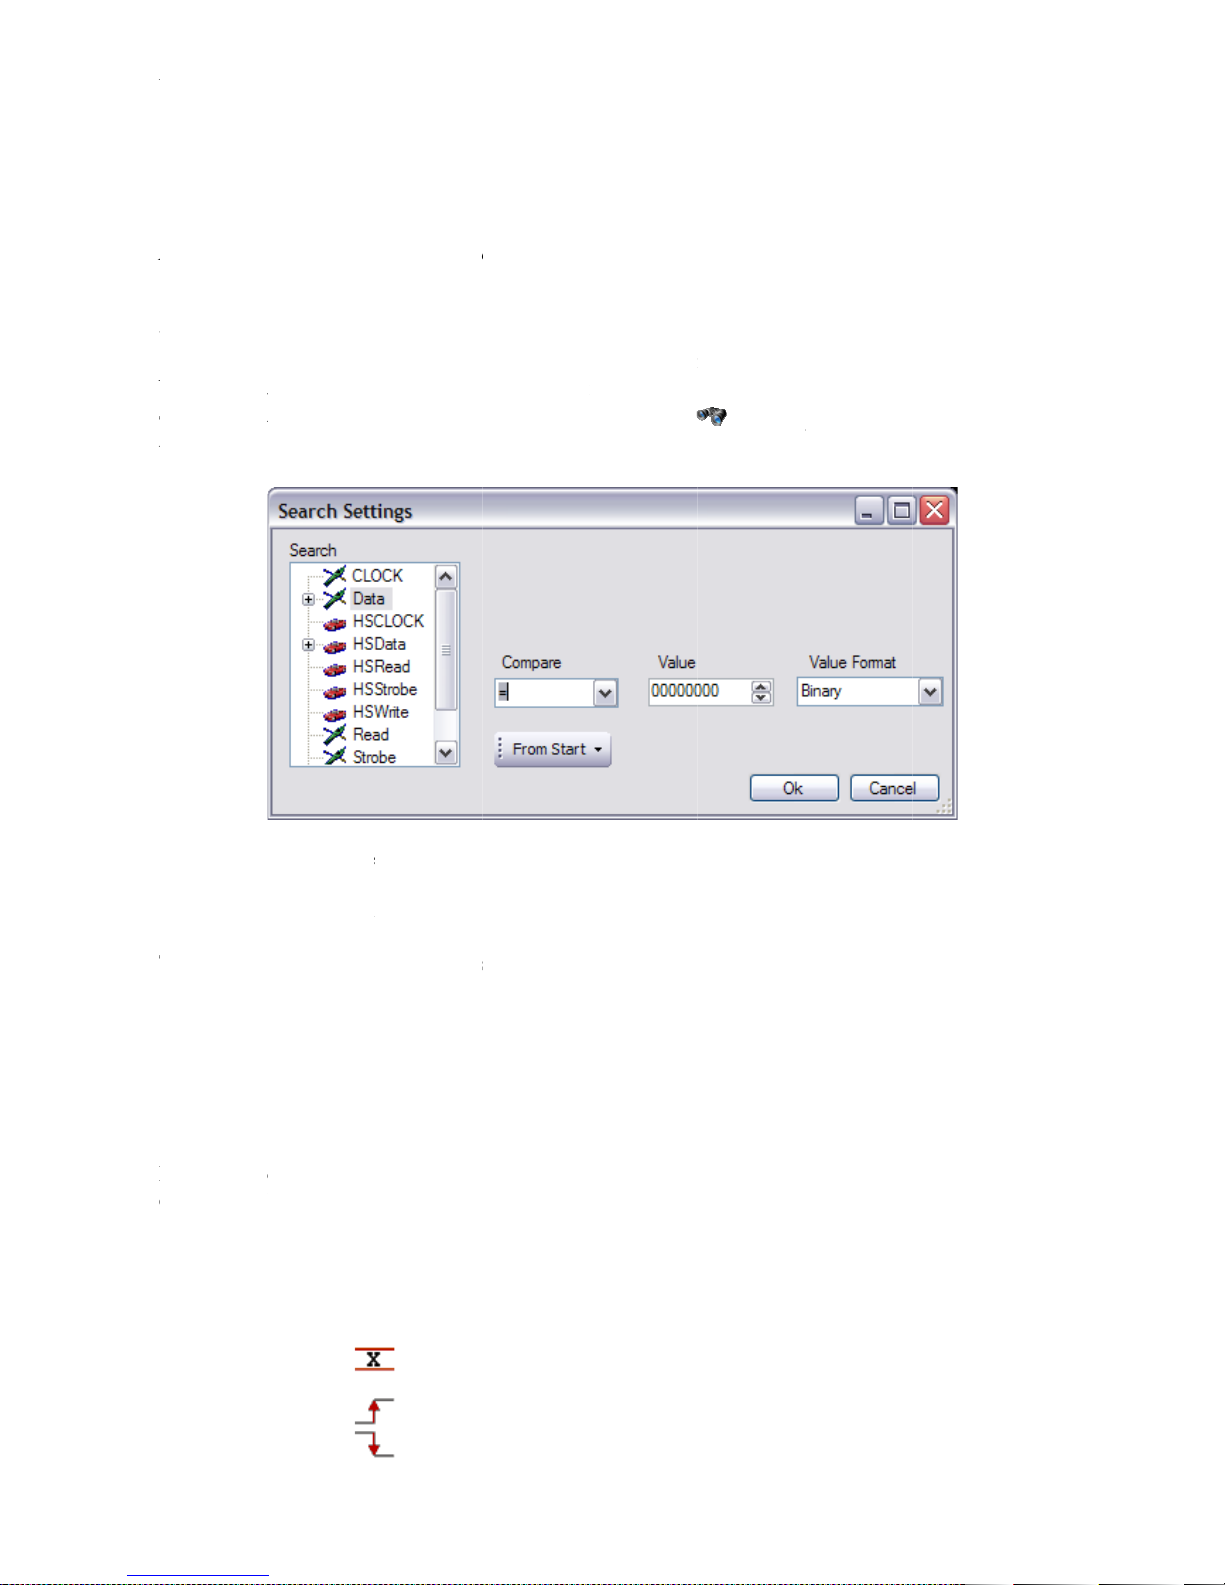
AT
Note:
Search
In the
bus or, for a single signal, a
To activate the search option, click on the
will
In the
to select the signal or bus where to search a specified value.
In the
The menu ring allows selecting the start location for searching. Possible options are:
Depending on the signal type selected in the
contains different options.
If a single signal is
AT
-LA500 – U
SER MANUAL
Note:
Exporting the entire acquisition may require a long time to be
Search
In the
State Listing
bus or, for a single signal, a
To activate the search option, click on the
will be opened, and search criteria can be entered.
In the
Search
to select the signal or bus where to search a specified value.
In the
Value
The menu ring allows selecting the start location for searching. Possible options are:
• From Start:
• From End:
• From Trigger:
Master Marker:
Depending on the signal type selected in the
contains different options.
If a single signal is
window, as in the Waveform View, i
list, all defined signals and bus (also the High Speed signals) are shown. It is possible
box, the value or the edge to search can be entered.
selected, the
• 0
•
•
edge or a
Search starts from the acquisition begin;
Search starts from the acquisition end;
Search starts from the trigger position;
Search starts from the
Value
Fall
falling
Search Settings
S
box can assume these values:
Search for a logic 0;
Search for a logic 1;
Search for a High Impedance (only for
Pattern Generator Mode);
Search for a rising edge;
Search for a falling edge;
rows and column have to be
exported.
t is possible to search a value related to a
master market
, the
completed.
key and the
Compare
Search Settings
Value
window
menu ring
rising
edge.
•
earch list
;
and the
1
•
HiZ
•
Rise
Page 60

AT
The
To make active the selected criteria, click the
closed.
In the
key. The
Serial Protocol Interpreter
When a Serial Protocol trigger is selected, the serial bus acquired data are interpreted and visualized
in a Command column of the
operations begin and end; a string will specify which operation is represented.
AT
To increase the number of available channels
frequency, up to 8 AT
synchronizing and controlling all AT
The
AT
connected AT
AT
driver and the
connect AT
trigger), transfer analog data to the pc when th
visualize digital and analog waveforms on the
Note:
AT
minimize propagation skews among the different AT
AT
-LA500 – U
SER MANUAL
The
Compare
To make active the selected criteria, click the
closed.
In the
visualization window,
key. The
ma
Serial Protocol Interpreter
When a Serial Protocol trigger is selected, the serial bus acquired data are interpreted and visualized
in a Command column of the
operations begin and end; a string will specify which operation is represented.
AT-XSS Expansion BUS
To increase the number of available channels
frequency, up to 8 AT
synchronizing and controlling all AT
The
oftware controls all AT
AT-XSS connection
connected AT
AT
Expansion bus
driver and the
connect AT
-
trigger), transfer analog data to the pc when th
visualize digital and analog waveforms on the
Note:
When a data acquisition is performed using several AT
AT
expansion cable, it is convenient to
minimize propagation skews among the different AT
•
menu ring allows
•
• !=
•
• HiZ
will move to the
LA500 can be connected by using the AT
is automatically recognized by the control software
LA500 as a single Logic Anal
scope
LA500 with a oscilloscope, set the trigger on it (the logic analyzer will wait an external
Change
select
Find if equal;
Find if not equal;
Find greater values (enabled only if a bus is
selected);
Find minor values (enabled only if a bus is
selected);
High
Mode);
click on the
State Listing
LA500 without any additional operation by the user. The presence
allows also synchronizing and controlling an external device. A s
card are needed to perform this operations. For example, it’s possible to
Search
between
Impedance (only for Pattern Generator
Search Forward
found value.
zer with a higher channel number.
Waveform View window.
for any edge;
the search option:
and the
window: coloured cells will show wh
without
e trigger event
use the same probe type for each instrument to
LA500.
Search Settings
key or on the
degrading
occurs
LA500 connected together via the
Search Backward
performance or sampling
Expansion bus
which
on the oscilloscope and
window will be
ere the bus
which allows
manages all
pecific
=
• >
<
ster cursor
to
OK button
next
s
-XSS
-
AT-
-
-LA500.
-
y
-XSS
of
-
-XSS
-
Page 61

AT-LA500 – USER MANUAL
Note: For a better acquisition it is suggested to connect all AT-LA500 in consecutive slots of the
AT-XSS expansion bus and to set the trigger event on an AT-LA500 positioned in an intermediate
location.
RELEASE 3.4 – JUNE 2009 61
Page 62
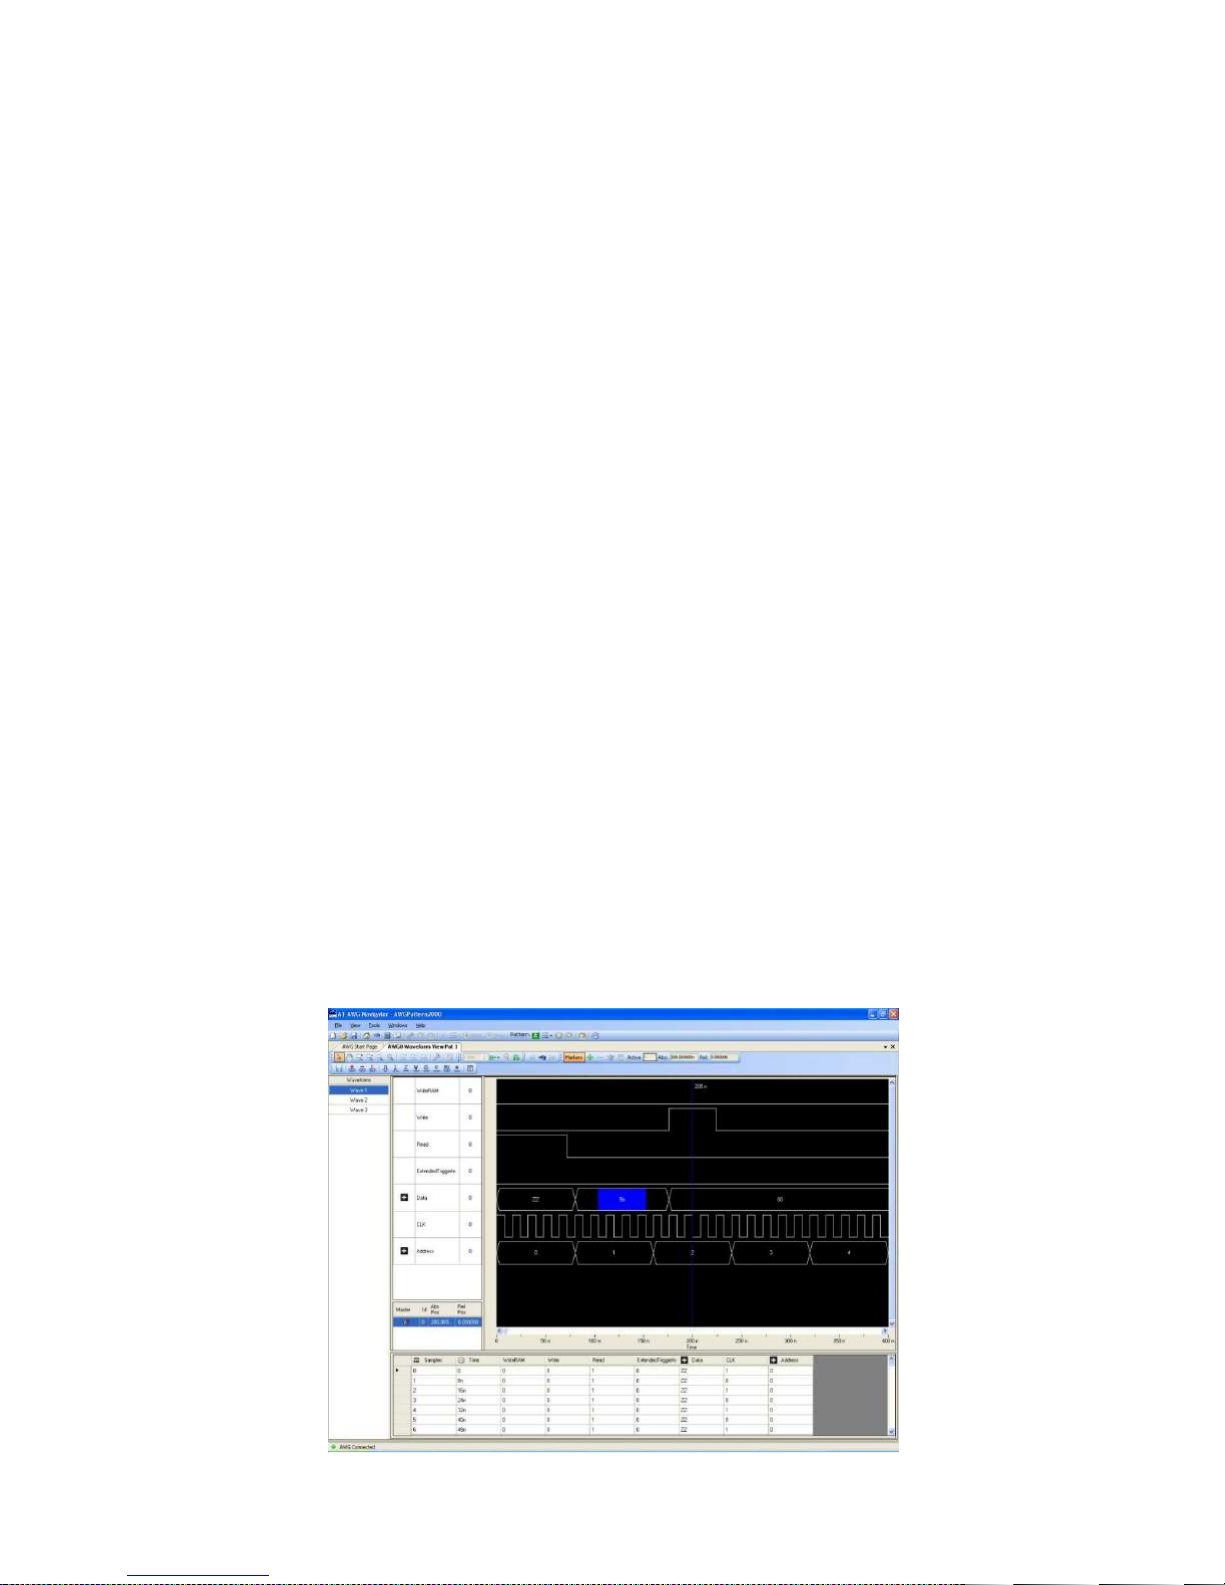
AT-LA500 – USER MANUAL
Digital Pattern Generator-Sampler (Optional)
AT-LA500 can be configured to work as a powerful Digital Pattern Generator-Sampler (optional).
In this working mode AT-LA500 provides the capability to emulate standard serial or parallel bus
transitions or custom digital interfaces for system debugging and characterization.
Its architecture is based on a vector/command memory and a powerful sequencer that defines the
vector/command execution flow.
The sequencer unit is a programmable finite state machine with a microcode memory that,
combined with the vector/command memory, can generate long digital patters and control signals at
a very high speed
As Digital Pattern Generator-Sampler the AT-LA500 provides:
• 36 Channels @ 125 MHz in Generation mode
• 36 Channels @ 250 MHz in Acquisition mode
• 640 Vectors in Generation
• 2 Million samples in Acquisition
• Digital Waveform Sequencer
• Parallel or 1,2 or 4 wire Serial Operating Modes
• Programmable Event Detector
• Multi-device synchronization with AT-XSS (SDK)
The 36 channels are divided in two banks, bank0 (Ch 17-0) and bank1 (Ch 35-18): the user can
select both banks to generate, both to sample or one bank to generate and the other to sample the
data,changing the direction of the output buffer with two control signals.
Digital waveforms (vectors and commands) can be edited in a tabular format or by means of a
powerful and intuitive digital waveform editor that provides tools for advanced pattern definitions:
clock, count and random patterns over a selection or the entire signal or bus.
RELEASE 3.4 – JUNE 2009 62
Page 63
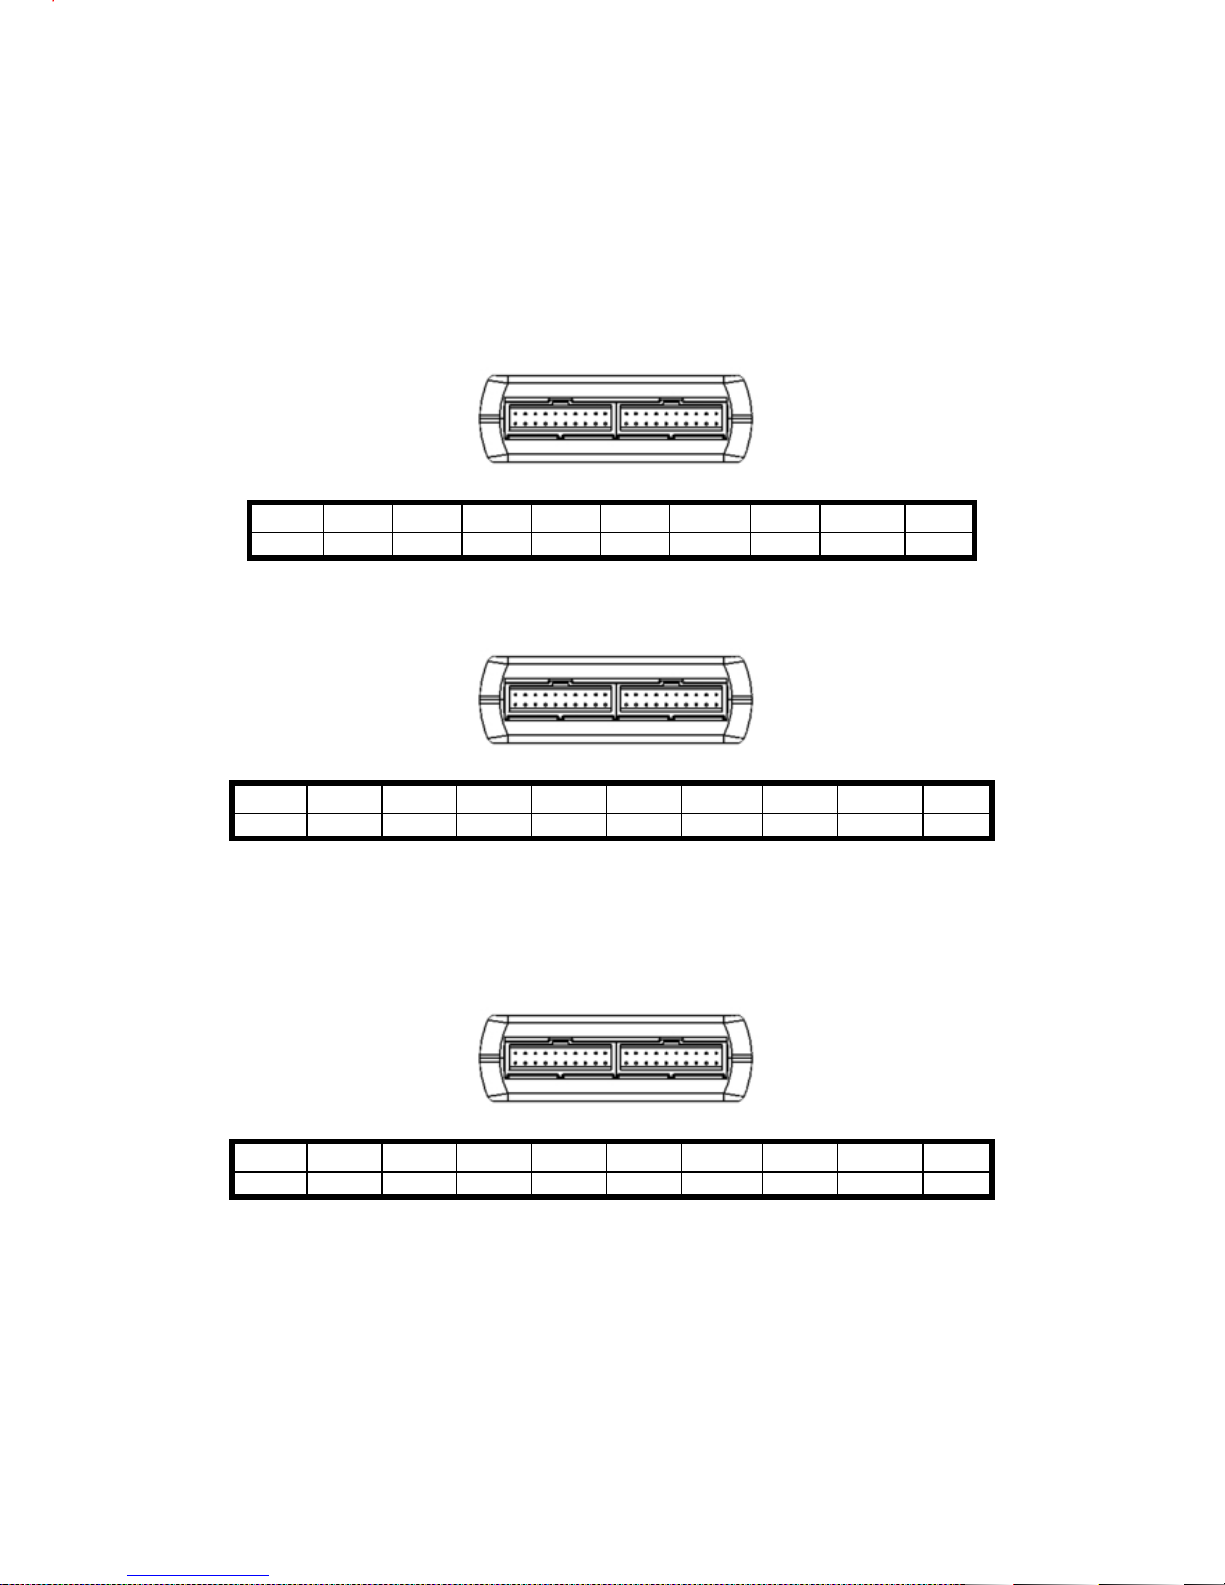
AT-LA500 – USER MANUAL
Probes description
Probes have to be connected to the testing board by means of opportune connectors.
WARNING: use Passive Probes only with AT-LA500 Digital Pattern Generator.
Regarding the probes connected to the Pod A the correspondence between the pins and the number
of channels is reported in the following tables:
Bank 0 (Ch. 8..0):
Ch.8 Ch.7 Ch.6 Ch.5 Ch.4 Ch.3 Ch.2 Ch.1 Ch.0
n.c. GND n.c. GND n.c. GND
n.c.
GND
n.c.
Bank 1 (Ch 17..9):
n.c.
n.c.
Ch.17 Ch.16 Ch.15 Ch.14 Ch.13 Ch.12 Ch.11 Ch.10 Ch.9
n.c.
GND
n.c.
GND
n.c.
GND
n.c.
GND
n.c.
n.c.
n.c.
Regarding the probes connected to the Pod B the correspondence between the pins and the number
of channels is reported in the following tables:
Bank 2 (Ch. 26..18):
Ch.26 Ch.25 Ch.24 Ch.23 Ch.22 Ch.21 Ch.20 Ch.19 Ch.18
n.c.
GND
n.c.
GND
n.c.
GND
n.c.
GND
n.c.
n.c.
n.c.
RELEASE 3.4 – JUNE 2009 63
Page 64
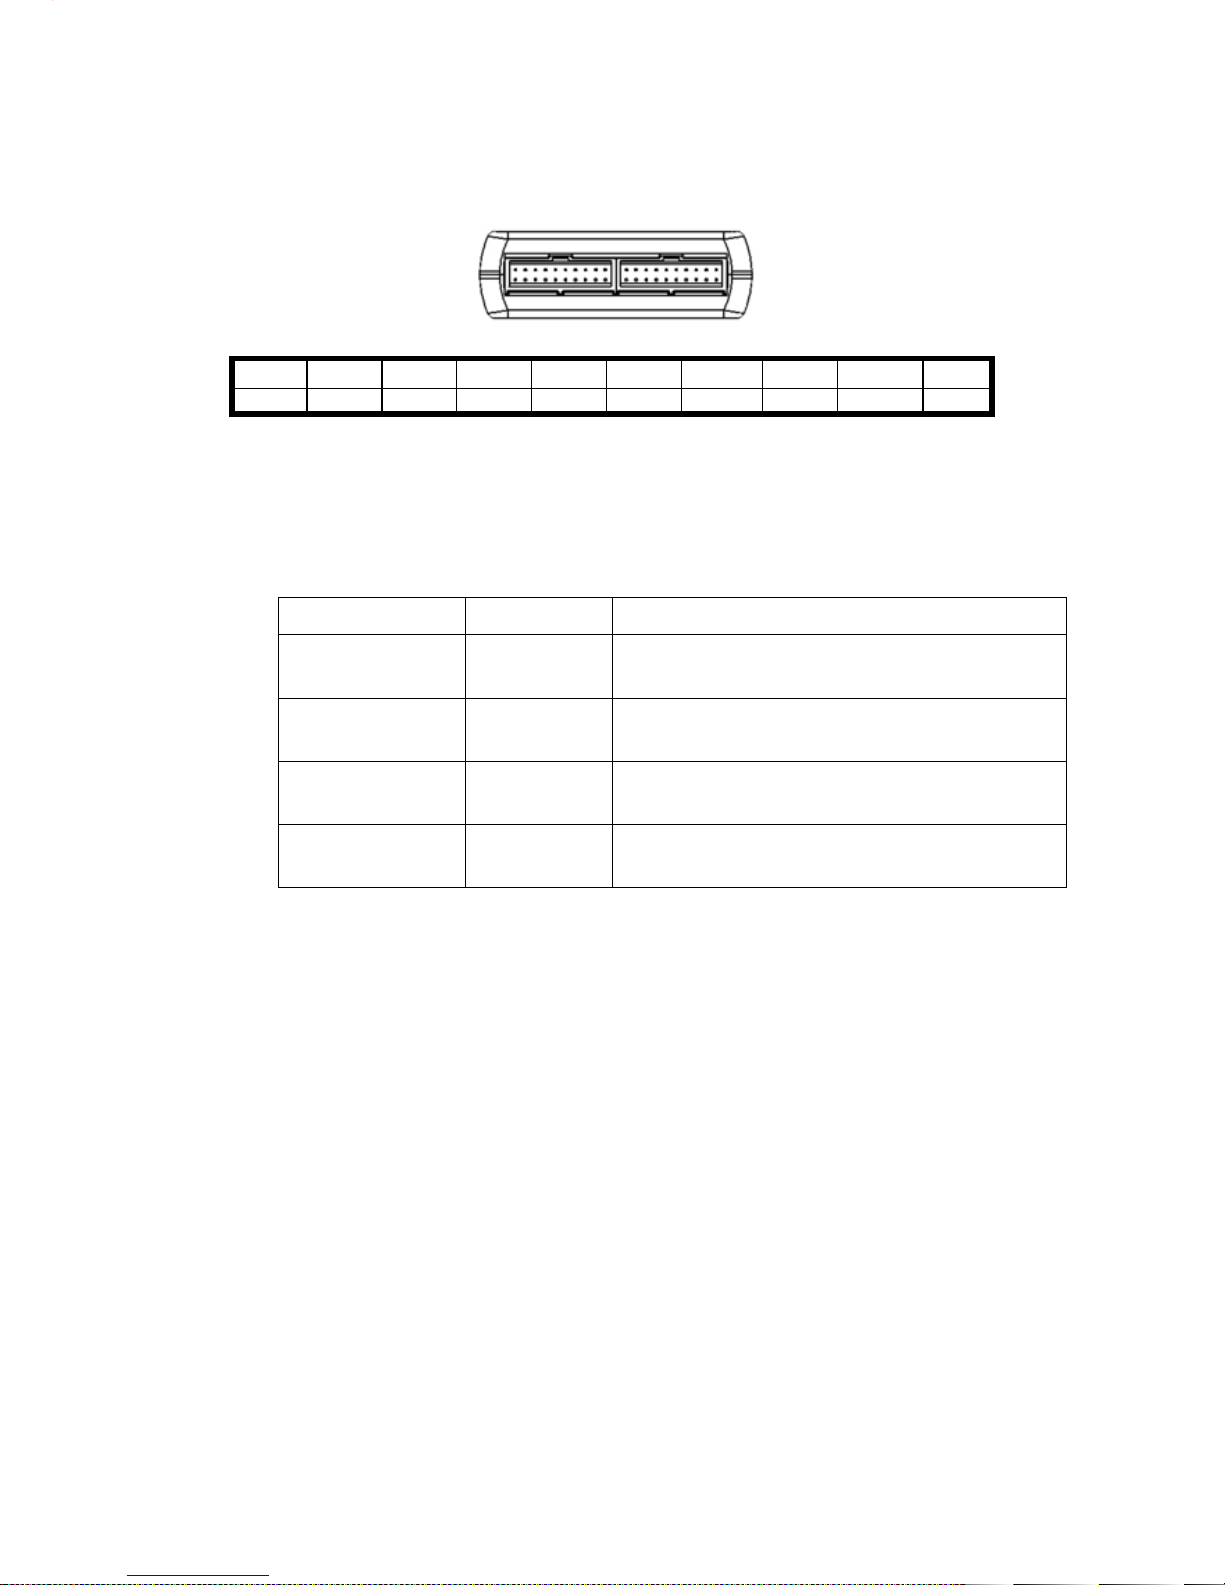
AT-LA500 – USER MANUAL
additional
Bank 3 (Ch. 35..27):
Ch.35 Ch.34 Ch.33 Ch.32 Ch.31 Ch.30 Ch.29 Ch.28 Ch.27
n.c.
GND
n.c.
GND
n.c.
GND
n.c.
GND
n.c.
n.c.
n.c.
Signals Description
The signals available on AT-LA500 Digital Pattern Generator-Sampler connectors are reported
below.
Signal name Type Description
GND --
Ch[17..0] Input Output
Ch[35..0] Input Output
Ch[35] / CLK Input / Output
Digital ground
Digital pattern generator bidirectional pins
bank 0
Digital pattern generator bidirectional pins
bank 1
Clock generator module output pin or
input/output pin
RELEASE 3.4 – JUNE 2009 64
Page 65
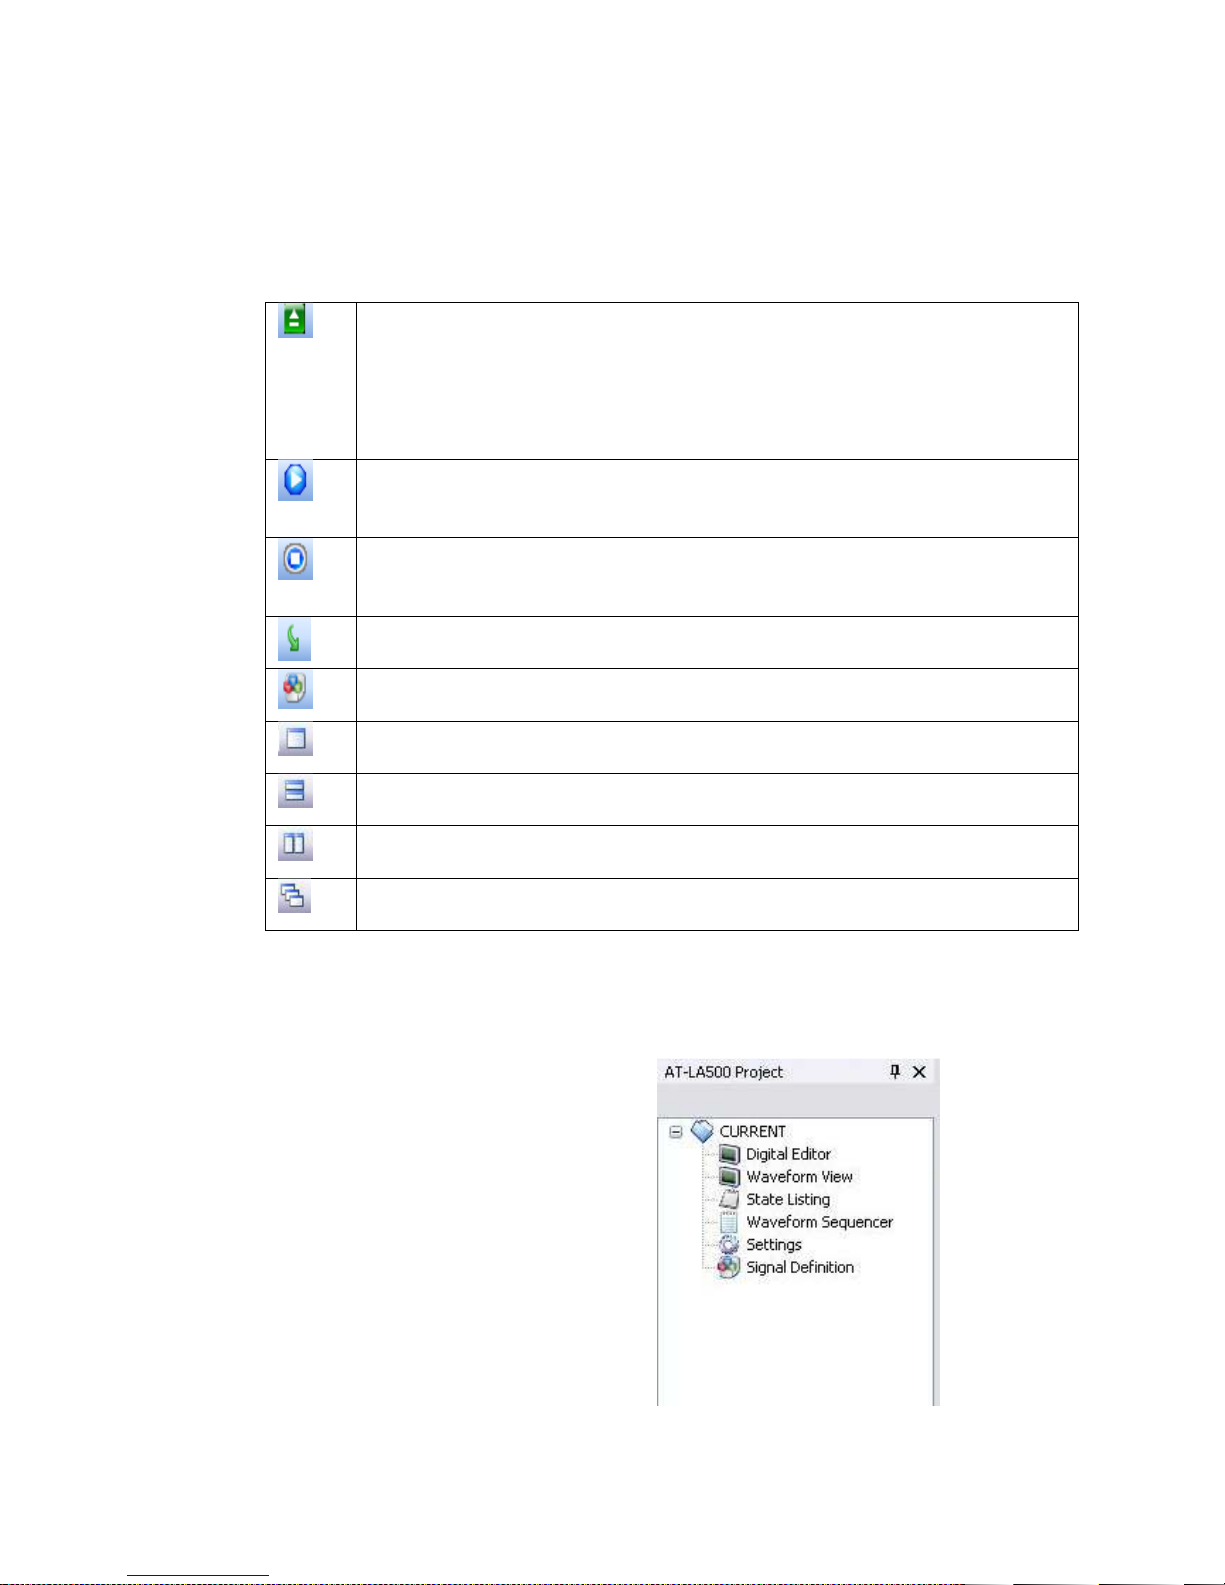
AT-LA500 – USER MANUAL
Command Bar
The Command Bar allows managing in a simple and fast way the waveform generation for all
enabled channels.
The available commands are:
Upload the digital waveforms and the sequencer instructions.
Note: if the user make changes on Digital Editor form or on the Sequencer
form, the upload button has to be pressed to load the changes on the
instrument.
Start the sequencer and the generation of the digital waveforms
Stop the Sequencer
It opens the Strobe form
View Pod Status
Dock Windows
Tile Horizontally Windows
Tile Vertically Windows
Cascade Windows
Project Window
This section allows a full control of
a project and it manages all settings
of the enabled channels
RELEASE 3.4 – JUNE 2009 65
Page 66
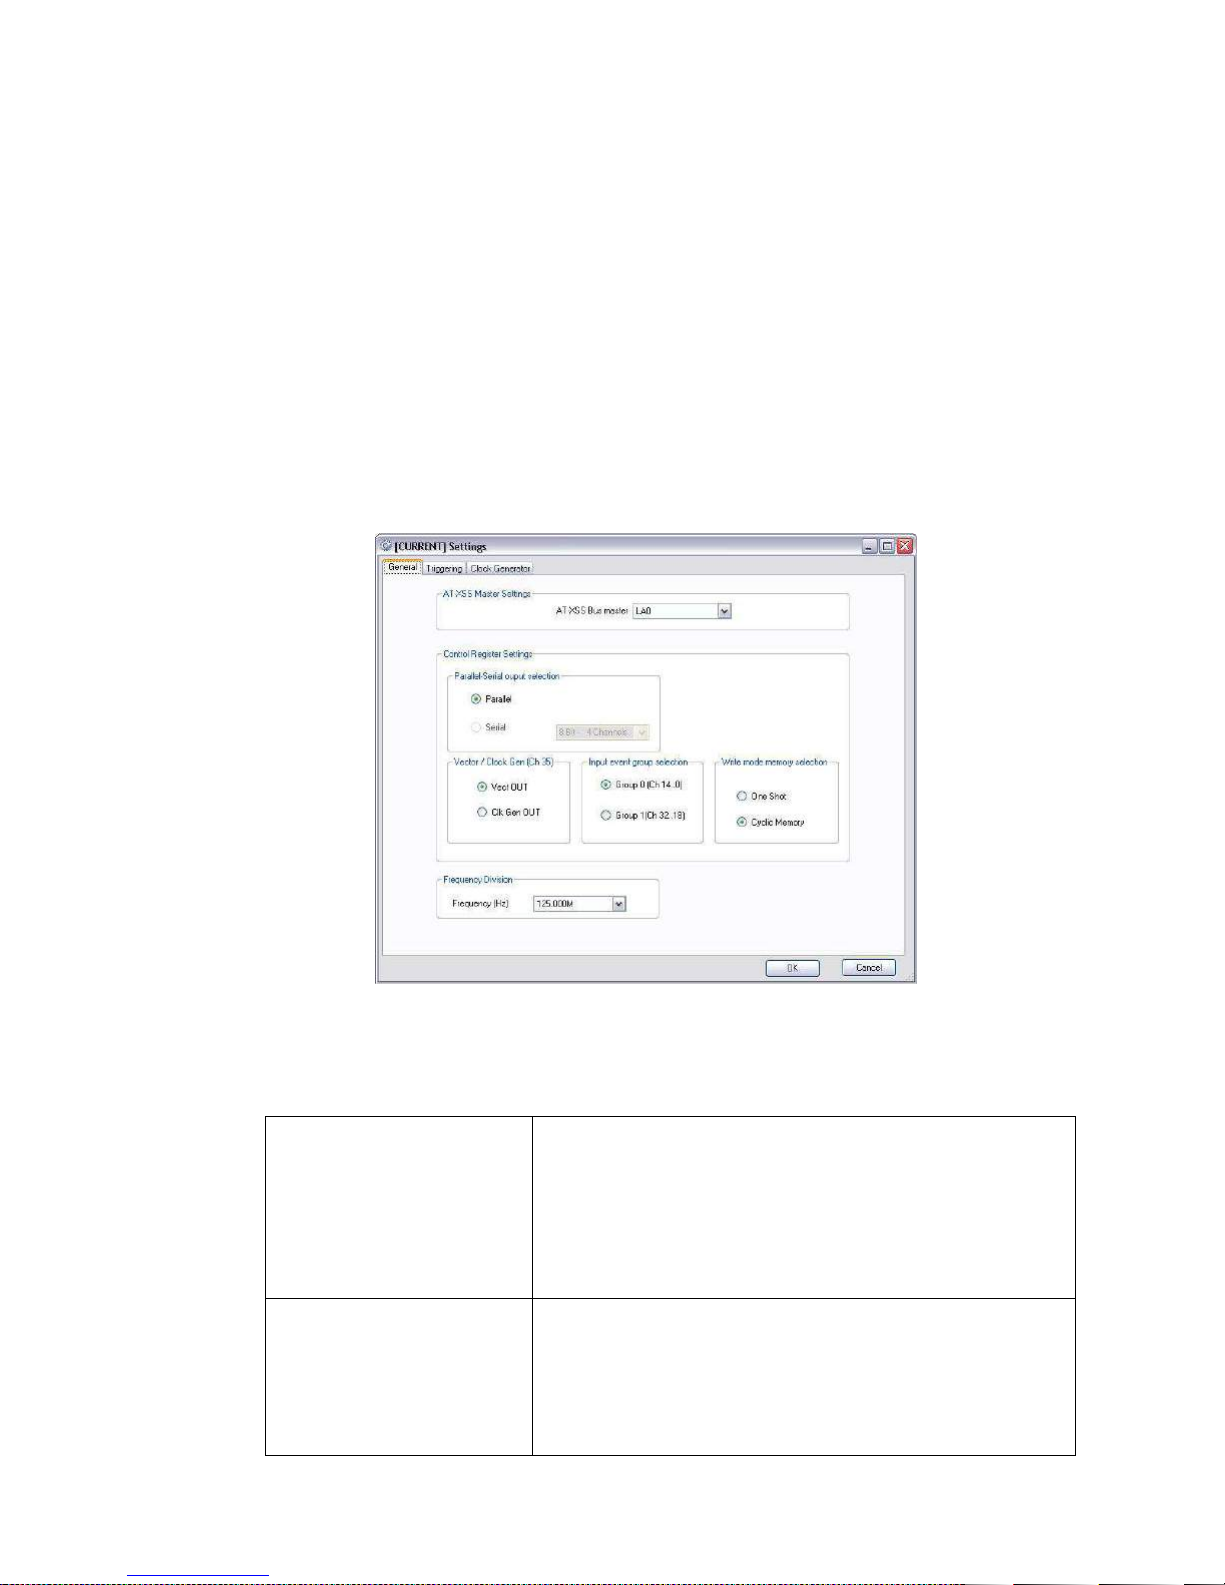
AT-LA500 – USER MANUAL
Tree functionalities
Left double click: when double-clicking on the mouse left button on a voice to be edited for the
selected project, the corresponding editing tool will be opened: Settings, Digital Editor, Waveform
View, State Listing, Signals Definition, Waveform Sequencer.
Settings
The Settings panel allows configuring the AT-LA500 for a correct pattern generation. It is divided
in three tabs: General, Triggering, and Clock Generation.
General
The General tab allows defining the basic operation for Control Register Settings
Vector / Clock Gen (Ch
35):
Parallel-Serial Output In Parallel mode the output vector is parallel.
RELEASE 3.4 – JUNE 2009 66
Channel 35 can be used as output for the clock generated
by the Clock Generator Module or as output for
Vector(35).
Vect OUT sets Ch35 as output for Vector(35)
Clk Gen Out sets Ch35 as Clock output
In Serial mode the serializer is activated and the serial
output is available on Ch0 (1 wire mode), Ch0-Ch18 (2
wire mode), Ch0-Ch1-Ch18-Ch19 (4 wire mode).
Page 67

AT-LA500 – USER MANUAL
Write Mode Memory One shot: the data are written until the end of the
memory is reached
Cyclic Memory: the memory is written in a cyclic mode
and data can be overwritten when the end of memory is
reached.
Input Event Group
Selection:
The waveform sequencer can monitor an event over two
signal groups: Group 0 and Group 1.
Selecting the Group 0 the waveform sequencer can
monitor an event on Ch[14..0] (in addition to the Trigger
condition from the Trigger Module),
otherwise selecting the Group 1 it monitors an event on
Ch[32..18] (in addition to the Trigger condition from the
Trigger Module).
Frequency Division: The frequency division for the Digital Pattern Generator
internal clock can be set.
The Pattern Generator works by default @ 125 MHz but
a different working frequency can be set by changing the
frequency register. This feature is useful to save vector
memory in case of generation of waveforms with slow
update rates.
The new working frequency will be 125 MHz/
2^(FrequencyDiv) and also the Clock Generator module
will be affected by the frequency division, so the clock
generator maximum output frequency will be 125 MHz/
2^(FrequencyDiv).
Allowed values are selectable in Frequency combo box.
Serializer (SDK only)
The serializer module is an hardware interface that takes the Vector stream and serializes it in 1, 2
or 4 serial channels.
The Serializer can work in 8,16 or 32 bits Mode.
In 8 bit Mode four serial channels are available (Ch0,Ch1,Ch18,Ch19) and vectors must be loaded
in this way: VECTORS(7..0) will be serialized by Serializer Module to generate Ch0,
VECTORS(15..8) for Ch1, VECTORS(23..16) for Ch2,VECTORS(31..24) for Ch3 (LSB first).
Vectors[31..24] Vectors[23..16] Vectors[15..8] Vectors[7..0]
CH19 CH18 CH1 CH0
RELEASE 3.4 – JUNE 2009 67
Page 68

AT-LA500 – USER MANUAL
In 16 bit Mode two channels are available (Ch0,Ch18 bidirectional) and vectors must be loaded in
this way: VECTORS(15..0) will be serialized by Serializer Module to generate Ch0,
VECTORS(31..16) for Ch 1 (LSB first).
Vectors[31..16] Vectors[15..0]
CH18 CH0
In 32 bit Mode one channel is available (Ch0) and vectors must be loaded in this way:
VECTORS(31..0) will be serialized by Serializer Module to generate Ch0 (LSB first).
Vectors[31..0]
CH0
8 bit CONTROLS are updated every 8, 16 or 32 clock cycles depending on the Serial Mode. In
Serial Mode if VECTOR(32) is '1', the Serializer starts to serialize the VECTORS stream, if it is '0'
the Serializer doesn't serialize the stream (please refer to SDK manual for further informations).
Note: the Serializer module is not active in the present AT-LA500 software version. Serialization
can be performed by using of the SDK application.
RELEASE 3.4 – JUNE 2009 68
Page 69
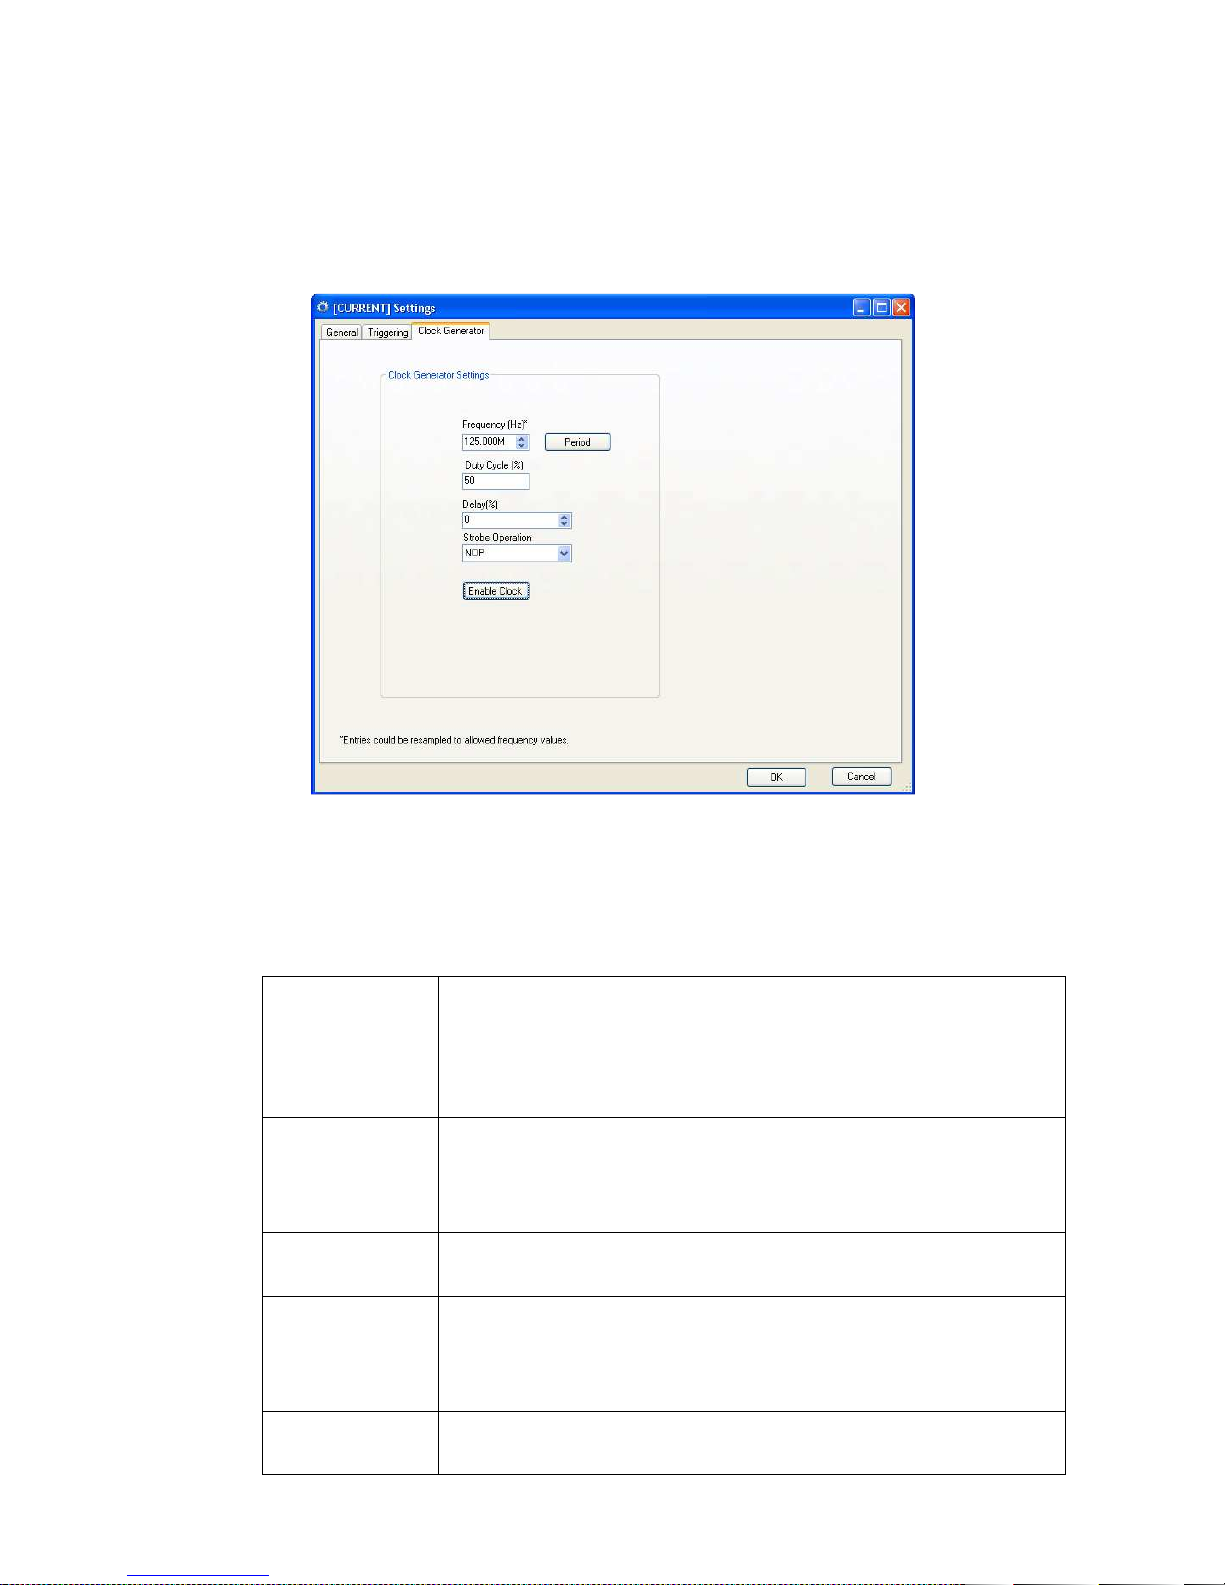
AT-LA500 – USER MANUAL
output
Note: user entries could be recalculated to allowed frequency
duty cycle
lock with the Vector(34)
OR,AND,XOR,NOT,
Clock Generator
Clock Generator module allows generating a clock signal with a frequency up to 125 MHz.
The clock will be generated on Ch35.
It is also possible to combine the clock with the VECTOR(34) signal using the strobe function. The
following options are available: NOP,OR,AND,XOR,NOT, NOR, NAND, XNOR.
The Clock generator also provides a synchronized signal to the Sequencer Module to generate
vectors synchronized with the output clock.
Frequency
It sets the frequency (in MHz) of the Clock Generator.The
frequency depends on the frequency division set by the user.
values.
Duty Cycle
It sets the generated clock duty cycle of the clock signal.
Note: user entries could be recalculated to allowed
values.
Delay
It sets the delay to the synchronized signal.
Note: user entries could be recalculated to allowed delay values.
Strobe Operation
It allows combining logically the Output c
signal. The possible logic options are: NOP,
NOR, NAND, XNOR, FORCE LOW, FORCE HIGH
Enable It enables or disables the Clock Generator Module
RELEASE 3.4 – JUNE 2009 69
Page 70
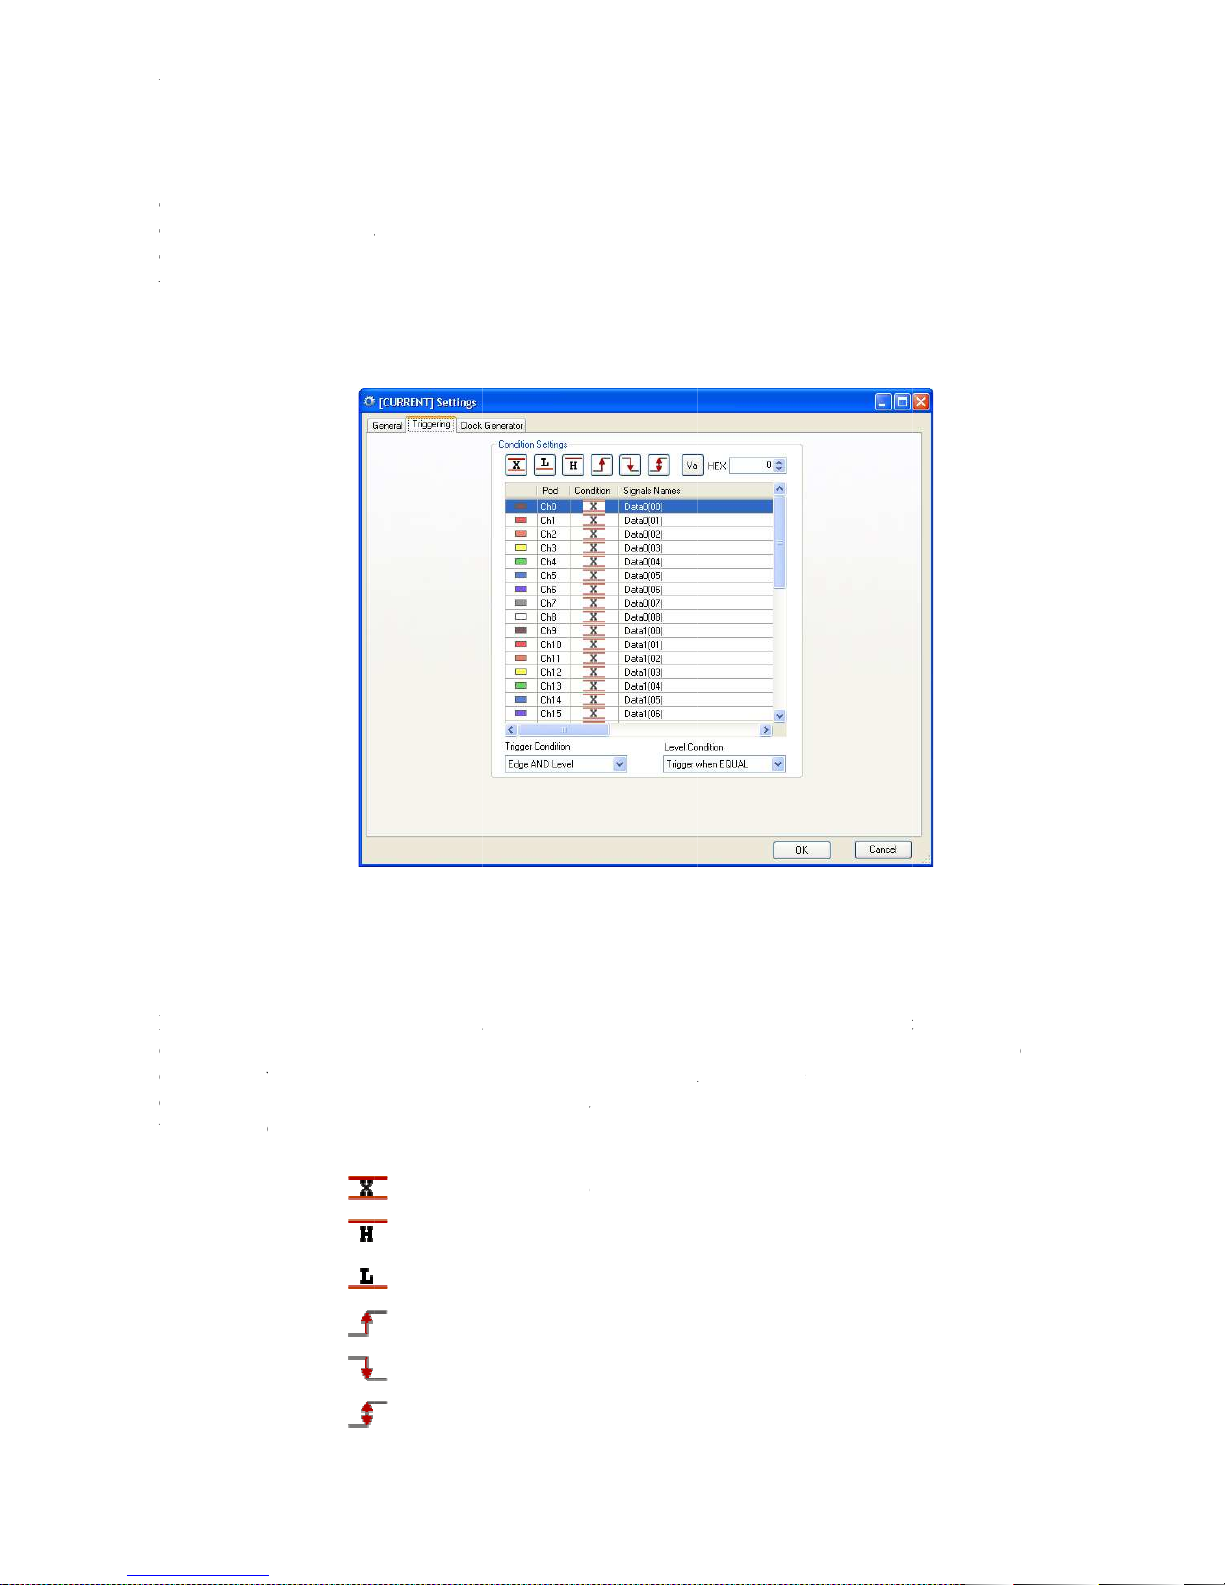
AT
Triggering
T
Trigger) to generate a trigger event like
The Trigger Condition is available only for Digital Pattern set as Master device. If the device has
been set as slave, it will receive the trigger event
Edges and Levels
For each signal it is possible to indicate whether the trigger condition must be detected on a rising
edge, on a falling edge or for any of the two edges. When the trigger conditions have been set on
edges of several signals, the trigger event will be dete
condition. If no trigger conditions on edges have been set for any signals, trigger events on edges
will never occur.
.
AT
-LA500 – U
SER MANUAL
Triggering
T
Trigger Module
Trigger) to generate a trigger event like
The Trigger Condition is available only for Digital Pattern set as Master device. If the device has
been set as slave, it will receive the trigger event
Edges and Levels
For each signal it is possible to indicate whether the trigger condition must be detected on a rising
edge, on a falling edge or for any of the two edges. When the trigger conditions have been set on
edges of several signals, the trigger event will be dete
condition. If no trigger conditions on edges have been set for any signals, trigger events on edges
will never occur.
.
allows setting
Don’t care (the signal will be ignored);
High logic level;
Low logic level;
Risin
Falling edge;
Any edge;
a trigger condition on
a logic analyzer.
Ch (
XSS bus (SDK mode only).
rmined by the occurrence of
..0) and on Vector(
) (Extended
at least one
he
in
35
39
from AT-
g edge;
Page 71

AT-LA500 – USER MANUAL
Va
Sets a bus at the hexadecimal value entered in the
adiacent control box.
To set the state on a channel, click on the row correspondent to the channel to be set in the table on
the right side of the window (note that the column Signal Names contains the user defined names
for the signals to acquire).
To set a condition, click on the desired button on the top. If more than one signal is selected, the
same level or edge setting will be applied to all the selected signals.
It is also possible to set a level setting to all selected signals by writing its value in hexadecimal
format then clicking the Va button.
Conditions on edges
For each signal it is possible to indicate whether the trigger condition must be detected on a rising
edge, on a falling edge or for any of the two edges.
When the trigger conditions have been set on edges of several signals, the trigger event will be
determined by the occurrence of at least one condition.
If no trigger conditions on edges have been set for any signals, trigger events on edges will never
occur.
Conditions on logic levels
For each signal it is possible to indicate whether the trigger condition must be detected on a high or
a low logic level. When the trigger conditions have been set on logic levels of several signals, the
trigger event will be determined by the occurrence of all conditions simultaneously.
If no trigger conditions on logic levels have been set for any signal, the trigger conditions on logic
levels are always considered as verified.
The trigger condition set on logic levels is useful when the trigger event must be detected for a
specific pattern.
By using the Level Condition: menu ring it is possible to select among several conditions for trigger
events on logic levels.
Trigger when EQUAL:
Trigger when NOT
EQUAL:
Trigger when
CHANGED:
The trigger event occurs when the state of the evaluated
signals is equal to the specified pattern;
The trigger event occurs when the state of the evaluated
signals is different from the specified pattern;
The signals selected for a trigger event on logic levels are
examined when data acquisition starts. These sampled
values will constitute the reference pattern. The trigger
event occurs when the state of the selected signals is
different from the reference pattern.
The conditions chosen by the user on logic levels are
ignored. AT-LA500 will simply use the information
related to which channels are to be examined for trigger
detection.
RELEASE 3.4 – JUNE 2009 71
Page 72

AT-LA500 – USER MANUAL
Relationship between trigger conditions
A relationship between trigger conditions on edges and trigger conditions on logic levels can be set
by the user, by using the Trigger condition menu ring. Several options are available:
Edge OR Level
Edge AND Level A trigger condition occurs when an edge condition and a logic
Edge BEFORE
Level
Edge AFTER Level A trigger condition occurs when an edge condition has been
ALWAYS A trigger condition occurs automatically when data acquisition
NEVER Trigger is inhibited. Any setting on edges or on logic levels
A trigger condition occurs when one between an edge
condition or a logic level condition is detected
level condition are satisfied simultaneously
A trigger condition occurs when an edge condition has been
detected at least once before that on logic levels
detected at least once after that on logic levels
starts. Any setting on edges or on logic levels will be ignored
will be ignored. A trigger event, however, can be activated
manually during data acquisition
RELEASE 3.4 – JUNE 2009 72
Page 73
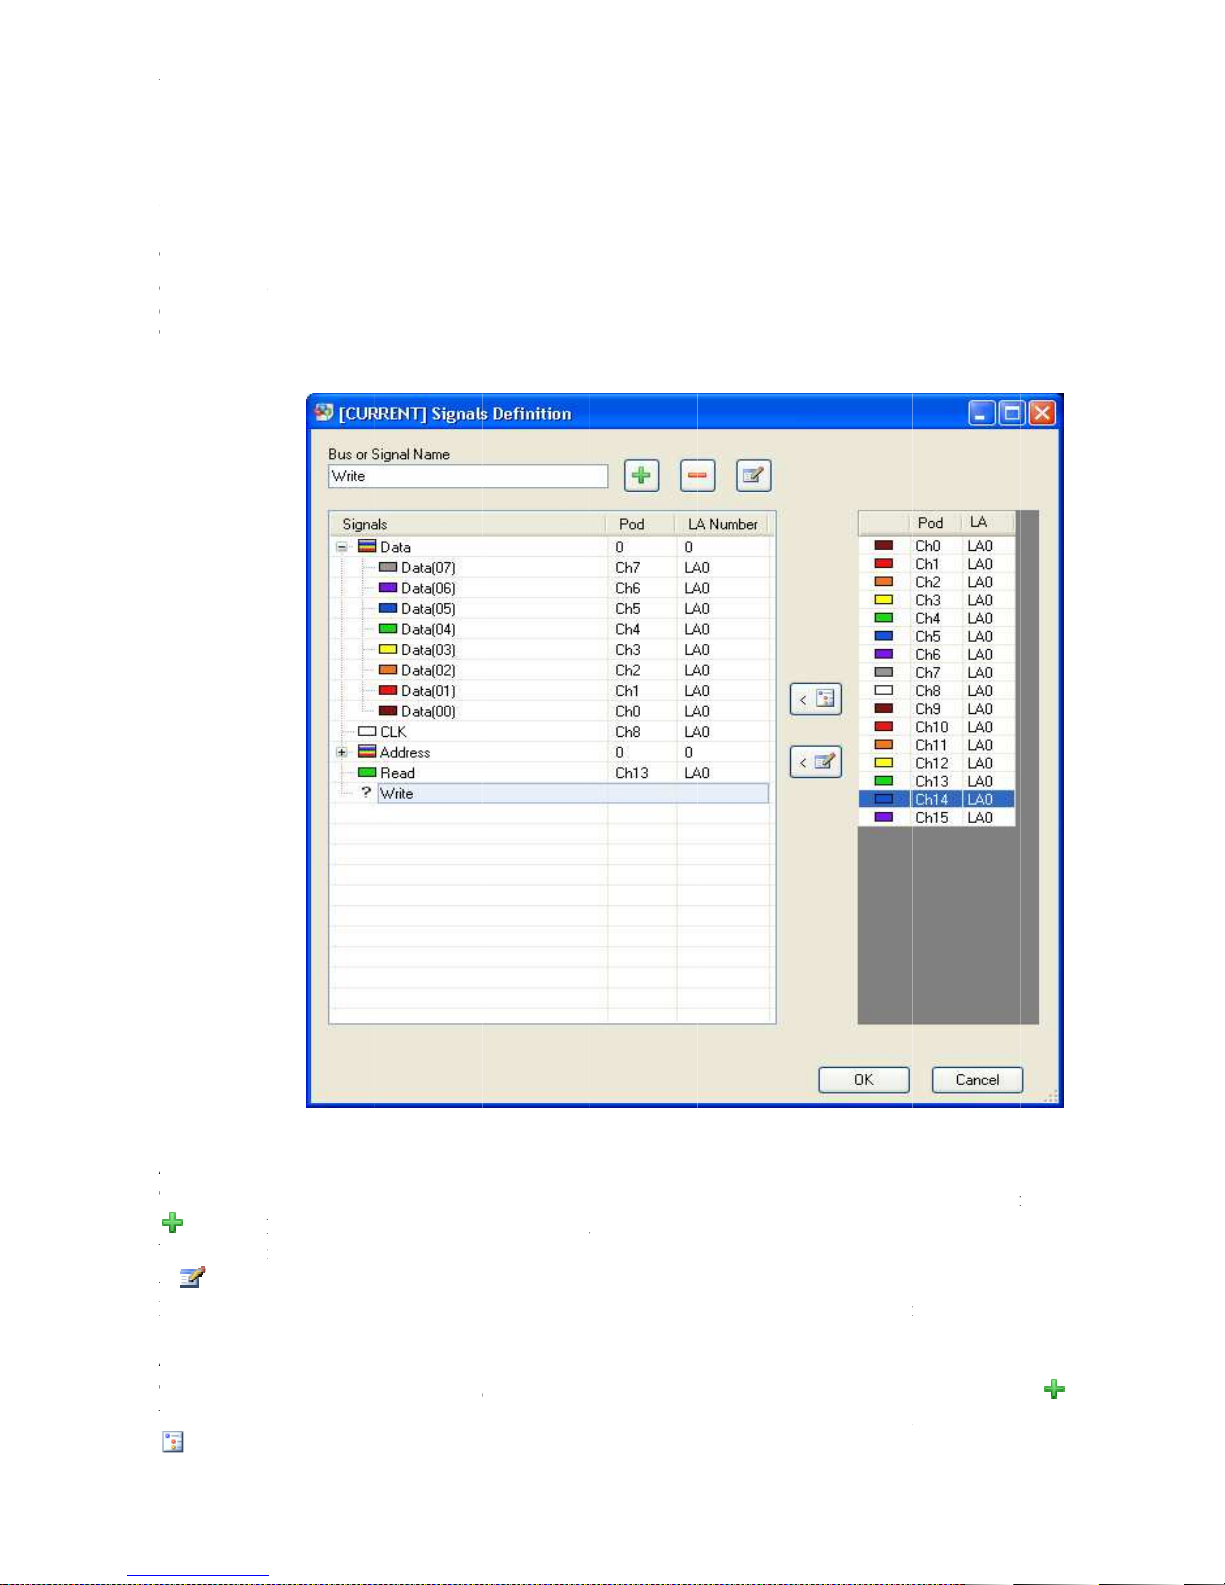
AT
Signal Definition
This panel allows defining a list of signals or bus and choosing their correspondence to the channels
of the AT
Only the signals defined in this panel can be viewed in the
The right table shows all the AT
Add a signal
To add a signal to the list, write the desired name in the
between signal name and channel. It is also possible to select the desired channel row and click the
<
Both these methods can be used also to chang
Add a bus
To add a bus to the list, write the desired name in the
button. Then select the rows of the channels that will form the bus in the right table. Click on the <
AT
-LA500 – U
SER MANUAL
Signal Definition
This panel allows defining a list of signals or bus and choosing their correspondence to the channels
of the AT
LA500
Only the signals defined in this panel can be viewed in the
The right table shows all the AT
Add a signal
To add a signal to the list, write the desired name in the
button. then double click on the desired channel row of the right table to set the correspondence
between signal name and channel. It is also possible to select the desired channel row and click the
< button.
Both these methods can be used also to chang
Add a bus
To add a bus to the list, write the desired name in the
button. Then select the rows of the channels that will form the bus in the right table. Click on the <
tton to add all selected signals to the bus.
Digital Pattern Generator.
LA500
channels and the colors of the correspondent wires.
e any previously defined correspondence.
Bus or Signal Name
Bus or Signal Name
Digital Editor
or Data Editor w
box and click on the
box and click on the
indows.
-
-
bu
Page 74

AT
Both these methods can be used also to change any previously defined correspondence.
Remove a signal or a bus
To remove a signal or a bus, select it then click on
Edit a signal or bus name
To change the name of a signal, select it, change its name in the
the
AT
-LA500 – U
SER MANUAL
Both these methods can be used also to change any previously defined correspondence.
Note
Remove a signal or a bus
To remove a signal or a bus, select it then click on
Edit a signal or bus name
To change the name of a signal, select it, change its name in the
the button.
To choose more than one channel keep pressed the Ctrl key and click on the desired
channels. To choose a group of consecutive channels, click on the first one, keep
pressed the Shift key, then click on the last one. All the channels between the first and
he last will be selected.
button.
Bus or Signal Name
box and click
:
t
the
Page 75
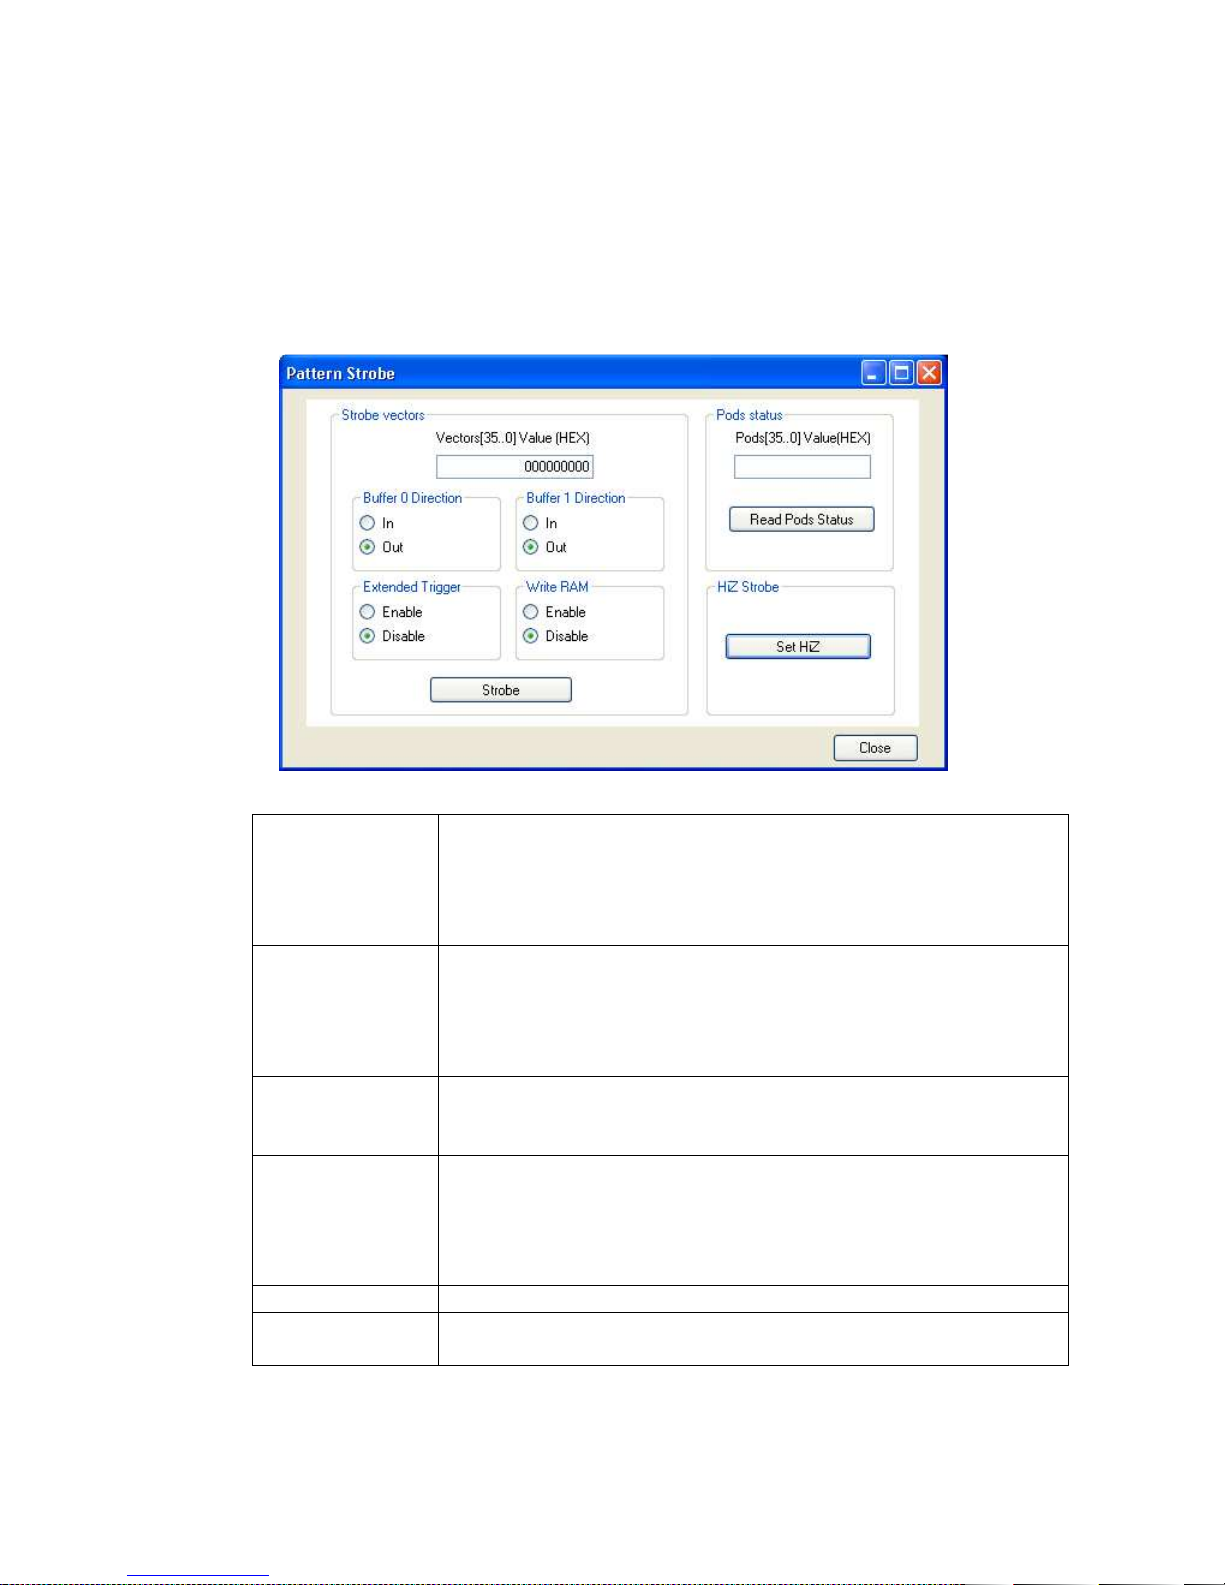
AT-LA500 – USER MANUAL
Strobe
This panel allows assigning values to Digital Pattern Generator pins, read their status or setting
them in a high impedance state.
Strobe Vectors It allows assigning a value to Vectors[15..0], to the Extended
Trigger signal and to Write RAM signals. By pressing the Strobe
button the output channels will change their logic levels to the
assigned ones.
Pods status The Digital Pattern Generator can also operate in Sampler mode.
Channels change their behavior from outputs to inputs.
When the Read Pods Status button is pressed, the logic level of
each input can be examined in real time.
HiZ Strobe By pressing the Set HiZ button all channels will go in a impedance
state
Buffer 0/1
Direction
It controls the direction of the output buffer 0 (Ch 17..0) and the
direction of the buffer 1(35..0). If Out is selected, the direction is
output (generation mode), if In the direction is input (acquisition
mode)
Extended Trigger Extended trigger input enabled or disabled
Write RAM Active high signal. If high (Enable), the AT-LA500 Pattern stores
the current channel value in the SRAM memory.
RELEASE 3.4 – JUNE 2009 75
Page 76
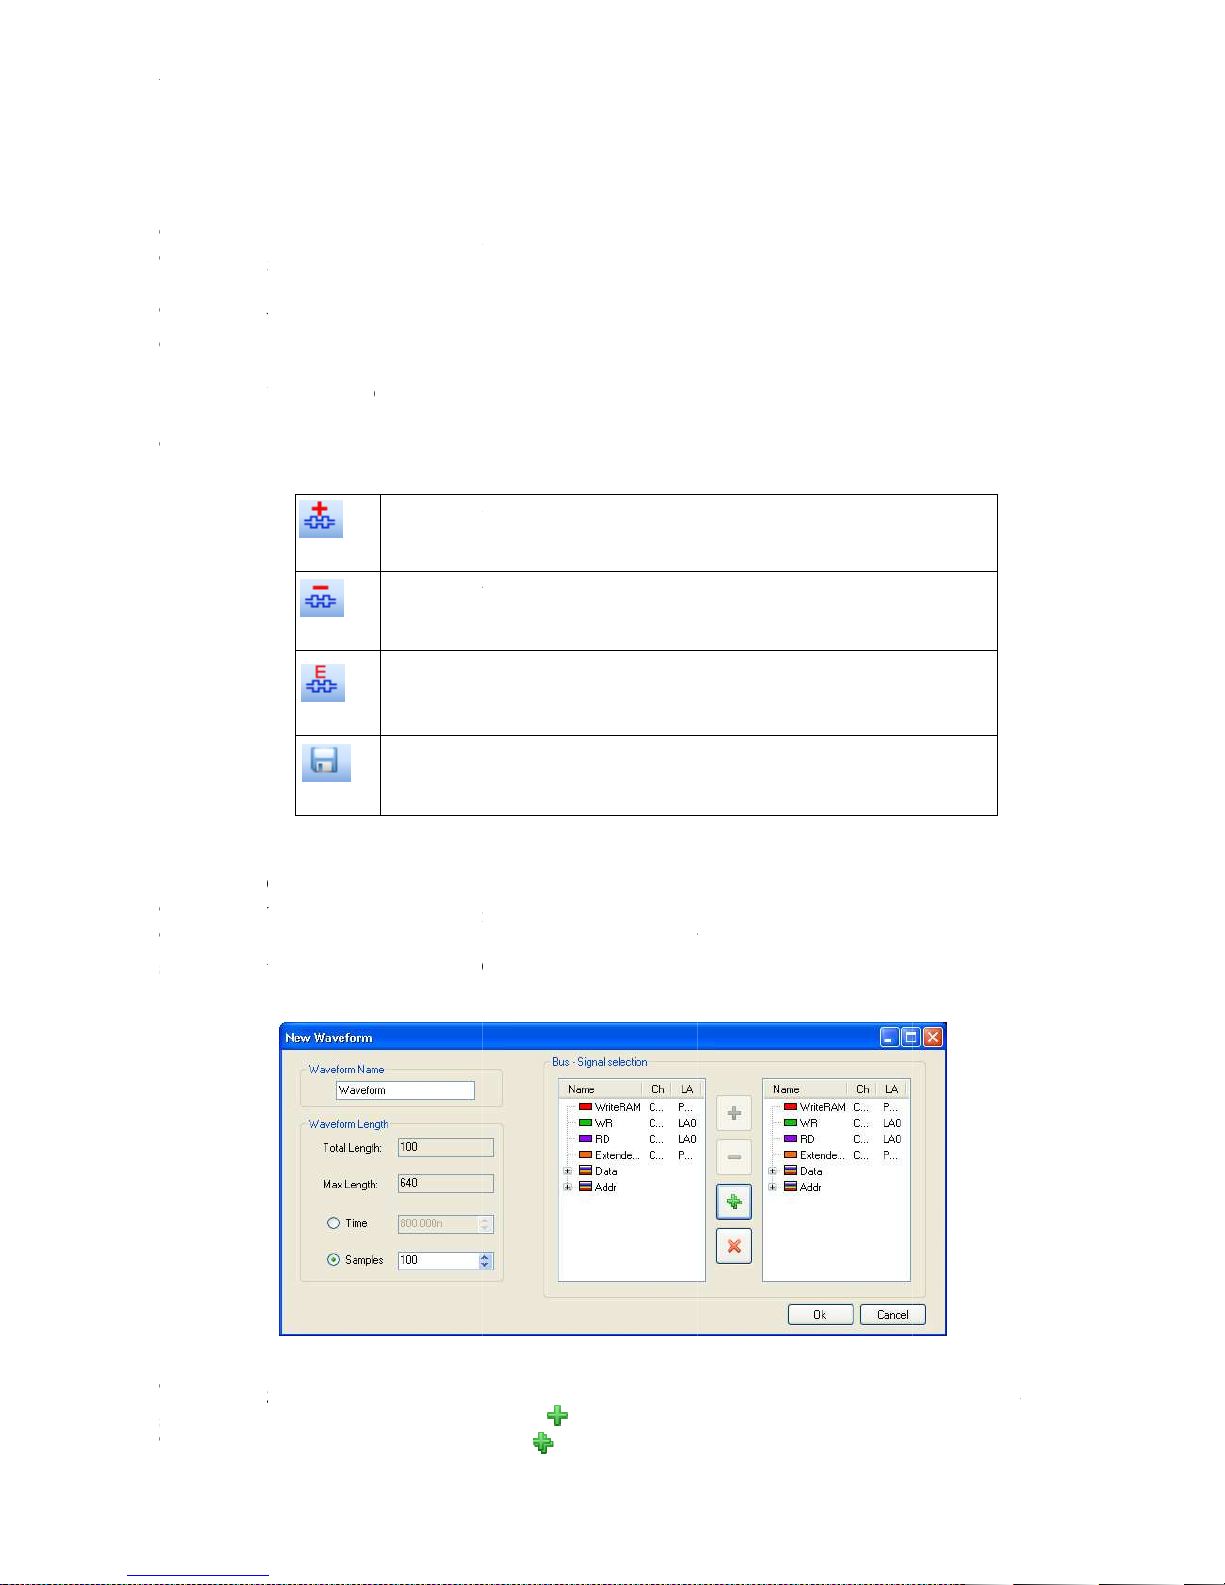
AT
Digital Editor
This windows allows editing digital waveforms.
The user can
the sequencer will recall during its operations.
This windows presents many commands in the Menu Bar. They will be described separately,
depending on their role.
Basic Waveform
These commands operate on waveforms
New Waveform window
The New Waveform window is opened when the
The New Waveform Window allows
signals that will be inserted in the
To add a signal or a bus to the list of the ones that will be shown in the
select it on the left side table and click
To add all signals at a time, just click on
AT
-LA500 – U
SER MANUAL
Digital Editor
This windows allows editing digital waveforms.
The user can
the sequencer will recall during its operations.
This windows presents many commands in the Menu Bar. They will be described separately,
depending on their role.
Basic Waveform
These commands operate on waveforms
New Waveform window
The New Waveform window is opened when the
The New Waveform Window allows
signals that will be inserted in the
To add a signal or a bus to the list of the ones that will be shown in the
select it on the left side table and click
To add all signals at a time, just click on
the vector/control memory (
Comman
s
Digital Editor
Add waveform. When the
New Waveform window is opened.
Remove waveform
Modify waveform
Save waveforms and sequencer instructions
defining
button
samples) in blocks called waveforms that
Add waveform
the waveform length in samples or time and the
Add Waveform
button is pressed.
button is pressed, the
Digital Editor
window,
segment
640
d
Window.
the
.
.
Page 77
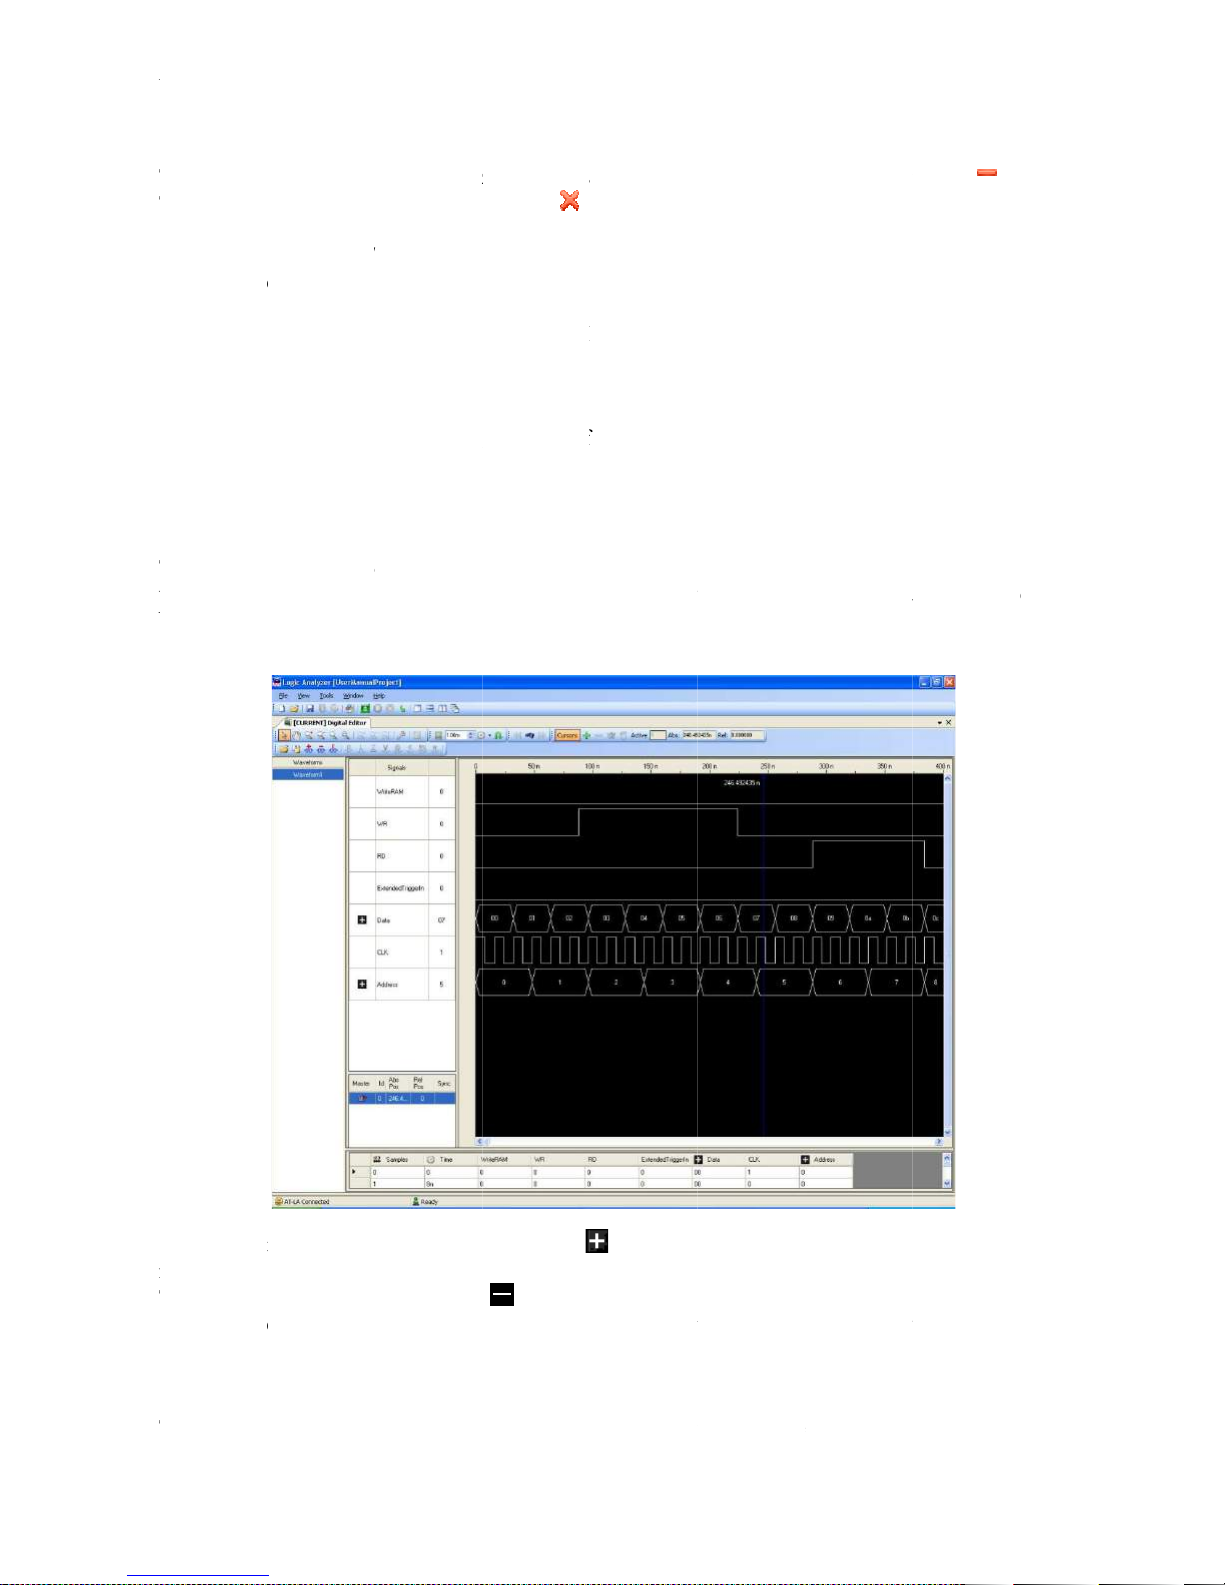
AT
To remove a signal from the visualization list, select
To remove all signal at a time, just click on
WriteRAM
functions are:
Digital Editor Window
The
waveforms. Single signals are visualized as digital signals, while grouped signals are represented as
buses.
In the
name
The icon of an opened bus becomes
It is possible to drag and drop the waveforms and change their order, to help the user to focus the
time relatio
In the same way, it is also possible to insert a signal into an opened bus or to extract a waveform
from it.
To resize the signals amplitude, just drag the line betwee
AT
-LA500 – U
SER MANUAL
To remove a signal from the visualization list, select
To remove all signal at a time, just click on
WriteRAM
functions are:
WriteRAM
Extended Trigger
IN
Digital Editor Window
The
Digital
waveforms. Single signals are visualized as digital signals, while grouped signals are represented as
buses.
In the
Digital Editor
name
to open a bus.
The icon of an opened bus becomes
It is possible to drag and drop the waveforms and change their order, to help the user to focus the
time relatio
nship between edges. To do this, click on a signal name and drag it in the new position.
In the same way, it is also possible to insert a signal into an opened bus or to extract a waveform
from it.
To resize the signals amplitude, just drag the line betwee
Extended Trigger IN
Window allows editing data in a graph containing digital waveforms or analog
, a bus is indicated by a
if it goes high, the Digital Pattern Generator stores data on its
memory (up to
it works like an internal trigger that can be used to generate a
trigger event for Trigger Module.
. Double click on it to close a bus.
it on the right side table and click on
are always present in the new waveform
samples).
icon on the left
n signals name.
of its name.
Double click on it
T
.
.
and
signals
.
heir
2M
Editor
s
Page 78

AT
On the right of every signal or bus name, a number indicates the value that this signal or bus
assumes at the time position of the master cursor (the cursors properties are described in the
Cursors
By clicking with the right mous
with these options:
Zoom
To move along the waveforms and to zoom, the
placed on the upper side toolbar:
AT
-LA500 – U
SER MANUAL
On the right of every signal or bus name, a number indicates the value that this signal or bus
assumes at the time position of the master cursor (the cursors properties are described in the
Cursors
chapter).
By clicking with the right mous
with these options:
Zoom
To move along the waveforms and to zoom, the
placed on the upper side toolbar:
Add samples scale
Analog mode display
Remove signals
e button on the signal name column, a shortcut menu will appear
Selection tool
Hand tool. Use the hand tool to pan the acquisition. Click and drag to move
Zoom In auto. Click
Zoom Out auto. Click to zoom out.
Zoom Manual. Select this tool to manually select the area to zoom. Click in
the start point of the Waveform View and drag the cursor to the end point
keeping the left mouse button pressed.
All. Click to fit the visualization to view all the acquisition time.
Analog Zoom in. Click to zoom in the selected analog waveform (if
Select this option to add a signal, indicated by a
with a series of interval that represents the number of
samples.
This option (available only for the buses) will represent a
bus as an analog waveform.
This is useful for example if an ADC or a DAC has to be
This option allows adding
Digital Editor
to zoom in.
Digital Editor
or remov
window provides many instruments,
icon,
signals to the
tested.
Add-
ing
.
it.
Zoom
present)
Page 79

AT
AT
-LA500 – U
SER MANUAL
Analog Zoom out. Click to zoom out the selected analog waveform (if
Analog Autoscale. C
lick to fit the selected analog waveform amplitude
present)
Page 80
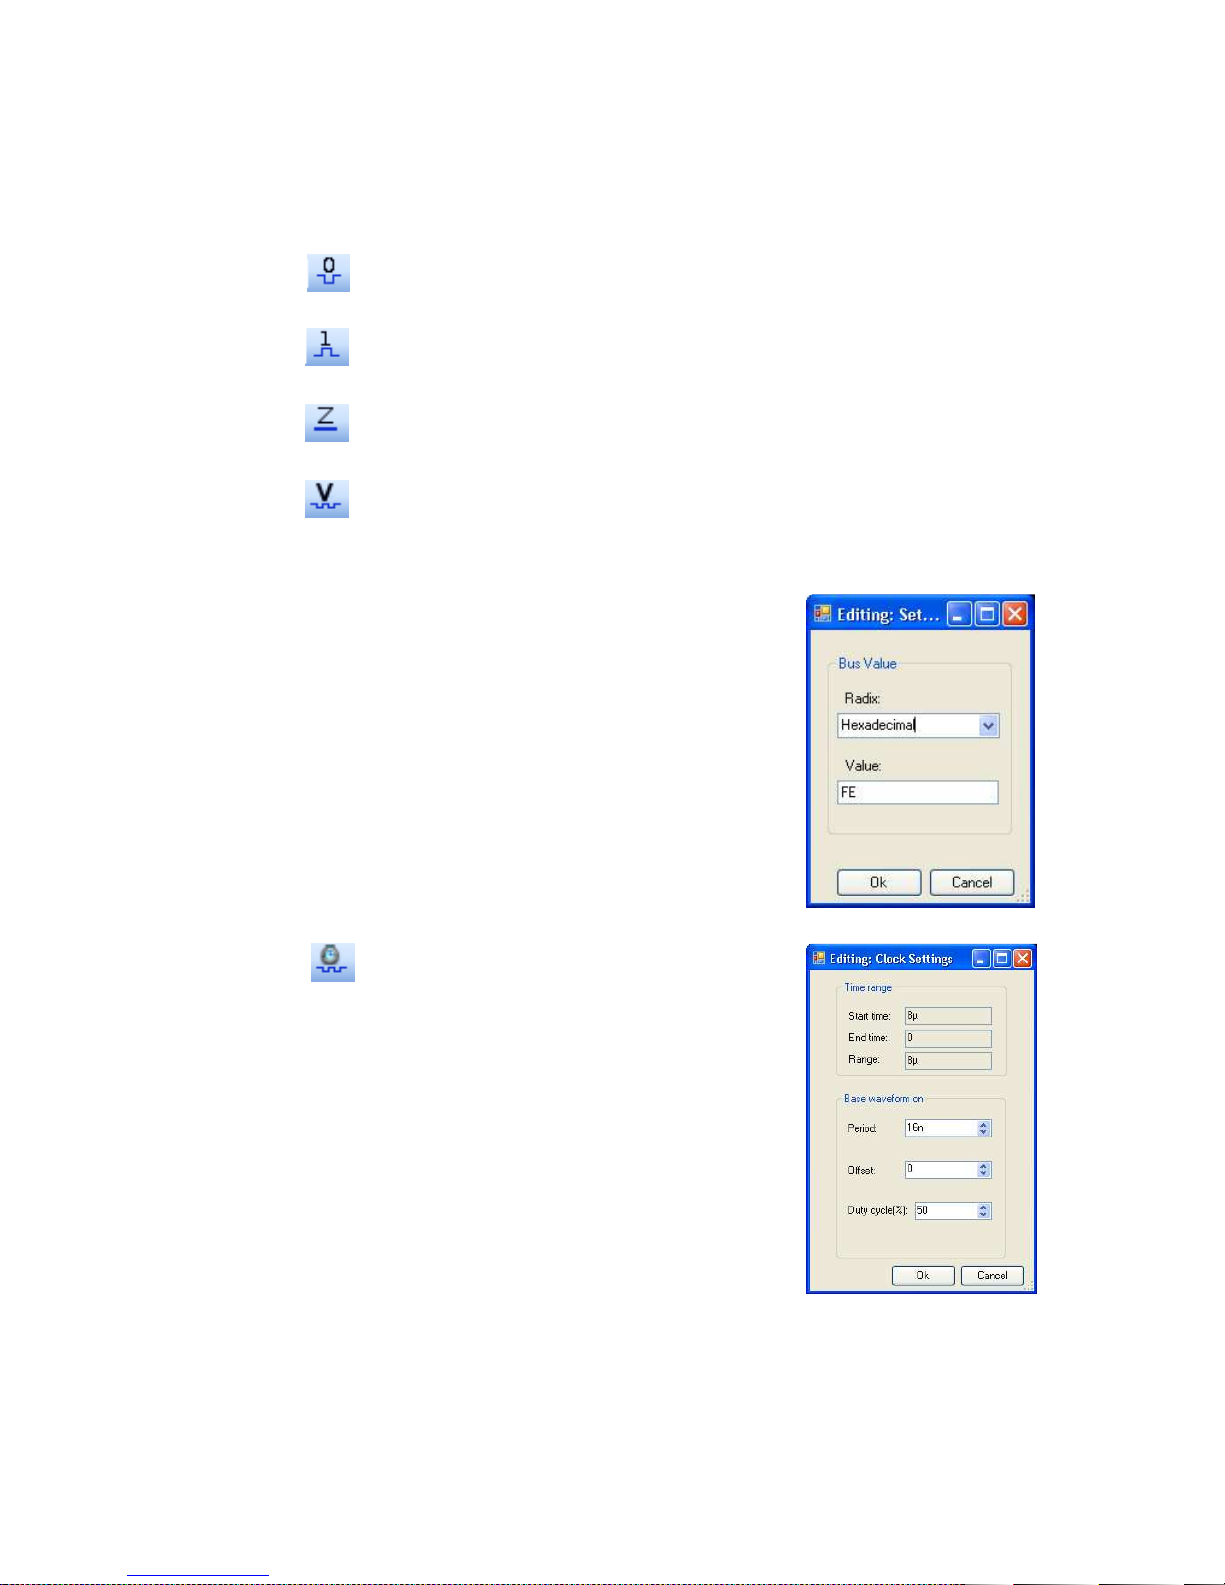
AT-LA500 – USER MANUAL
Arbitrary Value allows overwriting a node value over the selected
To overwrite a node value perform the
toolbar. The
Specify the new value you want overwritten
feature can be used to
automatically generate the clock wave, rather
The start and end time of a clock signal can
Digital Editor Window Toolbar
Several commands allow operating on the waveforms. In particular:
Signal/bus to 0
Signal/bus to 1
Signal/bus to High Impedance
Signal/bus to Arbitrary Value.
waveform, waveform interval, or across one or more nodes or groups.
following steps:
Select a node or a bus and click the Value
button on the Digital Editor
Arbitrary Value dialog box appears.
In the Radix list, select the radix type.
in the Numeric or named value box.
Click OK.
Clock Editor for selected signal.
The Clock
than drawing each clock triggering pulse.
be selected.
RELEASE 3.4 – JUNE 2009 80
Page 81
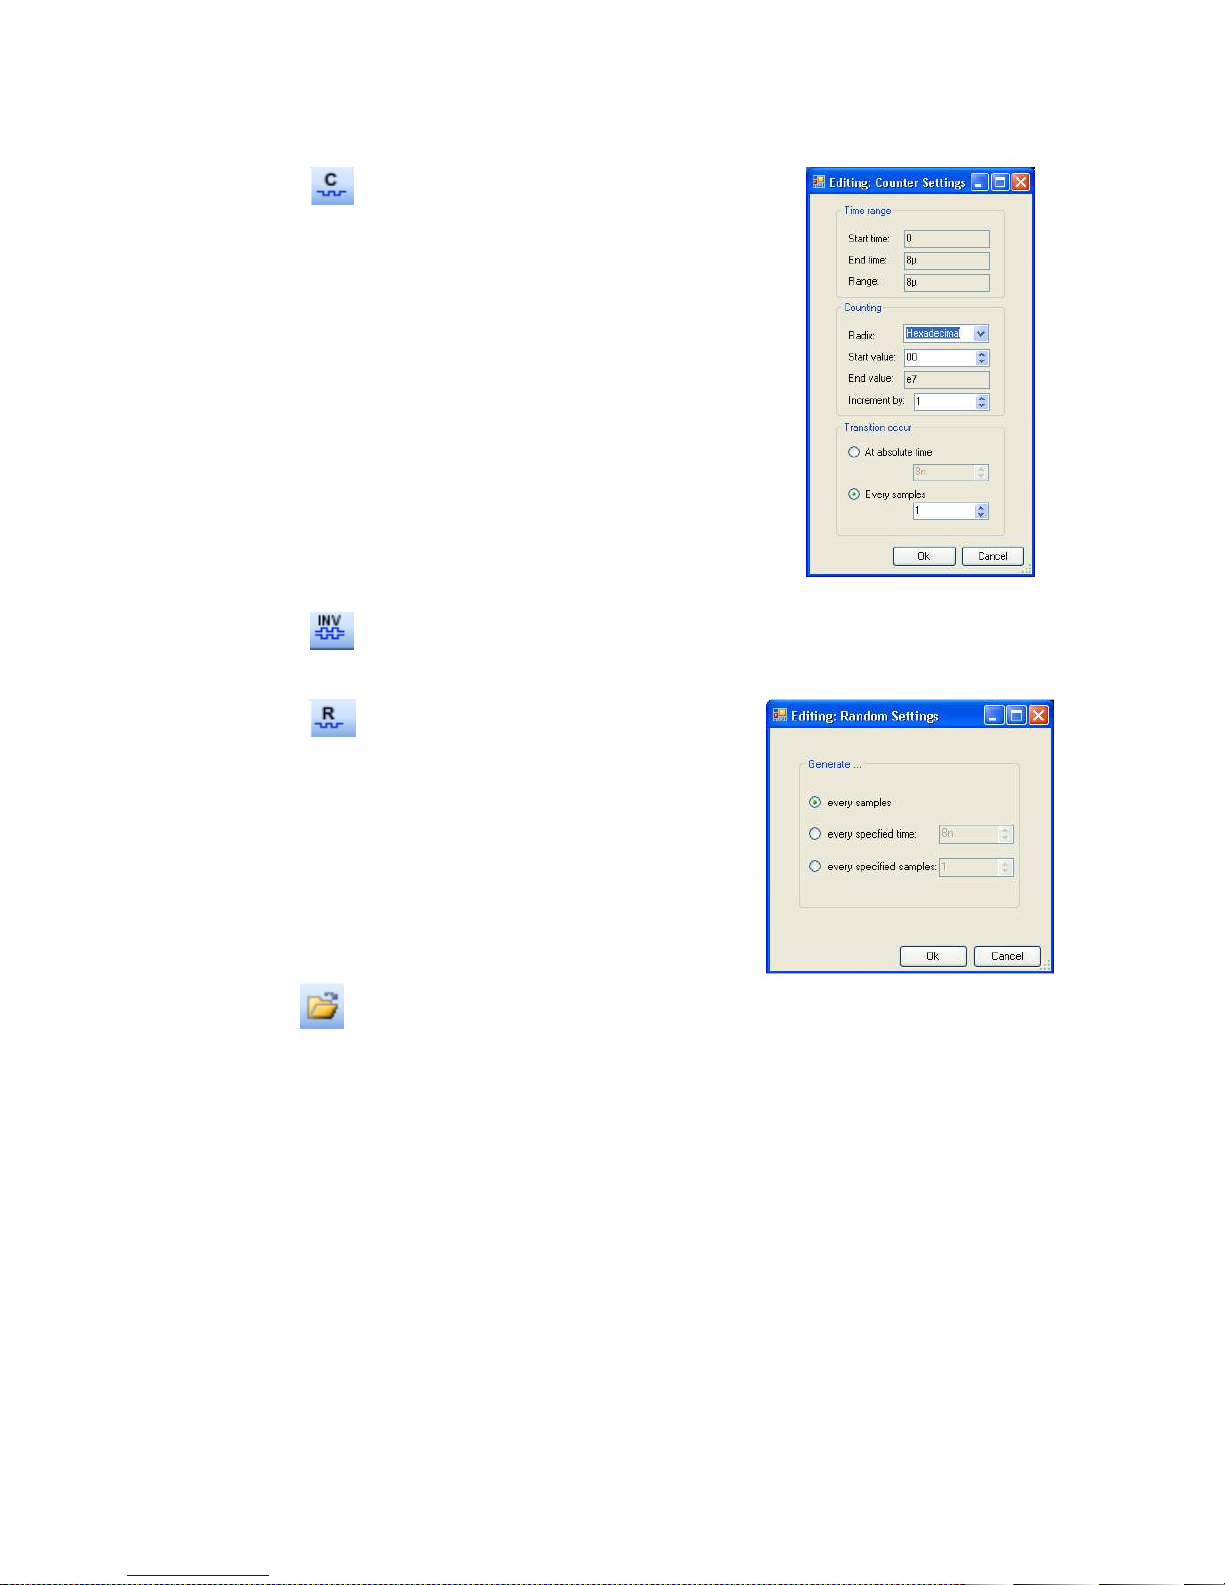
AT-LA500 – USER MANUAL
Counter editor applies a count value to a bus
to increment the value of the bus by a
Instead of manually editing the values for
each node, the Counter editor automatically
es specifying a starting
value for a bus and the time interval to
random
node values over the selected waveform,
or more
andom node values by every grid
interval, every specified time or at fixed
file. The
file is encoded using the CSV (Comma
line in
the CSV file corresponds to a row in the
ithin a line, fields are
separated by commas, each field
The first row contains the pod index with
character #, for example #1
signal, #39 is
signal (please
Next rows contain the pod values: only
values 0,1,2 are allowed. 0 is the low
logical level, 1 is the high logical level
Counter Editor for selected bus.
specified time interval.
creates the counting values for buses.
This feature enabl
increment by.
Invert signal/bus value.
Random Value for signal/bus.
Random Value allows generating
waveform interval, or across one
nodes or groups.
R
intervals can be generated.
Import Data.
Import waveforms from a .csv
Separated Values) format, each
table and w
belonging to one table column.
the prefix
stands for Pod 1.
Note: #38 is the Write Ram
the Extended Trigger IN
see above for description).
RELEASE 3.4 – JUNE 2009 81
Page 82

AT-LA500 – USER MANUAL
The imported data will be visualized on
the Digital Editor Window and on the
, but only data corresponding
to bus/signals added on the Digital Editor
Instrument settings cannot be imported,
sualized with the
Export waveforms to a .csv file. The file
is encoded using the CSV (Comma
each line in
the CSV file corresponds to a row in the
table and within a line, fields are
separated by commas, each field
The first exported row contains the pod
index with the prefix character #, for
signal, #39 is
signal (please
Next exported rows contain the pod
values: only values 0,1,2 are allowed. 0
is the low logical level, 1 is the high
logical level and 2 is the high impedance
Only data corresponding to bus/signals
dded on the Digital Editor Window will
and 2 is the high impedance state (HiZ).
Data Editor
Window will be imported.
the data will be vi
current user settings.
Export Data.
Separated Values) format,
belonging to one table column.
example #1 stands for Pod 1.
Note: #38 is the Write Ram
the Extended Trigger IN
see above for description).
state (HiZ).
a
be exported.
Instrument settings cannot be exported.
RELEASE 3.4 – JUNE 2009 82
Page 83
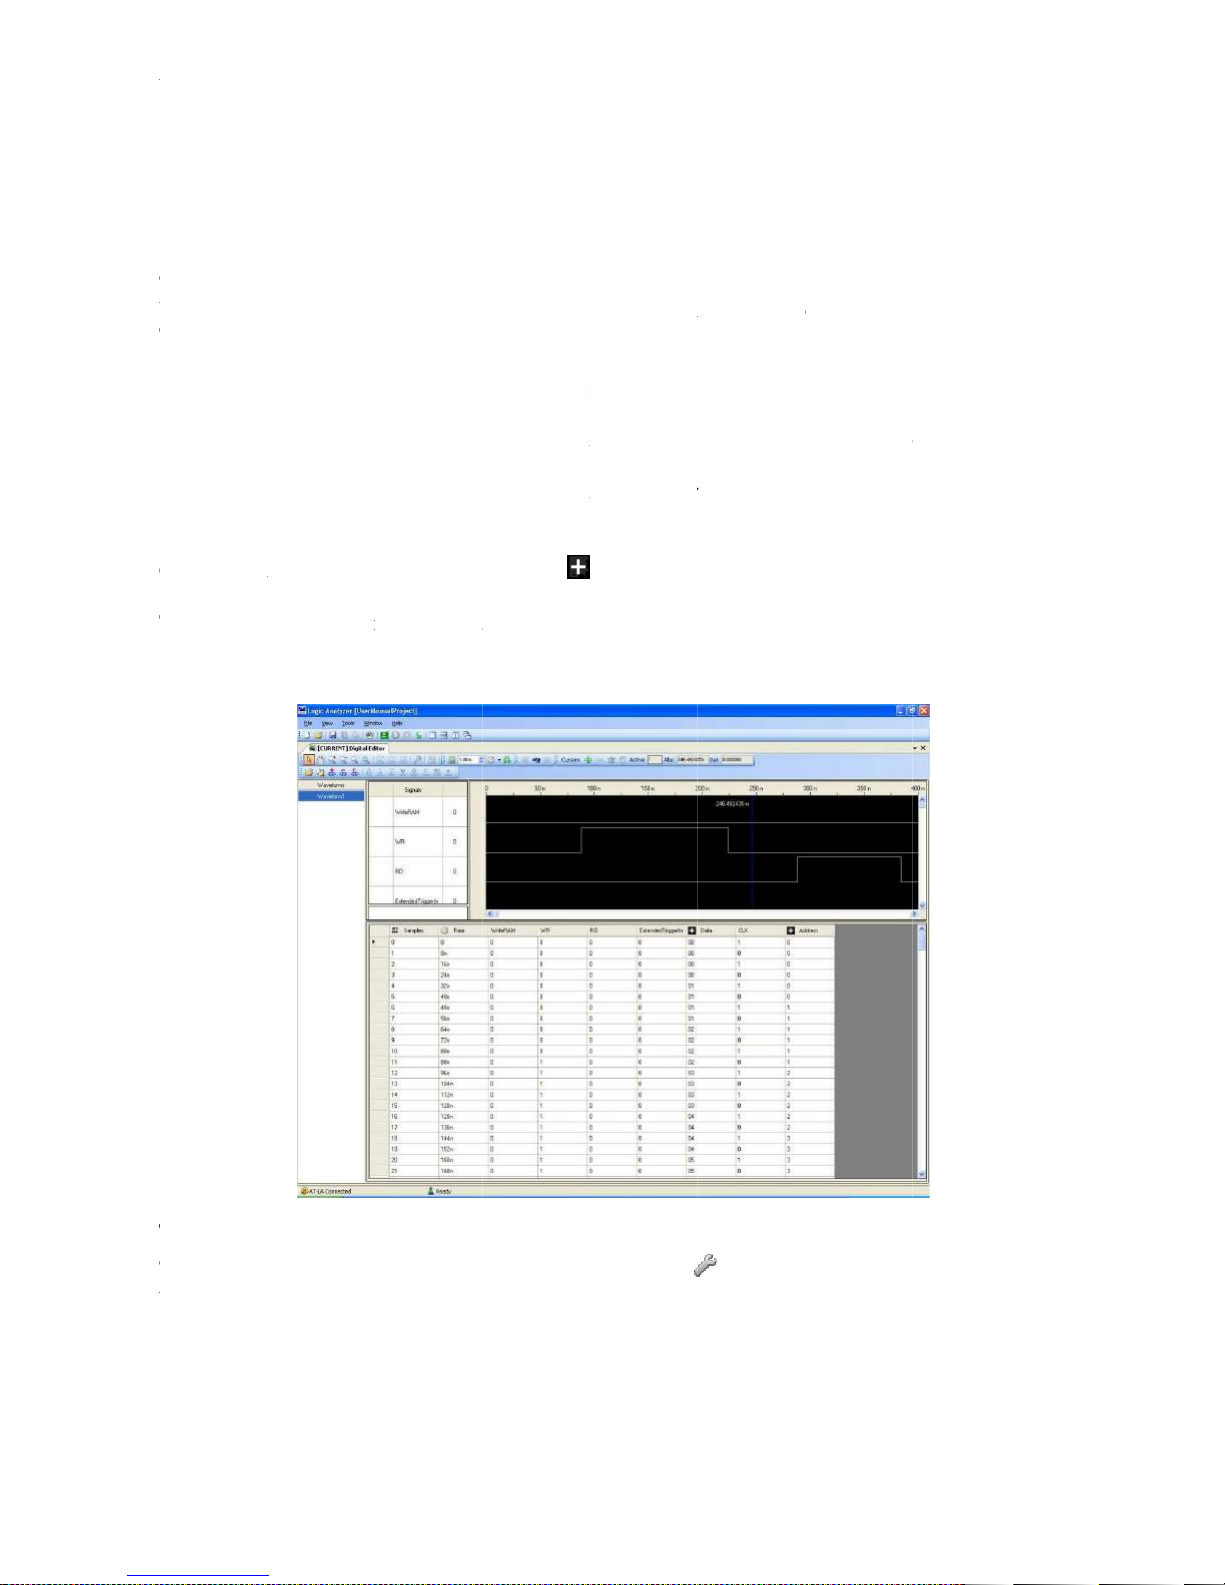
AT
Data Editor
T
Within the
The modifications will also appear on the
In the Data Editor two additional columns are present
On the Data Editor, a bus is indicated by
It is possible to click on it to open a bus.
To resize the columns amplitude, just drag the line between signals name.
Waveform View Settings
To change the graph
window will be shown.
AT
-LA500 – U
SER MANUAL
Data Editor
T
Data Editor
Within the
Data Editor
The modifications will also appear on the
In the Data Editor two additional columns are present
On the Data Editor, a bus is indicated by
It is possible to click on it to open a bus.
To resize the columns amplitude, just drag the line between signals name.
Waveform View Settings
To change the graph
window will be shown.
be used
, data
Samples
Time
or signal
to edit
properties, click on the
It is composed by two tabs:
signal/bus values
data are visualized
Digital Editor
contains the progressive number of the acquired samples
It contains
in numerical format.
numerically in columns
placed above it
the progressive absolute time of every sample
icon on the left of its name.
Graph property
icon. The Waveform
and
Signals prope
Settings
he
can
where
.
.
:
column
column
It
the
View
rty.
Page 84
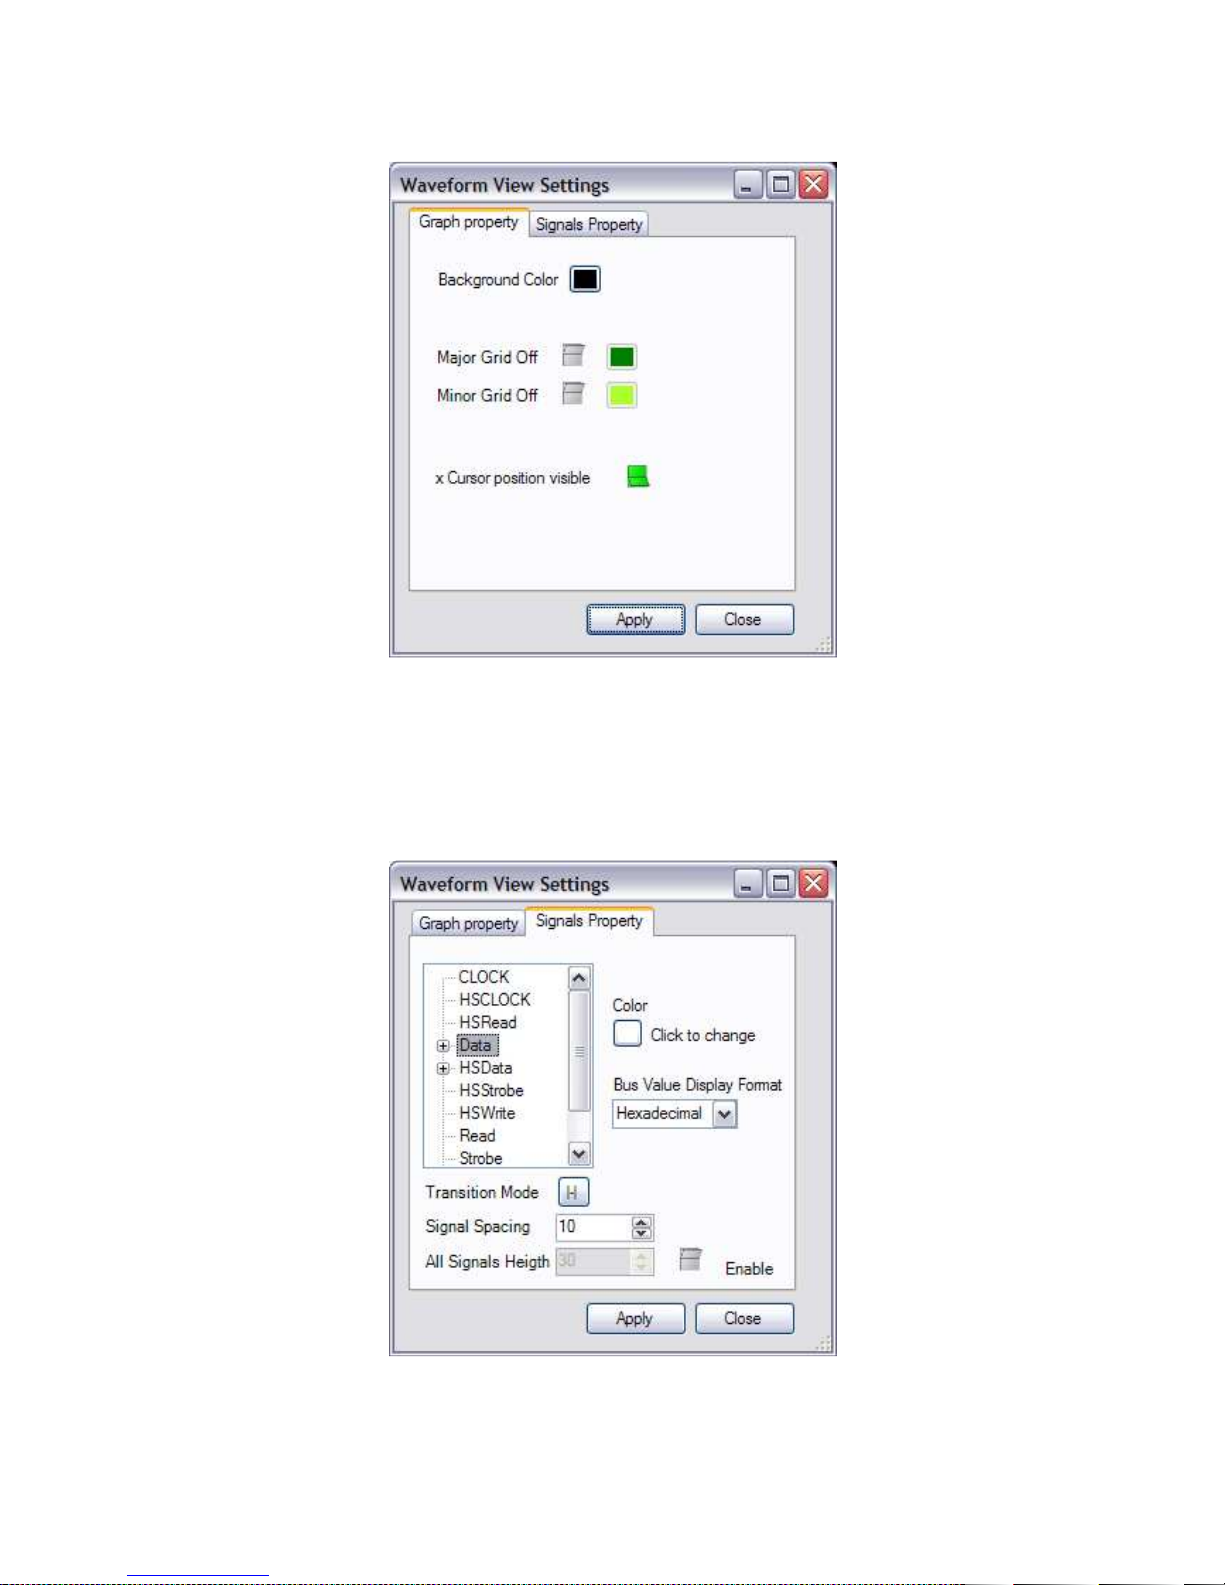
AT-LA500 – USER MANUAL
In the Graph property tab it is possible to change the graph background color by clicking on the
Background Color box.
By clicking the Major Grid and the Minor Grid switches it is possible to show or hide the vertical
grids and to choose their colors.
By clicking the x Cursor position visible switch it is possible to show or hide the cursor position
indication near the cursors.
In the Signals Property tab it is possible to change the color of a single signal, the representation of
the value of a bus, the transition visualization mode, the space between signals and the height of all
signals.
RELEASE 3.4 – JUNE 2009 84
Page 85
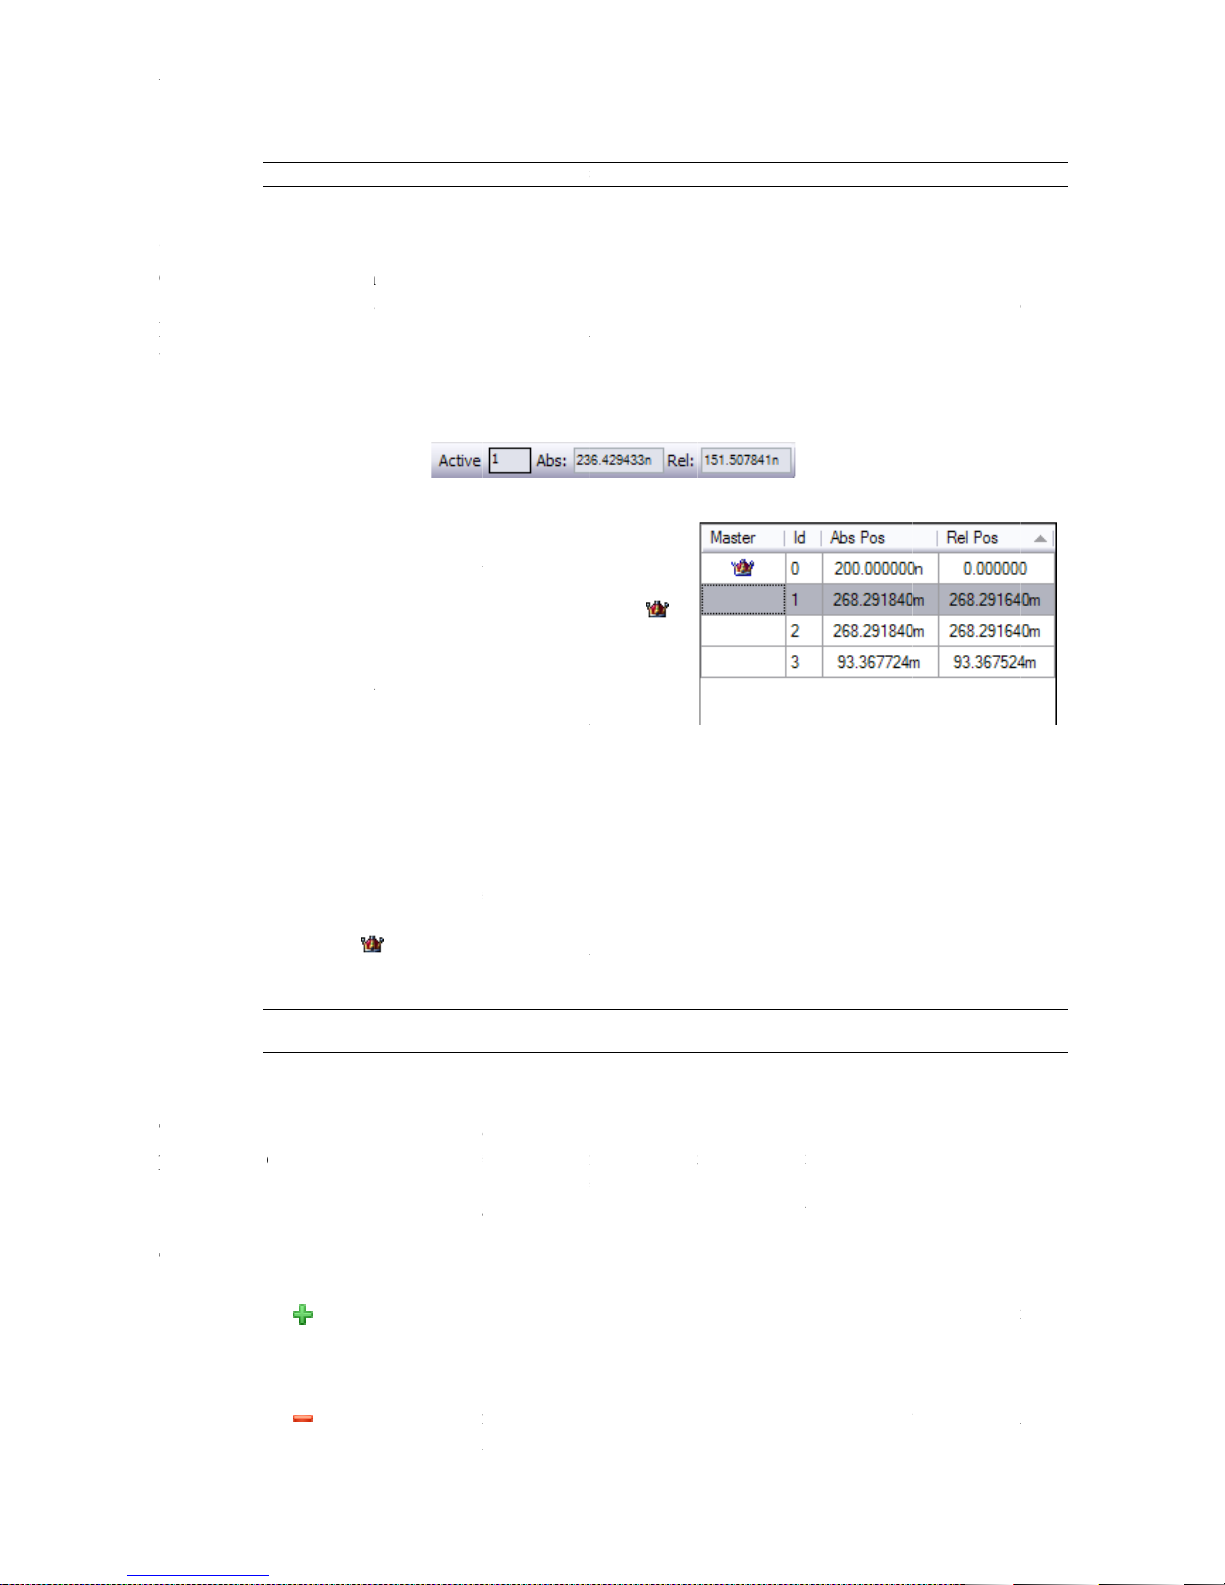
AT
Cursors
Cu
recognized or found easier. In addition cursors can be used to measure and to analyze acquired data.
By clicking on
window
In the
the Id of the cursor currently selected), and
The columns of the marker window show the progressive cursor identifier, the absolute time
position (the time distance between the cursor position and the start of the
relative time position (the time distance between the cursor and the master cursor).
the cursors is moved, all the values are automatically updated and shown.
The following command allow operating on cursors
AT
-LA500 – U
SER MANUAL
Note:
Cursors
Cu
rsors (also called markers) are useful to identify and enlighten data that, therefore, may be
recognized or found easier. In addition cursors can be used to measure and to analyze acquired data.
By clicking on
window
In the
Digital Editor
the Id of the cursor currently selected), and
Note
The columns of the marker window show the progressive cursor identifier, the absolute time
position (the time distance between the cursor position and the start of the
relative time position (the time distance between the cursor and the master cursor).
the cursors is moved, all the values are automatically updated and shown.
The following command allow operating on cursors
The minimum All Signals Height value is 20.
Markers
toolbar are also available
All cursors present in the
window are listed in the
The master cursor is identified by the
All relative positions will be calculated
with respect to the position of the master
The master cursor is
during a data search operation to show
To change the master cursor, select the
new cursor in the marker window and click
In the
label in the
moved automatically
icon in the
window, the master cursor is drawn in blue; all others cursors are drawn in
To add
visualization area
To remove a cursor
window than click on the key
Digital Editor
Absolute and Relative Positions
Digital Editor
marker window
Digital Editor
a cursor
toolbar,
indicators that show the active cursor (that is,
click on this key
select the cursor to be removed in the market
it is possible to show or hide the
A new cursor will be
acquisition) and the
marker
Any time one of
added to the
.
icon.
cursor.
its
some
.
.
results.
on the
toolbar.
:
yellow.
Digital Editor
Page 86
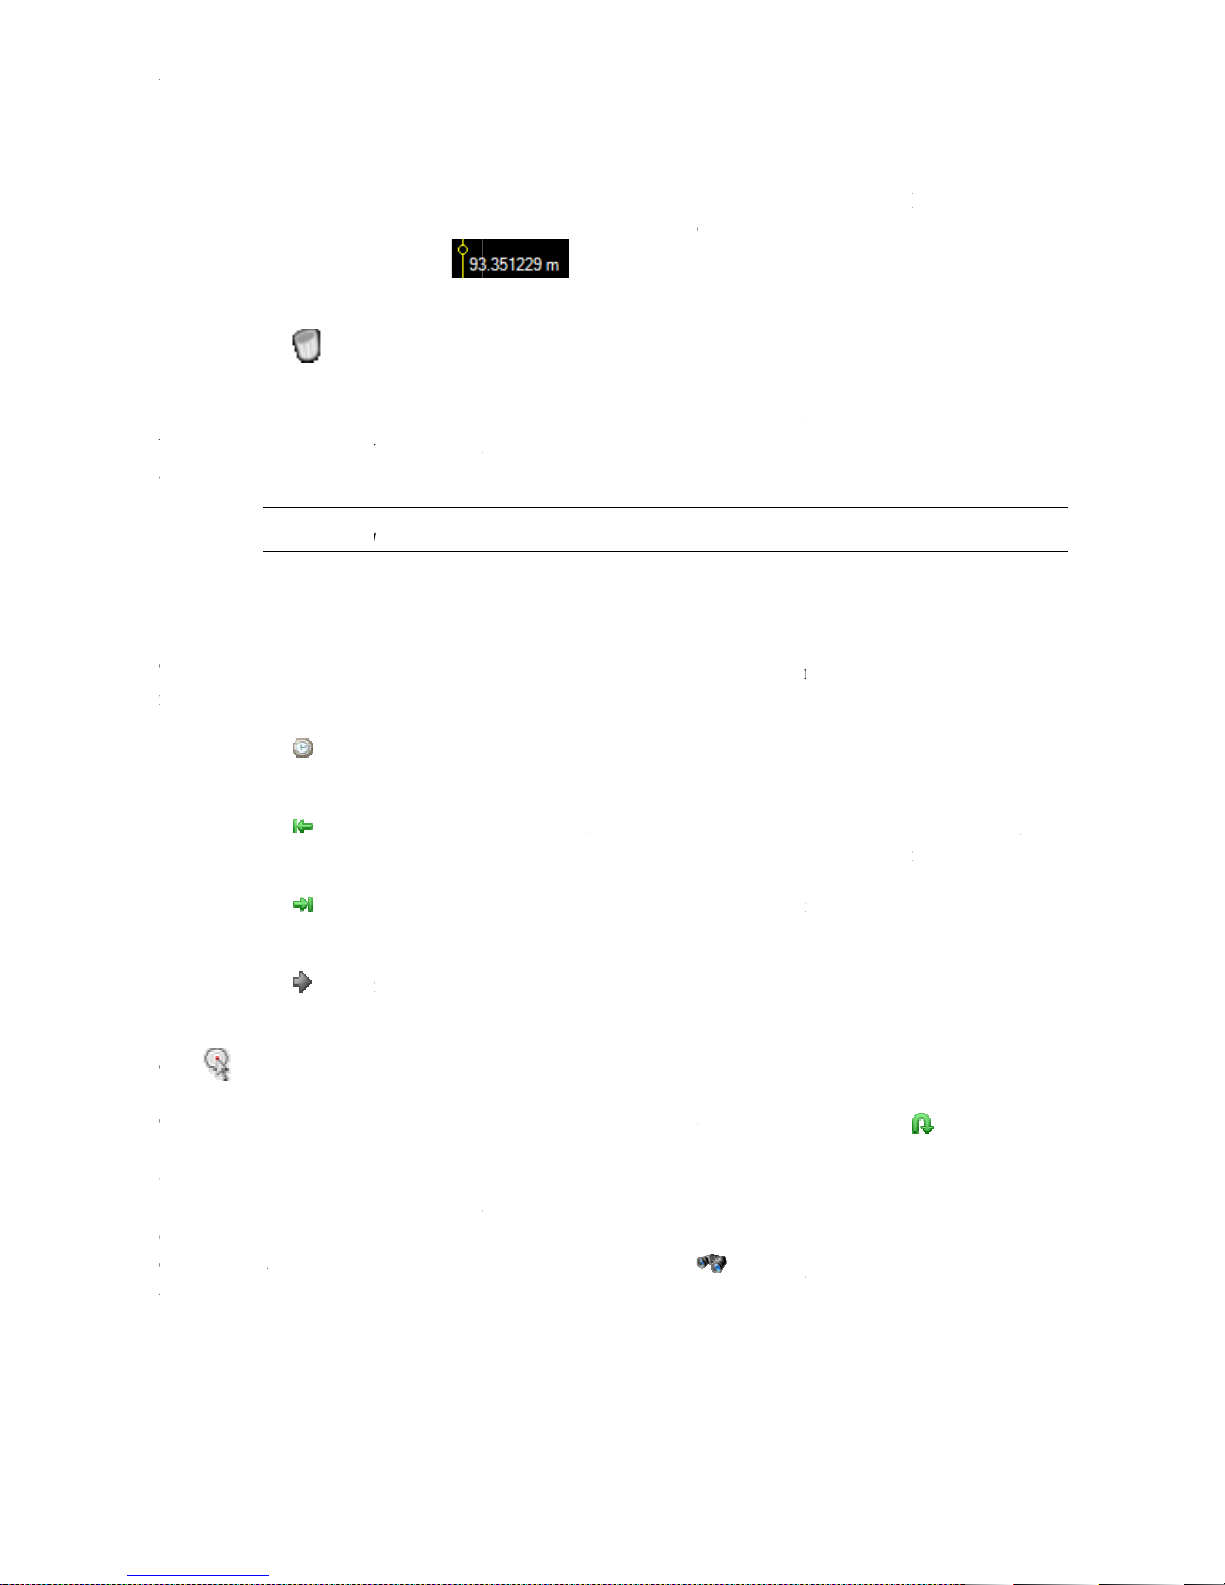
AT
It is also possible to add or remove cursors and set the master by clicking with the right mouse
button in the marker windows and by selecting the desired option in the shortcut menu that will
appear.
Go To a Selected Target
The
moved within the visualization area. The possible options in the
The
To move the selected
Search
In the
edge or a falling edge.
To activate the search option, click on the
will be opened, and search criteria can be entered.
AT
-LA500 – U
SER MANUAL
It is also possible to add or remove cursors and set the master by clicking with the right mouse
button in the marker windows and by selecting the desired option in the shortcut menu that will
appear.
Note
Go To a Selected Target
The
Go to option
moved within the visualization area. The possible options in the
The
key must be pressed to activate this operation.
To move the selected
Search
In the
Digital
edge or a falling edge.
To activate the search option, click on the
will be opened, and search criteria can be entered.
Drag on the
selected cursor
It is possible to remove all the cursors but
needed.
menu ring allows selecting the position where the master cursor is going to be
Go to time
Go to start samples
Go to end samples
Cursor
cursor
Editor it is possible to search a value related to a bus or, for a single signal, a rising
To move a cursor
cursor dot it is possible to move the cursor position indication:
To remove all cursors
to the middle of the current visualization, click on the
the master cursor is moved to the time position specif
the box close to the control
master cursor
visualization area starts with the acquisitio
master cursor
visualization area starts with the acquisition begin
The visualization area is centered on the cursor
Search Settings
drag on the selected cursor.
click on this key
The user, however, can create as many cursors as
is moved at the acquisition begin and the
is moved at the acquisition end and the
option
key and the Search Settings window
By dragging the
menu ring are:
n begin
By dragging the
ied in
n begin
:
one.
Go to
the
the
n:
n
icon.
Page 87
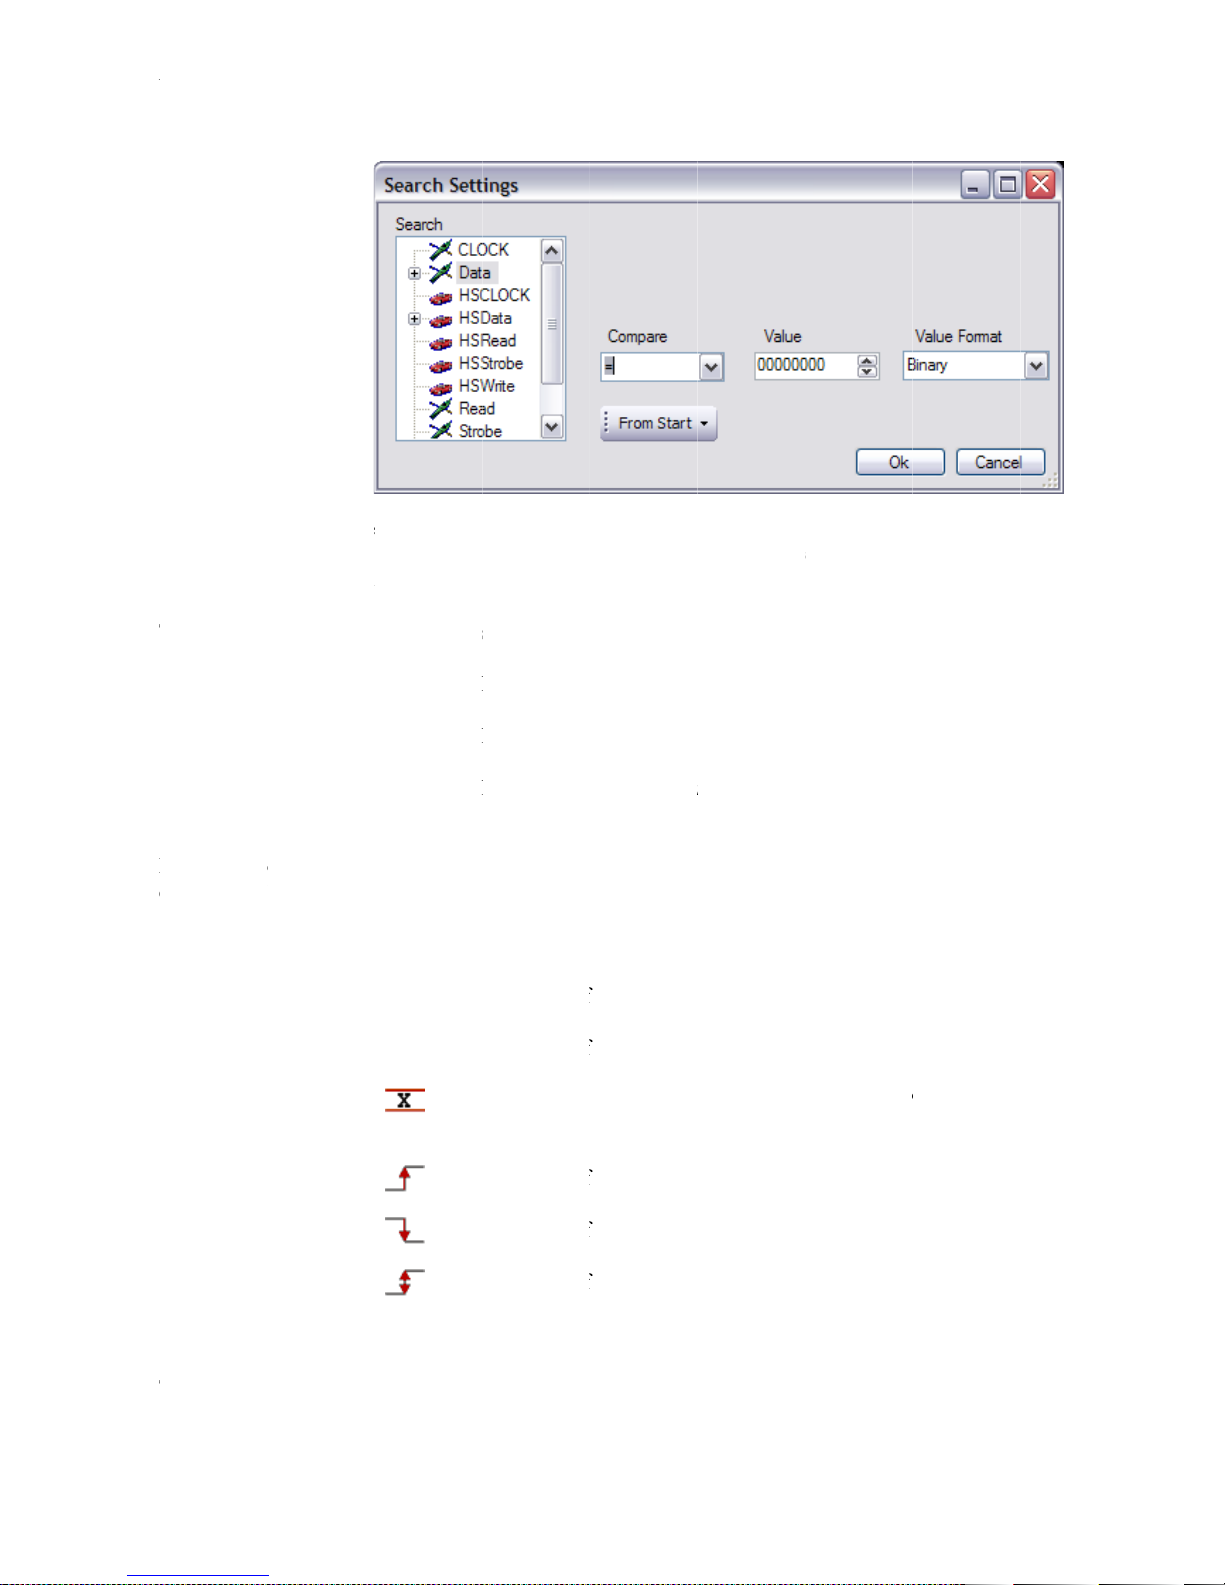
AT
In the
to select the signal or bus where to search a specified value
In the
The menu ring allows selecting the start location for searching. Possible
Depending on the signal type selected in the
contains different options.
If a single signal is selected, the
The
AT
-LA500 – U
SER MANUAL
In the
Search
to select the signal or bus where to search a specified value
In the
Value
The menu ring allows selecting the start location for searching. Possible
Depending on the signal type selected in the
contains different options.
If a single signal is selected, the
The
Compare
list, all defined signals and bus (also the High Speed signals)
box, the value or the edge to search can be entered.
menu ring allows to select between the search option:
=
Search st
Search
Search starts from the cursor
Value
arts from the acquisition begin
starts from the acquisition end
Search
box can assume these values:
Search for a logic 0
Search for a logic 1
Search for a High Impedance (o
Search for a
Search for
Search for any edge
Find if equal
n
list, the
rising edge
a falling edge
is to be searched.
n
Compare
are shown. It is possible
options are:
Value
nly for Pattern Generator
menu ring
From Start
From End
Cursor n
0
1
HiZ
Rise
Fall
Change
Mode)
location
and the
Page 88
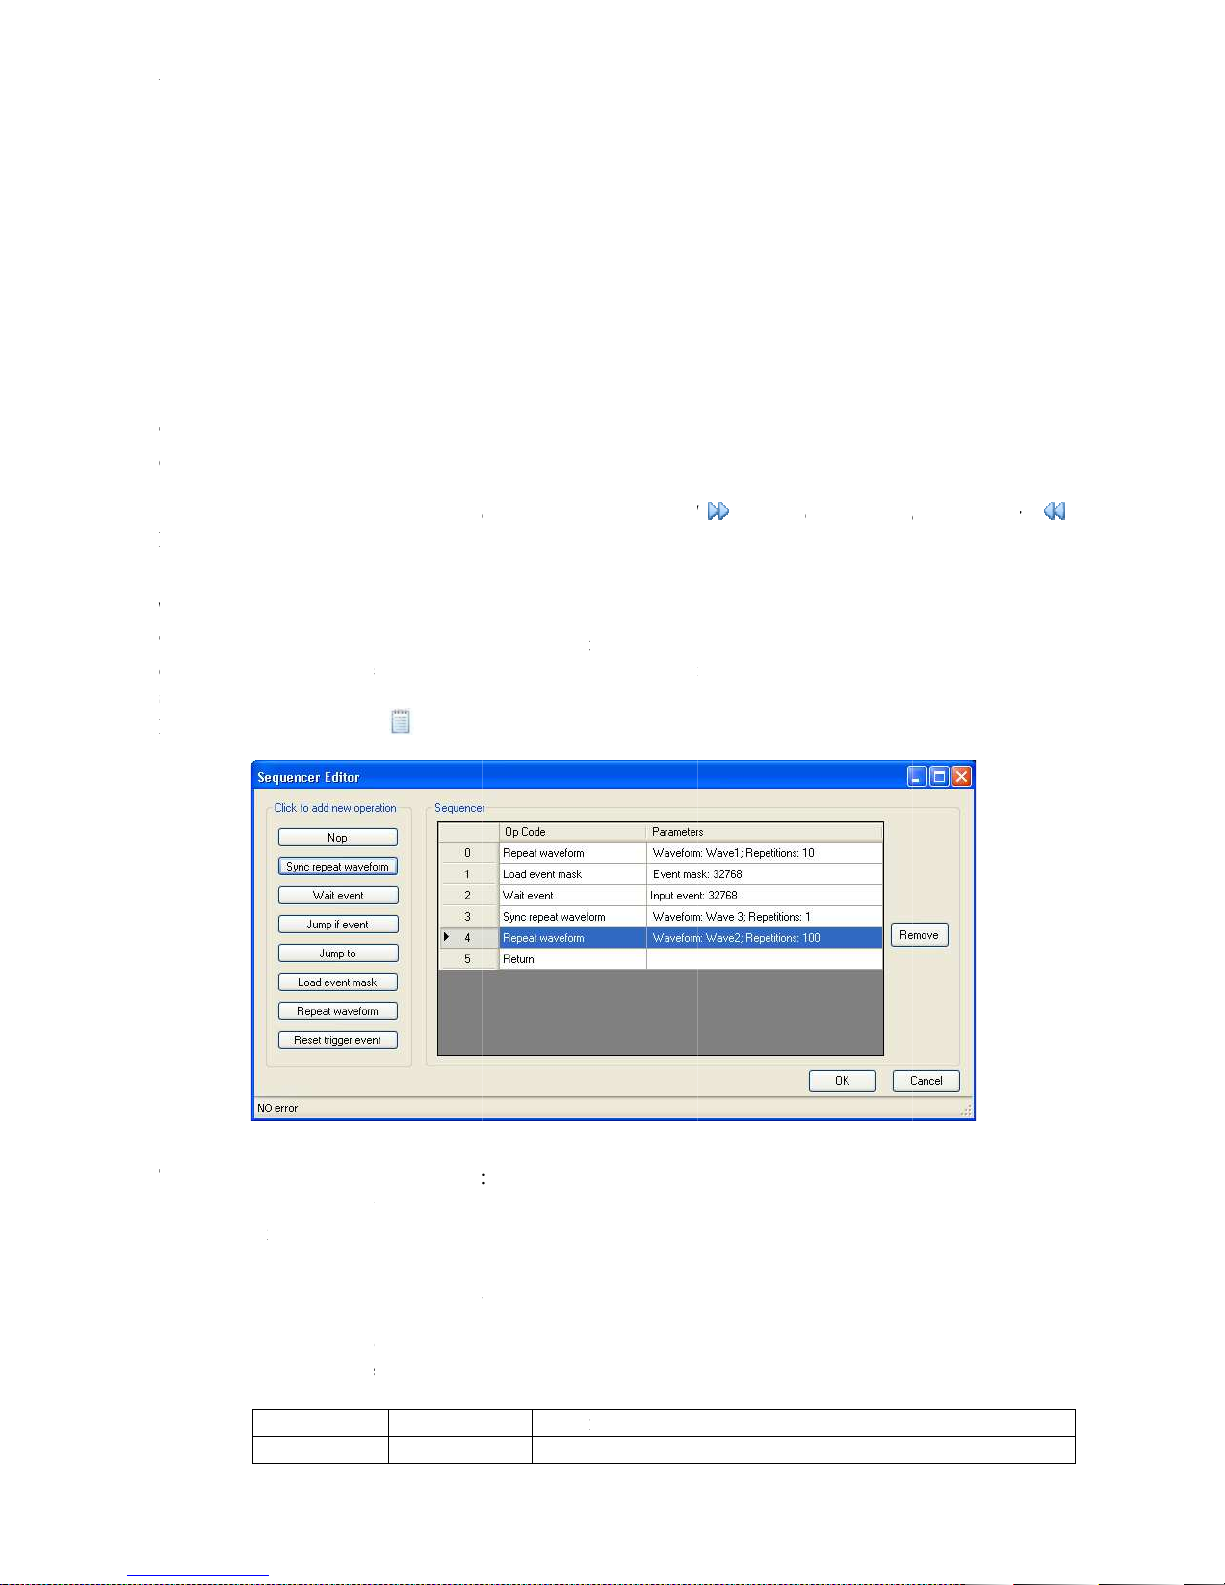
AT
To make active the selected criteria, click the
closed.
In the visualization window, click on the
key. The master cursor will move to the next found value.
Waveform
The sequencer unit is a programmable finite state machine with a microcode memory that,
combined with
signals at a very high
Double click on
The sequencer instructions allow to:
AT
-LA500 – U
SER MANUAL
To make active the selected criteria, click the
closed.
In the visualization window, click on the
key. The master cursor will move to the next found value.
Waveform
The sequencer unit is a programmable finite state machine with a microcode memory that,
combined with
signals at a very high
Double click on
The sequencer instructions allow to:
Repeat vectors stored inside the vector memory at each of several addresses
Make conditional and unconditional jumps
Monitor input signals combining them with a mask
Modify the mask on input signals
Insert wait states
Wait for trigger events
Reset the
Instruction
NOP
!=
>
<
HiZ
Sequencer
vector
speed (125 MHz).
the icon
Trigger events
Editor
/command
of the Project Tree
Explanation
Find if not equal
Find greater values (ena
Find minor values (enabled only if
High Impedance
Search Forward
memory, can generate very long digital patters and control
Parameters
Repetitions
button and the
to open the Sequencer Form.
. Minimum=0 Maximum = 65535 (It means
bled only if a bus is selected)
Search Settings
key or on the
a bus is selected)
Search Backward
window will be
OK
•
•
•
•
•
•
•
the
No
Page 89
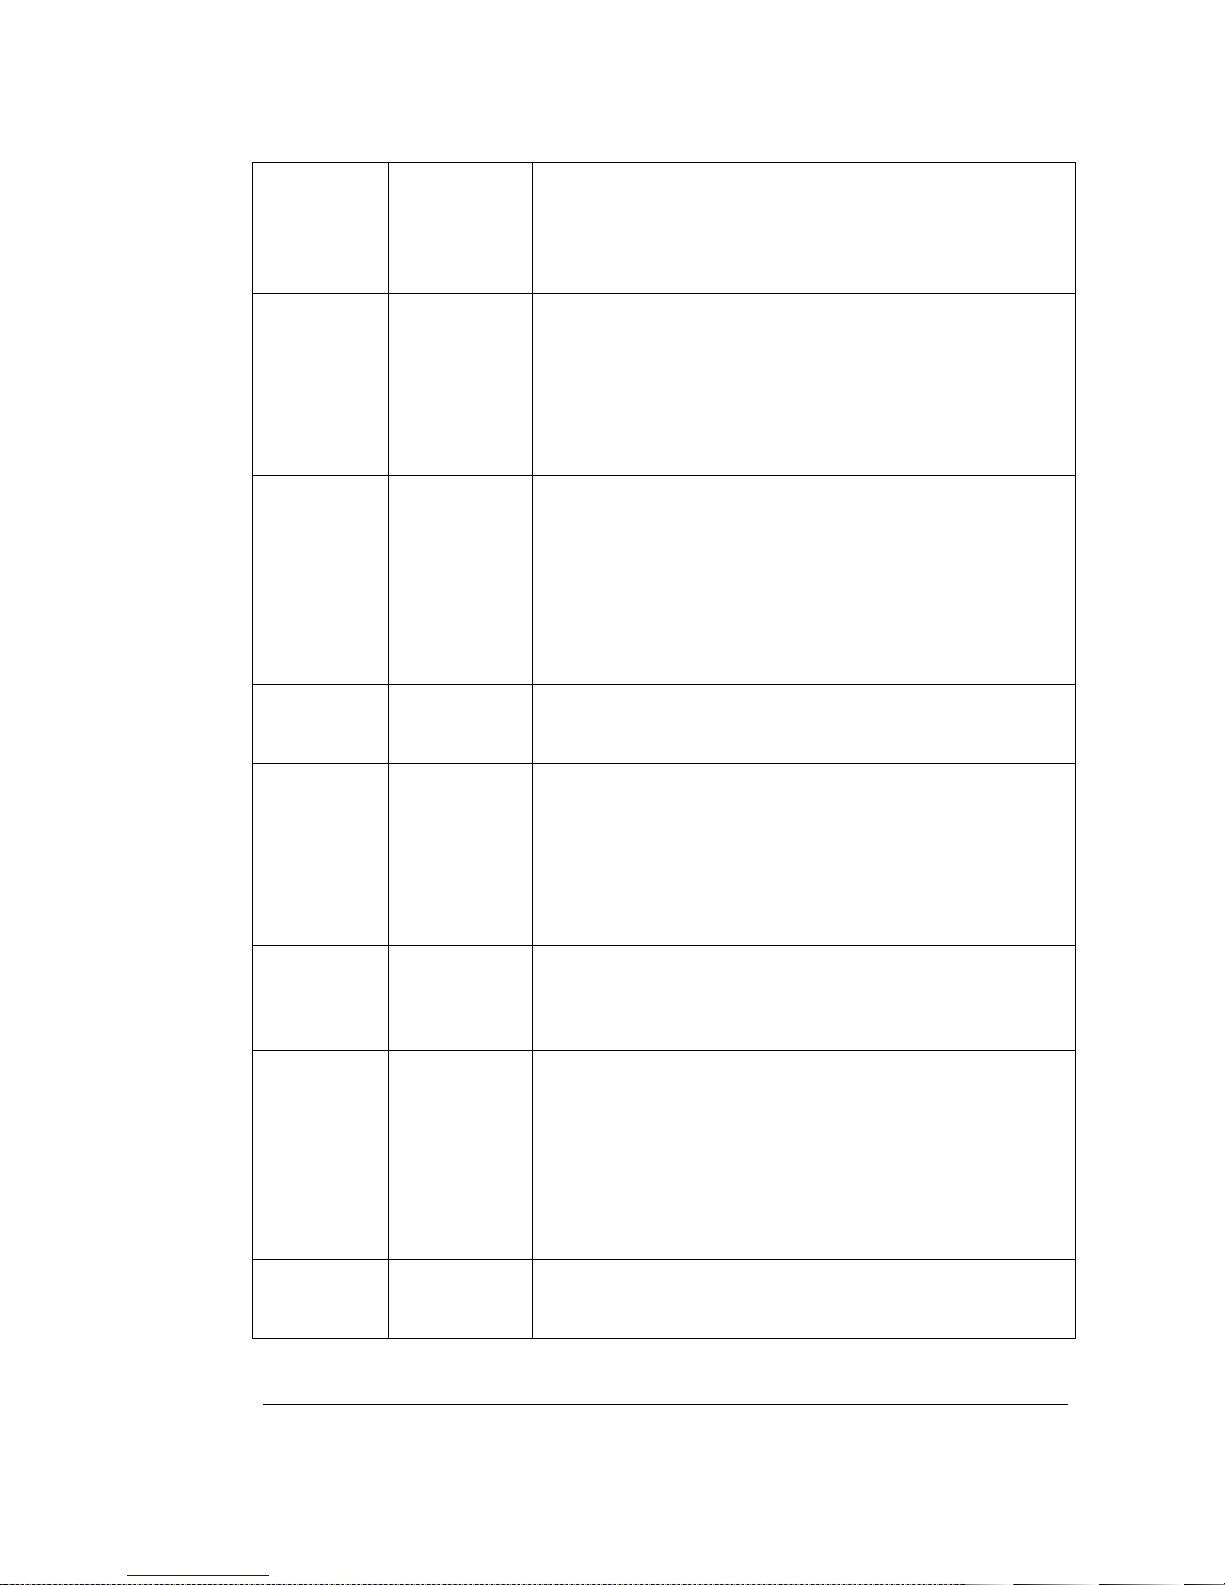
AT-LA500 – USER MANUAL
Mask = Input Event
Input Event (HEX):
Operation that NOP instruction can be repeated from 1 to 65536
times) .
Loop Mode: NO LOOP, LOOP BEGIN (it marks the
first instruction of a loop), LOOP END (it marks the last
instruction of a loop).
Repeat
Waveform
Repeat a
waveform
Waveform: waveform name
Repetitions. Minimum=0 Maximum = 65535 (It means
that the waveform will be repeated from 1 to 65536
times) .
Loop Mode: NO LOOP, LOOP BEGIN (it marks the
first instruction of a loop), LOOP END (it marks the last
instruction of a loop).
Sync Repeat
Waveform
Repeat a
waveform
synchronized
with the
clock signal
generated by
the Clock
Waveform: waveform name
Repetitions. Minimum=0 Maximum = 65535 (It means
that the waveform will be repeated with allowed values
from 1 to 65536 times) .
Loop Mode: NO LOOP, LOOP BEGIN (it marks the
first instruction of a loop), LOOP END (it marks the last
instruction of a loop).
Generator
Jump To Jump to the
instruction a
address N
Jump If
Event
Jump if an
event occurs
Address: instruction jump address.
Jump addresses inside a Loop must be avoided
Address: instruction jump address.
Jump addresses inside a Loop must be avoided
Input Event (HEX):16 bits input event. Input Event[14..0] are
DPIO[14..0], Input Event[15] is the trigger event (please see
Trigger Module for description).The Input Event bits are
masked in AND with Mask value.
The expression to evaluate will be: Input Event Group AND
Load Event
Mask
Load the
mask value
Event Mask(HEX): the value of the mask.
Loop Mode: NO LOOP, LOOP BEGIN (it marks the
first instruction of a loop), LOOP END (it marks the last
instruction of a loop).
Wait Event Wait until
the event
occurs
DPIO[14..0], Input Event[15] is the trigger event (please see
Trigger Module for description).The Input Event bits are
masked logically in AND with Mask value.
The expression to evaluate will be: Input Event Group AND
Mask = Input Event
16 bits input event. Input Event[14..0] are
Loop Mode: NO LOOP, LOOP BEGIN (it marks the
first instruction of a loop), LOOP END (it marks the last
instruction of a loop).
Reset
Trigger
Event
Notes:
- Last sequencer instruction must be RETURN
- Jumps are relative to the current vector block
RELEASE 3.4 – JUNE 2009 89
Reset the
trigger event
value
Loop Mode: NO LOOP, LOOP BEGIN (it marks the
first instruction of a loop), LOOP END (it marks the last
instruction of a loop).
Page 90

AT-LA500 – USER MANUAL
- REPEAT WAVEFORM: the generated vectors are asynchronous respect to the clock generator
signal
- SYNC REPEAT WAVEFORM: the generated vectors are synchronous respect to the clock
generator signal. Sync signal can be delayed with Sync Delay
- Sequencer Memory depth is 512 instructions
- Waveforms Memory depth is 640
- A block of instructions can be repeated with Loop Begin / Loop End parameters. Loop Begin
marks the first instruction of the loop, Loop End marks the last instruction. Loop Repetitions
parameter is the number of times that the loop will be repeated. Allowed values are from 1 to
8191
RELEASE 3.4 – JUNE 2009 90
Page 91
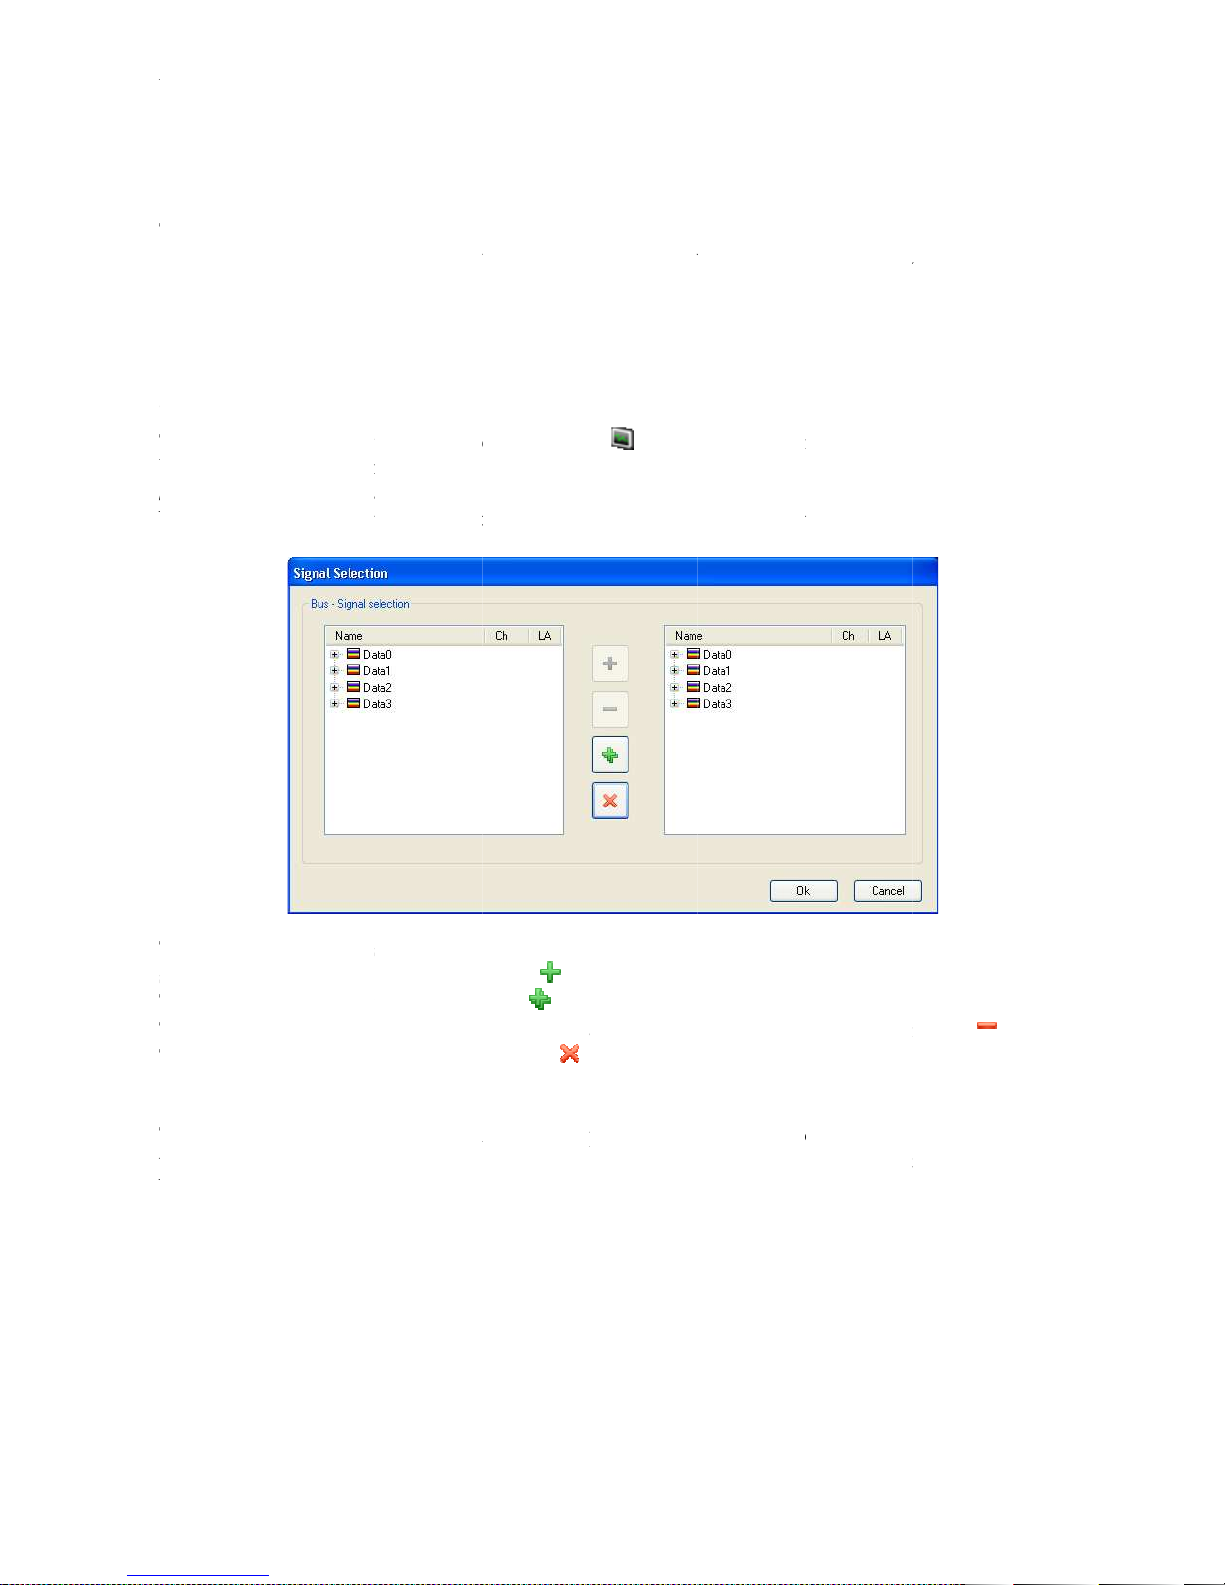
AT
Data Visualization
The Digital Pattern Generator can also work as a Sampler
that can be exported and visuali
Waveform View
Create a Waveform View window
To open the Waveform view, double click on the
When a new acquisition is complete, and the Waveform View window is not yet open, a
Selection
been acquired are to be visualized, t
To add a signal or a bus to the list of the ones that will be shown in the Waveform View window,
select it on the left side table and click on
To add all signals at a time, just click on
To remove a sig
To remove all signal at a time, just click on
The Waveform Window allows analyzing acquired data in a graph containing digital and analog
waveforms. Single signals are
buses.
AT
-LA500 – U
SER MANUAL
Data Visualization
The Digital Pattern Generator can also work as a Sampler
that can be exported and visuali
Waveform View
Create a Waveform View window
To open the Waveform view, double click on the
When a new acquisition is complete, and the Waveform View window is not yet open, a
Selection
window will appear to select which signals or groups of signals among those that have
been acquired are to be visualized, t
To add a signal or a bus to the list of the ones that will be shown in the Waveform View window,
select it on the left side table and click on
To add all signals at a time, just click on
To remove a sig
To remove all signal at a time, just click on
The Waveform Window allows analyzing acquired data in a graph containing digital and analog
waveforms. Single signals are
buses.
nal from the visualization list, select it on the right side table and click on
zed with the Waveform View form and with the
visualized as digital signals, while grouped signals are represented as
hen the Waveform View window will be shown.
icon in the Solution Explorer.
all acquired data are stored into a file
State Listing
NAVIGATOR
form.
Signal
AT-LA
:
.
.
.
.
Page 92
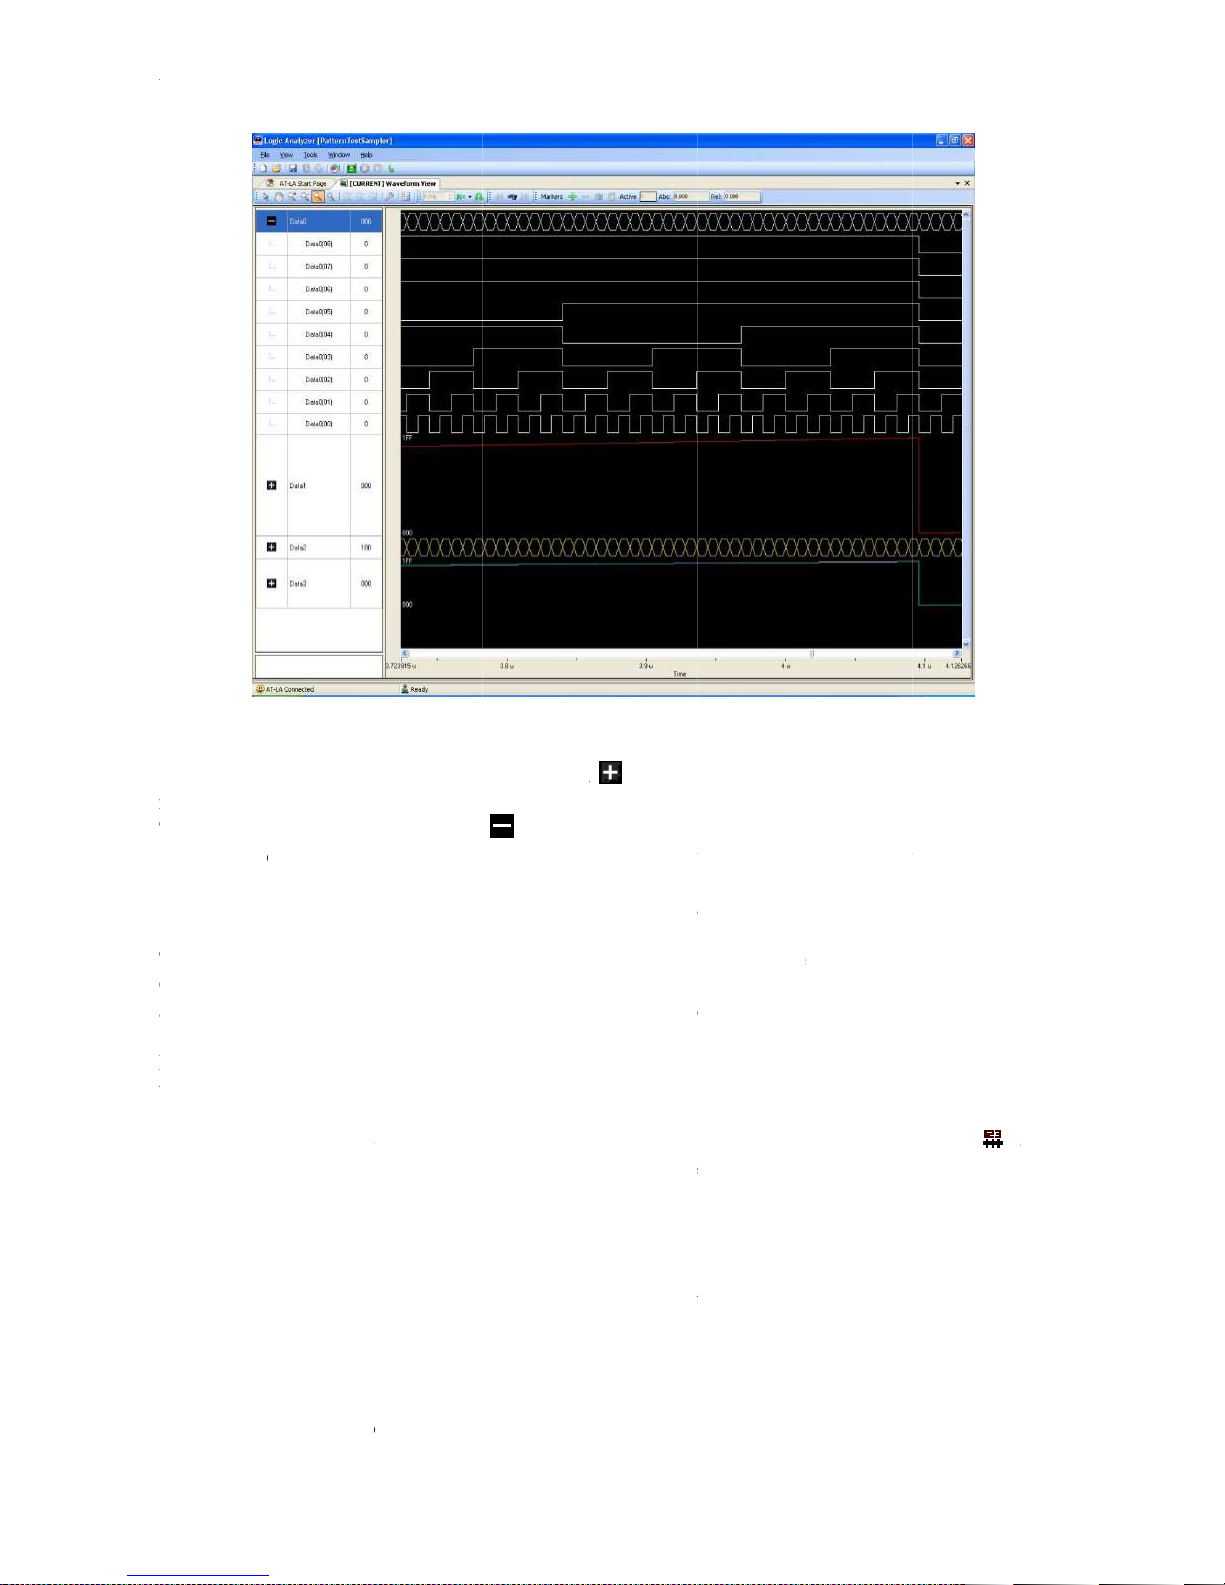
AT
In the
name
The icon of an opened bus becomes
It is possible to drag and drop the waveforms and change their order, to help the user to focus the
time relationship between edges. To do this, click on a signal name and drag it in the new position.
In the same way, it is also
from it.
To resize the signals amplitude, just drag the line between signals name.
On the right of every signal or bus name, a number indicates the value that this signal or bus
assu
Cursors
By clicking with the right mouse button on the signal name column, a shortcut menu will appear
with these options:
AT
-LA500 – U
SER MANUAL
In the
Waveform View
name
to open a bus.
The icon of an opened bus becomes
It is possible to drag and drop the waveforms and change their order, to help the user to focus the
time relationship between edges. To do this, click on a signal name and drag it in the new position.
In the same way, it is also
from it.
To resize the signals amplitude, just drag the line between signals name.
On the right of every signal or bus name, a number indicates the value that this signal or bus
assu
mes at the time position of the master cursor (the cursors properties are described in the
Cursors
section
By clicking with the right mouse button on the signal name column, a shortcut menu will appear
with these options:
, a bus is indicated by a
Add samples scale
Analog mode display
Remove signals
possible to insert a signal into an opened bus or to extract a waveform
. Double
Select this o
with a series of
samples.
This option (available only for the buses) will represent a
bus as an analog waveform.
This is useful for example if an
This option allows adding
Waveform
icon on the left
click on it to close a bus.
ption to add a signal, indicated by a
segments
of its name.
that represents the number of
or remov
Double click on it
ADC or a DAC has to be
NAVIGATOR
icon,
signals to the
AT-LA
s
).
tested.
Add-
ing
View.
Page 93

AT-LA500 – USER MANUAL AT-LA NAVIGATOR
Zoom, Cursors, Graph Property, Search toolbars are the same explained above for the Digital
Editor, please see above for descriptions.
RELEASE 3.4 – JUNE 2009 93
Page 94
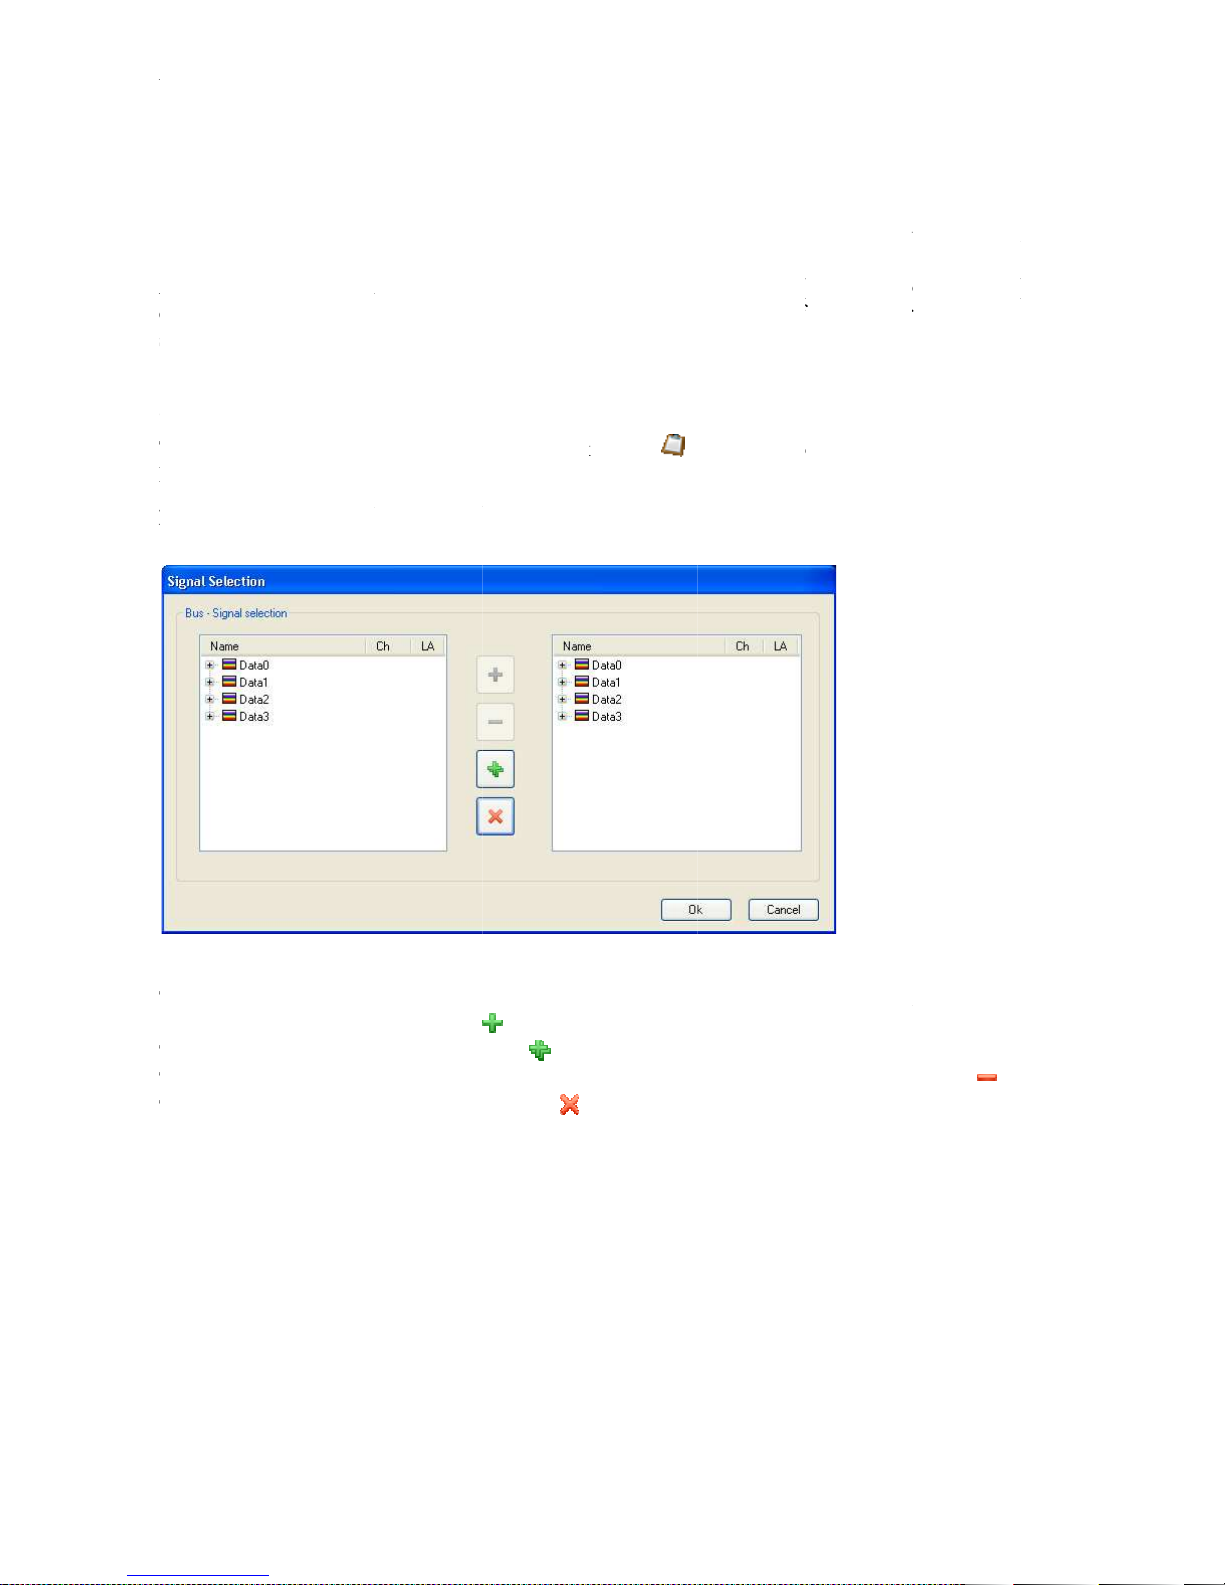
AT
State Listing
In the
representing a signal or a group of signals.
Additional columns
column) and the interpretation of the serial protocol bus operations, if this trigger option has been
selected.
Create a
To open the
Listing
groups of signals among those that have been acquired are to be visualized, then the
window will be shown.
To add a signal or a bus to the list of the ones that will be shown in the
it on the left side table and click on
To add all signals at a time, just click on
To remove a signal fr
To remove all signal at a time, just click on
AT
-LA500 – U
SER MANUAL
State Listing
In the
State Listing
representing a signal or a group of signals.
Additional columns
column) and the interpretation of the serial protocol bus operations, if this trigger option has been
selected.
Create a
State Listing
To open the
Listing
window is not yet open, a
groups of signals among those that have been acquired are to be visualized, then the
window will be shown.
To add a signal or a bus to the list of the ones that will be shown in the
it on the left side table and click on
To add all signals at a time, just click on
To remove a signal fr
To remove all signal at a time, just click on
window acquired data are visualized numerically in columns, each one
indicate the sample number (
State Listing
om the visualization list, select it on the right side table and click on
window
window, double click on the
Signal Selection
Samples
icon in the Solution Explorer. If the
window will appear to select which signals or
column), the absolute time (
State Listing
NAVIGATOR
State
State Listing
window, select
State
AT-LA
Time
.
.
.
.
Page 95
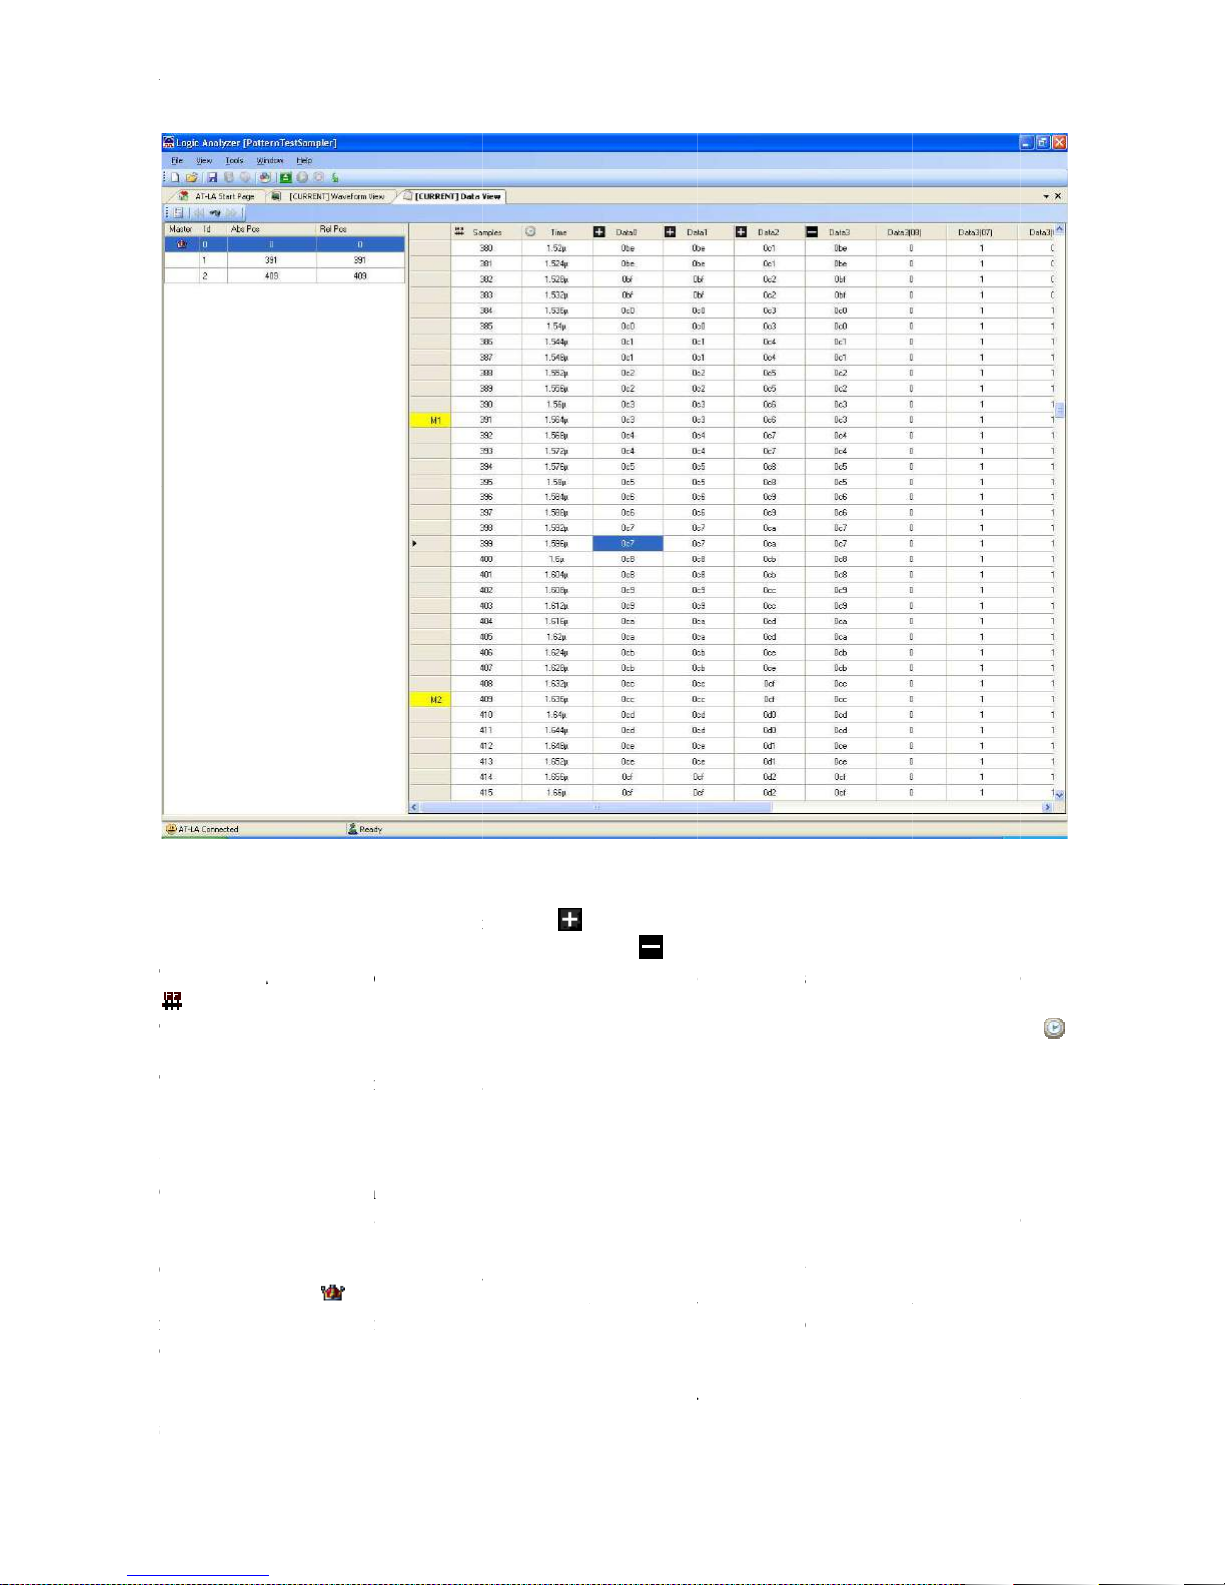
AT
In the
it to open a bus. T
The
The
icon.
To resize the columns amplitude, just drag the line between signals name.
Cursors
Cursors (also called markers) are useful to identify and enlighten data that, therefore, may be
recognized or found easier. In addition cursors can be used to measure and to analyze acquired data.
On the left side of the
identified by the
master cursor. Furthermore, the master cursor is
operation to show resu
It is possible to operate with cursors by clicking with the right mouse button on the cursor list and
select one of these options in the shortcut menu that will appear:
AT
-LA500 – U
SER MANUAL
In the
State Listing
it to open a bus. T
The
Samples
The
column contains the progressive absolute time of every sample. It is indicated by the
icon.
To resize the columns amplitude, just drag the line between signals name.
Cursors
Cursors (also called markers) are useful to identify and enlighten data that, therefore, may be
recognized or found easier. In addition cursors can be used to measure and to analyze acquired data.
On the left side of the
identified by the
master cursor. Furthermore, the master cursor is
operation to show resu
It is possible to operate with cursors by clicking with the right mouse button on the cursor list and
select one of these options in the shortcut menu that will appear:
, a bus is indicated by a
he icon of an opened bus becomes
column contains the progressive number of the acquired samples. It is indicated by the
icon. All relative positions will be calculated respected to the position of the
lts.
State Listing
icon on the left of its name. It is possible to click on
window are listed a
. Click on it to close a bus.
ll available cursors. The master cursor is
moved automatically during a data search
NAVIGATOR
AT-LA
icon.
Time
Page 96

AT-LA500 – USER MANUAL AT-LA NAVIGATOR
• Delete marker
• Set master
• Add marker
Add a cursor to the State Listing
Window;
Remove the selected cursor;
Set the selected cursor as the master;
• Clear marker list
• Go to this marker
Delete all cursors but one;
Move the State Listing list to show
the position of the selected cursor;
• Representation…
Allows to select the Absolute and
Relative Position representation. It is
possible to choose between Time and
Samples.
Note: It is possible to remove all the cursors but one. The user, however, can create as many cursors
as needed.
The markers are indicated by the string Mn in the first column of the State Listing, where n is the
progressive identification number.
Browse the State Listing window and export data
To jump quickly to the desired position of the State Listing list, it is possible to click with the right
mouse button on the data and to select one of these options in the shortcut menu that will appear:
Add marker
Add a cursor in the selected point of
the State Listing window;
Move selected marker here
Places the selected cursor to the
specified position of the State
Listing;
Show this sample on Waveform
View
Center the Waveform View on the
selected sample (only if the
Waveform View is already open);
Go to selected marker
Move the State Listing list to show
the position of the selected cursor;
Go to samples…
Move the State Listing list to show
the samples which number is
specified in the Go to sample…
window that will appear;
Go to time…
Move the State Listing list to show
the samples which absolute time is
specified in the Go to time…
window that will appear;
Save to txt file…
Allows to export data in a Comma
Separated Value file. A window will
appear to select which rows and
column have to be exported.
Representation…
Data can be visualized in
Binary,Hexadecimal or Decimal
format.
LSB on Top / MSB on Top
Data can be visualized with Least
Significant Bit on Top or with Most
Significant Bit on Top.
RELEASE 3.4 – JUNE 2009 96
Page 97
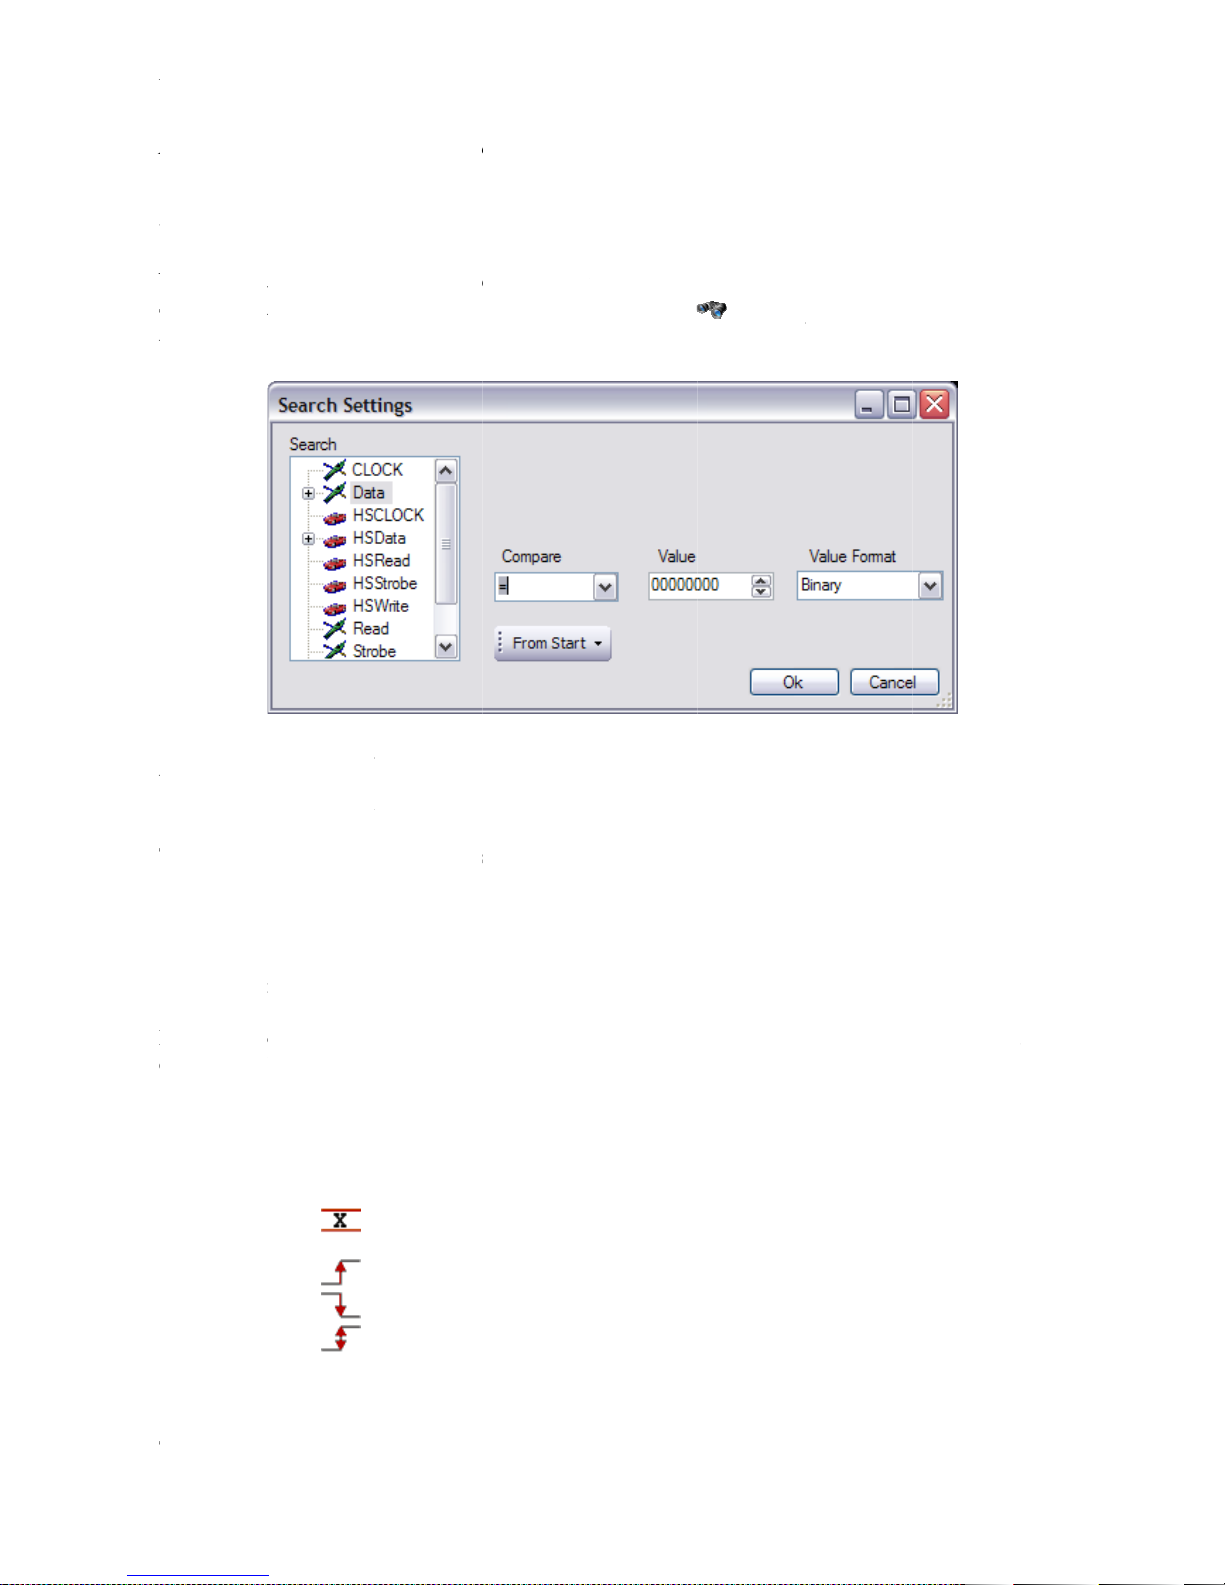
AT
Note:
Search
In the
bus or, for a single signal, a rising edge or a falling edge.
To activate the search option, click on the
wil
In the
where to search a specified value.
In the
The menu ring allows selecting the start location for searching. Possible options are:
Depending on the signal type selected in the
contains different options.
If a single signal is selected, the
The
AT
-LA500 – U
SER MANUAL
Note:
Exporting the entire acquisition may require a long time to be completed.
Search
In the
State Listing
bus or, for a single signal, a rising edge or a falling edge.
To activate the search option, click on the
wil
l be opened, and search criteria can be entered.
In the
Search
where to search a specified value.
In the
Value
The menu ring allows selecting the start location for searching. Possible options are:
From Start:
From Trigger:
Master Marker:
Depending on the signal type selected in the
contains different options.
If a single signal is selected, the
The
Compare
window, as in the Waveform View, it is possible to search a value related to a
list, all defined signals and bus are shown. It is possible to select the signal or bus
box, the value or the edge to search can be entered.
HiZ
Rise
Fall
Change
menu ring allows to sel
Search starts from the acquisition begin;
Search starts from the acquisition end;
Search starts from the trigger position;
Search starts from the master market;
Value
Search Settings
Search
box can assume these values:
Search for a logic 0;
Search for a logic 1;
Search for a High Impedance (only for
Pattern Generator Mode);
Search for a rising edge;
Search for a falling edge;
Search for any edge;
ect between the search option:
list, the
key and the Search Settings window
Compare
Value
NAVIGATOR
menu ring
AT-LA
From End:
and the
0
1
Page 98

AT
To make active the selected criteria, click the
closed.
In the visualization window, click on the
key. The master cursor will move to the next found value.
AT
-LA500 – U
SER MANUAL
To make active the selected criteria, click the
closed.
In the visualization window, click on the
key. The master cursor will move to the next found value.
Find if equal;
Find if not equal;
Find greater values (enabled only if a bus is
selected);
Find minor values (enabled only if a bus is
selected);
High Impedance (only for Pattern Generator
Mode);
Search Forward
button and the
Search Settings
key or on the
Search Backward
NAVIGATOR
window will be
AT-LA
=
!=
>
<
HiZ
OK
 Loading...