

Page 1
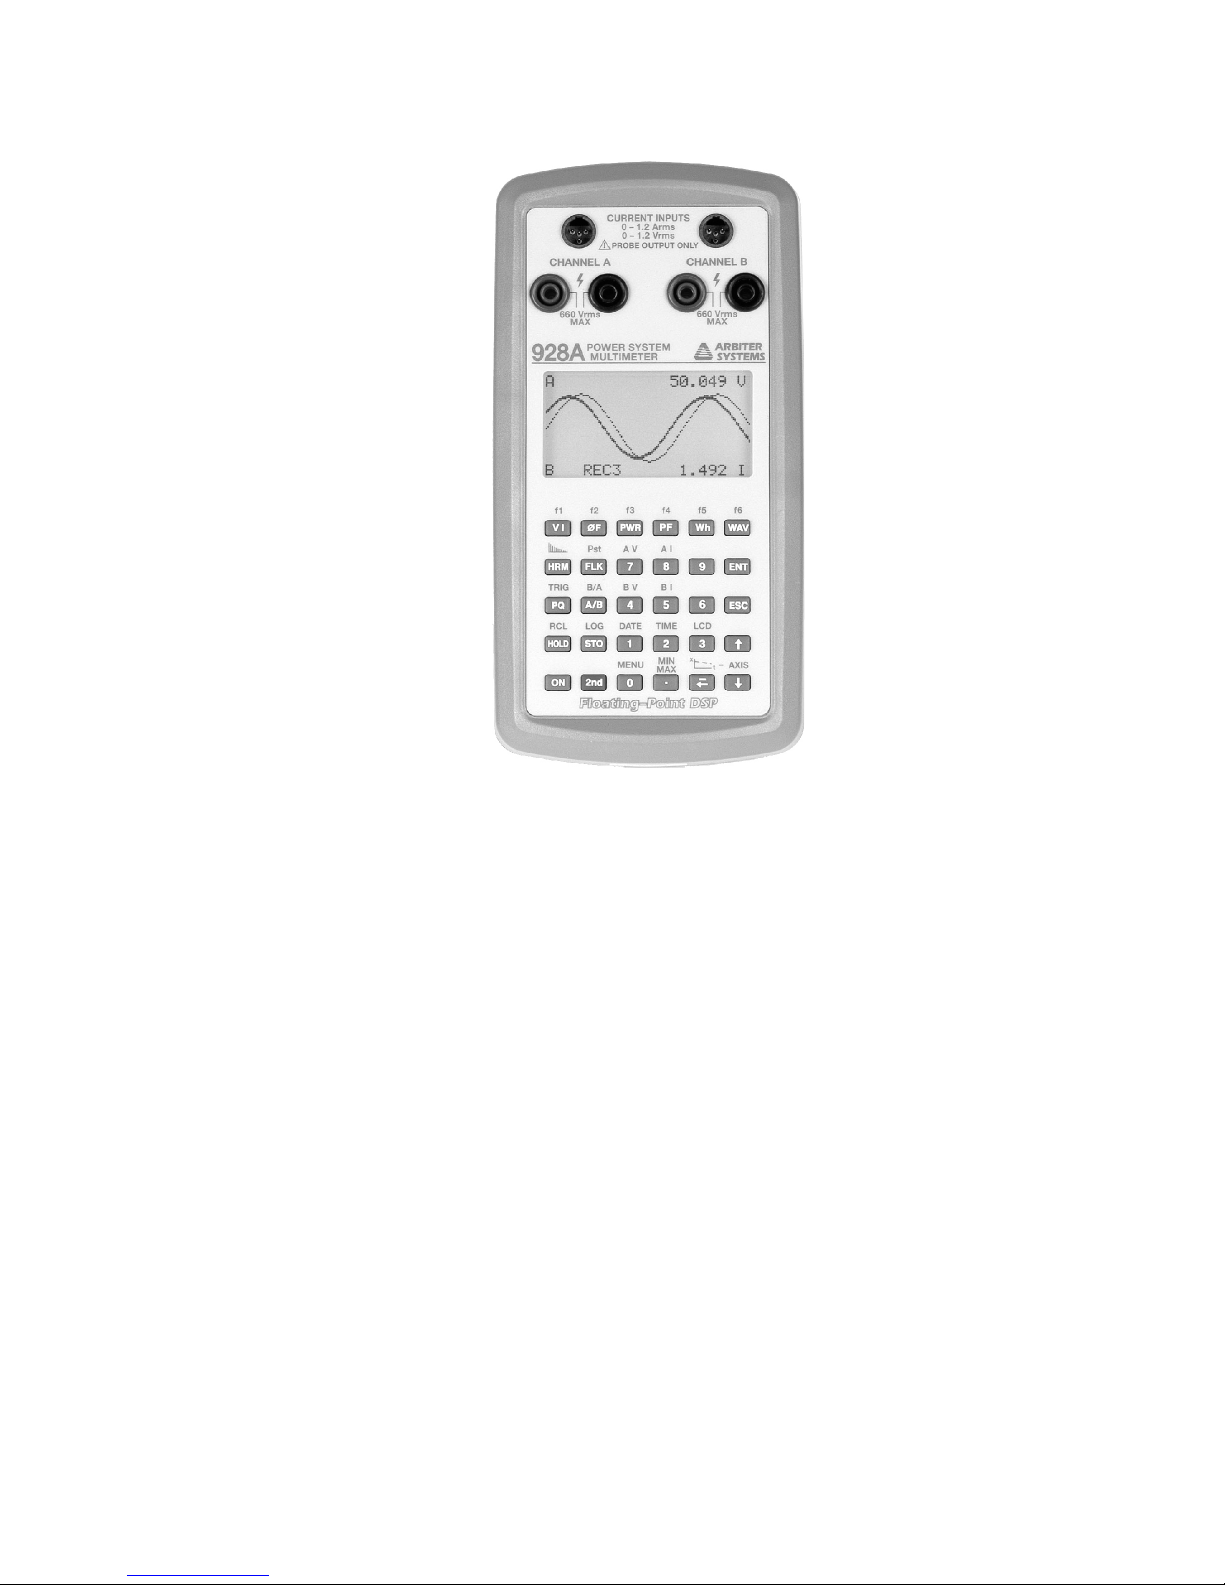
MODEL 928A USER’S MANUAL
Arbiter Systems, Inc.
Paso Robles, CA 93446
U.S.A.
Page 2

Notice
This manual is issued for reference only, at the convenience of Arbiter Systems. Reasonable effort was
made to verify that all contents were accurate as of
the time of publication. Check with Arbiter Systems
at the address below for any revisions made since the
original date of publication.
Contact Information
Arbiter Systems, Inc.
1324 Vendels Circle, Suite 121
Paso Robles, CA 93446
(805) 237-3831
Website: www.arbiter.com
mailto: [email protected]
mailto: [email protected]
ii
Page 3

LIMITED WARRANTY
Arbiter Systems makes no warranty, expressed or implied, on any product manufactured or sold by Arbiter Systems except for the following limited warranty
against defects in materials and workmanship on products manufactured by Arbiter Systems.
Products manufactured by Arbiter Systems are guaranteed against defective materials and workmanship
under normal use and service for one year from the
date of delivery. The responsibility of Arbiter Systems
under this warranty is limited to repair or replacement,
at Arbiter Systems’ option, of any product found to be
defective. Arbiter Systems shall have no liability under this warranty unless it receives written notice of
any claimed defect, within the earlier of:
Thirty days of discovery by Buyer, or;
One year from the date of delivery.
For warranty service or repair, products must be returned to a service facility designated by Arbiter Systems. Buyer shall prepay all shipping charges to Arbiter Systems, and Arbiter Systems shall pay shipping
charges incurred in returning the product to Buyer.
However, Buyer shall pay all shipping charges, duties
and taxes for products returned to Buyer in a country
other than the United States of America.
THE WARRANTY SET FORTH HEREIN
CONSTITUTES THE ONLY WARRANTY
OBLIGATIONS OF ARBITER SYSTEMS,
EXPRESSED OR IMPLIED, STATUTORY, BY
OPERATION OF LAW, OR OTHERWISE.
ARBITER SYSTEMS DISCLAIMS ANY
WARRANTY OF MERCHANTABILITY OR
FITNESS FOR A PARTICULAR PURPOSE, AND
BUYER EXPRESSLY WAIVES ALL OTHER
WARRANTIES.
iii
Page 4

This limited warranty does not extend to any product,
which has been subject to:
I Improper use or application, abuse, or operation
beyond its rated capacity, or contrary to the instructions in the operation and maintenance manuals (if any);
II Accident;
III Repair or maintenance performed by Buyer, ex-
cept in accordance with the operation and maintenance manuals, if any, and any special instructions of Arbiter Systems;
IV Modification without the prior written authoriza-
tion of Arbiter Systems (whether by the substitu-
tion of non-approved parts or otherwise).
The remedies provided herein are Buyer’s sole and exclusive remedies. In no event shall Arbiter Systems be
liable for direct, indirect, incidental or consequential
damages (including loss of profits), whether based on
contract, tort, or other legal theory.
FOR THE FASTEST POSSIBLE SERVICE,
PLEASE PROCEED AS FOLLOWS:
1. Notify Arbiter Systems, Inc., specifying the instrument model number and serial number and
giving full details of the difficulty. Service data
or instrument-return authorization will be provided upon receipt of this information.
2. If instrument return is authorized, forward prepaid to the manufacturer. If it is determined
that the instrument is not covered by this warranty, an es timate will be made before the repair
work begins, if requested.
See Contact Information on page ii.
iv
Page 5

Arbiter Systems, Inc.
Model 928A
Power System Multimeter
User’s Manual
Warranty
Table of Contents
Introduction
Getting Started
Operation
Mlink Software Tutorial
Functional Description
Specifications
Appendixes
Index
Copyright Arbiter Systems Incorporated January 2012
All rights reserved. International copyright secured.
PD0030900J
v
Page 6

vi
Page 7

Contents
Introduction 1
Scope . . . . . . . . . . . . . . . . . . . . . . 1
Features . . . . . . . . . . . . . . . . . . . . . 1
Simple Measurement . . . . . . . . . . . . . . 2
Recording Data . . . . . . . . . . . . . . . . . 2
Safety and Usage Information . . . . . . . . . 2
Caution: Max CT Input Level . . . . . 2
Caution: Direct Current Input . . . . . 3
Measuring Safety and Usage . . . . . . . 3
928A Starter Kit . . . . . . . . . . . . . 4
Getting Started 5
Keyboard Operation . . . . . . . . . . . . . . 5
Primary Function Keys . . . . . . . . . 5
Secondary Function Keys – 2nd key . . 5
Navigating Menus to Configure . . . . . 5
Power Supply, On and Off . . . . . . . . . . . 6
Auto Power Shutdown . . . . . . . . . . 6
Battery Power Only . . . . . . . . . . . 6
AC Power Adapter . . . . . . . . . . . . 8
Bail Assembly . . . . . . . . . . . . . . . . . . 8
Measurement Terminals . . . . . . . . . . . . 10
Voltage Terminals . . . . . . . . . . . . 11
Current Terminals . . . . . . . . . . . . 12
vii
Page 8

Basic Functions and Keys . . . . . . . . . . . 13
MIN/MAX – Range . . . . . . . . . . . 13
LCD – Display Control . . . . . . . . . . 13
Function Keys, f1 – f6 . . . . . . . . . . 14
Splash Screen . . . . . . . . . . . . . . . 14
Up and Down Arrows . . . . . . . . . . 14
MENU – Configuration and Settings . . 15
Menus in Context . . . . . . . . . . . . . 18
ENT – Enter or Move . . . . . . . . . . 18
ESC – Escape, Go Back . . . . . . . . . 19
STO – Store Value or Reading . . . . . 19
TIME – View or Set Time . . . . . . . . 20
DATE – View or Set Date . . . . . . . . 21
Using the Input Channels . . . . . . . . . . . 22
Configuring Channels A and B . . . . . 23
Using the MN352 Current Probe . . . . 29
CT Characterization Files . . . . . . . . 30
Operation 31
Introduction . . . . . . . . . . . . . . . . . . . 31
Making Measurements . . . . . . . . . . . . . 32
VI – Voltage and Current . . . . . . . . 32
φF – Phase and Frequency . . . . . . . . 34
PWR – Active and Reactive Power . . . 36
PF – Power Factor & Apparent Power . 38
Wh – Watt-hour . . . . . . . . . . . . . 40
WAV - Waveform . . . . . . . . . . . . . 42
HRM – Numerical Harmonics . . . . . . 44
Graphical Harmonics . . . . . . . . . . . 45
Flicker Information . . . . . . . . . . . . 46
FLK – Instantaneous Flicker . . . . . . 47
Pst – Short-Term Flicker . . . . . . . . . 47
PQ – Power Quality, Sags and Swells . . 48
TRIG – Working with Triggers . . . . . 54
Configuring Triggers . . . . . . . . . . . 55
viii
Page 9

A/B Function . . . . . . . . . . . . . . . 56
B/A Function . . . . . . . . . . . . . . . 57
HOLD – Hold Metered Value . . . . . . 58
RCL – Recall Stored Values . . . . . . . 59
Integration Key . . . . . . . . . . . . . . 60
AXIS Key . . . . . . . . . . . . . . . . . 61
LOG Key . . . . . . . . . . . . . . . . . 62
Autolog Setup . . . . . . . . . . . . . . . 63
Mlink Software Tutorial 65
Introduction . . . . . . . . . . . . . . . . . . . 65
Download Mlink . . . . . . . . . . . . . . . . 66
Installing USB Driver . . . . . . . . . . . . . 66
Install FTDI Driver on Windows XP. 66
Linux Version . . . . . . . . . . . . . . . 67
Drivers for Windows Vista . . . . . . . . 67
Drivers for Windows 7 . . . . . . . . . . 67
Installing Mlink . . . . . . . . . . . . . . . . . 68
Connecting to the 928A . . . . . . . . . . . . 68
Startup - USB Connection . . . . . . . . 68
Mlink Main Window . . . . . . . . . . . . . . 71
Available Functions . . . . . . . . . . . . 71
CT Profiles . . . . . . . . . . . . . . . . . . . 72
To Install Profiles . . . . . . . . . . . . . 72
To Erase Profiles . . . . . . . . . . . . . 73
Configure User Screens . . . . . . . . . . . . . 73
Download Trigger Records . . . . . . . . . . . 75
Configure Power Quality . . . . . . . . . . . . 76
Power Quality Settings . . . . . . . . . . 77
Configure Point Limits . . . . . . . . . . 78
Point Limit Definitions . . . . . . . . . . 78
User Profile . . . . . . . . . . . . . . . . 79
OFF - Deactivate PQ Trigger . . . . . . 80
Download Log Records . . . . . . . . . . . . . 80
Download Power Quality Records . . . . . . . 81
ix
Page 10

Uploading New Firmware . . . . . . . . . . . 82
Functional Description 83
Introduction . . . . . . . . . . . . . . . . . . . 83
User Interface . . . . . . . . . . . . . . . . . . 83
Details . . . . . . . . . . . . . . . . . . . . . . 84
Input Sections . . . . . . . . . . . . . . 84
MUX and ADC . . . . . . . . . . . . . . 84
DSP . . . . . . . . . . . . . . . . . . . . 85
Power Supplies . . . . . . . . . . . . . . 85
Accessories . . . . . . . . . . . . . . . . . . . 85
Current Measurement . . . . . . . . . . 85
Voltage Measurement . . . . . . . . . . 86
Soft Carrying Case . . . . . . . . . . . . 86
USB Data Cable . . . . . . . . . . . . . 86
Specifications 87
Input . . . . . . . . . . . . . . . . . . . . . . 87
Input Configuration . . . . . . . . . . . 87
Voltage . . . . . . . . . . . . . . . . . . 88
Current . . . . . . . . . . . . . . . . . . 88
Interface . . . . . . . . . . . . . . . . . . . . . 88
Operator Interface . . . . . . . . . . . . 88
Power Supply Requirements . . . . . . . . . . 88
Batteries . . . . . . . . . . . . . . . . . . 88
External Power Supply . . . . . . . . . . 89
Measurements . . . . . . . . . . . . . . . . . . 89
Voltage and Current . . . . . . . . . . . 89
Phase Angle, A to B . . . . . . . . . . . 89
Frequency . . . . . . . . . . . . . . . . . 89
Harmonics . . . . . . . . . . . . . . . . . 89
Waveform . . . . . . . . . . . . . . . . . 90
Power and Energy Quantities . . . . . . 90
General . . . . . . . . . . . . . . . . . . . . . 90
Physical . . . . . . . . . . . . . . . . . . 90
Environmental . . . . . . . . . . . . . . 90
x
Page 11

AC Power Adapter . . . . . . . . . . . . . . . 91
MN352 Current Probe . . . . . . . . . . . . . 92
Probe Specifications . . . . . . . . . . . 92
Keypad Definitions 93
Primary Keys . . . . . . . . . . . . . . . . . . 93
Secondary Keys . . . . . . . . . . . . . . . . . 95
CT Input Connector 97
928A Current Input Connector . . . . . . . . 97
CT Cable Connector . . . . . . . . . . . . . . 98
Phase Conventions 99
CE Mark Certification 101
xi
Page 12

xii
Page 13

List of Figures
1 Battery Compartment . . . . . . . . . . . 7
2 Bail Assembly attached to lower holes . . 9
3 Bail Assembly attached to upper holes . . 9
4 Point Limit Profile . . . . . . . . . . . . . 48
5 Mlink Installation Screen . . . . . . . . . 68
6 Mlink Connection Window . . . . . . . . 69
7 Windows XP COM Port Assignment . . . 70
8 Mlink Main Window . . . . . . . . . . . . 71
9 Load CT Profiles . . . . . . . . . . . . . 72
10 Configure User Screens Window . . . . . 74
11 Download Triggers Window . . . . . . . . 75
12 Power Quality Settings . . . . . . . . . . 76
13 Power Quality Point Limits . . . . . . . . 79
14 Upload Firmware Window . . . . . . . . 82
15 928A Current Connector Layout . . . . . 97
16 CT Cable Connector – side view . . . . . 98
17 CT Connector End View . . . . . . . . . 98
xiii
Page 14

xiv
Page 15

Introduction
Scope
Welcome to Arbiter Systems’ Power System Multimeter with Floating Point DSP! The Model 928A
Power System Multimeter is filled with great features
to help you measure electrical power. Whether you are
a new or experienced user, you should find the Model
928A easy to use and accurate. Three power sources
include alkaline or NiMH AA cells, and a +7 Vdc wall
adapter for continuous use. The alkaline cells provide
about 30 hours of use, and the NiMH should provide
about 60 hours of use.
Features
128X64 graphic LCD display
30-key multi-function keypad
Isolated USB serial interface
4 AA cells or a +7 Vdc plug-in power supply
Flash memory for approximately 6500 records
Accurate internal real time clock
Mlink application software
Page 16

Simple Measurement
To measure, simply set the inputs for voltage or current, connect the correct set of cables and press the
desired function button.
Recording Data
Store data by pressing the STO button or using one of
the Auto-Log features. The 928A also stores Sags and
Swells, and standard Triggers in flash memory. 400
kB of flash memory provides enough space to store
thousands of records.
Safety and Usage Information
Read the usage and safety information inside this manual. Dangerous voltages may be present at the terminals of the equipment you are measuring, so take
precautions! Safety symbols are used throughout this
manual to signify potential hazards to the equipment
or to you, the user. Some of these are as follows.
“Warning” - identifies an action or a condition that
poses a hazard to the user.
“Caution” - identifies a condition or action that may
cause the incorrect operation or damage to the Model
928A.
Caution: Max CT Input Level
Never apply any signal directly to the CT inputs of
Channel A or B greater than 1.2 Arms or 1.2 Vrms.
Apply voltage and current signals to two identical
channels, labeled A and B. Prior to measuring, make
2
Page 17

sure that the channels have been correctly configured
for the signal type (whether they are voltage or current).
Caution: Direct Current Input
DO NOT connect a current signal directly to either Channel A or B. Always use a current-output or
voltage-output C T when measuring current with the
928A.
Measuring Safety and Usage
Be sure to follow all precautions and safety information
provided with any other equipment you are using.
Display
Using a 128x64 pixel display, the 928A can display all
text and graphics necessary for operation. The LCD
can be adjusted for contrast and backlighted operation.
The Instrument Case
Made from strong copolymer (similar to nylon), the
928A case is designed to protect it from certain mechanical and electrical hazards, however it is not waterproof. Water or other liquids can penetrate the case
at a number of points, which can permanently damage
the unit. Therefore, use care to protect it from rain,
spills or condensing environments.
Caution: Water Damage
The case is not waterproof. Subjecting the 928A to
rain or a wet environment will most likely damage it.
3
Page 18

Caution: CT Probe Use
Please note that the jaws of the CT probe must be
fully closed to operate properly. Some probes have a
locking device, which must be fully engaged before the
probe will operate correctly. When clamping any CT
probe around conductors, always inspect the two jaws
to make sure they are fully closed.
CT Characterization
While the 928A Starter kit includes a CT probe that
has been characterized for accuracy, Arbiter also provides a service for users to have their own CT characterized for use with the 928A. Contact Arbiter Systems
for more information on this service.
For more information on CT characterization files
(called “Profiles”), see instructions under “CT Characterization Files” on page 30.
928A Starter Kit
AP0011200 - +7 Vdc Power Supply
AP0009700 - Single-Phase Voltage Lead Set
AP0012300 - 100:1 Clamp-On CT 150 A 10 mV/A
BT0000201 - 1.5 Volt AA Alkaline Battery (4)
CA0026106 - 928A USB Cable A-B 6 ft.
CA0027200 - 928A CT Cable Voltage Output
PD0030900 - Operation Manual
HD0069800 - 928A Soft Carrying Case
CTCAL01 - CT Calibration (100 mA – 100 A)
AS0082900 - 928A Bail Assembly
4
Page 19

Getting Started
Keyboard Operation
Most of the keys on your 928A perform one primary
and one secondary function. The primary function of
any key is indicated by the characters on the face of
the key; for example, ON. The secondary functions are
indicated above the key; for example, RCL above the
HOLD key. See page 93 for key definitions.
Primary Function Keys
Primary keys need only to be pressed to function. For
example, press to set the multimeter mode to read
voltage and/or current for Channel A and B.
Secondary Function Keys – 2nd key
First press followed by any key with symbol
marked in blue above it.
Navigating Menus to Configure
1. To select a configure mode, press any function
key, then 2nd > MENU. For example, PQ >
2nd > MENU, or 2nd > LOG > 2nd > MENU.
Page 20

2. Scroll through fields using the or key and
press ENT to move the cursor to the value field.
3. Press , or number keys to change these values;
press ENT to install and move to another value.
4. To save changes and exit, highlight <STOre And
Exit> and press ENT. Alternatively, press STO.
Power Supply, On and Off
Press ON to power the 928A ON and OFF. To conserve power, the multimeter can be configured to automatically turn itself off after an adjustable period of
inactivity.
For help on supplying inlet power, whether connecting the power source or installing batteries, see
page 7ff.
Auto Power Shutdown
The 928A auto shutdown feature allows you to select
whether you want the 928A to automatically shutdown
or not. To automatically shut down and conserve batteries, use the the Auto Shutdown menu under the
Main Menu. A number of different time intervals are
available in which the 928A will automatically power
down. See Auto Shutdown on page 17.
Battery Power Only
The Model 928A operates on four AA alkaline or
Nickel-Metal Hydride batteries. In the event of a battery failure, always carry a spare set of fully-charged
batteries.
6
Page 21
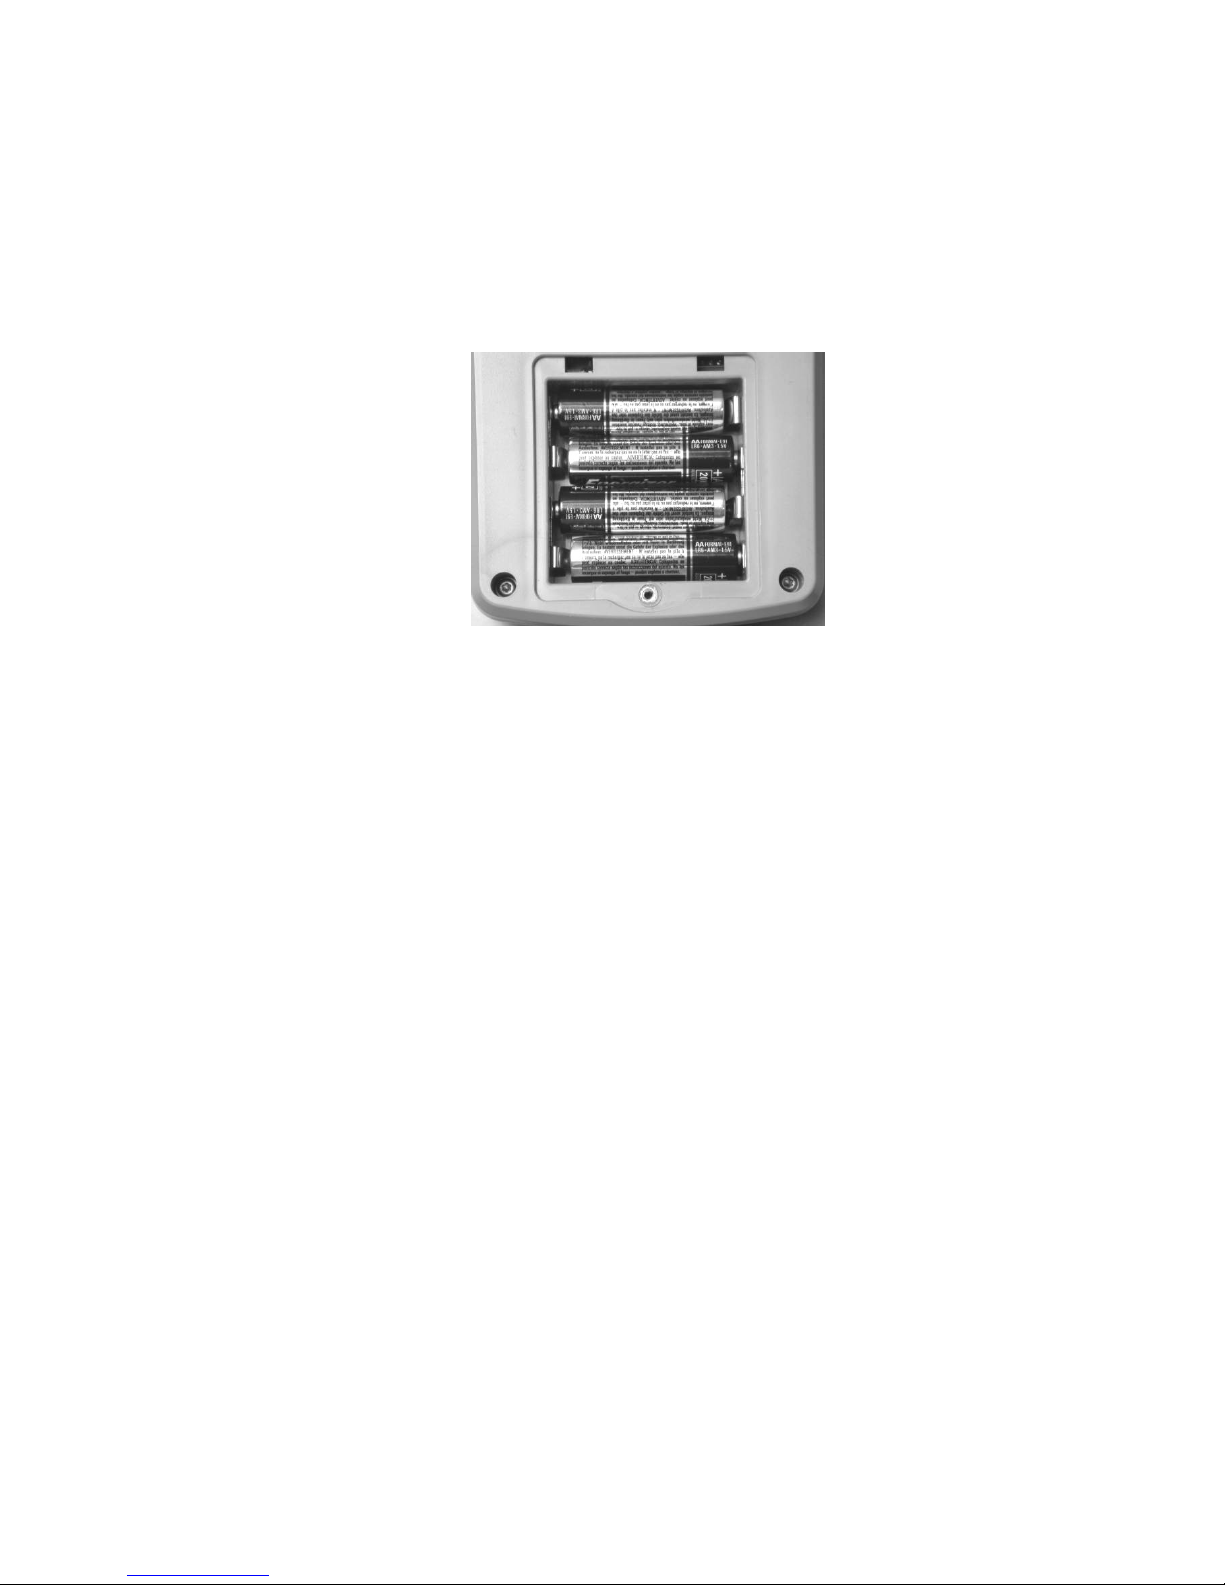
Battery Replacement
1. Power off the 928A prior to removing the batteries.
2. Remove the battery cover retaining screw and
remove the cover by pulling it upwards at the
screw side. See Figure 1.
3. Replace the batteries. Note that battery orientation is indicated by polarity symbols.
4. Replace the battery cover and retaining screw
and put back into service.
Figure 1: Battery Compartment
Caution: To optimize reliability, and reduce the
possibility of corrosion between the contacts, keep all
terminals as clean as possible. One method of cleaning the Model 928A battery terminals is to rub them
periodically with a cotton-tipped swab moistened with
denatured alcohol.
7
Page 22

AC Power Adapter
Included in the Model 928A Starter Kit is a power
adapter (Arbiter part no. AP0011200) that provides
power to the 928A and is suitable for continuous use.
The power adapter is not designed to charge batteries located in the battery compartment. For power
adapter details and specifications, see “AC Power
Adapter” on page 91.
Caution: The AC power adapter does not charge
internal batteries. Batteries are disconnected when
power adapter is connected to the Model 928A.
Operating with AC Adapter
The power adapter supplies power to the 928A for normal operation. While using the power adapter, any
batteries installed in the 928A are disconnected. To
operate the 928A with the accessory power adapter:
1. Attach the power supply to a line outlet from 90
to 264 Vac and 47 to 63 Hz.
2. Connect the 3.5 mm mini-plug into the 928A
power receptacle.
3. Press ON to operate the 928A.
Bail Assembly
The Model 928A Starter Kit comes with a bail assembly for propping up the 928A and convenient viewing.
Note that the plastic inserts on the ends of bail assembly slide into the pair of mounting holes on the top
or bottom of the rear panel. See Figures 2 and 3 for
details.
8
Page 23
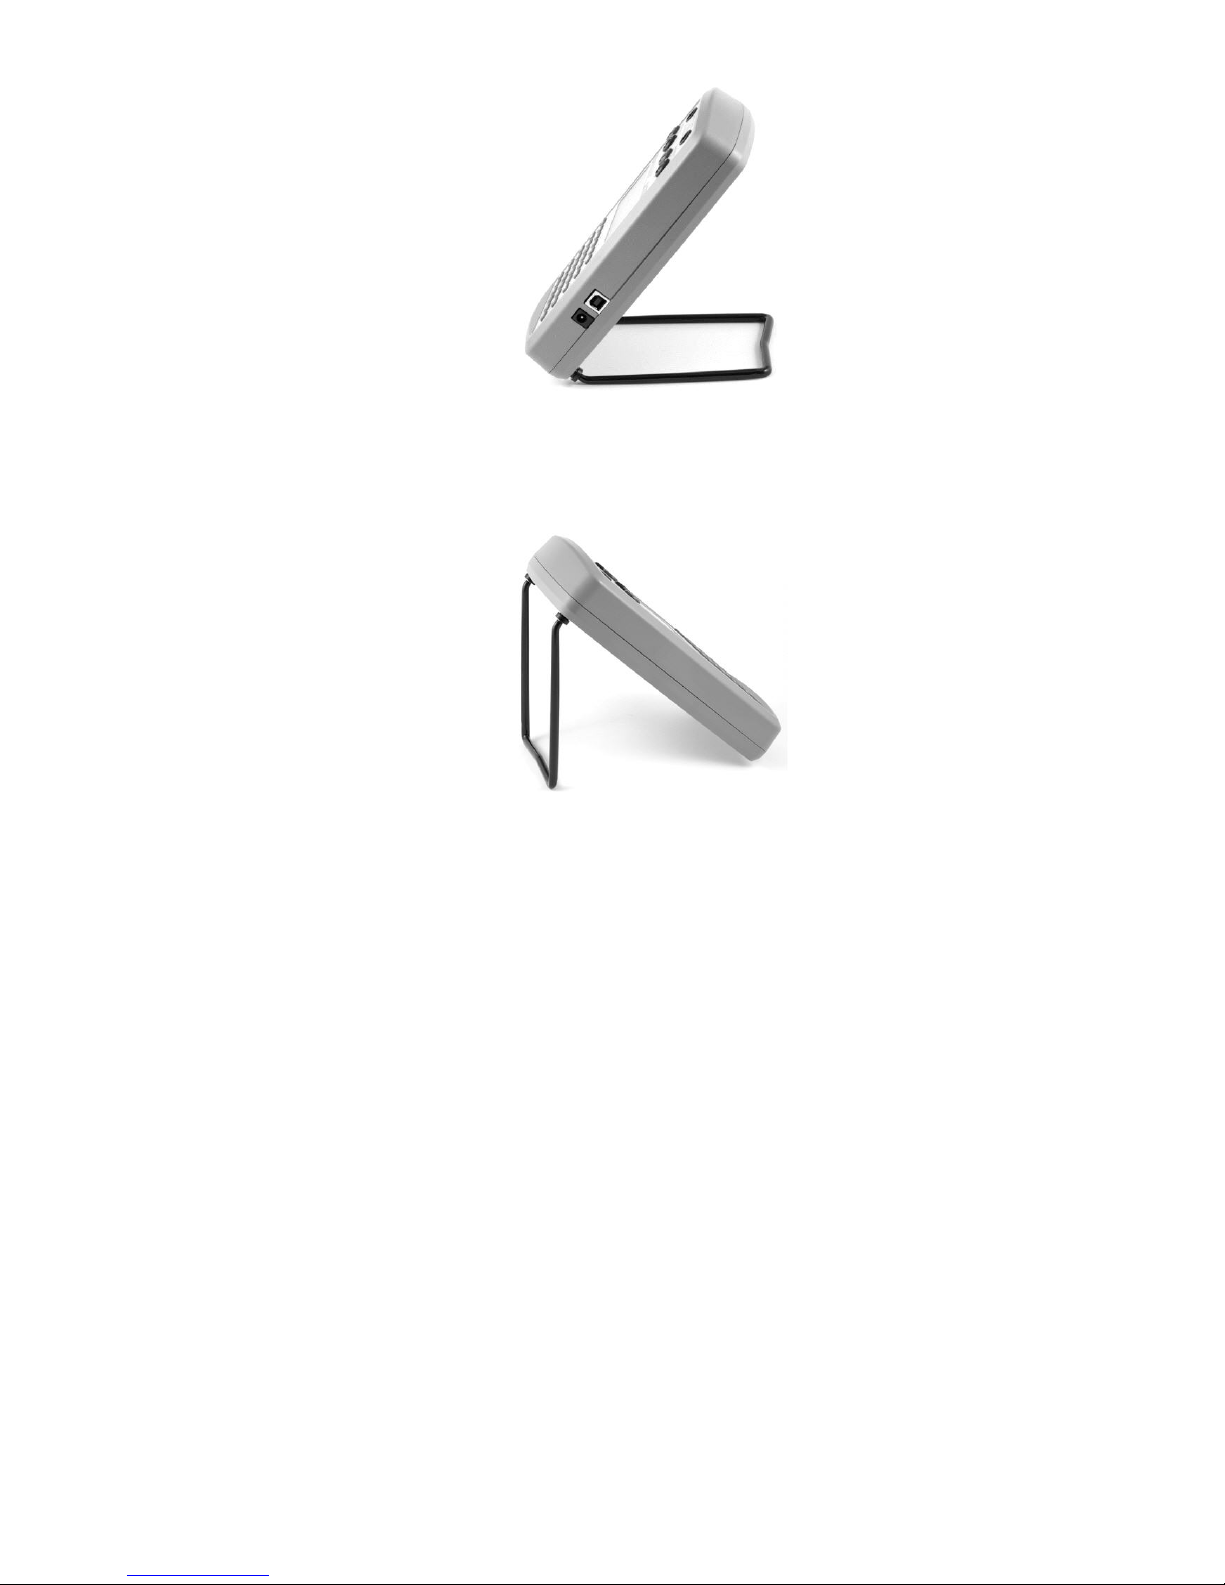
Figure 2: Bail Assembly attached to lower holes
Figure 3: Bail Assembly attached to upper holes
9
Page 24
Measurement Terminals
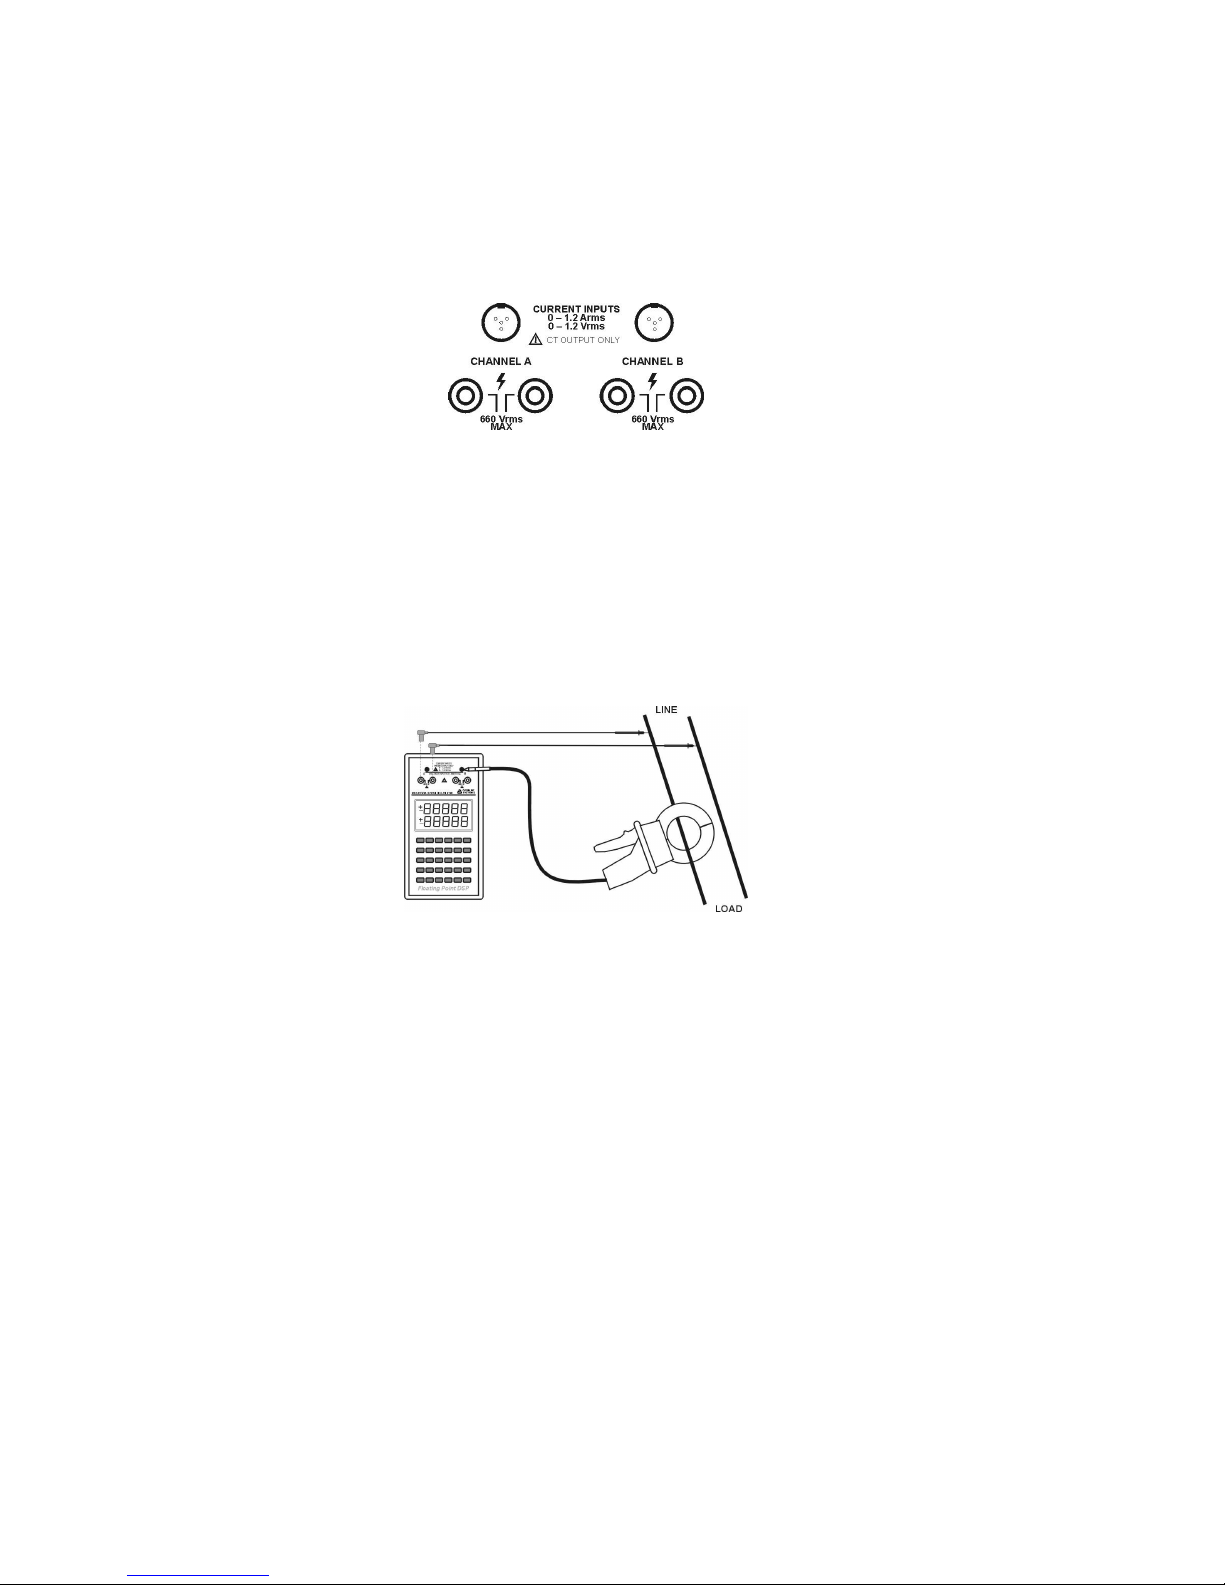
The Model 928A has two identical sets of measurement
terminals, c alled Channel A and Channel B, that accept either a voltage or a current. To measure a current, select one of the current input connectors at the
top of the instrument. To measure a voltage, select a
set of voltage terminals found below the current input
connectors.
Caution: Maximum Input, Current Terminals: 0 to
1.2 Arms or 0 to 1.2 Vrms. See caution for CT probe
use on page 4.
Versatile Inputs
For basic measurements (voltage, current, frequency
and phase angle) any combination of inputs may be
used. For power and energy measurements (active
power, apparent power, reactive power or power factor), use a combination of voltage and current inputs.
10
Page 25
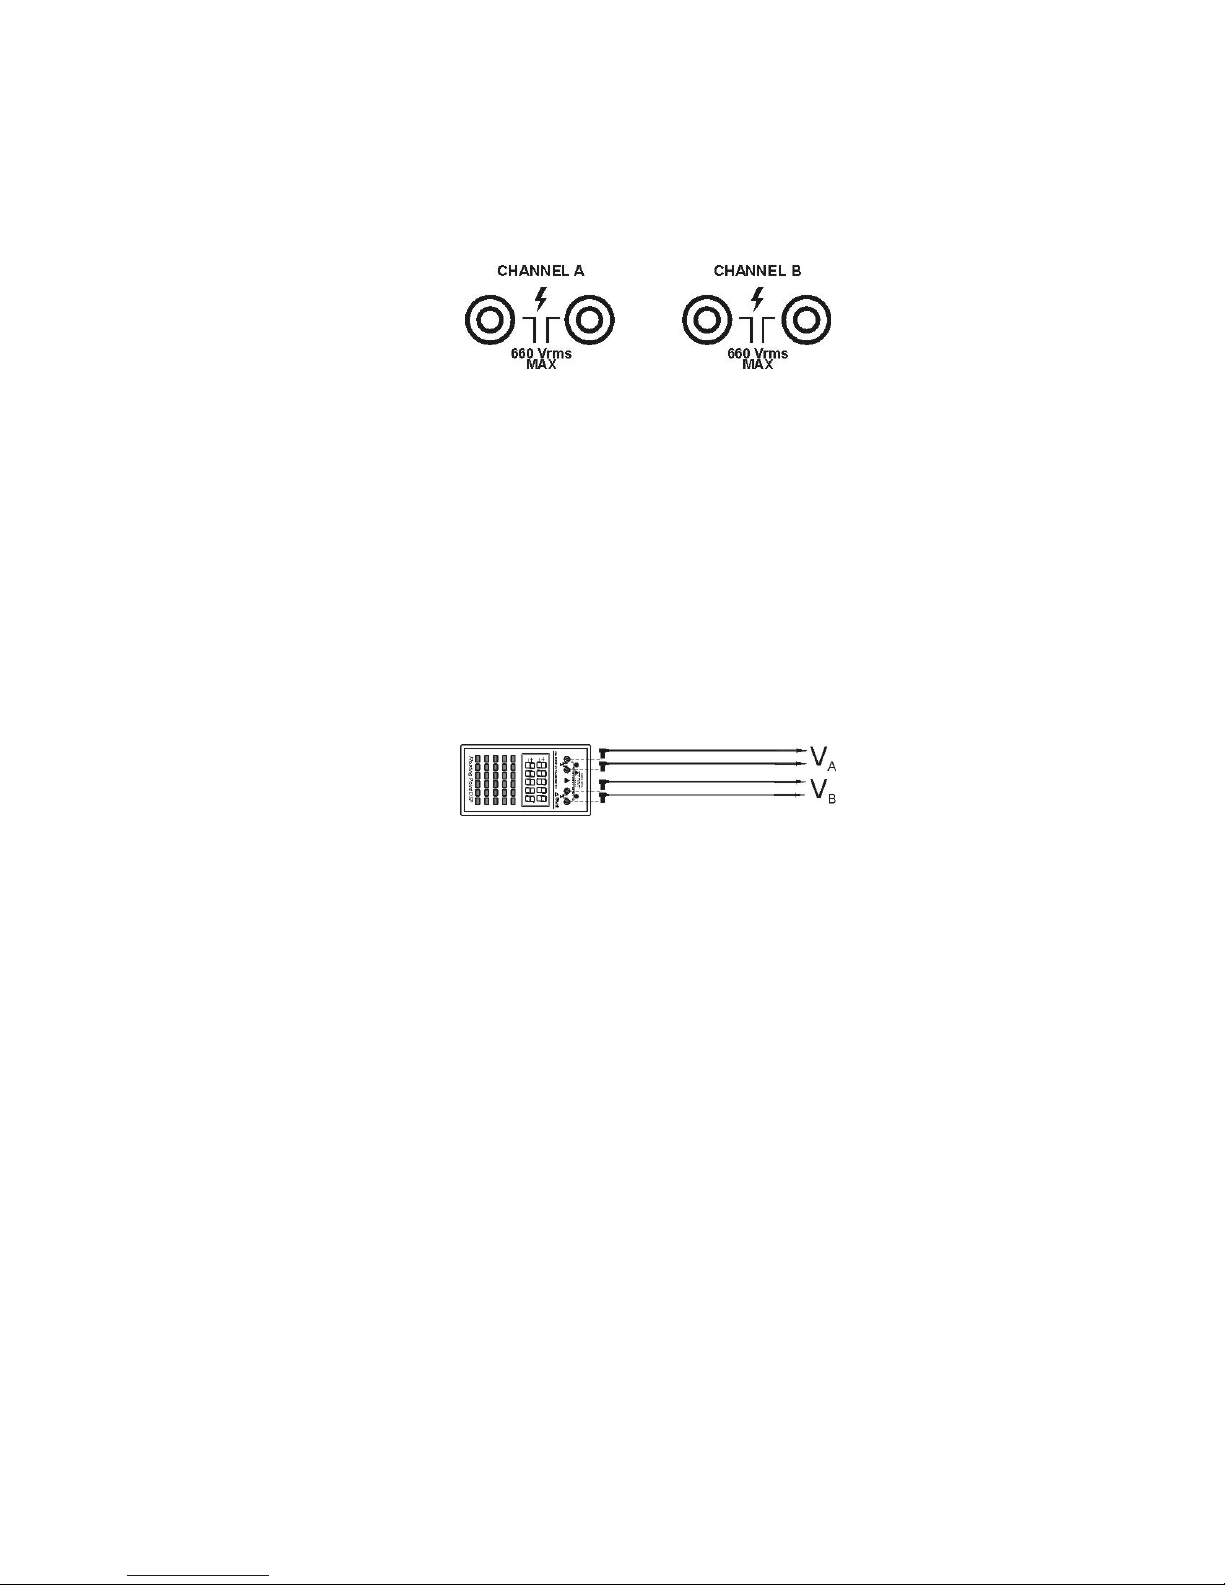
Voltage Terminals
Two sets of voltage terminals allow you to apply voltages up to 660 Vrms, max. They may also be scaled for
reading the primary voltage on a PT or transformer.
These inputs are labeled “CHANNEL A” and “CHANNEL B.”
Normally, a direct connection (e.g. 1:1) is the default selection for measuring voltages, however, you
can configure almost any voltage ratio for PT measurement at the secondary. To configure voltage ratios other than 1:1, see Configuring Channels A and B
starting on page 23.
Press 2nd > AV to measure voltage at Channel A.
Press 2nd > BV to measure voltage at Channel B.
Note: Voltage inputs are isolated by 1.2 Megohms
to each other and have a maximum input rating of 660
Vrms.
Caution - Max Voltage Input Level: Never
apply any signal to Channel A or B voltage input terminals which is greater than 660 Vrms.
11
Page 26
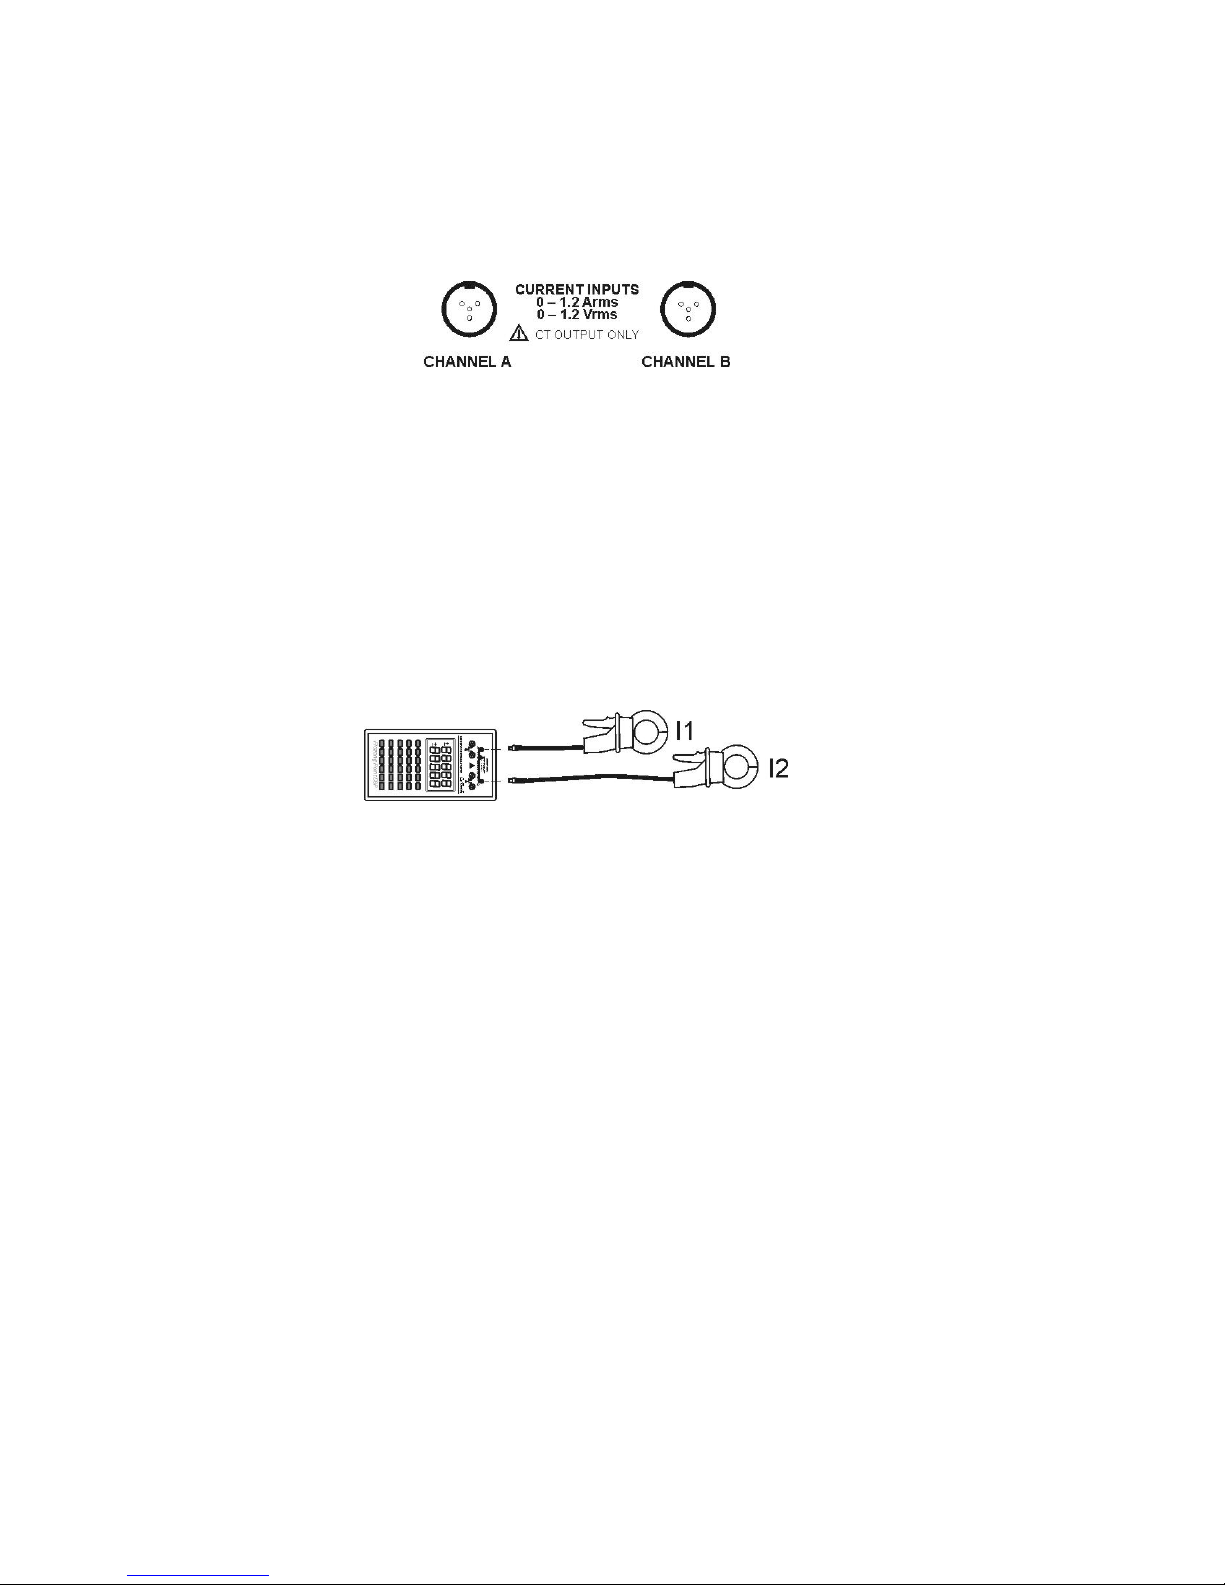
Current Terminals
Two sets of current terminals allow you to measure two
currents simultaneously. The Current Input terminals
for Channels A and B allow you to connect either a
voltage-output CT or current-output CT to the 928A.
A CT configuration screen allows you to setup CT values for both channels ahead of time.
CT configuration includes entering the CT Output
Type (either voltage or current), CT Ratio and Phase
Offset.
Press 2nd > AI to measure current at Channel A.
Press 2nd > BI to measure current at Channel B.
Note: Use care to select the correct probe type and
scale factor to be able to measure accurately. Also, if
using a characterized probe (by Arbiter Systems), be
sure to select the correct characterization file (called a
“Profile”). See CT Select, under Configuring Channels
A and B on page 25.
Caution: No Direct Current Input – connect CT
probe only. See caution for CT probe use on page 4.
12
Page 27
Caution: Maximum CT Input Level: Never apply
any signal to Channel A or B current input terminals
which is greater than 1.2 Arms or 1.2 Vrms.
Basic Functions and Keys
MIN/MAX – Range
Press the MIN/MAX key to cycle through various
measurements, including the minimum, maximum, average and normal (active). To reset MIN/MAX values
to zero, press and hold the backspace key for 3 seconds
while in MIN/MAX function.
LCD – Display Control
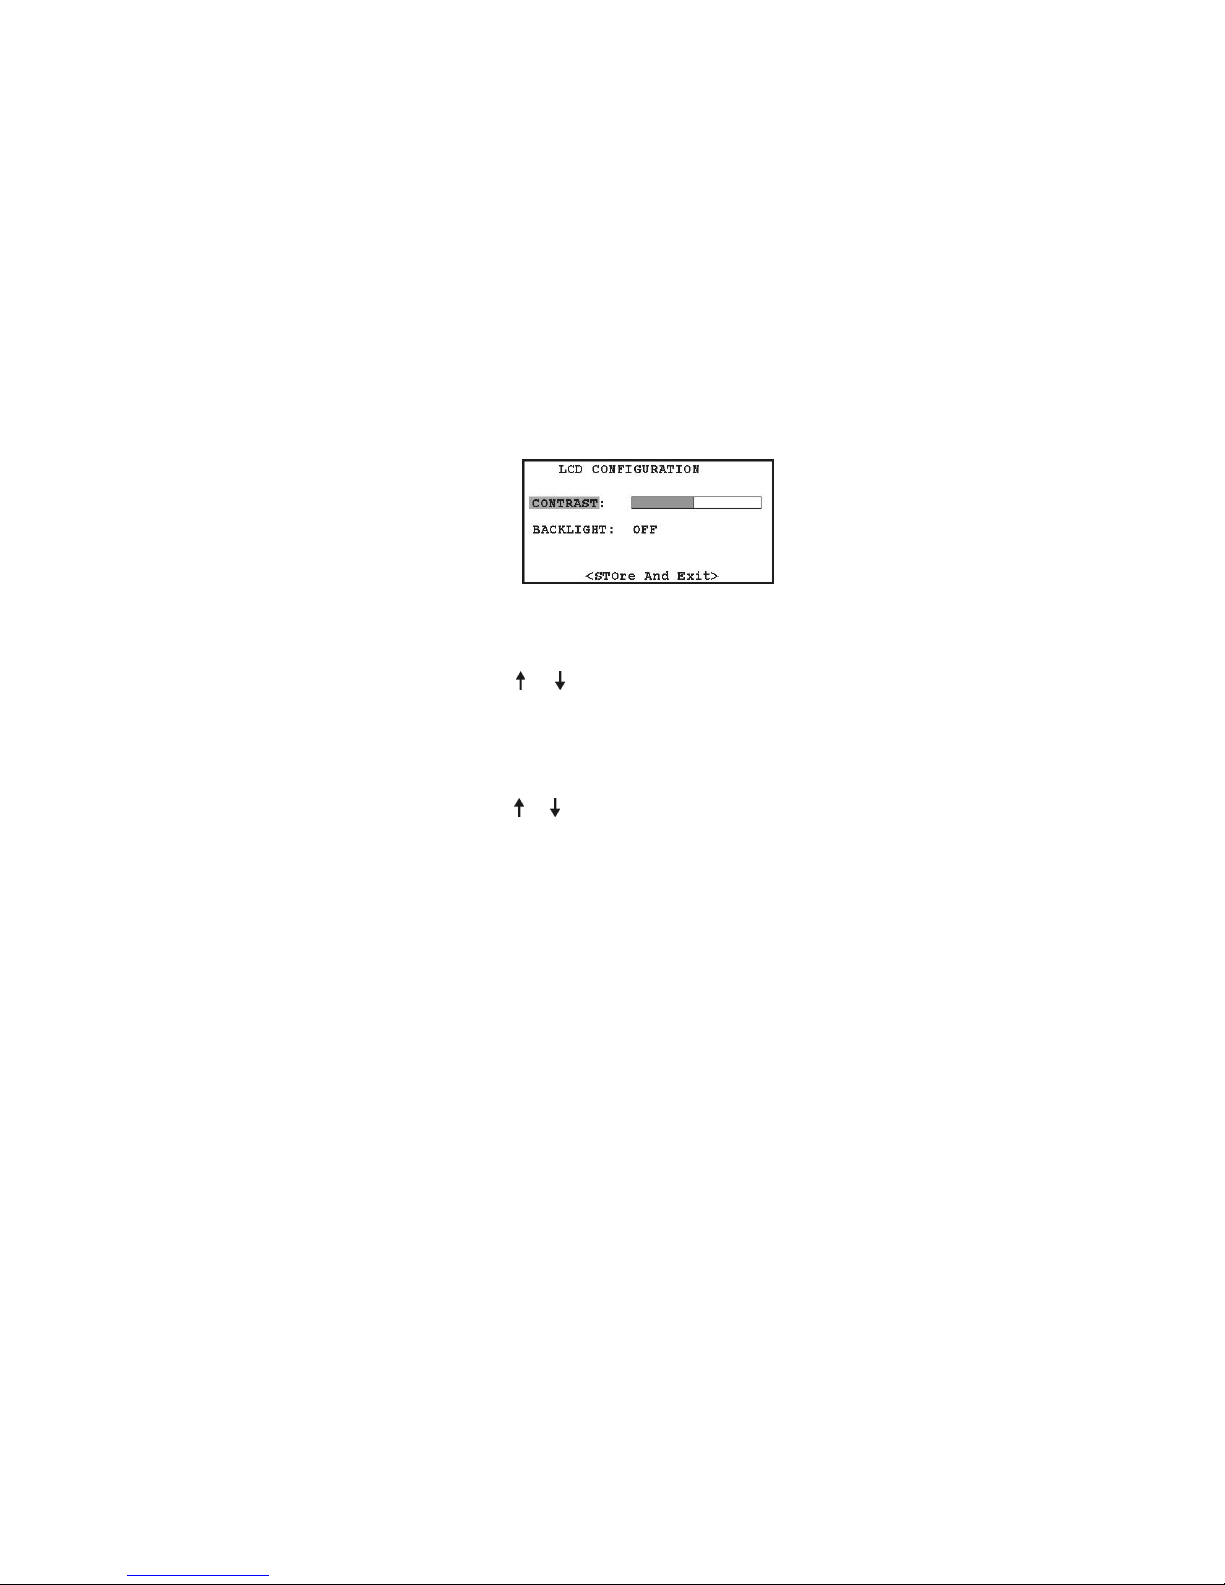
1. Press 2nd > LCD to open the LCD configuration
screen.
2. Press or to select LCD contrast or Backlight
control.
3. Press ENT to select contrast slider bar or backlight condition.
4. Press or to adjust contrast, or select backlight
ON or OFF and press ENT.
5. Highlight <STOre And Exit> with the cursor
and press ENT to install new values and exit.
13
Page 28
Function Keys, f1 – f6
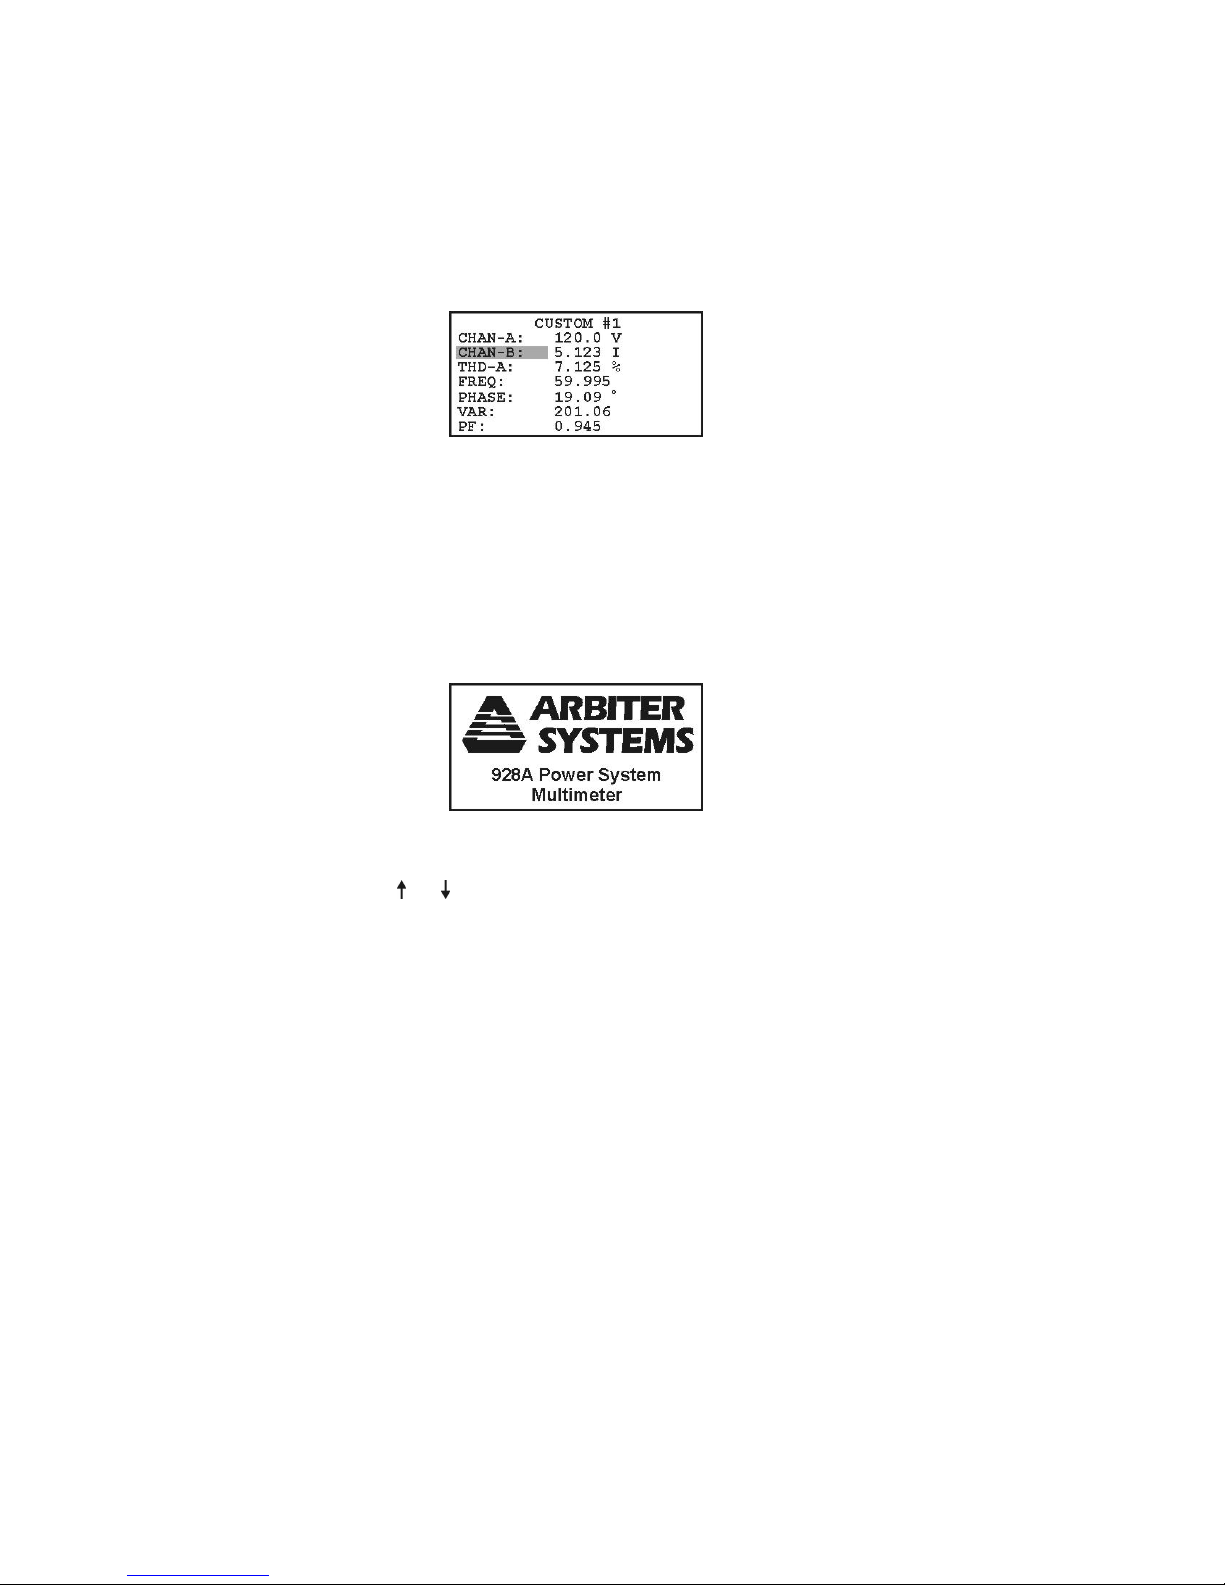
f1 - Custom User Screen
Press 2nd > f1 to access either of two custom user
screens. These screens are in tabular format and allow
up to seven functional entries. Configure all user me asurement functions through Mlink software; for more
information s ee “Mlink Software Tutorial” starting on
page 65.
f2,. . . ,f6 There are currently no functions assigned to
the secondary keys labeled f2 through f6.
Splash Screen
When first powered on, the 928A will display an introductory message that describes the 928A. Press any
of the main measurement keys (e.g. VI) to bypass the
splash screen.
Up and Down Arrows
Press or to step through values in configuration
menus or for choosing specific records held in memory.
14
Page 29
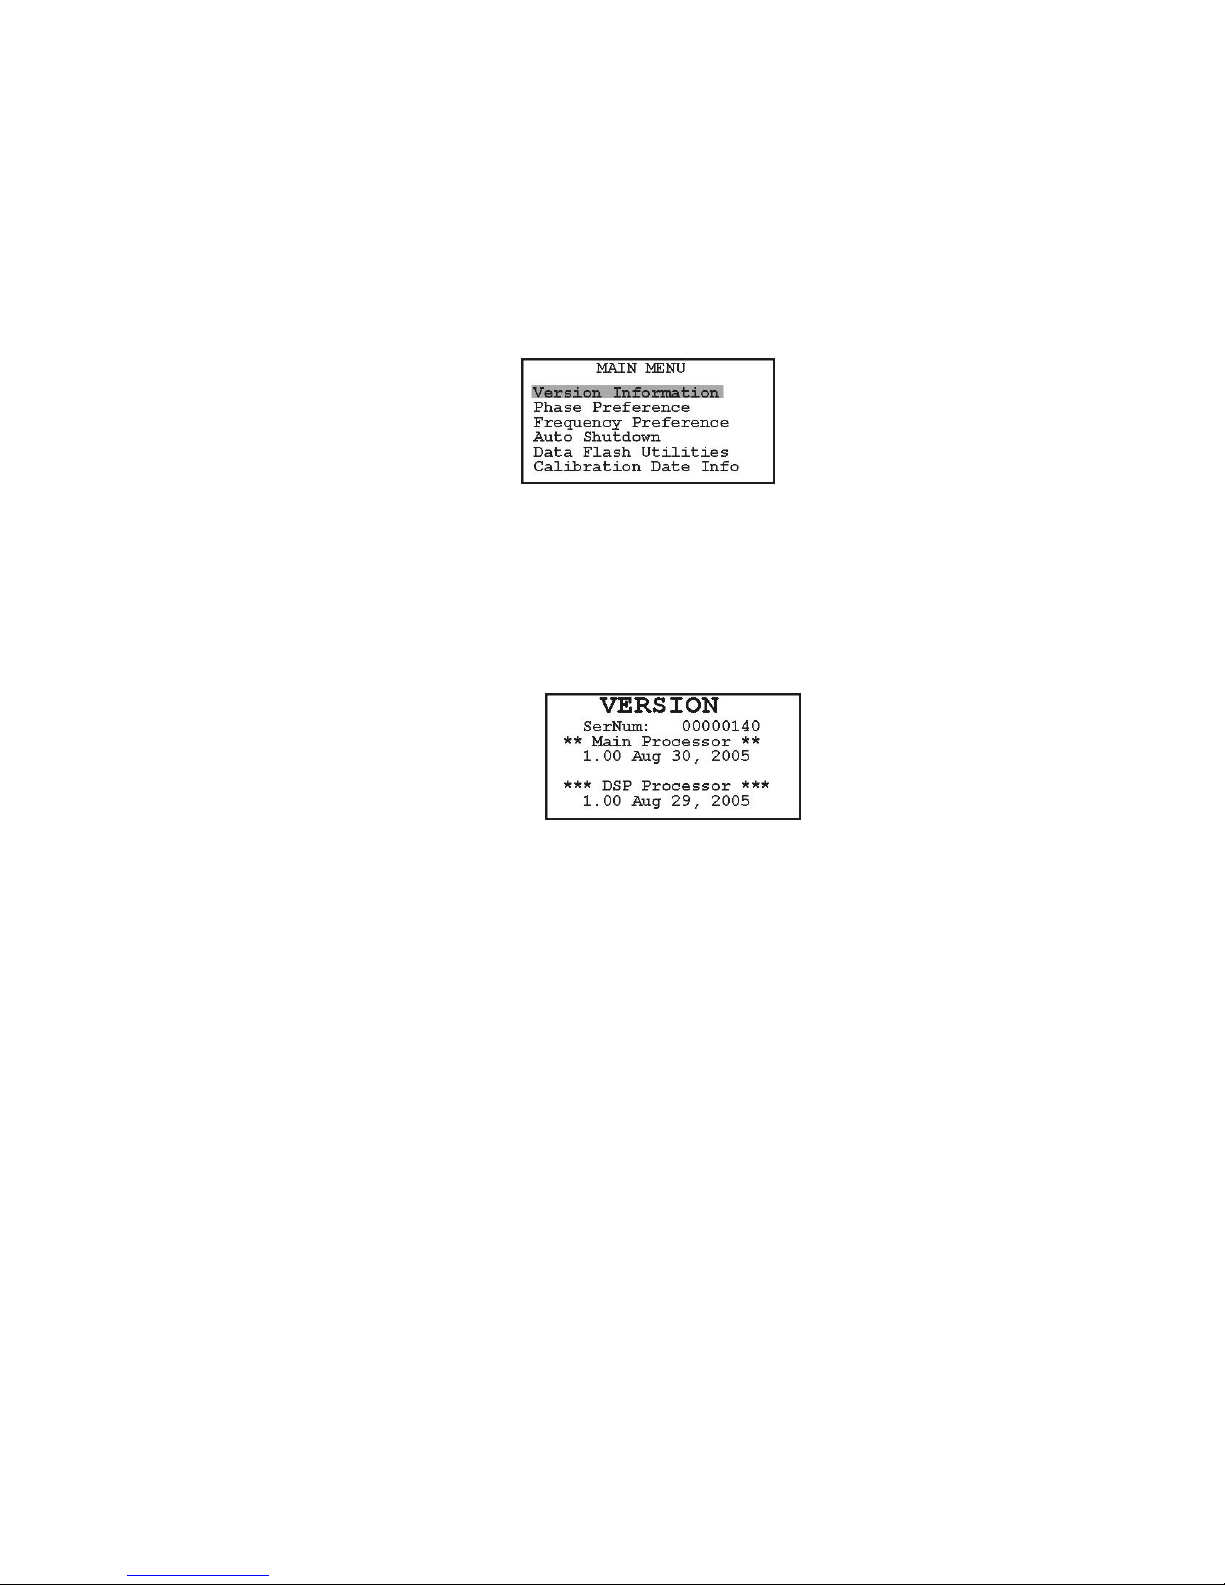
MENU – Configuration and Settings
Use the MENU key to set up the functions, preferences
and operating parameters of the 928A. Access these
menus through the Main Menu, or in context.
Main Menu
1. Press 2nd > MENU > 2nd > MENU to open
the main menu.
2. Press ESC to backup to previous menus.
Firmware Version
1. Open the main menu as shown above under Main
Menu.
2. With the cursor highlight “Version Information”
and press ENT and read the version information.
3. Press ESC to backup to previous menus.
15
Page 30
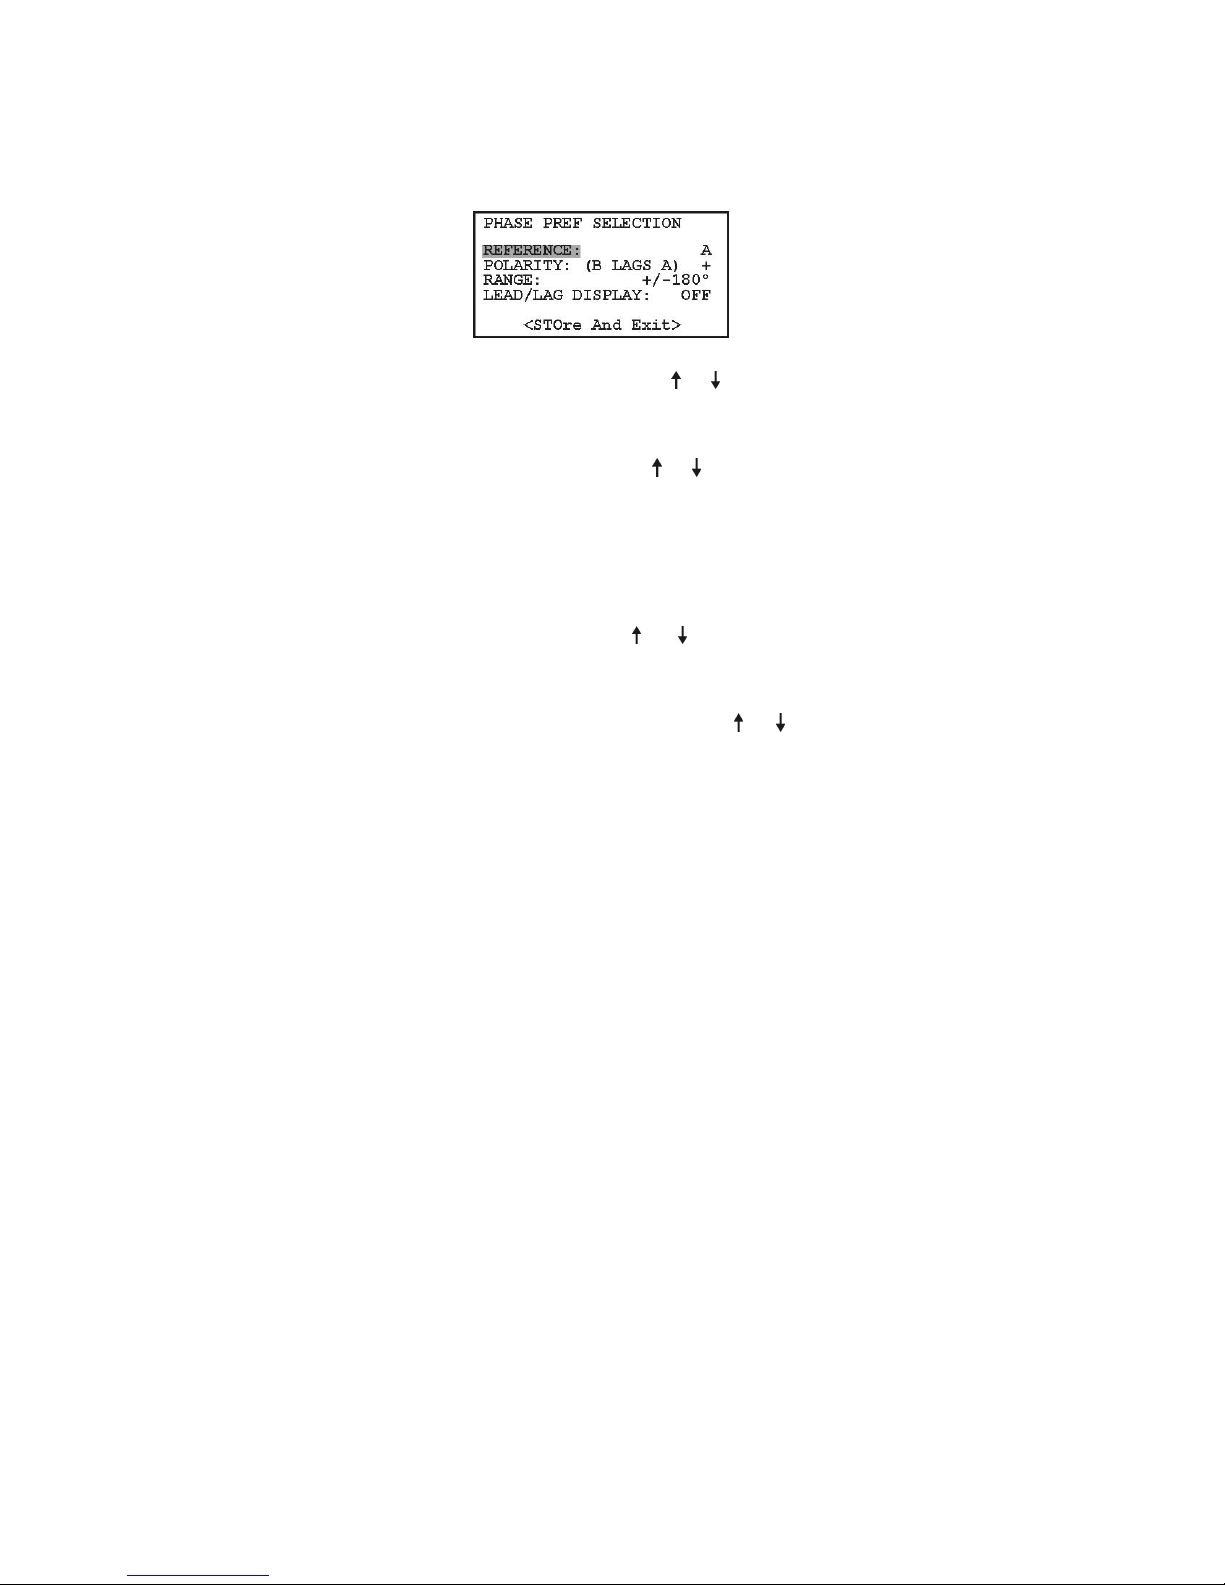
Phase Preference
1. From the Main Menu, highlight “Phase Preference” with the cursor and press ENT to open the
Phase Preference menu.
2. REFERENCE: Press ENT and or to set the
Reference to Channel A or B. Press ENT to set
it.
3. POLARITY: Press ENT and or to set
POLARITY as positive (+) or negative (-) and
ENT to set it.
Note: Notation changes from “B LAGS A”
to “A LAGS B” when switching REFERENCE
from A to B.
4. RANGE: Press ENT and or to select the
range value (to either ±180◦, or 0 − 360◦) and
ENT to set it.
5. LEAD/LAG Display: Press ENT and or to
switch the Lead/Lag display ON or OFF. When
selecting ON, the words “LEAD” or “LAG” will
be displayed in the PF (Apparent Power / Power
Factor) function.
6. Highlight <STOre And Exit> and press ENT
to install values.
16
Page 31
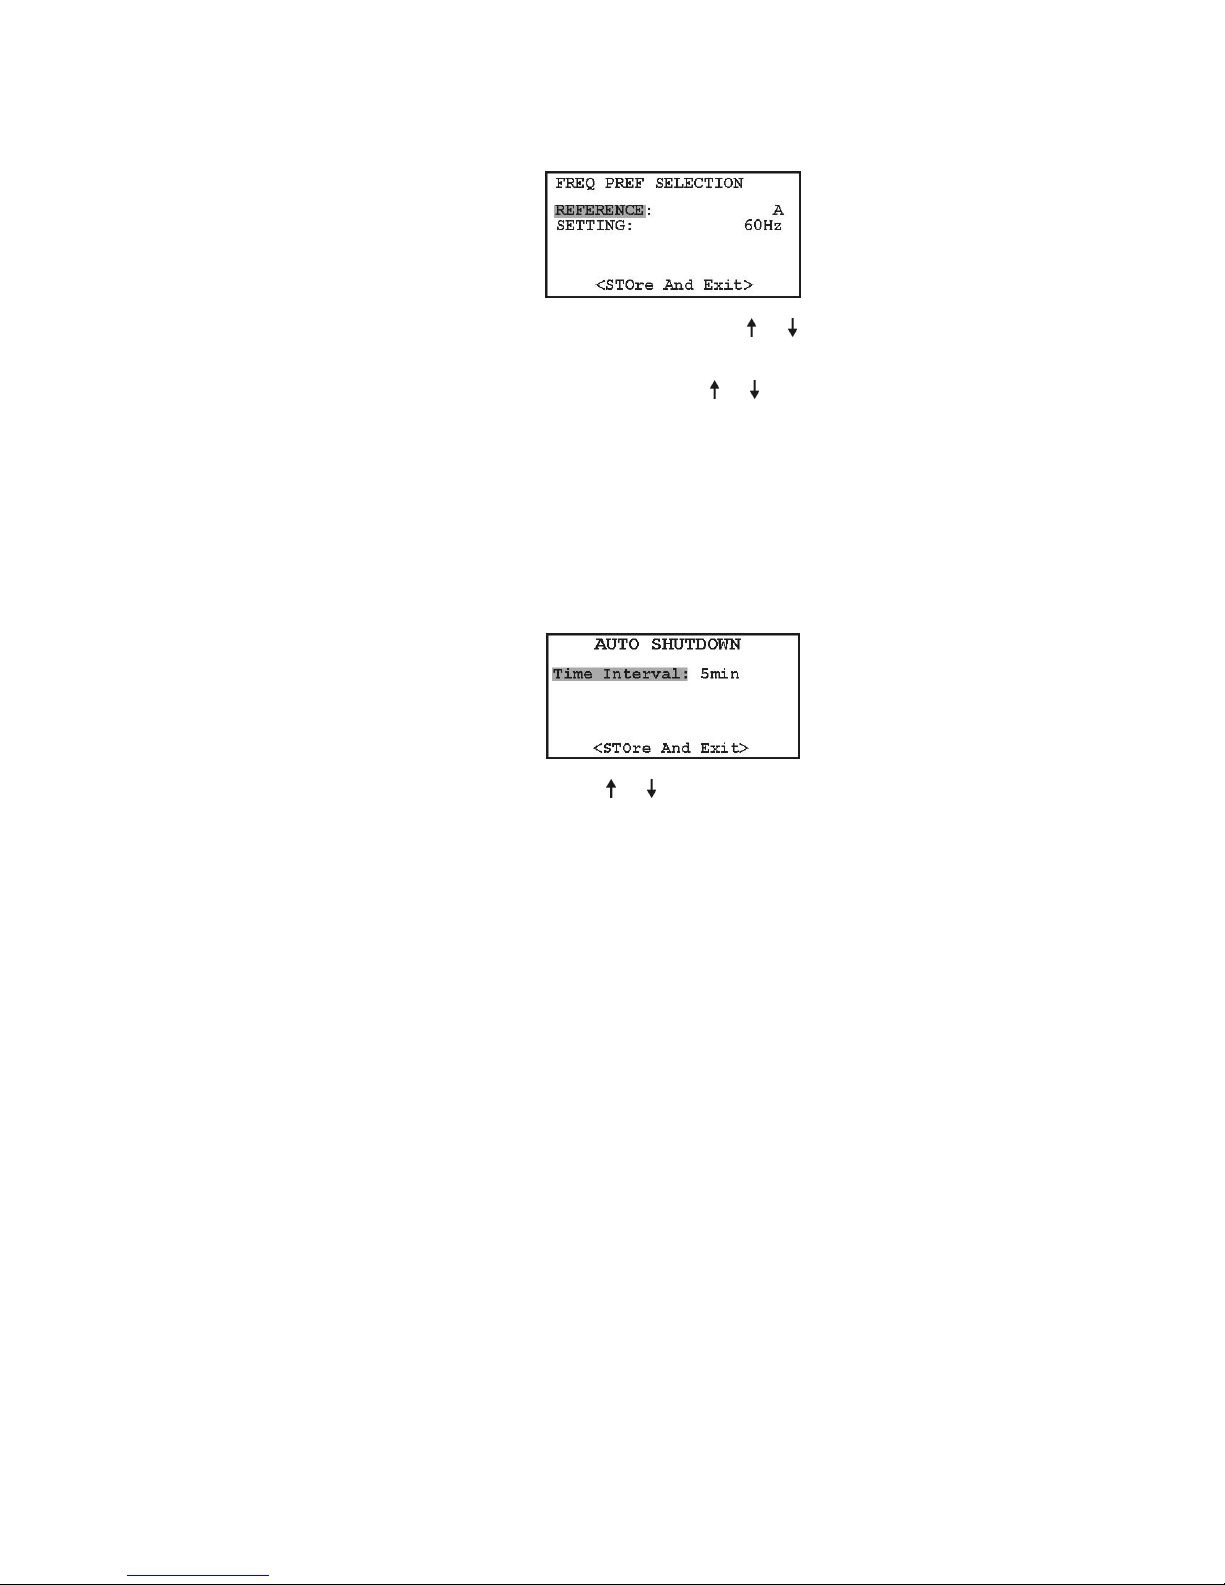
Frequency Preference
1. From the Main Menu, highlight “Frequency
Preference” and press ENT to open.
2. REFERENCE: Press ENT and or to access
and change Reference value to A or B and ENT.
3. SETTING: Press ENT and or to access and
change Frequency SETTING to either 50 Hz or
60 Hz, and ENT to set it.
4. Highlight <STOre And Exit> with the cursor
and press ENT to install the new value(s).
Auto Shutdown
1. From the Main Menu, highlight “Auto Shutdown” and press ENT to open.
2. Press ENT and or to adjust the Auto Shutdown feature OFF or to one of the time intervals
(OFF, 5min, . . . , 16hr), and ENT to set it.
3. Highlight <STOre And Exit> with the cursor
and press ENT install the new setting.
17
Page 32
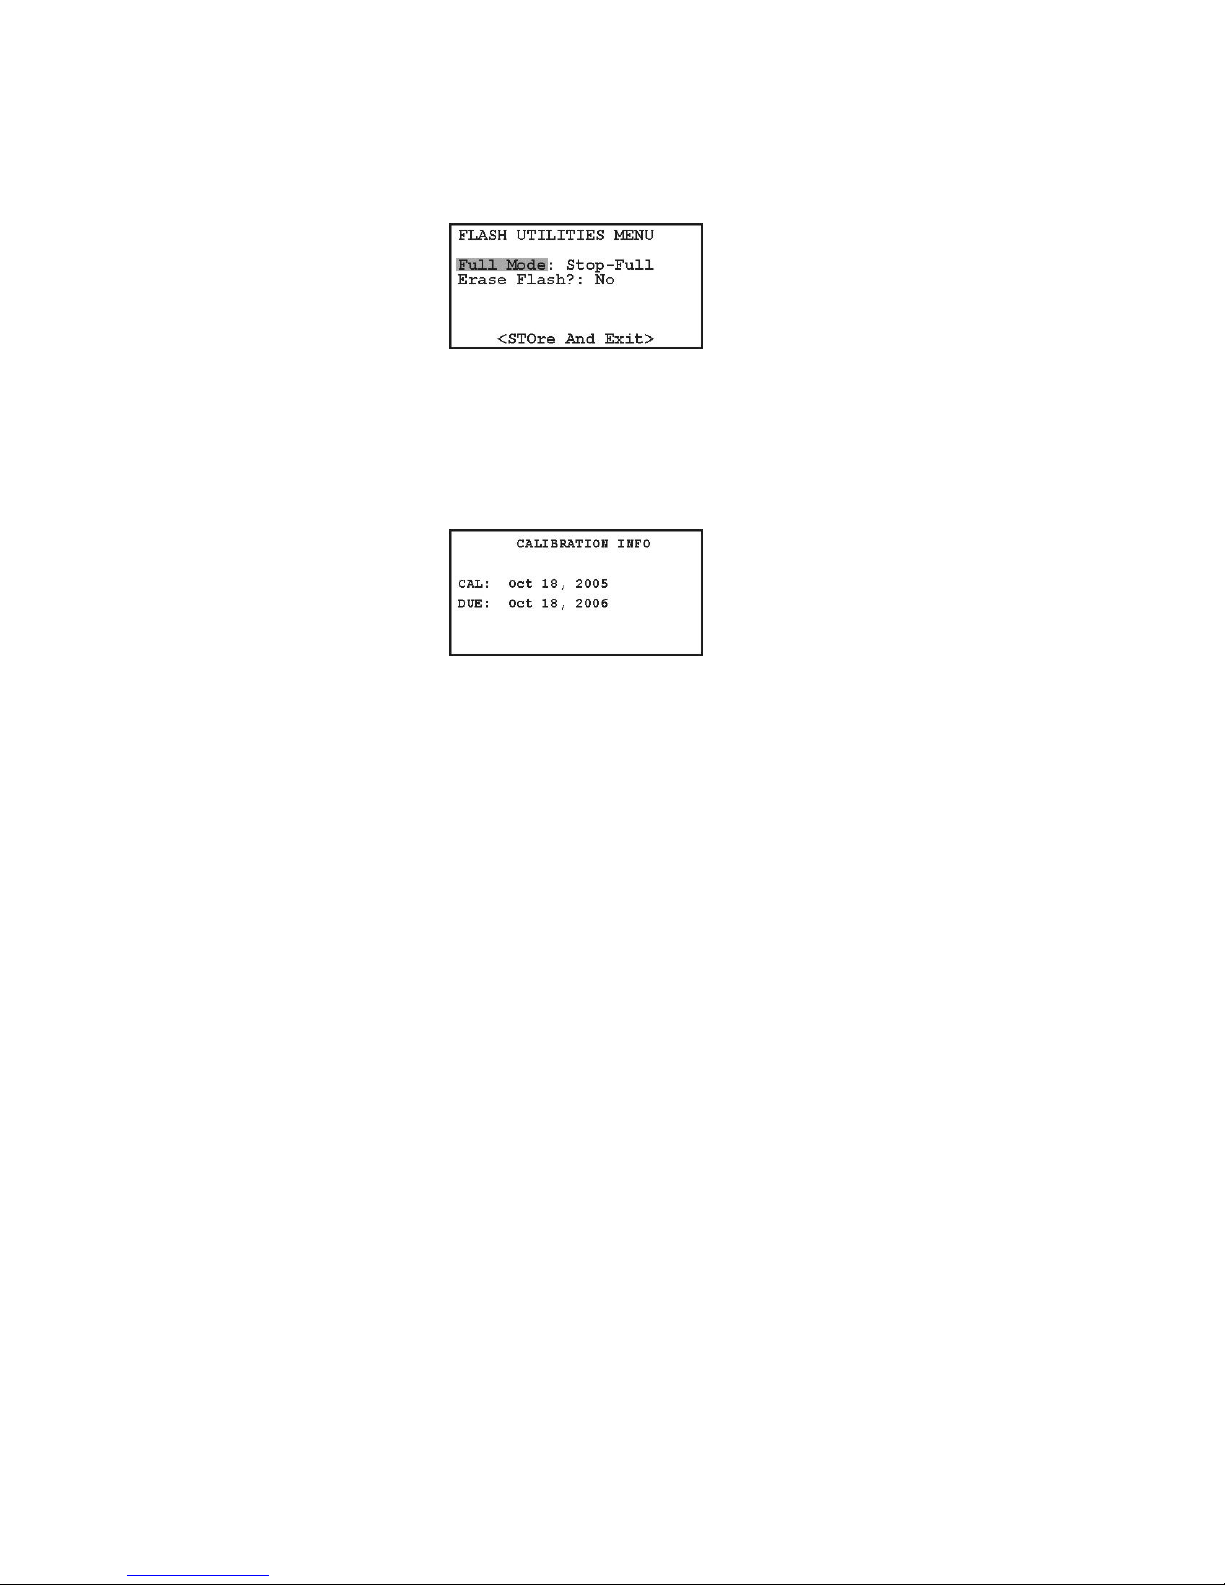
Flash Utilities Menu
Use the Flash Utilities Menu to manage 928A memory. Choose either “Stop-Full” or “Overwrite” in Full
Mode to control storage with full memory condition.
Choose “Yes” or “No” in Erase Flash? to do so.
Calibration Date Info
If your unit has a calibration certificate, highlight this
selection and press ENT to view the calibration information. Without the certificate, the menu item will
not appear.
Menus in Context
To access these menus, you will need to be viewing the
specific function and press 2nd > MENU. See specific
function (e.g. VI or PWR) for complete information.
ENT – Enter or Move
Press ENT to open a menu selection, move between
selections within a menu and to confirm a change to a
new value.
18
Page 33

ESC – Escape, Go Back
Press ESC to leave a specific menu or go back in keystrokes to the previous screen. For example, if you are
viewing the Main Menu, press ESC to leave the Main
Menu and view Channel Configuration.
STO – Store Value or Reading
Use STO to
1. Write to flash memory the current measured values at Channel A and B as shown on the display.
2. Save values during configuration of functions
(e.g. a CT ratio or phase offset and moving to
the next item). Use STO in lieu of highlighting
<STOre And Exit> and pressing ENT.
When Recording Data
The Model 928A stores records according to the date
and time running in the internal clock. Before measuring, check the clock for the correct time in the case
that it has drifted or was inadvertently changed. See
TIME and DATE, on pages 20 and 21, for more information on setting the time and date.
When Configuring Functions
To configure settings in the 928A, ge nerally you will
press 2nd > MENU while in some measurement mode
(e.g. VI). After changing any settings, press STO
to install the new value(s) in memory and leave that
menu. Also, highlight <STOre A nd Exit> then ENT
to perform the same function as STO.
19
Page 34
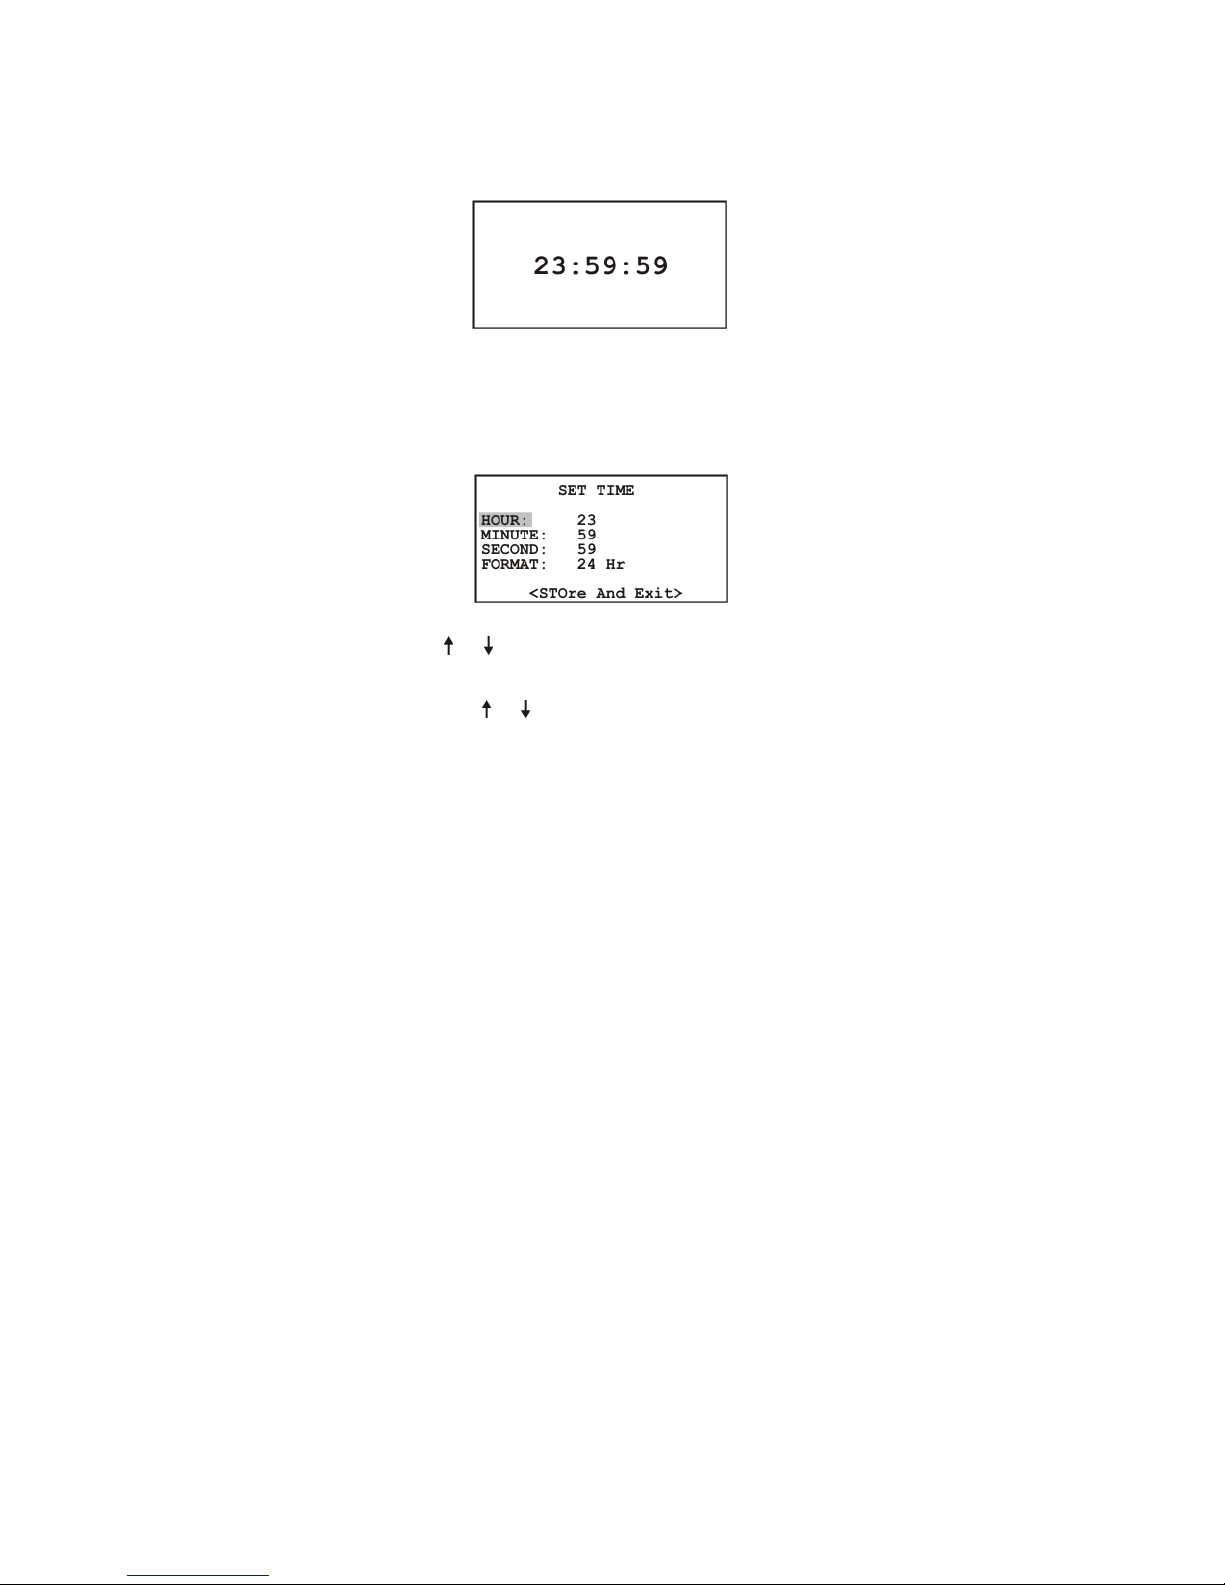
TIME – View or Set Time
Viewing the Time
Press 2nd > TIME to view the time.
Adjusting the Time
1. While viewing the time, press 2nd > MENU to
access the time adjust screen.
2. Press or to move between fields and ENT to
enter the Time value field you want to change.
3. Using the or , or number keys, adjust the desired time value, and press ENT to store. Make
any additional changes.
4. When finished, highlight <STOre And Exit>
and press ENT to install new values and return
to viewing the time.
5. Press ESC to exit the time screen.
20
Page 35
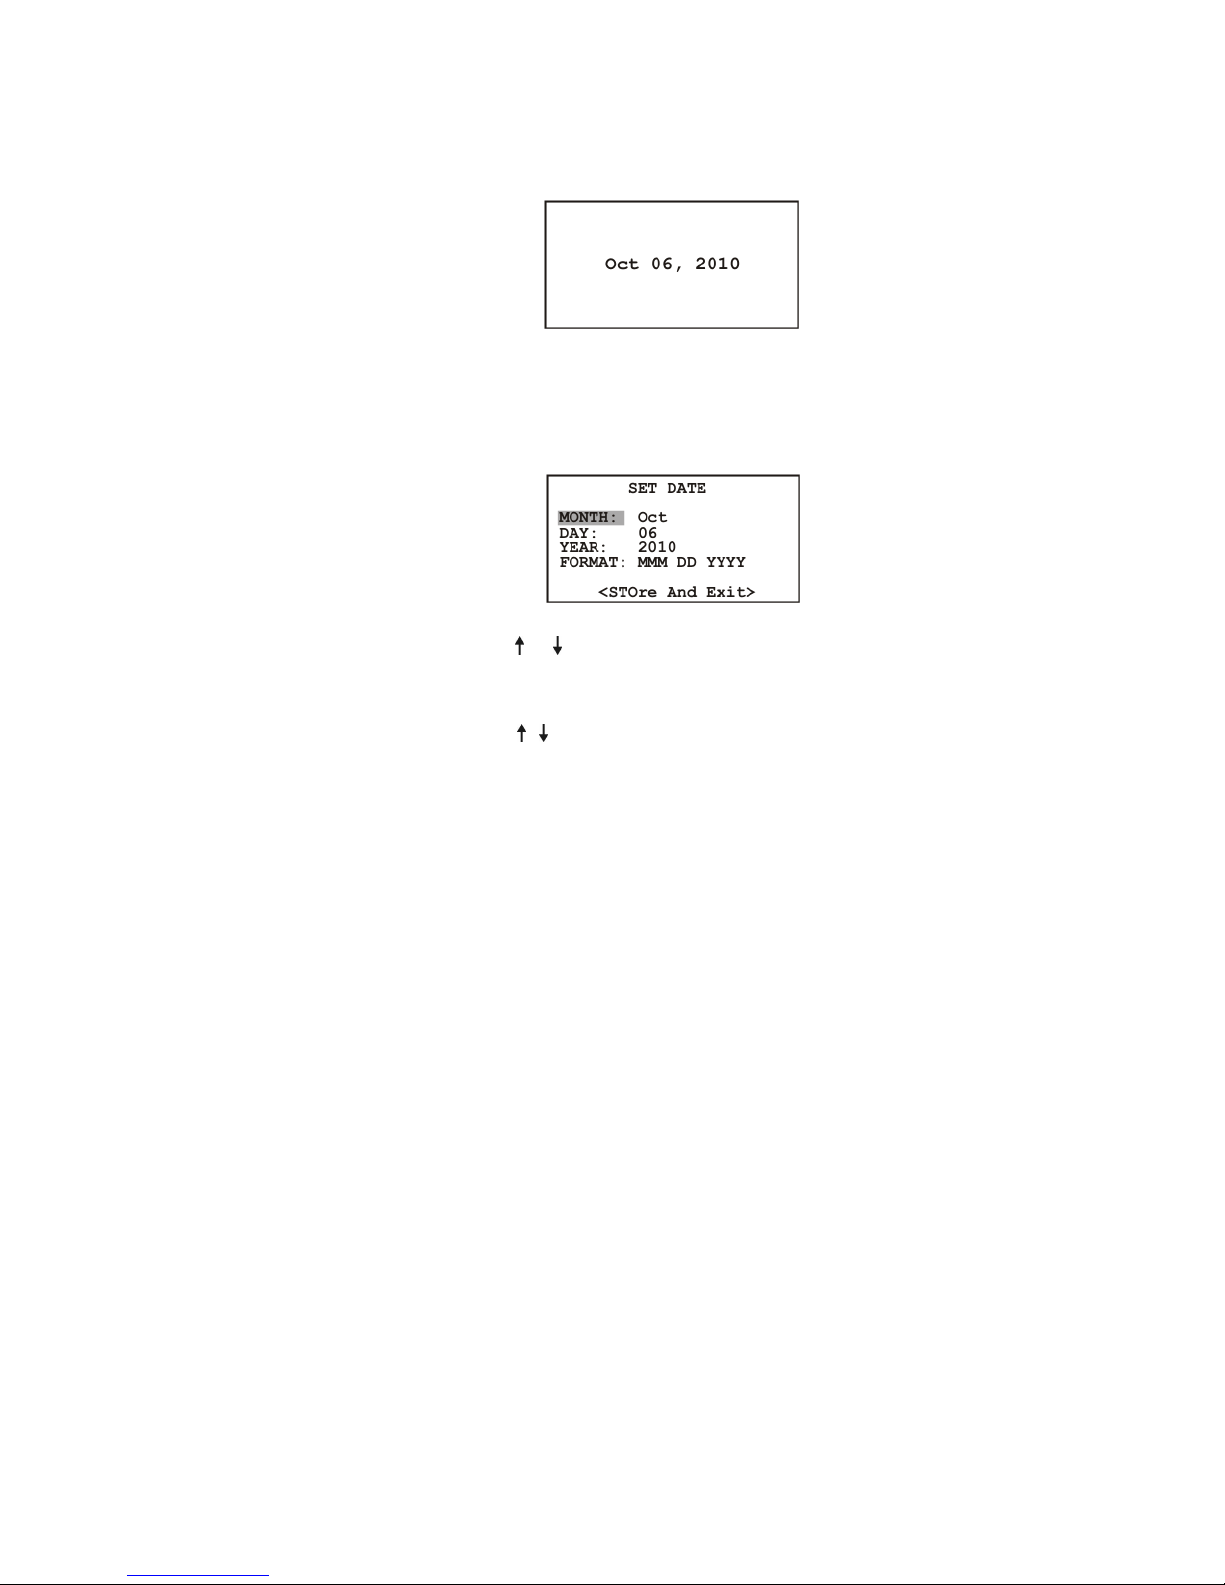
DATE – View or Set Date
Viewing the Date
Press 2nd > DATE to view the date.
Adjusting the Date
1. While viewing the date, press 2nd > MENU to
access the date adjust screen.
2. Press or to move between fields and highlight
the value you want to change. Press ENT to
enter date value.
3. Press , or number keys to adjust the desired
date value, and ENT to store.
4. When finished configuring the date, highlight
<STOre And Exit> and press ENT to install
new values and return to viewing the date.
5. Press ESC to exit the date screen.
21
Page 36

Using the Input Channels
This page describes four steps in setting up and using
channels A and B for voltage and/or current.
1. Configure the Channels: (see next page) In
this step, you will set up how the channels measure. Configure Channels A and B scaling for
reading any voltage or current signal. Once these
are set up, you should be able to select the channel and begin me asuring. Normally, you would
not keep changing these values. However, if you
change to a different CT, then you would need
to configure this step again.
2. Select the Channel: In this step, you determine what each channel is measuring. Lets say
you want to measure voltage on Channel A and
current on Channel B. To set this up, press 2nd
> AV to set Channel A for voltage and press 2nd
> BI to set Channel B for current.
If you want to set up both channels to measure
current, then,press 2nd > AI to s et Channel A
for current, press 2nd > BI to set Channel B for
current.
Note: You must press the appropriate channel
selection keys to correctly measure the desired
function.
3. Choose the Measurement Mode: For example, press
values.
4. Connect the Equipment: To measure, connect the leads between the 928A and the circuit
under test.
to display voltage and/or current
22
Page 37
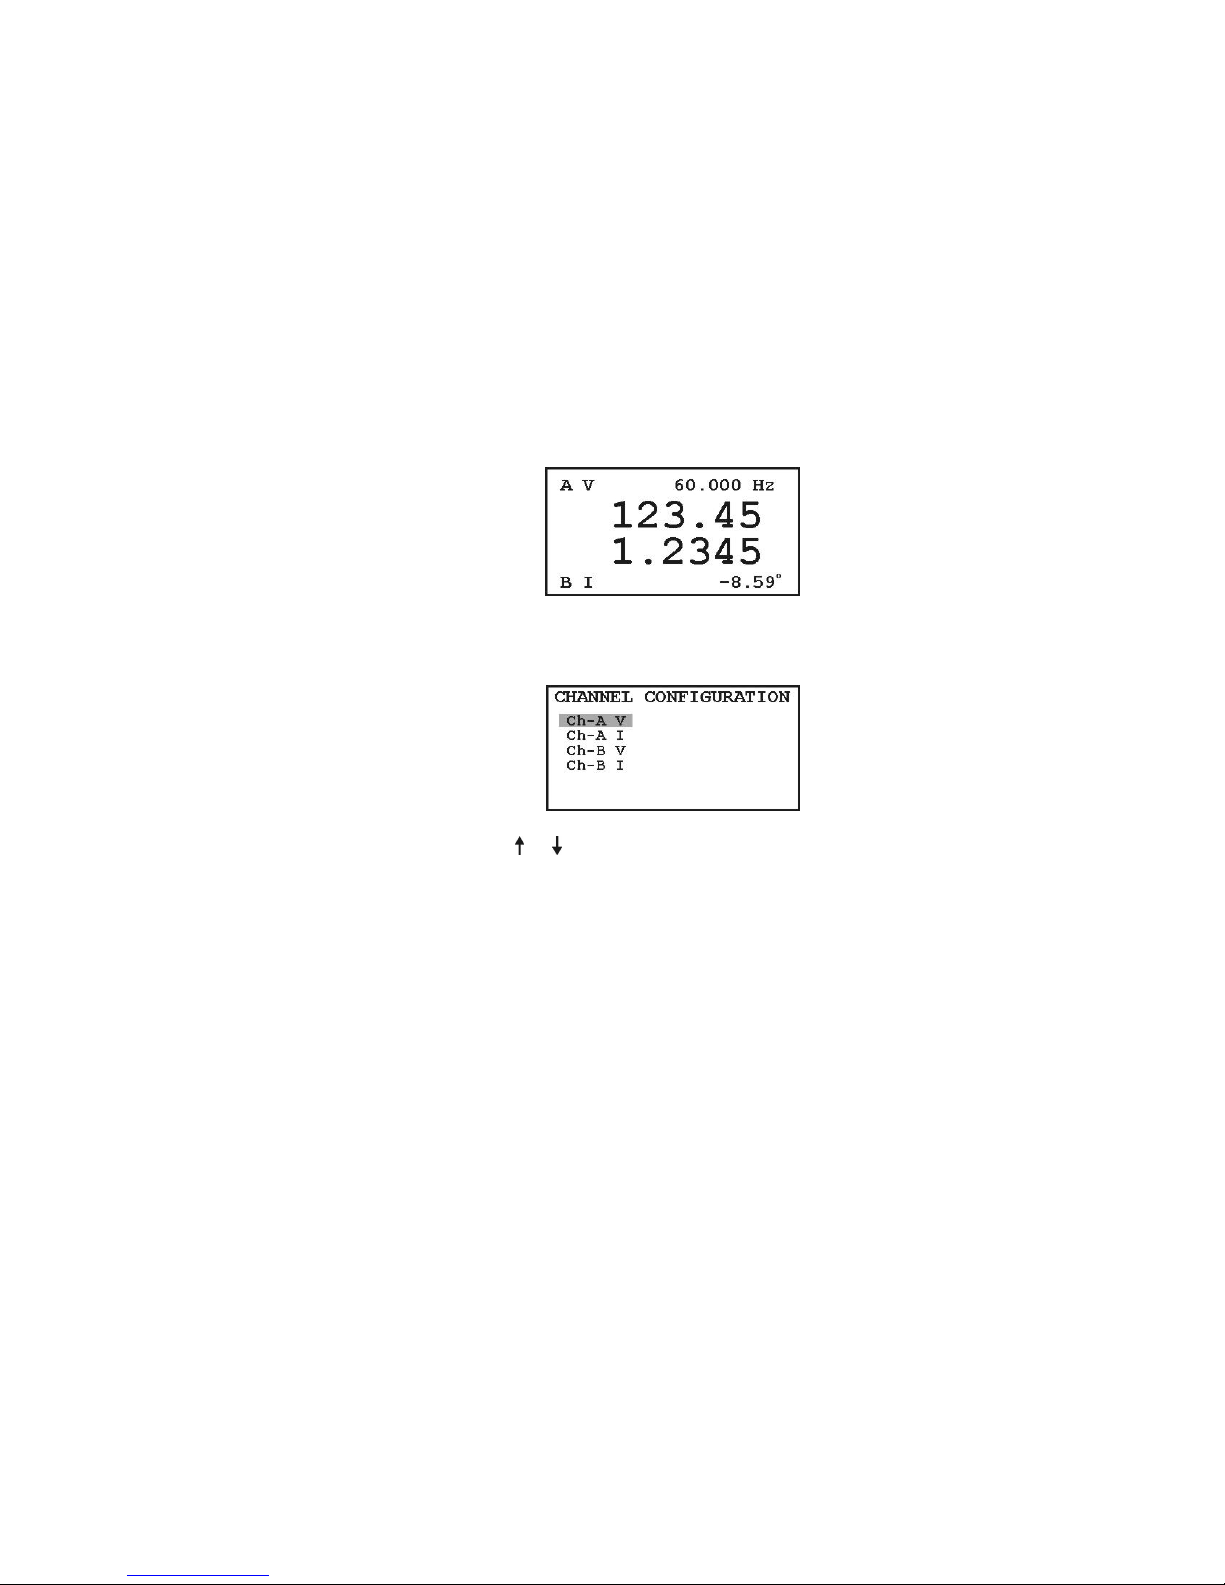
Configuring Channels A and B
Configure Channels A and B, for both current and
voltage through this menu. Four possibilities exist:
Ch-A V Channel A measuring a voltage
Ch-A I Channel A measuring a current
Ch-B V Channel B measuring a voltage
Ch-B I Channel B measuring a current
You can completely configure all these possibilities
at one time from the Channel Configuration menu.
Voltage, Ch-A V
1. Press VI to open the measurement mode.
2. Press 2nd > MENU to open the configuration
screen for Channels A and B.
3. Press or to highlight the channel and ENT to
open the specific Channel configuration screen.
In this example, Ch-A V sets the voltage measurement parameters for Channel A.
23
Page 38
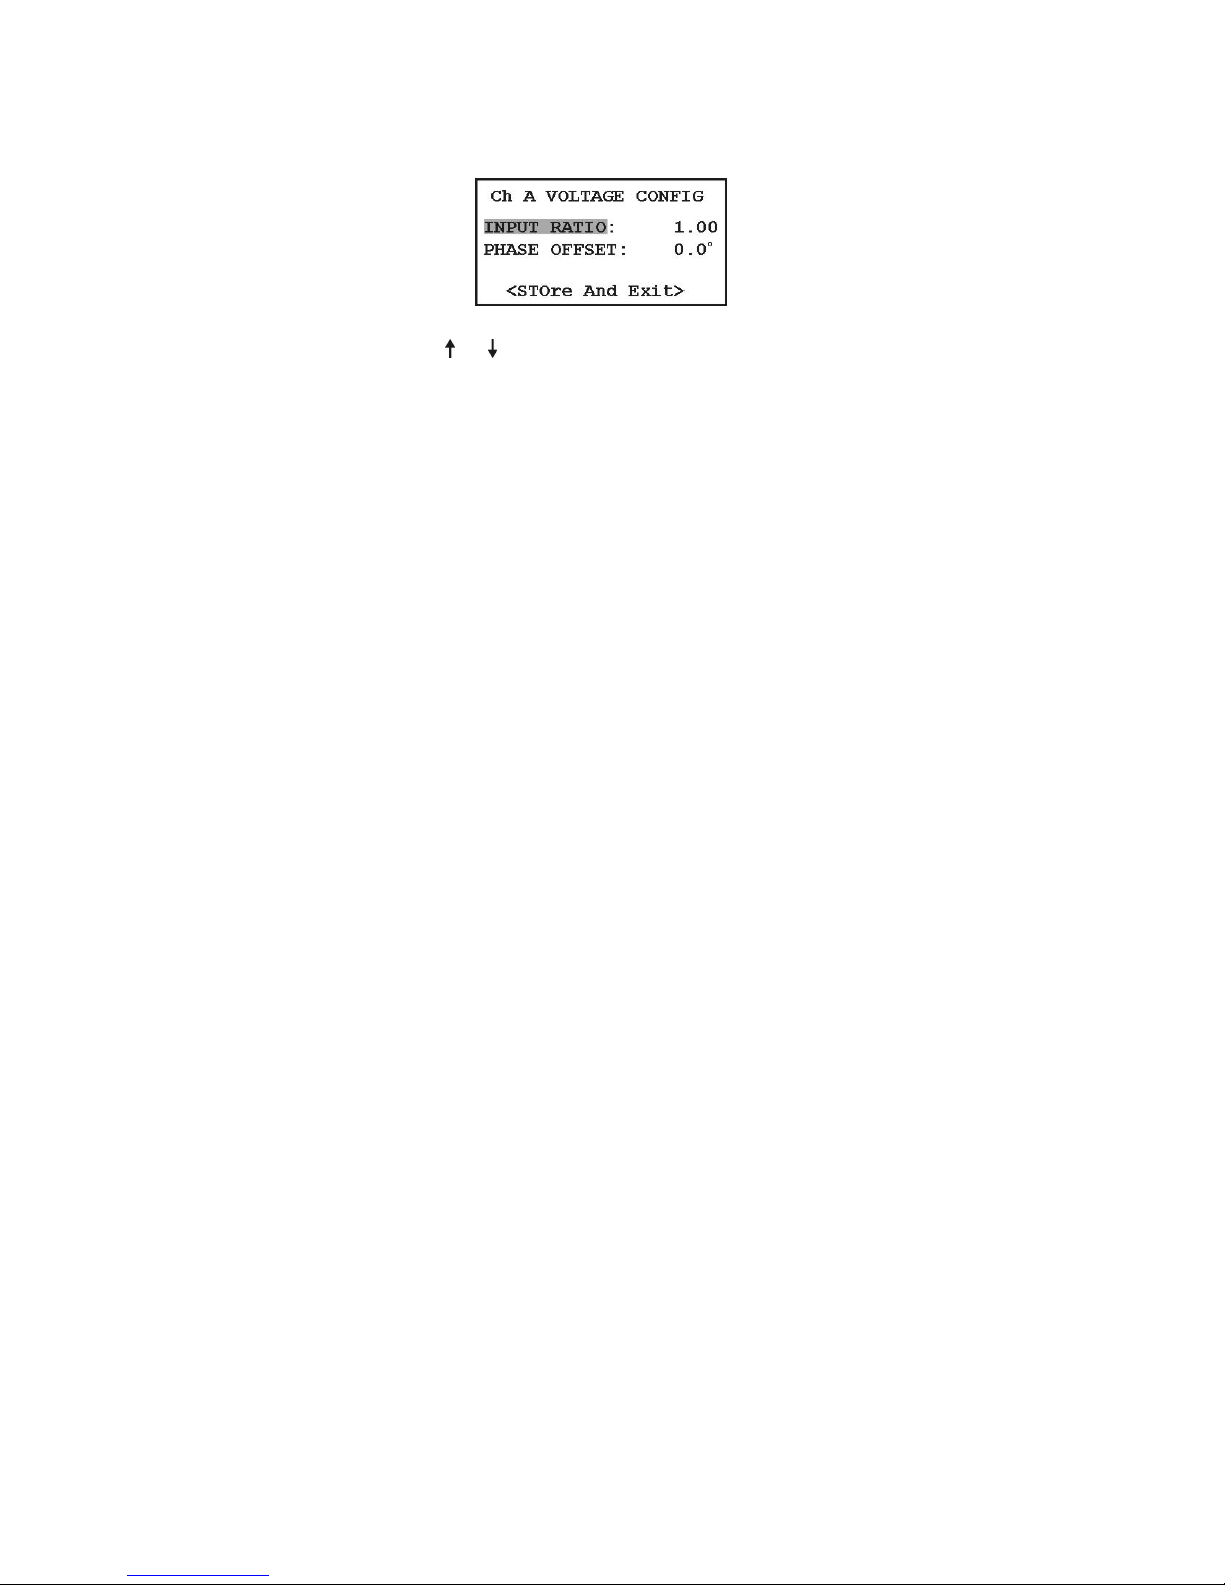
4. The display should change to the “Ch A VOLTAGE CONFIG” screen. The configured items
for voltage are Input Ratio and Phase Offset.
5. Press or to select desired field and ENT to
select value to change.
Input Ratio
6. Enter the ratio values from the numeric keypad
and press ENT to move to the next field. Note
that all ratios are referenced to 1. For the example screen ab ove, the Input Ratio is actually
1:1.
Phase Offset
7. Enter the Phase Offset value from the numeric
keypad and press ENT to move to the next field.
In this example, the phase offset is 0.0◦.
8. When finished configuring the channel, highlight
<STOre And Exit> and press ENT to install
any new values and return to the Channel Configuration me nu. Press ESC to leave the Channel
Configuration menu and return to the measurement mode.
24
Page 39
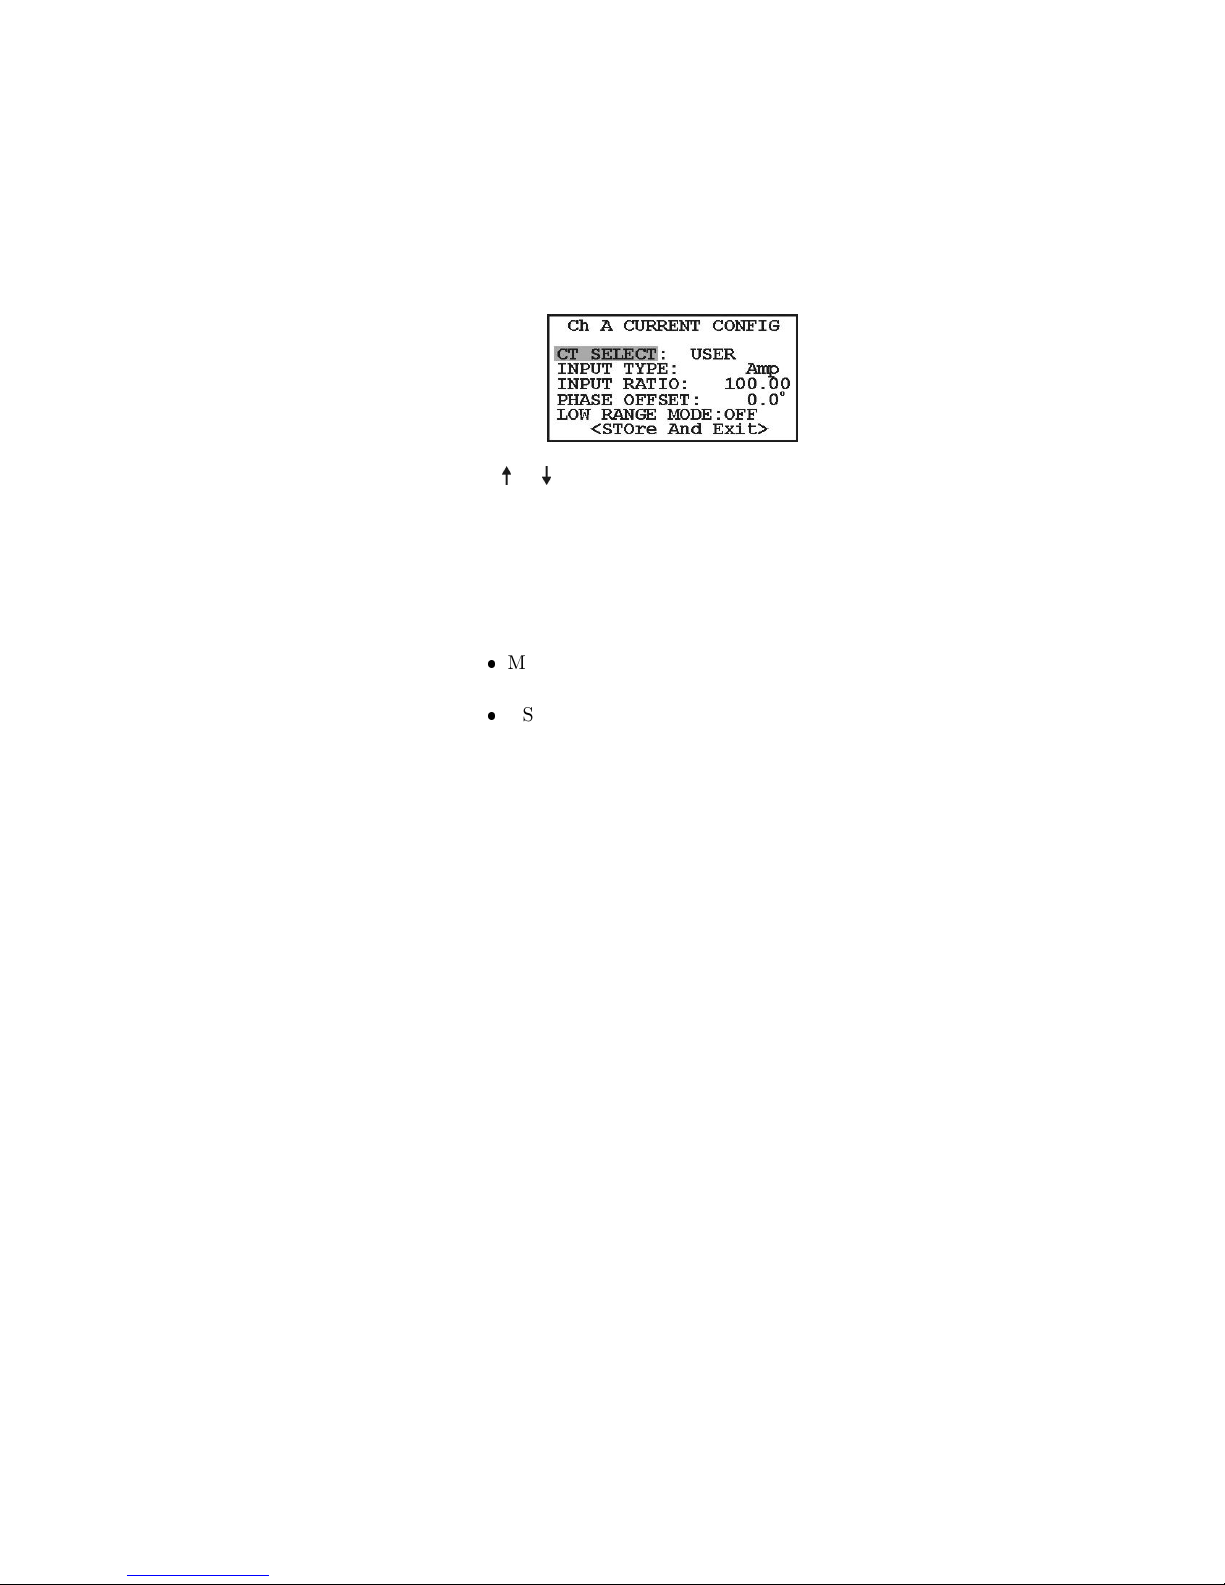
Current, Ch-A I
Current Configuration includes five items: CT Select,
Input Type, Input Ratio, Phase Offset and Low Range
Mode.
1. Open the Ch A CURRENT CONFIG screen.
Press VI > 2nd > MENU, move the cursor to
Ch-A I and press ENT. See also “Configuring
Channel A and B” on Page 23.
2. Use or , ENT, and the numeric keys to enter
the CT Select, Input Type, Input Ratio, Phase
Offset and Low Range Mode values as required.
CT Select
Selects either USER or M########, where:
M######## - selects a calibrated CT
serial number (e.g. M00001234)
USER - selects one user calibration constant
M######## selects a 12-point characterization set for the specified clamp-on CT, provided
by Arbiter Systems. Calibration constants are
obtained from Arbiter Systems and installed in
the 928A using Mlink software. See “CT Profiles” in the Mlink Software Tutorial, on page 72
for information on uploading CT profiles.
25
Page 40

3. Input Type, Input Ratio or Phase Offset for “Mtype” CT SELECT values are protected from direct change in the 928A.
4. If choosing a CT SELECT value of USER, you
can change any value in configuration screen.
5. When finished configuring, highlight <STOre
And Exit> and press ENT to exit this menu.
Low Range Mode
For current measurements below 10 mA rms (i.e. into
the 928A itself, not the CT) it may be advisable to
switch the Low Range Mode ON. The Low Range
Mode, multiplies the input signal by a factor of 20,
and can improve accuracy and stability of the signal.
Input signals above 10 mA rms may cause clipping.
Voltage Ch-B V
Change the Channel B voltage configuration in the
same manner as for Ch-A V as described above. Remember that these settings only apply for Channel B
when selecting the voltage function.
Current Ch-B I
Change the Channel B current configuration in the
same manner as for Ch-A I as described above. Remember that these settings only apply for Channel B
when selecting the current function.
Current Probe Configuration Examples
For secondary side measurements, you will need to set
up the instrument scale factors so that you can cor-
26
Page 41

rectly read the primary value. The e xample below
shows how to configure a specific probe.
CAUTION: No Direct Current Input – connect CT
probe only. See caution for CT probe use on page 4.
EXAMPLE: Current Probe Specification
AC Current Probe
AC Input: 75 Arms, maximum
AC Output: 10 mV/A rms
660 Vrms Working volts, max.
This probe produces 10 mV at the output terminals
(to the 928A) for an input current of 1 Amp.
MAXIMUM OUTPUT VOLTAGE
= AC Input × AC Output Ratio
= 75 A × 10 mV/A
= 750 mV (or 0.75 Vrms)
It is safe to apply a current or voltage to either
current input if it is less than or equal to the specified
maximum of 1.2 Vrms, or 1.2 Arms. In this case it is
safe to apply 0.75 Vrms being less than 1.2 Vrms. If
using a current output CT, you would be able to apply
up to 1.2 Arms to either current input.
Selecting a Channel Function
Press 2nd > AV to select voltage at Channel A.
Press 2nd > AI to select current at Channel A.
Press 2nd > BV to select voltage at Channel B.
Press 2nd > BI to select current at Channel B.
27
Page 42

NOTE: Remember that if you w ish to measure
voltage or current on a specific channel, you must connect the appropriate test leads between the specific
terminals to the circuit you want to measure. If measuring voltage, use the voltage terminals. If measuring
current, use the current terminals.
Measuring Voltage and Current
Most of the measured values available from the 928A
are derived from the voltage, current and frequency
measurements. Most of the advance functions using
these basic measurements are found in the next sec tion
entitled “Operation.”
Current Terminals
Caution: No Direct Current or Voltage Input – do
not connect a voltage or current directly to the current
terminals of the 928A. These terminals are intended for
use with a current probe only – either a voltage output
or current output type. See caution for CT probe use
on page 4.
28
Page 43
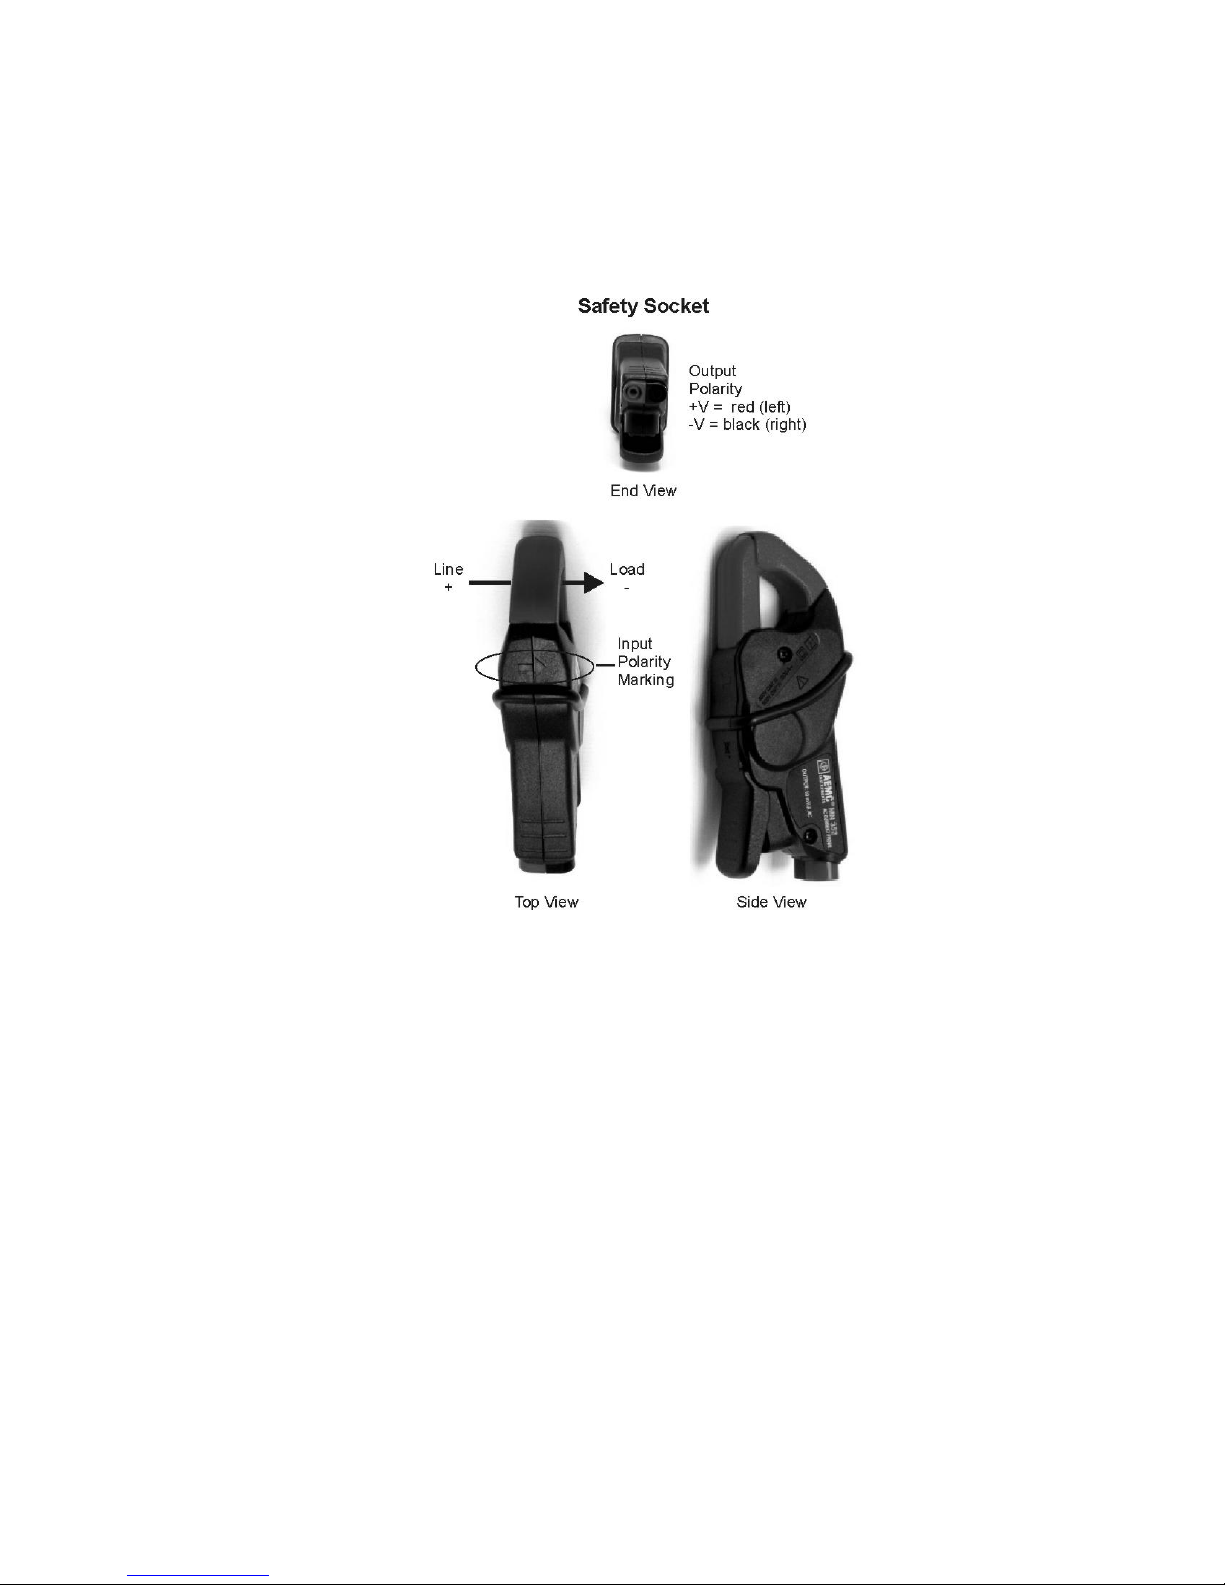
Using the MN352 Current Probe
Connect the CA0027200 accessory voltage-output CT
cable between Channel A or B current input connector
on the Model 928A and the safety sockets on MN352.
Observe the polarity markings for correct reading.
Warning: Always remove the clamp from the circuit
under test before connecting/disconnecting the accessory cable at either end.
29
Page 44

CT Characterization Files
With each CT probe, Arbiter Systems provides a characterization file (or “Profile”) that improves the accuracy for current measurements. Before using the
probe, the profile must be uploaded to the Model 928A
using Mlink software and configured in the Model
928A. The Model 928A stores up to five CT profiles.
To Obtain the CT File
1. Connect to the Arbiter Systems website at the following link:
http://arbiter.com/support/downloads/ctcharacterization-files.php
You may also connect to the Arbiter home page and
choose Service/Support, then Downloads, and finally
Model 928A CT Characterization Files.
2. Type in the serial number that is located on your
probe. The site will return a link to select for downloading. Select it and download the file to your pc.
To Upload the CT File
Go to “CT Profiles” on page 72 for instructions on
installing and removing the CT file(s) on your Model
928A. Mlink provides you with tools for managing all
of the CT files available for your Model 928A.
Configure CT File in the Model 928A
To choose a specific CT profile, you will need to go
to the “Ch A (B) CURRENT CONFIG” menu in the
Model 928A. See “CT Select” on page 25 for further
details on choosing a specific CT profile.
30
Page 45

Operation
Introduction
Information in this section provides specific details on
configuring and using more advanced functions of the
928A.
Certain fundamental procedures are covered in the
previous chapter, such as “Configuring Channels A
and B” starting on page 23. If you have not previously reviewed them, it would be good to do so at this
time.
Some of the more advanced features covered in this
section include measuring:
Voltage and Current
Phase and Frequency
Power and Power Factor
Harmonics and Flicker
Power Quality
Triggering, AutoLogging and the Log Key
Recall of Data Stored in Flash Memory
Trending Data
Ratio Functions (A/B and B/A)
Page 46
Making Measurements
VI – Voltage and Current
Choose either Channel A or Channel B to measure
voltage and current. If necessary, refer to Configuring
Input Channels in Getting Started. For example, if
you wish to measure voltage using Channel A, then
you would press 2nd > AV.
CAUTION
Do Not Exceed the Maximum Ratings
Voltage Inputs: 660 Vrms
Current Inputs: 1.2 Arms or 1.2 Vrms
Setup
1. Verify that Channel A and Channel B are configured properly. If necessary, refer to Getting
Started page 23, Configuring Channels A and B.
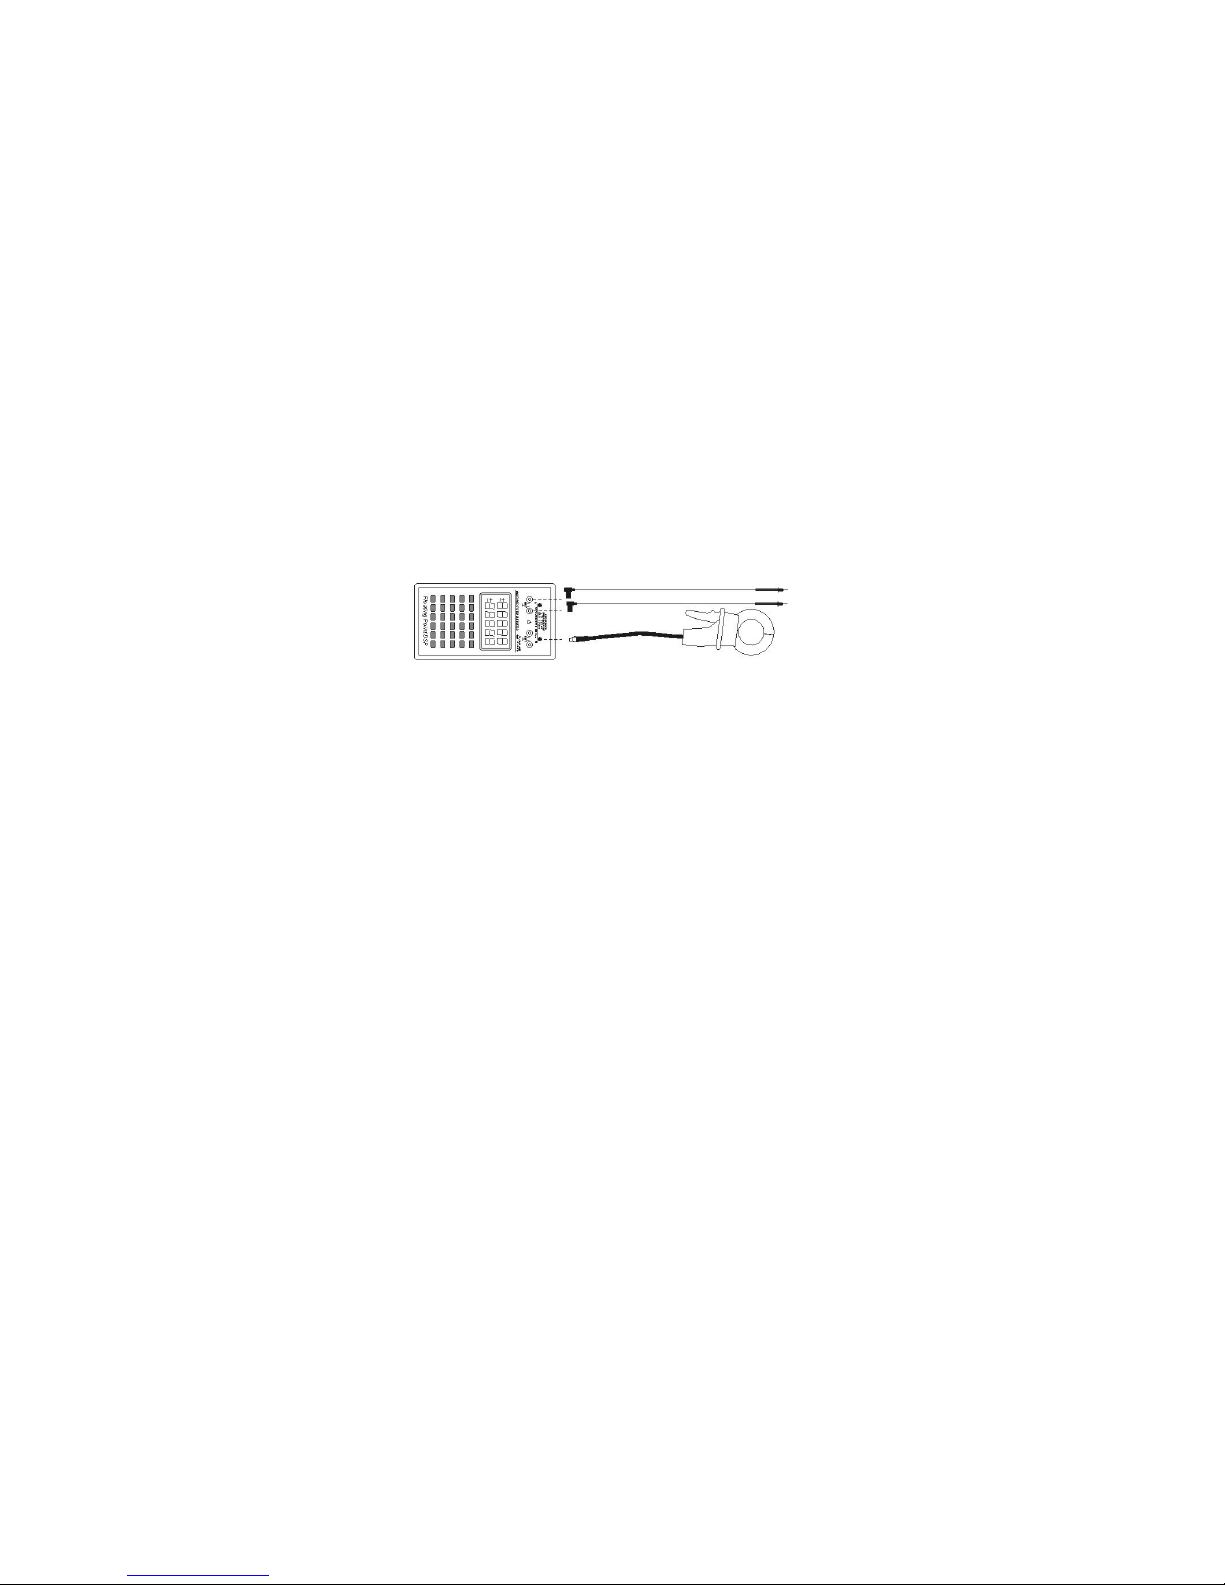
2. Press VI and connect the probe(s) between the
928A and the circuit elements.
3. Read values on the display.
32
Page 47
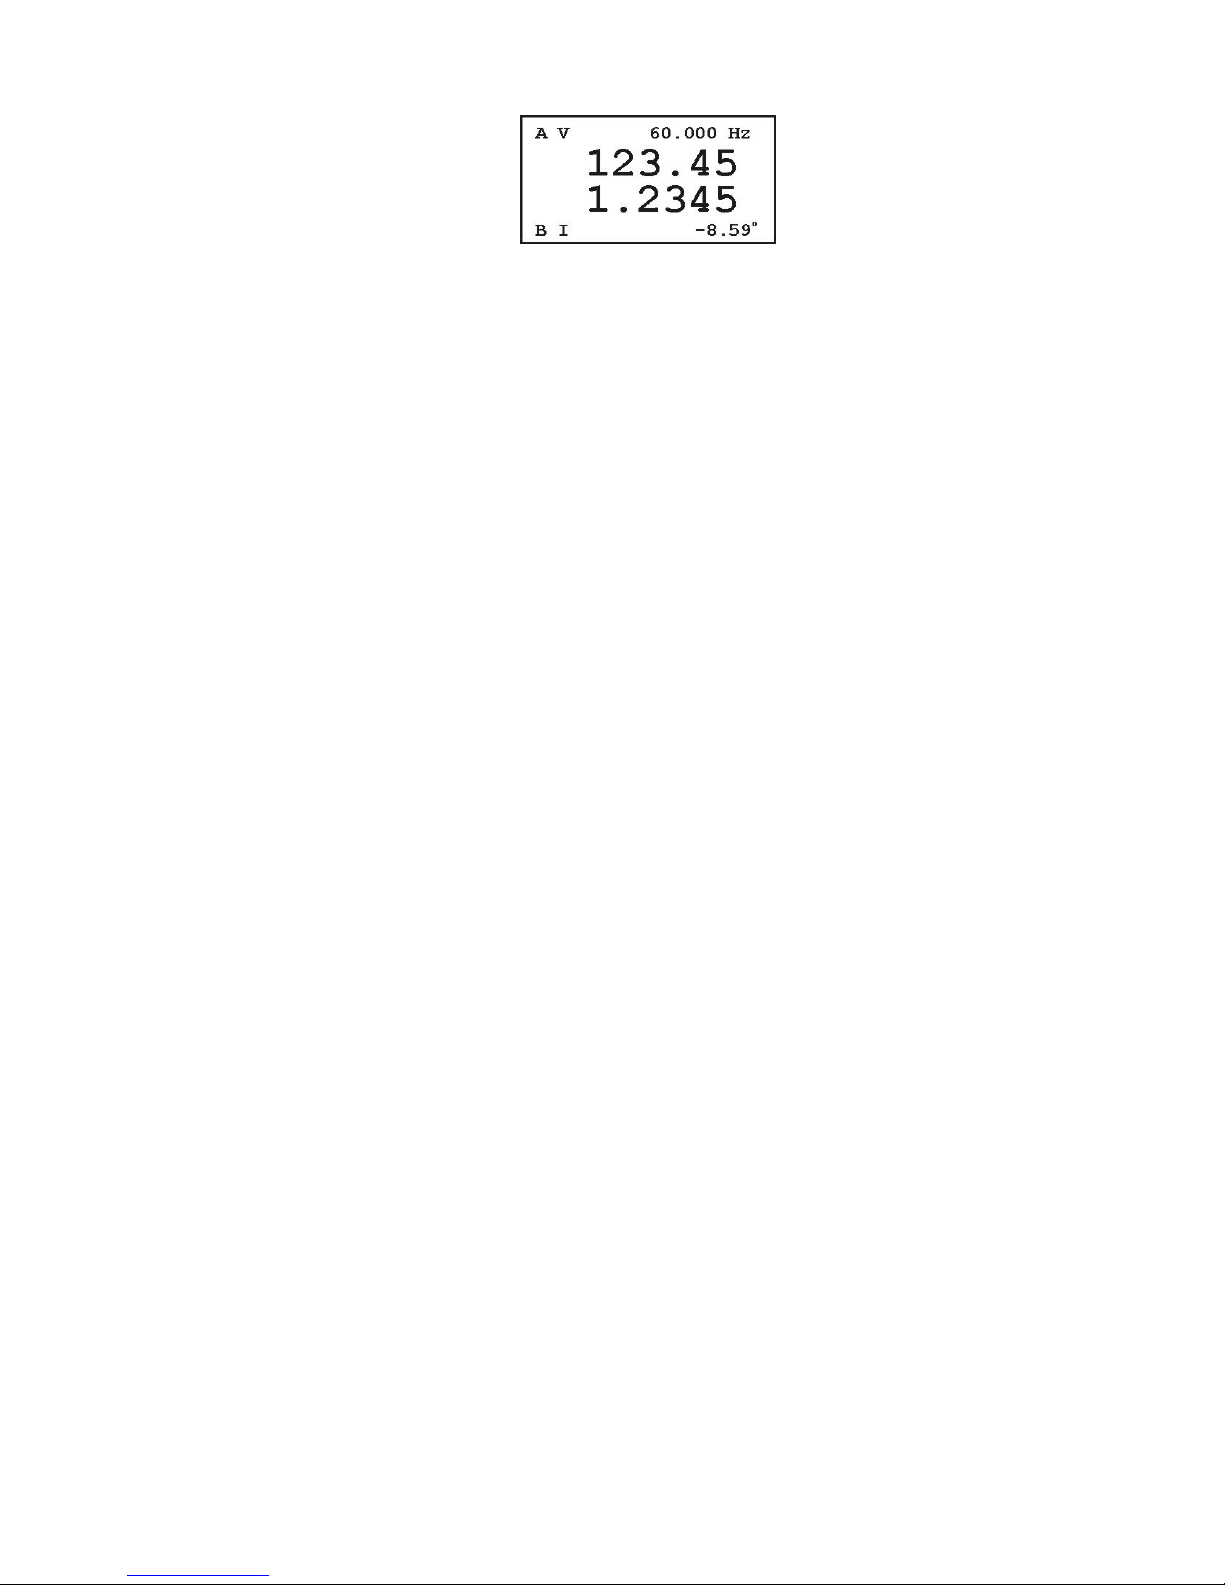
Display Definitions
Display Description
A V Channel A with units in volts.
60.000 Hz measured line frequency
123.45 measured channel A signal in volts
1.2345 measured channel B signal in amps
B I Channel B with units in amps.
◦
-8.59
Phase angle of channel B signal
relative, in degrees, to channel A.
Caution: For current probe use, see “CT Probe Use”
on page 4.
33
Page 48
φF – Phase and Frequency
To measure phase, you will need to connect two signals
to the Model 928A: current-current, voltage-current or
voltage-voltage. Frequency requires only one input.
Setup
1. Verify that Channel A and B are c onfigured
properly for the type of signals that you are me asuring. If necessary, see page 23, Configuring
Channels A and B.
2. Press φF and connect the probes to the circuit
elements.
3. Read the values on the display.
Phase Preferences
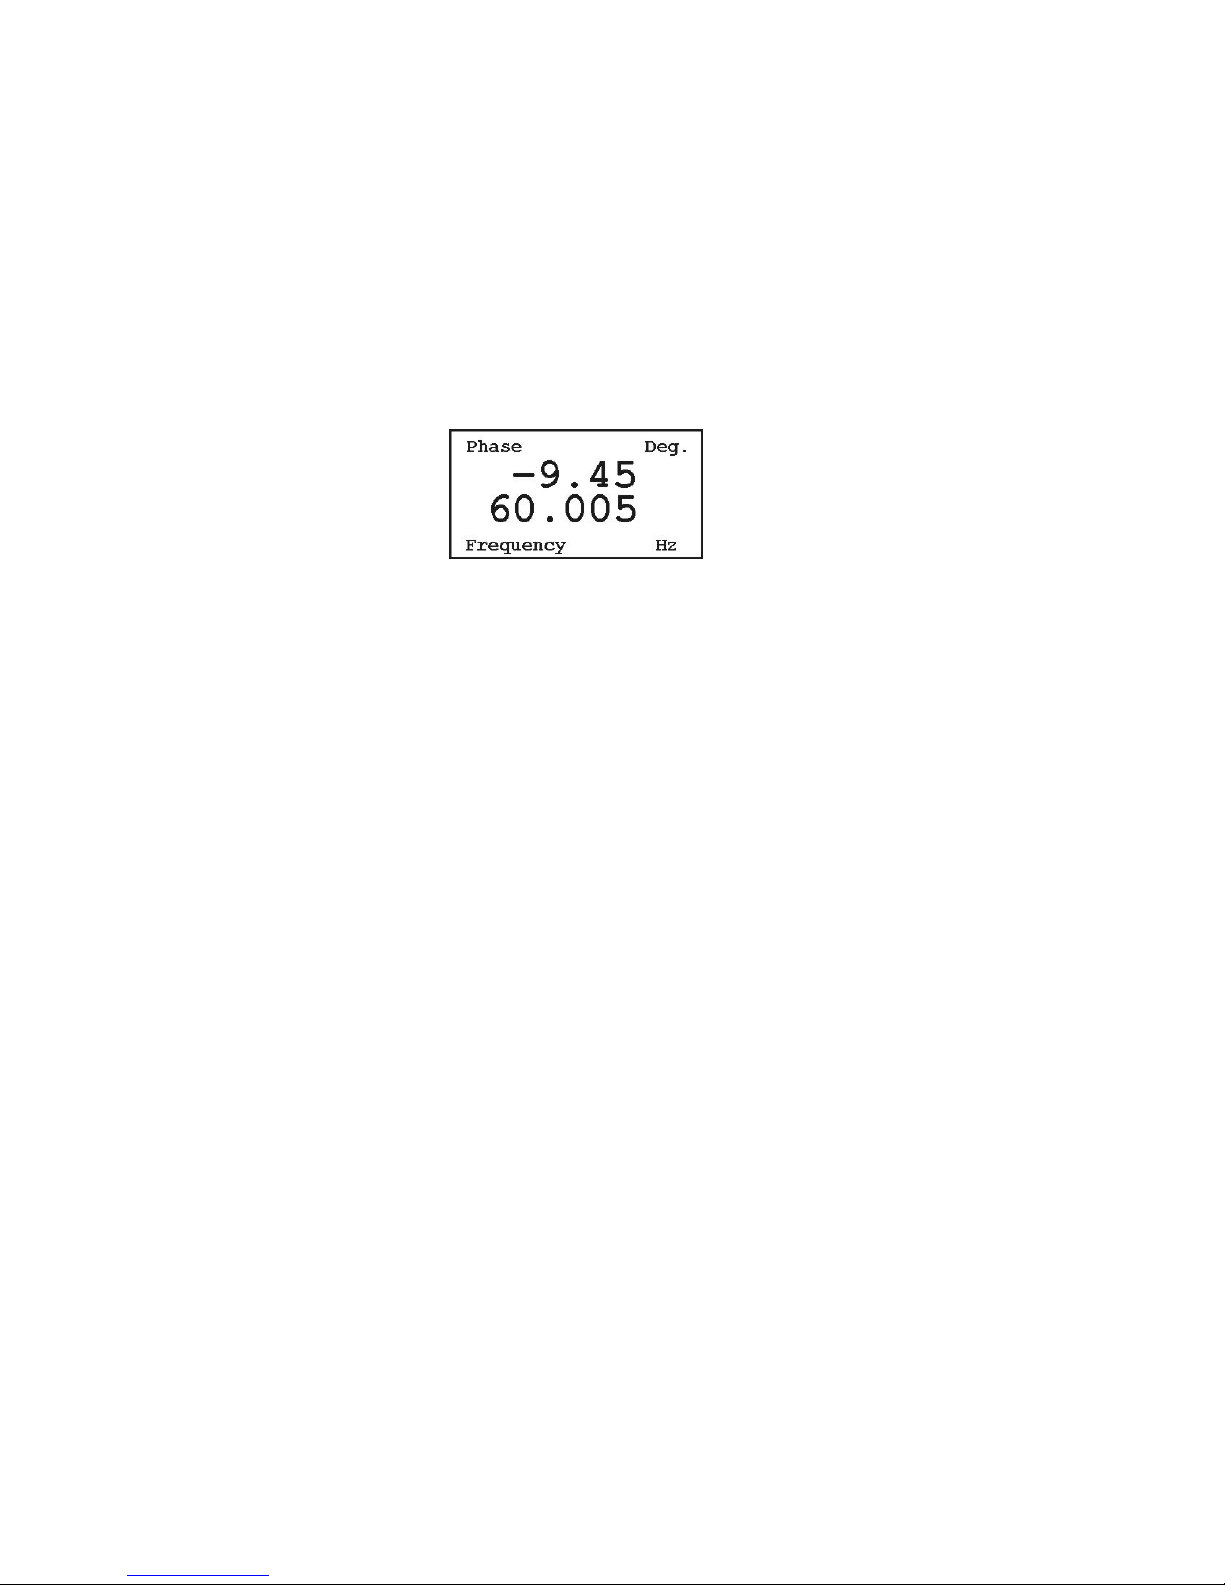
In this example, Channel B signal (current) is lagging
Channel A (voltage) and is configured to report the
phase as negative (-9.45◦). If you want Channel B lagging Channel A to be reported as positive, you would
need to op en the Phase Preferences screen (under the
Main Menu), and select as follows:
Polarity: (B lags A) +
Make sure the cursor covers the “+” sign and press
one of the arrow keys to toggle it to the desired value
and press ENT. For complete details on Main Menu
Configuration, see page 16, under Phase Preference.
34
Page 49
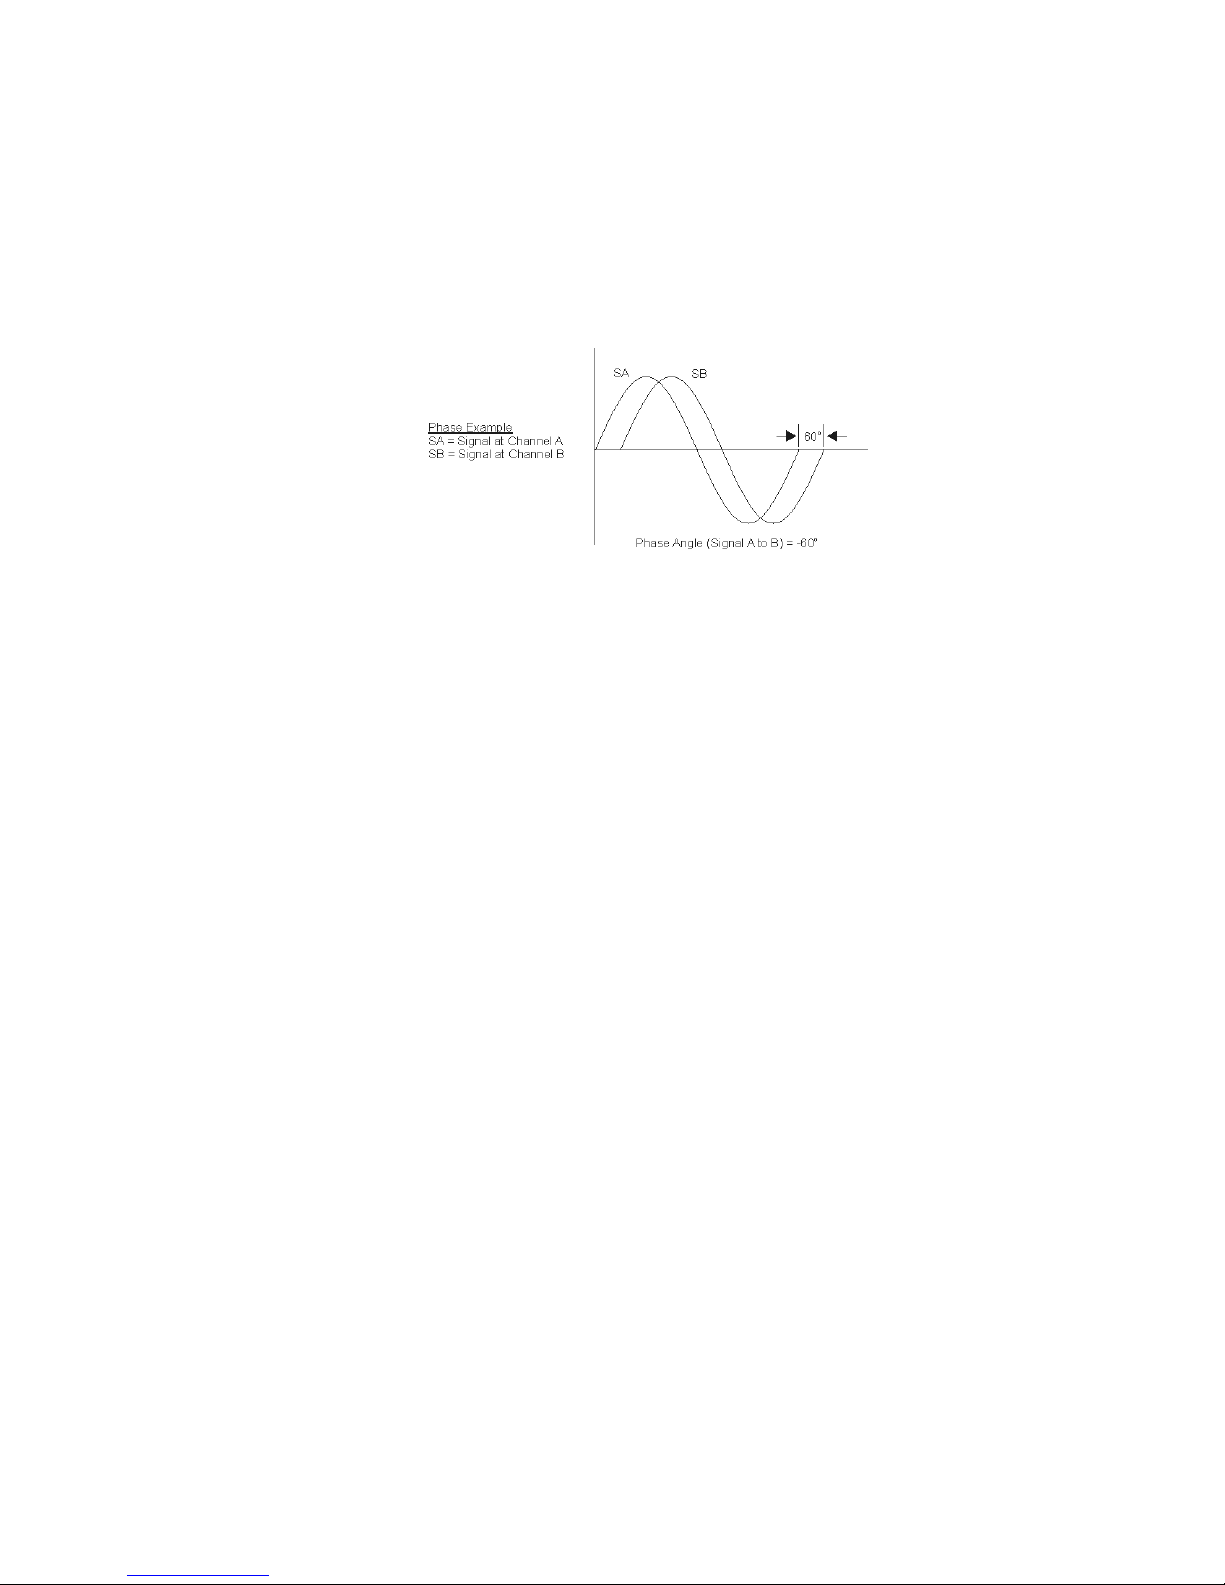
Note that the 928A is very flexible and always compares the signals at channels A and B for their phase
relationship, regardless of the type of signal, whether
voltage or current.
Phase Conventions
The following chart illustrates the standard phase conventions as used in the Model 928A. In this example,
the inputs measured by the 928A may be either voltage
or current signals.
SB is delayed from SA by 60 degrees, or approximately 2.8 milliseconds in time at 60 Hz. The phase
is therefore referred to as lagging and given a negative
sign.
If you prefer to see a lagging signal given a positive
sign, then you should configure this in Phase Preferences in the Main Menu. See page 16, under Phase
Preferences.
Example from the figure above: Suppose you are
monitoring two signals, with a voltage connected at
Channel A voltage terminals and a current at Channel
B current input terminal. Then, the current would be
lagging the voltage by 60 degrees.
For additional details on phase conventions, please
see page 99, Appendix C – Phase Conventions.
35
Page 50
PWR – Active and Reactive Power
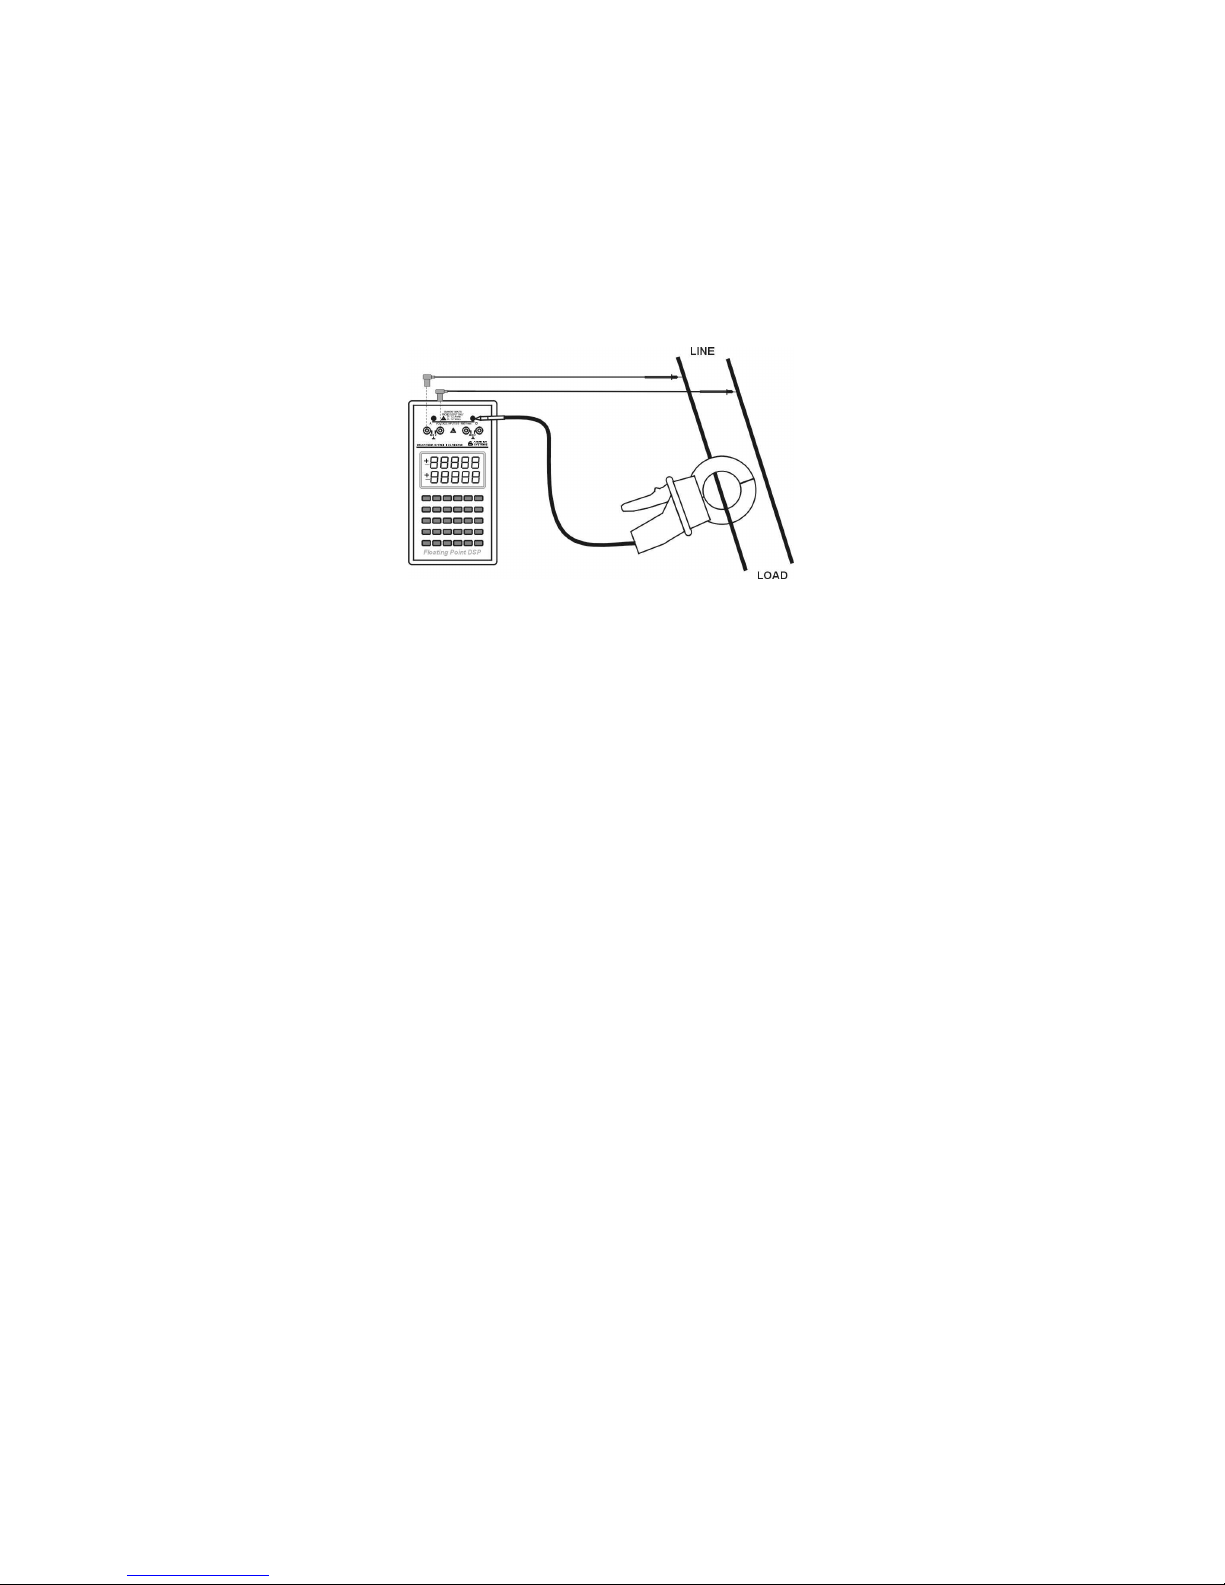
To use the power measurement function on the 928A,
you must select one measurement channel for voltage
and the other for current. In this example, Channel A
is configured as voltage and Channel B as current.
Setup
1. Press 2nd > AV to set Channel A to voltage and
2nd > BI to set Channel B to current.
Note: in this figure, voltage probes are connected to Channel A and CT connected to Channel B.
2. Press PWR and connect the probes to the circuit
elements.
3. Read the display.
36
Page 51
Display Definitions
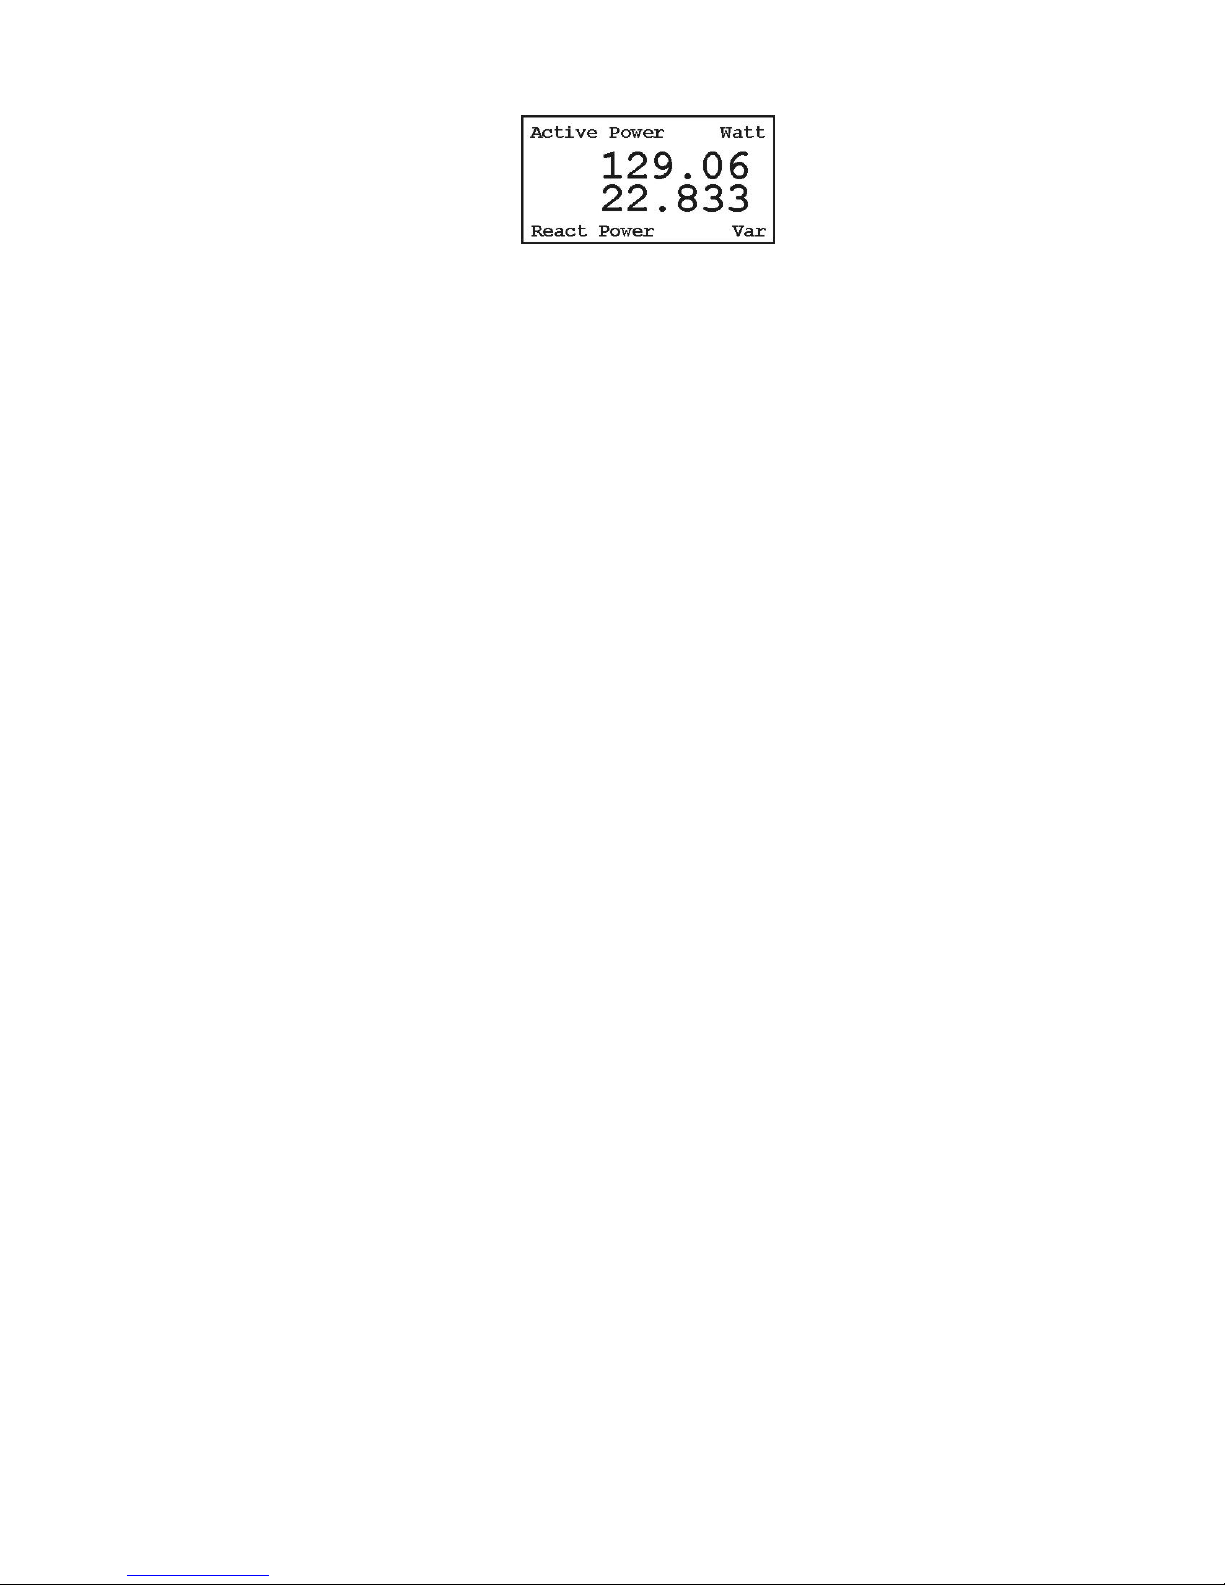
The display should indicate Active and Reactive
power, showing the effective power to a load and
wasted power returned to the line. The displayed units
are Watts on the top and Vars on the bottom.
Determining Active Power
Active power is calculated from the real components
of the current and the voltage.
Caution: For current probe use, see “CT Probe Use”
on page 4.
37
Page 52
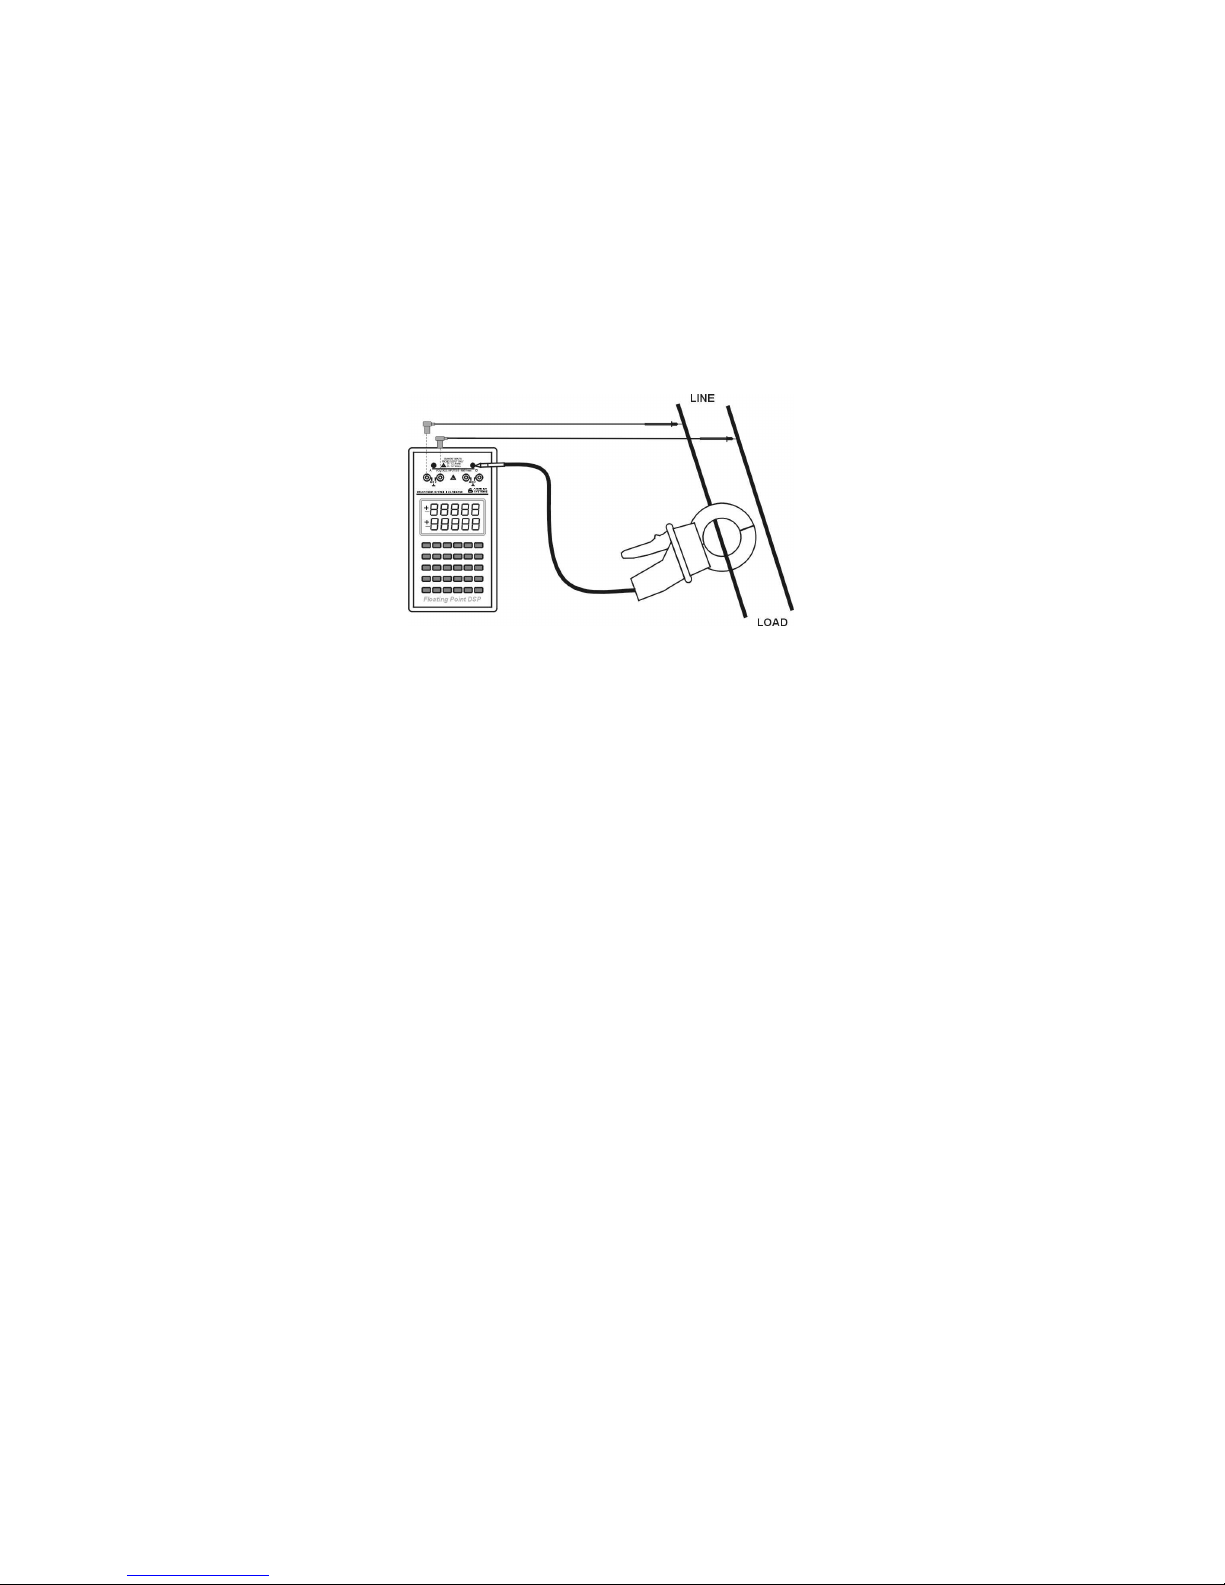
PF – Power Factor & Apparent Power
To use the Power Factor and Apparent Power function on the 928A, you will need to select one of the
measurement channels for voltage and the other for
current. In this example, Channel A is selected as
voltage and Channel B as current.
Setup
1. Press 2nd > AV to configure Channel A for volt-
age and press 2nd > BI to configure Channel B
for current.
Note: in this figure, voltage probes are connected to Channel A and CT connected to Channel B.
2. Press PF and connect the probes between the
928A and the circuit elements.
3. Read the display.
38
Page 53
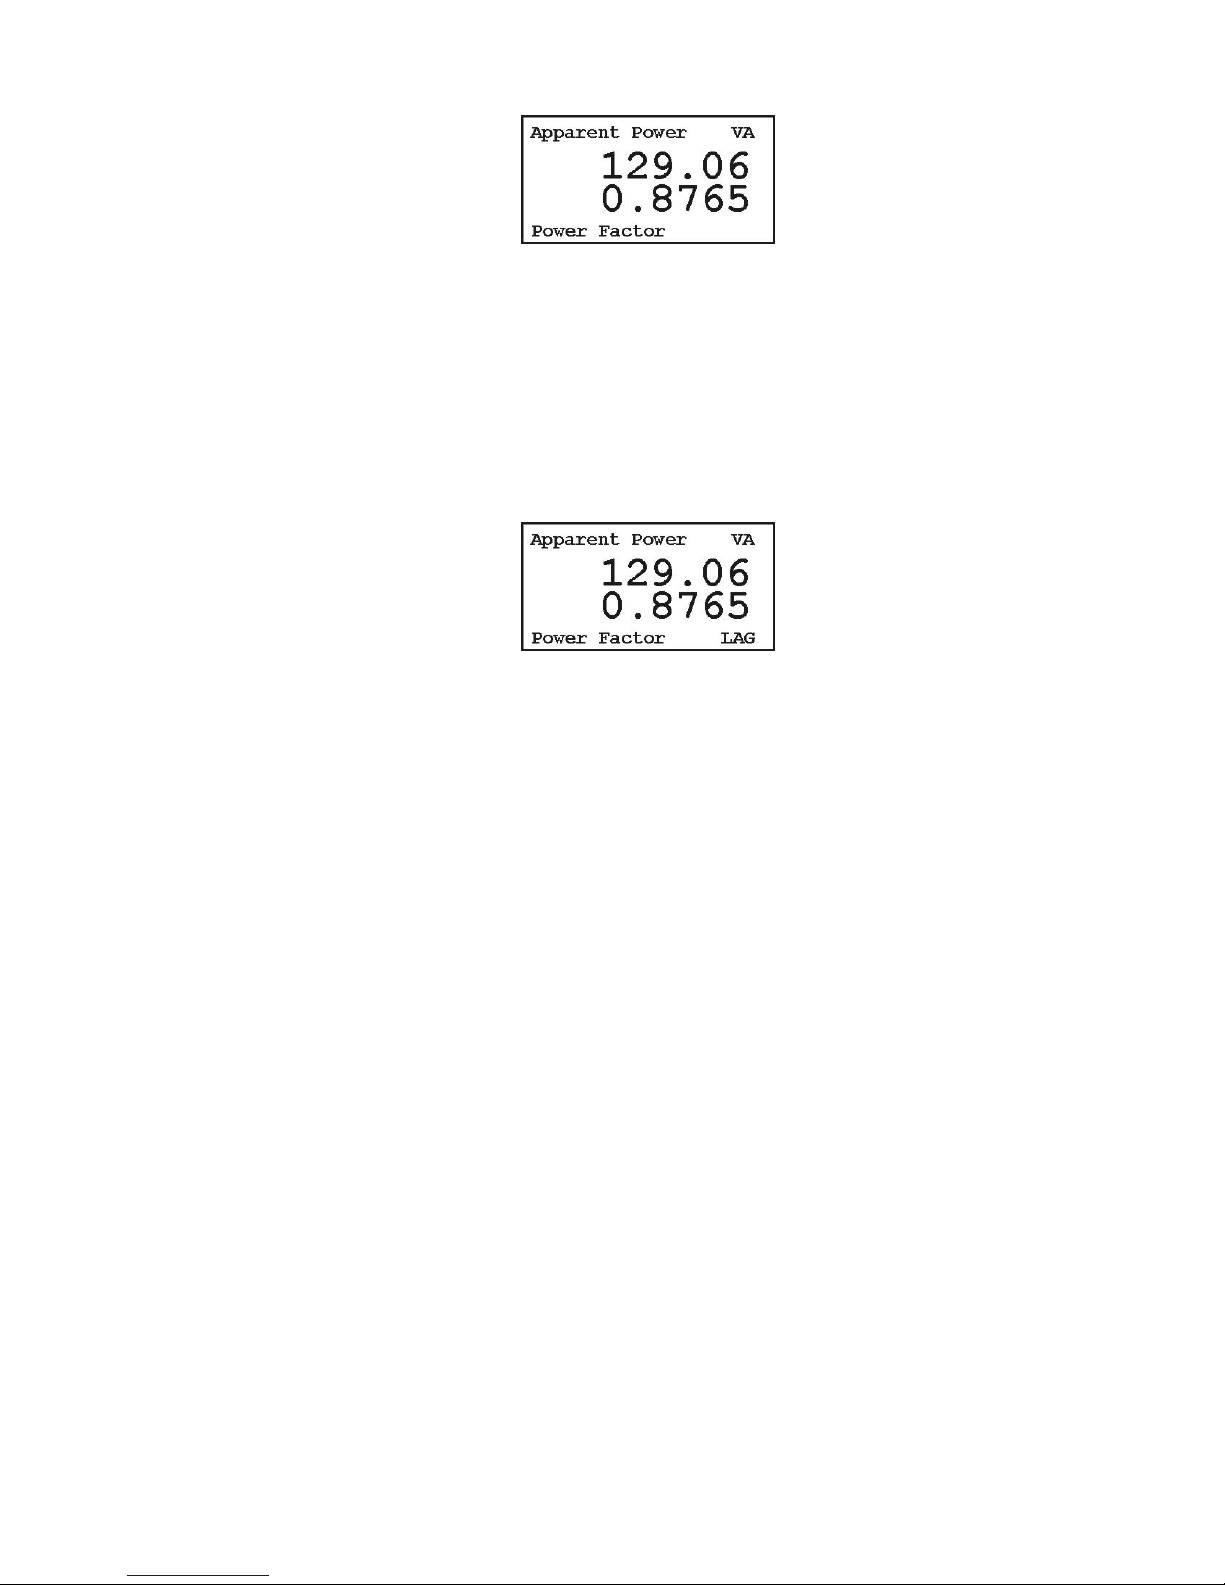
Display Definitions
The power factor displayed is determined from the
reactive component of power.
Lead Lag Display
If you wish to know if the power factor is leading or
lagging, configure this through the main menu, under
Phase Preference. See page 16, under Phase Preference. The screen below shows a lagging power factor
with the Lead/Lag indication turned ON.
Caution: For current probe use, see “CT Probe Use”
on page 4.
39
Page 54
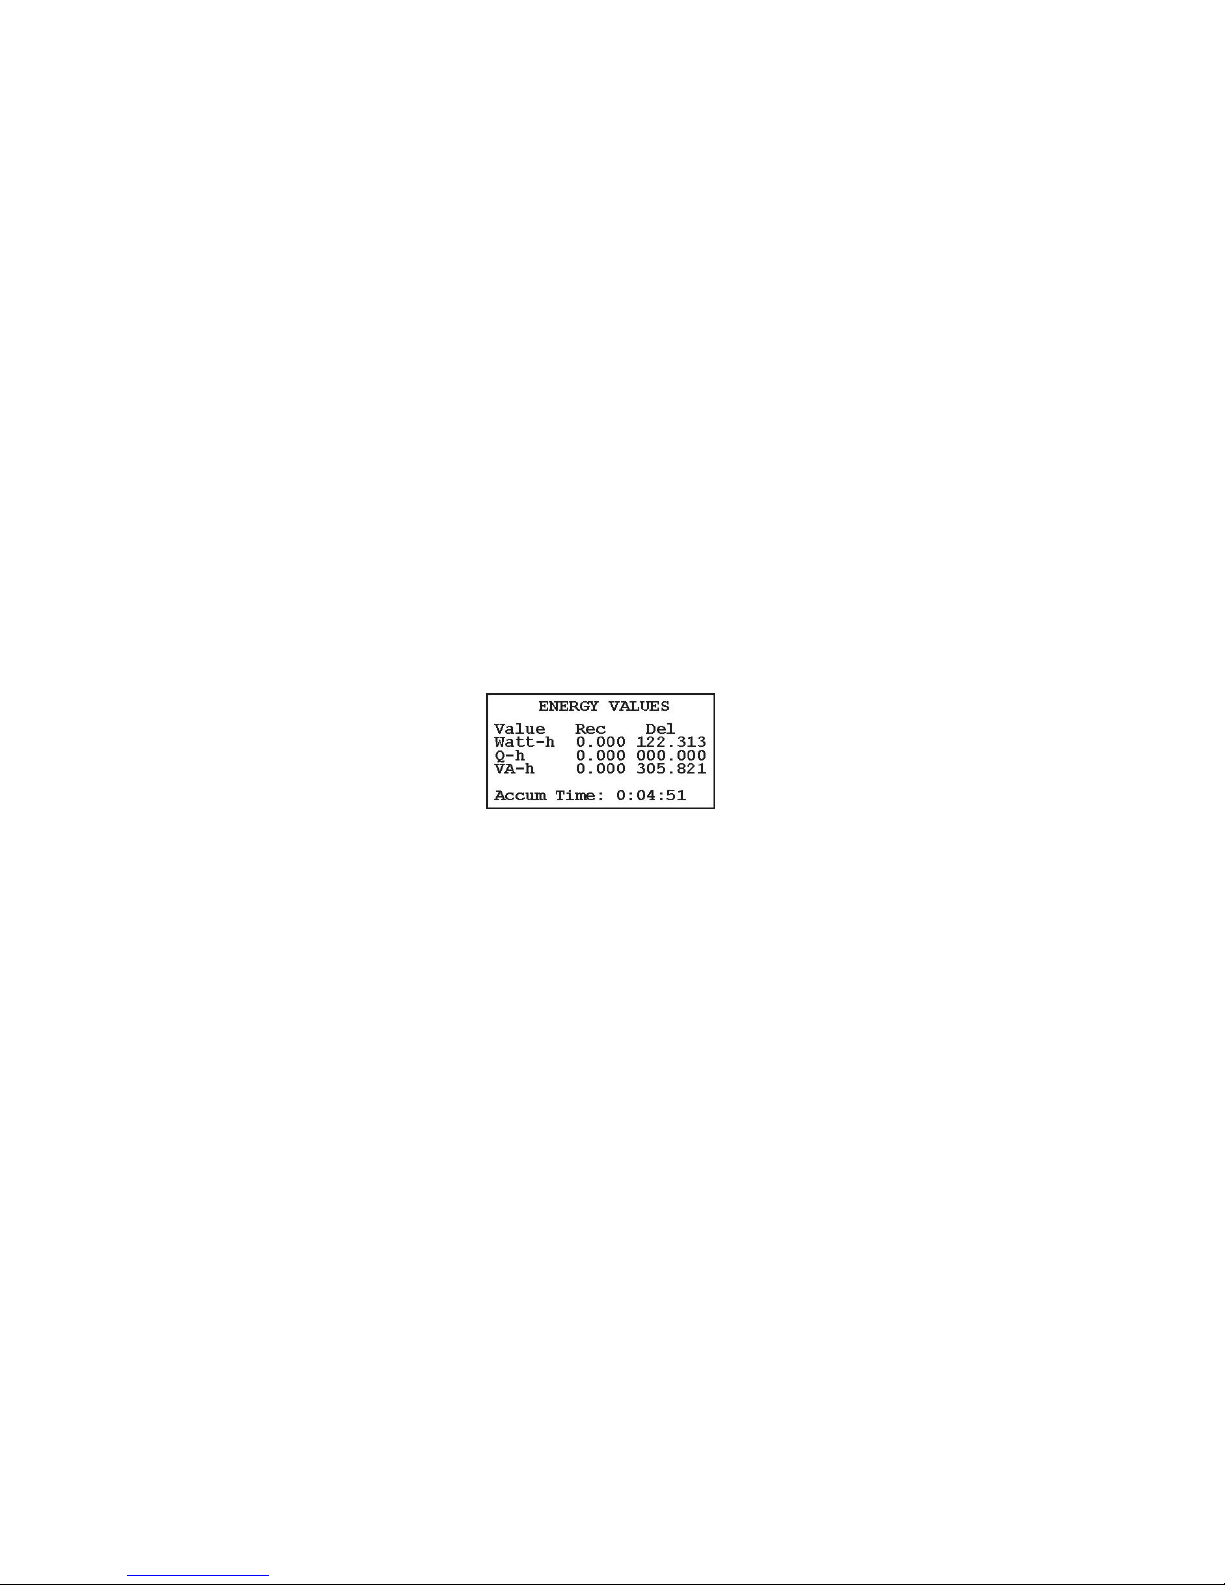
Wh – Watt-hour
Use this mode to view the energy received and delivered.
To view or record any of the 10 energy values measured in the Model 928A, you must select one of the
measurement channels for voltage and the other for
current. Choose either channel for voltage or current.
In this example however, Channel A is selected as voltage and Channel B as current.
Setup
1. Check to see if the internal clock is displaying
the correct date and time. See Time and Date
on pages 20 and 21.
2. Press 2nd > AV to configure Channel A for volt-
age.
Press 2nd > BI to configure Channel B for current.
3. Connect the test probes between the 928A and
the circuit or meter under test.
4. Press Wh to display the calculated Watt-hours.
Note: Del refers to the power delivered to the
load, and Rec refers to the power delivered to
the source.
40
Page 55
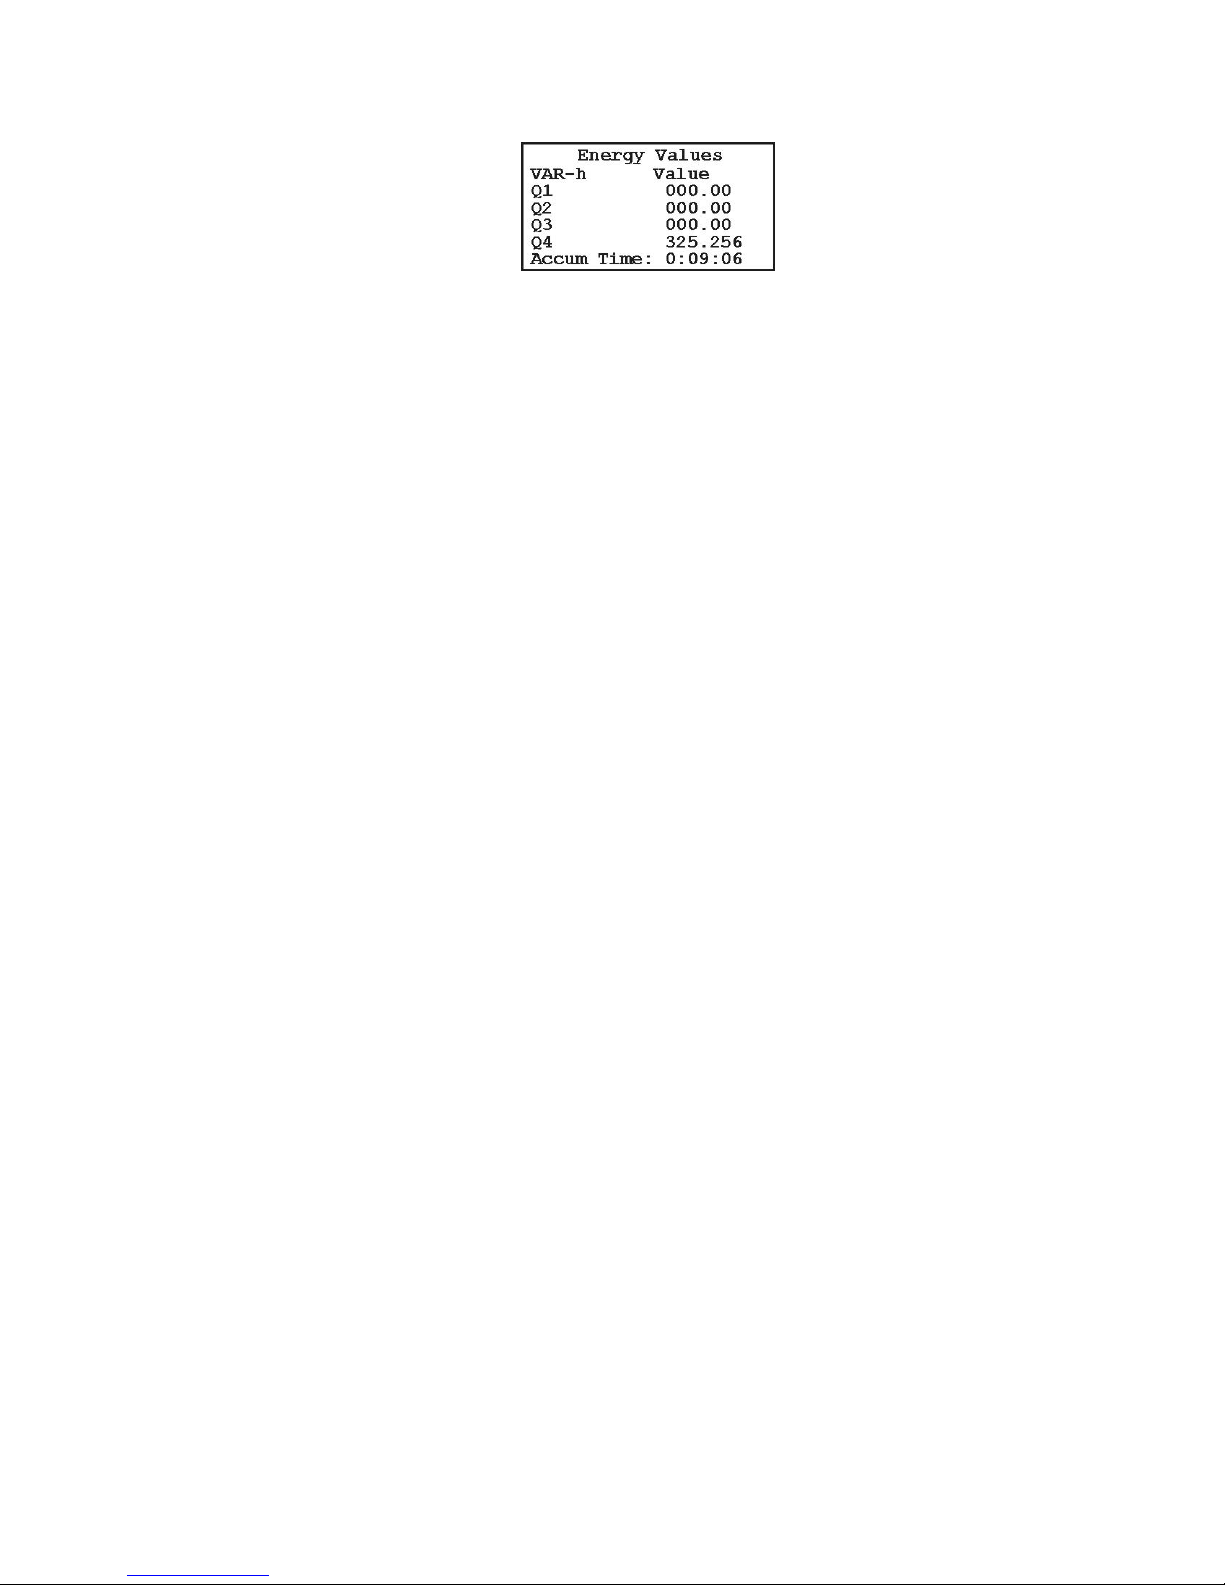
5. Press Wh again to access the second set of energy
values.
Important Note: Possible Data Loss – You will
lose energy data if the 928A shuts down while measuring energy. Since energy values require time to accumulate, consider configuring the Auto Shutdown feature so that the 928A does not shut down during a
measurement. Prior to collecting energy values, set
the Auto Shutdown feature to OFF and use the external power supply. See Auto Shutdown on page 6.
Caution: For current probe use, see “CT Probe Use”
on page 4.
41
Page 56
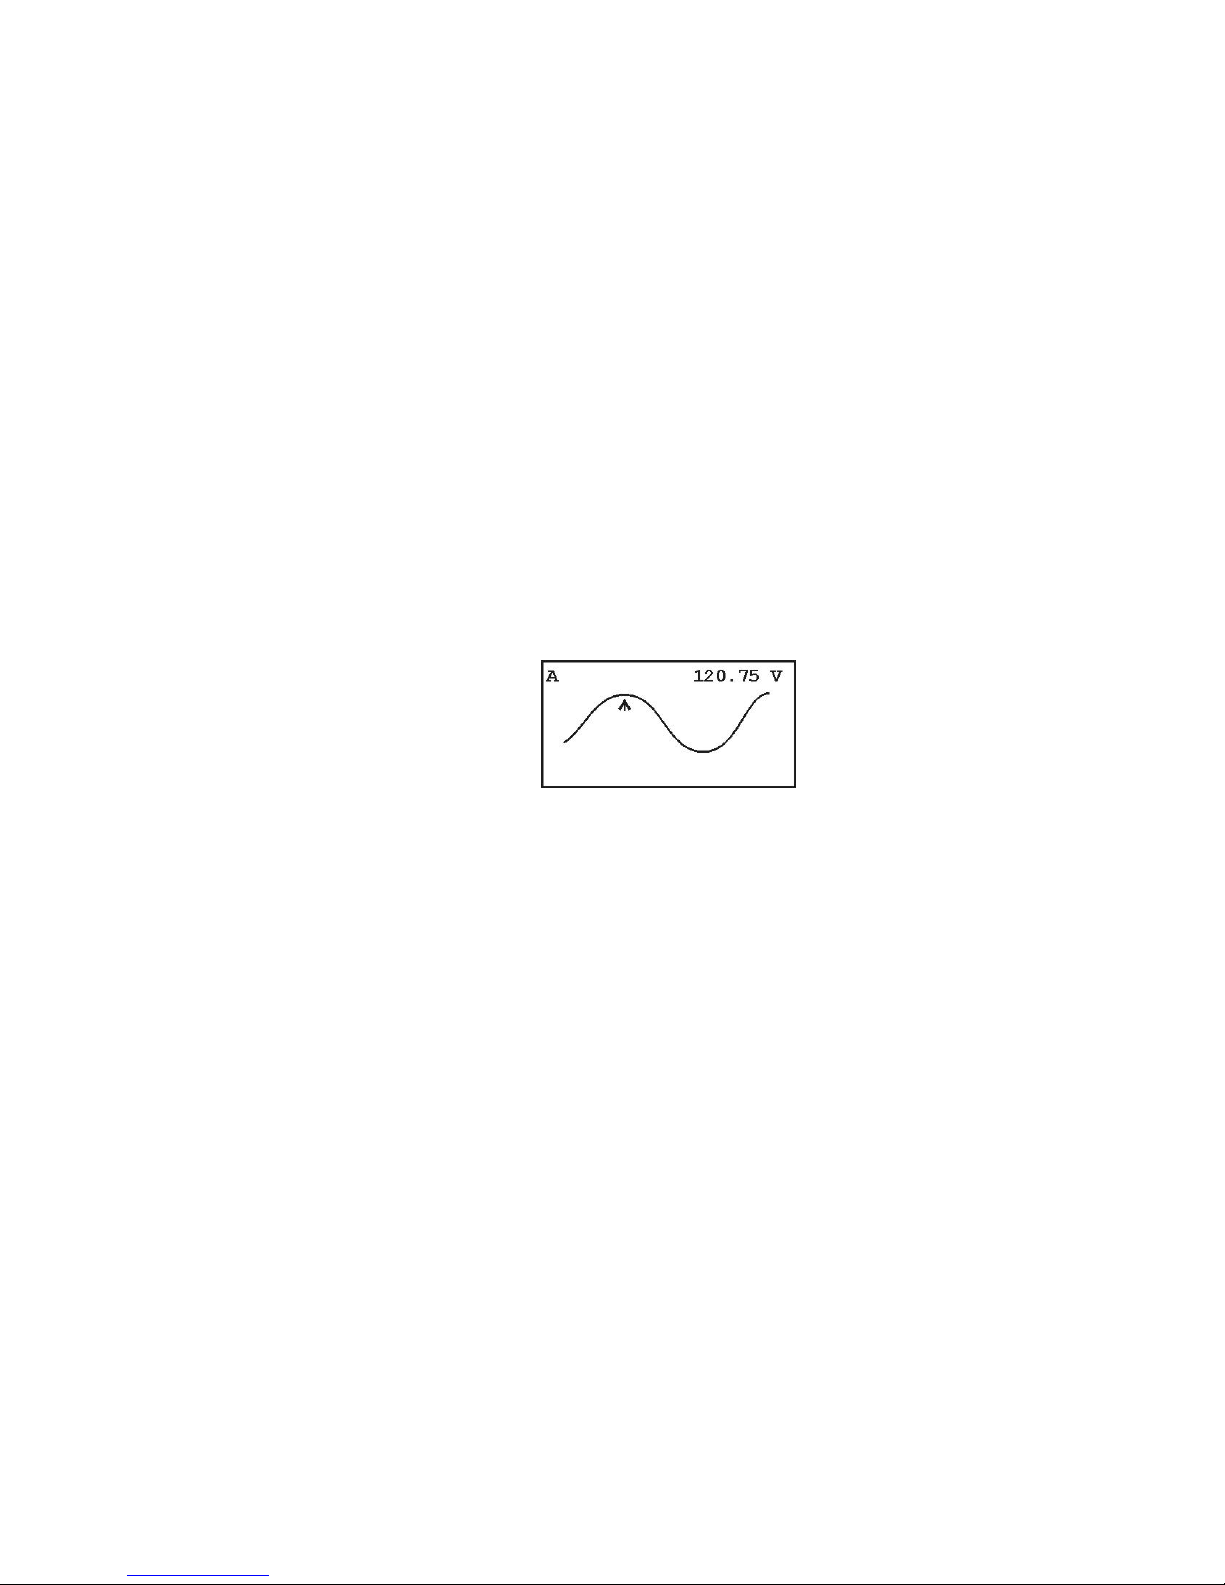
WAV - Waveform
To view or record signal waveforms on the 928A, select
one or both of the measurement channels, for voltage
and/or current. You can view up to two voltages, two
currents or one voltage and one current. It does not
matter which channel you select (A or B) to measure
voltage or current.
Setup
1. Make sure that Channel A and B are set up properly with at least one channel configured for voltage and/or current. If necessary, refer to Configuring Channels A and B on page 23.
2. Press the appropriate Signal Selection key in order to measure the signal properly - for example,
press 2nd > AV to select Channel A to measure
voltage.
3. Connect the probe(s) between the 928A and the
circuit under test.
4. Press WAV and read the Channel A graph on
the display.
Channel A
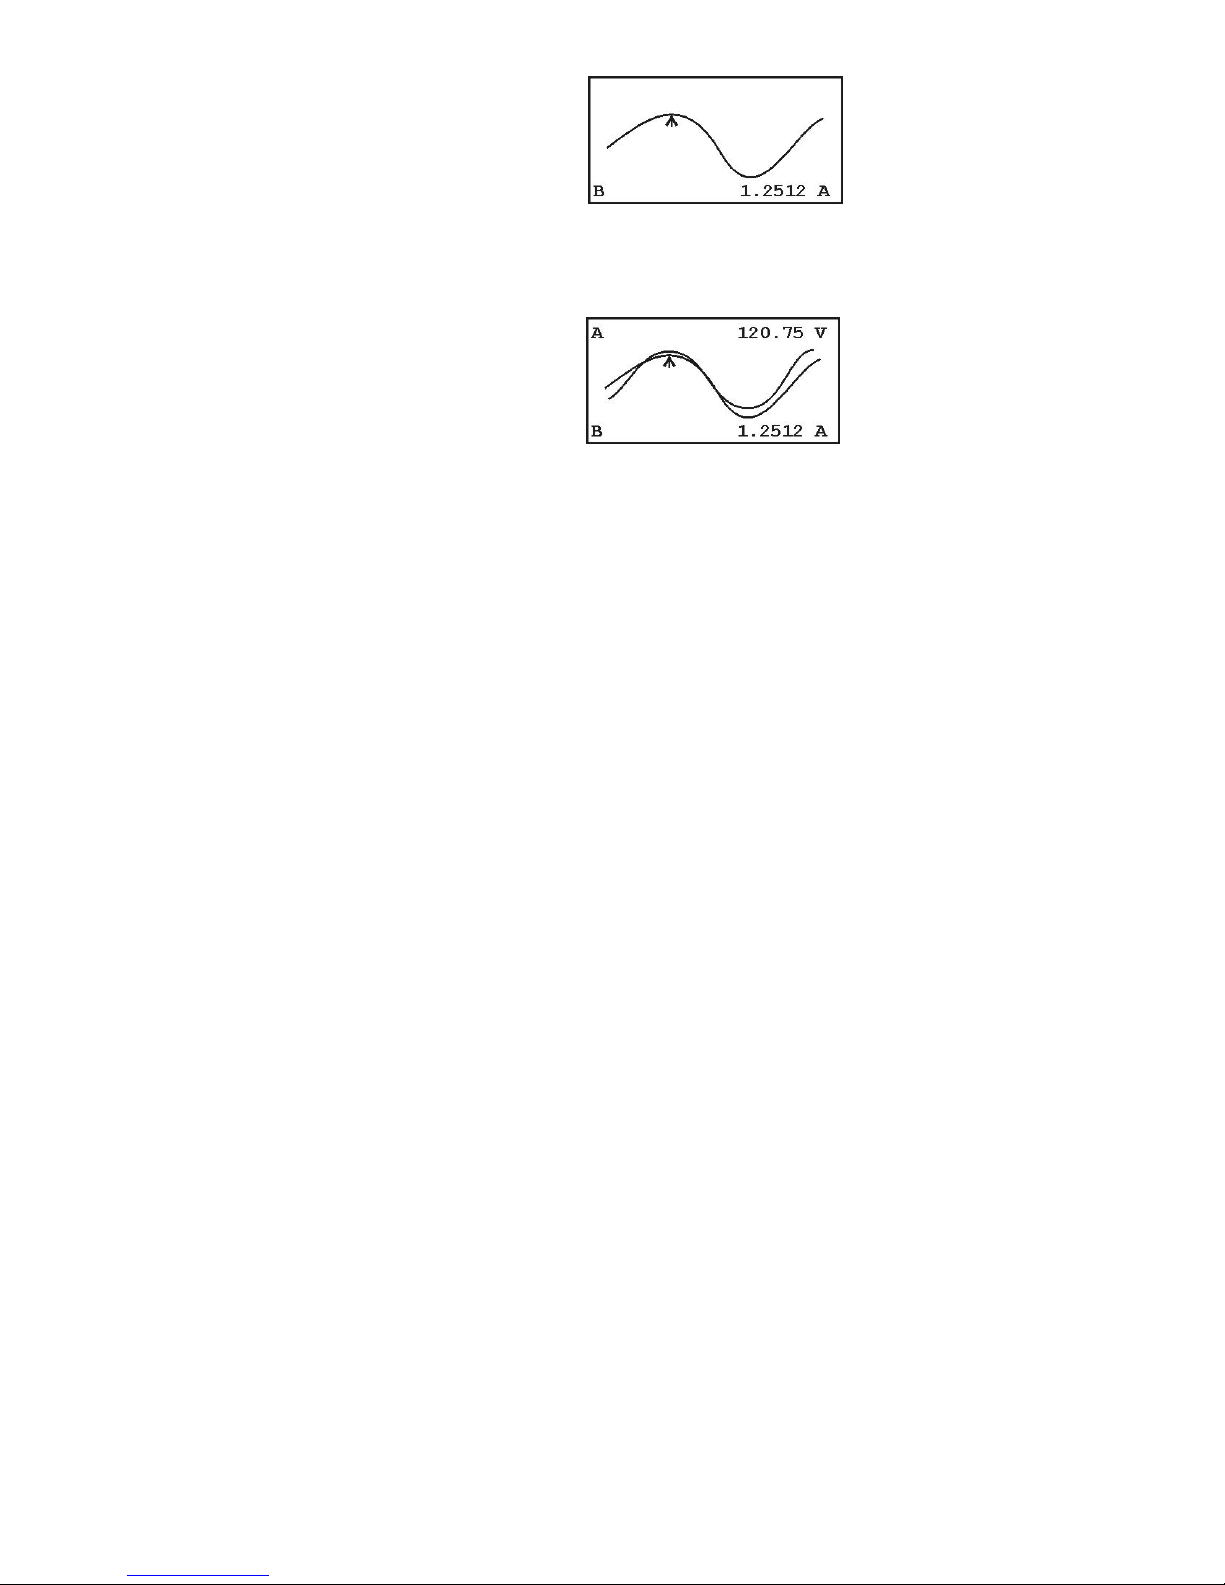
5. Press WAV again to view the channel B graph
on the display.
6. Press WAV a third time for a combined view of
channels A and B on the display.
42
Page 57
Channel B
Combined
Caution: For current probe use, see “CT Probe Use”
on page 4.
43
Page 58
HRM – Numerical Harmonics
To view or record harmonics on the 928A, you must
select one or both of the measurement channels, for
voltage and/or current. You can view up to two voltages, two currents or a voltage and current. It does not
matter which channel you select (A or B) to measure
voltage or current.
Setup
1. Make sure to select the correct signals for Channels A and B - for example press 2nd > AV to
measure voltage on channel A.
2. Press HRM and connect the meter probes between the 928A and the circuit under test.
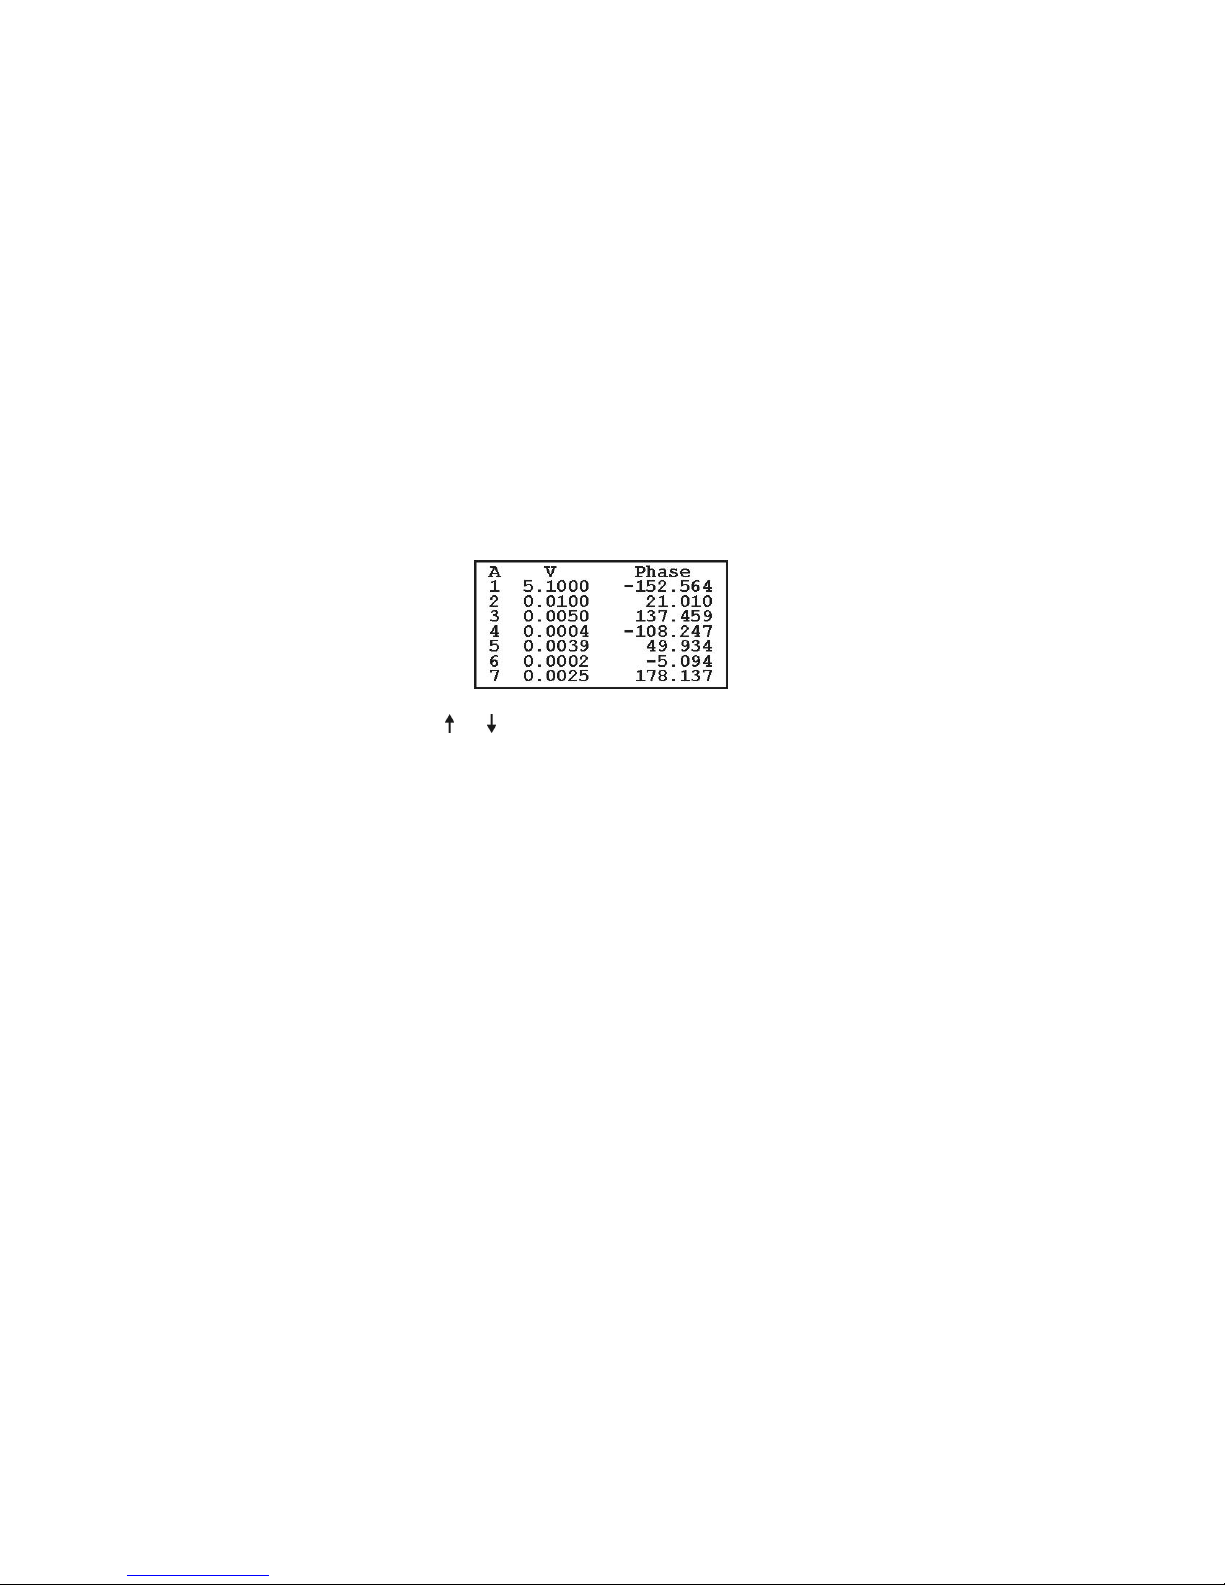
3. Read the display; this example indicates channel
A voltage magnitudes (fundamental through the
7th harmonic) and phase angle in degrees.
4. Press or to view the full range of tabulated
harmonic values from the fundamental to the
50th harmonic. Press the arrow keys to move
through the individual harmonic numbers and
levels in groups of seven.
5. To read Channel B numerical harmonics, press
HRM. Repeated pressing HRM toggles between
Channel A and B numerical harmonic data.
44
Page 59
Graphical Harmonics
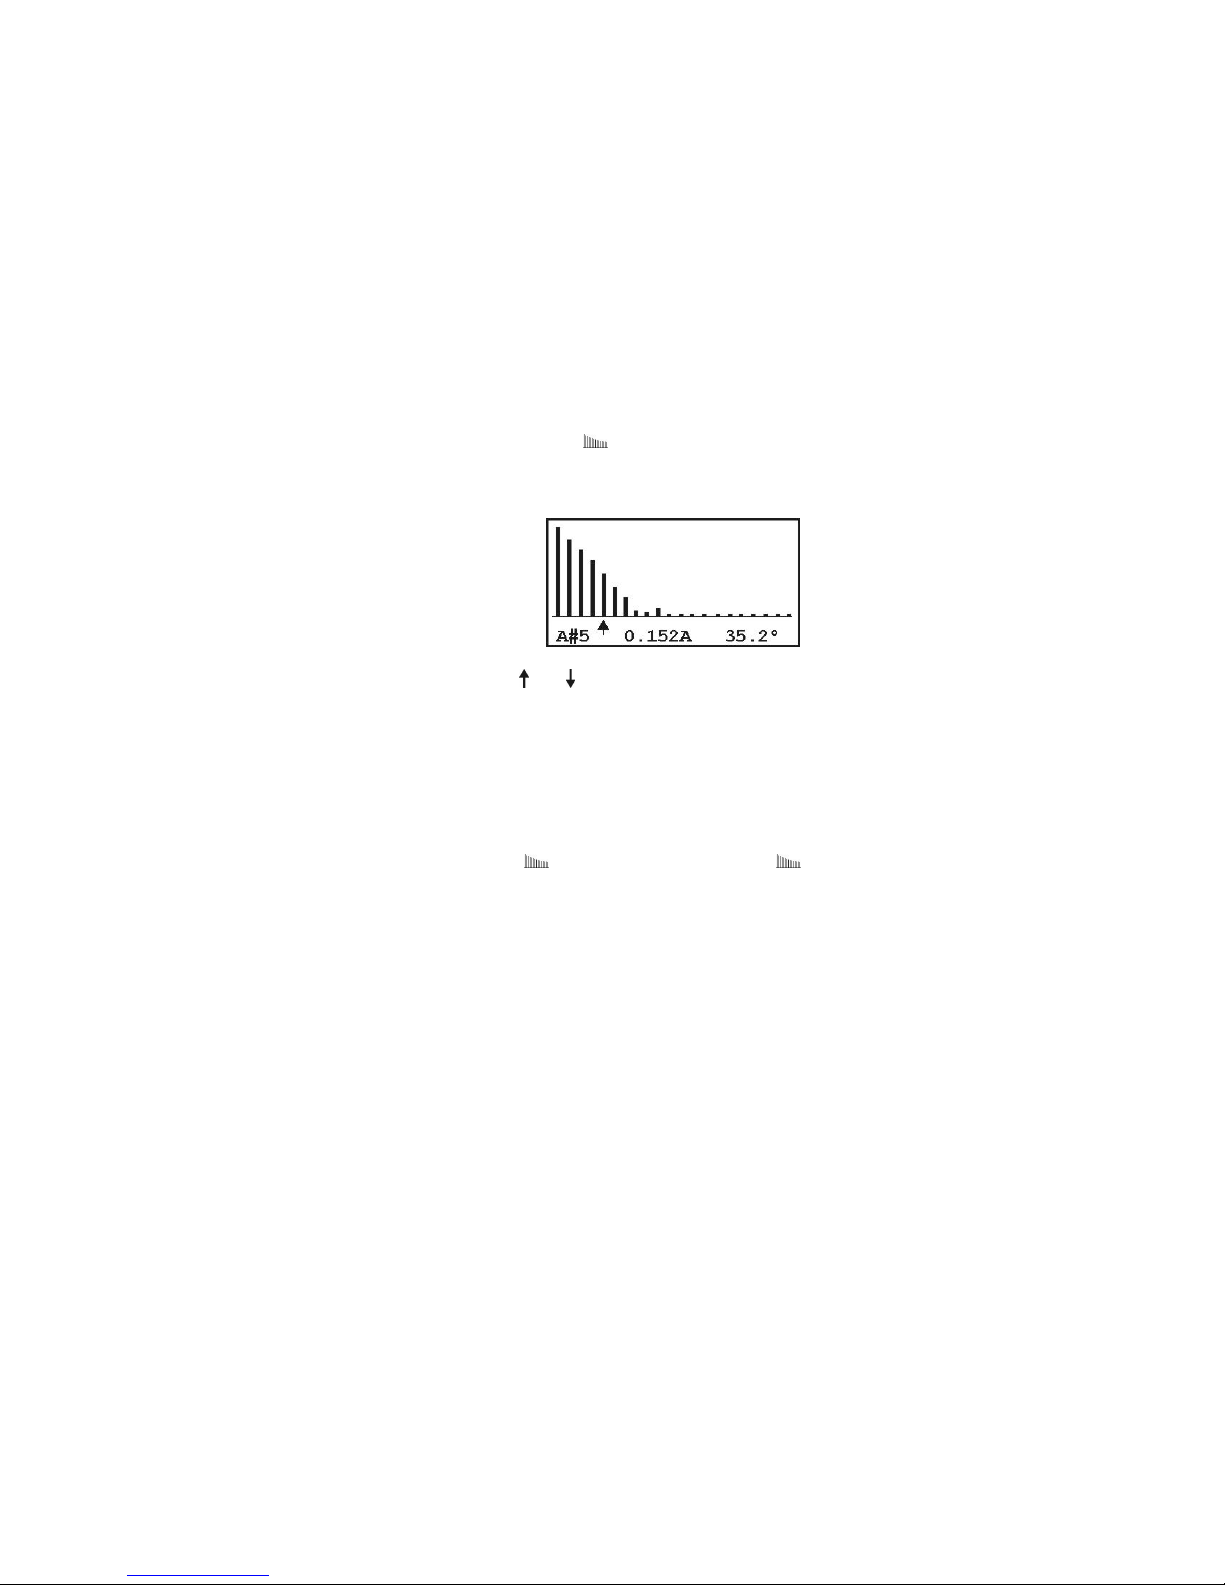
To view a graphical representation of harmonics on the
928A, you must select one or both of the measurement
channels, for voltage and/or current. The Model 928A
allows you to view both voltages and currents, however
it will allow you to view only one channel at a time.
Each channel must be viewed separately due to the
allowable space on the display.
Setup
1. Press the appropriate Signal Selection key in order to measure the signal properly – for example
press 2nd > AI.
2. Press 2nd > and connect the meter probes
between the 928A and the circuit under test.
Read the display.
3. Press or to move the cursor to select the
desired harmonic (e.g. in display above, cursor
identifies 5th harmonic for channel A). Pressing
the arrow keys, after reaching the last harmonic
entry on the screen, will ope n the next (higher
or lower) set of harmonics.
4. To read Channel B graphical harmonics, press
2nd > . Repeatedly press 2nd > to toggle
between Channel A and B graphical harmonic
data.
45
Page 60

Flicker Information
In a sense, flicker is defined as a fluctuation of the
line voltage. It is a very specific problem related to
human perception and incandescent light bulbs, but
not a general term for voltage variations.
The concept behind placing limits on voltage fluctuations is that they cause lights to flicker, which can
be irritating and may cause discomfort. Voltage fluctuations are caused by loads on the power distribution system, which are located near lighting equipment
(within the same building or powered by the same distribution transformer), and have changing power or
current levels.
Based on groups of people tested for irritation from
light fluctuations, most tend to be irritated when the
light fluctuates at around 1000 changes/minute. Apparently above 1800 changes/minute light flicker is no
longer perceived. Fluctuations in the rms voltage of
only 0.25% are sufficient to cause noticeable flicker in
light bulbs.
Some Definitions
Voltage Fluctuation: a series of voltage changes, or
a continuous variation of the rms voltage.
Flicker: Impression of unsteadiness of visual sensation induced by a light stimulus whose luminance or
spectral distribution fluctuates with time.
Short-Term Flicker Indicator, Pst: The flicker
severity evaluated over a short period (10 minutes);
Pst = 1.0 is the conventional threshold of irritability.
A reasonable goal might be to limit Pst values to less
than 1.0 for 95% of the time.
46
Page 61

Long-Term Flicker Indicator, Plt: The flicker
severity evaluated over a long period (over 2 hours)
using successive Pst values. The Plt threshold is 0.8.
Plt is not measured by the 928A.
FLK – Instantaneous Flicker
FLK flicker is defined as the instantaneous flicker that
is updated each second. By simply pressing FLK the
928A will display instantaneous flicker based on the
signals applied to channel A and/or B. To view flicker
on the 928A, you must select voltage for measurement
channels A and/or B.
1. Press 2nd > AV and/or 2nd > BV.
2. Press FLK, and read the instantaneous flicker.
FLK flicker values are measured at approximately
100 millisecond intervals and updated on the 928A display each second.
Pst – Short-Term Flicker
Pst flicker is defined as Short-Term Flicker and averages the flicker values over a ten minute time period,
counting down in seconds. The display shows a countdown value as Pst is being processed. At the end of
the countdown period, Pst is displayed based on the
signals applied to channels A and/or B.
1. Press 2nd > AV and/or 2nd > BV.
2. Press 2nd > Pst, and read the short-term flicker.
47
Page 62
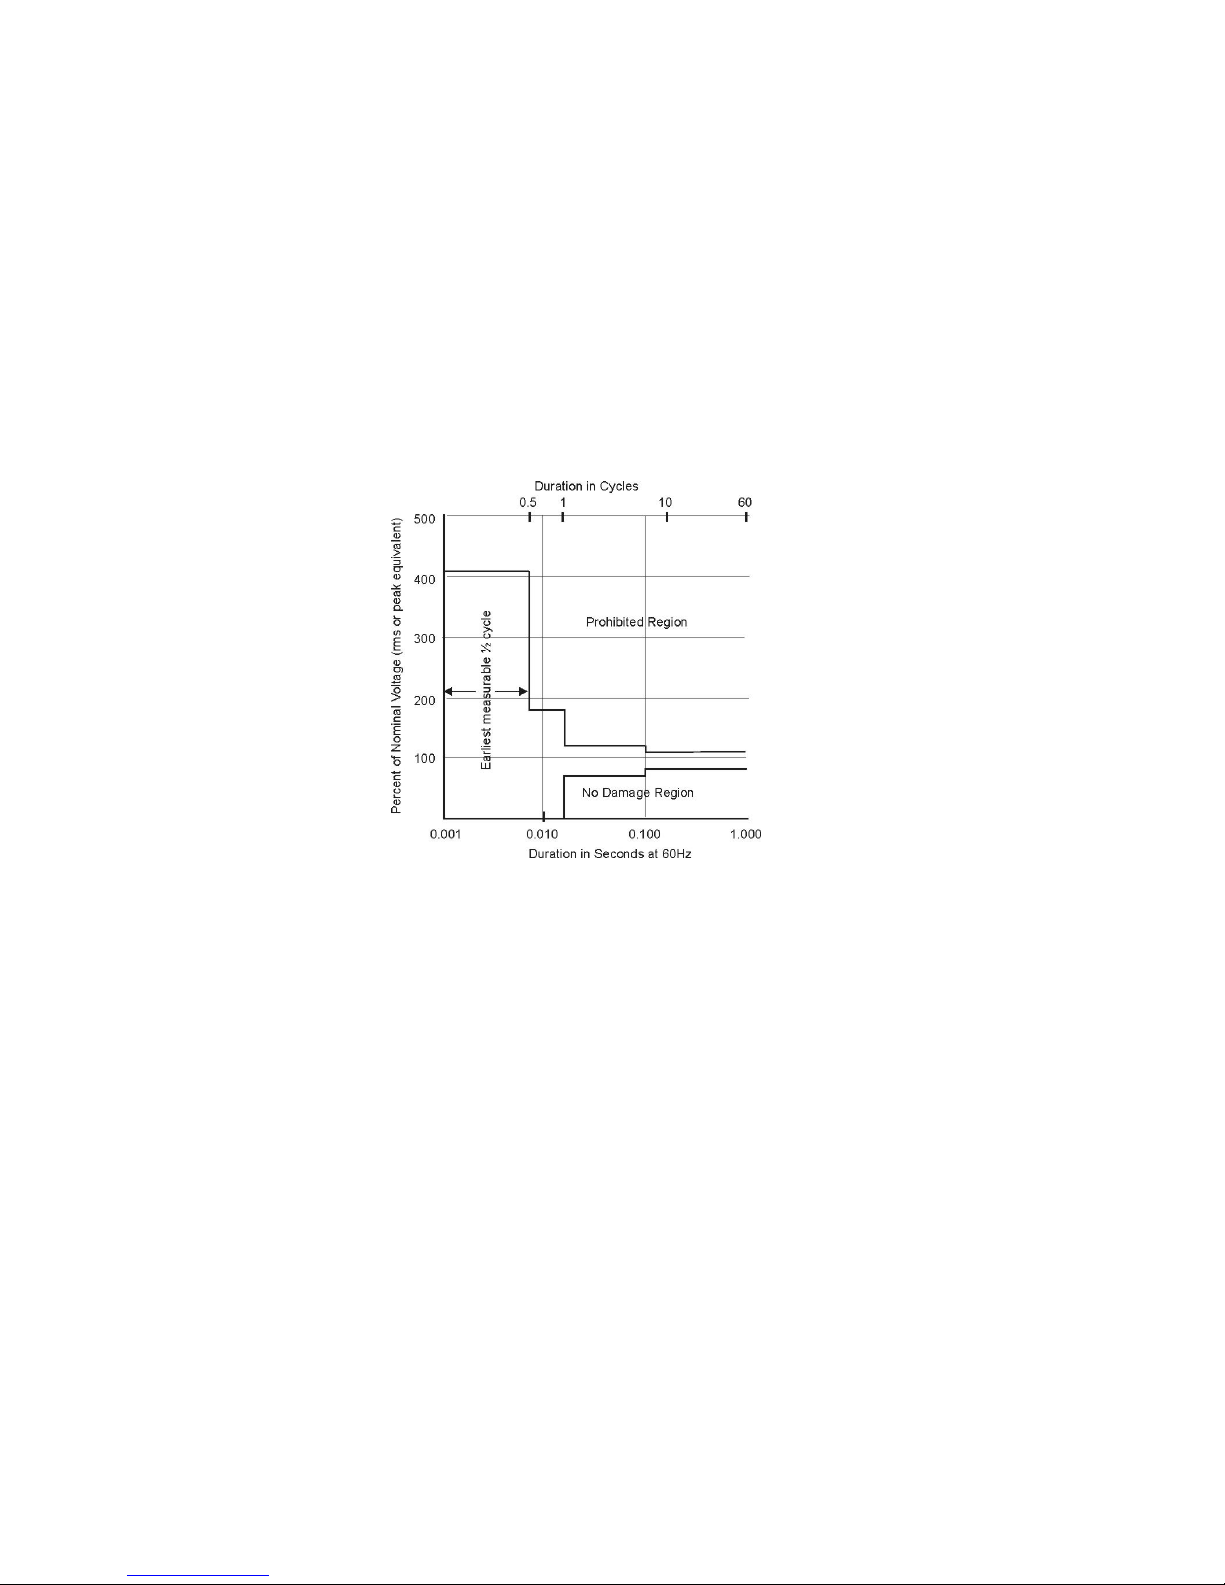
PQ – Power Quality, Sags and Swells
Method
The Model 928A measures sags, swells and power interruptions by using the PQ power quality triggering
function. PQ follows the CBEMA method of measuring the signals at Channels A and B, comparing
them to point limits over assigned time intervals. The
rules used to measure the two input signals, including
Point Limits, are called a Profile. An example of the
CBEMA method used in the 928A is illustrated below.
Figure 4, drawn in a manner after the CBEMA
method, models some sag/swell voltage limits and time
intervals set in the 928A. Time intervals are normally
configured as an integer multiple of a half cycle at the
nominal frequency.
Figure 4: Point Limit Profile
48
Page 63
The 928A stores power quality (PQ) records of sags
and swells as a list of dates, times, maximums and
minimums while the trigger is active. After the trigger
becomes Inactive, it will display them on the 928A.
Any one profile may consist of up to 10 Point
Limits, with each point defined over integer-multiples
of half-cycles of the nominal frequency. Configuring
point limits is straightforward, existing ones may be
adjusted and more added at a later time.
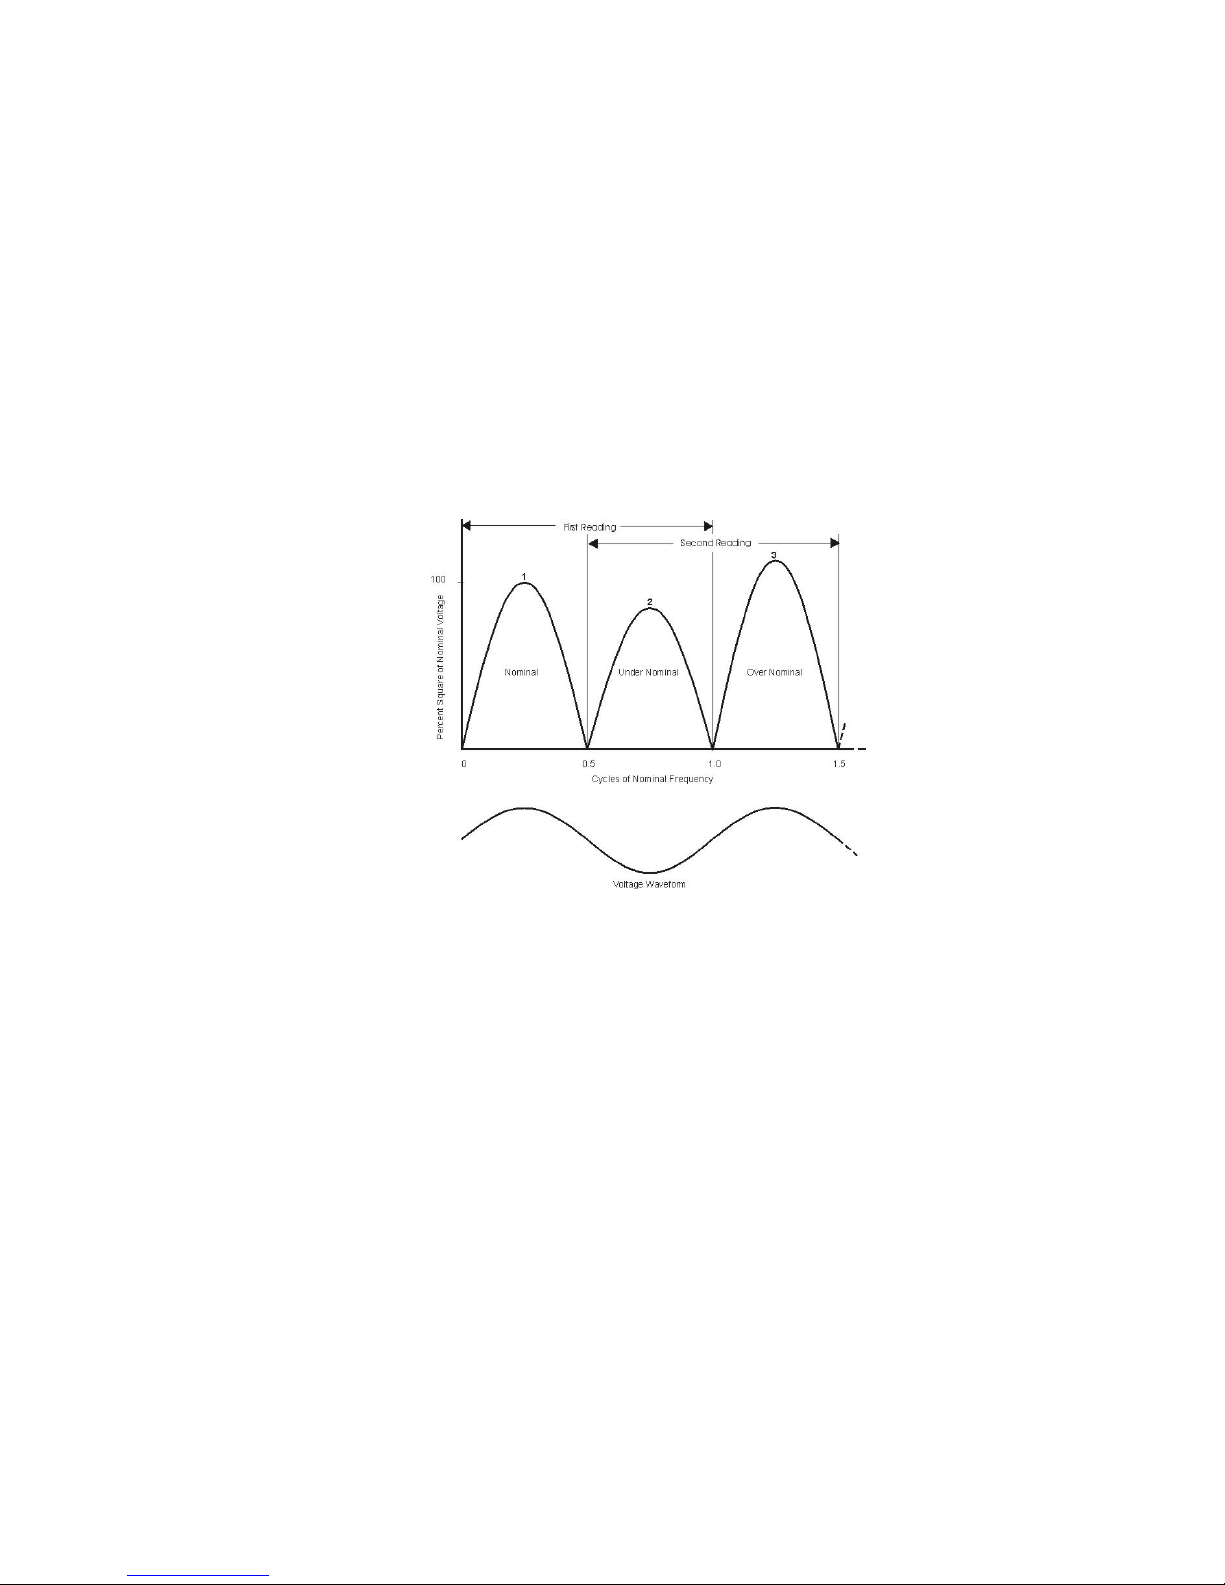
Note: the PQ function measures RMS values only.
In the diagram below, notice that half-cycle voltage waveform elements have been squared, with each
half-cycle having a different maximum compared to
nominal. Also notice that these half-cycle elements
are grouped in overlapping pairs. It is the rms value
of two adjacent half-cycle elements that are compared
to the profile limits.
49
Page 64

PQ Profiles
The Model 928A can store up to 5 distinct PQ profiles
that may be configured using Mlink software and uploaded into the 928A. Profiles are listed in the Model
928A as OFF, USER, PROF-1, . . . , PROF-5.
USER Profile
One profile, called USER, is available only from the
928A keypad. When you select USER, you can set up
one point limit directly in the 928A. Records stored
from USER profile are only available on the 928A itself
and cannot be downloaded.
Profiles - OFF
Select OFF when not using PQ Triggering. Otherwise,
PQ triggering could fill up the available memory. See
Selecting PQ Profiles on following pages.
Working with PQ Profiles and Records
Internal flash memory will store all PQ event records
until flash memory is full, overwritten or erased. View
event records directly from flash on the 928A by pressing PQ. Changing the PQ profile will not disturb
records already stored in flash memory.
NOTE: Make sure to download event records using Mlink software prior to deleting from flash in the
928A.
Selecting PQ Profiles
Except for one PQ profile named USER, all PQ Profiles are configured by using Mlink software. Configure
the profile named USER only from the 928A keyboard.
50
Page 65
Additionally, Channels A and Channel B may be configured independently.
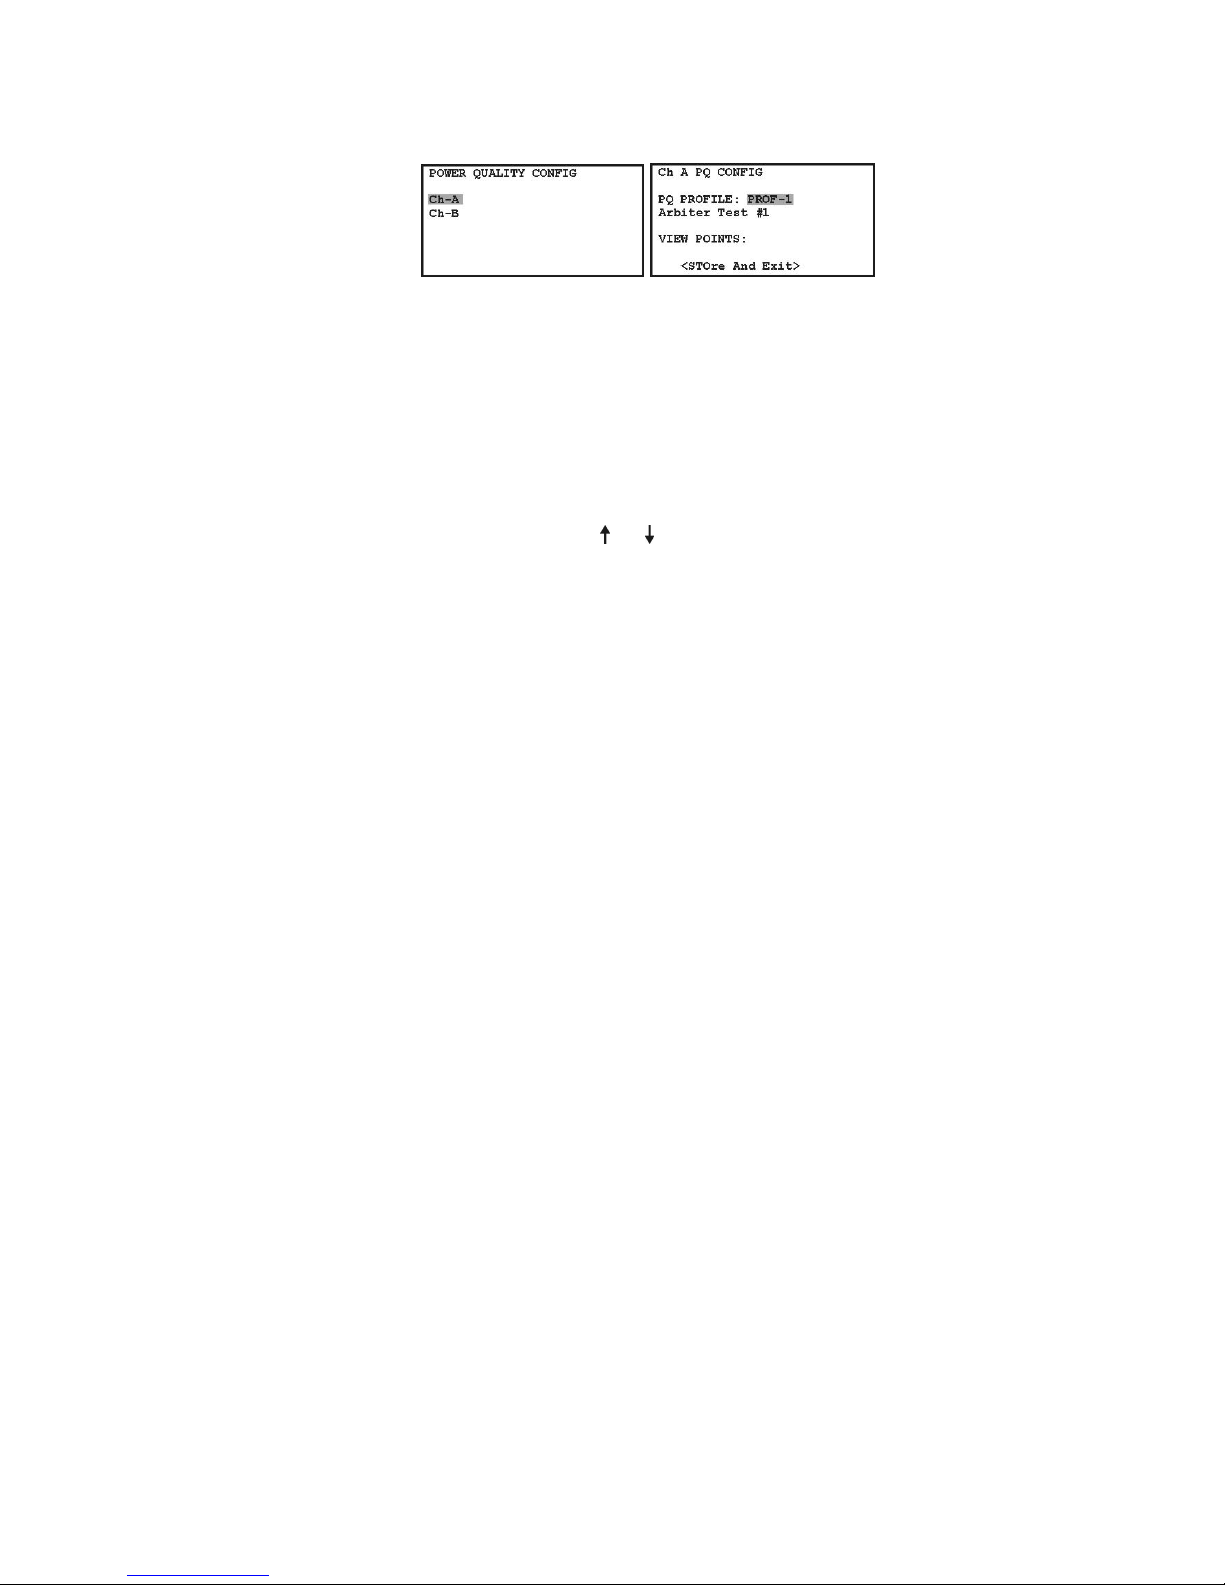
1. To select a PQ Profile, press PQ > 2nd >
MENU. With the cursor, highlight either Channel A or B and press ENT to open the profile
selection screen (seen in right screenshot).
There will be 7 available choices: 5 PQ Profiles,
1 USER Profile and OFF (to disable).
2. Press ENT to highlight the profile name (e.g.
PROF-1), and or to select the desired PQ
profile name. Press ENT to assign the profile
name and to move to VIEW POINTS.
3. Press ENT (with cursor on VIEW POINTS) to
open the Point Limit viewing screen, or highlight
<STOre And Exit> and press ENT. Press
ESC to exit.
USER Profile Setup
Select one USER profile in the same manner as for
Profile 1 . . . 5 and OFF. From PQ Profile, select USER
and press ENT. Select VIEW POINTS and press ENT.
You should see the screen depicted on the right (below).
51
Page 66
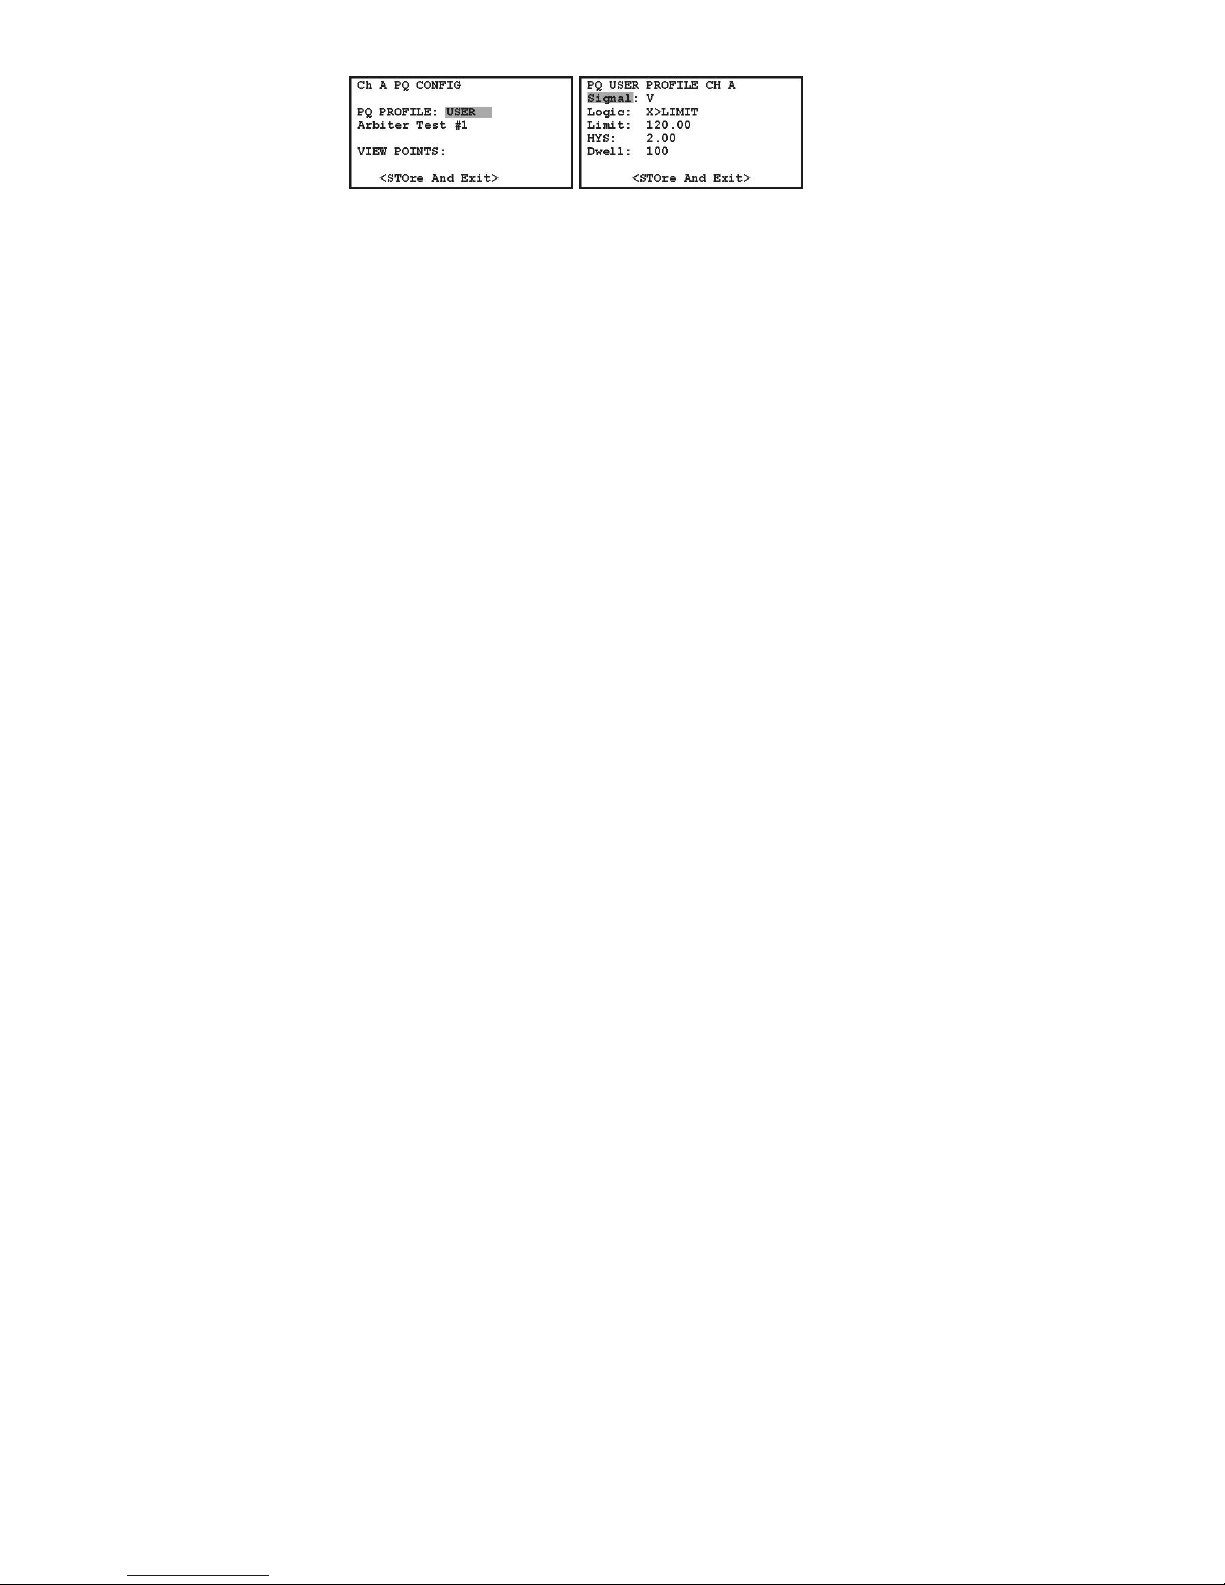
USER Profile Definitions
Signal: Select either V for voltage, or I for current.
Logic: Compares Signal (X) to Limit: select either
X>LIMIT, or X<LIMIT.
Limit: Logically compares the signal to this value:
select any floating point number up to 1,000,000.
HYS: Hysteresis: adds to the Limit value (±) to
reduce unnecessary events; select any floating point
number up to 1,000,000.
Dwell: Number of half cycles while while Logic is
true before trigger becomes Active; select any integer
number up to 65535.
Tips on PQ Triggering
Here are some situations where you might not see any
recorded events even though the measured parameter
meets the required “Limit” conditions.
1. The parameter already meets the limiting condition when setting the trigger; it needs a transition from LO to HI or HI to LO before trigger
becomes Active.
2. The parameter did not meet the dwell condition.
3. The parameter met the original limit conditions,
however fell outside the sliding reference time
constant (see IEC61000-4-30, par. 5.4.4.).
52
Page 67
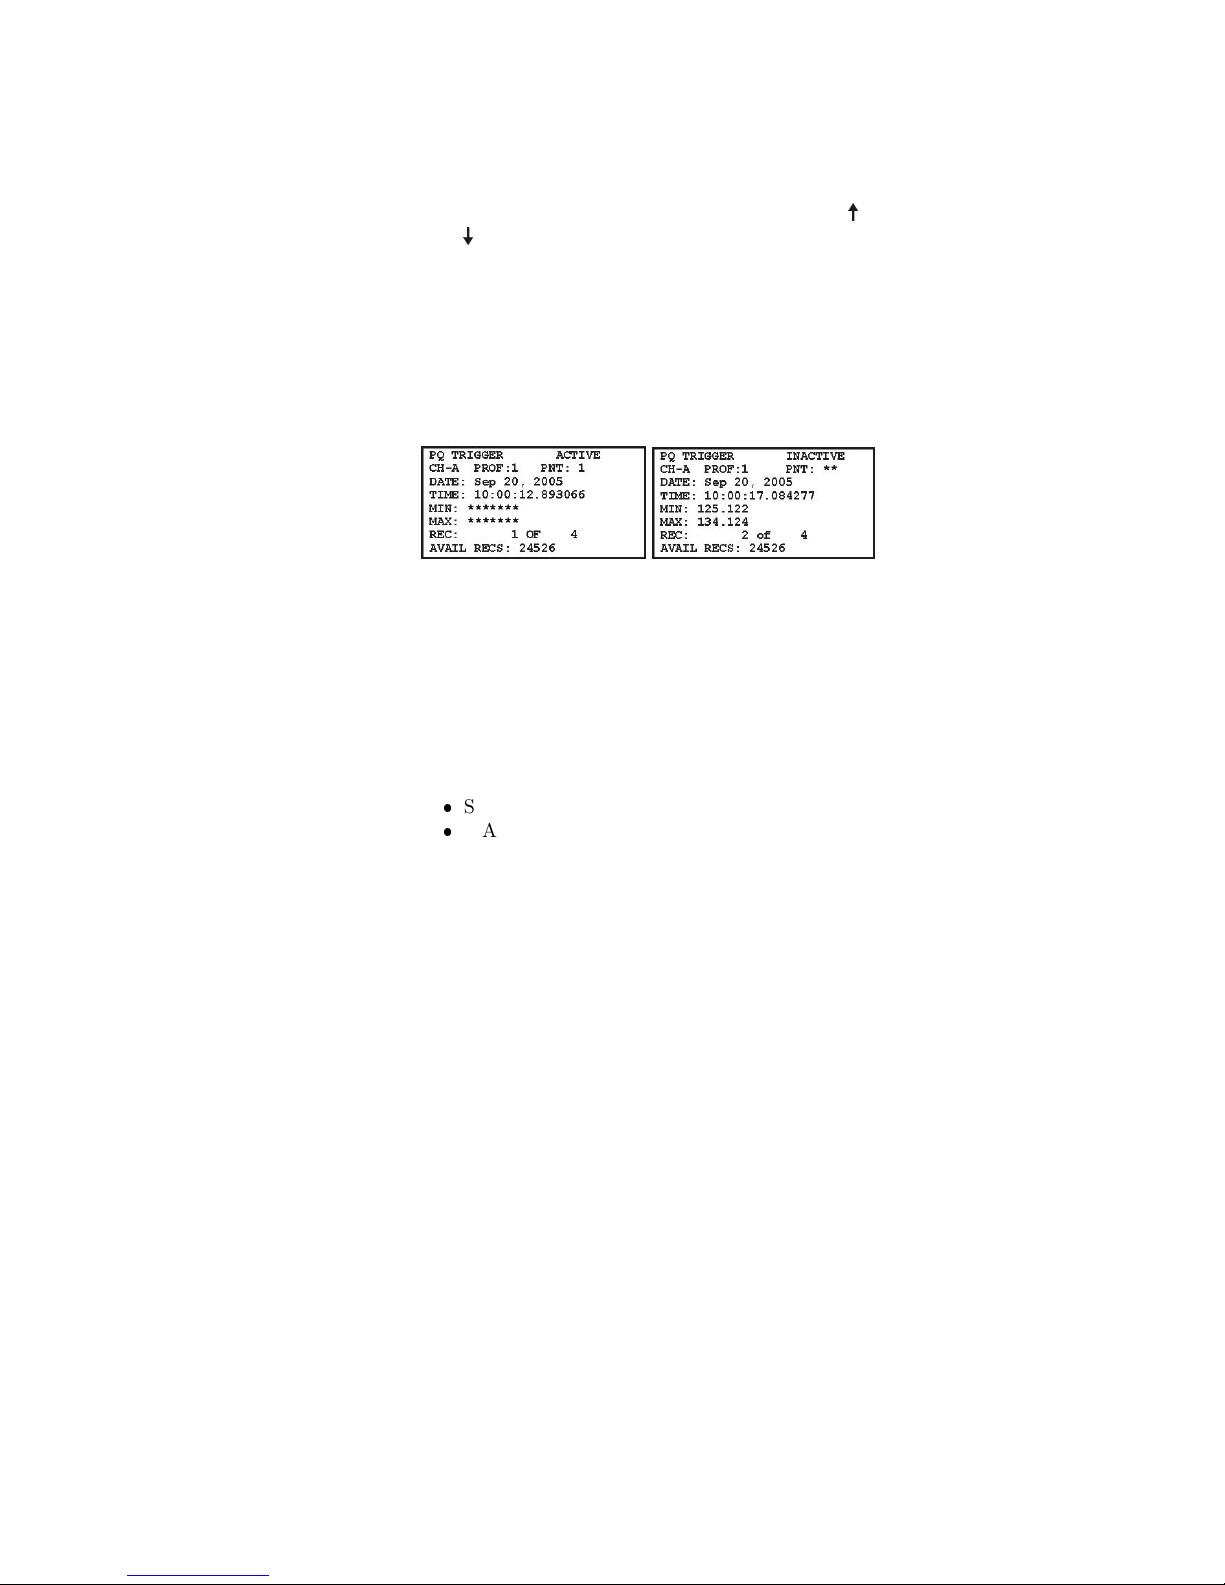
Accessing PQ Events
1. Press PQ to view power quality event rec ords.
Power Quality events are listed according to
Record Number (RECS), Date and Time.
2. Scroll through the listed events by pressing or
- shows MIN/MAX values when PQ Trigger
is Inactive (right screen), no MIN/MAX values
when Active (left screen).
3. Press any other function key to leave the PQ
Event List.
4. Use Mlink software to download PQ records in
CSV format to view in spreadsheet form.
NOTE: PQ profiles (PROF-1, . . . , PROF-5) must
be configured through Mlink software, then uploaded
to the Model 928A.
PQ Records
When the signals measured at either Channel A or B
exceed any Point Limit, the Model 928A will record
the following values:
Start & Stop Times
MAX & MIN values within Start and Stop Times
Press PQ to view recorded events by time and date.
To view PQ data from Excel or other spreadsheet, use
Mlink software to download records from 928A.
53
Page 68
TRIG – Working with Triggers
Use TRIG to test various input signal conditions such
as voltage interruptions or frequency changes. When
these conditions match the defined triggering limits,
the 928A will record the start and stop times, and the
maximum, or minimum signal value during the event
(i.e. the date and time in which the trigger is active).
TRIG is very similar to PQ triggering as described
in the previous section. However, TRIG is more general and flexible than PQ, and does not conform to
IEC 61000-4-30, paragraph 5.4.4.
Viewing Triggers
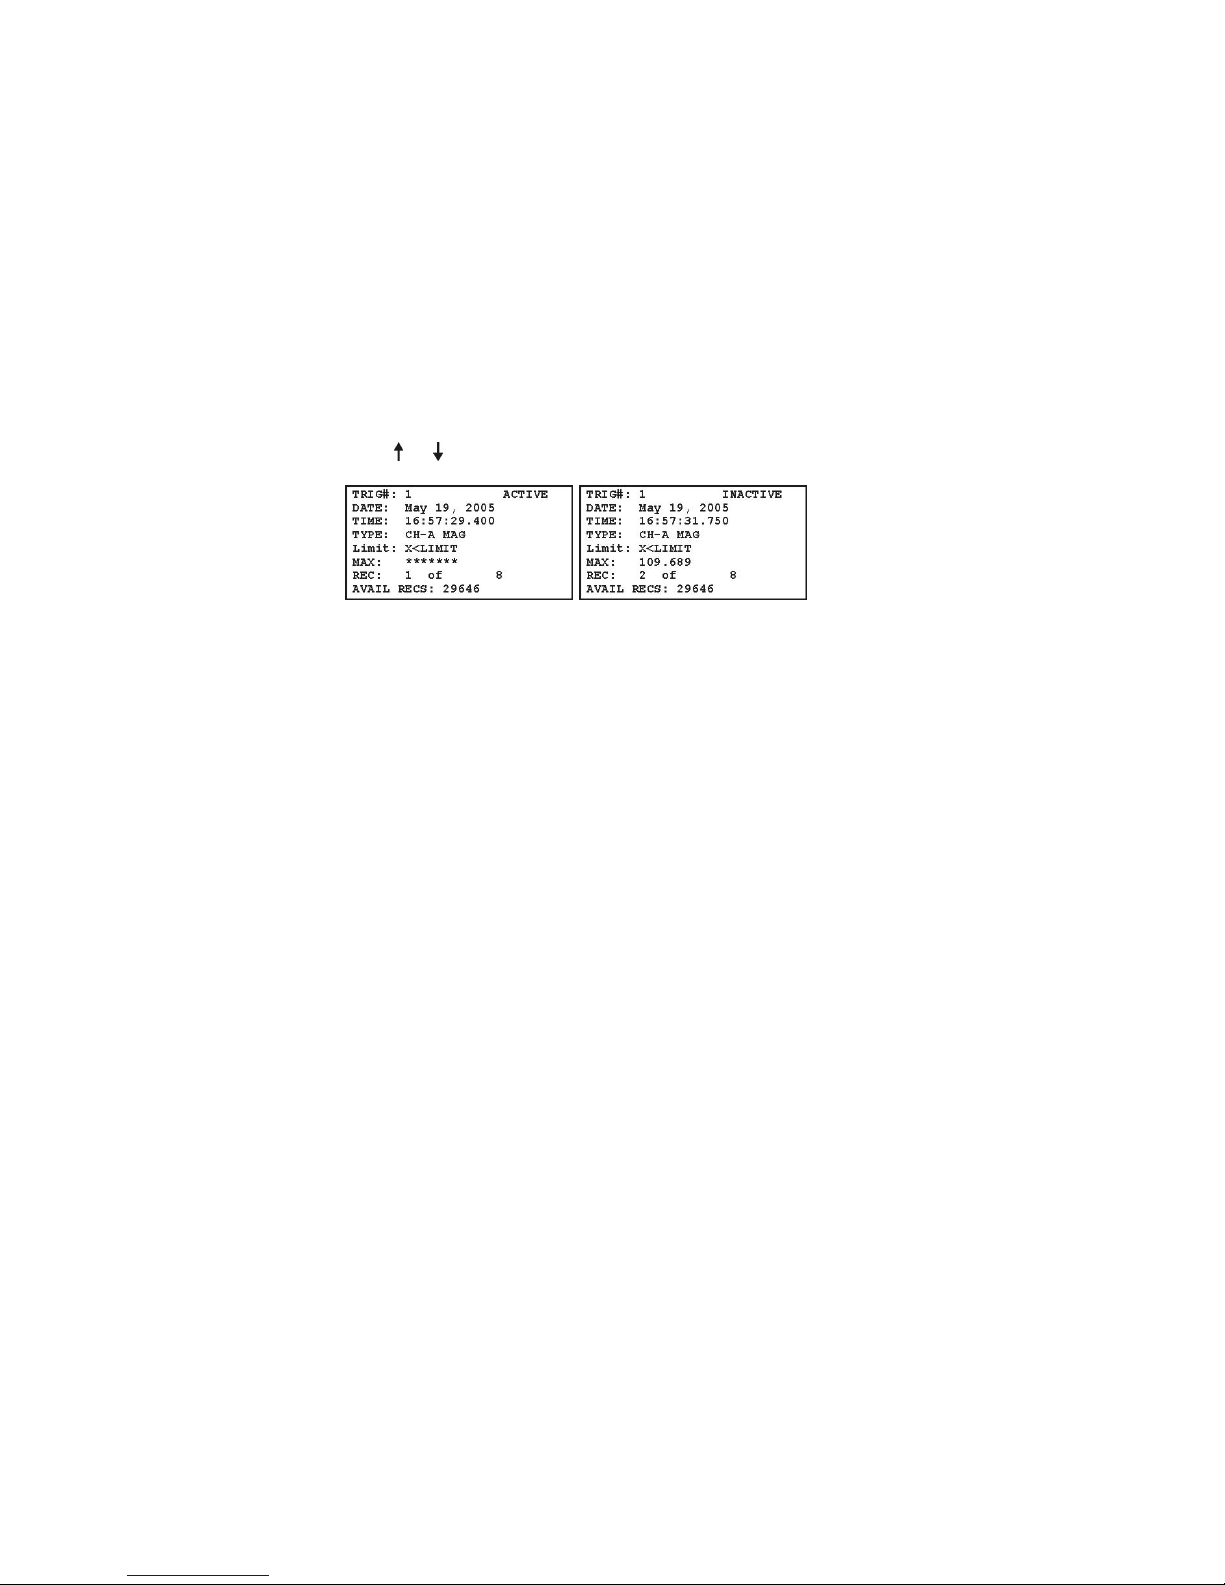
Press 2nd > TRIG to view the Trigger Events screen.
Press
the date and time that TRIG #1 first became active
(i.e. triggered); note that no input signal levels are
recorded.
returned to normal limits, and became inactive (i.e.
“non-triggered”). Notice that REC 2 of 8 also indicates a MAX (or MIN) value of the input signal during
the time while the trigger was previously active.
the lowest value recorded during this event was 109.689
volts at the date and time indicated.
or to move through the rec ord list.
In the screen shots above, REC 1 of 8 indicates
REC 2 of 8 shows the date and time TRIG #1
In this example, the Limit was set to 110.00, and
54
Page 69
Configuring Triggers
Note that you can only configure TRIG from the 928A
itself, not in Mlink.
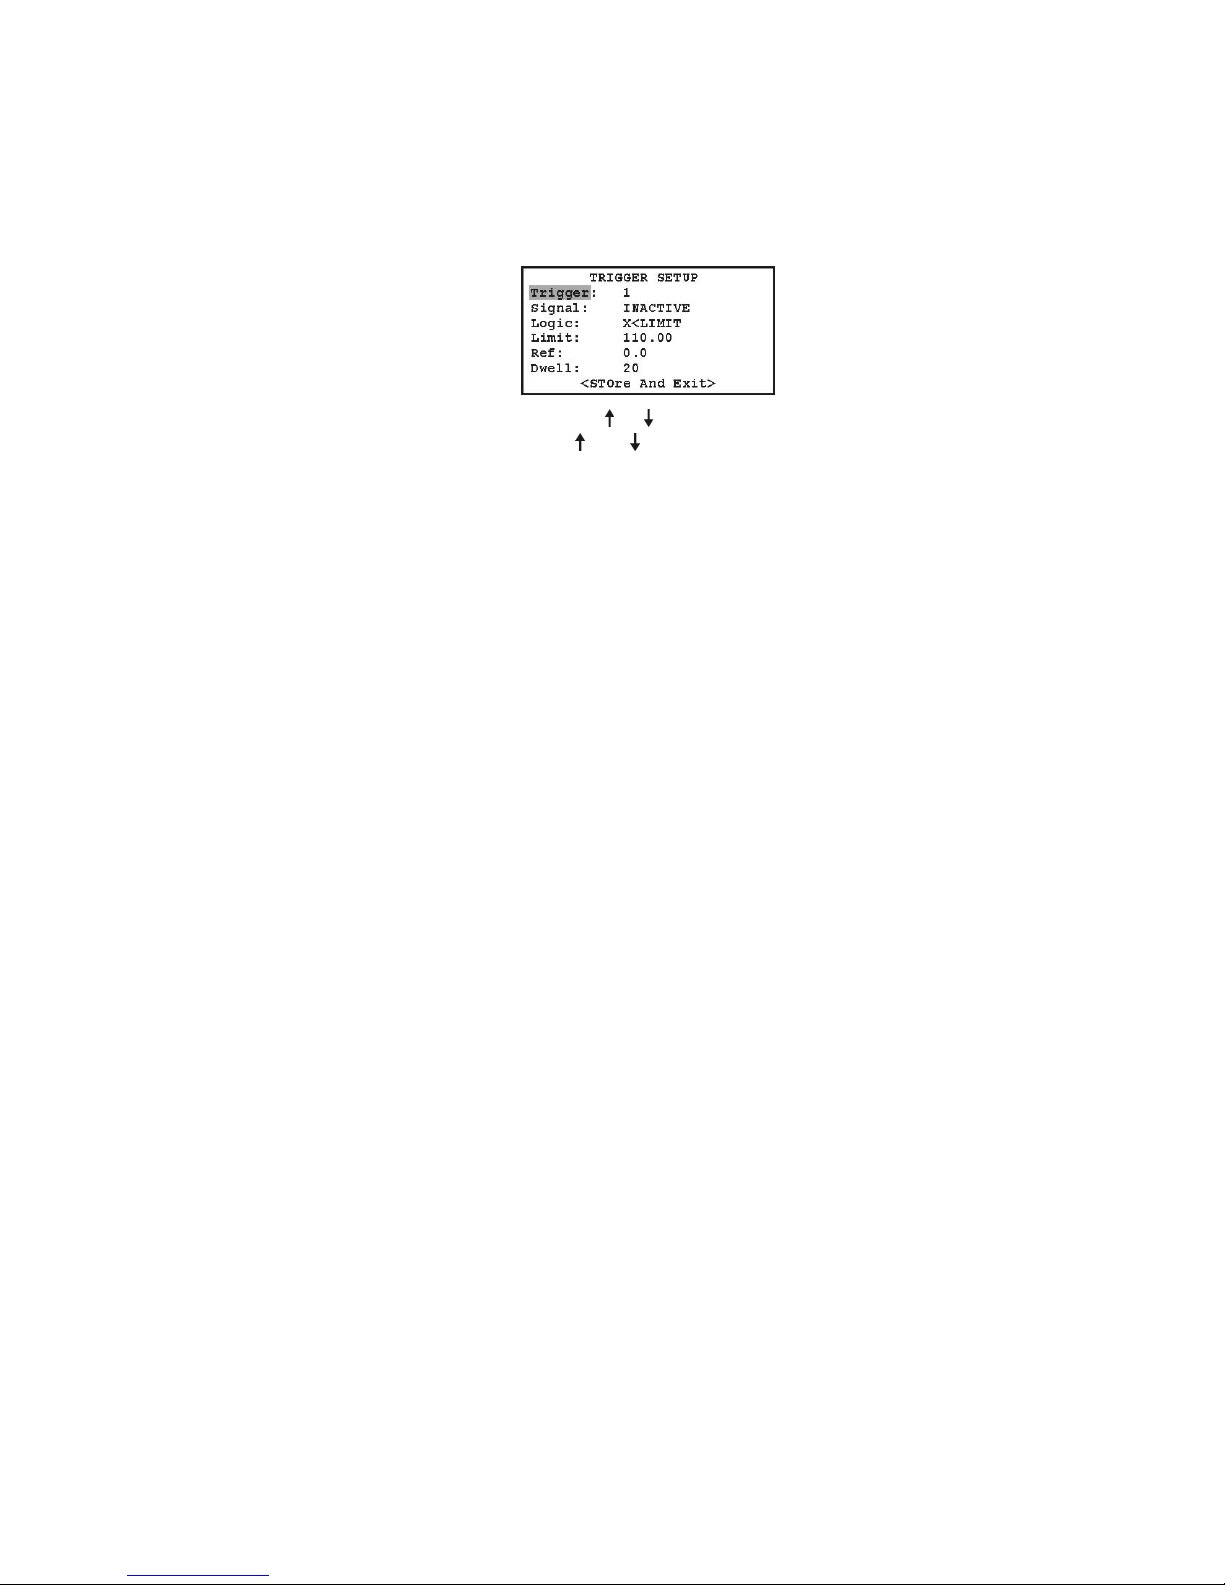
To configure TRIG, press 2nd > TRIG > 2nd >
MENU. Once in this menu, step through each condi-
tion and view or edit any value. There are 8 individual
triggers available.
1. Press ENT and or to select trigger.
2. Use ENT > and , or the number keys to the
configure triggering conditions.
3. Highlight <Store And Exit> and press ENT to
store new values.
4. Press ESC to exit the configuration screens.
Trigger Setup Value Definitions
Trigger: 8 possible profiles available
Signal: Allowable input signal values: INACTIVE
(means the trigger is not armed), CH-A MAG, CH-B
MAG, WATTS, VA, VAR, PF and FREQ.
Logic: 4 conditionals: x < Limit; x > Limit; |x| >
Limit; |x-ref| > Limit; x = input signal value
Limit: Numerical value compared to signal: floating
point.
Ref: A nominal signal value (e.g. 60 Hz) used to compare to Limit: floating point
Dwell: The persistence in alarm condition before trigger becomes active, in 50 millisecond increments (e.g.
20 = 1 second): an integer.
55
Page 70
A/B Function
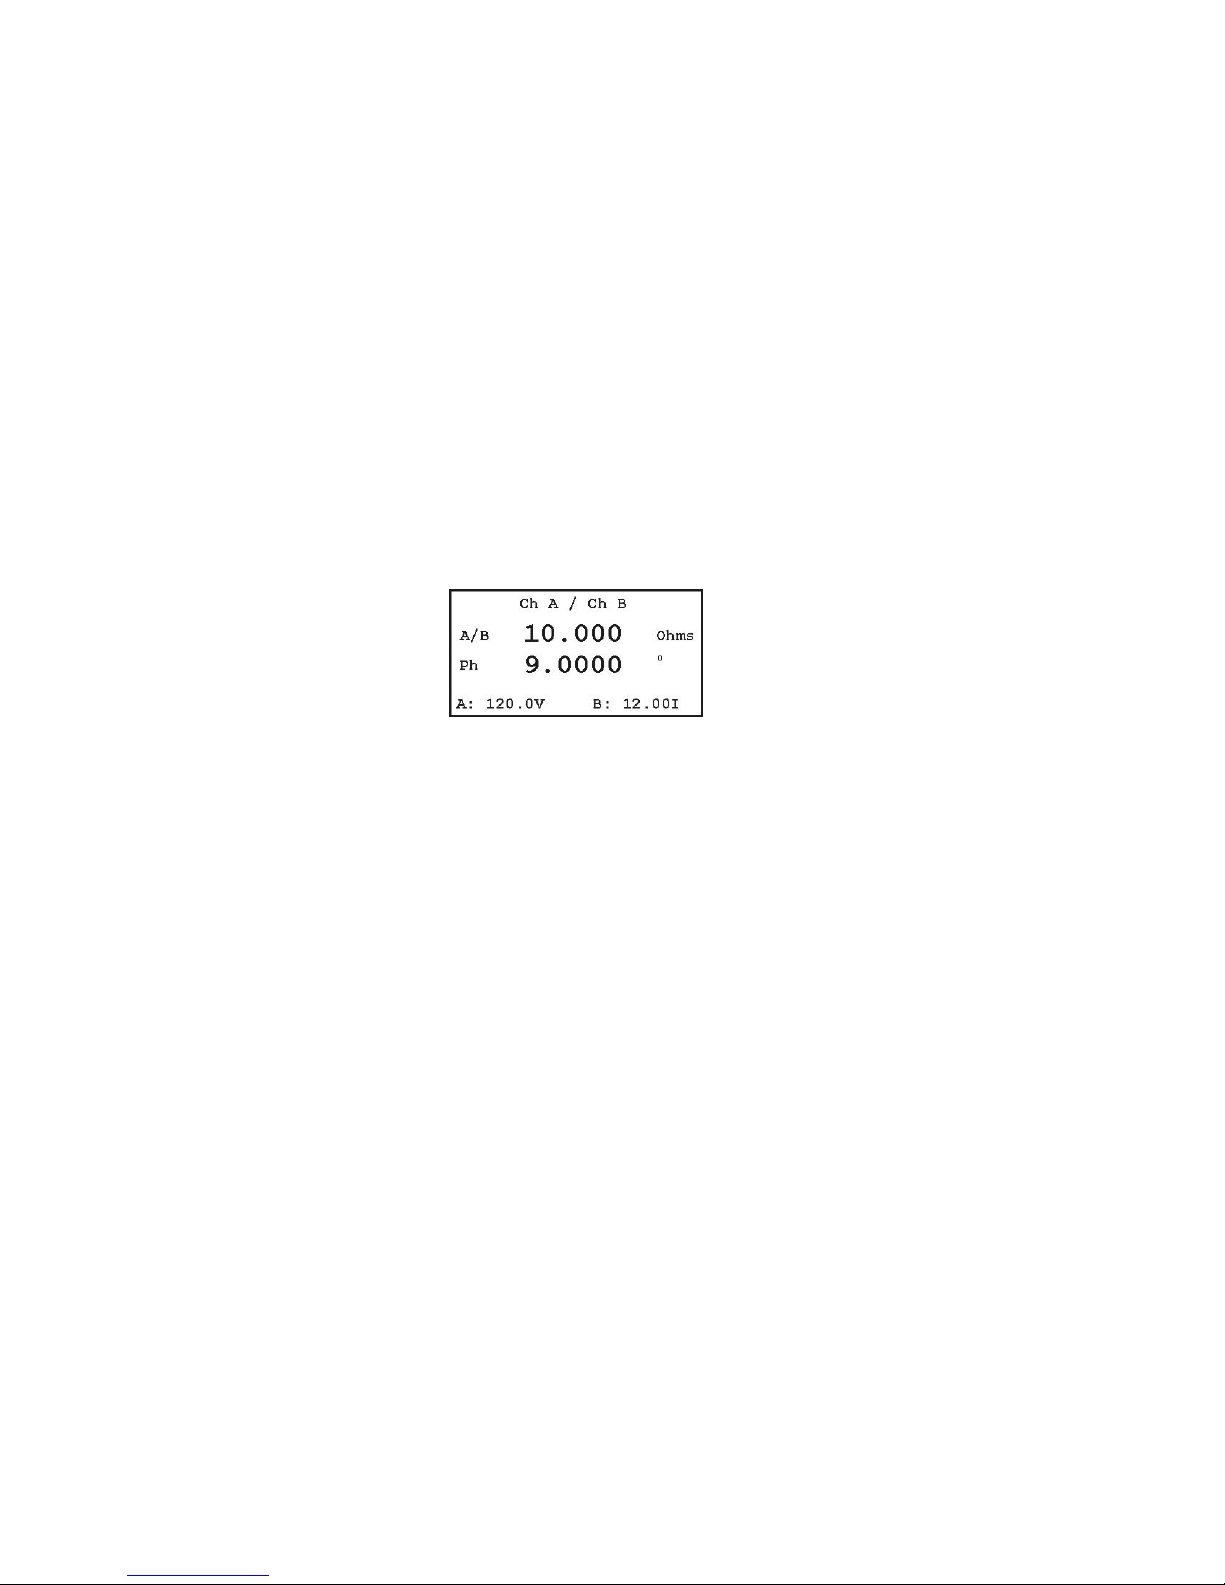
Use the A/B function to find the ratio of the two measured input signals to Channels A and B. If, for example, you wish to know the ratio of a voltage at channel
A to a current a channel B, pressing the A/B button
will display the results of dividing the voltage by the
current giving resistance and phase offset of Channel
B from Channel A.
Setup
1. Make sure that Channel A and B are set up properly with both channels configured for voltage
and/or current; you must use two channels to
use A/B. If necessary, see Configuring Channels
A and B on page 23.
2. Press A/B and connect the measurement probes
to the circuit under test.
3. Read the display.
NOTES: If you configure channel A as current
and channel B as voltage, then the units will be in
Mhos and degrees. If you choose two voltages or two
currents, then the units will be a strict ratio (with no
displayed units for A/B) and degrees.
56
Page 71
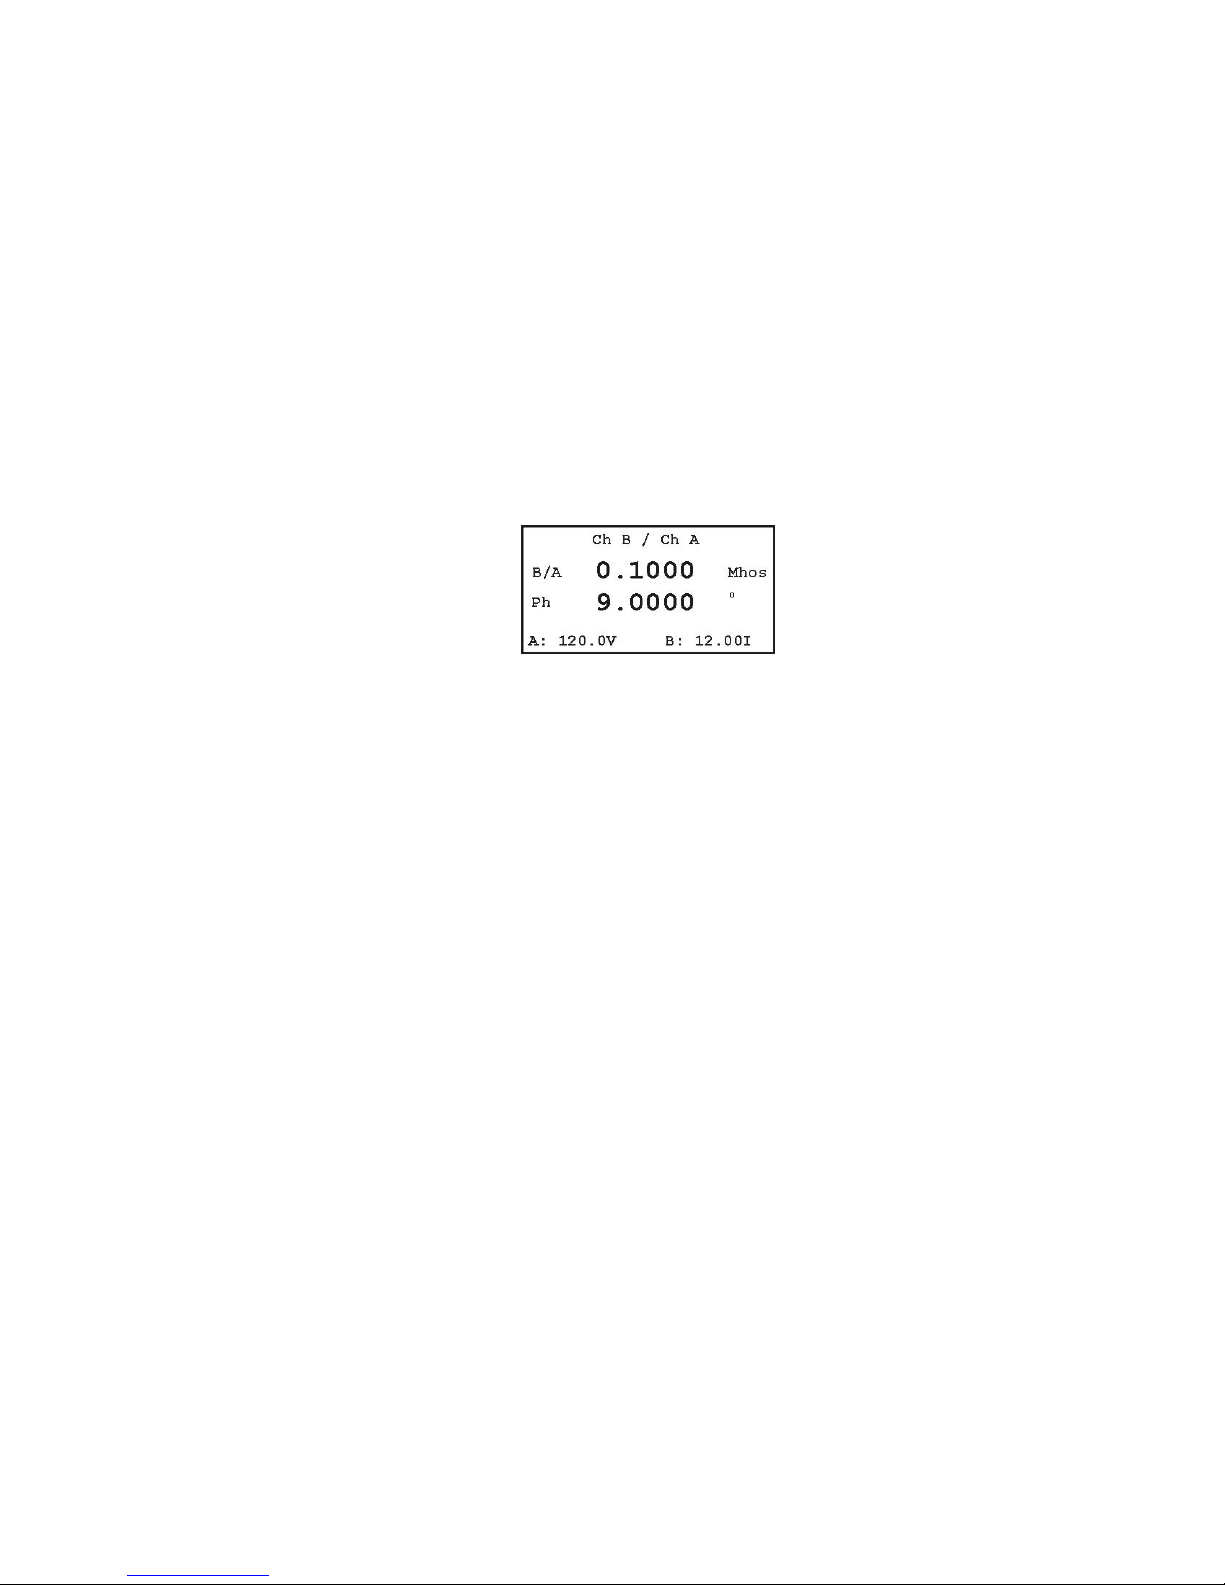
B/A Function
Use the B/A function in the same manner as you would
with the A/B, only with the reverse response as with
the A/B function and the same input signals.
Use the B/A function to find the ratio of the two
measured input signals to Channels A and B. If, for
example, you wish to know the ratio of a voltage at
channel A to a current a channel B, pressing the B/A
button will display the results of dividing the current
by the voltage giving conductance, in Mhos, and phase
offset of Channel A from Channel B, in degrees.
Setup
1. Press B/A and connect the measurement probes
to the circuit under test.
2. Read the display.
NOTES: If you configure channel A as current and
channel B as voltage, the units will be in ohms and
degrees. If you choose two voltages or two currents,
then the units will be a strict ratio (with no displayed
units for B/A) and degrees.
57
Page 72
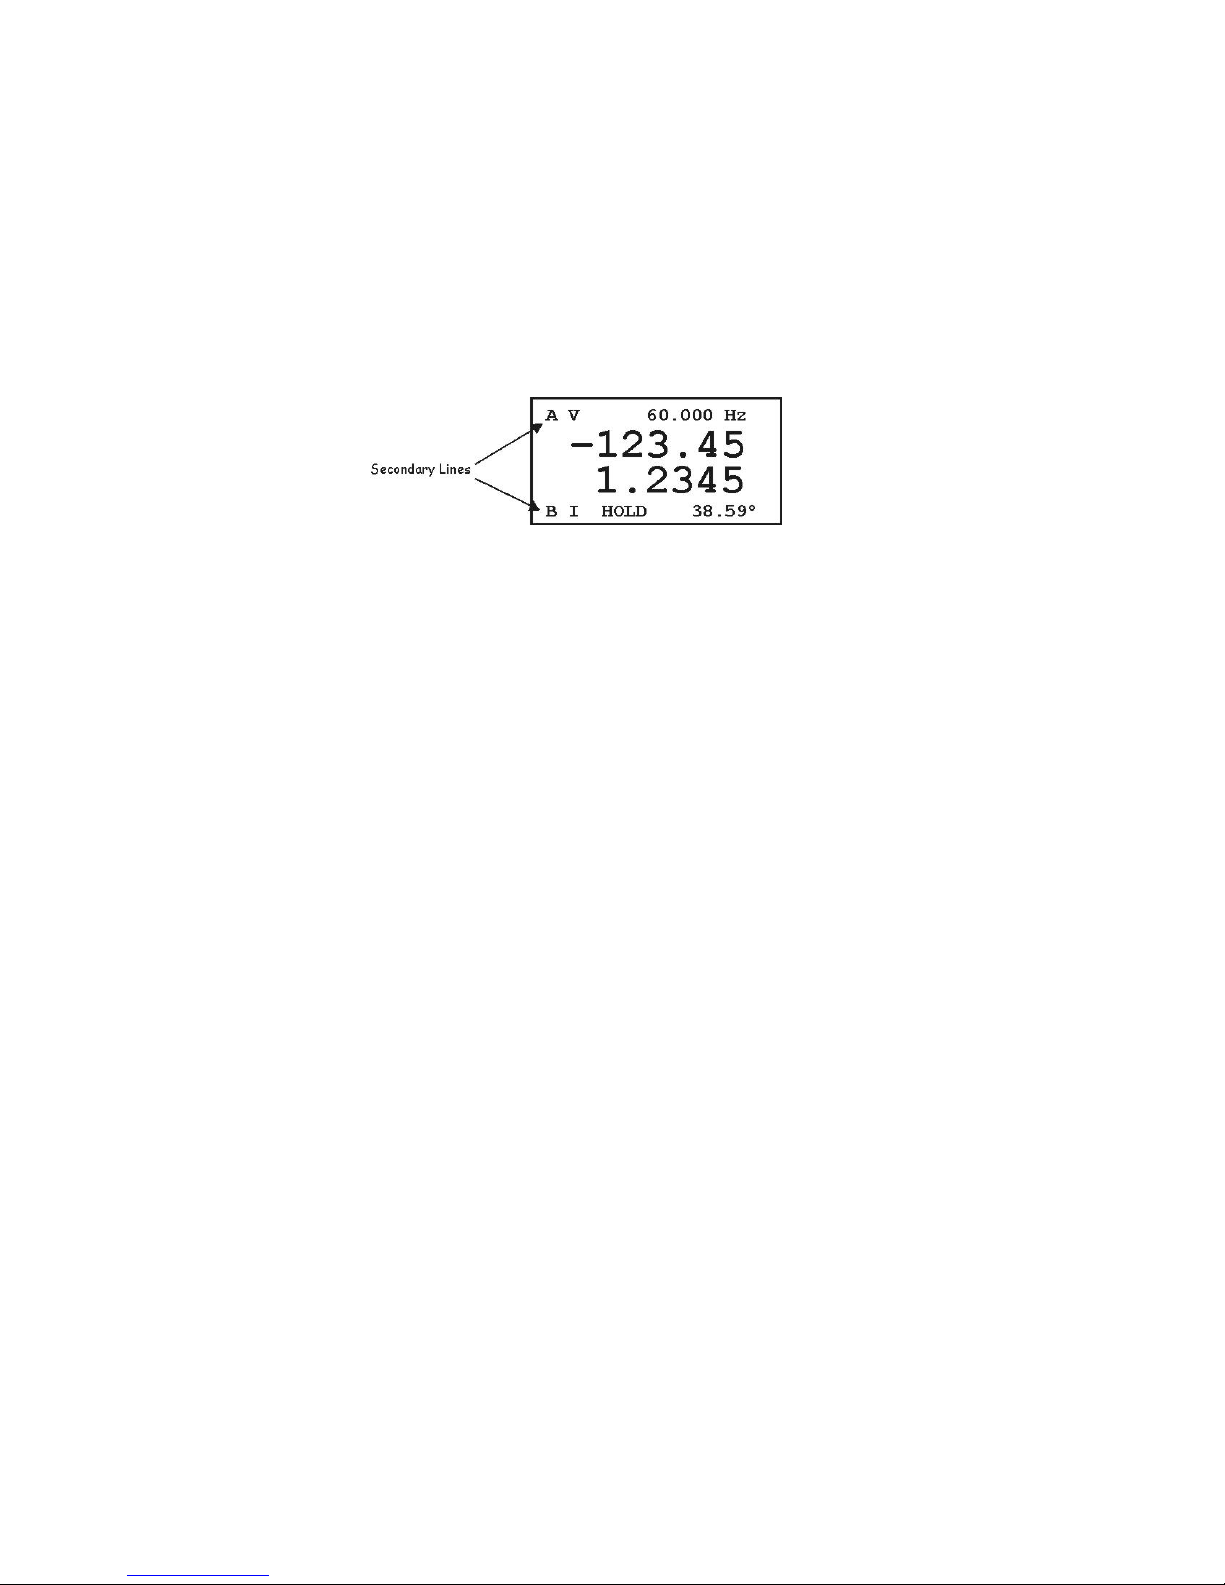
HOLD – Hold Metered Value
Press HOLD to leave the measurement mode and retain the last measured value on the display. Press
HOLD again to return to the measurement mode.
The Hold function operates only with measurement
functions, and not with setup screens or with Date and
Time. To view and/or change the Date and Time, see
DATE or TIME on pages 20 and 21.
When in the hold mode, you will see the word
“HOLD” in the lower secondary line of the display,
as illustrated below. When not in the measurement
mode, the word “HOLD” will disappear.
Procedure
1. Set up the 928A to measure the values you wish
to observe. If necessary, see Configuring Channels A and B on page 23.
2. Connect the measurement probes between the
928A and the circuit under test. Press HOLD.
This puts the display in the hold mode.
3. Read the values.
4. Press HOLD again to return to the measurement
mode.
58
Page 73
RCL – Recall Stored Values
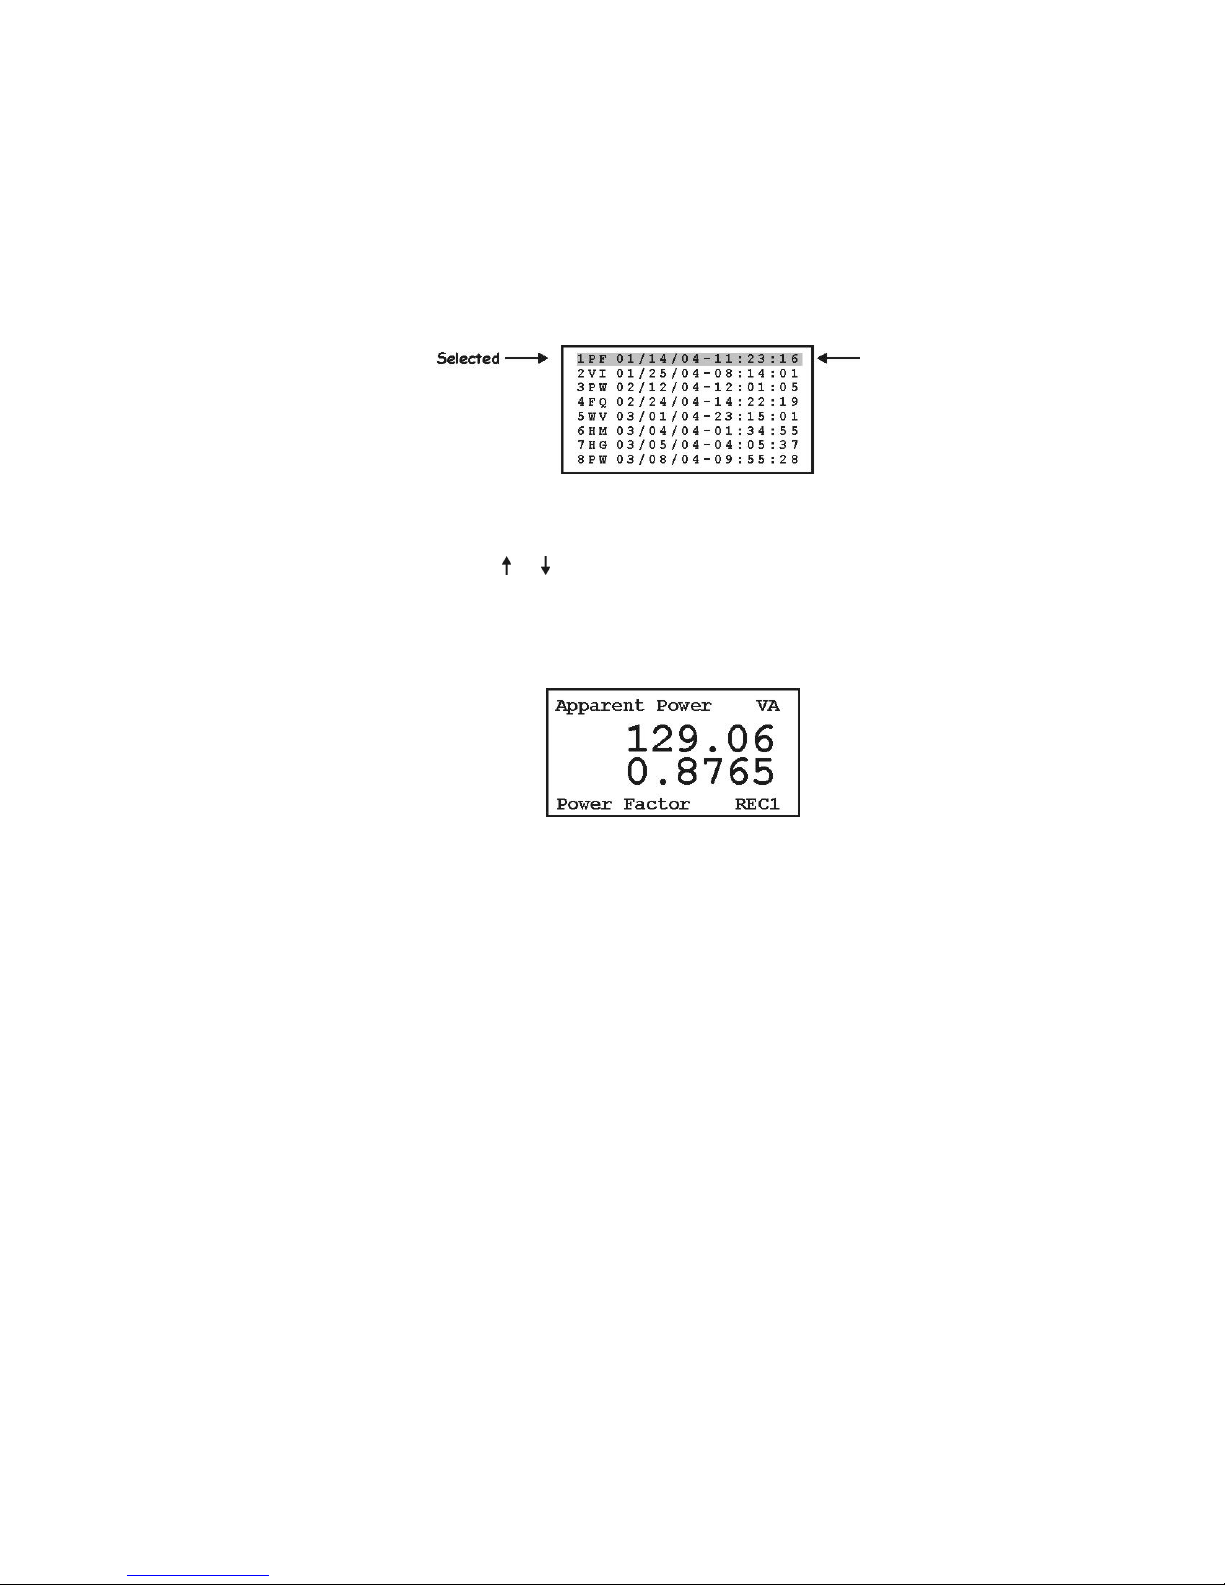
Press 2nd > RCL to open the list of records stored
from pressing STO. Records are replaced when storing
a new record over the old record location. The Model
928A can store up to eight records using STO, and
numbered from 1 to 8.
Records are stored according to number, type, date
and time as shown in the example below.
Viewing Procedure
1. Press 2nd > RCL to view the Recall Stored Data
screen.
2. Use or to select the record for viewing.
3. Press ENT to view the selected record data.
Note the word“REC1”, for Record #1, in the
lower right of the display below.
4. Press ESC to return to the Recall Data screen
and select a new record. Press ESC again to
leave the Recall Stored Values list.
59
Page 74
Integration Key
Purpose
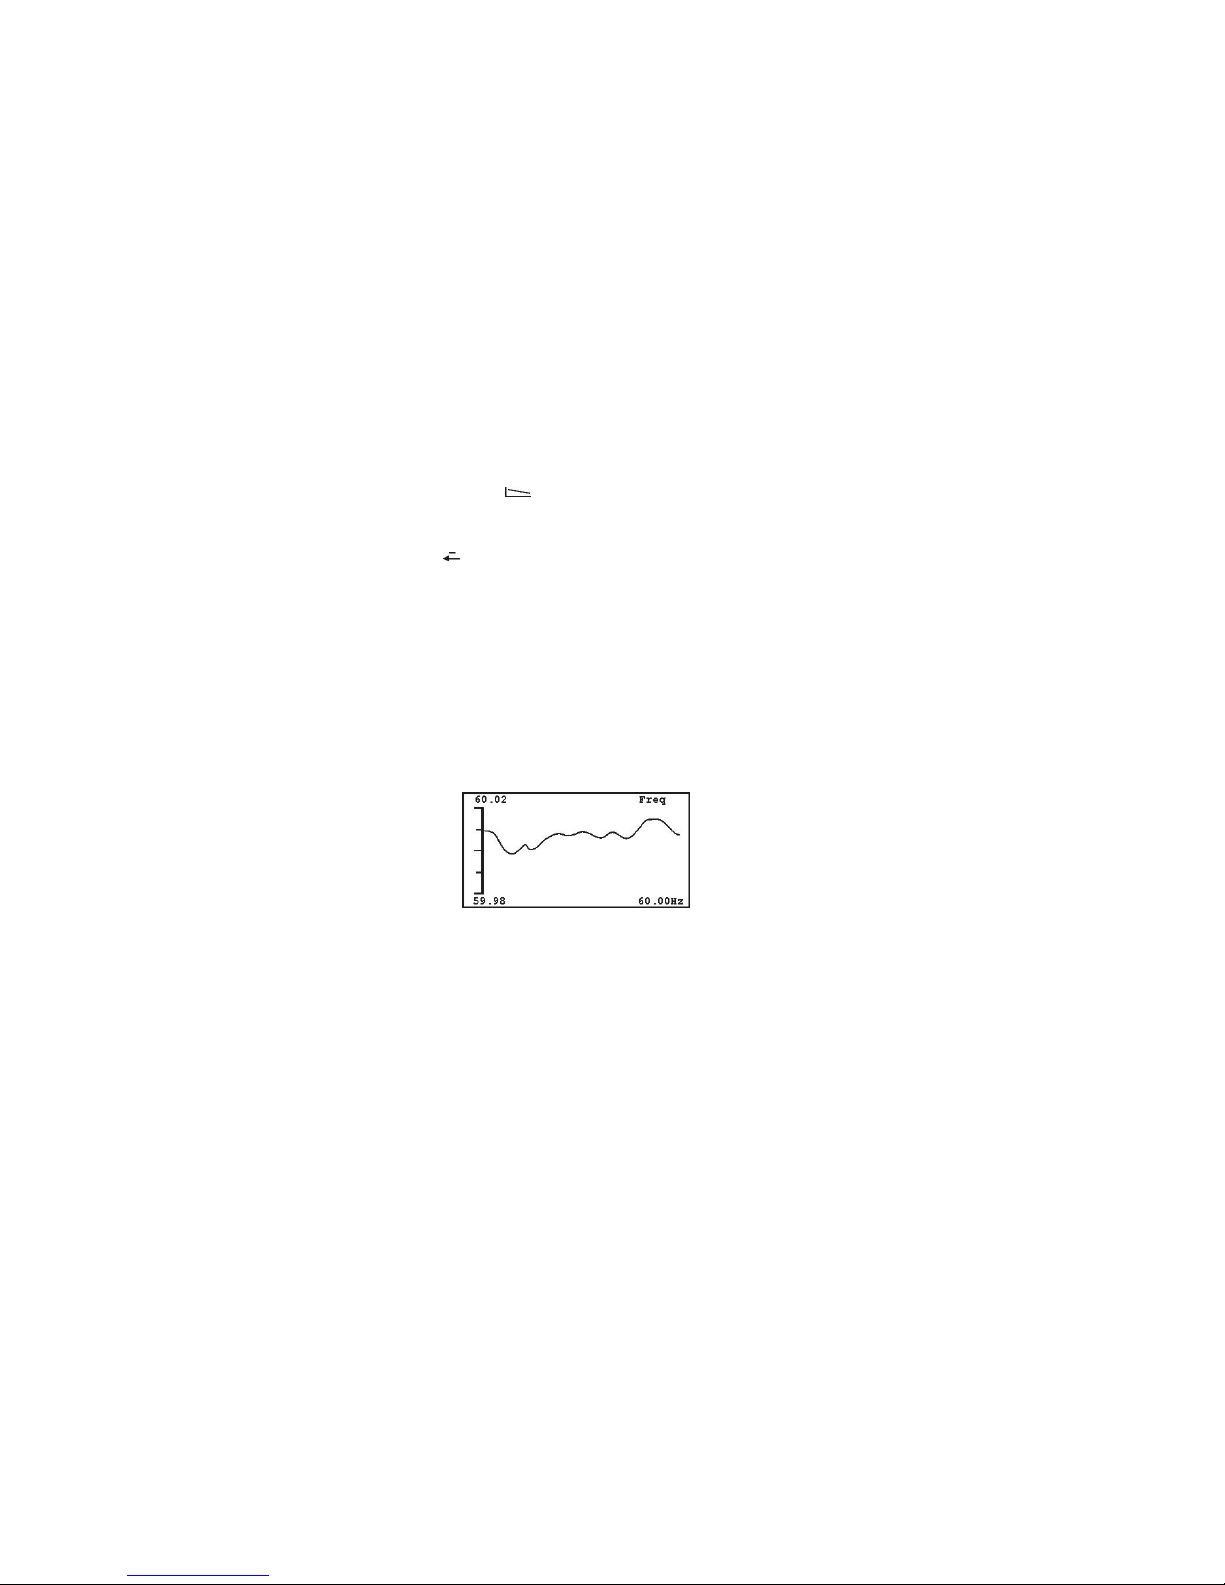
Use the Integration function to view a plot of the selected signal over time. Signals include voltage, current, frequency, phase and power factor. Configure the
signal sampling interval from 1 to 65535 seconds. The
vertical range scales according to the upper and lower
limits that you configure.
Press 2nd > AXIS to scale the plotted values to
the desired viewing range. This includes the upper
and lower limits, the last measured value, a vertical
graticule and the units of the measured signal. See
next page for setup details.
Procedure
1. Press 2nd > to plot and view the configured
signal.
2. Press and hold for three seconds to restart the
plot.
Example
In the example below, the plotted signal (i.e. Source)
is frequency, the upper and lower limits (Axis Max
and Axis Min) are 60.020 and 59.980 Hz, and the last
measured value is 60.00 Hz. Since the Graph Type
chosen is Scroll, previously plotted data moves left.
60
Page 75
AXIS Key
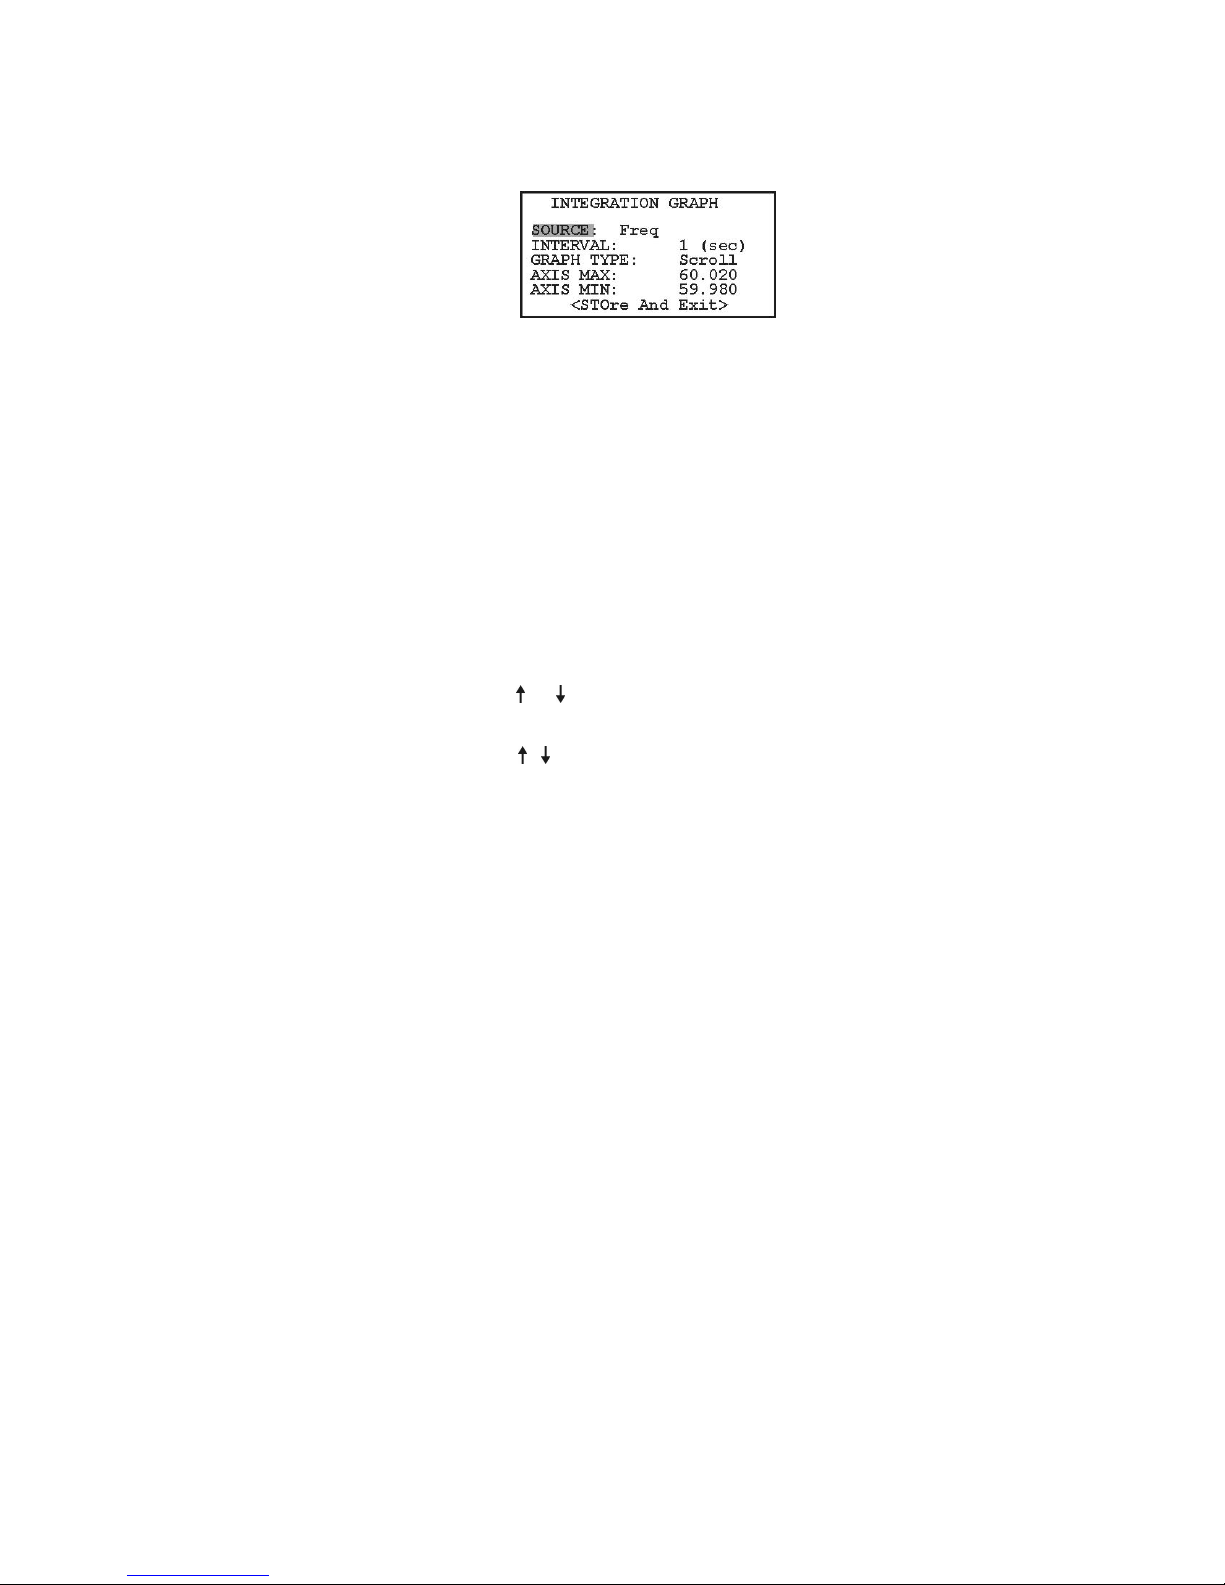
Use the AXIS key to configure how the Integration
function plots the signal source. There are five categories to set up in this menu.
Graph Definitions
Source Chan-A, Chan-B, freq, phase, PF
Actpwr
Interval From 1 to 65535, in seconds
Graph Type Scroll or Fixed
Axis Max Maximum plotted value on display
Axis Min Minimum plotted value on display
Procedure
1. Press 2nd > AXIS to open the Integration Key
configuration screen.
2. Press or to locate the desired field and ENT
to enter the variable field.
3. Press , or number keypad to change the required values(s) and press ENT to store value.
4. Finally, highlight <STOre And Exit> with the
cursor and press ENT to save any changes and
exit this menu.
5. Press ESC at any time to quit the menu function.
61
Page 76
LOG Key
Purpose
Use the LOG key to automatically record basic electrical data to the 928A flash memory over a specified time
interval. This function, also called AUTOLOG, makes
it convenient to record measured electrical quantities
while the equipment is unattended.
Logging Features
Basic Data only (see list at end of section).
Logging interval in seconds
Stores up to 6592 records, maximum
Viewing Autolog Information
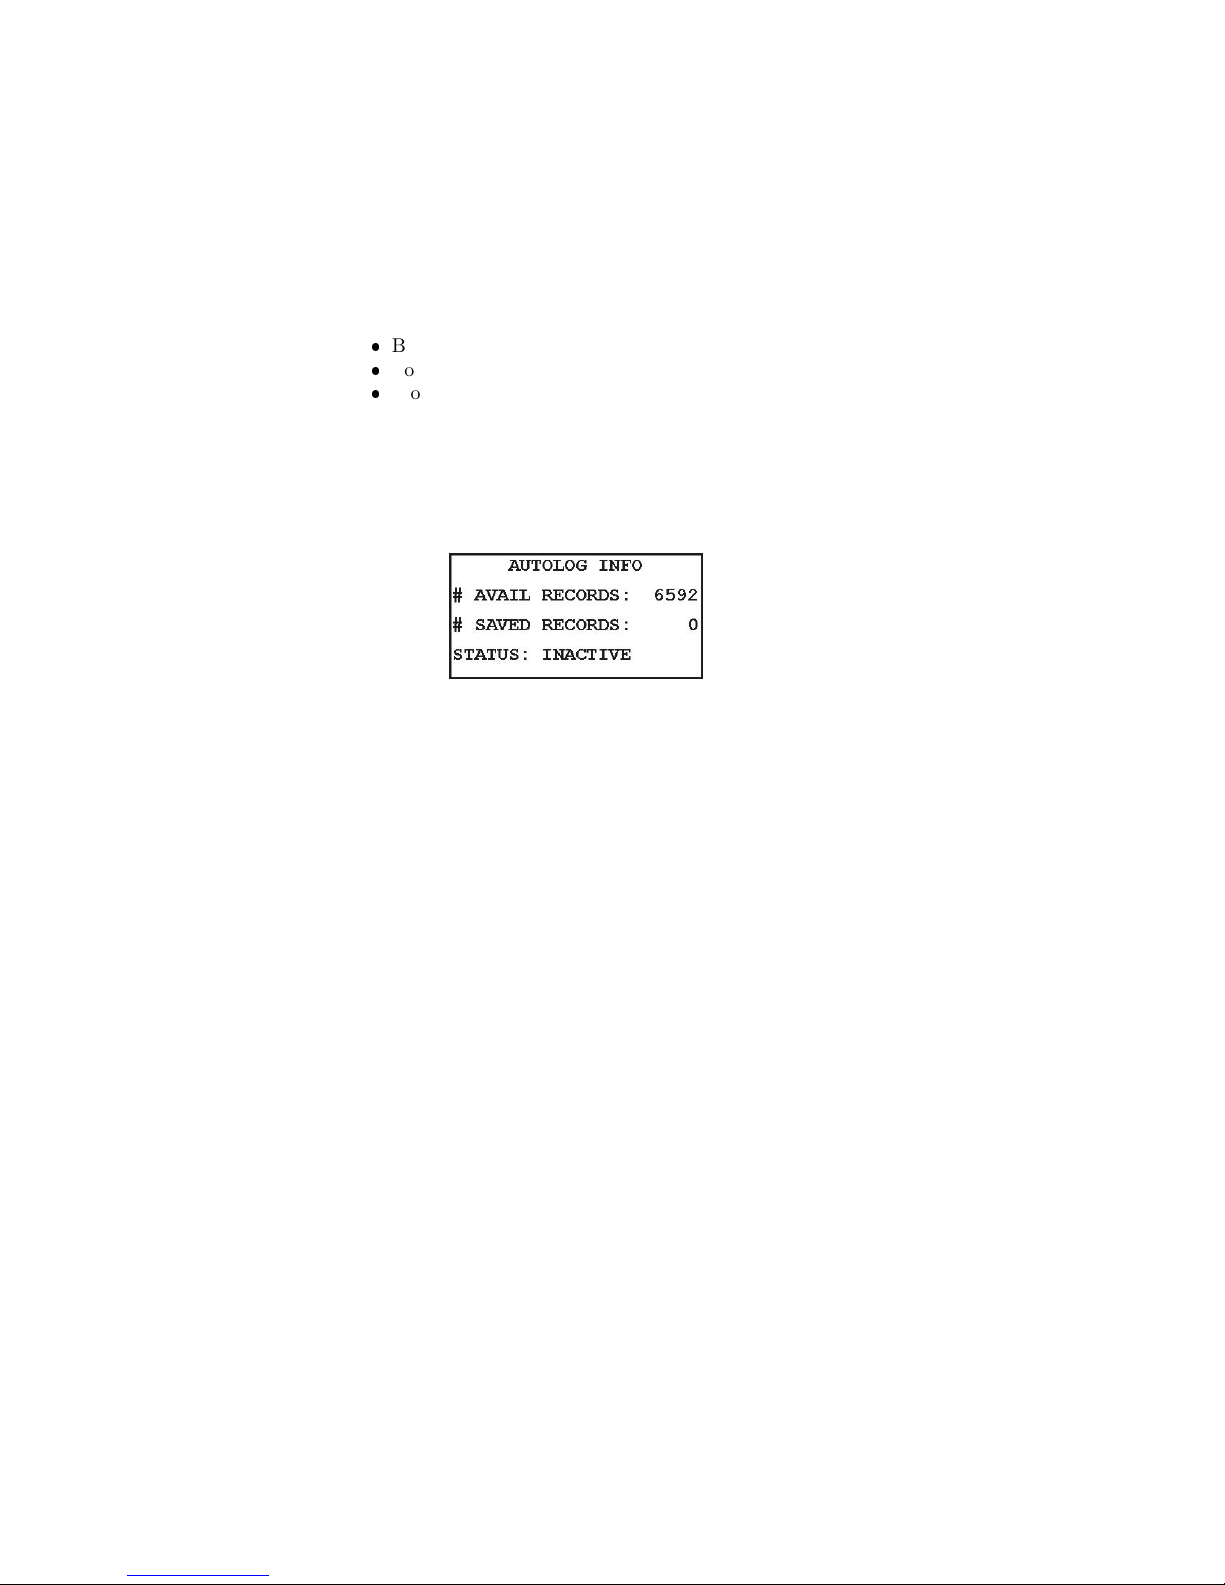
To view Autolog information, press 2nd > LOG, and
the screen will display some basic information about
the data logging features.
In order to operate, the Autolog function needs
start and stop times and dates and a logging interval in
seconds. Set up these features while in the AUTOLOG
INFO menu by pressing 2nd > MENU.
Viewing Autolog Data
Use Mlink software (see page 80) to download Autolog
records to computer and view in spreadsheet format.
They cannot be viewed on the 928A itself.
62
Page 77
Autolog Setup
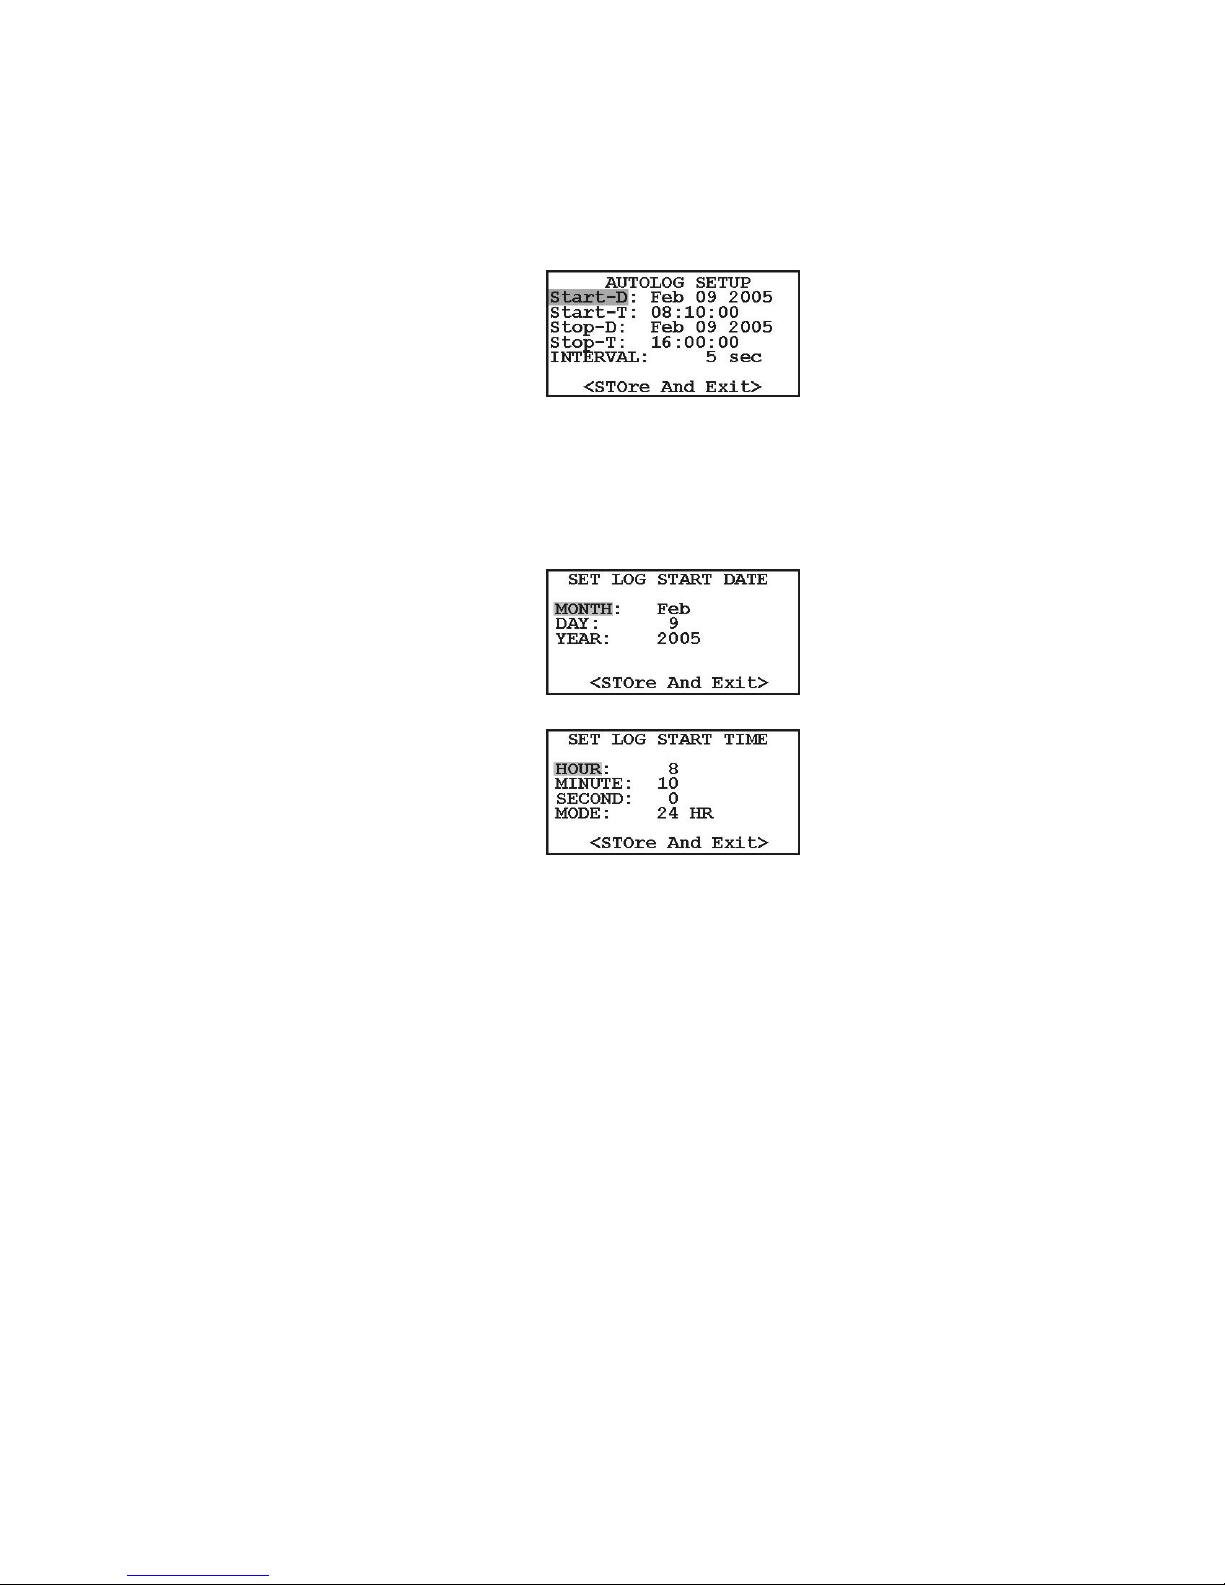
Always make sure to verify the time a date in the 928A
before using the Autolog feature. See pages 20 and 21.
1. From the Autolog Info screen, press 2nd >
MENU. The Autolog Setup screen should ap-
pear.
2. Use the arrow keys to locate the field you wish
to alter, and press ENT to open the field value.
Both screens below show the start date and time.
Stop date and time screens are very similar. Be
sure to configure them both.
3. Adjustment procedure: Use the arrow keys to lo-
cate the desired field value and press ENT to
63
Page 78

enter the value. Use the numeric keypad, or ,
to enter the desired parameters and press ENT
to store.
4. When you have finished adjusting any parameters, always move the cursor to <STOre And
Exit> and press ENT.
5. When finished adjusting the 928A clock features,
or to quit for any reason, press ESC to leave the
Autolog setup.
Autolog Time Mode
The Autolog Time Mode is set when you set up the
Time features. See Time Adjustment. Note: check
the 928A Time and Date for accuracy prior to starting
the Autologging. To adjust time and date, see pages 20
and 21.
Basic Data List
Channel A magnitude
Channel B magnitude
Power Factor
Q
VA
VAR
Watt
Relative Phase (B to A)
Frequency
Frequency Deviation
Frequency Rate
Channel A Flicker
Channel B Flicker
64
Page 79
Mlink Software
Tutorial
Introduction
This tutorial was written to assist you in using Mlink,
application software written specifically for the Model
928A. Mlink application software provides you with
the following functions:
Uploading CT Profiles*
Configuring Power Quality Triggers
Downloading Data Records
Configuring Custom User Screens
Uploading New 928A Firmware
* CT Profiles are current probe characterization
files stored in the Model 928A that improve their accuracy.
Page 80

Download Mlink
Download the latest version of Mlink at the following
link, or if necessary contact Arbiter Systems at the
information listed on page ii.
http://arbiter.com/support/downloads/software
-updates.php and select Mlink (928).
Installing USB Driver
Before using Mlink, you will need to load USB/Virtual
COM Port drivers on your pc. USB drivers for Windows XP are available at the link above. Windows
Vista is able to locate these drivers online when installing Mlink software.
After you have acquired the drivers, you should
load them on your system.
Install FT DI Driver on Windows XP
1. Unzip the downloaded file to a directory.
2. Connect the 928A to your computer via the included USB cable. Make sure that the 928A is
powered on.
3. Windows XPshould give you a “Found New
Hardware” message (small bubble message at
task bar). It may also open a window that indicates that it is searching for a driver.
4. At the conclusion, the Windows new driver installation window should allow you to choose a
driver. Pick from specific location and point to
the unzipped directory.
5. Click “Finish.”
6. A message should appear, “Found USB Serial
Port” (small bubble message at task bar).
66
Page 81

7. From specific location point to the sam e directory as above.
8. Click “Finish,” and it should be ready to use.
Linux Version
The Mlink Linux version is also available from Arbiter, however it will only connect with the 928A if the
drivers have been compiled in with the kernel. Some
Linux distributions may have these drivers available.
Drivers for Windows Vista
To install drivers on a Windows Vista machine, make
sure that the 928A is connected to your computer via
the USB cable and make sure your computer is connected to the Internet. The operating system should
go looking for the drivers and load them. This may
take some time so be patient. Check the Arbiter website link below for additional information.
Drivers for Windows 7
Mlink has been tested successfully using Windows 7
Pro in 64-bit mode. Check the Arbiter website link
below for additional information.
Software Link
http://www.arbiter.com
67
Page 82
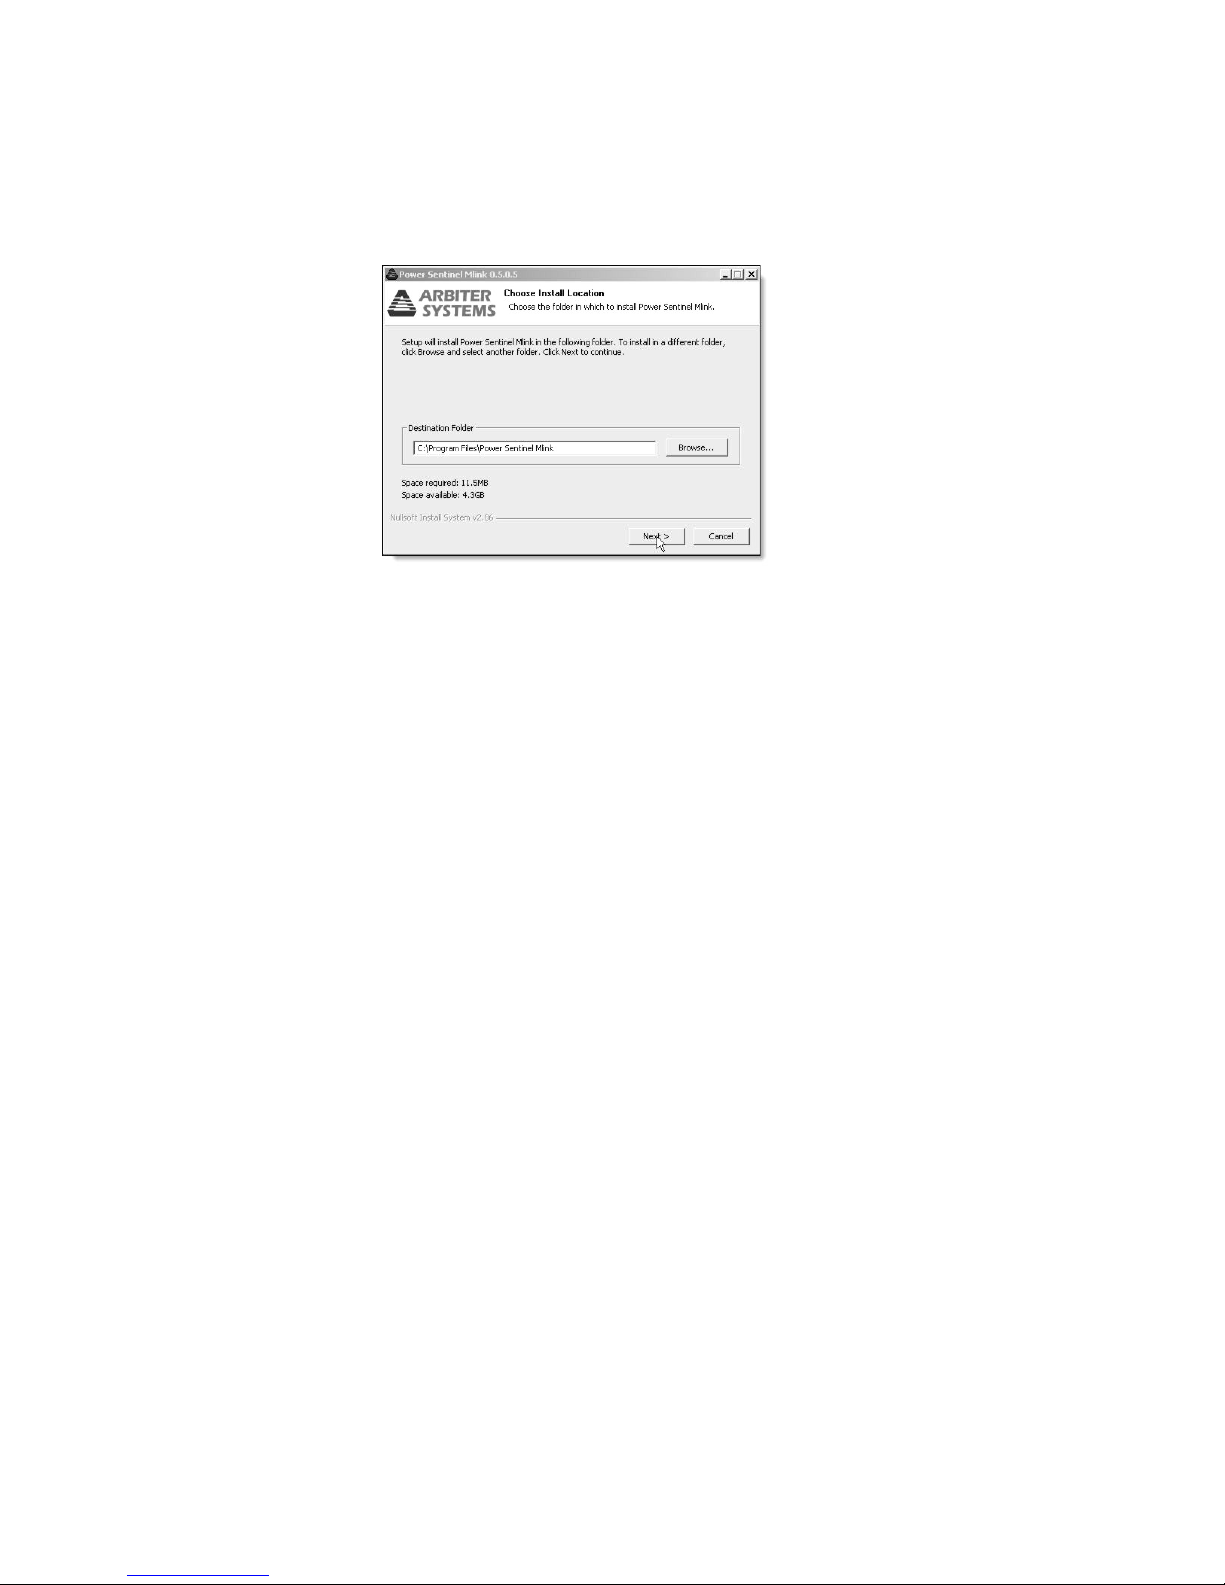
Installing Mlink
Load the Mlink installation file on your computer, and
either double-click on the file or select Start > Run
and browse to locate the Mlink self installation file.
Select the Mlink self-installing program and begin the
installation. See Figure 5.
Figure 5: Mlink Installation Screen
Connecting to the 928A
Prior to starting Mlink, make sure that:
1. The 928A is powered ON
2. The USB cable is connected between the pc and
the 928A.
Startup - USB Connection
When starting Mlink for the first time, you may be
greeted with the connection window shown in Figure 6,
and an opportunity to select a COM port. This selec-
68
Page 83
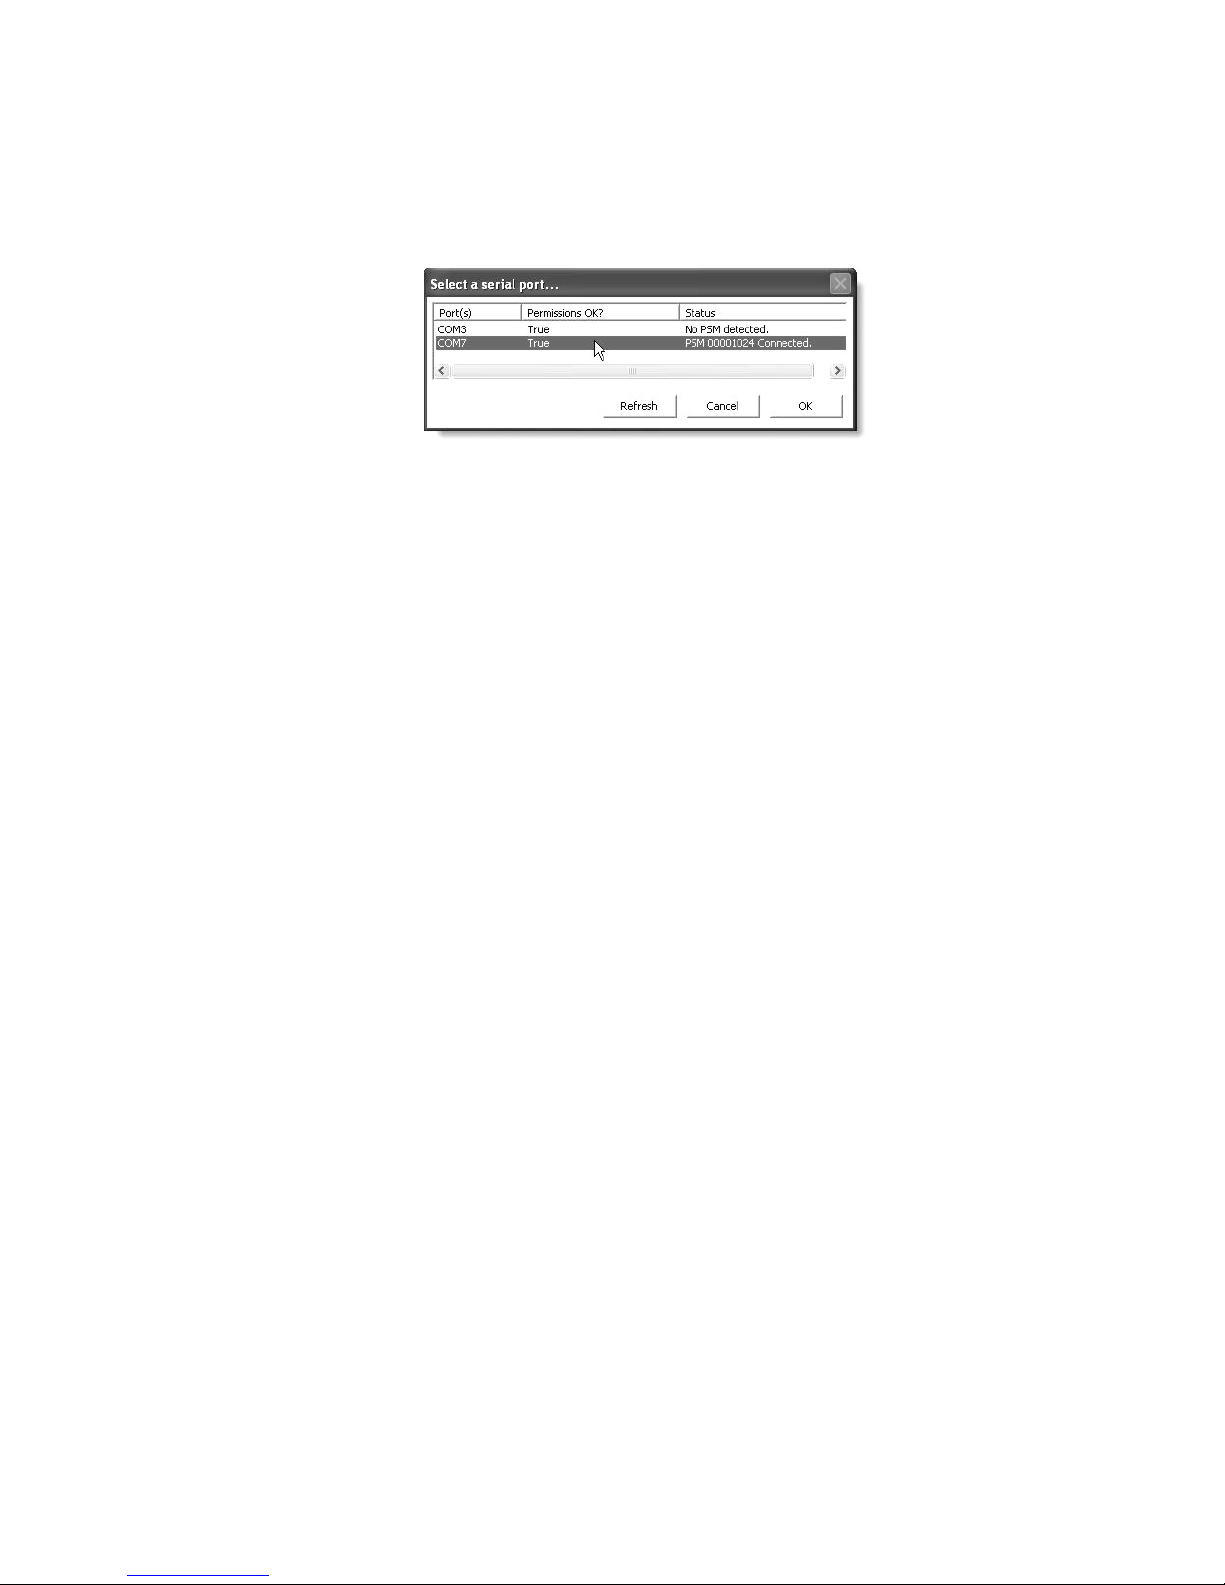
tion is necessary, even though it is a USB port, since
the 928A uses an RS-232-to-USB Bridge technology
to create a virtual COM port. Otherwise, you should
only see the Mlink main window (next page) with a
green connection light. Normally, after you have first
seen the connection window in Figure 6, you will not
see this window again.
Figure 6: Mlink Connection Window
Connecting
1. To connect, select the desired COM port number
and click the OK button. A short delay may
occur for the OK button to become available.
2. If the port number does not appear, click the
Refresh button; another port should appear (e.g.
COM3). It may take a few seconds to appear.
Then, repeat step 1.
3. Under the Status column, it should indicate if
the 928A (PSM) is detected or not. The unit serial number should appear - e.g. “PSM 00001109
Connected.”
NOTE: If you do not see the correct COM port
in the connection window, you may need to do
the following:
4. Close Mlink and power cycle the 928A.
69
Page 84
5. Restart Mlink and check for your COM port as
per steps 1 - 3 above.
6. If the previous step does not work, then you may
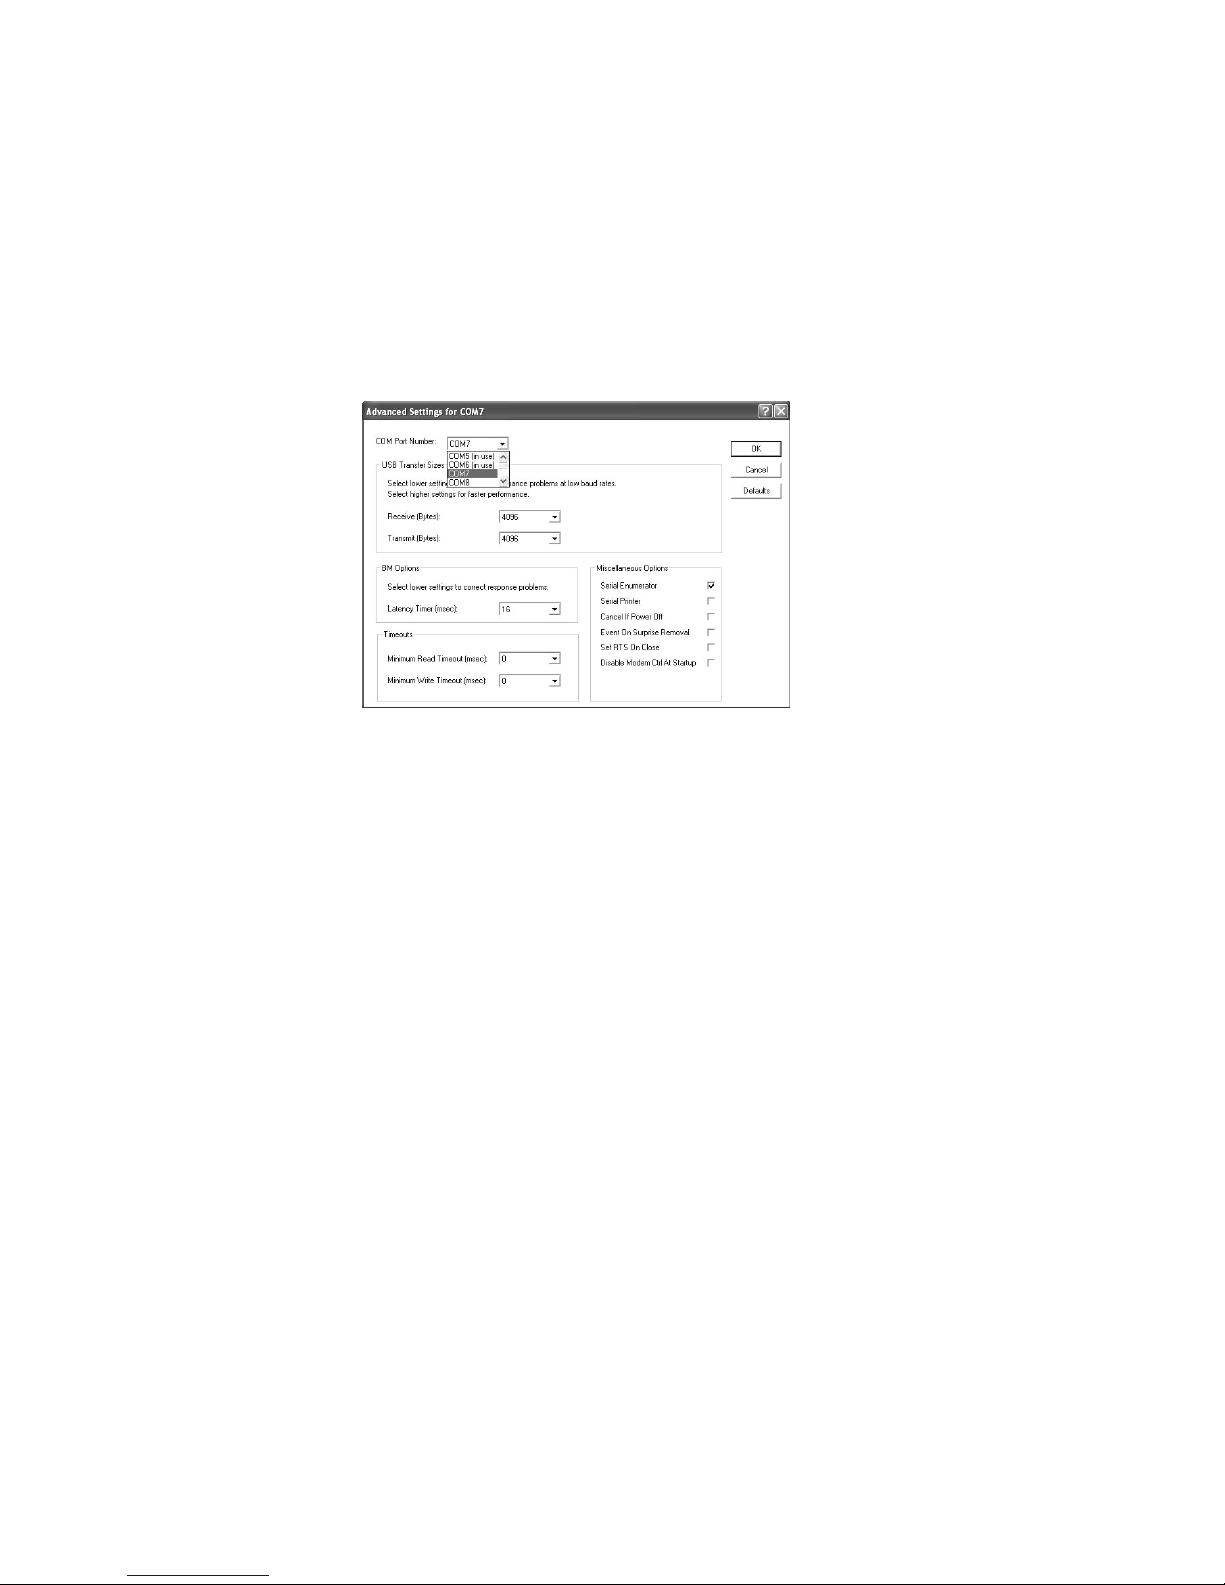
want to check which COM port Windows is using. Sometimes it will not work properly if it
assigns a port of COM 10 or higher.
7. To check this, you will need to go to My Computer > Manage > Device Manager > Ports
(COM & LPT) > USB Serial Port (COM X) >
(Right Click) > Properties > Port Settings (tab)
> Advanced (button) > COM Port Number >
select an available port up to 9. See Figure 7.
Figure 7: Windows XP COM Port Assignment
70
Page 85
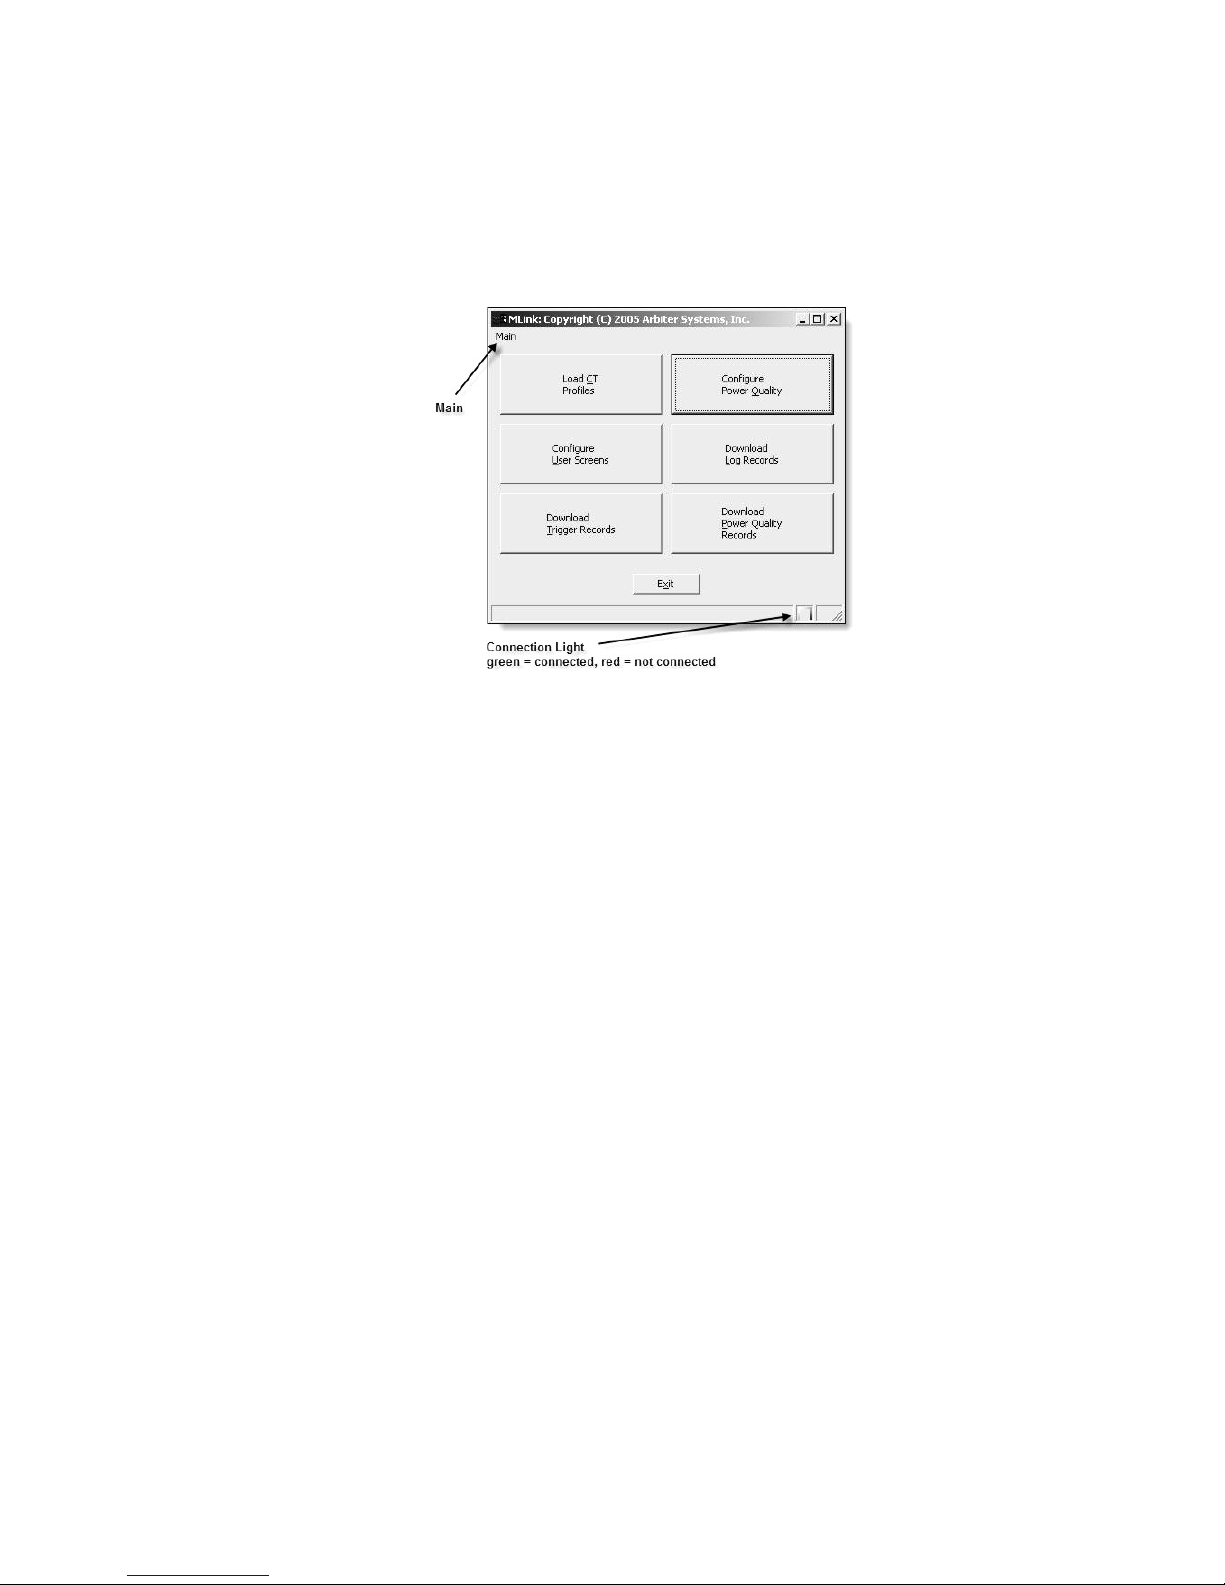
Mlink Main Window
Located on the main screen are six basic function buttons as indicated in Figure 8. There are also several
important functions found under one menu item called
“Main”. On the lower-right of the status bar there is a
connection light that strobes, notifying you of the connection status. When finished, close Mlink by clicking
the Exit button.
Figure 8: Mlink Main Window
Available Functions
From the Mlink main window, you have the following
functions: Load CT Profiles, Configure User Screens,
Download Trigger Records, Configure Power Quality,
Download Log Re cords and Download Power Quality
Records. Besides these, you can select the Main menu
to select select a port or upload new firmware.
71
Page 86
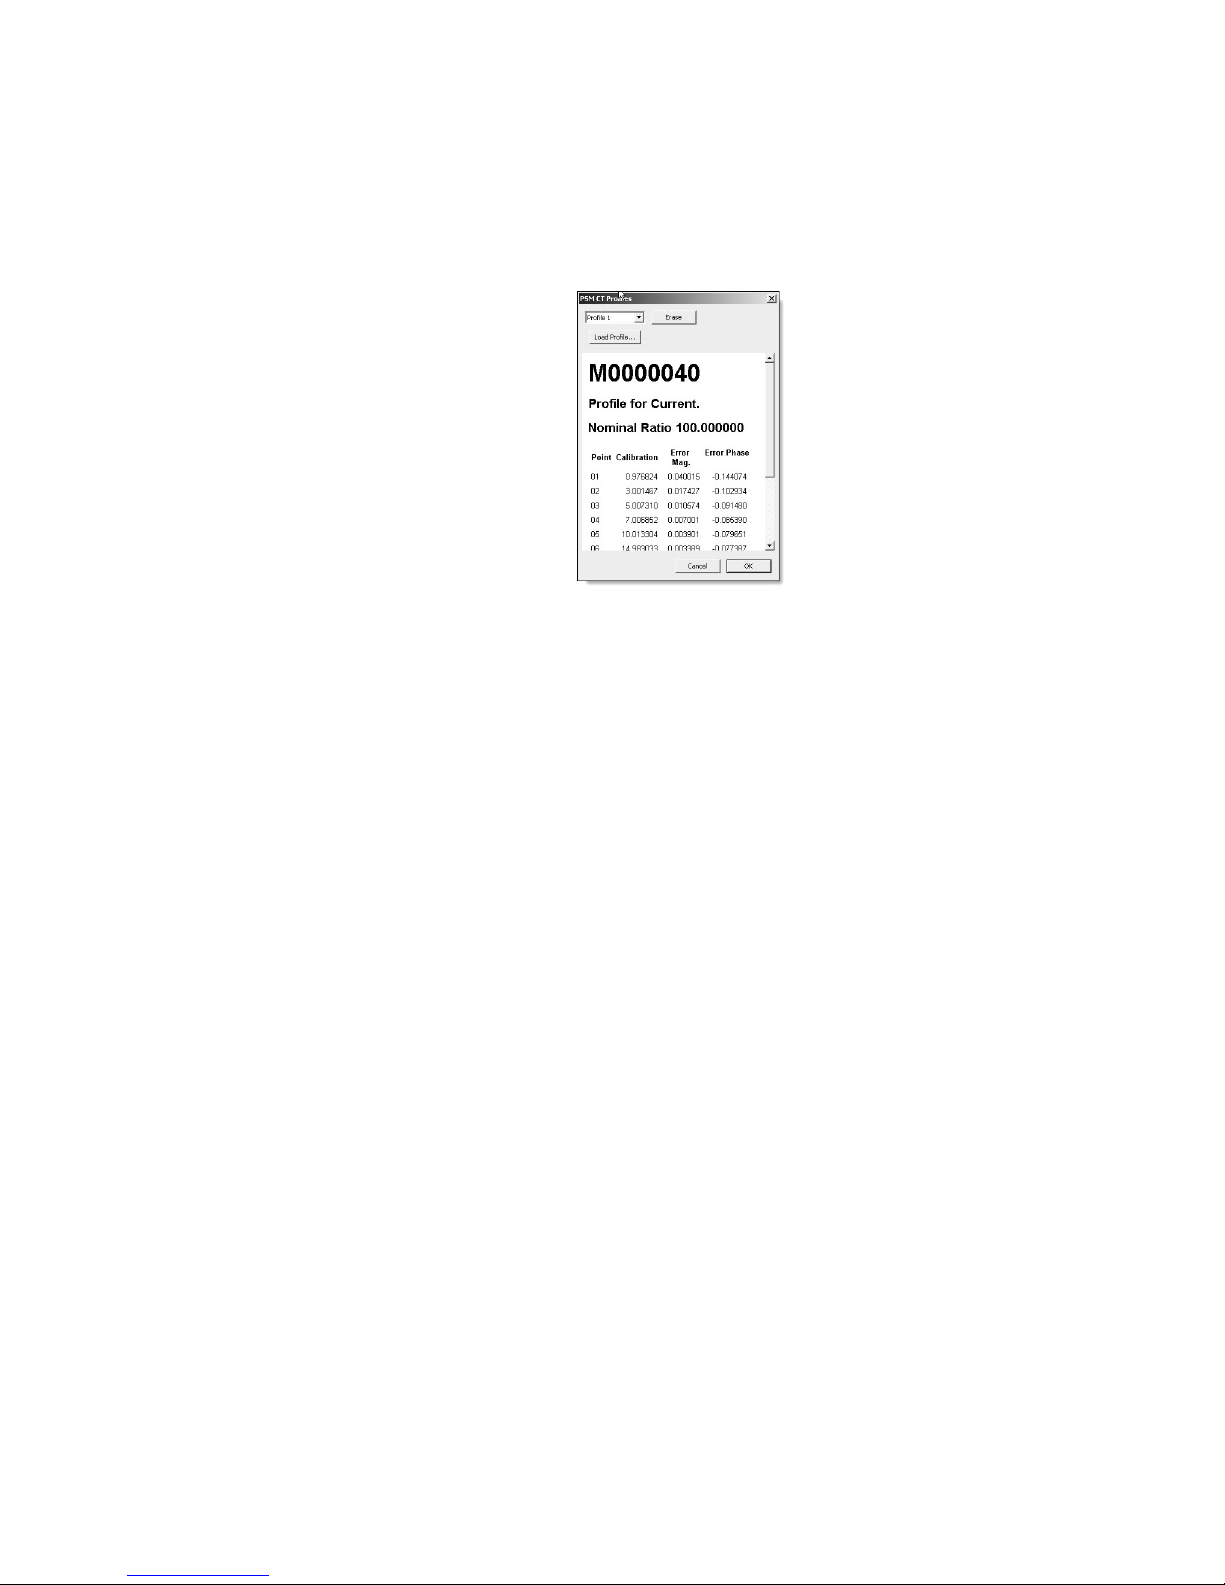
CT Profiles
Improve the accuracy of the 928A by installing CT
profile (CT Characterization File) for the specific CT
probes you use. In Mlink software, this characterization file is called a Profile. The 928A can store up
to 5 separate profiles for different probes or different
characterizations for the same probe.
Figure 9: Load CT
Profiles Window:
includes –
Probe Title,
Nominal Ratio,
12 Current Points,
Error Magnitudes,
Error Phases
To Install Profiles
1. Download CT profile from Arbiter website – go
to Service/Support > Downloads > Model 928A
CT Characterization Files. On CT Characterization page, type in entire CT serial number
after the M.
2. Power on the 928A and connect the USB cable
between the 928A and the computer.
3. Start Mlink and check for a green connection
light! If red, go back to “Startup - USB Connection.”
4. From the main screen, click the “Load CT Profiles” button.
72
Page 87

5. Select the Profile number that you wish to install e.g. Profile 1 (this includes any of the five
filenames).
6. Click the Load Profiles button to browse for the
CT profile file for uploading. Select the file and
click OPEN. Profile data should immediately appear in the Load CT Profiles window.
7. Click OK to close the Upload CT Profile window.
To Erase Profiles
1. Select one profile number you wish to erase - e.g.
Profile 1, . . . , Profile 5 and click the Erase button. The profile data will be erased and replaced
with zeros.
2. Click OK close the CT Profile window.
NOTE: To apply profiles in the 928A, see “Current
Ch-AI” on page 25.
Configure User Screens
Two user screens are available for you to customize the
928A display. See page 14. Once configured you can
toggle between the two screens by pressing 2nd > f1
successively. If your requirements change, you can run
Mlink again to change the order or type of functions
listed in the 928A User Screens.
1. Power on the 928A and connect the USB cable
between the 928A and the computer.
2. Start Mlink and check for a green connection
light! If red, go back to “Startup - USB Connection.”
73
Page 88
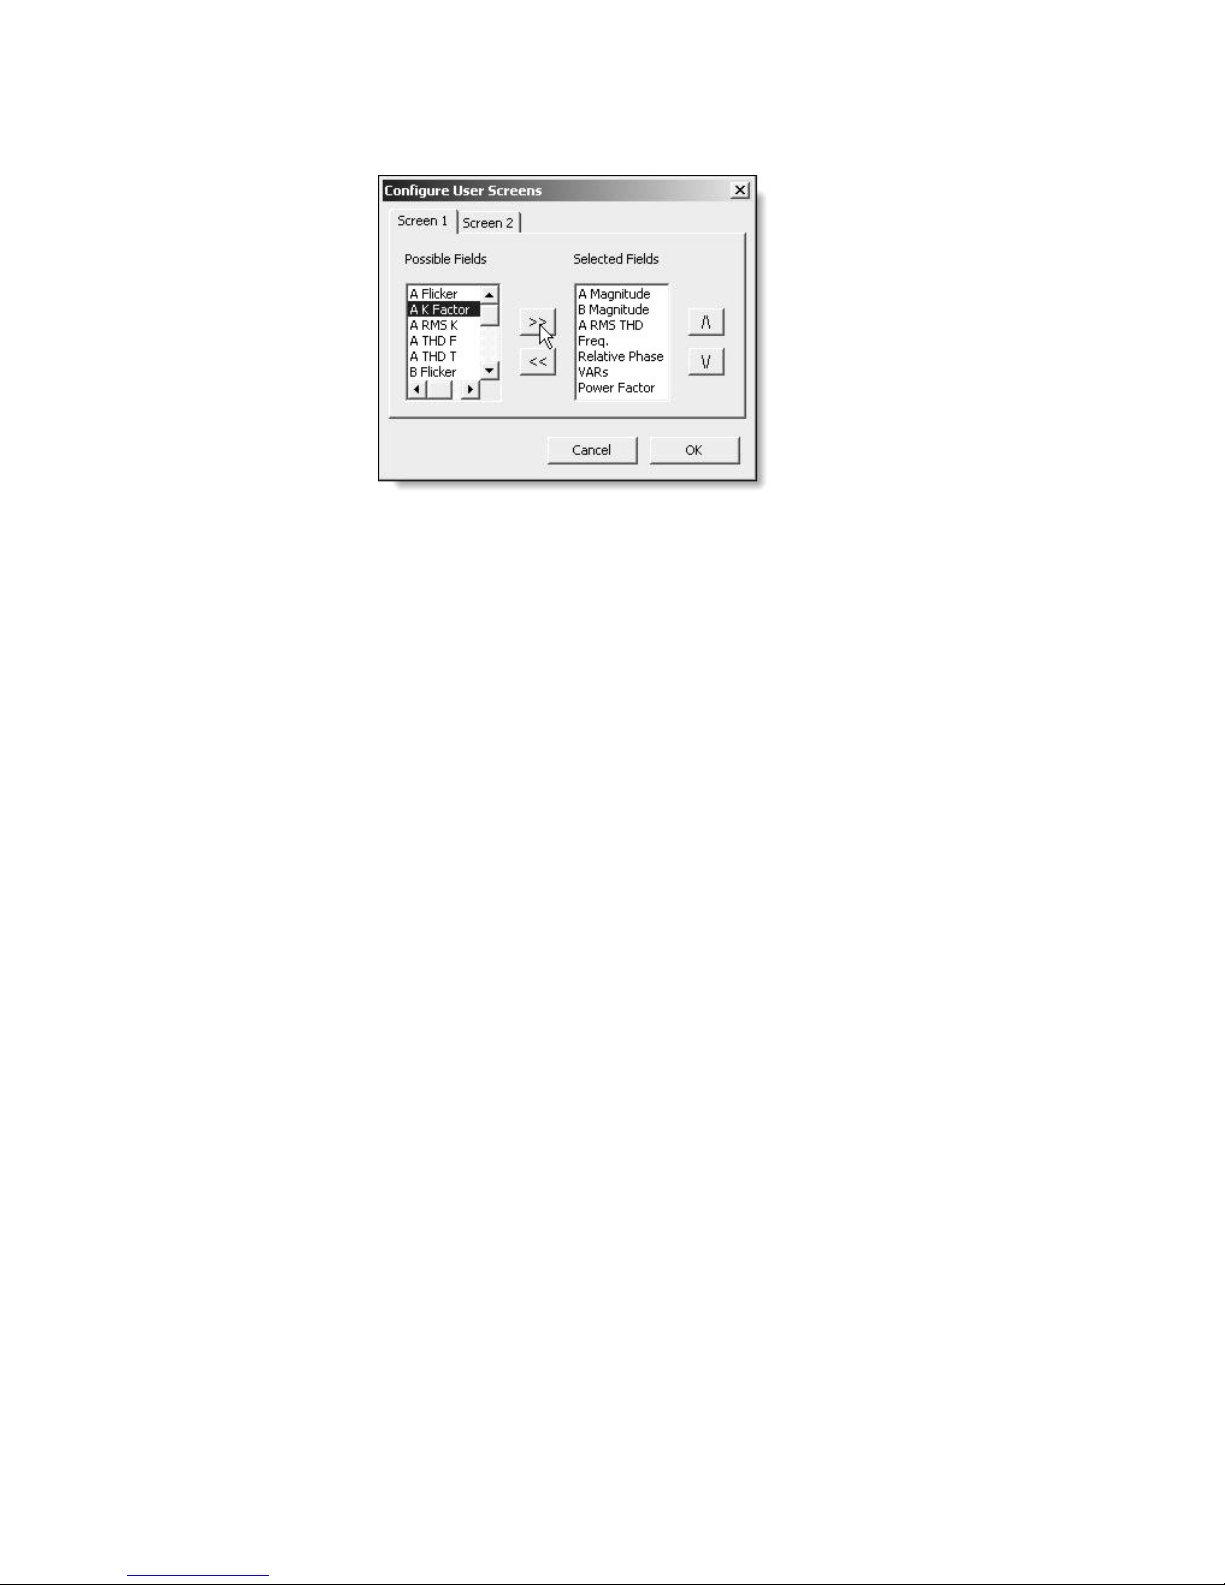
3. Click the “Configure User Screens” button.
4. To add new fields, select the desired fields in the
Possible Fields box and click the right arrows.
Figure 10: Configure User Screens Window
NOTE: Each user screen allows a maximum of
seven items - the maximum number of lines on
the 928A display.
5. To remove fields, select the desired fields in the
Selected Fields box and click the left arrow.
6. To change the order in the Selected Fields window, select the desired field in the Selected Fields
box and click either the Up or Down arrow to
change the order.
7. Click OK to close the Configure window.
74
Page 89
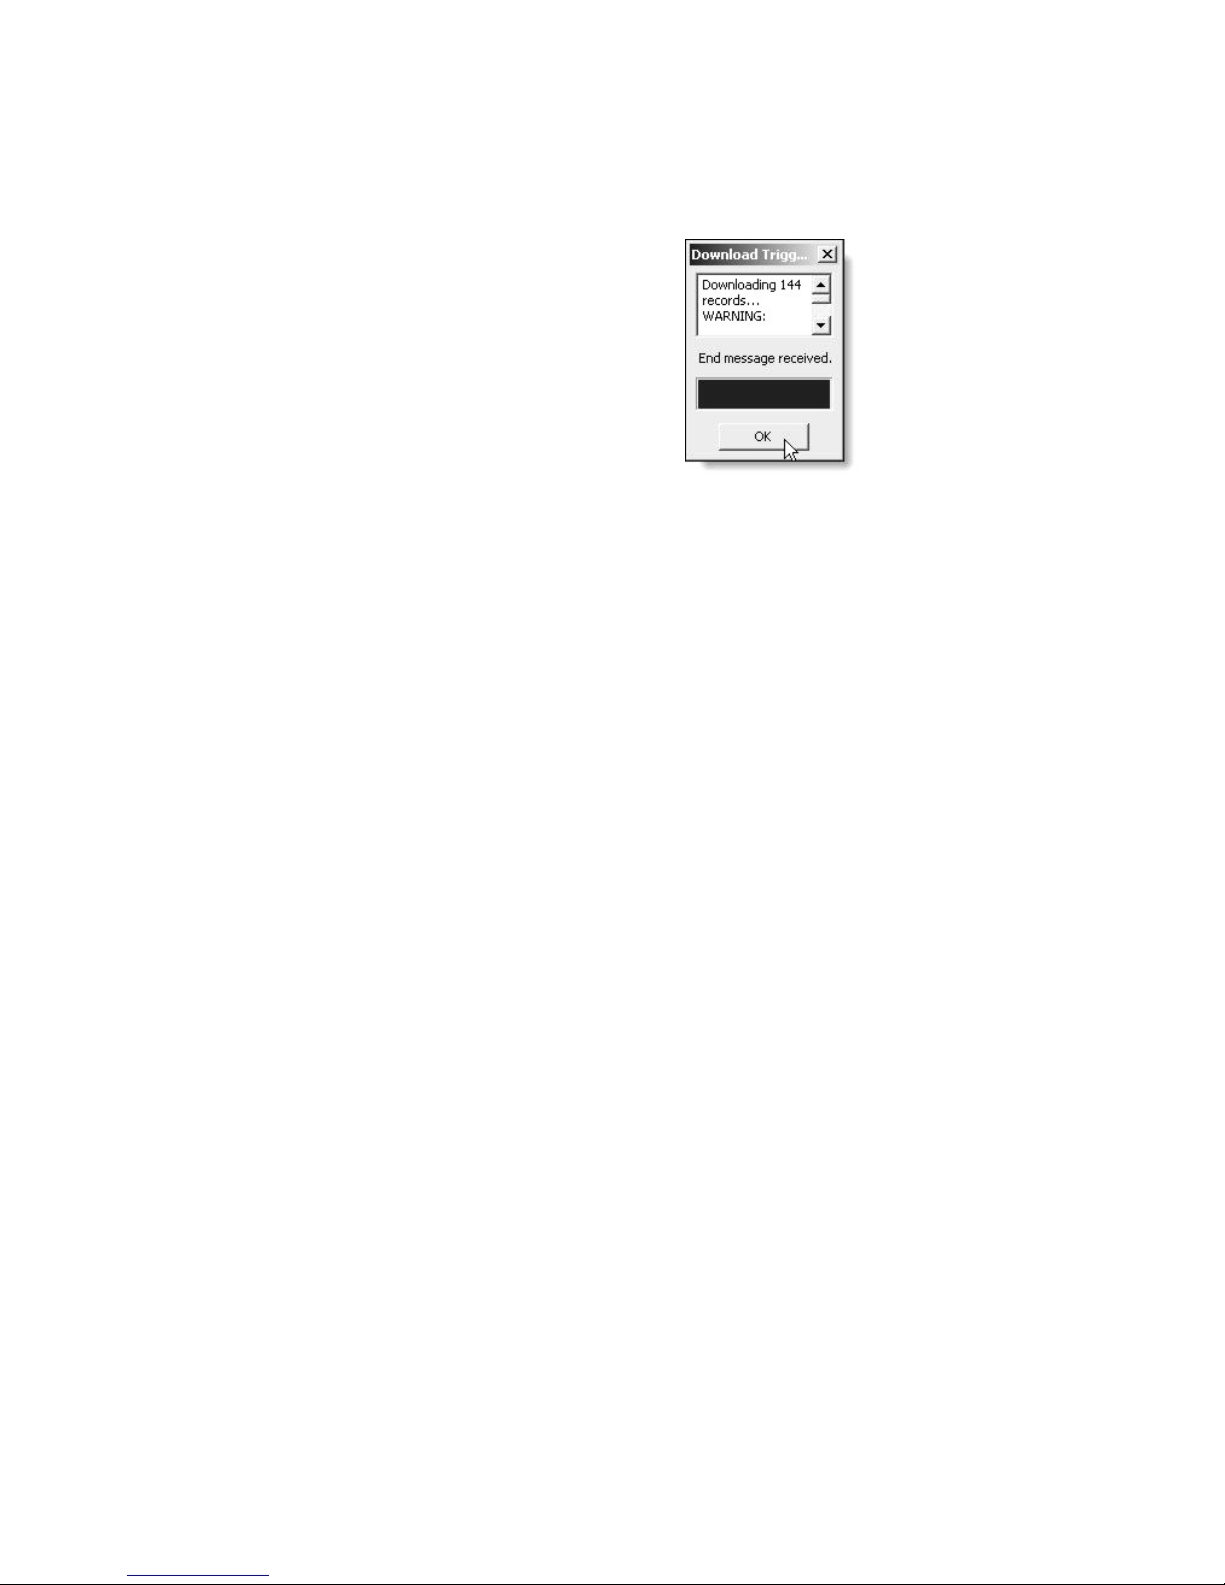
Download Trigger Records
The 928A allows you to quickly move event-triggered
records to your pc using Mlink. Triggers must first
be defined and activated in the 928A - see “TRIG –
Working with Triggers” on page 54.
Figure 11: Download
Triggers Window
1. Power on the 928A and connect the USB cable
between the 928A and the computer.
2. Start Mlink and check for a green connection
light! If red, go back to “Startup - USB Connection.”
3. Click the “Download Trigger Records” button.
4. If the 928A has Trigger Records to download, a
Save Log As window should appear with supplied
filename for the data. Click the Save button, or
type in another filename and click Save.
5. A Download records window should display the
progress or will say, Nothing to Download.
6. Wait for the download to finish and click OK to
close the Download Triggers window.
75
Page 90
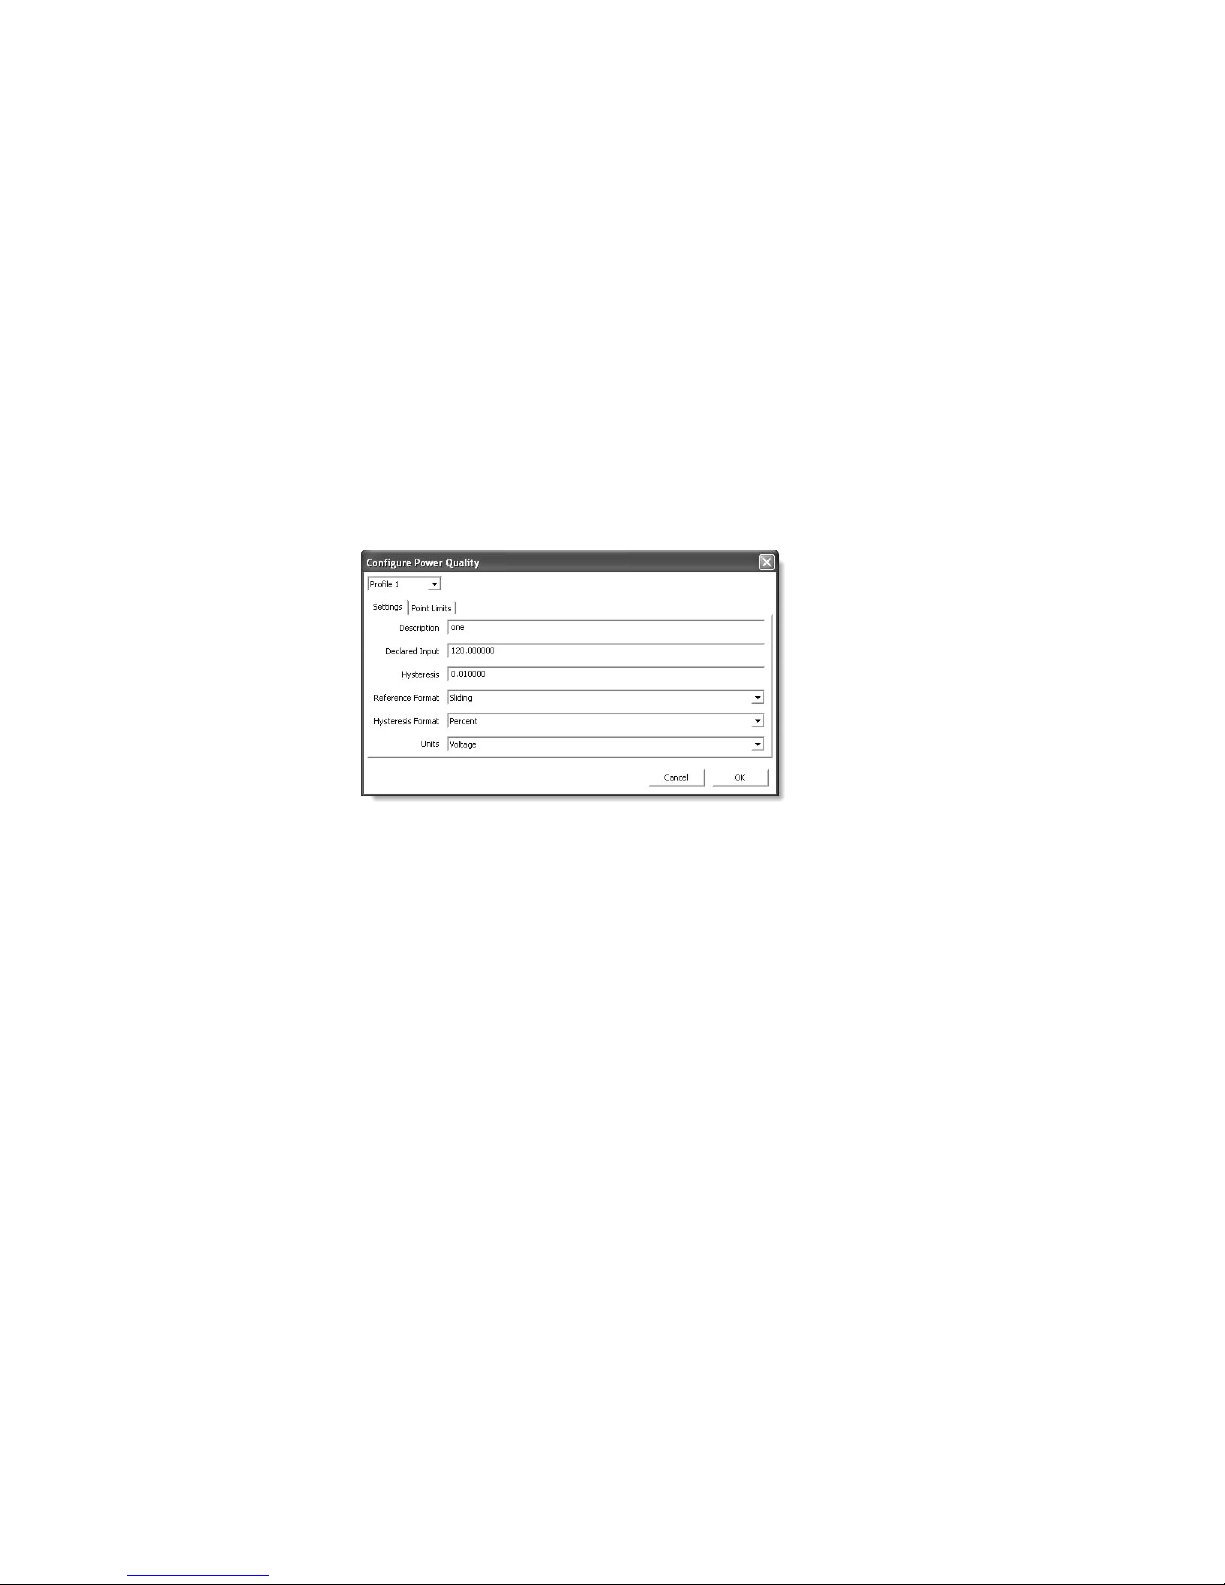
Configure Power Quality
Use this section to assist you in configuring the 928A
to detect sags and swells by using Point Limits similar
to a CBEMA method. Make sure to review the section
entitled “Power Quality – Sags and Swells” on page 48.
Figure 4 illustrates how progress ive limits over specified time intervals can be applied to detecting sags and
swells.
There are two separate setup screens in Mlink for
configuring Power Quality triggering in the 928A: the
first screen is tabbed “Settings” and the second is
tabbed “Point Limits”. These are depicted in Figures 12 and 13.
The Settings screen sets up some basic things about
the measured signal and how the point limits are compared to it. Check through the values listed in the
screen shot illustrated in Figure 12 and compare them
with the definitions on the following pages.
Figure 12: Power Quality Settings
76
Page 91

Power Quality Settings
1. Press ON to start the 928A and connect the USB
cable between the 928A and the computer.
2. Start Mlink and check for a green connection
light! If red, go back to “Startup - USB Connection.”
3. Click the “Configure Power Quality” button and
check to see if the Settings tab is on top.
Settings Definitions
Profile: Select the Profile number (1 – 5) in the
drop-down window at the top, and type in a profile
name for “Description.”
Declared Input: This is the same as the nominal
value being measured. For example, 120 (i.e. Vrms).
It is also used as the initial condition for a sliding
reference.
Hysteresis: Select a value (for Units, Voltage or
Current) that represents the allowable Hysteresis
(e.g. 5.000000 in Figure 12).
Reference Format: Select either Absolute or
Sliding. Choose “Absolute” if you want the Limit to
be fixed (for Limit Format as either absolute or
percent). Choose “Sliding” as the Reference Format
if choosing any the Limit Format as Percent and
want the Limit to change gradually. Sliding
Reference is defined with a 1-minute time constant.
Hysteresis Format: Select Absolute or Percent.
Units: Select the appropriate input signal, either
Voltage or Current.
77
Page 92

Configure Point Limits
Mlink allows you to set up ten point limits for each of
the five profiles. Point Limits allow you to setup different stages of triggering tailored to monitor voltage
(or current) sags and swells. Set up each point limit in
the same manner, and place them in any order. This
makes setting them up very flexible.
In the example below (Figure 13) there are three
separate point limits defined. All of the limit functions are X>Limit; two limit formats are absolute and
one is percent. The limits are defined in decreasing
voltages as 150, 140 and 120 with the first two fixed
limits and one as a sliding reference. Each point is
assigned a different dwell time: 1, 4 and 12 half-cycles
respectively.
Use a sliding reference, for example, to provide a
gradually changing limit to account for a line voltage
that changes slowly throughout the day. The sliding reference uses the method described in IEC-610004-30, paragraph 5.4.4, and should eliminate needless
triggers during normal operation. Hard limits could
be used for extreme voltage swings.
Point Limit Definitions
Point: denotes the number of the Point Limit (1 -
10). You can define up to 10 different points to
measure the selected value (e.g. voltage or current).
Limit Function: set to OFF, X < Limit, X > Limit.
Limit Format: set to Absolute or Percent.
Absolute refers to the the actual measured value (e.g.
X (voltage) > 130 Vrms). Percent refers to a percent
of the measured value (e.g. 105 percent of the
measured value, entered as 1.05).
78
Page 93
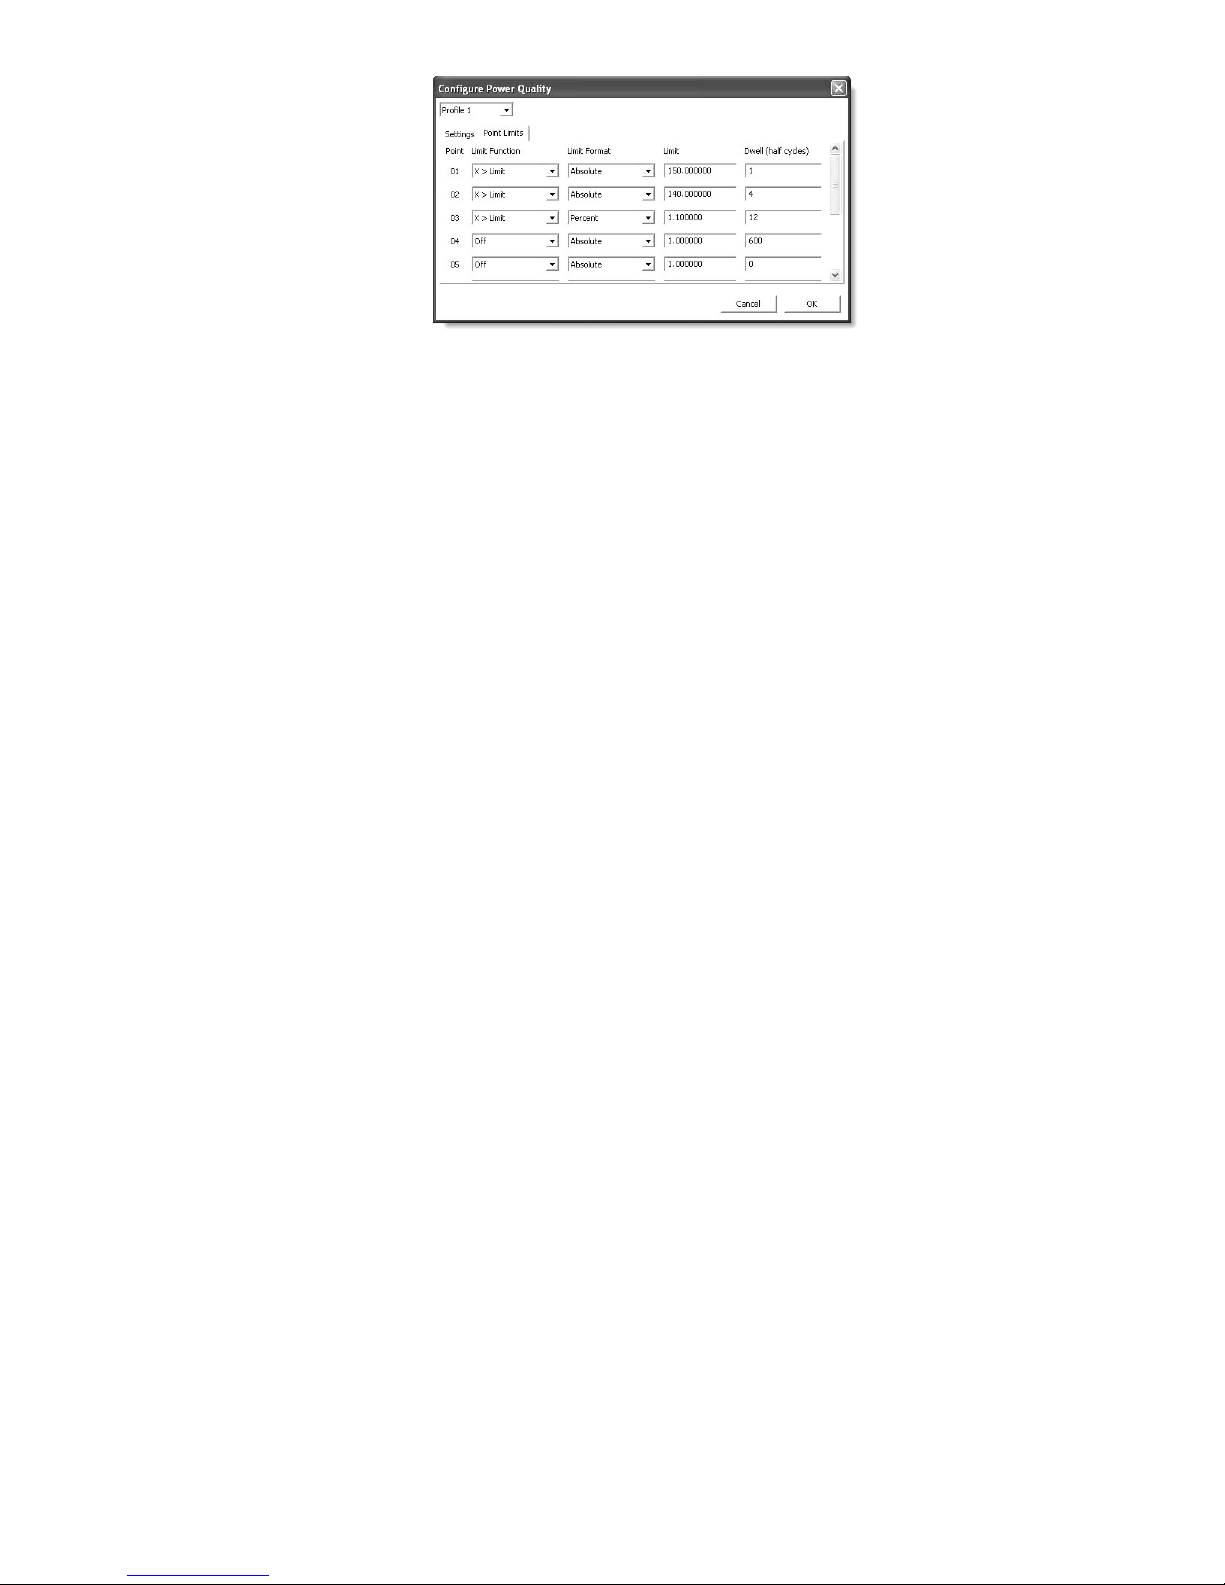
Figure 13: Power Quality Point Limits
Limit: sets the numerical value against which the
measured signal is compared: a floating point value.
For example, absolute: Limit = 132 volts; percent:
110% of 120 volts = 132, in the Point Limits screen,
1.1 × 120 = 132).
Dwell: during trigger condition, sets the number of
input signal half-cycles that must occur before
recording begins: an integer number.
Click OK to install PQ Profiles in the 928A, or Cancel
to quit without making any changes.
User Profile
One selection named USER is available with one Point
Limit that is only accessible from the 928A keypad.
See “Selecting PQ Profiles” on page 50, for information
on setting up the USER profile.
79
Page 94

OFF - Deactivate PQ Trigger
When not recording, select OFF for Channels A and
B PQ Config to deactivate the PQ Event Recording.
Otherwise, trigger records may fill up the available
flash memory module. See “PQ Event Storage and
Viewing” on page 53.
NOTE: The PQ function triggers on the RMS values of voltages and currents that exceed the specified
Point Limits. The RMS value must exceed the Limit
for the duration specified as Dwell.
Download Log Records
The 928A is designed to transfer AutoLogged records
(using the LOG key) to your pc. To configure Autologging see “LOG Key” on pages 62ff.
To transfer records from the 928A to the pc, you
will need to have some records already stored in the
928A flash memory module. Logging is based on start
and stop times and dates. In order to use this feature
effectively make sure to set the correct time and date.
See TIME and DATE on pages 20 and 21.
1. Power on the 928A and connect the USB cable
between the 928A and the computer.
2. Start Mlink and check for a green connection
light! If red, go back to “Startup - USB Connection.”
3. Click the Download Log Records button.
4. If you have records to download, a Save Log As
window should app e ar with supplied filename.
Click the Save button, or type in another filename and click Save.
80
Page 95

5. A Download records window should indicate the
number of records downloaded and say, “Download Complete,” or will say, “Nothing to Download” if there are no records to download.
6. Click OK to finish and close the Download
progress window.
Download Power Quality Records
Use this feature to transfer power quality records from
your 928A to your pc. Downloading is very much
the same as for Standard Log Records or for Trigger
Records, and requires that records be stored in the
928A flash memory module.
1. Power on the 928A and connect the USB cable
between the 928A and the computer.
2. Start Mlink and check for a green connection
light! If red, go back to “Startup - USB Connection.”
3. Click the Download Power Quality Records button.
4. If you have records to download, a SaveAs window should appear with supplied filename. Click
the Save button, or type in another filename and
click Save.
5. A Download records window should indicate the
number of records downloaded and say, “Download Complete,” or will say, “Nothing to Download” if there are no records to download.
6. Click OK to finish and close the Download
progress window.
NOTE: PQ records take more time to download, so
do not close the progress window if you do not see
81
Page 96
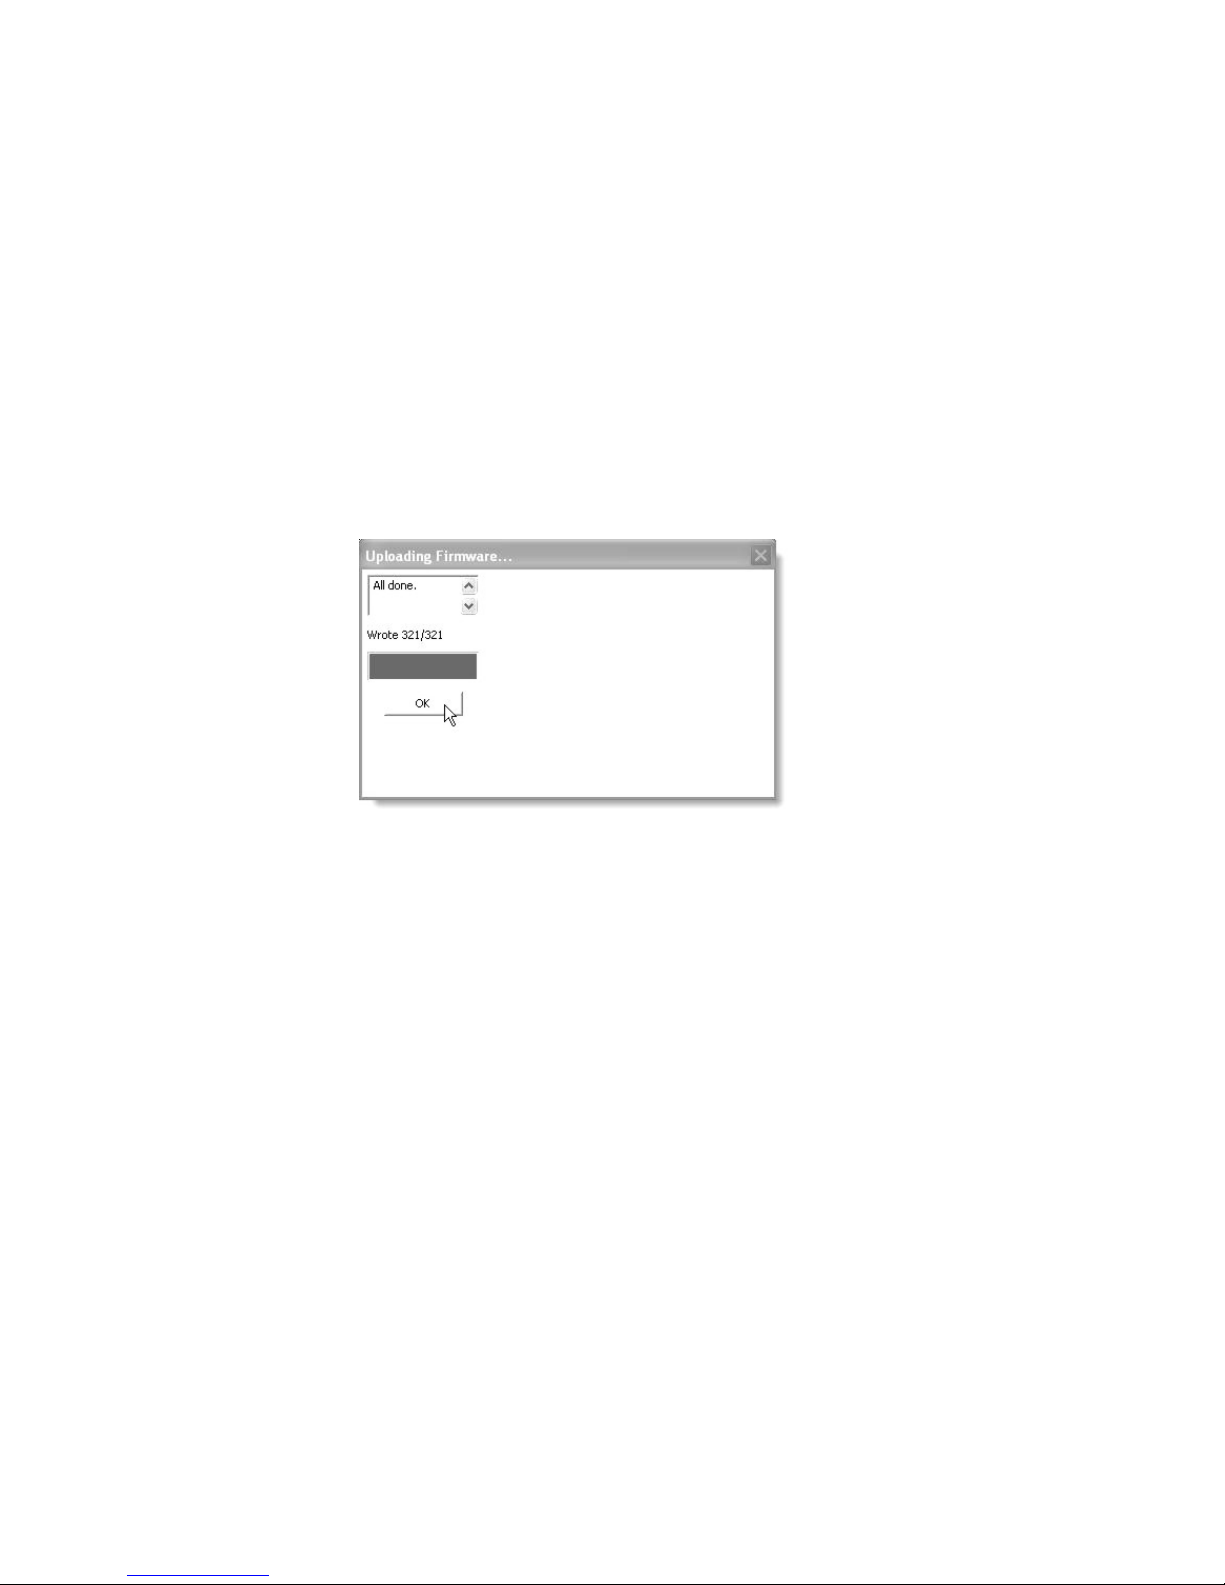
immediate progress.
Uploading New Firmware
Mlink provides a convenient method for uploading new
firmware to the 928A, and optimizing performance.
When new firmware versions become available, obtain
them from the Arbiter web site or by contacting Arbiter Systems technical support.
1. Start Mlink and select Main > Upload Firmware.
The firmware file is in a zipped format and Mlink
automatically unzips it.
2. Select the file and click OPEN and you should
see the progress as shown in Figure 14. The 928A
displays “FLASH PROGRAM IN PROGRESS”
during the installation. Click OK when finished.
Figure 14: Upload Firmware Window
82
Page 97

Functional
Description
Introduction
The Model 928A is a two-channel, AC power measurement instrument, providing 0.1% accuracy in a
handheld package. Besides voltage, current and power
quantities, it measures power quality, including harmonics, flicker, sags, surges and interruptions. Also,
it includes a graphical display, internal clock, approximately 400 KB of flash for data storage, and full-time
battery operation using common AA-size NiMH or Alkaline cells.
User Interface
The user interface consists of a 128 x 64 graphic LCD
with backlight, and 30-key silicone keypad. Also included is a USB serial interface for configuring and
data retrieval.
Page 98

Details
Input Sections
Two identical input channels (A and B) allow use rs
to connect to voltage sources (0 to 660 Vrms) and to
current sources (0 to 1.2 Arms or 0 to 1.2 Vrms), designed to work with a CT up to approximately 1000
A. To allow accurate measurements at low current levels (< 10 A) there will be a ×100 ‘booster’ amplifier
available to extend the input current range downwards
to about 10 – 100 mA (with a 1000:1 external CT) for
full accuracy and lower with somewhat reduced performance. Current Inputs are connected to the upper
connectors and allow for a voltage output or current
output CT. The current input section has a 1000:1 CT
giving an output current of 0 to 1 mA, which is then
converted to a voltage. The voltage input section uses
medium-power, low TC resistors that accept up to 660
Vrms with a 1 Vrms signal to the ADC.
The current input sections are able to accept either
1.2 Arms or 1.2 Vrms max input. This will accommodate either current or voltage output probes.
MUX and ADC
The ADC is a 24-bit Texas Instruments ADS1251
sigma delta converter running at 10240 samples-p ersecond. There are two multiplexers being used: a
74HC4053 and a 74HC4052. The ‘4053’ is being used
to switch between the voltage and current channel inputs, and the ‘4052’ switches the source for current
channels: either a current CT (maximum input 1.2
Arms), voltage CT (maximum input of 1.2 Vrms) or
gain of 20.
84
Page 99

DSP
The DSP is a Texas Instruments TMS320VC33-120
and runs from 1.8 to 3.3 V power supplies. The
TMS320 will perform all of the DSP and control
processing, reducing the parts count and power requirement.
Power Supplies
The 928A will operate from four-AA cells, which can
be either NiMH or Alkaline. Rechargeable batteries
may be recharged from a third-party NiMH recharger,
available at many consumer outlets. Also available is
accessory Kit power adapter AP0011200.
Accessories
Arbiter Systems recommends the use of the following
accessories for use with the Model 928A.
Current Measurement
Current Output CT Lead Set
CA0027100 (current output): This accessory current
lead set connects directly between a Model AP0009800
CT, or similar current output CT, and the Model 928A
current terminals using safety banana connectors. It
is constructed of high-quality silicone-insulated, finestranded wire for durability and safety.
Voltage Output CT Lead Set
CA0027200 (voltage output): This accessory current
lead set connects directly between a Model AP0012300
CT, or similar voltage-output CT, and the Model 928A
85
Page 100

using safety banana connectors. It is constructed of
high-quality silicone-insulated, fine-stranded wire for
durability and safety.
Standard CT
AP0012300, 100:1 clamp-on CT: 150 A, 10 mV/A;
standard banana connectors.
Optional CT
AP0001300 clamp-on CT (AEMC SR601) 1000:1, 1000
Arms, 660 Vrms, 1 mA/A; s hrouded banana connectors. Requires CT cable assembly, CA0027100.
Voltage Measurement
For voltage measurement, use the AP0009700 voltage
lead set. This lead set includes Arbiters professional
lead set material and voltage probe kit accessories for
connecting to a variety of circuit connections.
Soft Carrying Case
For carrying the Model 928A and some access ories,
choose the HD0065200. Made from rugged polyester,
it provides two compartments for clamp-on CT, lead
sets and manual.
USB Data Cable
Use CA0026106 USB cable when connecting the Model
928A to a computer. For configuring the Model 928A
or downloading data from the flash memory module,
use Mlink software.
86
 Loading...