

Page 1
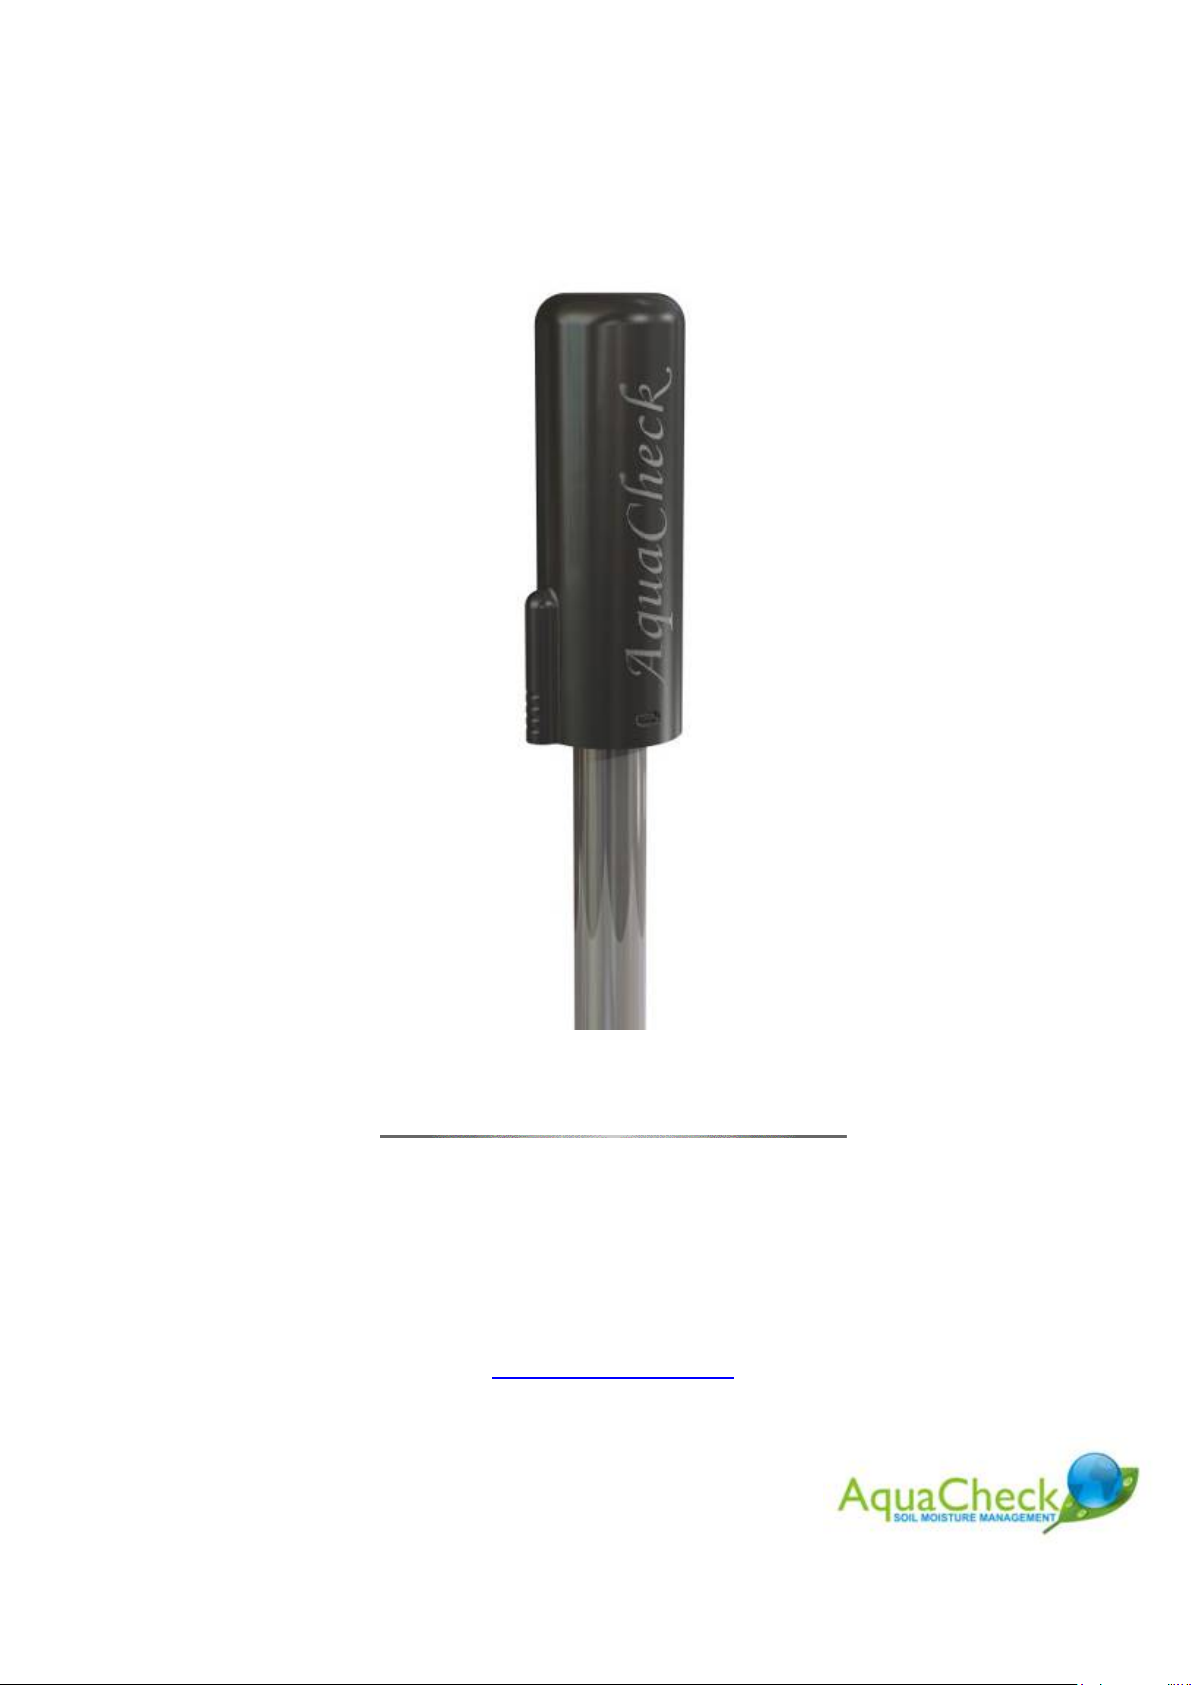
AquaCheck Probe (BIIW) & SOLO
Instruction Manual
AUG 2010
www.aquacheck.co.za
Page 2

2
AquaCheck (Pty) Ltd
All rights reserved
Neither whole nor any part of the information contained in this publication
may be reproduced, transcribed or translated in any form, written or electronic
for any purpose whatsoever without prior written consent of AquaCheck (Pty)
Ltd.
This publication is intended only to assist the reader in the use of the product.
AquaCheck (Pty) Ltd shall not be liable for any loss or damage arising from
the use of any information contained in this publication, or any error or
omission in such information, or any incorrect use of the product.
Version 1.1 AUG 2010.
Page 3

3
STATEMENT OF COMPLIANCY
ELECTRO-MAGNETIC COMPLIANCE
The BASIC II wireless probe, SOLO RTU, Analogue and MobiCheck versions of the
AquaCheck probe have been tested and found to comply with the limits for Class A
digital devices, pursuant to the requirements of the CE rules. These limits are
designed to provide reasonable protection against harmful interference in a
residential installation. This equipment generates, uses and can radiate radio
frequency energy and, if not installed and used in accordance with the instruction
manual, may cause interference to other radio communications.
Operation of the devices described in this manual also complies with part 15 of FCC
as well as IC compliancy rules and regulations and are therefore subject to the
following two conditions:
(1) these devices may not cause interference, and
(2) these devices must accept any interference, including interference that may
cause undesired operation of the device.
EMC APPROVALS
The BASIC, Analogue and MobiCheck versions of the AquaCheck probe have been
tested and found to comply with the following EMC guidelines:
IMMUNITY TESTING:
IEC 61000-6-1 and IEC 61000-6-2
Electrical Fast Transients (EFT) - IEC 61000-4-4
Electrostatic Discharge (ESD) - IEC 61000-4-2
Surges - IEC 61000-4-5
Radiated Susceptibility - IEC 801 –3
Voltage Dips and Interruptions - IEC 61000-4-11
Conducted Susceptibility - IEC 61000-4-6
EMISSIONS AND HARMONICS:
CISPR 11/14/15/22 IEC 61000-3-3 and IEC 61000-3-2
Radiated Emissions
Conducted Emissions
Flicker
Harmonics
Page 4

4
FCC & IC CONFORMITY ON THE WIRELESS LOGGER, BASIC II WIRELESS
PROBE AND SOLO REMOTE TRANSMISSION APPLIES WITH THE
FOLLOWING CONDITIONS.
(A) FCC ID: YFFACLOGGER; YFF-ACSOLO; YFF-ACPROBE
FCC 15.21: Changes or modifications not expressly approved by AquaCheck
will void the user's authority to operate the equipment.
FCC 15.105: This equipment has been tested and found to comply with the
limits for a Class A digital device, pursuant to Part 15 of the FCC Rules.
These limits are designed to provide reasonable protection against harmful
interference when the equipment is operated in a commercial environment.
This equipment generates, uses, and can radiate radio frequency energy and,
if not installed and used in accordance with the instruction manual, may
cause harmful interference to radio communications. Operation of this
equipment in a residential area is likely to cause harmful interference in which
case the user will be required to correct the interference at his own expense.
(B) IC ID: 8996A-ACLOGGER; 8996A-ACSOLO; 8996A-ACPROBE: Operation
is subject to the following two conditions: (1) this device may not cause
interference, and (2) this device must accept any interference, including
interference that may cause undesired operation of the device. (RSS-Gen
7.1.5)
Page 5

5
“...then anyone who leaves behind him a written
manual, and likewise anyone who receives it, in the
belief that such writing will be clear and certain,
must be exceedingly simple-minded...”
Plato (423-347 BC).
Page 6

6
CONTENTS
LIST OF FIGURES .................................................................................................................8
1 Introduction ......................................................................................................................9
2 Basic II Wireless System Components .........................................................................10
3 Probe construction .........................................................................................................12
4 General Statistics ...........................................................................................................13
5 Sensor Configuration .....................................................................................................13
6 Probe Settings .................................................................................................................13
7 Hand-held wireless logger .............................................................................................14
7.1
Introduction ..............................................................................................................14
7.2
Menu Functions .......................................................................................................16
7.3
THE STEPS OF COMMISSIONING .....................................................................19
8 COMMISSIO,I,G STEPS I, DETAIL ....................................................................19
8.1
Charge the logger’s battery. .....................................................................................19
8.2
Record the unique ID of each Basic II probe PRO II. .............................................20
8.3
Program the ID’s into the Logger ............................................................................20
8.4
Program the current Time and Date into the Logger ...............................................21
8.5
Perform a Profile Log on all Programmed Profiles .................................................22
9 ADDITIO,AL FEATURES .........................................................................................23
9.1
Single Log ................................................................................................................23
9.2
9.2 Clear All Logs ....................................................................................................24
9.3
9.3 View Stats ..........................................................................................................25
10 Trouble shooting ............................................................................................................26
11 Taking a reading ............................................................................................................27
11.1 Adding a probe as a profile ......................................................................................27
11.2 Download readings ..................................................................................................27
11.2.1 Profile Log ......................................................................................................27
11.2.2 Single Log ........................................................................................................28
12 Add-on’s ..........................................................................................................................28
13 Maintenance ...................................................................................................................28
14 I,STALLATIO, OF THE PROBE ............................................................................29
14.1 Installation in sandy soils .....................................................................................29
14.2 Using the “Slurry Technique” ..................................................................................31
15 REFILL LIMITS ...........................................................................................................34
Page 7

7
16 Getting Started ...............................................................................................................36
16.1 STEP 1 – Setup logger .............................................................................................36
16.2 STEP 2 - Activate probe (s) .....................................................................................36
16.3 STEP 3 – Installing the Software .............................................................................36
16.4 STEP 4 – Setting up blocks .....................................................................................38
16.5 STEP 5 – Connecting the logger to the CropGraph software ..................................38
16.6 STEP 6 – Setting up groups on the logger ...............................................................38
16.7 STEP 7 – Taking the first reading............................................................................38
Page 8

8
LIST OF FIGURES
Figure 1: Hand-held wireless logger ................................................................................. 10
Figure 2: AquaCheck Probe ..................................................................................... 11
Figure 3: SOLO RTU ............................................................................................... 11
Figure 4: Probe Construction ............................................................................................. 12
Figure 5: RF Utility Software .............................................................................................. 14
Figure 6: Drilling a hole with the hand-held auger .......................................................... 29
Figure 7: Collecting sand from the augured hole ............................................................ 30
Figure 8: A good fitting access tube .................................................................................. 30
Figure 9: Wetting the profile ............................................................................................... 31
Figure 10: Pouring slurry from the augured hole back into the hole ............................ 32
Figure 11: Increasing the viscosity of the slurry .............................................................. 32
Figure 12: An installed MobiCheck access tube ............................................................. 33
Figure 13: A typical hand-auger bit ................................................................................... 33
Figure 14: A typical hand-auger T-handle bar ................................................................. 33
Figure 15: A typical separate level graph showing a depletion cycle .......................... 34
Figure 16: A typical summed graph showing a depletion cycle .................................... 35
Figure 17: ProductKey Menu .............................................................................................. 37
Figure 18: Software registration form ................................................................................ 37
Page 9

9
1 Introduction
Capacitance based soil moisture probes have been used for irrigation scheduling
purposes for the past 15 years around the world.
Global market trends have however necessitated a revised point of departure for
affordable and practical irrigation scheduling technology and instruments.
AquaCheck (Pty) Ltd, has recognized the shift in global trends. The AquaCheck
probe was therefore specifically developed to address these needs. Its design and
construction is not only flexible enough to interface with the most advanced irrigation
system, but also has the ability to function as a very basic tool for entry level
irrigators.
Five versions of the AquaCheck II probe are available:
o A BASIC II wireless continuous logging version using a wireless hand-held
logger for data transfer to a PC;
o An ANALOGUE version compatible to third party analogue loggers.
o A SDI-12 version compatible to third party SDI-12 loggers.
o A MODBUS version compatible to third party MODBUS loggers.
o An AquaGREEN probe (SDI-12 or MODBUS) for greenhouse and turf
applications.
Capacitance sensors measure the dielectric constant of the soil by applying a
voltage between two electric plates (sensor rings). The frequency measured by the
rings varies with the dielectric constant, and this is used to calculate the soil
moisture content of the soil. The sensors are typically positioned at various depths
on a column 32mm in diameter. The current AquaCheck probe range offers six
standard length options varying from 200mm to 1200mm. The 400mm typically has
4 sensors and the 1200mm offers 6 sensor depths (see page 10 – configuration).
The column with attached sensors is positioned in the probe shaft and is sealed with
a water resistant resin. After assembly, the sensors are individually calibrated or
normalized to set the default air and water counts for each sensor. The probe also
takes a soil temperature reading at each depth. Each sensor has a built-in
temperature variation compensation factor. Readings from each sensor are
therefore corrected for possible inherent electronic temperature variations.
The probe can be set to take readings at variable time intervals but typically a
reading every 30 minutes (on all 6 sensors) would allow for up to 42 days on-board
storage capacity.
This manual covers the BASIC II wireless version.
Page 10
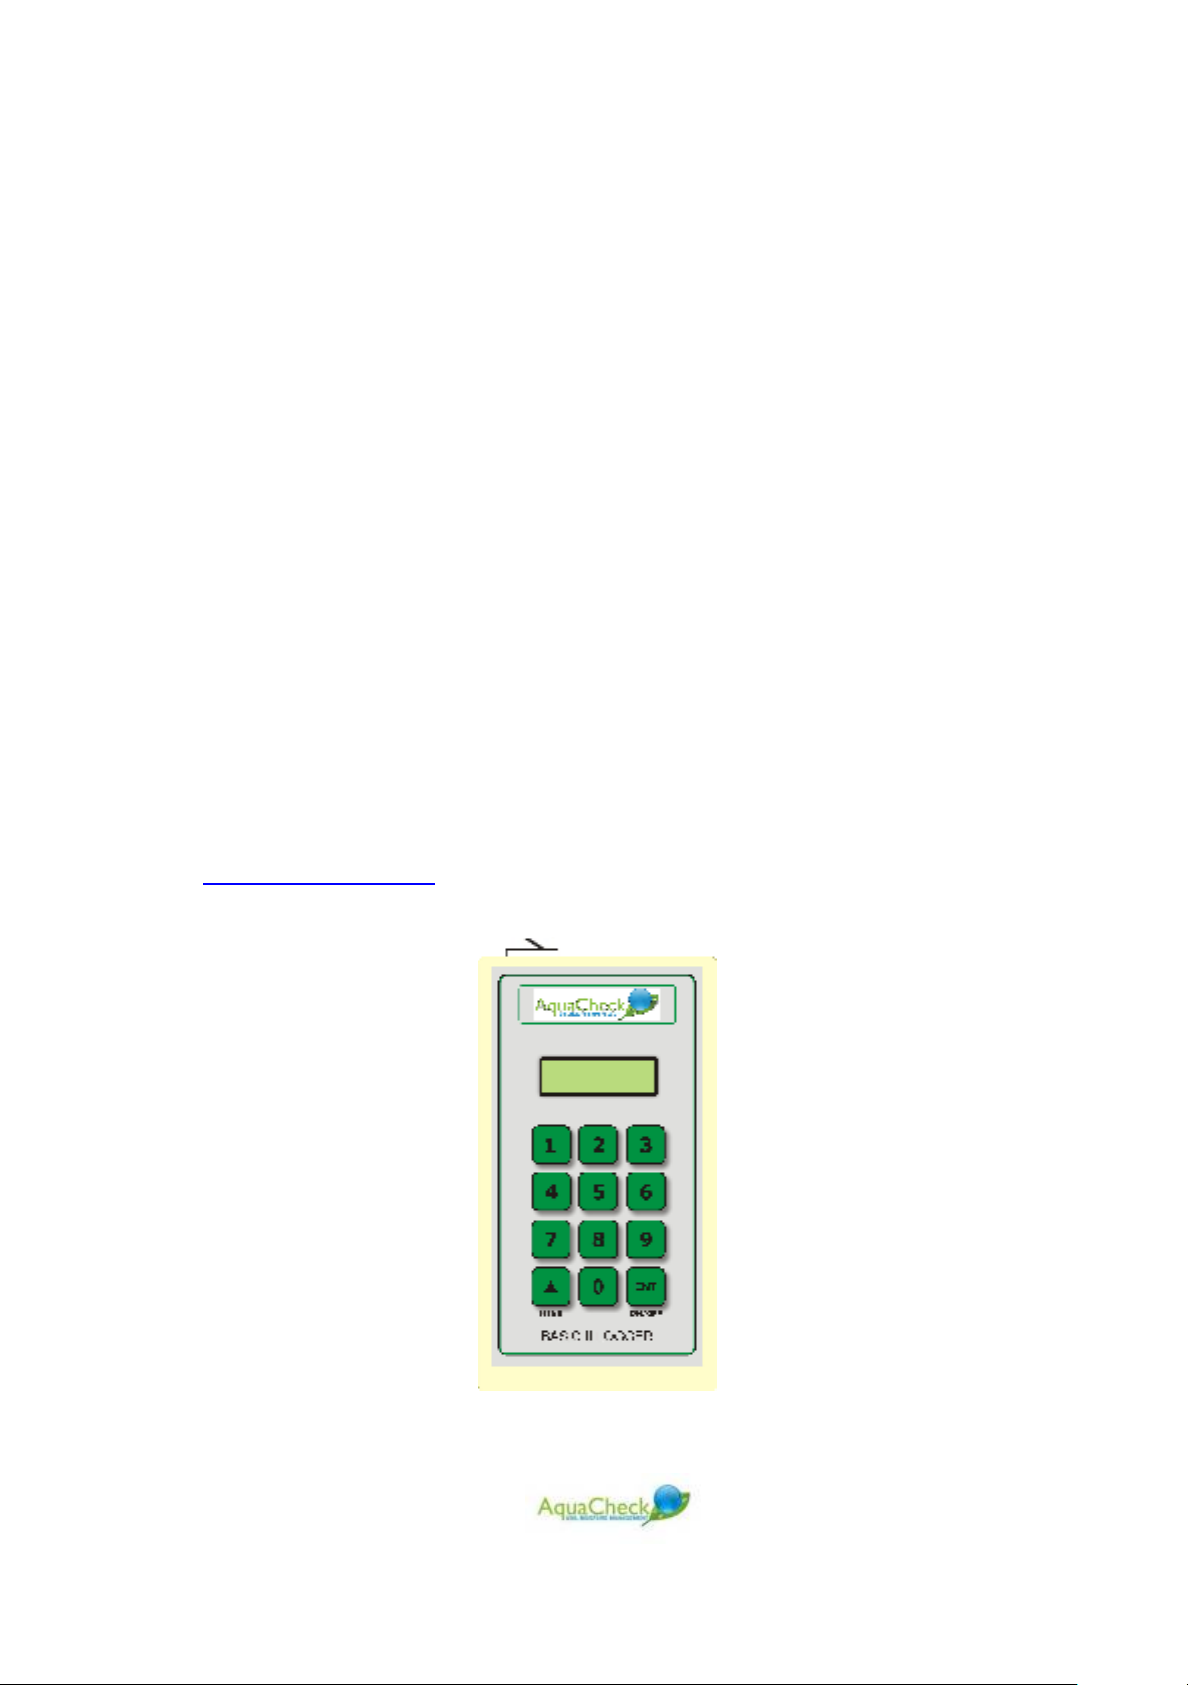
1 Basic II Wireless System Components
Figure
1
: Hand
-
held wireless logger
The BASIC II wireless system consists of the following components:
A. A continuous logging soil moisture probe
B. A continuous logging RTU device
C. Hand-held wireless logger unit
D. CropGraph software
E. Accessories:
a. Charger & Download cable
b. Manual & Installation CD
c. RF Utility Module
d. Installation Kit
The AquaCheck Basic II wireless probe is also offered in a sub-surface
configuration for turf and pasture applications. For this application the probe head
and shaft are separate units joined by a 0.5m cable. The shaft is equipped with a
hardened top cap, which if viewed from the top, looks like a standard popup
sprinkler head once installed. This version of the probe is however dependent on
an external communication device for power supply, data storage and/or
transmission. The SOLO device mentioned herein is typical of such an external
device for the sub-surface or classic versions of the AquaCheck probe.
(For more detail on the subsurface version please visit our website at
www.aquacheck.co.za and browse the products section)
10
Page 11
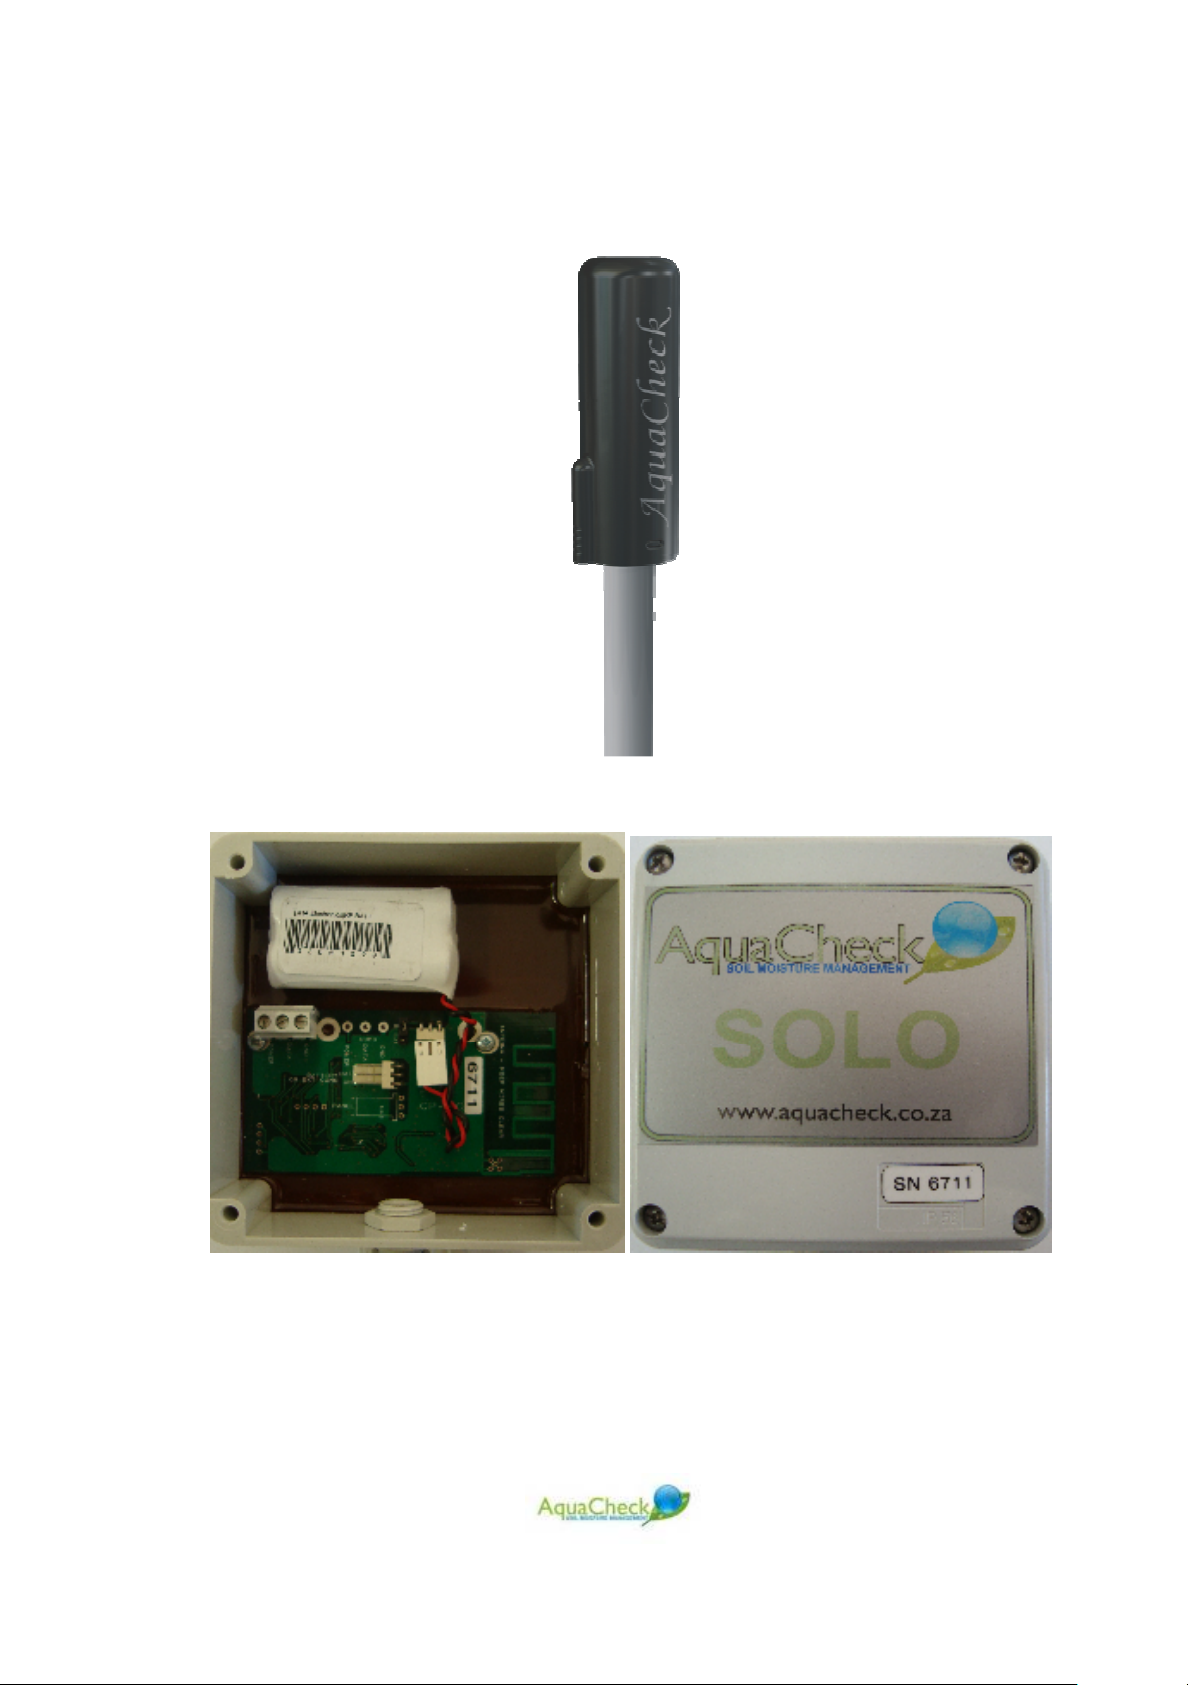
Figure 2: AquaCheck Probe
Figure 3: SOLO RTU
11
Page 12
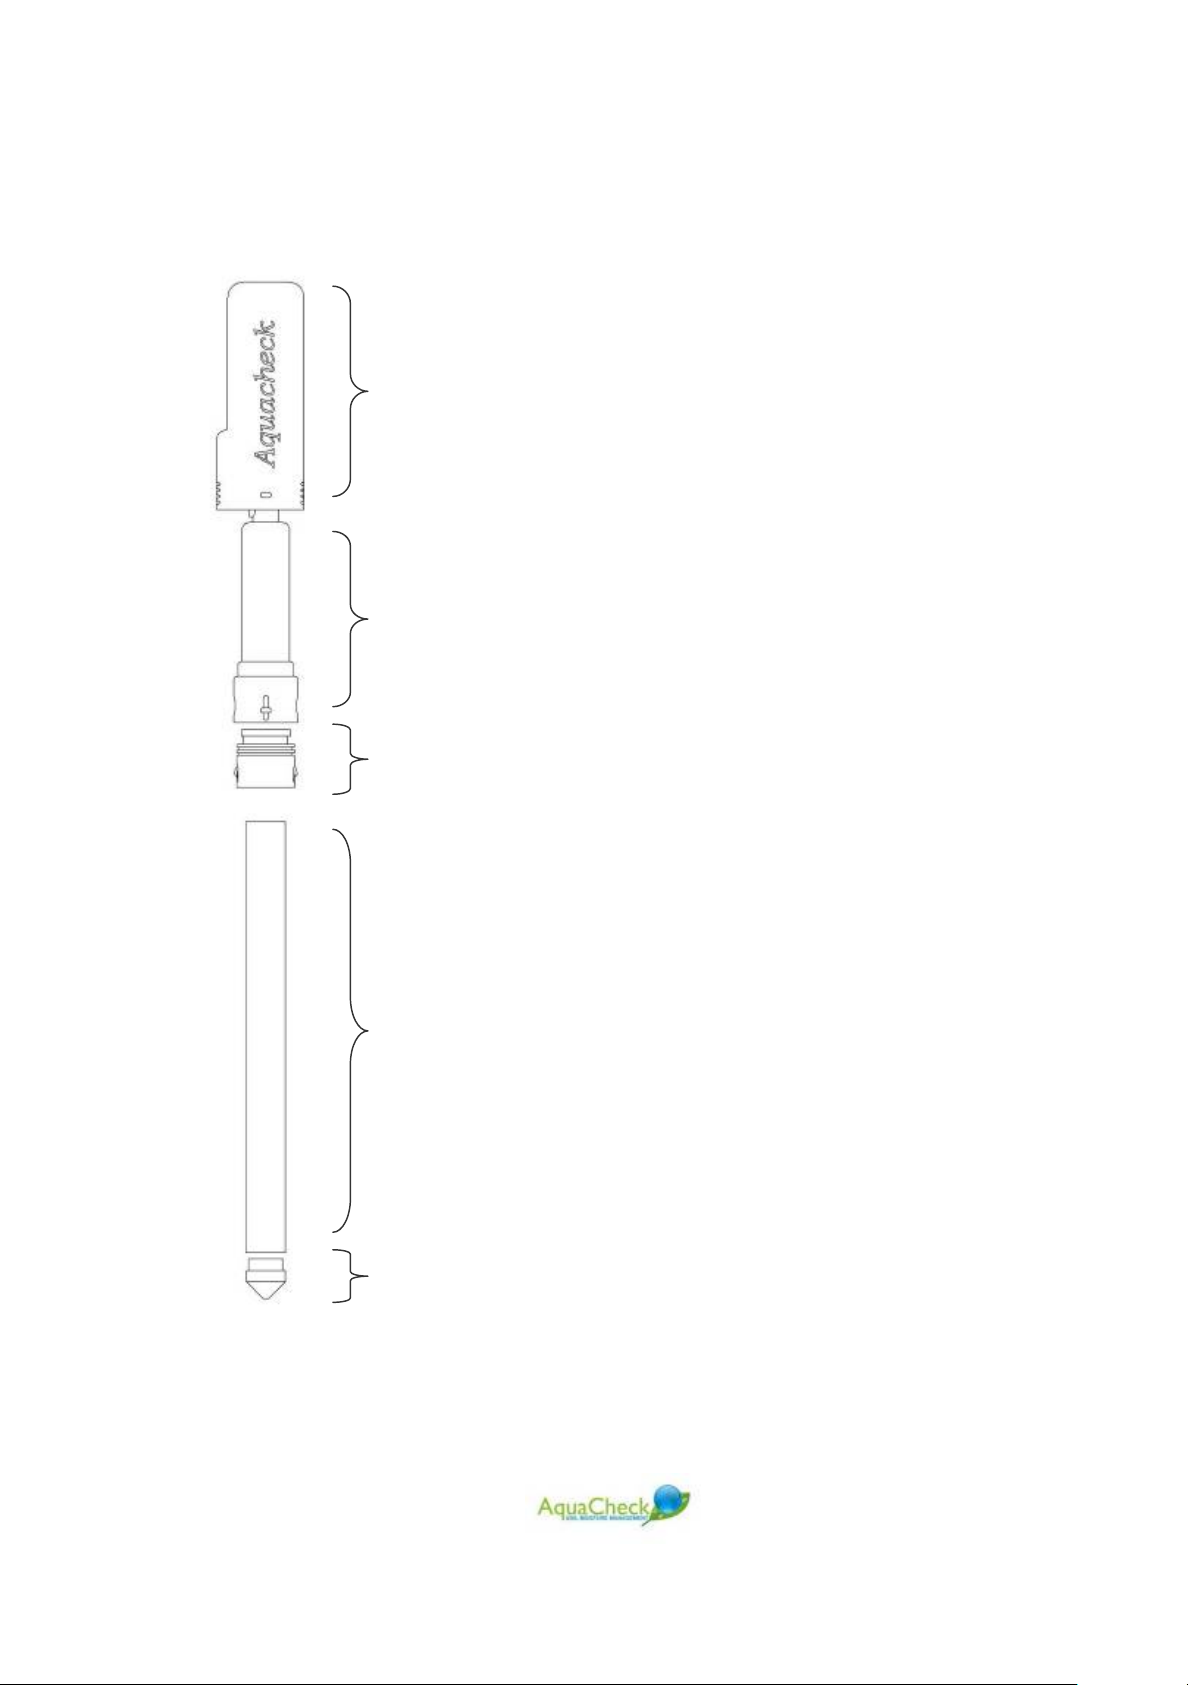
2 Probe construction
PROBE COVER
PROBE HEAD
LONG/SHORT
CONNECTOR
ASSEMBLY
Figure 4: Probe Construction
PROBE SHAFT
BOTTOM
STOPPER
12
Page 13

3 General Statistics
Dimensions: 400, 600, 800, 1000, 1200mm lengths with a shaft
diameter of 32mm
Weight: ±1 Kg (800mm & 6 sensors)
Protection: IP68+
Power supply: Internal 3.6V Lithium Battery (Approx 3 Years)
or External 4V to 8V at 12mA active and 0.8mA standby.
Output: Digital interface (0-3V) MODBUS compatible
Analog interface (0-2,5V) (12 Bit)
6 x S-Moist. Sensors and 6 x S-Temp. sensors.
Memory: 42 days continuous, logging every half hour.
Temp. Range: 0 to 50
0
C working, and -15 to 80 0C capable.
4 Sensor Configuration
The AquaCheck continuous logging probe is available in 6 standard depths or
lengths:
o 200mm length with 2 sensors at 100 and 200mm;
o 400mm length with 4 sensors at 100, 200, 300 & 400mm;
o 600mm length with 5 sensors at 100, 200, 300, 400 & 600mm;
o 800mm length with 6 sensors at 100, 200, 300, 400, 600 & 800mm;
o 1000mm length with 6 sensors at 100, 200, 400, 600, 800 & 1000mm
o 1200mm length with 6 sensors at 200, 400, 600, 800, 1000 & 1200mm;
o 400mm or 600mm version for pastures/turf;
o Soil temperature on each depth.
5 Probe Settings
Various settings on the AquaCheck BIIW probe can be changed such as ID number,
date/time, logging interval, etc. A special utility tool is available from your distributor
which will enable you to change these settings. For more information about the RF
13
Page 14
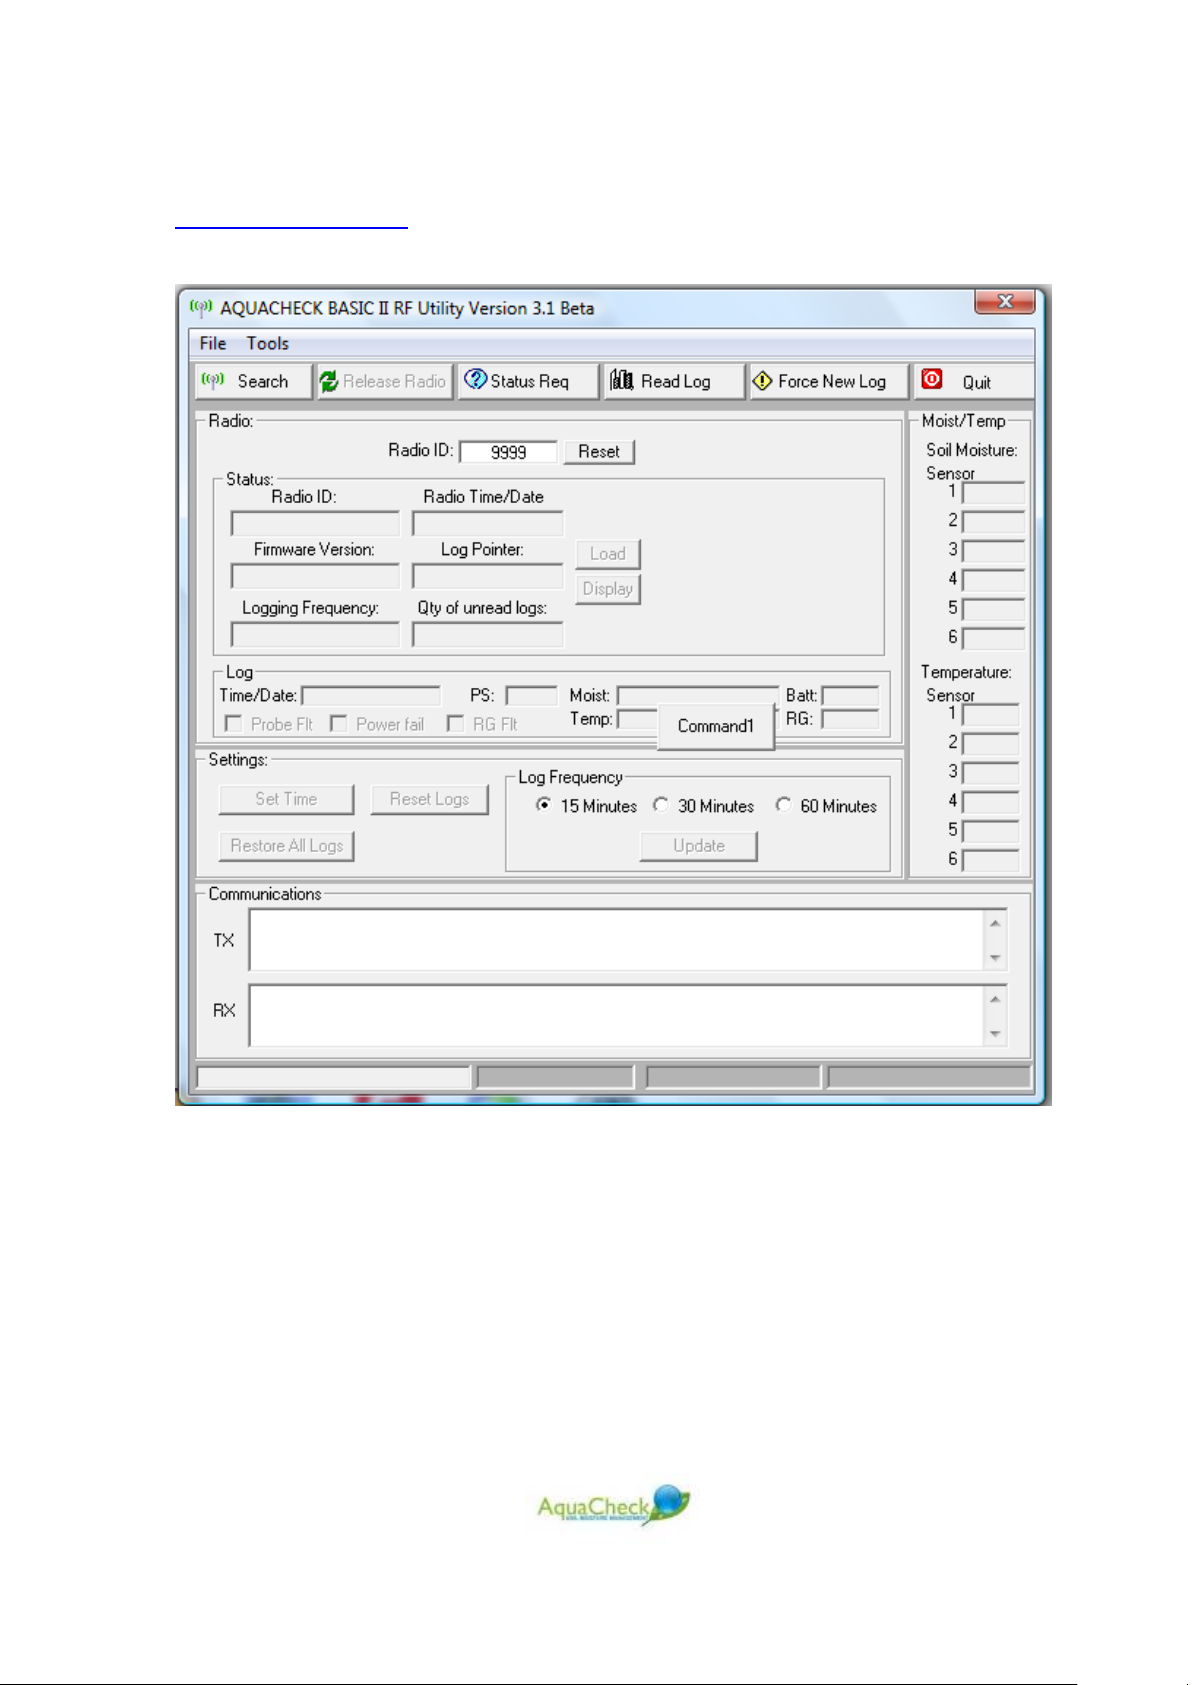
Utility Toolkit, please contact your local distributor or contact AquaCheck at
www.aquacheck.co.za
Figure 5: RF Utility Software
6 Hand-held wireless logger
6.1 Introduction
The AquaCheck Basic II data logger is a component of the AquaCheck soil moisture
management system. A typical soil moisture system consists of soil moisture probes
and a Data logger. The probe data (soil moisture and temperature) are relayed to
14
Page 15
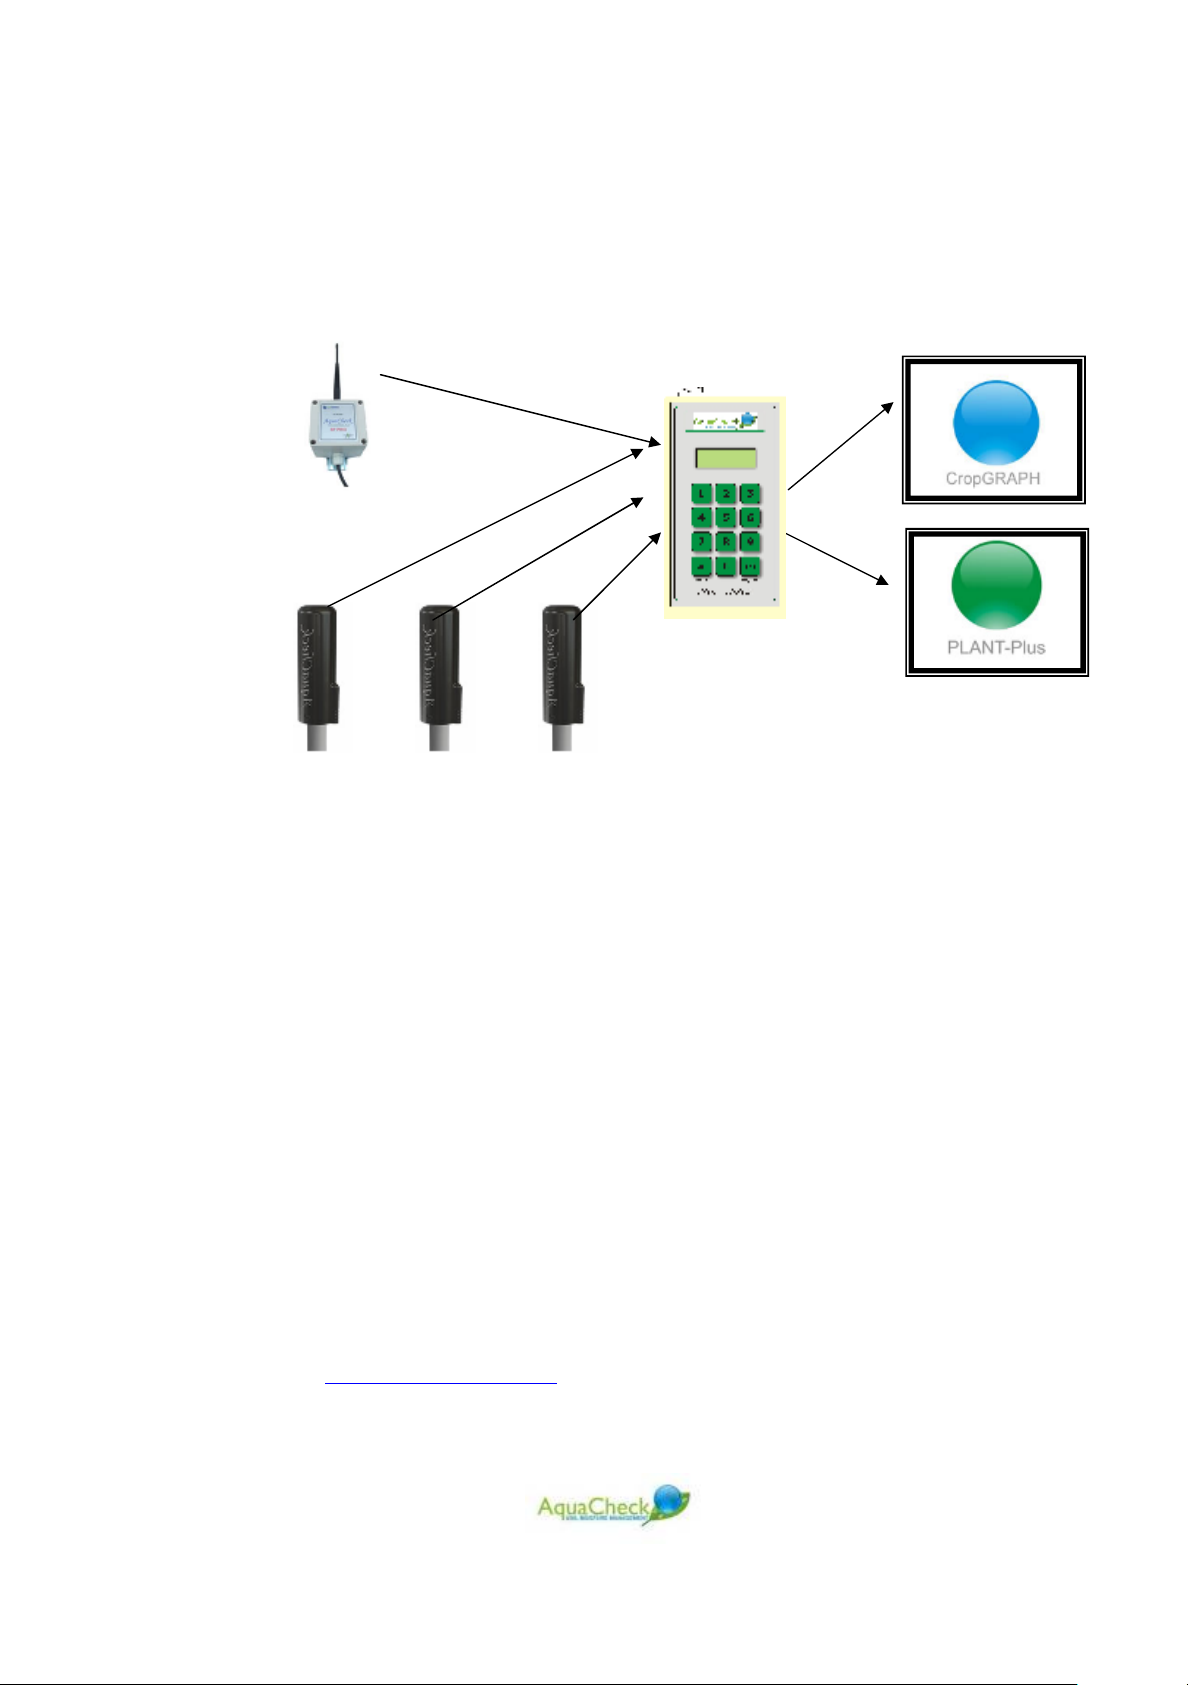
RF Hand logger via a propriety RF telemetry system. The logged data is then
downloaded to a PC which processes the data for trending display via a PC
application (CropGraph/Plant-Plus).
RF radios & Probes Logger PC Application
The hand-held wireless logger can log up to 120 probes. The logger offers a menu
option which allows the user to view, edit and manage certain functions. The menu
options are:
o Date & Time (default)
o Profile Log – normal function to collect data from the probe
o Single log – log all data from a specific probe
o Download interval – only applicable for the base station loggers
o Clear all logs – clear data from the logger
o View Stats – view how many logs are on the logger
o Set time & date – change current date & time
o Continuous logging –. only applicable for the base station loggers
o Profile setup – populate the 120 possible profiles with probe ID’s.
o PRO II Firmware update – the hand logger can be used to remotely upgrade
firmware on the PRO II RTU’s
o Exit
New firmware offering additional features on the loggers are released from time to
time or as needed. There is a software utility available to upgrade your logger.
Please visit the AquaCheck website to verify the latest logger firmware version for
your logger at
for the applicable files.
www.aquacheck.co.za and browse to the downloads section to search
15
Page 16
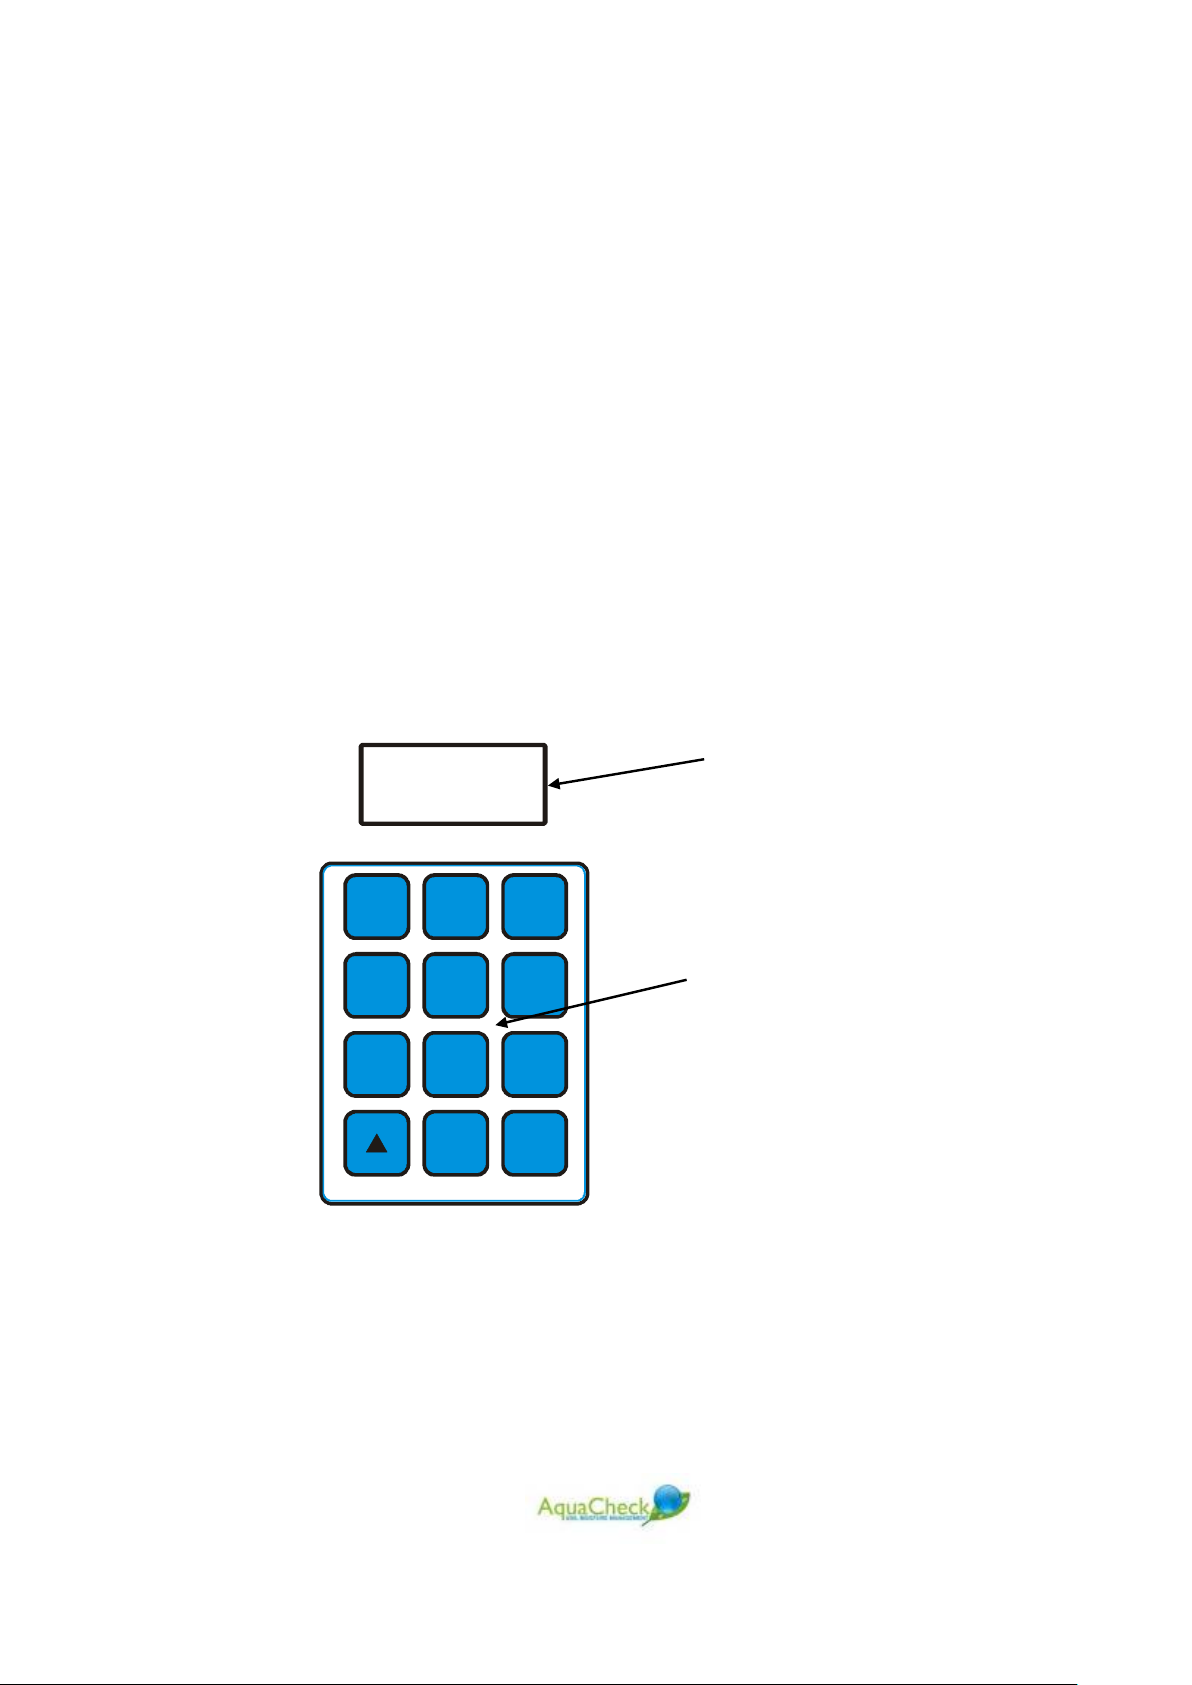
AquaCheck Basic II data logger.
123
5
674
8
9
0
ENT
ON/OFF
DATA LOGGER
The AquaCheck Basic II data logger as shown above is fitted with the
following:
a. Omni-directional internal antenna
b. 2 x 16 character Back light LCD Dot matrix display
c. 5 pin socket for charger and downloading data to a P.C.
d. Numeric keypad
e. Rechargeable internal battery
f. Internal Radio to communicate with PRO II’s and Basic II soil moisture
probes.
g. Databank with a capacity for 15000 logs.
h. A mains charger, Car charger and download cable is supplied with the
logger.
6.2 Menu Functions
The AquaCheck Basic II data logger functions are accessed via the 12-pushbutton
keypad and the information is displayed on the LCD display. See below:
LCD Display
Keypad
MENU
The Scroll()/menu and ENT/ON/OFF pushbuttons have dual functions. The ENT
pushbutton turns the logger ON and OFF, whilst during Setup, it functions as an
ENTER key. Once the logger is first turned ON, only the function written below the
key is operational. All the other keys are inactive.
16
Page 17

Once the logger is turned on(press the ON/OFF key) then the display turns on,
Brand
Time & Date
displaying the following information in quick succession:
Boot Loader
Firmware Version
Type
Bootl.dr
v1.00
Aqua
Check
SW4920
Ver 1.04
Data
Logger
16:45
4 Oct 08
17
Page 18
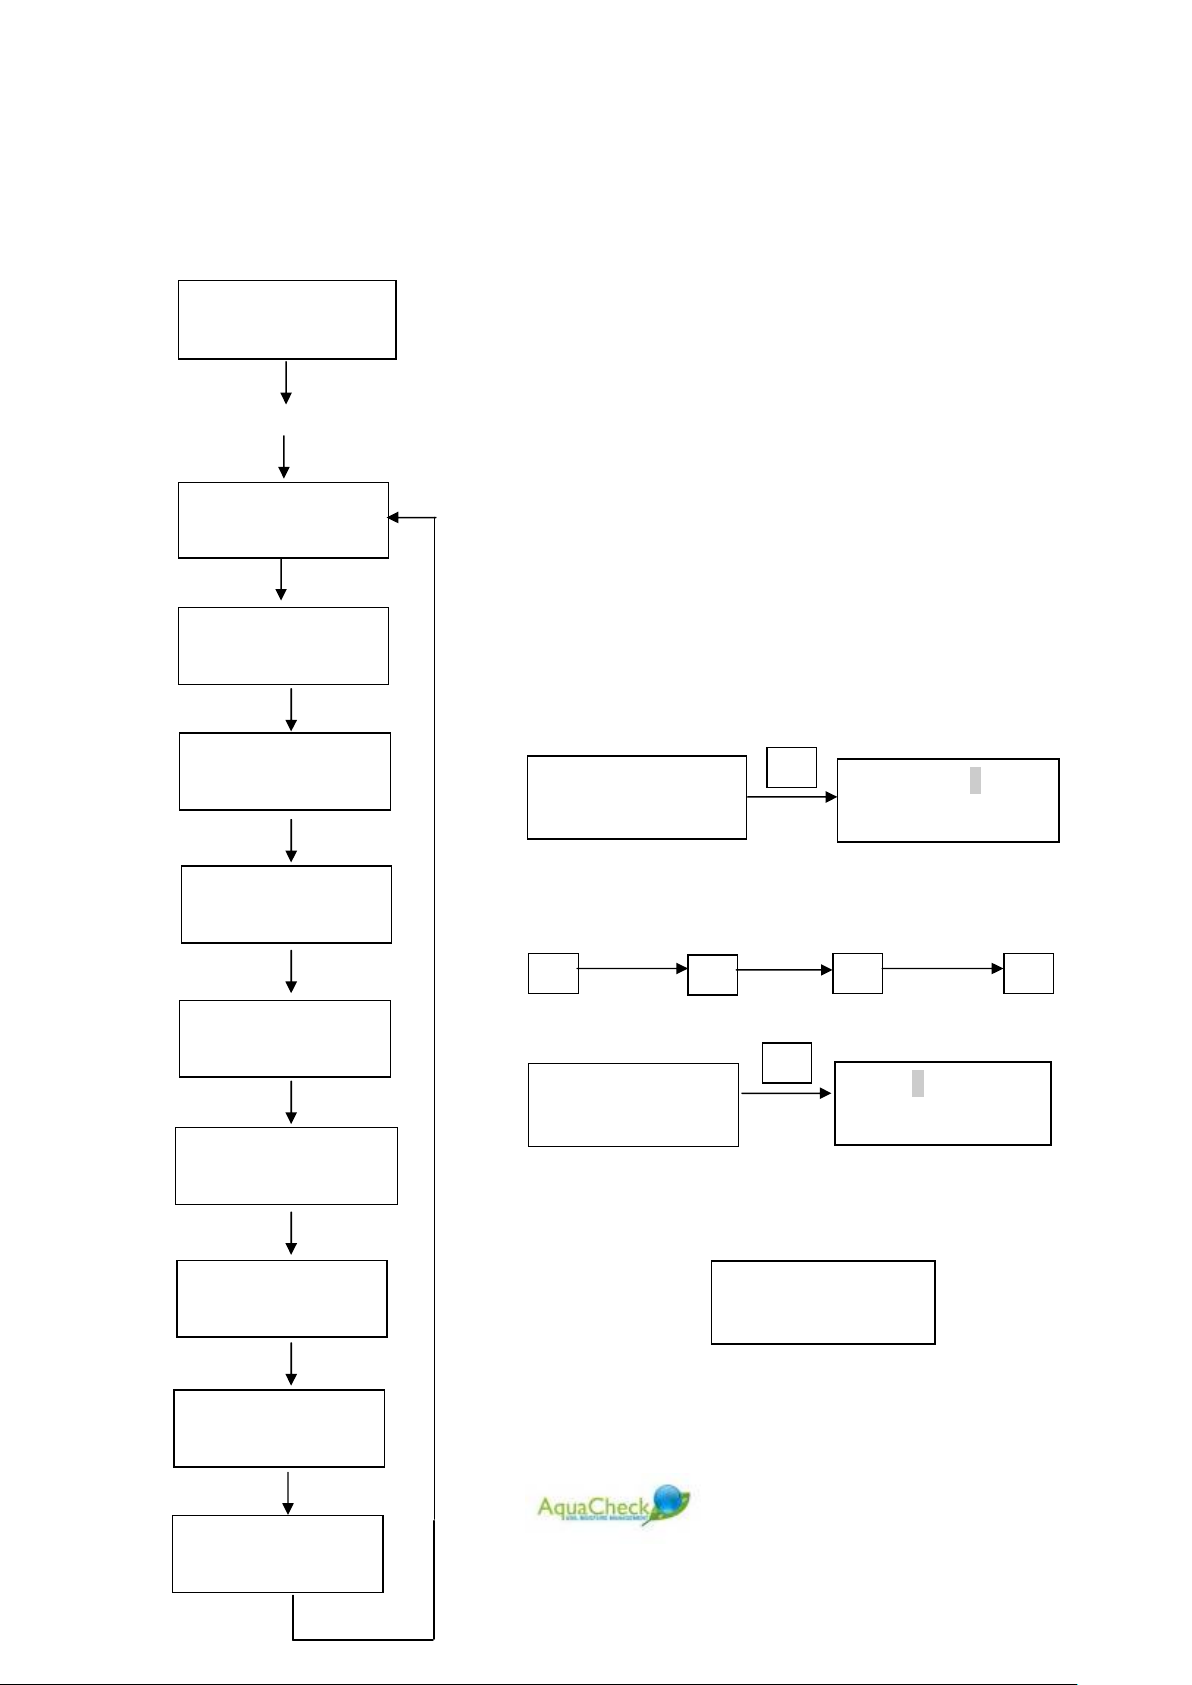
Once the time and date is displayed, press the Menu key to gain access to the
logger functions. The functions can be scrolled and the menu is circular as
displayed below:
16:45 4 Nov ‘08
Each item on the screen flashes. Pressing the
/Scroll key at this time selects the next menu
Press Menu
item.
Press ENT to execute the menu function.
Profile Log
Example: To set the time and date, follow the
steps below:
a. Turn on the Logger. and wait for the time and
Single Log
date to be displayed
b. Press the MENU/ key.
c. Then press the MENU/ key until the ‘Set
Time & Date’ screen is displayed:
Clear All logs
Set Time & Date
E,T
Set Time 16:35
The shaded area indicates flashing.
View Stats
To change the time to 17:00, now press
1
7
0 0
Set Time & Date
The display will now show:
E,T
Set Time 7:00
Date: 04/12/08
Cont. Logging
Using the numeric keypad, edit the date in the
same manner as shown in the time setting
example. Once completed, press the ENT key.
The display will now show:
Profile Setup
Set Time & Date
Press the MENU/ key until ‘Exit’ is displayed,
then press Enter. Pressing Enter again will turn
PRO II Firmware
off the logger.
Exit
18
Page 19
6.3 THE STEPS OF COMMISSIONING
1. Charge the logger’s battery.
2. Once the probes and PRO II’s are installed, record the unique ID of each one.
3. Program each ID’s into a profile on the logger.
4. Set the current Time and Date on the Logger
5. Perform a profile log on all of the probes/PRO II’s. This will synchronies the
time and date with each device and download the unread data.
7 COMMISSIONING STEPS IN DETAIL
7.1 Charge the logger’s battery.
Plug the charger into a 220V mains outlet and plug the charger’s cable into the 5
way connector. After a few seconds, the display will read:
16:45 4 Nov ‘08
Charging..
An on-board timer is activated to time the charge cycle. Once charging is
completed, the display will read: ‘Charge Complete’
Unplug the charger from the logger and then from the mains. After a few seconds,
the logger will turn itself off.
19
Page 20
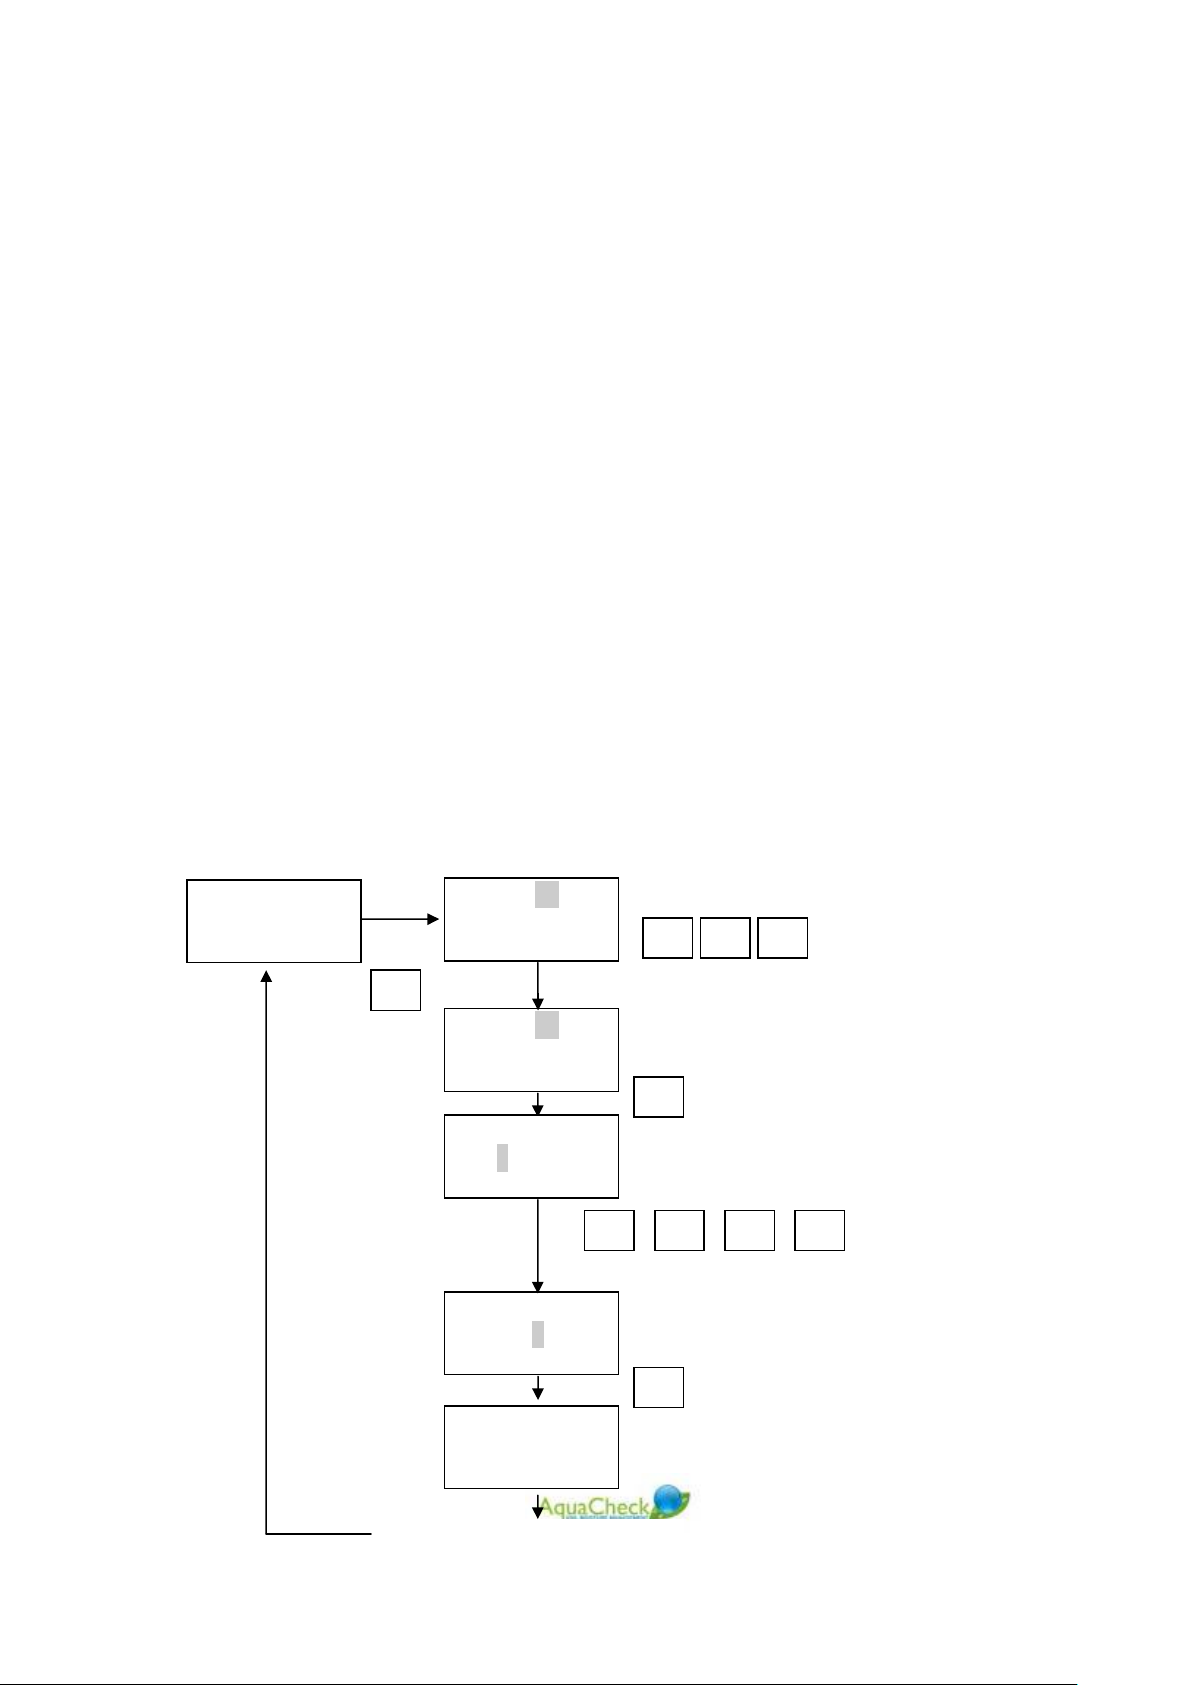
Key in Profile no.
7.2 Record the unique ID of each Basic II probe PRO II.
1. Although the ID’s/serial numbers are all 5 digits long, the 1
to ‘5’.
2. When programming the Logger, always programme the ID’s of the RF
STUBS/PRO’s omitting the first digit(5). For Example: With the serial Number
or ID being SN:51204, when programming the ID into the Logger, program
the ID as 1204 omitting the ‘5’.
st
digit is always set
7.3 Program the ID’s into the Logger
1. All of the recorded ID’s of the BASIC II probes and PRO II’s installed and
recorded in the previous section, should be programmed into a profile, that
upon downloading, the logger will automatically download all the latest data
from the ID in the profile. This is called a Profile Log.
2. The Logger has a capacity for up 120 profiles.
Should one need to download all of the stored logs stored on a the BASIC II probes
or PRO II, then download all the data by means of a single log. The Logger has a
battery backed real time clock. During each download, the time is automatically
synchronised with the BASIC II probes and PRO II’s.
Once the logger
is turned on,
Press the
Menu/ key.
Press the
Menu/ key until
the ‘Group Setup’
menu is
displayed. Follow
the steps in the
diagram on the
left to program in
the device ID’s.
Repeat until all of
the groups are
programmed into
the logger
Profile Setup
E,T
Profile: 000
Profile: 001
Profile: 1
ID1: 0000
Profile: 1
ID1: 1326
0 0
E,T
1 3 2 6
1
Key in Device ID
Profile Setup
Repeat for other ID’s
20
E,T
Page 21

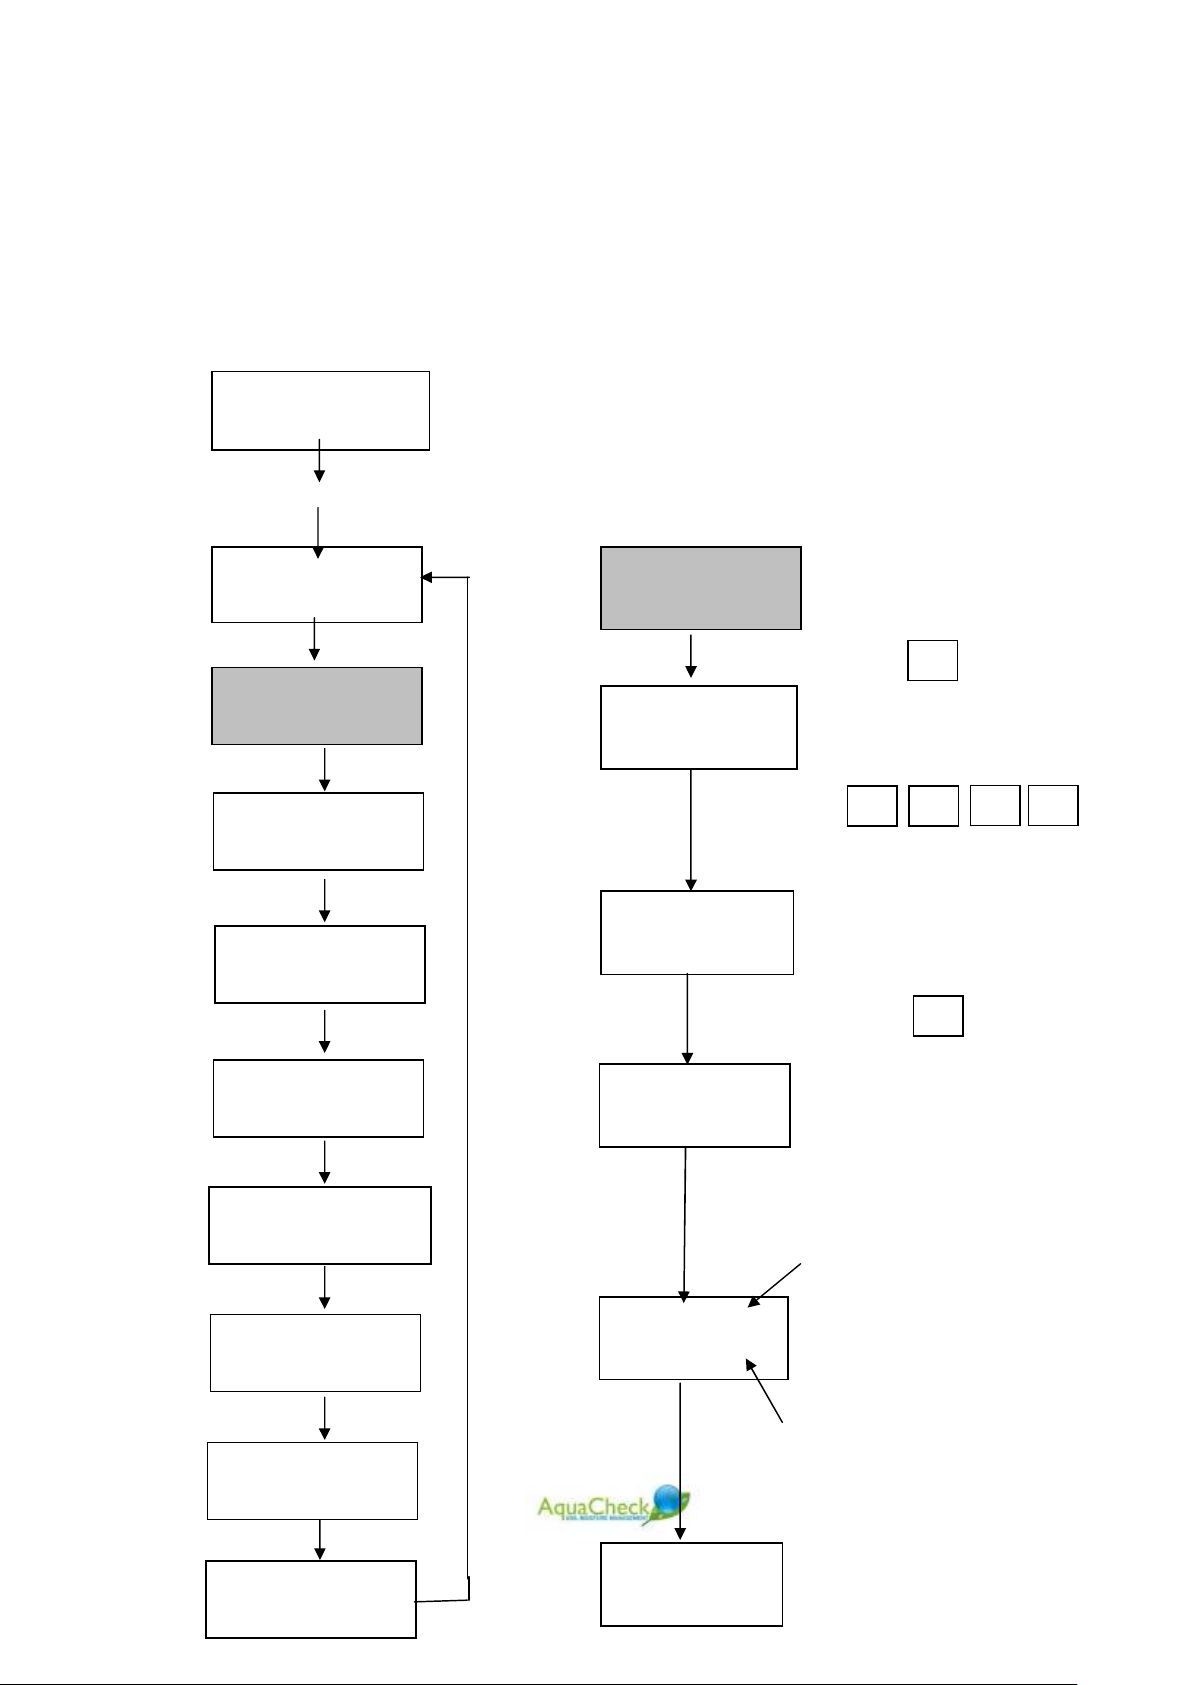
7.4 Program the current Time and Date into the Logger
16:45 4 Nov 08
Press Menu
Profile Log
Turn on the Logger and then press the Menu/ key.
Press the Menu/ key until the ‘Set Time & Date’ menu
is displayed
Example: To change the time from 16:35 to 17:00
E,T
Single Log
Clear All logs
View Stats
Set Time & Date
Cont. Logging
E,T
Set Time: 16:35 Set Time & Date
Set Time: 7:00
Date: 01/01/07
0 3 1 2 0
Date: 03/12/08
1 7 0 0
Key in using
numeric keypad
E,T
To change Date
from 01/01/08
to
03/12/08
8
Key in using
numeric keypad
Profile Setup
PRO II Firmware
Exit
21
Page 22

Key in using numeric
‘Scanning profile 002’
before reporting a ‘No
7.5 Perform a Profile Log on all Programmed Profiles
Profile logging allows one to collect the data from
16:45 4 Nov 08
Press Menu
Profile Log
Single Log
Clear All logs
View Stats
Set Time & Date
Cont. Logging
Profile Setup
BASIC II probes and PRO II’s in close proximity of
the point of logging and only the unread data is
retrieved. To do a Profile log, follow the
instructions below:
Profile Log
Profile: 000
0 0
Profile: 002
Display shows
and a count-down
E,T
Scanning 39
Profile 002
ID 5163(50%)
timer displaying the
remaining scan time
Probe’ message’
Signal Strength
Loading 143
Remaining logs to
E,T
2
keypad
download
PRO II Firmware
Exit
22
Load
Complete
Download Completed
Press Enter to continue
Page 23
en downloading all of the stored logs,
log and counts
Key in using numeric
Scanning Log ID 5165
8 ADDITIONAL FEATURES
8.1 Single Log
16:45 4 Nov O7
Press Menu
One can access all of the stored logs on a probe by
means of a single log.
Please note that due to the amount of data involved; it
can take a couple of minutes to download the data.
Follow the steps below to retrieve the data:
8.2
Clear All logs
Set Time & Date
Profile Log
Single Log
View Stats
Single Log
Log ID: 0000
Log ID: 5165
Scanning 40
LogID: 5165
E,T
5 1
6
keypad
E,T
counting down in
seconds 40
5
Cont. Logging
Profile Setup
PRO II Firmware
Exit
ID ---- (50%)
Loading 23
23
Load
Complete
Signal Strength
Wh
the logger starts with the 1st
up
Download Completed
Press Enter to continue
Page 24

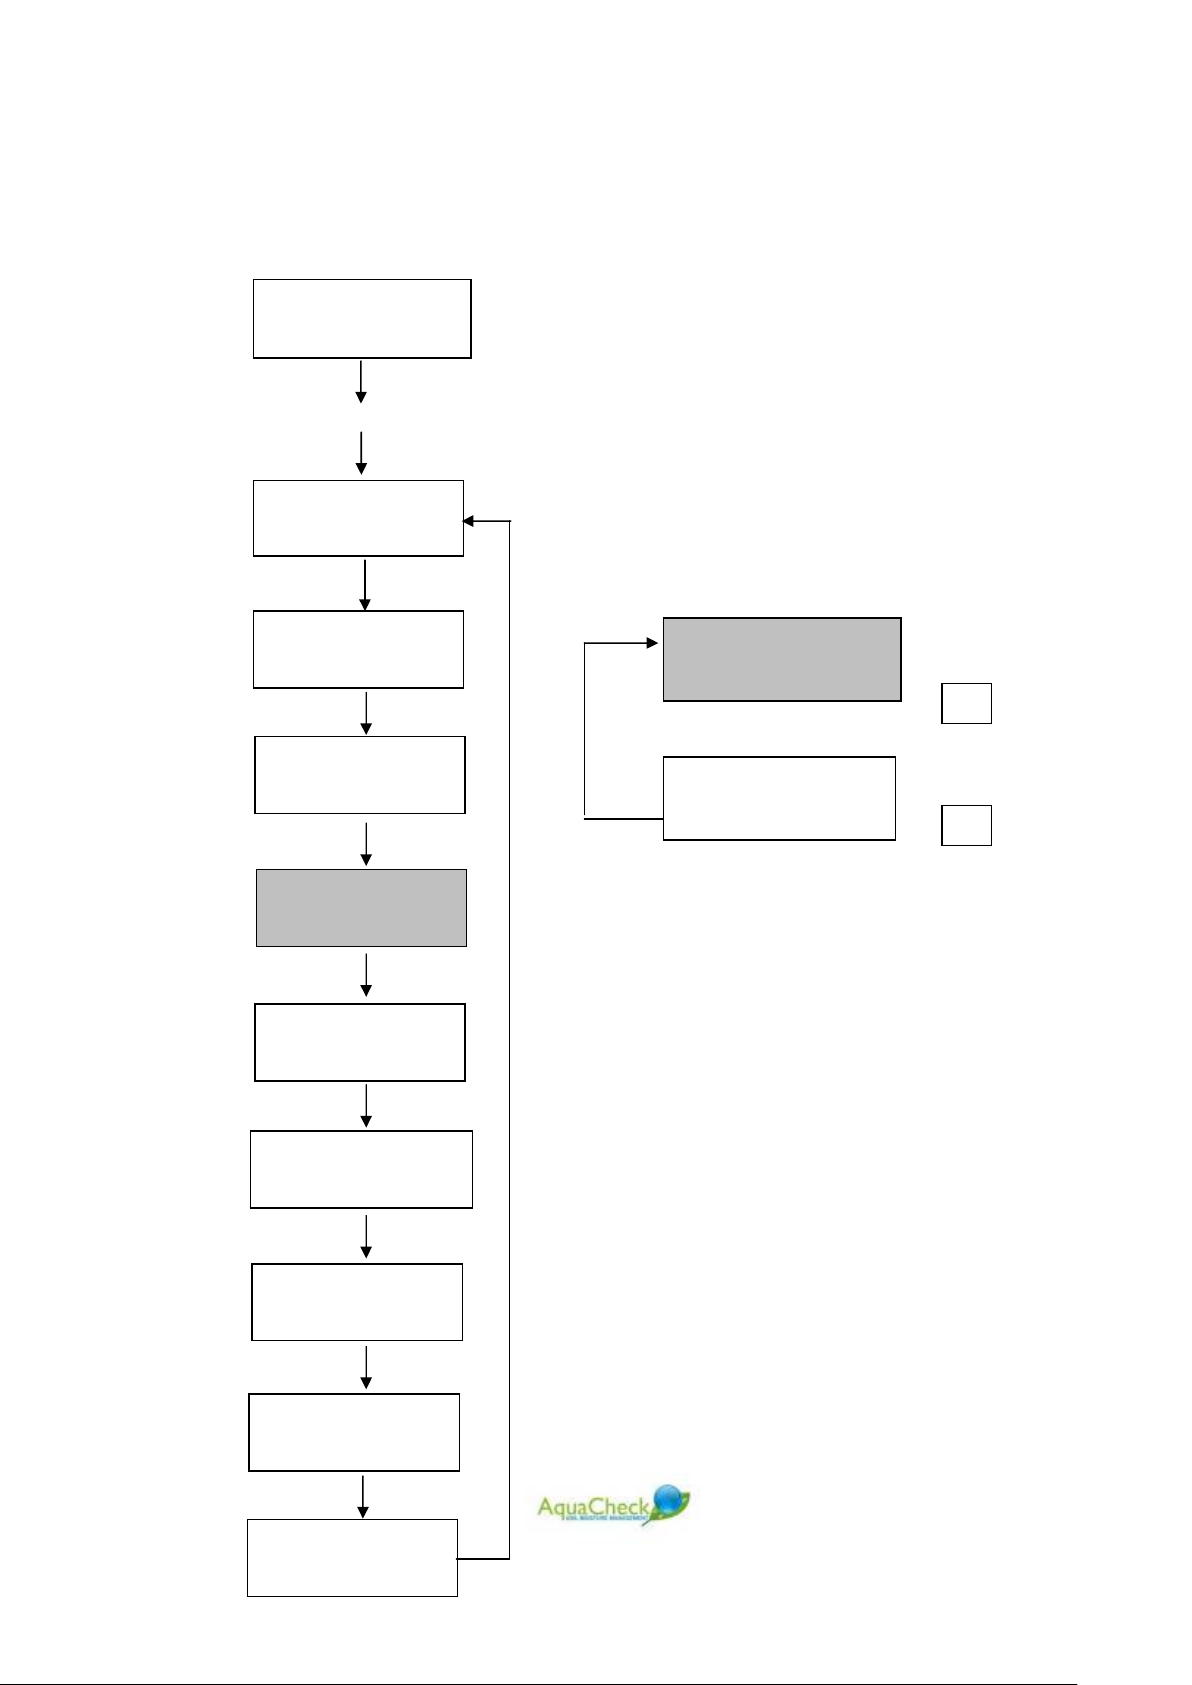
9.2 Clear All Logs
Once all of the data is downloaded to a PC, the databank of the logger should be
cleared. To clear the databank follow the instructions below:
16:45 4 Nov O7
8.3
Press Menu
Profile Log
Single Log
Clear All logs
View Stats
Clear All Logs
E,T
Confirm? [No ]
Confirm? [Yes]
E,T
Set Time & Date
Cont. Logging
Profile Setup
PRO II Firmware
Exit
24
Page 25
9.3 View Stats
16:45 4 Nov 08
Press Menu
Profile Log
In order to keep track of the logging of data, one
can view the quantity of stored logs in the logger’s
memory. This is a useful feature if one wants to
know specifically how many logs were
downloaded from a profile or ID. View the quantity
of logs as follows:
Single Log
Clear all logs
View Stats
Set Time & Date
Cont. Logging
View Stats
E,T
Total: 1095
E,T
Profile Setup
PRO II Firmware
Exit
25
Page 26

Symptom
Possible Cause
Solution
9 Trouble shooting
Display Dim Battery depleted Charge battery
After a group log, the
logger displays ‘No
Probes’
During a Profile log,
Logger finds probe
and starts download,
afterwards, displaying
‘No Reply’
Logger Displays
‘Profile Empty’ when
trying a profile log
1. Logger out of range
2. Probe ID incorrect
1. Logger out of range
or reception is poor.
2. Battery on device is
marginal or flat
Device ID is not
programmed into group
1. Move closer to the
device. Keep the logger
upright with the antenna
pointing upwards to the
sky when doing a log.
2. Verify the device ID
1. Move closer to the
device. Keep the logger
upright with the antenna
pointing upwards to the
sky when doing a log.
2. Check battery voltage
on device. Voltage
should be more that 3.3
volts
Record device ID and program
the ID into the profile.
26
Page 27

10 Taking a reading
Please note: All probes are shipped with the battery pack disconnected. To
activate the probe, the probe head needs to be removed by turning it through 45
first and then by pulling it upwards. Make sure the battery board is properly seated
and then connect the battery pack. The date/time needs to be set before a reading
can be taken. In the absence of the RF Utility Toolkit, the date/time can also be set
with logger using the profile log option. In this case the logger memory has to
cleared immediately after the download to prevent obsolete data to be imported into
the database. Browse the logger menu to the CLEAR ALL LOGS menu option and
press the enter button.
To take a normal reading from a probe, the probe first needs to be added to the
profile list of logger.
10.1 Adding a probe as a profile
How to
:
Go to Profile Setup by scrolling down the menu by pressing the menu
button option on the keypad of the logger several times until you reach
Profile Setup,
Press Enter
Insert profile #, i.e. 001 by using the numbers on the keypad;
Press Enter
Add probe ID to this profile, i.e. 5177 by using the numbers on the keypad.
Press Enter. Profile 001 has now been populated with probe ID 5177.
Exit
0
10.2 Download readings
10.2.1 Profile Log
To download the most recent readings (from the previous download) of a specific
probe:
How to
:
Switch the logger on by pressing and holding the Enter button for a ½
second.
Press menu and scroll to Profile Log
27
Page 28

Select 001, press enter – the logger will automatically start scanning for all
the probe listed in profile 001. (The probe wakes up every 15 seconds to
“listen” if any logger or device is polling it.)
On the logger screen (LCD) the signal strength is displayed as well as the
remaining seconds. Once the logger makes a connection to the probe, the
signal strength and remaining number of logs are displayed and the logger
starts downloading the logs.
Upon completion the logger LCD will display “Download Completed”.
10.2.2 Single Log
To download all the readings from a specific probe:
How to
:
Browse to Single Log option by scrolling through the menu button.
Select probe ID by entering the applicable probe ID i.e. 5177
Press enter.
Logger will start scanning for this probe.
Once the logger has made a successful connection, it will start retrieving
all the available data on that specific probe.
All the available data from this probe will be downloaded.
11 Add-on’s
The AquaCheck probe offers plug & play options for a rain gauge and or a
dendrometer (PlantSense
probe head needs to be replaced with the appropriate components. Please contact
your local AquaCheck distributor or visit our website at
more detail.
TM
). To add a rain gauge, the default battery pack and
www.aquacheck.co.za for
12 Maintenance
Very little maintenance is required when using the AquaCheck probe. The only
replaceable part is the battery pack. The battery pack should last for up to 18
months under normal conditions. To replace the battery, remove the probe head and
disconnect the old battery pack from the battery board. Make sure the battery board
is properly seated in the 14-pin connector before connecting the new battery.
Remember to set the time and date again after replacing the battery.
28
Page 29

13 INSTALLATION OF THE PROBE
Make sure that the time & date is set on the probe before installing it. It is also
recommended to remove obsolete data from the probe first. This can be done by
using the RF Utility toolkit or by using the logger.
As a general rule it is strongly advisable to test the probe for integrity before
installation. This can be done by first letting the probe log in open air for two hours
after which it can be lowered into water up to the lower end of the connector
assembly also for two hours. Air readings must be in the order of 2-4% and water
readings in the order 94-98%. The probe can be reset by the hand-held logger or by
using the RF Utility Toolkit.
It is important to note that the fit between the probe (or access tube in the case of
the MobiCheck) and surrounding soil is of critical importance in obtaining accurate
and representative soil moisture readings. Various techniques to obtain a good fit
are used depending on soil type, crop type and application. A customized installation
auger is available on request and can be used for all soil types. It must be noted that
in extreme sandy soils a customized “hollow” tube auger usually gives better results.
13.1 Installation in sandy soils
For very sandy soils the best installation result or fit is obtained by first thoroughly
wetting the profile or site. The standard hand-held auger or a specialized aluminum
hollow auger is used to create a tight fit access hole. If the aluminum auger is used,
it is banged or hammered into the wet sandy profile and extracted several times.
Figure 6: Drilling a hole with the hand-held auger
29
Page 30
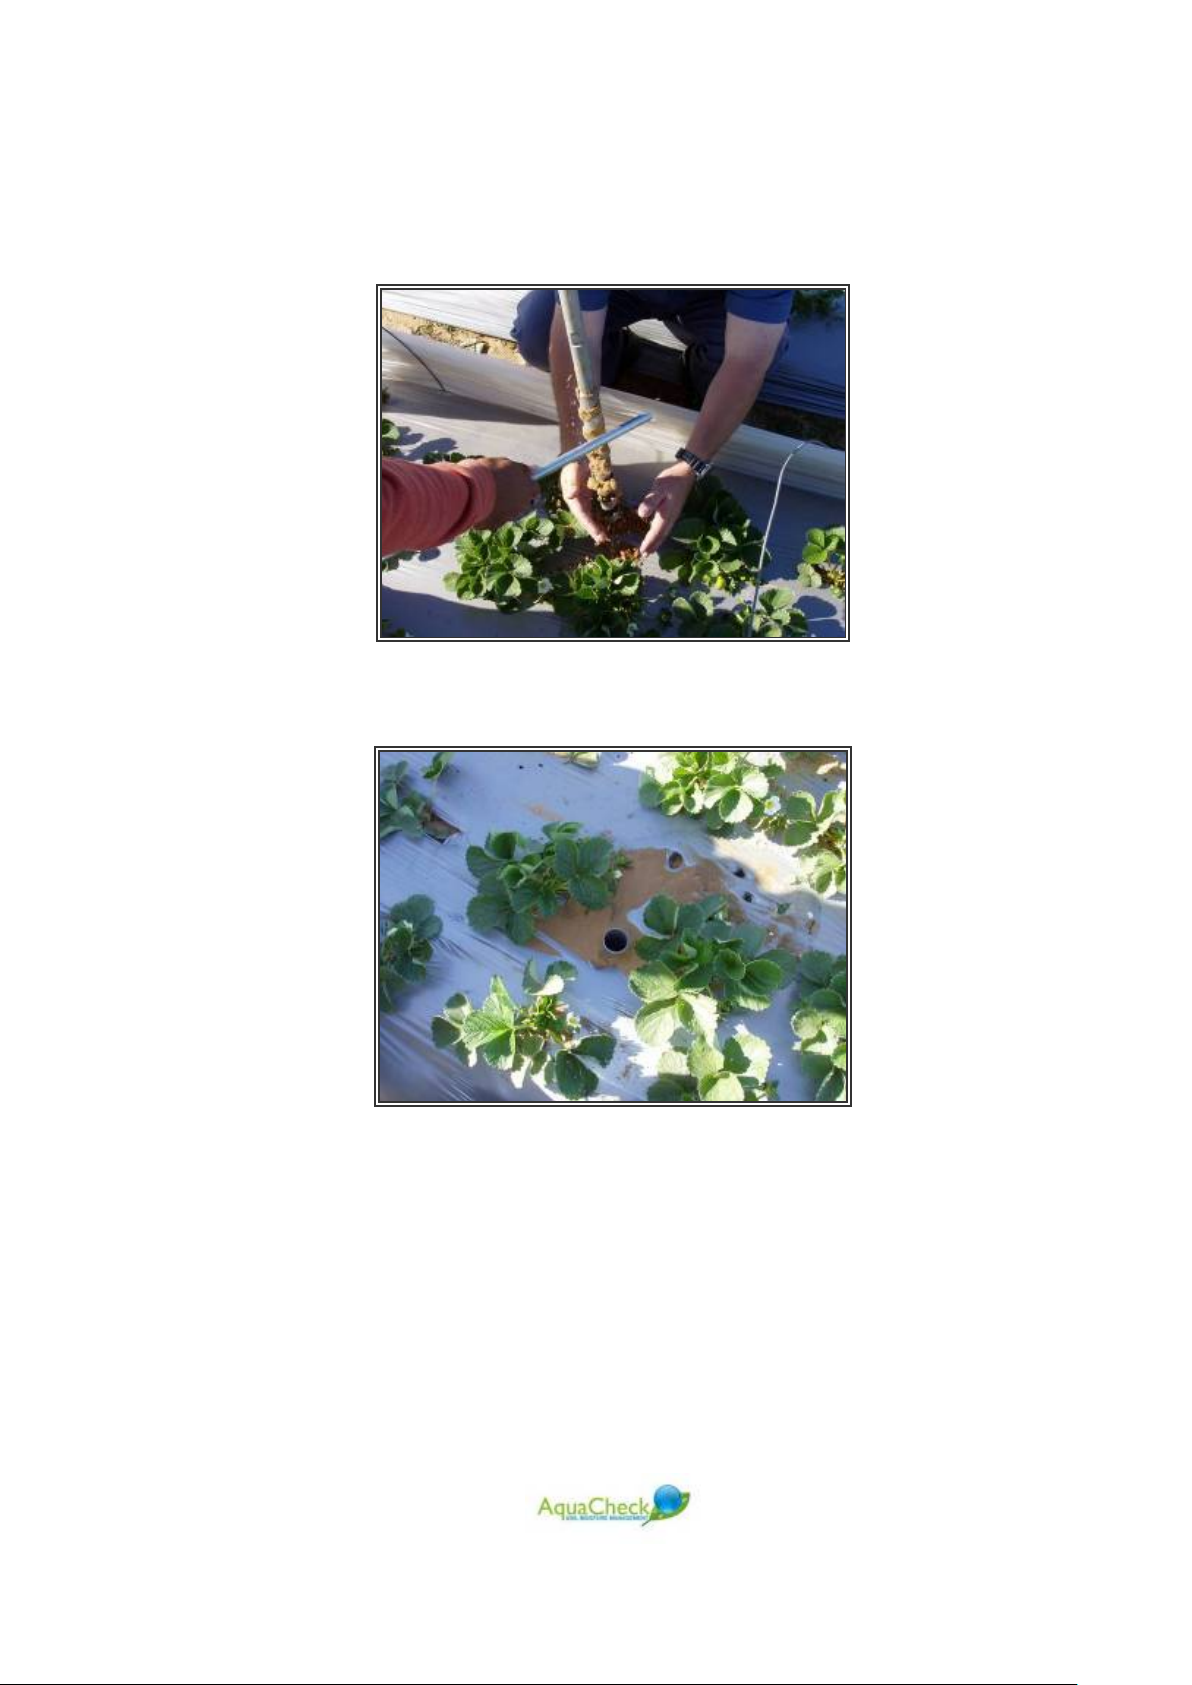
On each extraction, the auger is emptied into a bucket. When the desired depth is
reached, the probe can be lowered into the hole to test if the appropriate depth has
been achieved.
Figure 7: Collecting sand from the augured hole
Figure 8: A good fitting access tube
30
Page 31

Figure 9: Wetting the profile
If the profile has been wetted sufficiently, the wall of the hole should remain in
tacked and allow for easy access. With some installations and after the probe has
been lowered into the hole, there might be a thin cavity between the probe shaft and
hole wall. In this case a little bit of sand is “washed” into the cavities together with
water in order to ensure a tight fit.
13.2 Using the “Slurry Technique”
The use of the slurry technique is recommended for most soil types. In extreme
clayey soils and specifically for installations in centre pivots, it is however important
to consider the impact of the subsequent “wetting front” when determining the readily
available soil water limits.
The slurry technique for installation in most soils is recommended due to the
sensitivity of capacitance based probes in general for air gaps between the access
tube and soil. When the slurry method is used in the correct way, there is very little
chance for air gaps forming between the access tube and soil.
31
Page 32
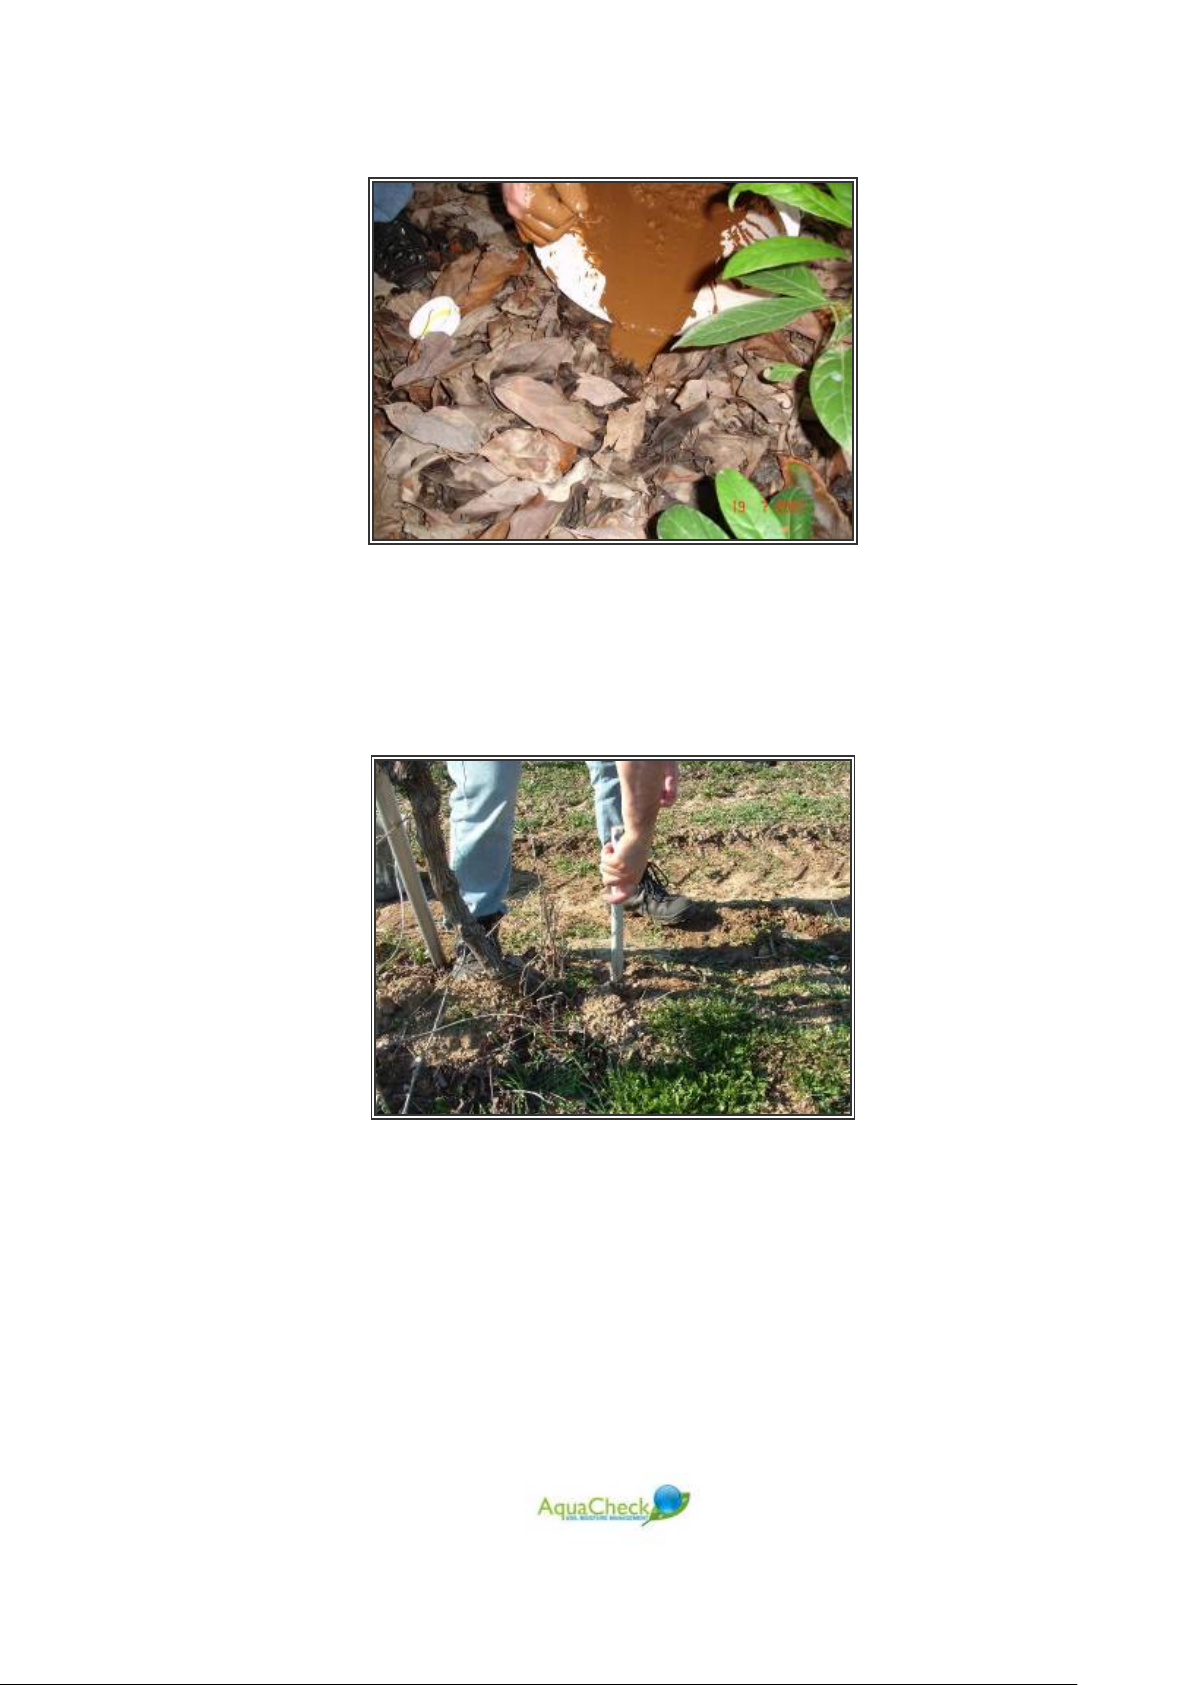
Figure 10: Pouring slurry from the augured hole back into the hole
A slightly oversized hole is drilled to the desired depth using the supplied auger. It is
important to keep the auger as straight as possible. Try not to “ream” the access
hole. The maximum space between the access tube and augured hole wall should
not be more than 2 mm.
Figure 11: Increasing the viscosity of the slurry
The excess soil from the hole is poured into a bucket and mixed with the desired
amount of water to make a good slurry mix. After the hole has been drilled to the
desired depth, the slurry mix is poured back into the hole. Sometime it is also
beneficial if the auger is used to “enhance” the viscosity of the slurry by moving the
auger several times up and down the slurry filled access hole.
32
Page 33

Figure 12: An installed MobiCheck access tube
The probe is inserted into the hole and as the probe is pushed down to the correct
depth, the excess slurry will be forced upward and eventually be pushed out.
Remove the excess slurry from the service as it may influence penetration of
irrigation and rain water directly next to the probe.
Figure 13: A typical hand-auger bit
Figure 14: A typical hand-auger T-handle bar
33
Page 34
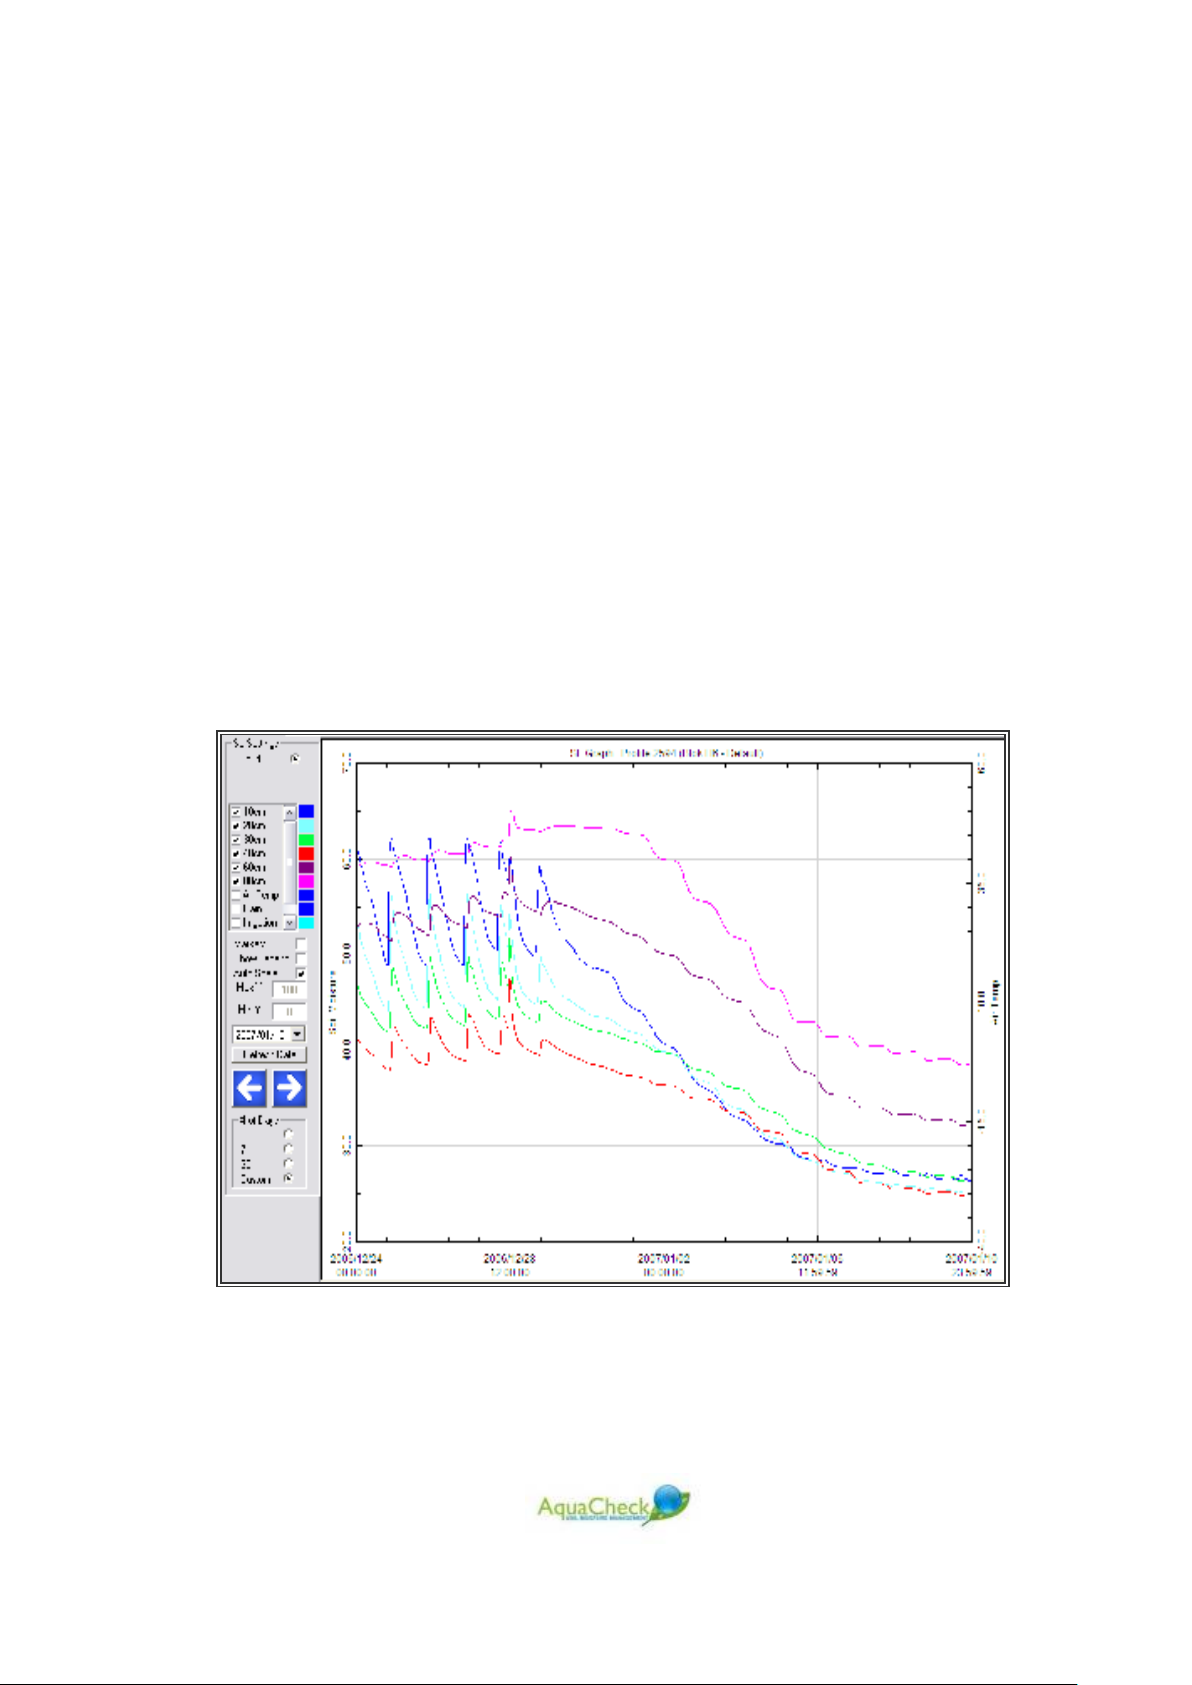
14 REFILL LIMITS
It is important to distinguish between the default calibration of the sensors and the
setting of upper and lower readily available water limits for each probe after
installation. (This will be covered in detail in the agronomy principles section).
Once the probe is installed, you need to calibrate the readings obtained from the
probe against relative soil moisture content. In essence, a depletion curve is derived
and by monitoring one or several typical wetting-drying cycles, an upper and lower
“refill” limit is obtained. If the service has been requested, then this function is
usually performed by a contracted agronomist.
The adjacent graphs are examples of a typical depletion cycle which has been
implemented after first having recorded how the farmer was irrigating as a standard
practice. The first graph shows the separate depth levels or data from sensors
positioned at various depths. The second graph is the combined result of all the
selected sensors for a specific probe.
Figure 15: A typical separate level graph showing a depletion cycle
34
Page 35
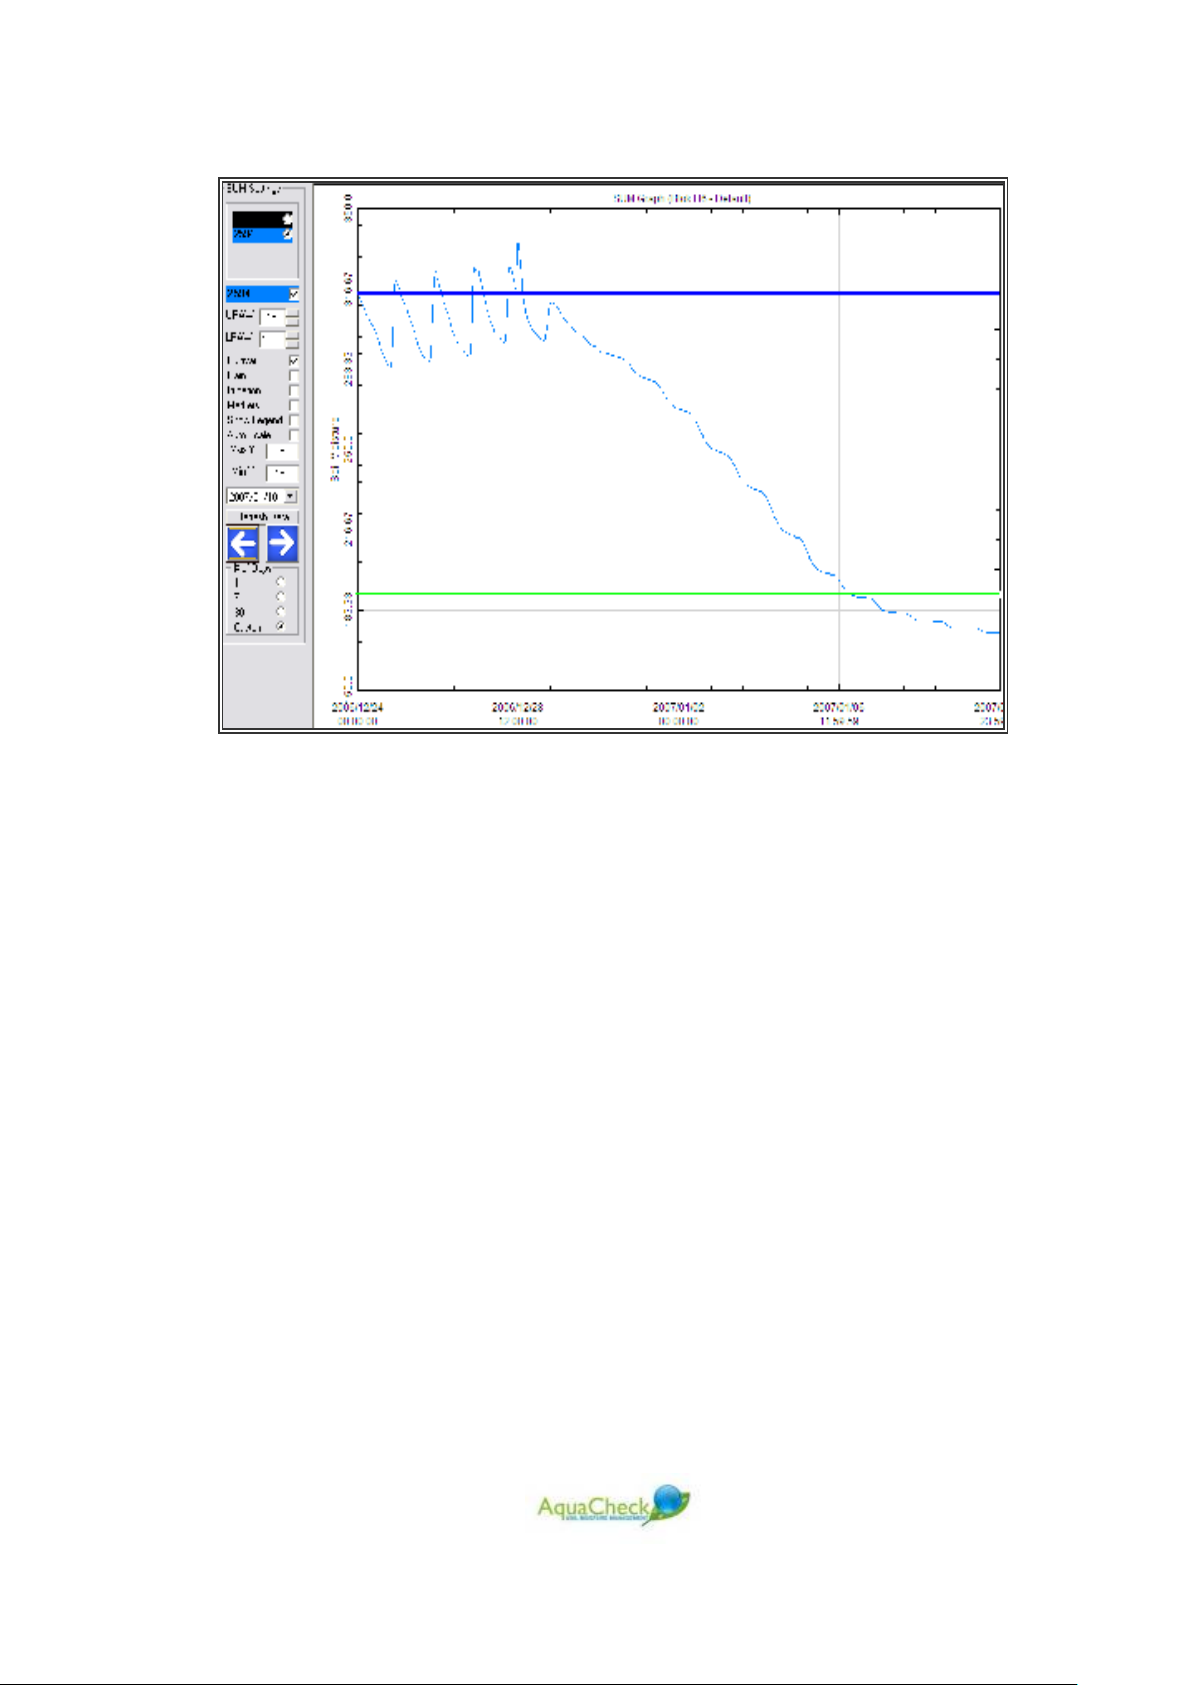
Figure 16: A typical summed graph showing a depletion cycle
On the second graph an upper refill limit and lower refill limit can be seen. These are
the limits within which the grower should under normal circumstances manage his
soil moisture regime.
Once installation of the probe has been completed and the profile has stabilized, the
next step is to determine the upper and lower refill limits. Determining the upper and
lower limits is really the key to successful and accurate irrigation scheduling
techniques.
35
Page 36

15 Getting Started
The following steps are recommended for easy setup and seamless first-time
operation.
15.1 STEP 1 – Setup logger
Charge the logger for at least 24 hours prior to installation.
Set date & time on the logger.
Populate the logger with the appropriate probe ID’s. heading 10.2.1
15.2 STEP 2 - Activate probe (s)
Remove the Probe Cover by squeezing lightly on the opposite sides of the
two locater knobs at the bottom edge of the probe cover.
Turn the Probe Head 45
knobs and remove it from the connector assembly.
Insert the battery board (PCB) into 14-pin connector
Connect the battery pack to the terminal on the battery PCB.
Carefully position the probe head over the battery pack, push towards the
connector assembly so that the probe fits over the connector assembly.
Make sure the o’ring set is well lubricated (only use approved lubrication as
may “off the shelve” lubricants have a corrosive effect on the o’rings.
Turn probe head (about 45
fitting into the locator holes).
Each probe needs about 2 minutes to initiate the activation sequence.
Use the RF Utility tool to confirm all the settings. (In the absence of a RF
Utility Toolkit, use the profile log option on the logger menu to download all
obsolete logs and to set the date time.
0
to dislocate the probe head from the two locator
0
) until it slots into position (with the locator knobs
15.3 STEP 3 – Installing the Software
Insert the supplied AquaCheck labeled mini-cd into your cd/dvd drive
Run the SETUP file
The CropGraph program will guide you through several installation steps
Once installation is finished, go to the Info tab, click on ProductKey and
complete the Software registration form.
36
Page 37

Figure 17: ProductKey Menu
Figure 18: Software registration form
If you are using Microsoft Outlook or Outlook express, an email with your
registration form will automatically be created and added to your outbox.
If you are using any other email program, please use the provided Export
(txt) button and save the registration file in your preferred location. Send an
email to
[email protected] with the attached file for registration.
Your email will be returned within 48 hours (excluding weekends) with your
product unlock key. This 20-digit key needs to be filled into the open space
next to the Product Key section.
37
Page 38

15.4 STEP 4 – Setting up blocks
Go to the CropGraph manual page 11 for instructions
15.5 STEP 5 – Connecting the logger to the CropGraph software
Make sure the logger is fully charged – the LCD on the logger should display
the following flashing message while still connected to main power supply:
“CHARGE COMPLETE”
Go to the CropGraph manual page 9 and follow the instructions
Make sure the logger is connected to the CropGraph Software (PC). If a
successful connection has been made, it should show
RF Download console has been activated.
If it does not show
com port has been selected. Make sure that the selected com port is indeed
the one associated with the Serial or USB port to which the cable has been
connected.
Make sure the logger Date/Time
default value is GMT +2)
Connected the most common reason is that the wrong
has been synchronized with your PC. (The
Connected when the
15.6 STEP 6 – Setting up groups on the logger
Go to page 11 of this manual and follow the recommended steps.
15.7 STEP 7 – Taking the first reading
Line probes up and identify probe serial numbers – make sure the probe
numbers correspond to the probe numbers used when the blocks were
created;
Position probes in such a way that the shaft of each probe is at least 100mm
away from the nearest object.
Make sure that at least 30 minutes have passed since the probes were
initiated.
To start downloading data from the probes go to page 11 of this manual and
follow the recommended steps.
Connect the logger to the PC (and CropGraph) software.
Make sure it says
download menu option has been selected.
Initiate the download process by hitting the Dump data button.
Go to page 9 of the CropGraph menu and follow the recommended steps to
import data to CropGraph.
Connected, in the down load console screen after the RF
38
 Loading...