

Next Generation OP07
V+
OUT
NC
4V– (CASE)
V
OS
TRIM
V
OS
TRIM 1
–IN 2
+IN 3
OP07
NC = NO CONNECT
a
Ultralow Offset Voltage Operational Amplifier
FEATURES
Outstanding Gain Linearity
Ultrahigh Gain 5000 V/mV Min
Low V
Over Temperature 60 V Max
OS
Excellent TCVos 0.3 V/ⴗC Max
High PSRR 3 V/V Max
Low Power Consumption 60 mW Max
Fits OP07, 725,108A/308A, 741 Sockets
Available in Die Form
GENERAL DESCRIPTION
The OP77 significantly advances the state-of-the-art in precision
op amps. The OP77’s outstanding gain of 10,000,000 or more
is maintained over the full 10 V output range. This exceptional
gain-linearity eliminates incorrectable system nonlinearities
common in previous monolithic op amps, and provides superior
performance in high closed-loop gain applications. Low initial
drift and rapid stabilization time, combined with only 50
V
OS
mW power consumption, are significant improvements over
previous designs. These characteristics, plus the exceptional
of 0.3 µV/°C maximum and the low VOS of 25 µV maxi-
TCV
OS
mum, eliminates the need for V
adjustment and increases
OS
system accuracy over temperature.
PSRR of 3 µV/V (110 dB) and CMRR of 1.0 µV/V maximum
virtually eliminate errors caused by power supply drifts and
common-mode signals. This combination of outstanding characteristics makes the OP77 ideally suited for high-resolution
instrumentation and other tight error budget systems.
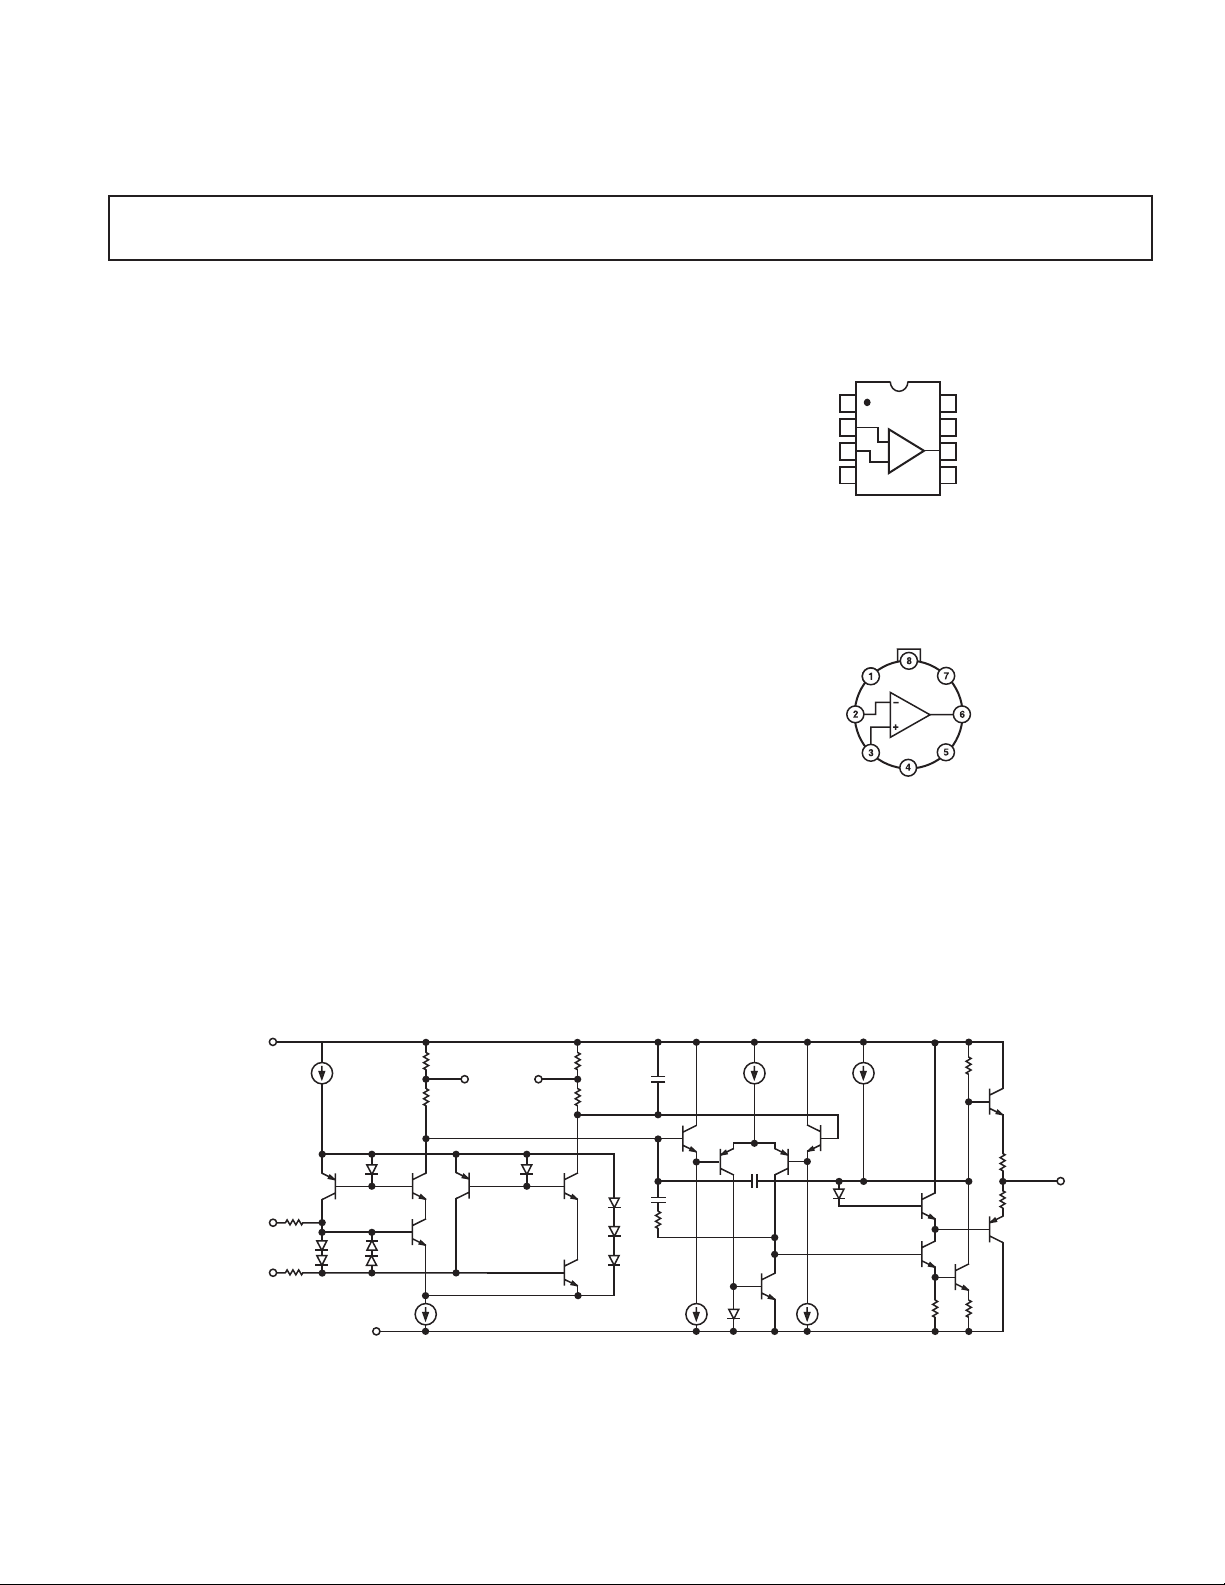
PIN CONNECTIONS
Epoxy Mini-Dip (P-Suffix)
8-Pin Hermetic DIP
TRIM
V
OS
–IN
+IN
1
OP07
2
3
4
NC = NO CONNECT
8
V
TRIM
OS
7
V+
6
OUT
5
NCV–
TO-99
(J-Suffix)
OP77
V+
NOTE:
R2A AND R2B ARE
ELECTRONICALLY
ADJUSTED ON CHIP
AT FACTORY.
NONINVERTING
INPUT
INVERTING
INPUT
REV. B
Information furnished by Analog Devices is believed to be accurate and
reliable. However, no responsibility is assumed by Analog Devices for its
use, nor for any infringements of patents or other rights of third parties that
7
3
2R3R4
Q5
Q21
Q22
Q7
V–
R2A
(OPTIONAL
NULL)
1
R1A
Q6
Q3
Q1
Q23
Q24
4
may result from its use. No license is granted by implication or otherwise
under any patent or patent rights of Analog Devices.
8
Q8
Q4
Q2
R2B
R1B
Q27
Q26
Q25
C1
C2
Q13
Q10
Q12
Q17
Q14
Q9
Q11
C3
R5
Q16
Q15
R7
Q19
R9
OUTPUT
6
R10
Q20
Q18
R8
R6
One Technology Way, P.O. Box 9106, Norwood, MA 02062-9106, U.S.A.
Tel: 781/329-4700 www.analog.com
Fax: 781/326-8703 © Analog Devices, Inc., 2002

OP77–SPECIFICATIONS
ELECTRICAL SPECIFICATIONS
(@ Vs = ⴞ15 V, TA = 25ⴗC, unless otherwise noted.)
OP77A
Parameter Symbol Conditions Min Typ Max Unit
INPUT OFFSET VOLTAGE V
OS
10 25 µV
LONG-TERM INPUT OFFSET
VOLTAGE STABILITY
INPUT OFFSET CURRENT I
INPUT BIAS CURRENT I
INPUT NOISE VOLTAGE
INPUT NOISE VOLTAGE DENSITY
1
2
DVOS/Time 0.2 µV/Mo
OS
B
e
np-p
2
e
n
0.1 Hz to 10 Hz 0.35 0.6 µV p-p
fO = 10 Hz 10.3 18.0 V
f
= 100 Hz 10.0 13.0
O
–0.2 1.2 2.0 nA
0.3 nA
fO = 1000 Hz 9.6 11.0
INPUT NOISE CURRENT
INPUT NOISE CURRENT DENSITY
2
i
np-p
2
i
n
0.1 Hz to10 Hz 14 30 pA p-p
fO = 10 Hz 0.32 0.80 pA/√Hz
= 100 Hz 0.14 0.23
f
O
fO = 1000 Hz 0.12 0.17
INPUT RESISTANCE
Differential Mode
Common Mode R
3
R
IN
INCM
26 45 MV
200 GV
INPUT VOLTAGE RANGE IVR ±13 ± 14 V
COMMON-MODE
REJECTION RATIO CMRR VCM = ±13 V 0.1 1.0 µV/V
POWER SUPPLY
REJECTION RATIO PSRR VS = ±3 V to ±18 V 0.7 3 µV/V
LARGE-SIGNAL
VOLTAGE GAIN A
OUTPUT VOLTAGE SWING V
VO
O
RL ≥ 2 kΩ ≥ VO = ±10V 5000 12000 V/mV
RL ≥ 10 kΩ±13.5 ±14.0 V
≥ 2 kΩ±12.5 ±13.0
R
L
RL ≥ 1 kΩ±12.0 ±12.5
SLEW RATE
CLOSED-LOOP BANDWIDTH
OPEN-LOOP OUTPUT RESISTANCE R
POWER CONSUMPTION P
2
2
SR RL ≥ 2 kΩ 0.1 0.3 V/µs
BW A
O
d
= +1 0.4 0.6 MHz
VCL
60 Ω
VS = ±15 V, No Load 50 60 mW
VS = ±3 V, No Load 3.5 4.5
OFFSET ADJUSTMENT RANGE RP = 20 kΩ±3mV
NOTES
1
Long-Term Input Offset Voltage Stability refers to the averaged trend line of VOS vs. Time over extended periods after the first 30 days of operation. Excluding the
initial hour of operation, changes in VOS during the first 30 operating days are typically 2.5 µV.
2
Sample tested.
3
Guaranteed by design.
–2–
REV. B

SPECIFICATIONS
OP77
ELECTRICAL SPECIFICATIONS
(@ Vs = ⴞ15 V, –55ⴗC ≤ TA ≤ 125ⴗC, unless otherwise noted.)
OP77A
Parameter Symbol Conditions Min Typ Max Unit
INPUT OFFSET VOLTAGE V
AVERAGE INPUT OFFSET
VOLTAGE DRIFT
1
INPUT OFFSET CURRENT I
AVERAGE INPUT OFFSET
CURRENT DRIFT
2
INPUT BIAS CURRENT I
AVERAGE INPUT BIAS
CURRENT DRIFT
2
OS
TCV
OS
TCI
B
TCI
OS
OS
–0.2 2.4 4 nA
B
25 60 µV
0.1 0.3 µV/°C
0.5 2.2 nA
1.5 25 pA/°C
8 25 pA/°C
INPUT VOLTAGE RANGE IVR ±13 ±13.5 0.6 V
COMMON-MODE
REJECTION RATIO CMRR VCM = ±13 V 0.1 1.0 µV/V
POWER SUPPLY
REJECTION RATIO PSRR VS = ±3 V to ±18 V 1 3 µV/V
LARGE-SIGNAL
VOLTAGE GAIN A
OUTPUT VOLTAGE SWING V
POWER CONSUMPTION P
NOTES
1
OP77A: TCVCS is 100% tested.
2
Guaranteed by design.
VO
O
d
RL ≥ 2 kΩ ≥ VO = ±10 V 2000 6000 V/mV
RL ≥ 10 kΩ±12 ±13.0 V
VS = ±15 V, No Load 60 75 mW
REV. B
–3–

OP77–SPECIFICATIONS
ELECTRICAL CHARACTERISTICS
(@ Vs = ⴞ15 V, TA = 125ⴗC, unless otherwise noted.)
OP77E OP77F
Parameter Symbol Conditions Min Typ Max Min Typ Max Unit
INPUT OFFSET VOLTAGE VOS 10 25 20 60 µV
LONG-TERM
STABILITY
INPUT OFFSET CURRENT I
INPUT BIAS CURRENT I
INPUT NOISE VOLTAGE
1
2
VOS/Time 0.3 0.4 µV/Mo
0.3 1.5 0.3 2.8 nA
–0.2 1.2 2.0 –0.2 1.2 2.8 nA
p-p
e
OS
B
np-p
0.1 Hz to 10 Hz 0.35 0.6 0.38 0.65 µV
INPUT NOISE
VOLTAGE DENSITY e
INPUT NOISE CURRENT
2
i
np-p
n
fO = 10 Hz 10.3 18.0 10.5 20.0 nV/X/i
f
= 100 Hz
O
f
= 1000 Hz 9.6 11.0 9.8 11.5
O
0.1 Hz to 10 Hz 14 30 15 35 pA
2
10.0 13.0 10.2 13.5
p-p
INPUT NOISE
CURRENT DENSITY i
INPUT RESISTANCE
Differential Mode
3
Common Mode R
n
R
IN
INCM
fO = 10 Hz 0.32 0.80 0.35 0.90 pA√Hz
= 100 Hz
f
O
f
= 1000 Hz 0.12 0.17 0.13 0.18
O
2
0.14 0.23 0.15 0.27
26 45 18.5 45 M⍀
200 200 G⍀
INPUT RESISTANCE
Common Mode R
INCM
200 200 G⍀
INPUT VOLTAGE RANGE IVR ⫾13 ⫾14 ⫾13 ⫾14 V
COMMON-MODE
REJECTION RATIO CMRR V
= ⫾13 V 0.1 1.0 0.1 1.6 µV/V
CM
POWER SUPPLY
REJECTION RATIO PSRR V
= 3 V to 18 V 0.7 3.0 0.7 3.0 µV/V
S
LARGE-SIGNAL
VOLTAGE GAIN A
VO
RL ≥ 2 k⍀ 5000 12000 2000 6000 V/mV
OUTPUT VOLTAGE
SWING V
SLEW RATE
CLOSED-LOOP
BANDWIDTH
2
2
O
SR RL ≥ 2 k⍀ 0.1 0.3 0.1 0.3 V/µs
BW A
RL ≥ 10 k⍀⫾13.5 ⫾14.0 ⫾13.5 ⫾14.0 V
R
≥ 2 k⍀⫾12.5 ⫾13.0 ⫾12.5 ⫾13.0
L
≥ 1 k⍀⫾12.0 ⫾12.5 ⫾12.0 ⫾12.5
R
L
1 0.4 0.6 0.4 0.6 MHz
VCL
OPEN-LOOP OUTPUT
RESISTANCE R
O
60 60 ⍀
POWER CONSUMPTION Pd VS = ⫾15 V, No Load 50 60 50 60
V
= ⫾3 V, No Load 3.5 4.5 3.5 4.5 mW
S
OFFSET ADJUSTMENT
RANGE Rp = 20 kn ⫾3 ⫾3mV
NOTES
1
Long-Term Input Offset Voltage Stability refers to the averaged trend line of VOS vs. Time over extended periods after the first 30 days of operation. Excluding the
initial hour of operation, changes in VOS during the first 30 operating days are typically 2.5 µV.
2
Sample tested.
3
Guaranteed by design.
–4–
REV. B

SPECIFICATIONS
OP77
ELECTRICAL CHARACTERISTICS
(@ Vs = ⴞ15 V, –25ⴗC ≤ TA ≤ +85ⴗC for OP77E/FJ and OP77E/FZ, unless otherwise noted.)
OP77E OP77F
Parameter Symbol Conditions Min Typ Max Min Typ Max Unit
INPUT OFFSET VOLTAGE V J. Z Packages 10 45 20 100 µV
10 55 20 100
AVERAGE INPUT OFFSET TVC
VOLTAGE DRIFT
INPUT OFFSET CURRENT I
AVERAGE INPUT OFFSET
CURRENT DRIFT
INPUT BIAS CURRENT I
AVERAGE INPUT BIAS
CURRENT DRIFT
1
OS
2
2
TCI
B
TCI
OS
OS
B
J. Z Packages 0.1 0.3 0.2 0.6 µV/°C
0 3 0.6 0.4 1.0
0.5 2.2 0.5 4.5 nA
1.5 4.0 1.5 85 pA/⬚C
E, F -0.2 2.4 4.0 -0.2 2.4 6.0 nA
8 40 15 60 pA/°C
INPUT VOLTAGE RANGE IVR ⫾13.0 ⫾13.5 ⫾13.0 ⫾13.5 V
COMMON-MODE
REJECTION RATIO CMRR V
= ⫾13 V 0.1 1.0 0.1 3.0 pVlV
CM
POWER SUPPLY
REJECTION RATIO PSRR V
= ⫾3 V to ⫾18 V 1.0 3.0 1.0 5.0 µV/V
S
LARGE-SIGNAL
VOLTAGE GAIN A
OUTPUT VOLTAGE SWING V
POWER CONSUMPTION P
NOTES
1
OP77E: TCVOS is 100% tested on J and Z packages.
2
Guaranteed by end-point limits.
VO
O
d
RL ≥ 2 kΩ 2000 6000 1000 4000 V/mV
= ⫾10 V
V
O
RL ≥ 2 kΩ ⫾12 ⫾13.0 ⫾12 ⫾13.0 V
VS = ⫾15 V, No Load 60 75 60 75 mW
REV. B
–5–

OP77–SPECIFICATIONS
WAFER TEST LIMITS
(@ Vs = ⴞ15 V, TA = 25ⴗC, for OP77N devices, unless otherwise noted.)
OP77N
Parameter Symbol Conditions Limit Unit
INPUT OFFSET VOLTAGE V
INPUT OFFSET CURRENT I
INPUT BIAS CURRENT I
OS
OS
B
40 µV Max
2.0 nA Max
±2 nA Max
INPUT RESISTANCE
Differential Mode R
IN
26 MΩ Min
INPUT VOLTAGE RANGE IVR ±13 V Min
COMMON-MODE REJECTION RATIO CMRR VCM = ±13 V 1 µV/V Max
POWER SUPPLY REJECTION RATIO PSRR VS = ±3 V to ±18 V 3 µV/VMax
OUTPUT VOLTAGE SWING V
LARGE-SIGNAL VOLTAGE GAIN A
O
VO
RL = 10 kΩ±13.5 V Min
R
= 2 kΩ±12.5
L
R
= 1 kΩ±12.0
L
RL = 2 kΩ 2000 V/mV Min
= ±10 V
V
O
DIFFERENTIAL INPUT VOLTAGE ±30 V Max
POWER CONSUMPTION P
NOTES
1
Guaranteed by design.
2
Electrical tests are performed at wafer probe to the limits shown. Due to variations in assembly methods and normal yield loss, yield after packaging is not guaranteed
for standard product dice. Consult factory to negotiate specifications based on dice lot qualification through sample lot assembly and testing.
d
V
= 0 V 60 mW Max
OUT
TYPICAL ELECTRICAL CHARACTERISTICS
(@ Vs = ⴞ15 V, TA = 25ⴗC, unless otherwise noted.)
OP77N
Parameter Symbol Conditions Limit Unit
AVERAGE INPUT OFFSET VOLTAGE DRIFT TCV
NULLED INPUT OFFSET VOLTAGE DRIFT TCV
AVERAGE INPUT OFFSET CURRENT DRIFT TCI
OS
OSn
OS
RS = 50 Ω 0.1 µV/OC
RS = 50 Ω, RP = 20 kΩ 0.1 µV/°C
0.5 pA/°C
SLEW RATE SR RL ≥ 2 kΩ 0.3 V/µs
BANDWIDTH BW A
+ 1 0.6 MHz
VCL
–6–
REV. B

OP77
WARNING!
ESD SENSITIVE DEVICE
ABSOLUTE MAXIMUM RATINGS
1
Supply Voltage . . . . . . . . . . . . . . . . . . . . . . . . . . . . . . . . ±22 V
Differential Input Voltage . . . . . . . . . . . . . . . . . . . . . . . ±30 V
Input Voltage
2
. . . . . . . . . . . . . . . . . . . . . . . . . . . . . . . . ± 22 V
Output Short-Circuit Duration . . . . . . . . . . . . . . . . .Indefinite
Storage Temperature Range
J and Z Packages . . . . . . . . . . . . . . . . . . . . –65°C to +150°C
Operating Temperature Range
OP77A . . . . . . . . . . . . . . . . . . . . . . . . . . . –55°C to +125°C
OP77E, OPP77F (J, Z) . . . . . . . . . . . . . . . . –25°C to +85°C
Junction Temperature (T
) . . . . . . . . . . . . . –65°C to +150°C
j
Lead Temperature (Soldering, 60 sec.) . . . . . . . . . . . . . 300°C
NOTES
1
Absolute Maximum Ratings apply to both DICE and packaged parts, unless
otherwise noted.
2
For supply voltages less than ± 22 V, the absolute maximum input voltage is
equal to the supply voltage.
Package Type
ⴱ
jA
jC
Unit
TO-99 (J) 150 18 °C/W
8-Lead Hermetic DIP (Z) 148 16 °C/W
NOTE
ⴱ
jA is specified for worst-case mounting conditions, i.e., jA is specified for
device in socket for TO, CERDIP, P-DIP, and PLCC packages; jA is specified
for device soldered to printed circuit board for SO package.
BONDING DIAGRAM
1. BALANCE
2. INVERTING INPUT
3. NONINVERTING INPUT
4. V-
6. OUTPUT
7. V+
8. BALANCE
DIE SIZE 0.093 ⴛ 0.057 inch, 5301 sq. mm
(2.36
ⴛ
1.45 mm, 3.42 sq. mm)
ORDERING GUIDE
Package Options Operating
CERDIP
*
Temperature
TO-99 8-Lead Range
OP77AZ MIL
OP77EJ OP77EZ IND
OP77FJ OP77FZ IND
ⴱ
Not for new designs; obsolete April 2002.
For Military processed devices, please refer to the Standard
Microcircuit Drawing (SMD) available at
www.dscc.dla.mil/programs/milspec/default.asp
SMD Part Number ADI Equivalent
5962-87738012A OP77BRCMDA
5962-8773802GA OP77AJMDA
5962-8773802PA OP77AZMDA
CAUTION
ESD (electrostatic discharge) sensitive device. Electrostatic charges as high as 4000 V readily
accumulate on the human body and test equipment and can discharge without detection. Although
the OP77 features proprietary ESD protection circuitry, permanent damage may occur on devices
subjected to high-energy electrostatic discharges. Therefore, proper ESD precautions are
recommended to avoid performance degradation or loss of functionality.
REV. B
–7–

OP77
MIN
TIME – SEC
ABSOLUTE CHANGE IN INPUT OFFSET
VOLTAGE – V
0
0
VS = ⴞ15V
5
10
15
20
25
30
10 20 30 40 50 60 70
DEVICE IMMERSED IN
70ⴗC OIL BATH (20 UNITS)
MAX
AVE
-Typical Performance Characteristics
2
1
= 0V)
OUT
0
INPUT VOLTAGE – V
–1
(NULLED TO 0 @V
–2
OUTPUT VOLTAGE – V
TPC 1. Gain Linearity (Input
Voltage vs. Output Voltage)
30
20
10
0
–10
–20
CHANGE IN OFFSET VOLTAGE – V
–30
–35 –15 5 25 45 65 85 105 125
–55
J, Z PACKAGES
+0.3V/ⴗC
–0.3V/ⴗC
TEMPERATURE – ⴗC
TPC 4. Untrimmed Offset
Voltage vs. Temperature
VS = ⴞ15V
T
= 25ⴗC
A
R
= 10k⍀
L
50–5–10
MEAN
S.D.
25
VS = ⴞ15V
20
15
10
OPEN-LOOP GAIN – V/V
5
10
0
–55
–15
–35
TEMPERATURE – ⴗC
5 25 45 65 85 105 125
TPC 2. Open-Loop Gain vs.
Temperature
4
3
2
1
0
–1
–2
–3
CHANGE IN INPUT OFFSET VOLTAGE – V
–4
0.5 1 1.5 2 2.5 3 3.5
0
TIME AFTER POWER SUPPLY TURN-ON – MINUTES
VS = ⴞ15V
T
= 25ⴗC
A
TPC 5. Warm-Up Drift
16
T
= 25ⴗC
A
R
= 2k⍀
L
12
8
4
OPEN-LOOP GAIN – V/V
0
0 ⴞ5 ⴞ10 ⴞ15 ⴞ20
POWER SUPPLY VOLTAGE – V
TPC 3. Open-Loop Gain vs.
Power Supply Voltage
TPC 6. Offset Voltage Change
Due to Thermal Shock
100
80
60
40
20
CLOSED-LOOP GAIN – dB
0
–20
10
100 1k 10k 10k 10M1M
FREQUENCY – Hz
TPC 7. Closed-Loop Response for
Various Gain Configurations
VS = ⴞ15V
T
= 25ⴗC
A
160
140
120
100
80
60
40
OPEN-LOOP GAIN – dB
20
0
0.01
0.1 1 10 100 1k 10k 100k 1M
FREQUENCY – Hz
VS = ⴞ15V
T
= 25ⴗC
A
TPC 8. Open-Loop Gain/Phase
Response
–8–
0
45
90
135
180
150
140
130
120
110
CMMR –dB
100
90
80
1
10 100 1k 10k 100k
FREQUENCY – Hz
TA = 25ⴗC
TPC 9. CMRR vs. Frequency
REV. B

OP77
130
120
110
100
PSRR – dB
90
80
70
60
0.1
1.0 10 100 1k 10k
FREQUENCY – Hz
TA = 25ⴗC
TPC 10. PSRR vs. Frequency
10
VS = ⴞ15V
T
= 25ⴗC
A
1.0
RMS NOISE – mV
0.1
100
1k 10k 100k
FREQUENCY – Hz
TPC 13. Input Wideband Noise vs.
Bandwidth (0.1 Hz to Frequency
Indicated)
4
VS = ⴞ15V
3
2
1
INPUT BIAS CURRENT – nA
0
–50
0 50 100
TEMPERATURE – ⴗC
TPC 11. Input Bias Current
vs. Temperature
1000
100
INPUT NOISE VOLTAGE – nV/ Hz
10
1
1
RS1 = RS2 = 200kV
THERMAL NOISE OF SOURCE
RESISTORS INCLUDED
RS = 0
VS = ⴞ15V
= 25ⴗC
T
A
10 100 1k
FREQUENCY – Hz
EXCLUDED
TPC 14. Total Input Noise
Voltage vs. Frequency
2.0
VS = ⴞ15V
1.5
1.0
0.5
INPUT OFFSET CURRENT – nA
0
–50
0 50 100
TEMPERATURE – ⴗC
TPC 12. Input Offset Current
vs. Temperature
32
28
24
20
16
12
8
PEAK-TO-PEAK AMPLITUDE – V
4
0
1k
10k 100k 1M
FREQUENCY – Hz
VS = ⴞ15V
T
= 25ⴗC
A
TPC 15. Maximum Output Swing
vs. Frequency
100
TA = 25ⴗC
10
POWER CONSUMPTION – mW
0
010203040
TOTAL SUPPLY VOLTAGE, V+ TO V – V
TPC 16. Power Consumption vs.
Power Supply
REV. B
20
VS = ⴞ15V
T
= 25ⴗC
A
V
= ⴞ10mV
IN
15
10
5
MAXIUM OUTPUT – VOLTS
0
100 1k 10k
LOAD RESISTANCE TO GROUND – ⍀
POSITIVE SWING
NEGATIVE SWING
TPC 17. Maximum Output Voltage
vs. Load Resistance
–9–
40
35
30
25
20
OUTPUT SHORT-CIRCUIT CURRENT – mA
15
04
123
TIME FROM OUTPUT BEING SHORTED –
MINUTES
VS = ⴞ15V
T
= 25ⴗC
A
TPC 18. Output Short-Circuit
Current vs. Time

OP77
R
L
1M⍀
V
X
10⍀
VIN = 10V
100k⍀
10k⍀
–10V
+10V
0V
V
X
V
Y
AVO 650V/mV
R
L
= 2k⍀
~
TYPICAL
PRECISION OP AMP
NOTES
1. GAIN NOT CONSTANT. CAUSES NONLINEAR ERRORS.
2. A
VO
SPEC IS ONLY PART OF THE SOLUTION.
3. CHECK THE OP AMP PERFORMANCE, ESPECIALLY AT TEMPERATURES.
200k⍀
50⍀
V
4000
V
O
O
OP77
V
=
OS
Figure 1. Typical Offset Voltage Test Circuit
2.5M⍀
100⍀
100⍀
INPUT REFERRED NOISE
2
3
V+
OP77
7
3.3k⍀
6
4
V–
V
=
25,000
OUTPUT
4.7F
10Hz FILTER)(
O
Figure 2. Optional Offset Nulling Circuit
INPUT
20k⍀
–
+
2
3
1
OP77
8
7
6
4
V–
V+
OUTPUT
Figure 5. Open-Loop Gain Linearity
Actual open-loop voltage gain can vary greatly at various output
voltages. All automated testers use endpoint testing and therefore
only show the average gain. This causes errors in high closedloop gain circuits. Since this is so difficult for manufacturers to
test, users should make their own evaluation. This simple test
circuit makes it easy. An ideal op amp would show a horizontal
scope trace.
Figure 3. Typical Low-Frequency Noise Test Circuit
100k⍀
+18V
+
*
10F
10⍀
7
6
4
10⍀
*
1 PER BOARD
0.1F
0.1F
10F
2
OP77
3
10k⍀10k⍀
*
+
–18V
Figure 4. Burn-In Circuit
V
Y
–10V
~
AVO 650V/mV
R
= 2k⍀
L
0V
+10V
V
X
Figure 6. Output Gain Linearity Trace
This is the output gain linearity trace for the new OP77. The
output trace is virtually horizontal at all points, assuring extremely
high gain accuracy. The average open-loop gain is truly impressive—approximately 10,000,000.
–10–
REV. B

OP77
APPLICATIONS INFORMATION
R2
1M⍀
0.1F
7
6
4
0.1F
R1
1k⍀
R3
1k⍀
R4
1M⍀
2
OP77E
3
+15V
–15V
Figure 7. Precision High-Gain Differential Amplifier
The high gain, gain linearity, CMRR, and low TCVos of the
OP77 make it possible to obtain performance not previously
available in single-stage very high-gain amplifier applications.
For best CMR,
RR1
must equal
2
RR3
. In this example,
4
with a 10 mV differential signal, the maximum errors are as listed
in Table I.
Bilateral Current Source
R1
V
IN
100k⍀
100k⍀
2
3
OP77
R2
Figure 9. Basic Current Source
R3
R1
V
IN
2
3
OP77
R4
R2
Figure 10. 100 mA Current Source
R3
1k⍀
6
R4
990⍀
+15V
6
–15V
I
< 15mA
OUT
R5
10⍀
2N2222
2N2907
R5
I
< 100mA
OUT
= VIN =
I
OUT
GIVEN R3 = R4 ⴙ R5, R1 = R2
R3
( )
R1 – R5
Table I. Maximum Errors
TYPE AMOUNT
COMMON-MODE VOLTAGE 0.01%/V
GAIN LINEARITY, WORST CASE 0.02%
TCVOS 0.003%/°C
TCI OS 0.008%/°C
R
F
10pF
+15V
0.1F
R
S
2
3
OP77
–15V
7
4
0.1F
6
100⍀
C
LOAD
OUTPUT
INPUT
Figure 8. Isolating Large Capacitive Loads
This circuit reduces maximum slew-rate but allows driving
capacitive loads of any size without instability. Because the boon
resistor is inside the feedback loop, its effect on output impedance is reduced to insignificance by the high open-loop gain
of the OP77.
These current sources will supply both positive and negative
current into a grounded load.
Note that
5
R
Z
O
=
+
54
RR
R
4
R
1
+
2
R
3
R
2
1
R
and that for ZO to be infinite,
REV. B
–11–

OP77
RR
54
+
must =
R
2
RR3
1
Precision Current Sinks
V+
R
L
I
O
V
IN
OP77
200⍀
IRF520
R1
1⍀
1W
V
IN
=
I
O
R1
V
> OV
IN
FULL SCALE OF 1V,
=
1A/V
I
O
Figure 11. Positive Current Sink
R1
OP77
200⍀
V
IN
IRF520
I
O
R
L
V
IN
=
I
O
R1
VIN > OV
V–
Figure 12. Positive Current Source
These simple high-current sinks require the load to float between
the power supply and the sink.
In these circuits, OP77’s high gain, high CMRR, and low TCV
OS
ensure high accuracy.
R1
1.8k⍀
2mA
15V
3
7
1N4579A
6.4V ⴞ5%
ⴞ5ppm/ⴗC
OP77
2
D1
6
4
R2
3.6k⍀
R3
6.4k⍀
= 10V
E
O
A
1.6
VCL
Figure 13. High Stability Voltage Reference
This simple bootstrapped voltage reference provides a precise 10 V
virtually independent of changes in power supply voltage, ambient temperature and output loading. Correct Zener operating
current of exactly 2 mA is maintained by R1, a selected 5 ppm/°C
resistor, connected to the regulated output. Accuracy is primarily determined by three factors: the 5 ppm/°C temperature
coefficient of D1, 1 ppm/°C ratio tracking of R2 and R3, and
operational amplifier V
errors.
OS
VOs errors, amplified by 1.6 (AVCL), appear at the output and
can be significant with most monolithic amplifiers. For example,
an ordinary amplifier with TCV
°C of output error while the OP77, with TCV
of 5 µV/°C contributes 0.8 ppm/
OS
of 0.3 µV/°C,
OS
contributes but 0.05 ppm/°C of output error, thus effectively
eliminating TCV
The high gain and low TCV
as an error consideration.
OS
assure accurate operation with
OS
inputs from microvolts to volts. In this circuit, the signal always
1k⍀
+15V
0.1F
2
7
–15V
4
6
0.1F
OP77E
V
IN
3
C1
30pF
D1
1N4148
2N4393
Figure 14. Precision Absolute Value Amplifier
The high gain and low TCVOS assure accurate operation with
inputs from microvolts to volts. In this circuit, the signal always
1k⍀
+15V
0.1F
2
7
–15V
4
0.1F
6
D2
R3
2k⍀
OP77E
3
V
OUT
0 < V
OUT
< 10V
appears as a common-mode signal to the op amps. The OP77E
CMRR of 1 V/V assures errors of less than 2 ppm.
–12–
REV. B

OP77
15V
+
10F
REF-01
22
REF-01
V
O
66
V
O
44
Figure 15. Low Noise Precision Reference
This circuit relies upon OP77’s low TCVOS and noise combined
with very high CMRR to provide precision buffering of the
averaged REF01 voltage outputs.
15V
0.1F
2
7
6
3
OP77
–15V
4
0.1F
1k⍀
V
IN
1N4148
RESET
2
REF-01
6
V
O
100⍀
4
100⍀
100⍀
OP77
0.1F
V
OUT
CH must be of polystyrene, Teflon*, or polyethylene to minimize
dielectric absorption and leakage. The droop rate is determined
by the size of C
*Teflon is a registered trademark of the Dupont Company
1k⍀
2N930
C
H
1k⍀
2
3
and the bias current of the AD820.
H
15V
0.1F
7
AD820
4
–15V
6
0.1F
V
OUT
Figure 16. Precision Positive Peak Detector
REV. B
–13–

OP77
C
C
R
F
6
100k⍀
D1
1N4148
V
OUT
+15V
0.1F
R
S
2
V
TH
1k⍀
V
R1
IN
2k⍀
7
OP77
3
4
0.1F
–15V
Figure 17. Precision Threshold Detector/Amplifier
When VIN < VTH, amplifier output swings negative, reverse
biasing diode D1. V
= VTH if RL= ∞ when VIN > VTH, the
OUT
loop closes,
VVVV
=+
OUT TH IN TH
– 1
()
R
F
+
R
S
CC is selected to smooth the response of the loop.
+15V
0.1F
2
V
IN
TRIM
REF-02
TEMP
GND
4
R
50k⍀
1.5k⍀
A
R
b1
R
bp
6
V
O
5
3
OP77
–15V
R
C
0.1F
V
OUT
Figure 18. Precision Temperature Sensor
Table II. Resistor Values
TCV
SLOPE (S) 10 mV/°C 100 mV/°C 10 mV/°F
OUT
TEMPERATURE –55°C to –55°C to –67°F to
RANGE +125°C +125°C +257°C
OUTPUT VOLTAGE –0.55 V to –5.5 V to –0.67 V to
RANGE +1.25 V +12.5V +2.57V
ZERO-SCALE 0 V @ 0°C 0 V @ 0°C 0 V @ 0⬚F
Ra (±1% Resistor) 9.09 kΩ 15 kΩ 7.5 kΩ
Rb1 (±1% Resistor) 1.5 kΩ 1.82 kΩ 1.21 kΩ
Rbp (Potentiometer) 200 Ω 500 Ω 200 Ω
Rc (±1% Resistor) 5.11 kΩ 84.5 kΩ 8.25 kΩ
–14–
REV. B

OUTLINE DIMENSIONS
(
)
Dimensions shown in inches and (mm).
OP77
0.160 (4.06)
0.115 (2.93)
0.048 (1.21)
0.042 (1.07)
0.020
(0.50)
PIN 1
0.210
(5.33)
MAX
0.022 (0.558)
0.014 (0.356)
0.048 (1.21)
0.042 (1.07)
R
0.430 (10.92)
0.348 (8.84)
8
14
0.100 (2.54)
BSC
0.070 (1.77)
0.045 (1.15)
3
PIN 1
4
IDENTIFIER
TOP VIEW
(PINS DOWN)
8
9
0.356 (9.04)
0.350 (8.89)
0.395 (10.02)
9.78
0.385
8-Lead Plastic DIP
(N-8)
5
0.280 (7.11)
0.240 (6.10)
0.325 (8.25)
0.130
(3.30)
MIN
0.300 (7.62)
0.060 (1.52)
0.015 (0.38)
SEATING
PLANE
8-Lead PLCC
(P-20A)
0.180 (4.57)
0.050
(1.27)
BSC
0.165 (4.19)
0.110 (2.79)
0.085 (2.16)
0.056 (1.42)
0.042 (1.07)
19
18
14
13
SQ
SQ
0.195 (4.95)
0.115 (2.93)
0.015 (0.381)
0.008 (0.204)
0.025 (0.63)
0.015 (0.38)
0.021 (0.53)
0.013 (0.33)
0.032 (0.81)
0.026 (0.66)
0.040 (1.01)
0.025 (0.64)
0.330 (8.38)
0.290 (7.37)
0.200 (5.08)
0.200 (5.08)
0.125 (3.18)
0.185 (4.70)
0.165 (4.19)
0.370 (9.40)
0.335 (8.51)
0.335 (8.51)
0.305 (7.75)
0.040 (1.02) MAX
0.045 (1.14)
0.010 (0.25)
0.005 (0.13)
MIN
PIN 1
0.405 (10.29) MAX
MAX
0.023 (0.58)
0.014 (0.36)
8-Lead Hermetic
(Q-8)
0.055 (1.4)
MAX
85
1
0.100 (2.54)
BSC
0.310 (7.87)
0.220 (5.59)
4
0.060 (1.52)
0.015 (0.38)
0.070 (1.78)
0.030 (0.76)
0.150
(3.81)
MIN
SEATING
PLANE
15
0
8-Lead Header Package
(H-8)
REFERENCE PLANE
0.750 (19.05)
0.500 (12.70)
0.250 (6.35) MIN
0.050 (1.27) MAX
0.019 (0.48)
0.016 (0.41)
0.021 (0.53)
0.016 (0.41)
BASE & SEATING PLANE
0.200
(5.08)
BSC
0.100
(2.54)
BSC
0.100 (2.54) BSC
4
3
2
0.320 (8.13)
0.290 (7.37)
0.015 (0.38)
0.008 (0.20)
5
1
0.034 (0.86)
0.027 (0.69)
0.160 (4.06)
0.110 (2.79)
6
7
8
45 BSC
0.045 (1.14)
0.027 (0.69)
Revision History
Location Page
Data Sheet changed from REV. A to REV. B.
Remove 8-Lead SO PIN CONNECTION DIAGRAM . . . . . . . . . . . . . . . . . . . . . . . . . . . . . . . . . . . . . . . . . . . . . . . . . . . . . . . . . . . 1
Changes to ABSOLUTE MAXIMUM RATINGS . . . . . . . . . . . . . . . . . . . . . . . . . . . . . . . . . . . . . . . . . . . . . . . . . . . . . . . . . . . . . . 2
Remove OP77B column from SPECIFICATIONS . . . . . . . . . . . . . . . . . . . . . . . . . . . . . . . . . . . . . . . . . . . . . . . . . . . . . . . . . . . . . . 2
Remove OP77B column from ELECTRICAL CHARACTERISTICS . . . . . . . . . . . . . . . . . . . . . . . . . . . . . . . . . . . . . . . . . . . . . 3–5
Remove OP77G column from WAFER TEST LIMITS . . . . . . . . . . . . . . . . . . . . . . . . . . . . . . . . . . . . . . . . . . . . . . . . . . . . . . . . . . 6
Remove OP77G column from TYPICAL ELECTRICAL CHARACTERISTICS . . . . . . . . . . . . . . . . . . . . . . . . . . . . . . . . . . . . . . 6
REV. B
–15–

C00320–0–2/02(A)
–16–
PRINTED IN U.S.A.
 Loading...