


Features
Integrated Development and
Debugging Environment
• Multiple project management
• Profiling and tracing of
instruction execution
• Automation API and automation aware
scripting engine
• Multiple processor (MP) support
• Background telemetry channel (BTC)
support with data streaming capability
• Statistical profiling
• Graphical plotting capabilities
• Cache visualization
• Execution pipeline viewer
• Compiled simulation
Efficient Application
Code Generation
• Native C/C++ compiler and enhanced
assembler
• Profile-guided optimization (PGO)
• Expert linker with profiling capability
• Integrated source code control
• TCP/IP and USB support for Blackfin
Processors
• Processor configuration/start-up code
wizard for Blackfin Processors
• VisualDSP++ kernel (VDK) with
multiprocessor messaging capability
• System services and device driver
support for Blackfin Processors
• File system support for Blackfin
Processors
VisualDSP++ Development
and Debugging Environment
Overview
VisualDSP++® 5.0 is a state-of-the-art software development environment targeting the
Analog Devices embedded processor portfolio. With the embedded software engineer and
signal processing-intensive applications specifically in mind, VisualDSP++, coupled with
Analog Devices in-circuit emulator (ICE) and EZ-KIT Lite® evaluation products, provides bestin-class capabilities for developing demanding real-time applications.
Platforms and Processor Support
VisualDSP++ supports Analog Devices’ Blackfin® Processors, SHARC® Processors, and
TigerSHARC® Processors. Windows XP,® Windows 2000,® and Windows Vista®
are supported.
Develop High Performance Applications Quickly
At the heart of VisualDSP++ is a robust and powerful C/C++ compiler. The compiler
consistently delivers industry-leading performance on standard benchmarks, ensuring
that all but the most performance-demanding applications can be written entirely in the
C language, accelerating development time while maintaining a portable code base. The
compiler is backed by a rich library of signal-processing routines, allowing easy access
to hand-coded, optimized implementations of FFTs, FIRs, etc. The Blackfin and SHARC
compilers support MISRA-C:2004 for safety-critical embedded systems (www.misra-c.com).
The ANSI-C compiler is also augmented with popular language extensions and
enhancements to make it more amiable to existing code bases. Examples include
GNU GCC extensions, ETSI fractional libraries, and multiple heap support.
www.analog.com/processors/tools
A compiler’s overriding mission is to produce correct code, so there
are occasions when the compiler must take a conservative approach
to a code sequence when a more aggressive approach could have
been taken if certain constraints could be guaranteed by the
programmer. The VisualDSP++ compiler supports a broad range of
pragma that allow the programmer to better exploit the compiler
while maintaining C language neutrality. Just as important, the
compiler has the ability to feed back advisory information to the
programmer, offering further improvements to a code sequence should
the programmer be able to make certain guarantees about it. This
information is displayed seamlessly in the VisualDSP++ main editor
window. This “lifts the veil” off the “black box” that compilers are often,
and accurately, accused of being.
Backing the compiler is a powerful assembler and linker technology.
Analog Devices’ processors are noted for their intuitive algebraic
assembly language syntax, and the VisualDSP++ assembler extends that
ease of use with the ability to import C header files, allowing for symbolic
references into arbitrarily complex C data structures. Binary data can
be “included” directly into assembly source files, creating an easy way
to add blocks of static data (such as audio samples and bitmaps) to an
application. The VisualDSP++ linker is fully multicore and multiprocessor
(MP) aware, allowing for the creation of cross-linked, multiexecutable
applications in a single pass. Other powerful capabilities of the linker
include dead code and data elimination, code and data overlays, section
spilling (i.e., automatic overflow from internal to external memory), and
automatic short-to-long call expansion.
Built upon the system service library, the file system service (FSS)
provides a portable and extensible means of accessing mass
storage media from the Blackfin Processor. Support for the
ADSP-BF548 EZ-KIT Lite development board is provided with
VisualDSP++ 5.0 for FAT file systems on the attached hard disk
drive, supplied SD card, and USB flash.
As embedded applications become increasingly part of the connected
world, the ability to rapidly add reliable Ethernet or USB connectivity
to an application can often make or break a development schedule.
For Blackfin Processors, VisualDSP++ includes a tuned port of the
open source LwIP TCP/IP stack. An example application showcasing
an embedded Web server is among the highlights of this support. For
Blackfin Processors and SHARC Processors, USB 2.0 device connectivity
is provided. Bulk and asynchronous transfer modes are supported out
of the box, with USB-IF logo certified embedded and host applications
provided with full source code.
Leverage Proven Application Infrastructure
VisualDSP++ goes beyond robust code generation tools, providing
considerable application infrastructure and middleware out of the box
to speed application development. The VisualDSP++ kernel (VDK) is a
robust, royalty-free, real-time operating system (RTOS) kernel. It provides
essential kernel features in a minimal footprint. Features include a fully
preemptive scheduler (time slicing and cooperative scheduling are also
supported), thread creation, semaphores, interrupt management, interthread messaging, events, and memory management (memory pools
and multiple heaps). In MP environments, MP messaging is also
provided. Configuration of these elements is done graphically with code
wizards to speed the creation of new threads and interrupt handlers.
VDK has been available for multiple releases of VisualDSP++ and is now
a key component of products shipping from a number of high volume
vendors. Several commercial RTOSs are also available from select Analog
Devices third parties.
Blackfin Processors can take advantage of the system service library
(SSL), which provides consistent, easy C language access to Blackfin
features such as the interrupt manager, direct memory access (DMA),
and power management units. Clock frequency and voltage can be
changed easily at run time through a set of simple APIs. Interrupt
handling can be live, fired at the time of the event, or deferred to a later
time of the application’s choosing. A device manager integrates device
drivers for on- and off-chip peripherals. VisualDSP++ includes ever
expanding device driver support for all on-chip peripherals and off-chip
devices found on Analog Devices EZ-KIT Lite and EZ-Extender® products.
The SSL is OS-neutral and can be run as a standalone or in conjunction
with an RTOS.
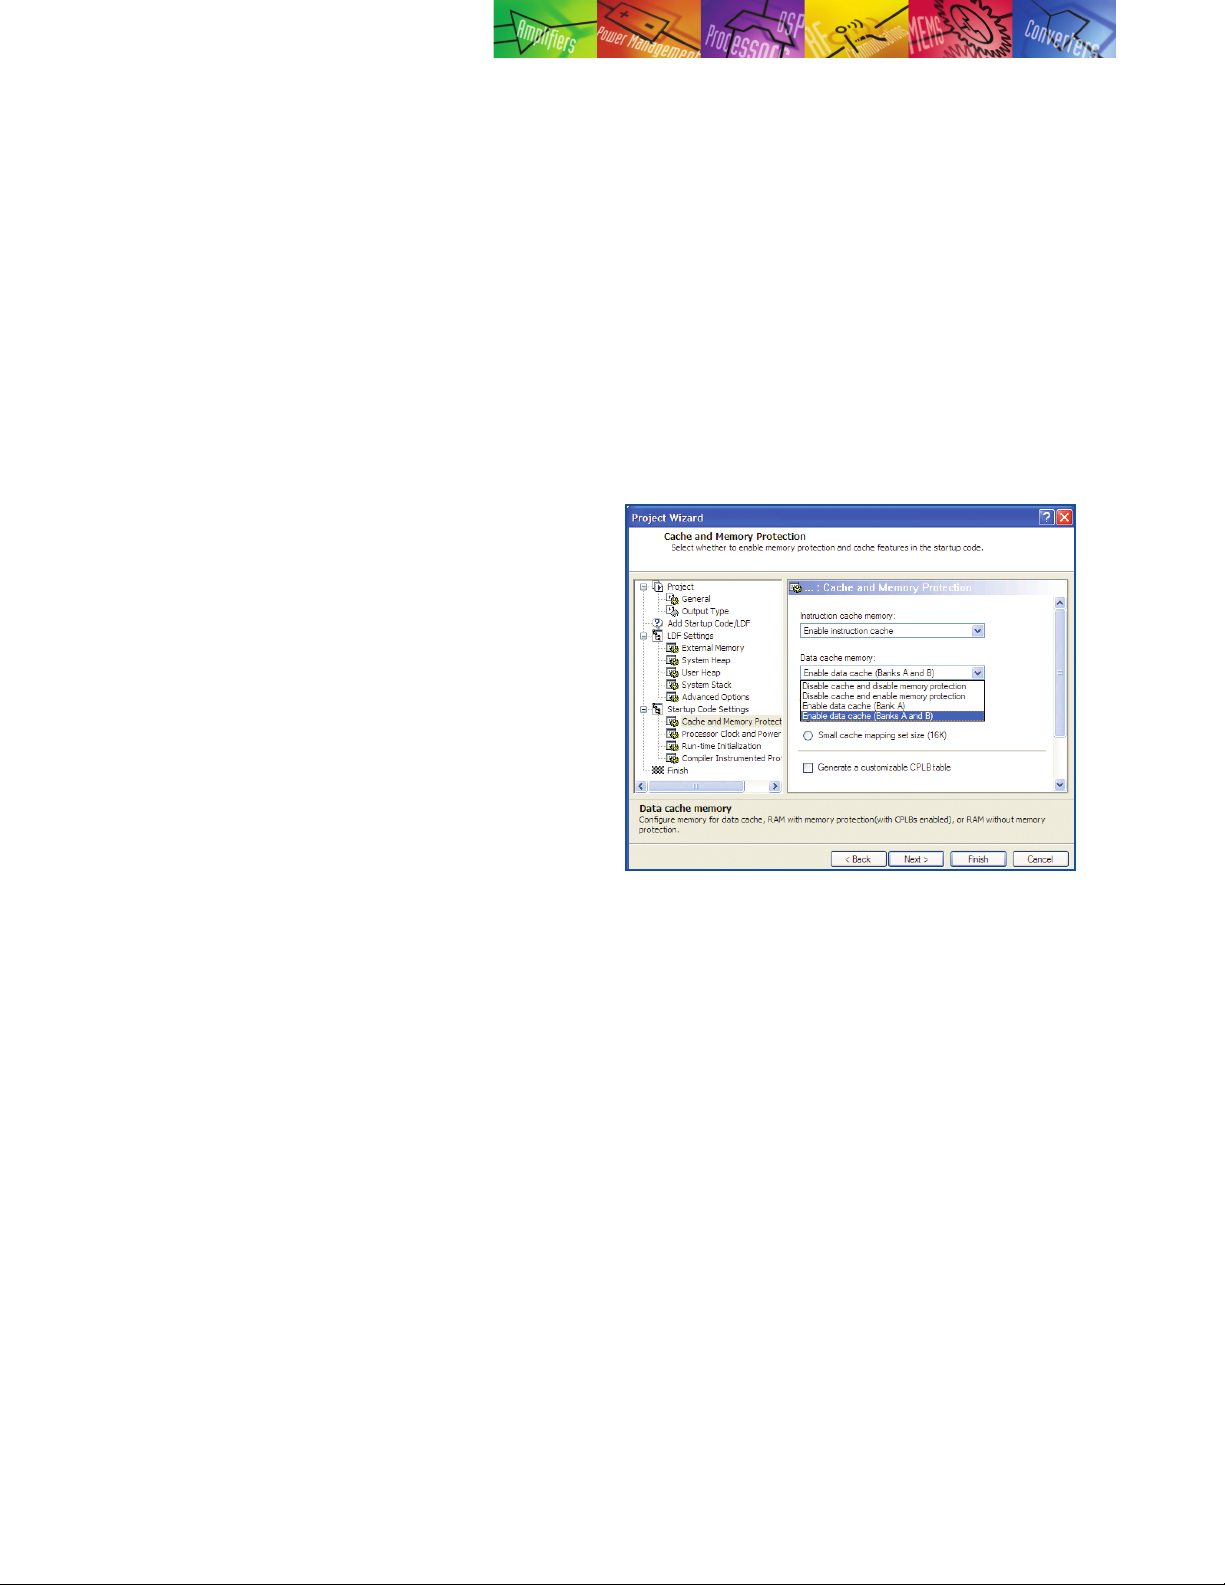
Source code generation.
Wrapping all of these powerful tools and libraries together is the
VisualDSP++ state-of-the-art integrated development and debugging
environment (IDDE). The IDDE includes full-featured editing and project
manage-ment tools with incremental builds, multiple build configurations
(“Debug” and “Release,” for example), syntax-coloring editor, and many
other code editing features. Makefiles can be imported and exported
freely. For Blackfin Processors, many application attributes can be
configured graphically, enabling point-and-click access to SDRAM setup,
stack and heap placement, power management, clock speed, cache
setup, and more.
Debug and Tune Your Application with Ease
The ability to develop a high performance application is often gated
by the visibility into your running system that your debugger provides.
VisualDSP++ excels in this regard, with best-in-class debugging and
inspection support. Robust fundamental C language source debugging
(source-level stepping and breakpoints, stack unwinds, local variable
and C expression support, memory and register windows) serves as a
foundation upon which multiple innovative and unique tools rest.
VisualDSP++ supports a variety of debugging targets. Most common is
a JTAG connection to an EZ-KIT Lite board or to a custom target board
by means of Analog Devices emulator products. However, there will be
occasions where closer inspection in a simulated environment may be
required. VisualDSP++ provides core cycle-accurate simulators, allowing
inspection of every nuance of activity within the processor, including
visualization of the processor’s pipeline and cache. These simulators are
robust and highly accurate, so much so that they are used by Analog
Devices’ own silicon designers for validation. A second simulator is
available to Blackfin Processor users—a high speed functional simulator.
Using proprietary just-in-time (JIT) technology, the simulators have the
ability to simulate millions of cycles per second on the most modest of
host PCs. Effectively, this means that what used to be an overnight run is
now a 10-minute coffee break, and what was once
a coffee break is now a near-instantaneous simulation.
As many of the most performance-demanding applications process a
signal of some sort, comprehensive memory plotting is a cornerstone
of VisualDSP++ debugger support. VisualDSP++ provides multiple
views, from basic (line plots) to sophisticated (eye diagrams and
waterfalls) to pinpoint anomalous data sequences in your application.
Image viewing in a number of data formats is also available.
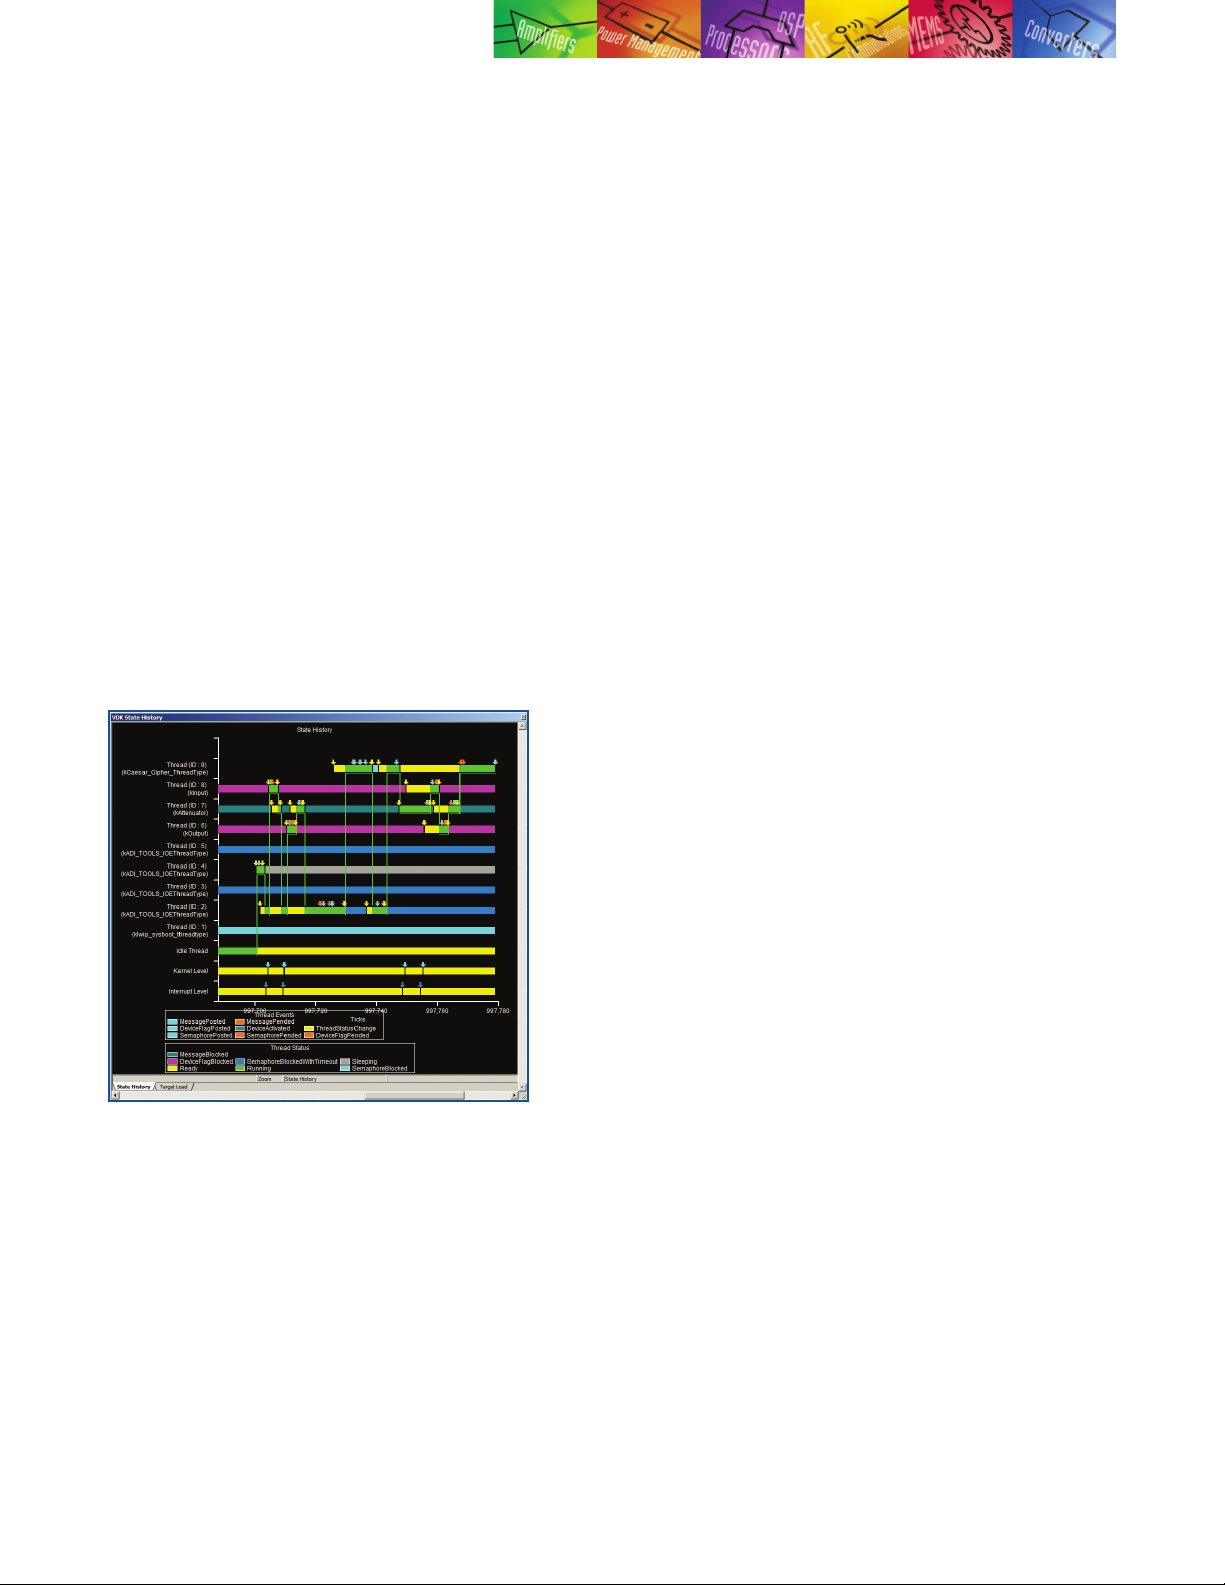
Users of the VDK get unparalleled visibility into the internals of
the kernel. Status on a per-thread basis is available, as is a comprehensive pictorial history of kernel events and CPU loading. Thread
changes, posted and pended semaphores, and other kernel events are
captured in this display.
For Blackfin Processors and SHARC Processors, inspection, or even
so their contents do not follow the debugger’s focus. To further aid MP
debug, synchronous run, step, halt, and reset are also provided.
The Analog Devices patented statistical profiler offers unprecedented
and unique visibility into a running application. Operating completely
nonintrusively to the application, the application is polled thousands
of times per second and a statistical view of where an application is
spending the majority of its time is quickly assembled. This tool can be
used to easily inspect an application for unexpected hotspots (suggesting
the need to move a key routine from external to internal memory, for
example). Simulator targets provide a completely linear profiling view. For
Blackfin Processors, traditional instrumented profiling is also available.
Going even further, the VisualDSP++ compiler is able to act upon
profiling information. Profile-guided optimization (PGO) is a technique
that allows the compiler to instrument an application, run the application,
and then make a second pass compilation, exploiting the information
that was gathered during the run of the application. This gives the
compiler unique insight on a block-by-block basis, allowing it to optimize
with a level of granularity that is not possible with a tool that operates
only on a file-by-file basis.
Integrate into Your Existing Environment
A development tool suite is always a part of an organization’s larger
software engineering environment. VisualDSP++ has been designed to
operate in a larger environment.
Since an embedded engineer is often developing on a new platform
while maintaining existing products that were likely developed with
earlier versions of the tools, VisualDSP++ can be installed discretely
an arbitrary number of times at a variety of release levels, allowing
engineering to easily switch between current and legacy versions of
VisualDSP++.
Kernel event history.
application stimulation, from the debugger at run time is possible
through the use of the processor’s background telemetry channel (BTC).
BTC allows for an arbitrary number of communication channels to be
established between the host debugger and the application. Channels
may go in either direction, so BTC can be used to read and write data as
the processor runs. Scalar values or entire arrays may be serviced by a
channel. Arrays read from the target can even be plotted in real time.
MP users get the same compelling set of debugging features across all
processors, unified into a single debugging interface. Individual windows
can be made to “float” their focus to whichever processor currently is
the debugger’s focus, or they can be “pinned” to a specific processor
To better integrate to source code control (SCC) systems, VisualDSP++
is able to connect to any SCC provider that supports the Microsoft®
common source code control (MCSCC) interface. This interface is
supported by all leading SCC vendors. VisualDSP++ goes one step
further by supporting the control of VisualDSP++ itself within a source
code control system.
The ability to robustly test an embedded application is enabled through
a comprehensive automation application programmers interface (API).
Using Microsoft’s language-neutral automation technology, nearly every
feature of the graphical environment is available to script authors.
Applications can be rebuilt, downloaded, and run from a simple script
executed from the command line or from within a custom test harness
framework. The automation API is supported by C++ and VBScript
examples for all API calls, though any automation-aware language
can be used.
For prototype runs and/or small volume deployment, an Analog Devices
emulator can be used to flash a program onto your custom system.
Accessible through the Automation API, the flash programmer can be
scripted, making it possible to develop a turnkey user interface for use
by a production floor technician or other individual not familiar with
VisualDSP++. Device drivers are provided for all flash devices found on
EZ-KIT Lite products, and these drivers can be easily adjusted to support
an arbitrary flash device. The Stand-Alone Flash Programmer enables the
development engineer to script or automate this process with a license-

free tool, allowing the manufacturing technician to repeatedly
program any number of boards prior to major production.
Getting Help and Staying Up to Date
Analog Devices is aware that best-in-class customer support
is ultimately in the interests of both customers and Analog
Devices in the long run. Analog Devices is committed to bestin-class customer support for VisualDSP++.
VisualDSP++ includes a comprehensive, indexed, searchable
online help system. In addition to information concerning
VisualDSP++, manuals for Analog Devices processors,
application notes, and more are included in the help system.
PDF versions of these documents are also available on the
installation CD or online at www.analog.com/processors.
Licensed users of VisualDSP++ are entitled to free technical
support. The support staff is dedicated to VisualDSP++ and has
specific expertise regarding it. There is never a per-incident or
maintenance fee; support remains free regardless of how long
you own your software.
Major and minor upgrades to VisualDSP++ are also free and
are released through the Analog Devices website.
The Collaborative
The VisualDSP++ environment enables independent third-party
companies to add value using Analog Devices’ published
set of application programming interfaces (APIs). The
Collaborative™ is an independent network of third-party
developers. The Collaborative’s product offerings—real-time
operating systems, emulators, high level language compilers,
and multiprocessor hardware—can interface seamlessly with
VisualDSP++, thereby simplifying development across all
platforms and targets.
Take a VisualDSP++ Test Drive!
Take a free 90-day test drive of VisualDSP++. To take a
test drive, you can download a test drive or request a
CD from the Analog Devices DSP Tools website at
www.analog.com/processors/tools/testdrive or contact
your local Analog Devices sales representative/distributor.
Analog Devices Tools Product Line
Analog Devices’ CROSSCORE® development tools product
line provides easier and more robust methods for engineers
to develop and optimize systems by shortening product
development cycles for faster time to market. The CROSSCORE
components include the VisualDSP++ software development
environment, EZ-KIT Lite evaluation systems, EZ-Extender
daughter boards, and emulators for rapid on-chip debugging.
For more information on development tools, visit the Analog
Devices website, www.analog.com/processors/tools.
Embedded Processors and DSPs
Analog Devices is a leading supplier of embedded and
digital signal processing solutions, from the high performance
Blackfin and TigerSHARC Processors to the low cost SHARC
Processors and integrated mixed-signal DSPs that are ideal for
an ever increasing spectrum of applications. Analog Devices’
advances in design provide faster processing, more memory,
lower power consump-tion, and simplified system integration.
Analog Devices’ products and technology provide a competitive
edge complete with expert technical support, comprehensive
development tools, and The Collaborative.
CROSSCORE Tools Support
Tel: 1-800-ANALOGD
Email: processor.tools.support@analog.com
Analog Devices is committed to providing high quality, timely,
accurate, and free technical support and
software upgrades.
Ordering Information
VisualDSP++ 5.0 for Blackfin
Part number: VDSP-BLKFN-PC-FULL
VisualDSP++ 5.0 for SHARC
Part number: VDSP-SHARC-PC-FULL
VisualDSP++ 5.0 for TigerSHARC
Part number: VDSP-TS-PC-FULL
Floating licenses and volume discounts are also available.
Analog Devices, Inc.
Worldwide Headquarters
Analog Devices, Inc.
One Technology Way
P.O. Box 9106
Norwood, MA 02062-9106
U.S.A.
Tel: 781.329.4700
(800.262.5643,
U.S.A. only)
Fax: 781.461.3113
Analog Devices, Inc.
Europe Headquarters
Analog Devices, Inc.
Wilhelm-Wagenfeld-Str. 6
80807 Munich
Germany
Tel: 49.89.76903.0
Fax: 49.89.76903.157
Analog Devices, Inc.
Japan Headquarters
Analog Devices, KK
New Pier Takeshiba
South Tower Building
1-16-1 Kaigan, Minato-ku,
Tokyo, 105-6891
Japan
Tel: 813.5402.8200
Fax: 813.5402.1064
Analog Devices, Inc.
Southeast Asia
Headquarters
Analog Devices
22/F One Corporate Avenue
222 Hu Bin Road
Shanghai, 200021
China
Tel: 86.21.5150.3000
Fax: 86.21.5150.3222
Embedded Processing and
DSP Support
U.S.A.:
processor.support@analog.com
Fax: 781.461.3010
Europe:
processor.europe@analog.com
Fax: 49.89.76903.157
www.analog.com/processors
©200 7 Analog De vices, Inc. All r ights res erved.
Trademarks and registered trademarks are the property
of their respective owners.
Printed in the U.S.A. PH02330-5-10/07(J)
www.analog.com/processors/tools

ICE-100B Emulator
User Guide
Analog Devices, Inc.
One Technology Way
Norwood, Mass. 02062-9106
Revision 1.0, September 2009
Part Number
82-000225-01
a

Copyright Information
©2009 Analog Devices, Inc., ALL RIGHTS RESERVED. This document
may not be reproduced in any form without prior, express written consent
from Analog Devices, Inc.
Notice
Analog Devices, Inc. reserves the right to make changes to or to discontinue any product or service identified in this publication without notice.
Analog Devices assumes no liability for Analog Devices applications assistance, customer product design, customer software performance, or
infringement of patents or services described herein. In addition, Analog
Devices shall not be held liable for special, collateral, incidental or consequential damages in connection with or arising out of the furnishing,
performance, or use of this product.
Analog Devices products are not intended for use in life-support
applications, devices, or systems. Use of an Analog Devices product in
such applications without the written consent of the appropriate Analog
Devices officer is prohibited.
Users are restricted from copying, modifying, distributing, reverse
engineering and reverse assembling or reverse compiling the Analog
Devices emulator operational software (one copy may be made for
back-up purposes only).

Trademark and Service Mark Notice
The Analog Devices logo, VisualDSP++, Blackfin, TigerSHARC,
SHARC, the CROSSCORE logo, EZ-KIT Lite, and EZ-ICE are registered trademarks are registered trademarks of Analog Devices, Inc.
All other brand and product names are trademarks or service marks of
their respective owners.
Regulatory Compliance
ICE-100B emulators are designed to be used solely in a laboratory environment. The emulator is not intended to be used in any end products or
as a portion of an end product. The emulators may cause interference to
other electronic devices operating at close proximity. The emulators
should not be used in or near any medical equipment or RF devices.
The ICE-100B emulators have been certified to comply with the essential
requirements of the European EMC directive 89/336/EEC (inclusive
93/68/EEC) and, therefore, carries the “CE” mark.
The ICE-100B emulators have been appended to
Analog Devices Development Tools Technical
Construction File referenced “DSPTOOLS1” dated
December 21, 1997 and was awarded CE Certification by an appointed European Competent Body
and is on file.
The ICE-100B emulator contains ESD (electrostatic discharge) sensitive
devices. Electrostatic charges readily accumulate on the human body and
equipment and can discharge without detection. Permanent damage may
occur on devices subjected to high-energy discharges. Proper ESD precautions are recommended to avoid performance degradation or loss of functionality. Store unused ICE-100B emulators in the protective shipping
package.


CONTENTS
PREFACE
Purpose of This Manual ................................................................ viii
Intended Audience ........................................................................ viii
Manual Contents .......................................................................... viii
Technical and Customer Support ..................................................... ix
GETTING STAR T ED
Contents of Emulator Package ....................................................... 1-2
PC Configuration ......................................................................... 1-2
USB Installation Tasks .................................................................. 1-2
Verifying Driver Installation .................................................... 1-4
Attaching to the Emulation Target ................................................. 1-6
VisualDSP++ Configurator ............................................................ 1-8
JTAG Frequency ........................................................................... 1-8
Troubleshooting and Warranty Information ................................... 1-9
HARD W A RE D E S C R I P T I O N
LEDs ............................................................................................ 2-1
Resetting the Target ...................................................................... 2-2
To Reset the Target ................................................................. 2-3
ICE-100B Emulator User Guide v

Designing Custom Processor Boards .............................................. 2-4
Mechanical Specifications ............................................................. 2-4
SUPPORT
Technical Support ......................................................................... 3-1
Quality Assurance ......................................................................... 3-2
REFERENCES
INDEX
vi ICE-100B Emulator User Guide

PREFACE
Thank you for purchasing the ICE-100B Emulator. The ICE-100B
emulator is used in conjunction with the VisualDSP++® development
environment to create, test, and debug advanced processor application
software on Analog Devices Blackfin® processors.
The ICE-100B emulator provides state-of-the-art support for
JTAG-compliant Analog Devices processors. Key features of the
ICE-100B emulator include:
• Plug-n-Play, USB 2.0 compliant
• High-speed USB device
• USB bus-powered device
•Windows® XP or Windows Vista operation
• Multiple processor I/O voltage support
1.8V, 2.5V, and 3.3V compliance
• Multiprocessor support
• JTAG clock operation of 5 MHz
Analog Devices carries a wide range of in-circuit emulation products.
To learn more about Analog Devices emulators, go to:
http://www.analog.com/processors/
ICE-100B Emulator User Guide vii

Purpose of This Manual
Purpose of This Manual
The ICE-100B Emulator User Guide provides directions for installing the
ICE-100B hardware and software on your PC. The manual also describes
how to configure and use the components of the ICE-100B emulators.
Intended Audience
This manual is intended to help the customer understand the features and
operation of the ICE-100B emulator so they can begin using
VisualDSP++.
Manual Contents
The manual consists of:
• Chapter 1, “Getting Started” on page 1-1
Provides software and hardware installation procedures, PC system
requirements, and basic board information.
• Chapter 2, “Hardware Description” on page 2-1
Provides information on hardware aspects of the ICE-100B
emulator.
• Chapter 3, “Support” on page 3-1
Provides technical support contact information.
• Chapter 4, “References” on page 4-1
Provides information on different resources available in developing
an application based on an Analog Devices processor.
viii ICE-100B Emulator User Guide

Technical and Customer Support
You can reach Analog Devices, Inc. Customer Support in the following
ways:
• Visit the Embedded Processing and DSP products Web site at
http://www.analog.com/processors/technical_support
• E-mail tools questions to
processor.tools.support@analog.com
• E-mail processor questions to
processor.support@analog.com (World wide support)
processor.europe@analog.com (Europe support)
processor.china@analog.com (China support)
• Phone questions to 1-800-ANALOGD
Preface
• Contact your Analog Devices, Inc. local sales office or authorized
distributor
• Send questions by mail to:
Analog Devices, Inc.
One Technology Way
P.O. Box 9106
Norwood, MA 02062-9106
USA
ICE-100B Emulator User Guide ix

Technical and Customer Support
x ICE-100B Emulator User Guide

1 GETTING STARTED
This chapter provides the information needed to begin using Analog
Devices ICE-100B emulators.
This chapter includes the following sections.
Analog Devices emulators are not intended to be used in a
production environment.
• “Contents of Emulator Package” on page 1-2
Provides a list of the components that are shipped.
• “PC Configuration” on page 1-2
Describes the minimal PC requirements.
• “USB Installation Tasks” on page 1-2
Provides a step-by-step procedure for setting up the emulator
hardware.
• “Attaching to the Emulation Target” on page 1-6
Describes how to connect ICE-100B emulators to your target
board.
• “VisualDSP++ Configurator” on page 1-8
Describes how to specify a platform definition.
• “JTAG Frequency” on page 1-8
Describes how to change the JTAG frequency.
• “Troubleshooting and Warranty Information” on page 1-9
Describes other resources.
ICE-100B Emulator User Guide 1-1

Contents of Emulator Package
Contents of Emulator Package
The ICE-100B emulator package contains the following items:
• ICE-100B emulator
• 2-meter USB Standard-A to mini-B cable
PC Configuration
For correct operation of the ICE-100B emulator, your computer must
have the minimal configuration:
• Windows XP or Windows Vista
• VisualDSP++ 5.0 Update 7 (or higher)
USB Installation Tasks
Perform the following tasks to safely install your ICE-100B emulator.
Follow these instructions in the presented order to ensure correct
operation of your software and hardware.
1. Install VisualDSP++ 5.0 Update 7 (or higher). VisualDSP++
includes the USB driver needed for the ICE-100B emulator hardware. VisualDSP++ can be installed on Windows XP or Windows
Vista. Refer to the Installation Quick Reference Card for details.
1-2 ICE-100B Emulator User Guide

Getting Started
Note: If you connect the ICE first, before installing VisualDSP++,
the Windows driver wizard will not be able to find the drivers to
install for the emulator to function.
2. Select the operating voltage of the target DSP JTAG interface. The
ICE-100B emulator ships with a jumper on positions 1 and 3, and
2 and 4, by default.
Refer to Table 1-1 and Figure 1-1.
Table 1-1. Specifying the Operating Voltage
Target Voltage JP1 Settings (Installed Jumpers)
3.3 volts 1 and 3, 2 and 4
2.5 volts 1 and 2, 3 and 4
1.8 volts 3 and 5, 2 and 4
Figure 1-1. JP1 Pinout
3. Ensure that JP2 does not have a jumper across the pins for
Windows mode. Refer to Table 1-2. There may be a jumper
hanging off one pin; this will not impact operation.
ICE-100B Emulator User Guide 1-3

USB Installation Tasks
Table 1-2. JP2 Settings
Jumper Operating System
Uninstalled Windows
Installed Linux
4. Connect the USB cable between the ICE-100B emulator and a
USB port of your computer.
5. Verify driver installation. Refer to “Verifying Driver Installation”
on page 1-4.
Before connecting to a target, see the power-up/down procedures
in “Attaching to the Emulation Target” on page 1-6.
Verifying Driver Installation
Before using the ICE-100B emulator, verify that the driver software is
installed properly.
Open the Windows Device Manager and verify that the ICE-100B
emulator appears under ADI Development Tools, as shown in Figure 1-2
1-4 ICE-100B Emulator User Guide

Getting Started
Figure 1-2. Verifying Driver Installation
ICE-100B Emulator User Guide 1-5

Attaching to the Emulation Target
Attaching to the Emulation Target
The final step is to connect the 14-pin header (J1) of the ICE-100B emulator to the target board via the JTAG interface. The 14-pin connector is
keyed at pin 3 on the emulator connector to ensure that the signals mate
correctly with the 14-pin target emulation header. The target board
should also have pin 3 of the JTAG interface connector cut. Refer to
Figure 1-3 for J1 pinout information.
Figure 1-3. J1 Pinout
1-6 ICE-100B Emulator User Guide

Getting Started
Powering Up/Down the ICE-100B Emulator
To power up the ICE-100B emulator:
1. Apply power to the target board.
2. Connect the USB port on the computer to the ICE-100B emulator.
The ICE-100B is a bus-powered device, so this step powers the
emulator.
3. Connect the ICE-100B emulator JTAG connector to the target
JTAG header.
4. Invoke VisualDSP++.
To power down the ICE-100B emulator:
1. Shut down (exit) VisualDSP++.
2. Disconnect the USB cable between the ICE-100B emulator and
the PC.
3. Power down the target board.
For custom processor boards still in design, refer to Engineer-to-Engineer
Note, Analog Devices JTAG Emulation Technical Reference (EE-68),
available from the Analog Devices Web site. This document is a technical
reference for implementing the JTAG interface on your target.
The emulator hardware is ready to be used in conjunction with
VisualDSP++ to debug a processor target system.
ICE-100B Emulator User Guide 1-7
The “PWR” LED (power LED) should be green when power is
applied and the board is not in hibernate state.
4. The ICE-100B emulator can now be removed from the target.

VisualDSP++ Configurator
VisualDSP++ Configurator
VisualDSP++ requires a description of the platform (JTAG chain). The
platform definition is necessary for VisualDSP++ to communicate with
the hardware through the emulator.
The VisualDSP++ Configurator and ICE Test utilities allow configuration
and testing of the emulator hardware. ICE Test provides emulator detection and JTAG interface testing. Use the ICE Test to test the target. If
errors are encountered, they are reported immediately and the test ends.
Refer to VisualDSP++ online Help for information about the
VisualDSP++ Configurator and the ICE Test utility
JTAG Frequency
The ICE-100B emulator supports JTAG clock operation at 5 MHz. There
is a relationship between the JTAG frequency and the core clock frequency of the processor. The core clock should be at least twice the JTAG
frequency in order for the JTAG interface to operate properly. On newer
Analog Devices processors, the core clock is a variable that is sometimes
set by switches or by software.
1-8 ICE-100B Emulator User Guide
If the core/JTAG clock relation is not followed, scan failures may
prevent the emulator from connecting to the processor.

Getting Started
Troubleshooting and Warranty Information
To provide comprehensive troubleshooting advice and warranty
information for all emulator and EZ-KIT Lite products, Analog Devices
maintains an Engineer-to-Engineer Note to provide this information.
Emulator and EZ-KIT Lite Evaluation System Troubleshooting Guide
(EE-175), is available online at: http://www.analog.com
This EE-Note can be used to resolve most installation, connection, and
software issues affecting the use of Analog Devices in-circuit emulators
(ICEs) and EZ-KIT Lite evaluation systems, avoiding the need to return
the suspected faulty emulator or EZ-KIT Lite board. Please carry out all
troubleshooting steps outlined in this document before contacting Analog
Devices Processor Tools Support.
Also included in this EE-Note, you will find complete warranty and
return material authorization (RMA) information for emulators and
EZ-KIT Lite products. In general, emulators less than one year old are
within warranty, and repairs within that period are free of charge, but
there are some limitations to this warranty coverage. For details, see the
EE-Note.
ICE-100B Emulator User Guide 1-9

Troubleshooting and Warranty Information
1-10 ICE-100B Emulator User Guide

2 HARDWARE DESCRIPTION
This chapter describes the hardware design of the ICE-100B emulator and
includes the following sections:
• “LEDs” on page 2-1
Describes LEDs which inform you of the emulator’s status.
• “Resetting the Target” on page 2-2
Describes how to reset the target.
• “Designing Custom Processor Boards” on page 2-4
Describes concerns regarding board lay out.
• “Mechanical Specifications” on page 2-4
Provides dimensional information.
LEDs
Three LEDs are located on the ICE-100B emulator (refer to Figure 2-1):
• PWR LED - The Power LED signifies that the ICE is powered.
• MON LED - The Monitor LED signifies that the ICE is configured over USB.
• STAT LED - The Status LED signifies that the ICE is ignoring the
EMU signal.
ICE-100B Emulator User Guide 2-1

Resetting the Target
a
STAT
PWR
ICE-100B
MON
PN: ADZS-ICE-100B
LED1
LED2
LED3
Figure 2-1. LED Positions - Top of Emulator Board
Resetting the Target
When debugging remotely, the ability to reset the target can be very useful. Enable this function through the Reset Target Options dialog box
and by soldering a wire from the ICE-100B emulator to the target. Two
solder points labeled “RESET” (reference designator P3) are located near
the JTAG connector (J1) and the USB connector (P1) on the ICE-100B.
For an active low version (~RESET), solder a wire between the square pad
(pin 1) of P3 and the ~RESET input signal of the target.
For an active high version (RESET), solder a wire between the round pad
(pin 2) and the RESET input signal of the target
If the Enabled option of the Reset Target Options dialog box is
not selected (checked), the Reset Target command under the
Debug menu item will be grayed out.
2-2 ICE-100B Emulator User Guide

Hardware Description
To Reset the Target
• From the Debug menu, choose Reset Target.
This sends a reset pulse of the specified Reset Time duration to the
target.
Reset Target Options Dialog Box
Use the Reset Target Options dialog box (refer to Figure 2-2 and
Table 2-1) to enable/disable the target reset function and to specify the
duration of the reset target pulse.
Figure 2-2. Reset Target Options Dialog Box
Table 2-1. Fields on the Reset Target Options Dialog Box
Field or Button Description
Reset Time Indicates the duration in milliseconds of the reset pulse that is to be
sent to the target
Reset Function When Enabled is selected (checked), allows the target to be reset. If
this check box is not checked, the Reset Time box will be grayed
OK Exits and saves changes
Cancel Exits and discards changes
ICE-100B Emulator User Guide 2-3

Designing Custom Processor Boards
Designing Custom Processor Boards
When designing a custom processor board using Analog Devices
processors and DSPs, special care must be taken to ensure that the JTAG
interface is designed and laid out correctly. If the board is not designed
correctly, communication via the JTAG port may not work. Another side
effect may be that the interface works, but you are not able to run at the
highest possible JTAG clock frequency. The JTAG clock frequency is
dependant on the particular Analog Devices processor, as well as the delay
characteristics of the custom processor board.
To ensure that the custom board’s JTAG interface is designed and laid out
correctly, refer to Engineer-to-Engineer Note, Analog Devices JTAG Emu-
lation Technical Reference (EE-68), available from the Analog Devices Web
site. This document is a technical reference for implementing the JTAG
interface on your target.
Mechanical Specifications
The outer dimensions of the ICE-100B emulator are 2.99” x 0.785”. The
height of the JTAG connector (J1) is approximately 0.310”. The tallest
component on the top is 0.235”, and the tallest component on the bottom
is 0.045”. Refer to Figure 2-3.
Care must be taken when locating a custom target JTAG interface
connector, that no components are taller than about 0.15” if located
under the emulator.
2-4 ICE-100B Emulator User Guide
If there are any concerns that emulator components may short to
the target board, an insulator should be used to provide protection.

0.045”
0.070”
a
0.450”
0.300”
0.855”
0.785”
2.990”
0.235”
0.310”
0.093”
P3
P1
3.3
1.8
JP1
JP2
2.5
STAT
PWR
P1
J1
ICE-100B
MON
JP1
J1
RESET
PN: ADZS-ICE-100B
LED1
LED2
LED3
* = MAXIMUM COMPONENT HEIGHT
*
*
*
Hardware Description
Figure 2-3. ICE-100B Emulator Dimensions (in inches)
ICE-100B Emulator User Guide 2-5

Mechanical Specifications
2-6 ICE-100B Emulator User Guide

3 SUPPORT
Analog Devices provides free technical support.
Technical Support
For technical support, visit the Embedded Processing and DSP Technical
Support page at:
http://www.analog.com/processors/technical_support
From there you can:
• Access the EngineerZone DSP Support Forum where Analog
Devices support team members and other designers exchange ideas
and answer questions
• Search our vast Knowledge Base containing application notes, data
sheets, code examples, manuals, and more
• Contact our Technical Support team directly by filling out the
support form
Alternately, you can contact Technical Support directly as follows:
• For tools issues, send a description of the problem by e-mail to
processor.tools.support@analog.com
• For processor issues, send a description of the problem by e-mail to
the Application Engineering group at
processor.support@analog.com
ICE-100B Emulator User Guide 3-1

Quality Assurance
Quality Assurance
Analog Devices is committed to providing quality products and services.
To continually provide this quality, please contact our Quality Assurance
Department directly if you have any concerns at (603) 883-2430, Monday
through Friday during normal business hours, or via e-mail at:
processor.tools.support@analog.com. Our Quality Assurance manager
will listen to your concerns and provide a timely and effective solution.
3-2 ICE-100B Emulator User Guide

4 REFERENCES
This section describes documentation resources helpful in your
application development.
• For information on designing the interface between an Analog
Devices processor and the emulation header on your custom
processor target board, refer to Engineer-to-Engineer Note, Analog
Devices JTAG Emulation Technical Reference (EE-68), available
from the Analog Devices Web site.
• For information on the architecture and system interface of the
Analog Devices processor, refer to the appropriate Analog Devices
processor’s Hardware Reference.
• For processor timing specification and other hardware design
information, refer to the appropriate processor’s Data Sheet.
• For complete information on software development tools
(assembler, compiler, linker, and so on), refer to documentation
included with VisualDSP++. This information is available in PDF
format and in VisualDSP++ online Help.
• For information about your development platform, refer to your
operating system manuals and hardware system manuals.
ICE-100B Emulator User Guide 4-1

• For information about digital signal processing theory and
applications, consult:
Higgins. Digital Signal Processing In VLSI.
Prentice-Hall, 1990.
Oppenheim and Schafer. Digital Signal Processing.
Prentice-Hall, 1975.
4-2 ICE-100B Emulator User Guide

IINDEX
A
attaching JTAG cable, 1-6
C
contents, emulator package, 1-2
customer support, -ix
custom processor boards, 2-4
D
data sheets, 4-1
designing custom boards, 2-4
Device Manager window, 1-4
digital signal processing theory, 4-2
documentation resources, 4-1
drivers, 1-4
E
EE-175, 1-9
EE-68, 1-7, 2-4, 4-1
emulators
ICE-100B, 1-1
troubleshooting, 1-9
H
hardware
description, 2-1
references, 4-1
high-speed USB device, -vii
I
ICE-100B emulator, about, 1-1
ICE Test, 1-8
installation tasks, 1-2
I/O voltage, -vii
J
JTAG
clock frequency, 2-4
frequency, 1-8
header, 2-4
port, 2-4
L
Linux operation, 1-3
M
F
frequency, 2-4
mechanical specifications, 2-4
multiprocessor support, -vii
P
PC configuration, 1-2
ICE-100B Emulator User Guide I-1

Q
quality assurance, 3-2
R
resetting the target, 2-2
V
verifying driver installation, 1-4
VisualDSP++, -vii, 1-2
documentation, 4-1
VisualDSP++ Configurator, 1-8
T
target, resetting, 2-2
technical support, 3-1
W
Windows operation, 1-3
I-2 ICE-100B Emulator User Guide
 Loading...