

31 MHz, Dual Programmable Filters
V
Data Sheet
FEATURES
Matched pair of programmable filters and VGAs
Continuous gain control range: 50 dB
Digital gain control: 15 dB
6-pole Butterworth filter: 1 MHz to 31 MHz
in 1 MHz steps, 1 dB corner frequency
Preamplifier and postamplifier gain steps
IMD3: >65 dBc for 1.5 V p-p composite output
HD2, HD3: >65 dBc for 1.5 V p-p output
Differential input and output
Flexible output and input common-mode ranges
Optional dc offset compensation loop
SPI programmable filter corners and gain steps
Power-down feature
Single 3.3 V supply operation
APPLICATIONS
Baseband IQ receivers
Diversity receivers
ADC drivers
Point-to-point and point-to-multipoint radio
Instrumentation
Medical
and Variable Gain Amplifiers
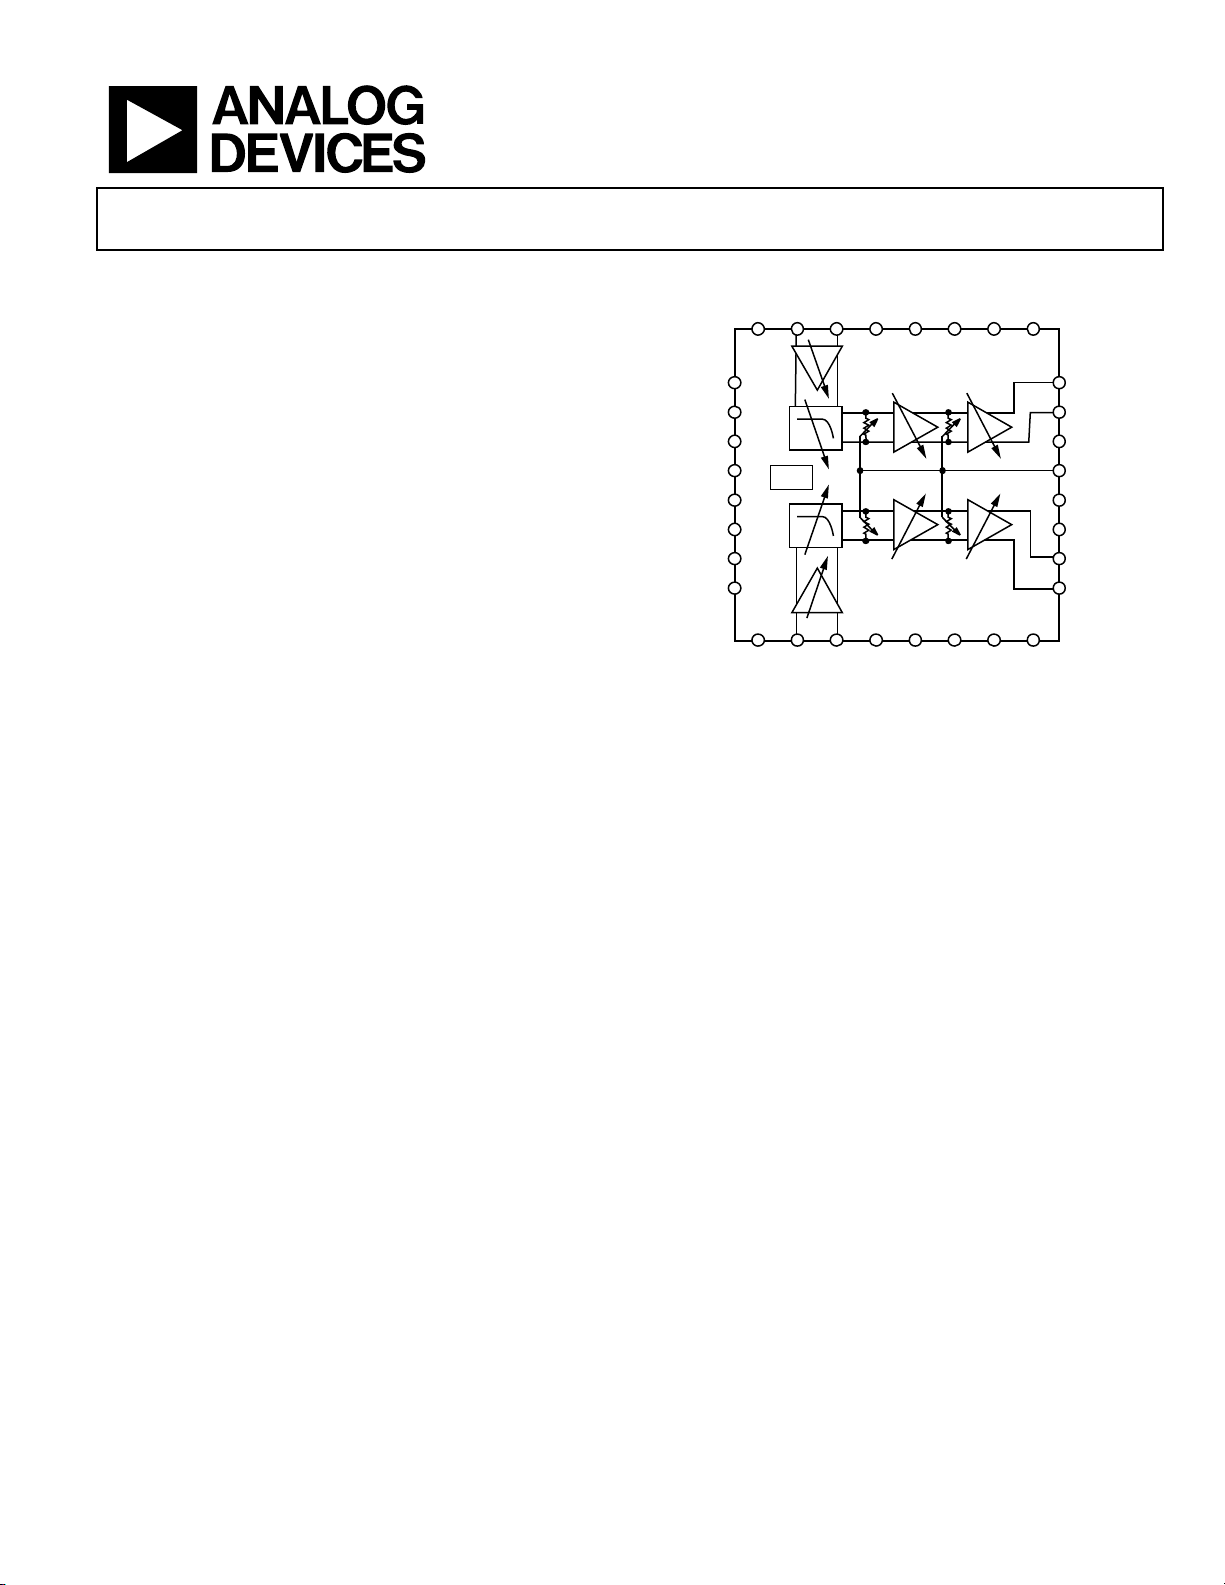
ADRF6516
FUNCTIONAL BLOCK DIAGRAM
INP1 INM1
ENBL
VPSD
COMD
LE
CLK
DATA
SDO
COM
VPS
SPI
COM INP2 INM2 VPS COM OFDS OFS2 V PS
PS
COMVICM OFS1VPS
ADRF6516
Figure 1.
OPP1
OPM1
COM
GAIN
VOCM
COM
OPM2
OPP2
09422-001
GENERAL DESCRIPTION
The ADRF6516 is a matched pair of fully differential, low noise
and low distortion programmable filters and variable gain
amplifiers (VGAs). Each channel is capable of rejecting large
out-of-band interferers while reliably boosting the desired signal,
thus reducing the bandwidth and resolution requirements on the
analog-to-digital converters (ADCs). The excellent matching
between channels and their high spurious-free dynamic range
over all gain and bandwidth settings make the ADRF6516 ideal
for quadrature-based (IQ) communication systems with dense
constellations, multiple carriers, and nearby interferers.
The filters provide a six-pole Butterworth response with 1 dB
corner frequencies programmable through the SPI port from
1 MHz to 31 MHz in 1 MHz steps. The preamplifier that precedes
the filters offers a SPI-programmable option of either 3 dB or 6 dB
of gain. The preamplifier sets a differential input impedance of
1600 and has a common-mode voltage that defaults to VPS/2
but can be driven from 1.1 V to 1.8 V.
Rev. A
Information furnished by Analog Devices is believed to be accurate and reliable. However, no
responsibility is assumed by Analog Devices for its use, nor for any infringements of patents or other
rights of third parties that may result from its use. Specifications subject to change without notice. No
license is granted by implication or otherwise under any patent or patent rights of Analog Devices.
Trademarks and registered trademarks are the property of their respective owners.
The variable gain amplifiers that follow the filters provide 50 dB
of continuous gain control with a slope of 15.5 mV/dB. Their
maximum gains can be programmed to various values through
the SPI. The output buffers provide a differential output impedance
of 30 Ω and are capable of driving 2 V p-p into 1 kΩ loads. The
output common-mode voltage defaults to VPS/2, but it can be
adjusted down to 700 mV by driving the high impedance VOCM
pin. Independent, built-in dc offset compensation loops can be
disabled if fully dc-coupled operation is desired. The high-pass
corner frequency is defined by external capacitors on the OFS1
and OFS2 pins and the VGA gain.
The ADRF6516 operates from a 3.15 V to 3.45 V supply
and consumes a maximum supply current of 360 mA when
programmed to the highest bandwidth setting. When disabled,
it consumes <9 mA. The ADRF6516 is fabricated in an advanced
silicon-germanium BiCMOS process and is available in a 32-lead,
exposed paddle LFCSP. Performance is specified over the −40°C
to +85°C temperature range.
One Technology Way, P.O. Box 9106, Norwood, MA 02062-9106, U.S.A.
Tel: 781.329.4700 www.analog.com
Fax: 781.461.3113 ©2010–2011 Analog Devices, Inc. All rights reserved.

ADRF6516 Data Sheet
TABLE OF CONTENTS
Features .............................................................................................. 1
Applications ....................................................................................... 1
Functional Block Diagram .............................................................. 1
General Description ......................................................................... 1
Revision History ............................................................................... 2
Specifications ..................................................................................... 3
Timing Diagrams .......................................................................... 5
Absolute Maximum Ratings ............................................................ 6
ESD Caution .................................................................................. 6
Pin Configuration and Function Descriptions ............................. 7
Typical Performance Characteristics ............................................. 8
Register Map and Codes ................................................................ 15
Theory of Operation ...................................................................... 16
Input Buffers ............................................................................... 16
Programmable Filters ................................................................. 16
Variable Gain Amplifiers (VGAs) ............................................ 17
Output Buffers/ADC Drivers ................................................... 17
DC Offset Compensation Loop ................................................ 17
Programming the Filters and Gains ......................................... 18
Noise Characteristics ................................................................. 18
Distortion Characteristics ......................................................... 19
REVISION HISTORY
9/11—Revision A: Initial Version
Maximizing the Dynamic Range.............................................. 19
Key Parameters for Quadrature-Based Receivers .................. 20
Applications Information .............................................................. 21
Basic Connections ...................................................................... 21
Supply Decoupling ..................................................................... 21
Input Signal Path ........................................................................ 21
Output Signal Path ..................................................................... 21
DC Offset Compensation Loop Enabled ................................ 21
Common-Mode Bypassing ....................................................... 21
Serial Port Connections ............................................................. 22
Enable/Disable Function ........................................................... 22
Error Vector Magnitude (EVM) Performance ........................... 22
EVM Test Setup .......................................................................... 22
Effect of Filter Bandwidth on EVM ......................................... 22
Effect of Output Voltage Levels on EVM ................................ 23
Effect of C
Evaluation Board ............................................................................ 24
Evaluation Board Control Software ......................................... 24
Schematics and Artwork ........................................................... 25
Outline Dimensions ....................................................................... 27
Ordering Guide .......................................................................... 27
Value on EVM ..................................................... 23
OFS
Rev. A | Page 2 of 28

Data Sheet ADRF6516
SPECIFICATIONS
VPS = 3.3 V, TA = 25°C, Z
Table 1.
Parameter Test Conditions/Comments Min Typ Max Unit
FREQUENCY RESPONSE
Low-Pass Corner Frequency, fC 6-pole Butterworth filter, 0.5 dB bandwidth 1 31 MHz
Step Size 1 MHz
Corner Frequency Absolute
Accuracy
Corner Frequency Matching
Pass-Band Ripple 0.5 dB p-p
Gain Matching
Group Delay Variation From midband to peak
Corner Frequency = 1 MHz 135 ns
Corner Frequency = 31 MHz 11 ns
Group Delay Matching Channel A and Channel B at same gain
Corner Frequency = 1 MHz 5 ns
Corner Frequency = 31 MHz 0.2 ns
Stop-Band Rejection
Relative to Pass Band 2 × fC 30 dB
5 × fC 75 dB
INPUT STAGE INP1, INM1, INP2, INM2, VICM pins
Maximum Input Swing At minimum gain, V
Differential Input Impedance 1600 Ω
Input Common-Mode Range 0.4 V p-p input voltage, HD3 > 65 dBc 1.1 1.65 1.8 V
Input pins left floating VPS/2 V
VICM Output Impedance 7 kΩ
GAIN CONTROL GAIN pin
Voltage Gain Range V
Gain Slope 15.5 mV/dB
Gain Error V
OUTPUT STAGE OPP1, OPM1, OPP2, OPM2, VOCM pins
Maximum Output Swing At maximum gain, R
HD2 > 65 dBc, HD3 > 65 dBc 1.5 V p-p
Differential Output Impedance 30 Ω
Output DC Offset Inputs shorted, offset loop disabled 35 mV
Output Common-Mode Range 0.7 1.65 2.8 V
VOCM pin left floating VPS/2 V
VOCM Input Impedance 23 kΩ
NOISE/DISTORTION
Corner Frequency = 1 MHz
Output Noise Density Gain = 0 dB at fC/2 −141 dBV/√Hz
Gain = 20 dB at fC/2 −131 dBV/√Hz
Gain = 40 dB at fC/2 −112 dBV/√Hz
Second Harmonic, HD2 250 kHz fundamental, 1.5 V p-p output voltage
Gain = 5 dB 82 dBc
Gain = 40 dB 68 dBc
Third Harmonic, HD3 250 kHz fundamental, 1.5 V p-p output voltage
Gain = 5 dB 71 dBc
Gain = 40 dB 56 dBc
= 1 kΩ, digital gain code = 111, unless otherwise noted.
LOAD
Over operating temperature range ±15 % f
Channel A and Channel B at same gain and
bandwidth settings
Channel A and Channel B at same gain and
bandwidth settings
= 0 V 1 V p-p
GAIN
from 0 V to 1 V −5 +45 dB
GAIN
from 300 mV to 800 mV 0.2 dB
GAIN
= 1 kΩ 2 V p-p
LOAD
C
±0.5 % f
C
±0.1 dB
Rev. A | Page 3 of 28

ADRF6516 Data Sheet
Parameter Test Conditions/Comments Min Typ Max Unit
IMD3
f1 = 500 kHz, f2 = 550 kHz, 1.5 V p-p composite
output voltage
Gain = 5 dB 61 dBc
Gain = 35 dB 42.5 dBc
IMD3 with Input CW Blocker
f1 = 500 kHz, f2 = 550 kHz, 1.5 V p-p composite
output, gain = 5 dB; blocker at 5 MHz, 10 dBc
relative to two-tone composite output voltage
Corner Frequency = 31 MHz
Output Noise Density Midband, gain = 0 dB −143.5 dBV/√Hz
Midband, gain = 20 dB −139 dBV/√Hz
Midband, gain = 40 dB −125 dBV/√Hz
Second Harmonic, HD2 8 MHz fundamental, 1.5 V p-p output voltage
Gain = 5 dB 68 dBc
Gain = 40 dB 70 dBc
Third Harmonic, HD3 8 MHz fundamental, 1.5 V p-p output voltage
Gain = 5 dB 55 dBc
Gain = 40 dB 75 dBc
IMD3
f1 = 14 MHz, f2 = 15 MHz, 1.5 V p-p composite
output voltage
Gain = 5 dB 55 dBc
Gain = 35 dB 77.5 dBc
IMD3 with Input CW Blocker
f1 = 14 MHz, f2 = 15 MHz, 1.5 V p-p composite
output, gain = 5 dB; blocker at 150 MHz, 10 dBc
relative to two-tone composite output voltage
DIGITAL LOGIC LE, CLK, DATA, SDO, OFDS pins
Input High Voltage, V
Input Low Voltage, V
Input Current, I
INH/IINL
>2 V
INH
<0.8 V
INL
<1 μA
Input Capacitance, CIN 2 pF
SPI TIMING LE, CLK, DATA, SDO pins (see Figure 2 and Figure 3)
f
1/t
SCLK
20 MHz
SCLK
tDH DATA hold time 5 ns
tDS DATA setup time 5 ns
tLH LE hold time 5 ns
tLS LE setup time 5 ns
tPW CLK high pulse width 5 ns
tD CLK to SDO delay 5 ns
POWER AND ENABLE VPS, VPSD, COM, COMD, ENBL pins
Supply Voltage Range 3.15 3.3 3.45 V
Total Supply Current ENBL = 3.3 V
Corner frequency = 31 MHz 360 mA
Corner frequency = 1 MHz 330 mA
Disable Current ENBL = 0 V 9 mA
Disable Threshold 1.6 V
Enable Response Time Delay following ENBL low-to-high transition 20 μs
Disable Response Time Delay following ENBL high-to-low transition 300 ns
40 dBc
55 dBc
Rev. A | Page 4 of 28
Data Sheet ADRF6516
A
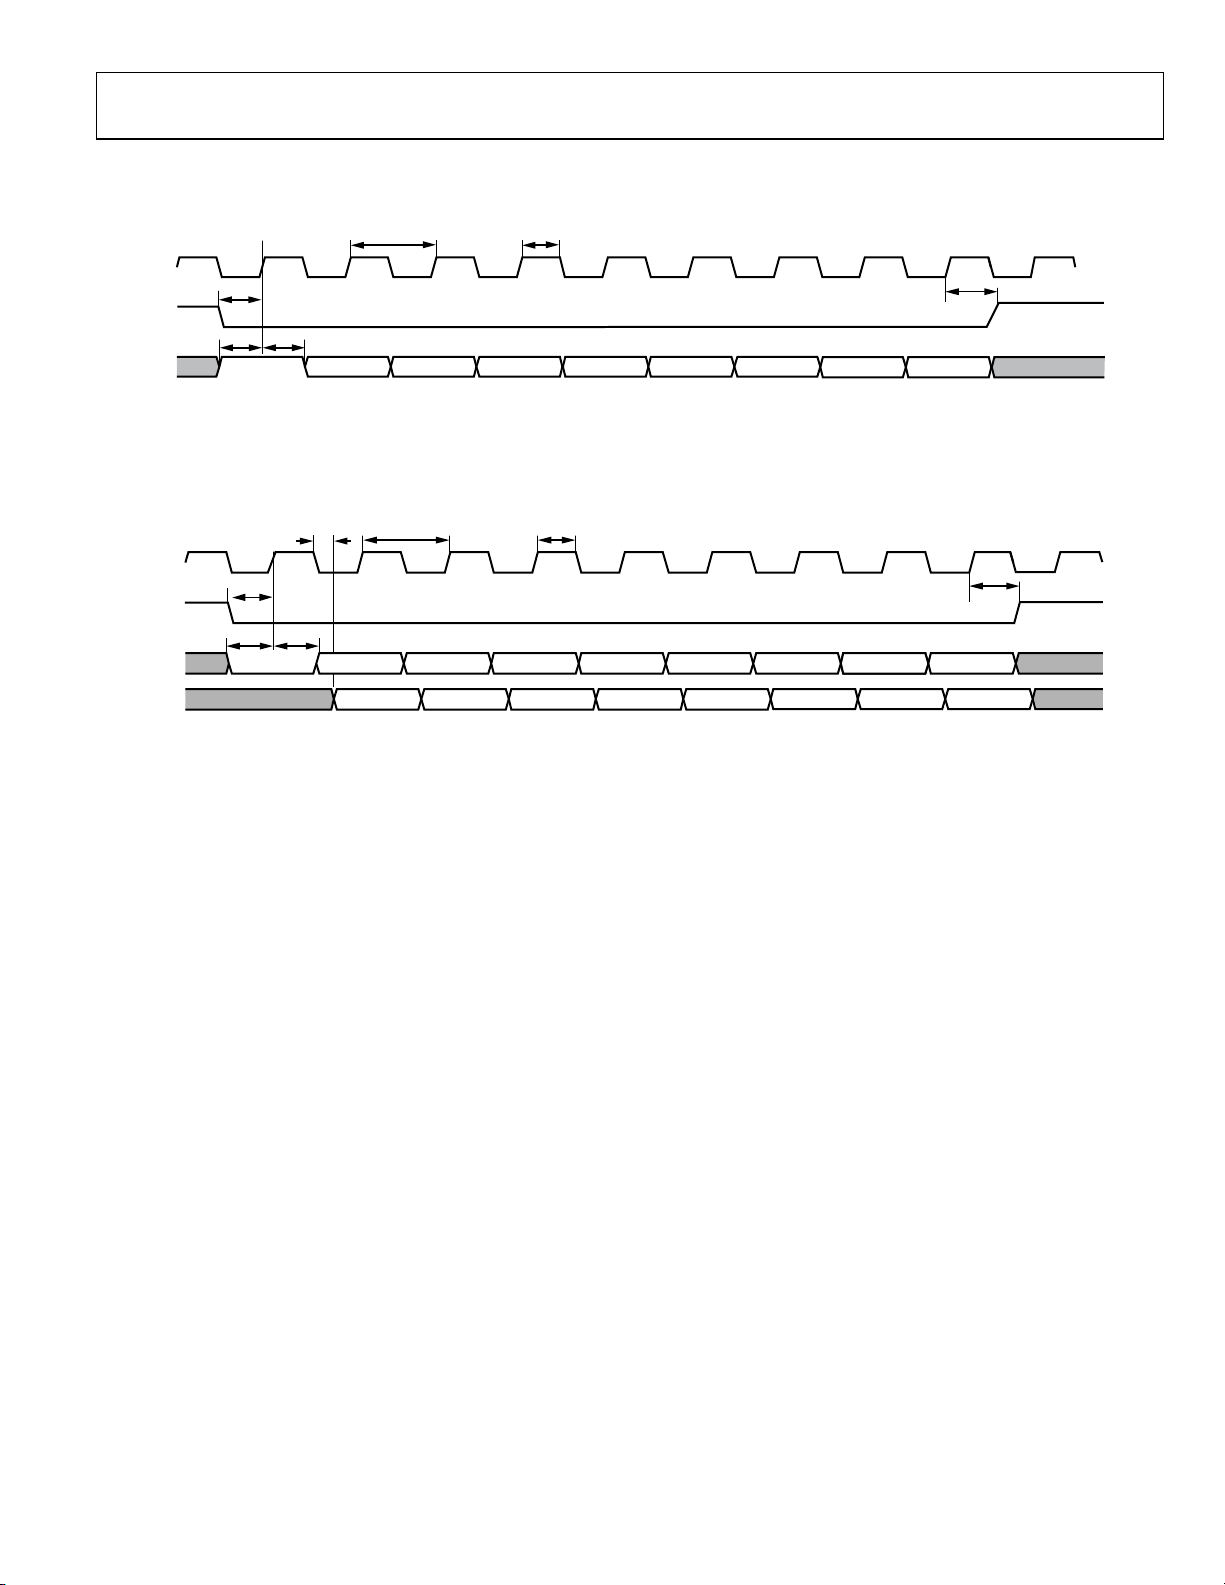
TIMING DIAGRAMS
t
CLK
CLK
LE
DAT
NOTES
1. THE FI RST DATA BIT DETERMINES WHETHER THE PART IS W RITING T O OR READING FROM THE INTERNAL 8- BIT REGI STER. F OR A WRITE
OPERATIO N, THE FI RST BIT SHOULD BE A LO GIC 1. T HE 8-BIT WO RD IS THEN W RITTEN T O THE DATA P IN ON CONSECUT IVE RISI NG
EDGES OF THE CLOCK.
t
LS
tDSt
WRITE BIT
DH
B2LSB
t
CLK
DON’T CAREDON’T CAREREAD BIT DON’T CARE DO N’T CARE DON’T CARE DON’T CARE DON'T CARE
CLK
DATA
t
D
t
LS
LE
t
DStDH
t
PW
B3
B4 B5 B6
Figure 2. Write Mode Timing Diagram
t
PW
B7 MSB
MSB - 2
DON’T CAREDON’T CARE
t
LH
9422-003
t
LH
SDO
NOTES
1. THE FI RST DATA BIT DETERMINES W HETHER THE PART IS WRITING TO OR READING F ROM THE I NTERNAL 8-BIT REGIST ER. FOR A READ
OPERATION, THE F IRST BIT SHOULD BE A LOGIC 0. T HE 8-BIT W ORD IS THE N REGISTERED AT THE SDO PIN ON CONSECUTIVE FALLING E DGES
OF THE CL OCK.
B2LSB
B3
B4 B5
B6
B7 MSB
Figure 3. Read Mode Timing Diagram
09422-004
Rev. A | Page 5 of 28
ADRF6516 Data Sheet
ABSOLUTE MAXIMUM RATINGS
Table 2.
Parameter Rating
Supply Voltages, VPS, VPSD 3.45 V
ENBL, OFDS, LE, CLK, DATA, SDO VPSD + 0.5 V
INP1, INM1, INP2, INM2 VPS + 0.5 V
OPP1, OPM1, OPP2, OPM2 VPS + 0.5 V
OFS1, OFS2 VPS + 0.5 V
GAIN VPS + 0.5 V
Internal Power Dissipation 1.25 W
θJA (Exposed Pad Soldered to Board) 37.4°C/W
Maximum Junction Temperature 150°C
Operating Temperature Range −40°C to +85°C
Storage Temperature Range −65°C to +150°C
Lead Temperature (Soldering 60 sec) 300°C
Stresses above those listed under Absolute Maximum Ratings
may cause permanent damage to the device. This is a stress
rating only; functional operation of the device at these or any
other conditions above those indicated in the operational
section of this specification is not implied. Exposure to absolute
maximum rating conditions for extended periods may affect
device reliability.
ESD CAUTION
Rev. A | Page 6 of 28
Data Sheet ADRF6516
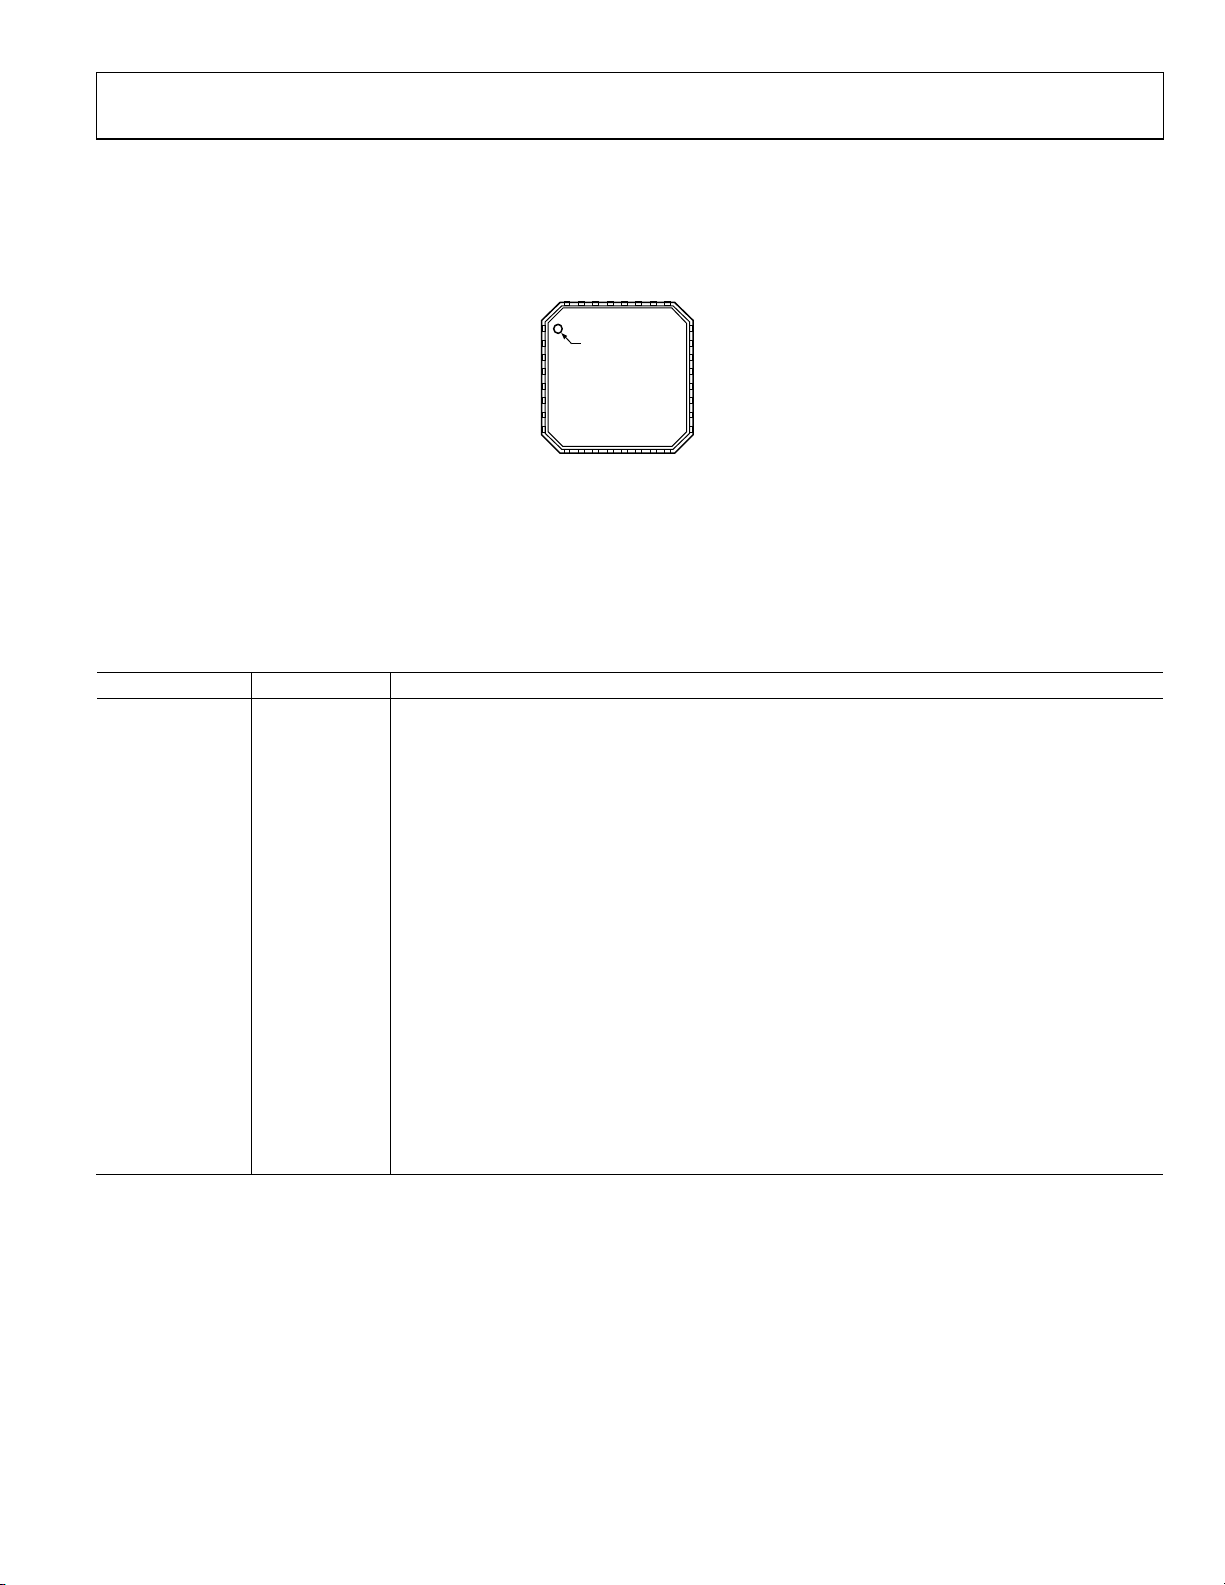
PIN CONFIGURATION AND FUNCTION DESCRIPTIONS
L
M1
COM
ENB
32
VICM
IN
VPS
OFS1
INP1
31
30
VPS
29
28
27
26
25
1VPSD
PIN 1
2COMD
INDICATOR
3LE
4CLK
ADRF6516
5DATA
TOP VIEW
6SDO
(Not to Scal e)
7COM
8VPS
1
9
1
13
10
12
VPS
INP2
COM
COM
INM2
NOTES
1. CONNECT THE EXPOSED PADDLE TO
A LOW IMPEDANCE GROUND PAD.
24 OPP1
23 OPM1
22 COM
21 GAIN
20 VOCM
19 COM
18 OPM2
17 OPP2
14
15
16
VPS
OFS2
OFDS
09422-002
Figure 4. Pin Configuration
Table 3. Pin Function Descriptions
Pin No. Mnemonic Description
1 VPSD Digital Positive Supply Voltage: 3.15 V to 3.45 V.
2 COMD Digital Common. Connect to external circuit common using the lowest possible impedance.
3 LE Latch Enable. SPI programming pin. TTL levels: V
4 CLK SPI Port Clock. TTL levels: V
5 DATA SPI Data Input. TTL levels: V
6 SDO SPI Data Output. TTL levels: V
< 0.8 V, V
LOW
< 0.8 V, V
LOW
LOW
HIGH
< 0.8 V, V
HIGH
> 2 V.
> 2 V.
HIGH
LOW
> 2 V.
< 0.8 V, V
HIGH
> 2 V.
7, 9, 13, 19, 22, 28 COM Analog Common. Connect to external circuit common using the lowest possible impedance.
8, 12, 16, 25, 29 VPS Analog Positive Supply Voltage: 3.15 V to 3.45 V.
10, 11, 30, 31
INP2, INM2,
Differential Inputs. 1600 Ω input impedance.
INM1, INP1
14 OFDS Offset Compensation Loop Disable. Pull high to disable the offset compensation loop.
15, 26 OFS2, OFS1 Offset Compensation Loop Capacitors. Connect capacitors to circuit common.
17, 18, 23, 24
OPP2, OPM2,
Differential Outputs. 30 Ω output impedance. Common-mode range is 0.7 V to 2.8 V; default is VPS/2.
OPM1, OPP1
20 VOCM Output Common-Mode Setpoint. Defaults to VPS/2 if left floating.
21 GAIN Analog Gain Control. 0 V to 1 V, 15.5 mV/dB gain scaling.
27 VICM
Input Common-Mode Voltage. VPS/2 V reference. Use to reference the optimal common-mode drive
to the differential inputs.
32 ENBL Chip Enable. Pull high to enable.
EP Exposed Paddle. Connect the exposed paddle to a low impedance ground pad.
Rev. A | Page 7 of 28
ADRF6516 Data Sheet
A
–
TYPICAL PERFORMANCE CHARACTERISTICS
VPS = 3.3 V, TA = 25°C, Z
50
BANDWIDTH = 31MHz
45
40
35
30
25
VPS = 3.15V, 3.3V, 3.45V
20
15
GAIN (dB)
10
5
0
–5
–10
0 100 200 300 400
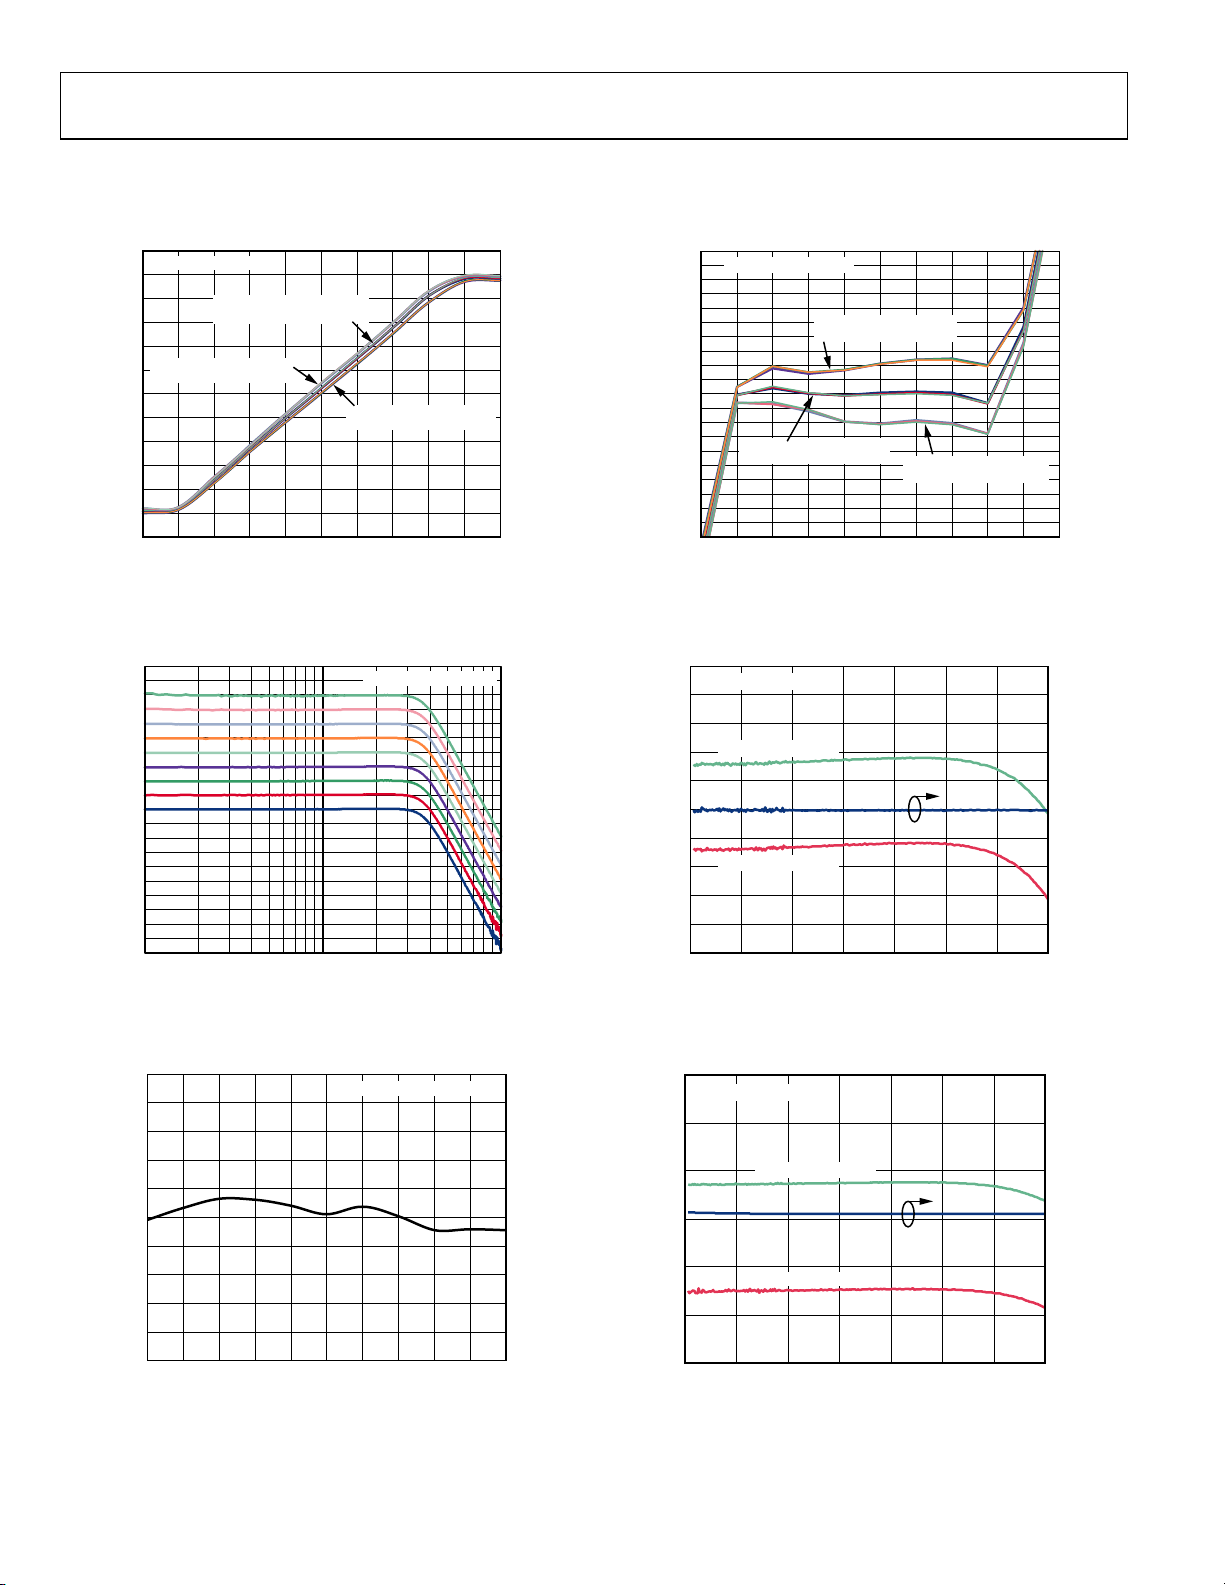
Figure 5. In-Band Gain vs. V
VPS = 3.15V, 3.3V, 3.45V
(Bandwidth Setting = 31 MHz)
= 1 kΩ, digital gain code = 111, unless otherwise noted.
LOAD
+25°C
–40°C
+85°C
VPS = 3.15V, 3.3V, 3.45V
500 600
V
(mV)
GAIN
over Supply and Temperature
GAIN
700 800 900
1000
09422-005
5.0
BANDWIDTH = 31MHz
4.5
4.0
3.5
3.0
2.5
2.0
1.5
1.0
0.5
0
–0.5
–1.0
–1.5
GAIN ERROR (dB)
–2.0
–2.5
–3.0
–3.5
–4.0
–4.5
–5.0
+25°C
VPS = 3.15V, 3.3V, 3.45V
0 100 200 300 400 500 600 700 800 900 1000
Figure 8. Gain Conformance vs. V
+85°C
VPS = 3.15V, 3.3V, 3.45V
–40°C
VPS = 3.15V, 3.3V, 3.45V
V
(mV)
GAIN
over Supply and Temperature
GAIN
(Bandwidth Setting = 31 MHz)
09422-008
50
45
40
35
30
25
20
15
10
5
0
–5
GAIN (dB)
–10
–15
–20
–25
–30
–35
–40
–45
–50
110
FREQUENCY (MHz)
Figure 6. Gain vs. Frequency over V
0.25
0.20
0.15
0.10
0.05
TCH (dB)
0
–0.05
–0.10
GAIN MISM
–0.15
–0.20
–0.25
0 100 200 300 400 500 600 700 800 900 1000
Figure 7. Gain Matching vs. V
V
GAIN
GAIN
BANDWIDTH = 31MHz
(Bandwidth Setting = 31 MHz)
GAIN
BANDWIDTH = 31MHz
(mV)
(Bandwidth Setting = 31 MHz)
–10
–11
AMPLI TUDE (d B)
–12
–13
–14
100
09422-006
09422-007
–15
–5
–10
–15
AMPLITUDE ( dB)
–20
–25
–30
5
BANDWIDTH = 31MHz
–6
–7
DIGITAL GAIN = 111
–8
–9
DIGITAL GAIN = 011
0 5 10 15 20 25 30 35
FREQUENCY ( MHz)
Figure 9. Gain Step and Gain Error vs. Frequency
(Bandwidth Setting = 31 MHz, V
0
BANDWIDTH = 31MHz
DIGITAL GAIN = 011
DIGITAL GAIN = 000
0 5 10 15 20 25 30 35
FREQUENCY ( MHz)
GAIN
= 0 V)
Figure 10. Gain Step and Gain Error vs. Frequency
(Bandwidth Setting = 31 MHz, V
GAIN
= 0 V)
8
7
6
5
4
3
2
GAIN STEP (dB)
1
0
–1
–2
09422-009
14
13
12
11
GAIN STEP (dB)
10
9
8
09422-010
Rev. A | Page 8 of 28
Data Sheet ADRF6516
A
L
A
A
20
BANDWIDTH = 31MHz
15
10
DIGITAL GAIN = 111
DIGITAL GAIN = 000
0 5 10 15 20 25 30 35 40
GAIN (dB)
OP1dB (dBV )
5
0
–5
–10
–15
–20
Figure 11. Output P1dB vs. Gain at 15 MHz (Bandwidth Setting = 31 MHz)
40
35
30
25
20
15
GAIN (dB)
10
5
0
–5
–10
110
FREQUENCY ( MHz)
100
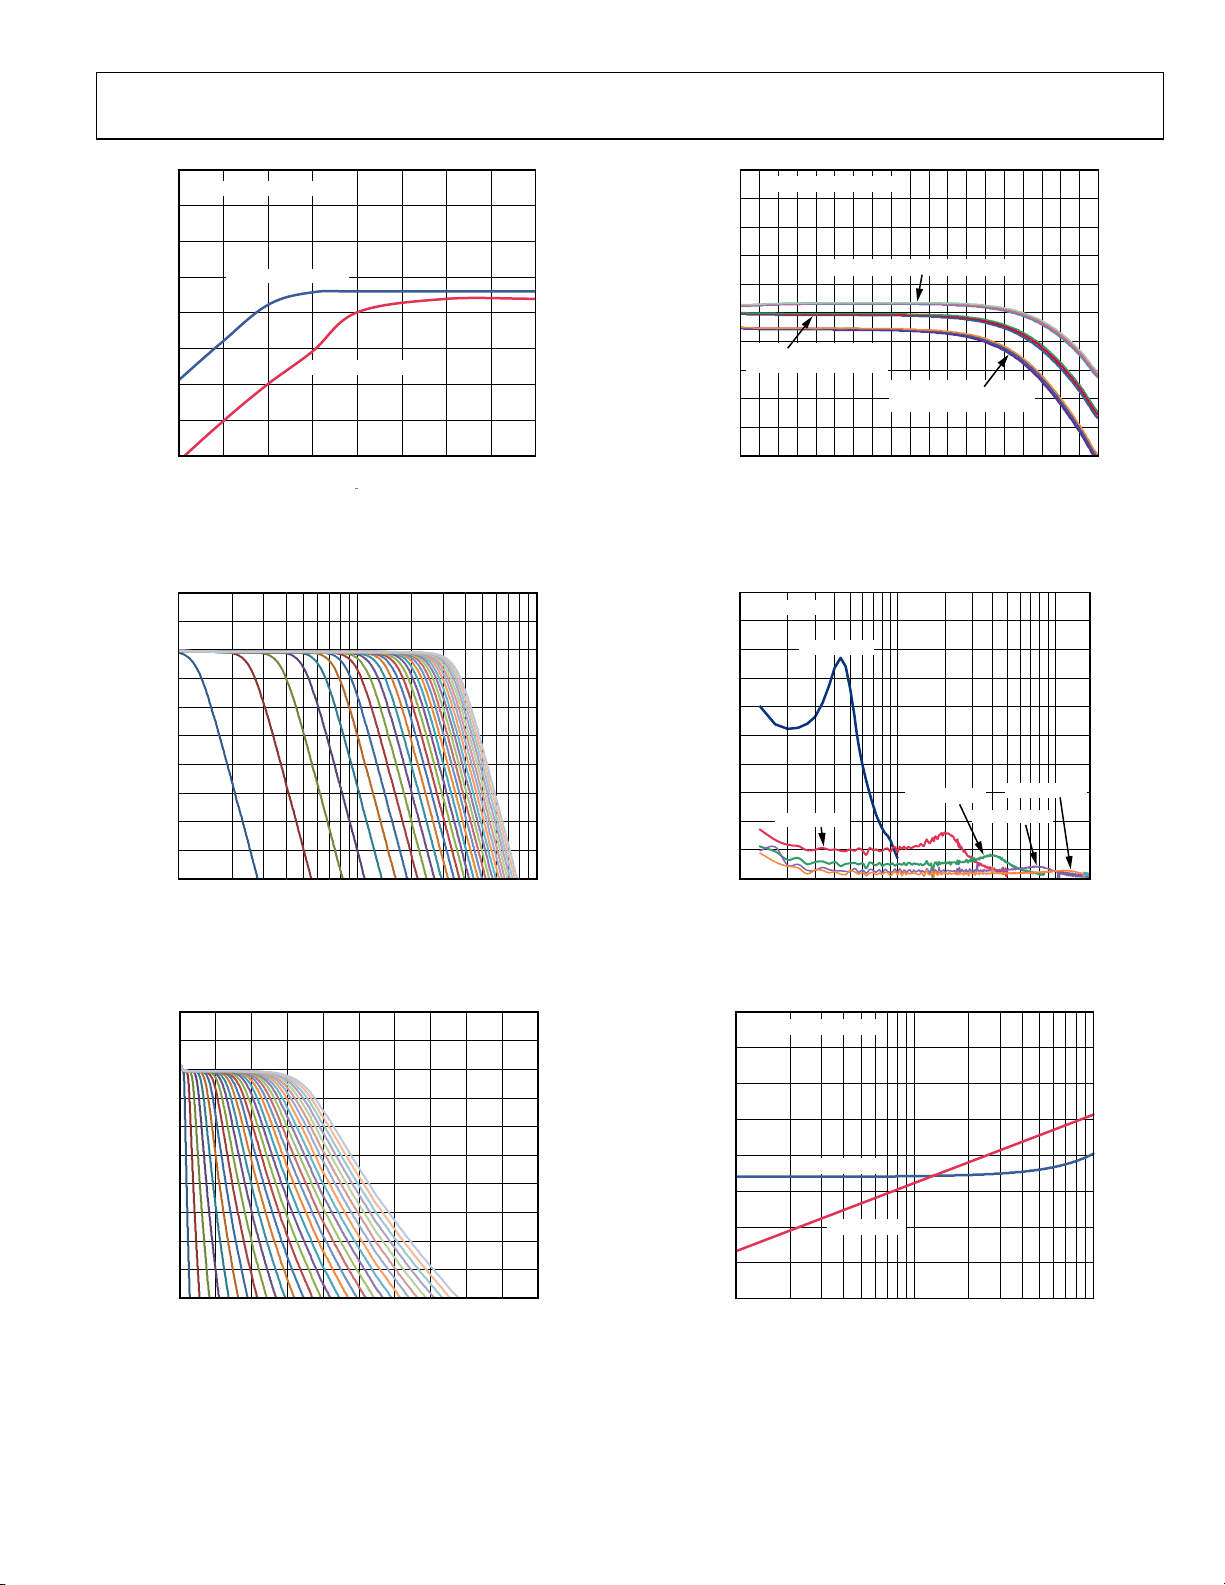
Figure 12. Frequency Response vs. Bandwidth Setting (Gain = 30 dB),
Log Scale
40
BANDWIDTH = 31MHz
38
36
34
32
30
GAIN (dB)
28
+25°C,
VPS = 3.15V, 3.3V, 3.45V
26
24
22
20
09422-011
2 4 6 8 10 12 14 16 18 20 22 24 26 28 30 32 34 36 38 40
–40°C, VPS = 3.15V, 3.3V, 3.45V
+85°C,
VPS = 3.15V, 3.3V, 3.45V
V
(mV)
GAIN
09422-014
Figure 14. Frequency Response over Supply and Temperature
(Bandwidth Setting = 31 MHz, Gain = 30 dB)
1000
GAIN = 20dB
900
800
700
600
Y (ns)
500
400
GROUP DEL
300
200
100
0
0.3 3 30
09422-012
BW = 1MHz
BW = 5MHz
BW = 10MHz
FREQUENCY ( MHz)
BW = 31MHz
BW = 20MHz
50
09422-015
Figure 15. Group Delay vs. Frequency (Gain = 20 dB)
40
35
30
25
20
15
GAIN (dB)
10
5
0
–5
–10
0 102030405060708090100
FREQUENCY ( MHz)
Figure 13. Frequency Response vs. Bandwidth Setting (Gain = 30 dB),
Linear Scale
09422-013
2.0
BANDWIDTH = 31MHz
1.5
1.0
TCH (ns)
0.5
0
Y MISM
–0.5
–1.0
GROUP DE
–1.5
–2.0
0.3 3 30
GAIN = 20dB
GAIN = 40dB
FREQUENCY ( MHz)
Figure 16. Group Delay Matching vs. Frequency
(Bandwidth Setting = 31 MHz)
09422-016
Rev. A | Page 9 of 28

ADRF6516 Data Sheet
L
A
A
A
A
A
A
A
5
BANDWIDTH = 1MHz
4
3
2
TCH (ns)
1
0
Y MISM
–1
–2
GROUP DE
–3
–4
–5
0.2 0.4 0.6 0.8 1. 0 1.2 1.4
GAIN = 20dB
GAIN = 0dB
FREQUENCY ( MHz)
Figure 17. IQ Group Delay Matching vs. Frequency
(Bandwidth Setting = 1 MHz)
09422-017
90
VOCM = 0.9V
VOCM = 1.2V
VOCM = 1.4V
VOCM = 1.65V
80
70
60
T 16MHz (dBc)
50
HD2
40
30
0 5 10 15 20 25 30 35 40 45
GAIN (dB)
09422-020
Figure 20. HD2 vs. Gain over Output Common-Mode Voltage
(Bandwidth Setting = 31 MHz, 1.5 V p-p, 8 MHz CW Fundamental Output)
0 0.5 1.0 1.5 2.0 2.5 3.0
0.50
0.25
TCH (dB)
BANDWIDTH = 30MHz
0
–0.25
AMPLITUDE MISM
–0.50
0 5 10 15
FREQUENCY (MHz)
BANDWIDTH = 1MHz
20 25 30
FREQUENCY (MHz)
Figure 18. IQ Amplitude Matching vs. Frequency
90
80
70
60
50
40
T 16MHz (dBc)
+25°C, VPS = 3.3V
+25°C, VPS = 3.15V
30
HD2
+25°C, VPS = 3.45V
+85°C, VPS = 3.3V
20
+85°C, VPS = 3.15V
+85°C, VPS = 3.45V
–40°C, VPS = 3.3V
10
–40°C, VPS = 3.15V
–40°C, VPS = 3.45V
0
0 5 10 15 20 25 30 35 40 45
GAIN (dB)
09422-019
Figure 19. HD2 vs. Gain over Supply and Temperature
(Bandwidth Setting = 31 MHz, 1.5 V p-p, 8 MHz CW Fundamental Output)
90
80
70
60
50
40
T 24MHz (dBc)
30
HD3
20
10
0
0 5 10 15 20 25 30 35 40 45
GAIN (dB)
09422-018
+25°C, VPS = 3.3V
+25°C, VPS = 3.15V
+25°C, VPS = 3.45V
+85°C, VPS = 3.3V
+85°C, VPS = 3.15V
+85°C, VPS = 3.45V
–40°C, VPS = 3.3V
–40°C, VPS = 3.15V
–40°C, VPS = 3.45V
09422-022
Figure 21. HD3 vs. Gain over Supply and Temperature
(Bandwidth Setting = 31 MHz, 1.5 V p-p, 8 MHz CW Fundamental Output)
90
VOCM = 0.9V
VOCM = 1.2V
VOCM = 1.4V
VOCM = 1.65V
80
70
60
T 24MHz (dBc)
50
HD3
40
30
0 5 10 15 20 25 30 35 40 45
GAIN (dB)
09422-023
Figure 22. HD3 vs. Gain over Output Common-Mode Voltage
(Bandwidth Setting = 31 MHz, 1.5 V p-p, 8 MHz CW Fundamental Output)
Rev. A | Page 10 of 28

Data Sheet ADRF6516
A
80
GAIN = 0dB, HD2
GAIN = 0dB, HD3
GAIN = 10dB, HD2
75
GAIN = 10dB, HD3
70
65
60
HARMONIC DIS TORTION ( dBc)
55
50
0.50 0.75 1.00 1. 25 1.50 1.75 2.00 2.25 2. 50
VICM (V)
Figure 23. HD2 and HD3 vs. Input Common-Mode Voltage
(Bandwidth Setting = 31 MHz, 0.4 V p-p Input Level)
45
BANDWIDTH = 31MHz
f1 = 14MHz, f2 = 15MHz
40
35
30
25
20
OIP3 (dBV)
15
10
5
0
0 5 10 15 20 25 30 35 40 45 50
DIGITAL GAIN = 000
DIGITAL GAIN = 111
GAIN (dB)
Figure 24. In-Band OIP3 vs. Gain (Bandwidth Setting = 31 MHz)
110
100
90
80
70
60
IMD3 (dBc)
50
40
30
20
10
09422-024
GAIN = 30dB
GAIN = 20dB
GAIN = 10dB
GAIN = 0dB
0 0.5 1.0 1. 5 2. 0 2.5 3.0 3.5 4.0
COMPOSIT E OUTPUT VOLTAGE (V p-p)
09422-027
Figure 26. In-Band Third-Order Intermodulation Distortion
(Bandwidth Setting = 31 MHz, Digital Gain = 000)
100
90
80
70
60
50
IMD3 (dBc)
40
30
20
10
0
09422-025
GAIN = 40dB
GAIN = 30dB
GAIN = 20dB
GAIN = 10dB
GAIN = 0dB
0 0.5 1.0 1.5 2.0 2.5 3.0 3.5 4.0
COMPOSIT E OUTPUT VOLTAGE (V p-p)
09422-028
Figure 27. In-Band Third-Order Intermodulation Distortion
(Bandwidth Setting = 31 MHz, Digital Gain = 111)
45
BANDWIDTH = 31MHz
f1 = 14MHz, f2 = 15MHz
40
DIGITAL GAIN = 111
35
30
25
20
OIP3 (dBV)
15
10
5
0
0 5 10 15 20 25 30 35 40 45 50
GAIN (dB)
+85°C
Figure 25. In-Band OIP3 vs. Gain over Temperature
(Bandwidth Setting = 31 MHz)
–40°C
+25°C
09422-026
70
60
BANDWIDTH = 31MHz
50
40
30
20
10
0
–10
–20
–30
–40
–50
–60
T 15MHz (dBV)
–70
–80
–90
IMD2
–100
–110
–120
–130
–140
–150
–160
–170
–55 –45 –35 –25 –15 –5 5 15 25 35 45 55 65
INPUT LEV EL AT 115MHz AND 130MHz (dBV/ TONE)
2:1 SLOPE
PREAMP GAIN = 6dB
PREAMP GAIN = 3dB
OUT-OF-BAND IIP 2
Figure 28. Out-of-Band IIP2, IMD2 Tone at Midband
(Bandwidth Setting = 31 MHz)
09422-029
Rev. A | Page 11 of 28

ADRF6516 Data Sheet
A
–
√
–
–
10
BANDWIDTH = 31MHz
0
–10
–20
–30
–40
–50
–60
–70
–80
T 15MHz (dBV)
–90
–100
IMD3
–110
–120
–130
–140
–150
–160
–55 –50 –45 –40 –35 –30 –25 –20 –15 –10 –5 0 5
PREAMP GAIN = 6dB
PREAMP GAIN = 3dB
INPUT LEV EL AT 115MHz AND 215MHz (dBV/ TONE)
3:1 SLOPE
OUT-OF-BAND IIP3
Figure 29. Out-of-Band IIP3, IMD3 Tone at Midband
(Bandwidth Setting = 31 MHz)
60
55
50
45
40
35
NF (dB)
30
25
20
15
10
–20–10 0 1020 304050
GAIN (dB)
DIGITAL GAIN = 000
DIGITAL GAIN = 100
DIGITAL GAIN = 110
DIGITAL GAIN = 111
Figure 30. Noise Figure vs. Analog Gain over Digital Gain
(Bandwidth Setting = 31 MHz, Noise Figure at 1/2 Bandwidth)
110
–115
Hz)
–120
–125
–130
–135
–140
–145
–150
OUTPUT NO ISE DENSITY (dBV/
–155
–160
–20–10 0 1020304050
09422-030
DIGITAL GAIN = 000
DIGITAL GAIN = 100
DIGITAL GAIN = 110
DIGITAL GAIN = 111
GAIN (dB)
09422-033
Figure 32. Output Noise Density vs. Analog Gain over Digital Gain
(Bandwidth Setting = 31 MHz, Measured at 1/2 Bandwidth)
100
–105
–110
–115
–120
–125
–130
–135
–140
OUTPUT NOI SE DENSITY (dBV/√Hz)
–145
–150
09422-031
1MHz
2MHz
4MHz
8MHz
16MHz
31MHz
–5 5152535455010203040
GAIN (dB)
0
09422-034
Figure 33. Output Noise Density vs. Gain over Bandwidth Setting
(Digital Gain = 111, Measured at 1/2 Bandwidth)
50
45
40
35
NF (dB)
30
25
20
–5 5 15253545
GAIN (dB)
1MHz
2MHz
4MHz
8MHz
16MHz
31MHz
Figure 31. Noise Figure vs. Gain over Bandwidth Setting
(Digital Gain = 111, Noise Figure at 1/2 Bandwidth)
09422-032
100
–105
–110
–115
–120
–125
–130
–135
–140
OUTPUT NOI SE DENSITY (dBV/√Hz)
–145
–150
0.4 0.6 0.8 1.0 1.2 1.4 1.6 1.8 2.0 2.2 2.4 2.6 2.8 3.0 3.2
GAIN = 40dB
GAIN = 20dB
GAIN = 0dB
BANDWIDTH = 1MHz
DIGITAL GAIN = 111
FREQUENCY (MHz )
Figure 34. Output Noise Density vs. Frequency
(Bandwidth Setting = 1 MHz, Digital Gain = 111)
09422-052
Rev. A | Page 12 of 28

Data Sheet ADRF6516
–
√
A
√
–
(
L
A
110
BANDWIDTH = 31MHz
–115
Hz)
–120
GAIN = 40dB
DIGITAL GAIN = 111
50
BANDWIDTH = 31MHz
40
35
30
–125
–130
–135
–140
OUTPUT NOISE DENSIT Y (dBV/
–145
–150
5 152535455565758595
GAIN = 20dB
GAIN = 0dB
FREQUENCY (MHz )
Figure 35. Output Noise Density vs. Frequency
(Bandwidth Setting = 31 MHz, Digital Gain = 111)
90
BANDWIDTH = 31MHz
–95
Hz)
T 15MHz (dBV/
OUTPUT NOISE DENSITY
DIGITAL GAIN = 111
–100
–105
–110
–115
–120
–125
–130
–135
–140
–145
–45 –40 –35 –30 –25 –20 –15 –10 –5
GAIN = 40dB
GAIN = 20dB
GAIN = 0dB
BLOCKER LEV EL AT 150MHz (dBV rms)
Figure 36. Output Noise Density vs. Input CW Blocker Level
(Bandwidth Setting = 31 MHz, Blocker at 150 MHz)
(Ω)
30
20
SERIES OUT
R
10
0
5 1015202530
09422-051
FREQUE NCY (MHz)
25
(nH)
20
SERIES OUT
L
15
10
09422-039
Figure 38. Output Impedance vs. Frequency
(Bandwidth Setting = 31 MHz)
120
100
80
60
TION (dB)
ISO
40
20
BANDWIDTH = 31MHz
0
0 5 10 15 20 25 30
09422-037
GAIN = 40dB
GAIN = 20dB
FREQUENCY (MHz)
GAIN = 0dB
09422-040
Figure 39. Channel Isolation, Output to Output, vs. Frequency
(Bandwidth Setting = 31 MHz)
2500
BANDWIDTH = 31MHz
2000
Ω)
1500
IN
R
1000
500
0 5 10 15 20 25 30
FREQUENCY ( MHz)
40
20
0
–20
–40
(pF)
IN
C
09422-038
Figure 37. Input Impedance vs. Frequency
(Bandwidth Setting = 31 MHz)
Rev. A | Page 13 of 28
365
360
355
350
(mA)
345
SUPPLY
I
340
335
330
325
0 5 10 15 20 25 30 35
DIGITAL GAIN = 000
DIGITAL GAIN = 111
BANDWIDTH (MHz)
09422-041
Figure 40. Current Consumption at Minimum and Maximum Digital Gain
vs. Bandwidth (Bandwidth Setting = 31 MHz, Gain = 30 dB)

ADRF6516 Data Sheet
370
BANDWIDTH = 31MHz
368
366
364
362
(mA)
360
SUPPLY
I
358
356
354
352
–40
DIGITAL GAIN = 000
DIGITAL GAIN = 111
–20
20 40 60 80 100
0
TEMPERATURE (°C)
09422-042
Figure 41. Current Consumption at Minimum and Maximum Digital Gain
vs. Temperature (Bandwidth Setting = 31 MHz, Gain = 30 dB)
BANDWIDTH = 31MHz
20dB GAIN ST EP
V
= 750mV TO 450mV
GAIN
70
BANDWIDTH = 31MHz
60
50
40
30
CMRR (dB)
20
10
0
0 5 10 15 20 25 30
GAIN = 40dB
GAIN = 20dB
FREQUENCY (M Hz)
Figure 43. Common-Mode Rejection Ratio (CMRR) vs. Frequency
(Bandwidth Setting = 31 MHz)
09422-144
28MHz SIG NAL = 60mV p- p
TO 600mV p-p
Figure 42. Gain Step Response
200ns/DIV
09422-143
Rev. A | Page 14 of 28

Data Sheet ADRF6516
REGISTER MAP AND CODES
The filter frequency, preamplifier gain, postamplifier gain, and VGA maximum gain can be programmed using the SPI interface. Table 4
provides the bit map for the internal 8-bit register of the ADRF6516. The preamplifier, postamplifier, and VGA maximum gain code bits
(Bits[B3:B1]) are referred to elsewhere in this data sheet as Digital Gain Code 000 through Digital Gain Code 111.
Table 4. Register Map
MSB LSB
B8 B7 B6 B5 B4 B3 B2 B1
Filter frequency code
See Table 5
Table 5. Frequency Code vs. Corner Frequency Lookup Table
5-Bit Binary Frequency Code1 Corner Frequency (MHz)
00000 No signal
00001 1
00010 2
00011 3
00100 4
00101 5
00110 6
00111 7
01000 8
01001 9
01010 10
01011 11
01100 12
01101 13
01110 14
01111 15
Preamplifier gain
code
0 = 3 dB
1 = 6 dB
5-Bit Binary Frequency Code1 Corner Frequency (MHz)
10000 16
10001 17
10010 18
10011 19
10100 20
10101 21
10110 22
10111 23
11000 24
11001 25
11010 26
11011 27
11100 28
11101 29
11110 30
11111 31
1
MSB first.
Postamplifier gain
code
0 = 6 dB
1 = 12 dB
VGA max gain
code
0 = 22 dB
1 = 28 dB
Rev. A | Page 15 of 28

ADRF6516 Data Sheet
THEORY OF OPERATION
The ADRF6516 consists of a matched pair of buffered, programmable filters followed by a cascade of two variable gain amplifiers
and output ADC drivers. The block diagram of a single channel
is shown in Figure 44.
The programmability of the bandwidth and of the pre- and postfiltering gain through the SPI interface offers great flexibility
when coping with signals of varying levels in the presence of
noise and large, undesired signals nearby. The entire differential
signal chain is dc-coupled with flexible interfaces at the input
and output. The bandwidth and gain setting controls for the two
channels are shared, ensuring close matching of their magnitude
and phase responses. The ADRF6516 can be fully disabled
through the ENBL pin.
1MHz TO 31MHz
3dB/6dB
PREAMP
BASEBAND
INPUTS
3dB/6dB
Figure 44. Signal Path Block Diagram for a Single Channel of the ADRF6516
PROG.
FILTERS
SPI
INTERFACE
GAIN AND FIL TER
PROGRAMMING
SPI BUS
25dB
VGA
11dB/14dB
ANALOG
GAIN CONTROL
15mV/dB
25dB
VGA
COMMON-MODE
6dB/12dB
ADC
DRIVER
6dB/12dB
OUTPUT
CONTROL
BASEBAND
OUTPUTS
Filtering and amplification are fundamental operations in any
signal processing system. Filtering is necessary to select the
intended signal while rejecting out-of-band noise and interferers. Amplification increases the level of the desired signal
to overcome noise added by the system. When used together,
filtering and amplification can extract a low level signal of
interest in the presence of noise and out-of-band interferers.
Such analog signal processing alleviates the requirements on
the analog, mixed signal, and digital components that follow.
INPUT BUFFERS
The input buffers provide a convenient interface to the sensitive
filter sections that follow. They set a differential input impedance
of 1600 Ω and float to a common-mode voltage near VPS/2. The
inputs can be dc-coupled or ac-coupled. If using direct dc coupling,
the common-mode voltage presented to the inputs should be
approximately VPS/2 to maximize the input swing capacity.
For a 3.3 V supply, the common-mode voltage can range
from 1.1 V to 1.8 V while maintaining a >65 dBc HD3 for a
400 mV p-p input signal. The VICM pin provides the optimal
midsupply common-mode voltage and can be used as a reference for the driving circuit. The VICM voltage is not buffered
and must be sensed at a high impedance point to prevent it
from being loaded down.
09422-046
The input buffers in both channels can be configured simultaneously for a gain of 3 dB or 6 dB through the SPI (see the
Register Map and Codes section). When configured for a 3 dB
gain, the buffers support a 400 mV p-p differential input level
with ~70 dBc harmonic distortion. For a 6 dB gain setting, the
buffers support 280 mV p-p inputs.
PROGRAMMABLE FILTERS
The integrated programmable filter is the key signal processing
function in the ADRF6516. The filters follow a six-pole Butterworth prototype response that provides a compromise between
band rejection, ripple, and group delay. The 0.5 dB bandwidth is
programmed from 1 MHz to 31 MHz in 1 MHz steps via the serial
programming interface (SPI), as described in the Programming
the Filters and Gains section.
The filters are designed so that the Butterworth prototype filter
shape and group delay responses vs. frequency are retained for
any bandwidth setting. Figure 45 and Figure 46 illustrate the ideal
six-pole Butterworth magnitude and group delay responses,
respectively. The group delay, τ
τ
= −∂φ/∂ω
g
where:
φ is the phase in radians.
ω = 2πf (the frequency in radians/sec).
Note that for a frequency scaled filter prototype, the absolute
magnitude of the group delay scales inversely with the bandwidth; however, the shape is retained. For example, the peak
group delay for a 28 MHz bandwidth setting is 14× less than
for a 2 MHz setting (see Figure 46).
0
–20
–40
–60
–80
–100
–120
RELATIVE MAGNITUDE (Hz)
–140
–160
–180
1M 10M 100M 1G
Figure 45. Sixth-Order Butterworth Magnitude Response for 0.5 dB
Bandwidths Programmed from 2 MHz to 29 MHz in 1 MHz Steps
, is defined as
g
FREQUENCY (Hz)
09422-043
Rev. A | Page 16 of 28

Data Sheet ADRF6516
500
400
300
BW = 2MHz
BW = 28MHz
50
15mV/dB
40
30
0.3
0.2
0.1
200
100
GROUP DELAY (ns)
0
–100
100k 1M 10M 100M
Figure 46. Sixth-Order Butterworth Group Delay Response for
0.5 dB Bandwidths Programmed to 2 MHz and 28 MHz
FREQUENCY (Hz)
14×
09422-044
The corner frequency of the filters is defined by RC products,
which can vary by ±30% in a typical process. Therefore, all the
parts are factory calibrated for corner frequency, resulting in
a residual ±15% corner frequency variation over the −40°C to
+85°C temperature range. Although absolute accuracy requires
calibration, the matching of RC products between the pair of
channels is better than 1% by observing careful design and
layout practices. Calibration and excellent matching ensure
that the magnitude and group delay responses of both channels
track together, a critical requirement for digital IQ-based
communication systems.
VARIABLE GAIN AMPLIFIERS (VGAs)
The cascaded VGAs are based on the Analog Devices, Inc.,
patented X-AMP® architecture, consisting of tapped 25 dB
attenuators followed by programmable gain amplifiers. The
X-AMP architecture generates a continuous linear-in-dB
monotonic gain response with low ripple. The analog gains of
both cascaded VGA sections are controlled through the high
impedance GAIN pin with an accurate slope of 15 mV/dB.
The gain response shown in Figure 47 shows the GAIN pin
voltage range and the absence of gain foldback at high V
By changing the gains of both VGAs simultaneously, a more
gradual variation in noise and distortion is achieved. The fixed
gain following each of the variable gain sections can also be programmed to two different values to maximize dynamic range.
GAIN
.
20
GAIN (dB)
10
0
–10
Figure 47. Linear-in-dB Gain Control Response of the X-AMP VGA Cascade
0.500.25 0.75 1.00 1.501.25 1.75 2.00 2.25 2.50 2.75 3. 00
0
Showing Consistent Slope and Low Error
V
GAIN
(V)
0
–0.1
–0.2
–0.3
GAIN ERROR (dB)
09422-049
OUTPUT BUFFERS/ADC DRIVERS
The low impedance (30 Ω) output buffers of the ADRF6516
are designed to drive either ADC inputs or subsequent amplifier
stages. They are capable of delivering up to 1.5 V p-p composite
two-tone signals into 1 kΩ differential loads with >65 dBc
IMD3. The output common-mode voltage defaults to VPS/2,
but it can be adjusted from 700 mV to 2.8 V without loss of
drive capability by presenting the VOCM pin with the desired
common-mode voltage. The high input impedance of VOCM
allows the ADC reference output to be connected directly. Even
though the output common-mode voltage is adjustable and the
offset compensation loop can null the accumulated dc offsets
(see the DC Offset Compensation Loop section), it may still be
desirable to ac couple the outputs by selecting the coupling capacitors according to the load impedance and desired bandwidth.
DC OFFSET COMPENSATION LOOP
In many signal processing applications, no information is
carried in the dc level. In fact, dc voltages and other low
frequency disturbances can often dominate the intended signal
and consume precious dynamic range in the analog path and
bits in the data converters. These dc voltages can be present
with the desired input signal or can be generated inside the
signal path by inherent dc offsets or other unintended signaldependent processes such as self-mixing or rectification.
Because the ADRF6516 is fully dc-coupled, it may be necessary
to remove these offsets to realize the maximum signal-to-noise
ratio (SNR). This can be achieved with ac coupling capacitors at
the input and output pins; however, large value capacitors with
low impedance values are required because the high-pass corners
must be <10 Hz. To address the issue of dc offsets, the ADRF6516
provides an offset compensation loop that nulls the output differential dc level, as shown in Figure 48. If the compensation loop
is not required, it can be disabled by pulling the OFDS pin high.
Rev. A | Page 17 of 28

ADRF6516 Data Sheet
–
√
–
C
50dB
VGA
OFS
OFSx
OUTPUT ADC
DRIVER
BASEBAND
OUTPUTS
09422-050
FROM
FILTERS
OFDS
GAIN
Figure 48. Offset Compensation Loop Operates Around the VGA
and Output Buffer
The offset compensation loop creates a high-pass corner, fHP,
that is superimposed on the normal Butterworth filter response.
Typically, f
is many orders of magnitude lower than the lowest
HP
programmed filter bandwidth so that there is no interaction
between them. Setting f
C
, from the OFS1 and OFS2 pins to ground. Because the
OFS
compensation loop works around the VGA sections, f
is accomplished with capacitors,
HP
is also
HP
dependent on the total gain of the cascaded VGAs. In general,
the expression for f
(Hz) = 6.7 × (Post Filter Linear Gain/C
f
HP
is given by
HP
OFS
(µF))
where Post Filter Linear Gain is expressed in linear terms, not
in decibels (dB), and is the gain following the filters, which
excludes the preamplifier gain of 1.4 (3 dB) or 2 (6 dB).
Note that f
C
OFS
that f
increases in proportion to the gain. For this reason,
HP
should be chosen at the highest operating gain to guarantee
is always below the maximum limit required by the system.
HP
PROGRAMMING THE FILTERS AND GAINS
The 0.5 dB corner frequencies for both filters and the gains of
the preamplifiers and postamplifiers are programmed simultaneously through the SPI port. An 8-bit register stores the 5-bit
code for corner frequencies of 1 MHz through 31 MHz, as well
as the 1-bit codes for the preamplifier gain, the VGA maximum
gain, and the postamplifier gain (see Table 4). The SPI protocol
not only allows frequency and gain codes to be written to the
DATA pin, but it also allows the stored code to be read back via
the SDO pin.
The latch enable (LE) pin must first go to a Logic 0 for a read or
write cycle to begin. On the next rising edge of the clock (CLK),
a Logic 1 on the DATA pin initiates a write cycle, whereas a
Logic 0 on the DATA pin initiates a read cycle. In a write cycle,
the next eight CLK rising edges latch the desired 8-bit code, LSB
first. When LE goes high, the write cycle is completed and the
frequency and gain codes are presented to the filter and amplifiers. In a read cycle, the next eight CLK falling edges present
the stored 8-bit code, LSB first. When LE goes high, the read
cycle is completed. Detailed timing diagrams are shown in
Figure 2 and Figure 3.
NOISE CHARACTERISTICS
The output noise behavior of the ADRF6516 depends on the gain
and bandwidth settings. Figure 49 and Figure 50 show the total
output noise spectral density vs. frequency for different bandwidth settings and VGA gains.
110
BANDWIDTH = 31MHz
–115
Hz)
–120
–125
–130
–135
–140
OUTPUT NOISE DENSIT Y (dBV/
–145
–150
5 152535455565758595
GAIN = 40dB
GAIN = 20dB
GAIN = 0dB
FREQUENCY (MHz )
Figure 49. Total Output Noise Density with a 31 MHz Corner Frequency
for Three Different Gain Settings
100
–105
–110
–115
–120
–125
–130
–135
–140
OUTPUT NOI SE DENSITY (dBV/√Hz)
–145
–150
0.4 0.6 0.8 1.0 1.2 1.4 1.6 1.8 2.0 2.2 2.4 2.6 2.8 3.0 3.2
GAIN = 40dB
GAIN = 20dB
GAIN = 0dB
FREQUENCY (MHz )
Figure 50. Total Output Noise Density with a 1 MHz Corner Frequency
for Three Different Gain Settings
Both the filter sections and the VGAs contribute to the total noise
at the output. The filter contributes a noise spectral density profile
that is flat at low frequencies, peaks near the corner frequency, and
then rolls off as the filter poles roll off the gain and noise. The
magnitude of the noise spectral density contributed by the filter,
expressed in nV/√Hz, varies inversely with the square root of the
bandwidth setting, resulting in a total integrated noise in nV that is
nearly constant with bandwidth setting. At higher frequencies,
after the filter noise rolls off, the noise floor is set by the VGAs.
Each of the X-AMP VGA sections used in the ADRF6516 contributes a fixed and flat noise spectral density to its respective
output, independent of the gain setting. Because the VGAs are
cascaded in the ADRF6516, the total noise contributed by the
VGAs at the output increases gradually with higher gain. This
is apparent in the noise floor variation at high frequencies at
different VGA gain settings.
DIGITAL GAIN = 111
BANDWIDTH = 1MHz
DIGITAL GAIN = 111
09422-051
09422-052
Rev. A | Page 18 of 28

Data Sheet ADRF6516
The exact relationship depends on the programmed fixed gain of
the amplifiers. At minimum gain, only the last VGA contributes
to the −144 dBV/√Hz minimum noise floor, which is equivalent
to 63 nV/√Hz. At lower frequencies within the filter bandwidth
setting, the VGAs translate the filter noise directly to the output
by a factor equal to the gain following the filter.
At low values of VGA gain, the noise at the output is the flat
spectral density contributed by the last VGA. As the gain
increases, more noise from the filter and first VGA appears at
the output. Because the intrinsic filter noise density increases
at lower bandwidth settings, it is more pronounced than it is
at higher bandwidth settings. In either case, the noise density
asymptotically approaches the limit set by the VGAs at the
highest frequencies. For other values of VGA gain and bandwidth
setting, the detailed shape of the noise spectral density changes
according to the relative contributions of the filters and VGAs.
Because the noise spectral density outside the filter bandwidth
is limited by the VGA output noise, it may be necessary to use
an external, fixed-frequency, passive filter prior to analog-todigital conversion to prevent noise aliasing from degrading the
signal-to-noise ratio. A higher sampling rate relative to the maximum required ADRF6516 corner frequency setting reduces the
order and complexity of this external filter.
DISTORTION CHARACTERISTICS
The distortion performance of the ADRF6516 is similar to its
noise performance. The filters and the VGAs contribute to the
overall distortion and signal handling capabilities. Furthermore,
the front end must also cope with out-of-band signals that can be
larger than the in-band signals. These out-of-band signals are
filtered before reaching the VGA. It is important to understand
the signals presented to the ADRF6516 and to match these
signals with the input and output characteristics of the part.
When the gain is low, the distortion is typically limited by the
input section because the output is not driven to its maximum
capacity. When the gain is high, the distortion is likely limited
by the output section because the input is not driven to its
maximum capacity. An exception to this is when the input is
driven with a small desired signal in combination with a large
out-of-band signal. In this case, the out-of-band signal may
drive the input to distort. As long as the input is not overdriven,
the out-of-band signal is removed by the filter. A high VGA
gain is still needed to raise the small desired signal to a higher
level at the output. The overall distortion introduced by the part
depends on the input drive level, including the out-of-band
signals, and the desired output signal level.
As noted in the Input Buffers section, the input section can
handle a total signal level of 400 mV p-p for a 3 dB preamplifier
gain and 280 mV p-p for a 6 dB preamplifier gain with >70 dBc
harmonic distortion. This includes both in-band and out-of-band
signals.
To distinguish and quantify the distortion performance of the
input section, two different IP3 specifications are presented. The
first is called in-band IP3 and refers to a two-tone test where the
signals are inside the filter bandwidth. This is exactly the same
figure of merit familiar to communications engineers in which
the third-order intermodulation level, IMD3, is measured.
To quantify the effect of out-of-band signals, a new out-of-band
(OOB) IIP3 figure of merit is introduced. This test also involves
a two-tone stimulus; however, the two tones are placed out-ofband so that the lower IMD3 product lands in the middle of the
filter pass band. At the output, only the IMD3 product is visible
because the original two tones are filtered out. To calculate the
OOB IIP3 at the input, the IMD3 level is referred to the input
by the overall gain. The OOB IIP3 allows the user to predict the
impact of out-of-band blockers or interferers at an arbitrary
signal level on the in-band performance. The ratio of the desired
input signal level to the input-referred IMD3 at a given blocker
level represents a signal-to-distortion limit imposed by the outof-band signals.
MAXIMIZING THE DYNAMIC RANGE
The role of the ADRF6516 is to increase the level of a variable
in-band signal while minimizing out-of-band signals. Ideally,
this is achieved without degrading the SNR of the incoming
signal or introducing distortion to the incoming signal.
The first goal is to maximize the output signal swing, which can
be defined by the ADC input range or the input signal capacity
of the next analog stage. For the complex waveforms often encountered in communication systems, the peak-to-average ratio, or
crest factor, must be considered when selecting the peak-to-peak
output. From the selected output signal and the maximum gain
of the ADRF6516, the minimum input level can be defined.
Lower signal levels do not yield the maximum output and suffer
a greater degradation in SNR.
As the input signal level increases, the VGA gain is reduced from
its maximum gain point to maintain the desired fixed output
level. The output noise, initially dominated by the filter, follows
the gain reduction, yielding a progressively better SNR. At some
point, the VGA gain drops sufficiently that the VGA noise
becomes dominant, resulting in a slower reduction in SNR from
that point. From the perspective of SNR alone, the maximum
input level is reached when the VGA reaches its minimum gain.
Rev. A | Page 19 of 28

ADRF6516 Data Sheet
Distortion must also be considered when maximizing the dynamic
range. At low and moderate signal levels, the output distortion
is constant and assumed to be adequate for the selected output
level. At some point, the input signal becomes large enough that
distortion at the input limits the system. The maximum tolerable
input signal depends on whether the input distortion becomes
unacceptably large or the minimum gain is reached.
The most challenging scenario in terms of dynamic range is the
presence of a large out-of-band blocker accompanying a weaker
in-band desired signal. In this case, the maximum input level is
dictated by the blocker and its inclination to cause distortion.
After filtering, the weak desired signal must be amplified to the
desired output level, possibly requiring maximum gain. Both
the distortion limits associated with the blocker at the input and
the SNR limits created by the weaker signal and higher gains are
present simultaneously. Furthermore, not only does the blocker
scenario degrade the dynamic range, it also reduces the range
of input signals that can be handled because a larger part of the
gain range is used to simply extract the weak desired signal
from the stronger blocker.
KEY PARAMETERS FOR QUADRATURE-BASED RECEIVERS
The majority of digital communication receivers makes use of
quadrature signaling, in which bits of information are encoded
onto pairs of baseband signals that then modulate in-phase (I)
and quadrature (Q) sinusoidal carriers. Both the baseband and
modulated signals appear quite complex in the time domain with
dramatic peaks and valleys. In a typical receiver, the goal is to
recover the pair of quadrature baseband signals in the presence
of noise and interfering signals after quadrature demodulation.
In the process of filtering out-of-band noise and undesired interferers and restoring the levels of the desired I and Q baseband
signals, it is critical to retain their gain and phase integrity over
the bandwidth.
The ADRF6516 delivers flat in-band gain and group delay,
consistent with a six-pole Butterworth prototype filter, as
described in the Programmable Filters section. Furthermore,
careful design ensures excellent matching of these parameters
between the I and Q channels. Although absolute gain flatness
and group delay can be corrected with digital equalization,
mismatch introduces quadrature errors and intersymbol interference that degrade bit error rates in digital communication
systems.
Rev. A | Page 20 of 28

Data Sheet ADRF6516
APPLICATIONS INFORMATION
BASIC CONNECTIONS
Figure 51 shows the basic connections for a typical ADRF6516
application.
SUPPLY DECOUPLING
A nominal supply voltage of 3.3 V should be applied to the
supply pins. The supply voltage should not exceed 3.45 V
or drop below 3.15 V. Each supply pin should be decoupled
to ground with at least one low inductance, surface-mount
ceramic capacitor of 0.1 µF placed as close as possible to the
ADRF6516 device.
The ADRF6516 has two separate supplies: an analog supply and
a digital supply. Care should be taken to separate the analog and
digital supplies with a large surface-mount inductor of 33 µH.
Each supply should then be decoupled separately to its respective
ground through a 10 F capacitor.
INPUT SIGNAL PATH
Each signal path has input buffers, accessed through the
INP1, INM1, INP2, and INM2 pins, that set a differential input
impedance of 1600 Ω. These inputs sit at a nominal commonmode voltage around midsupply.
The inputs can be dc-coupled or ac-coupled. If using direct
dc coupling, the common-mode voltage, V
1.1 V to 1.8 V. The VICM pin can be used as a reference commonmode voltage for driving a high impedance sensing node of the
preceding cascaded part (VICM has a 7 kΩ impedance).
INPUT1 (–)
, can range from
CM
0.1µF
VPS
For example, the high impedance VOCM input pin of the
ADRF6806 quadrature demodulator can be directly connected
to the VICM pin of the ADRF6516. This gives the ADRF6806
the optimal common-mode voltage reference to drive the
ADRF6516.
OUTPUT SIGNAL PATH
The low impedance (30 Ω) output buffers are designed to drive
a high impedance load, such as an ADC input or another amplifier
stage. The output pins—OPP1, OPM1, OPP2, and OPM2—sit
at a nominal output common-mode voltage of VPS/2, but can
be driven to a voltage of 0.7 V to 2.8 V by applying the desired
common-mode voltage to the high impedance VOCM pin.
DC OFFSET COMPENSATION LOOP ENABLED
When the dc offset compensation loop is enabled via the OFDS
pin, the ADRF6516 can null the output differential dc level. The
loop is enabled by pulling the OFDS pin low to ground. The
offset compensation loop creates a high-pass corner frequency,
which is proportional to the value of the capacitors that are
connected from the OFS1 and OFS2 pins to ground. For more
information about setting the high-pass corner frequency, see
the DC Offset Compensation Loop section.
COMMON-MODE BYPASSING
The ADRF6516 common-mode pins, VICM and VOCM, must
be decoupled to ground. At least one low inductance, surfacemount ceramic capacitor with a value of 0.1 F should be used
to decouple the common-mode pins.
0.1µF
INPUT1 (+)
CONTROL
INTERFACE
INPUT2 (+)
INPUT2 (–)
SERIAL
VPSD
VPS
VPS
0.1µF
0.1µF
VPSD
COMD
LE
CLK
DATA
SDO
COM
VPS
ENBL
COM
VPS
INM1
COM
INP1
VPS
ADRF6516
VPS
INP2
INM2
COM
0.1µF
VICM
OF
VPS
0.1µF
OFS1
VPS
OPP1
OPM1
COM
GAIN
VOCM
COM
OPM2
OPP2
DS
VPS
OFS2
VPS
0.1µF
VPS
0.1µF
0.1µF
OUTPUT1 (+)
OUTPUT1 (–)
OUTPUT2 (–)
OUTPUT2 (+)
09422-053
Figure 51. Basic Connections
Rev. A | Page 21 of 28

ADRF6516 Data Sheet
SERIAL PORT CONNECTIONS
The ADRF6516 has a SPI port to control the gain and filter bandwidth settings. Data can be written to the internal 8-bit register
and read from the register. It is recommended that low-pass RC
filtering be placed on the SPI lines to filter out any high frequency
glitches. See Figure 58, the evaluation board schematic, for an
example of a low-pass RC filter.
ENABLE/DISABLE FUNCTION
To en abl e t he ADRF6516, the ENBL pin must be pulled high.
Driving the ENBL pin low disables the device, reducing current
consumption to approximately 9 mA at room temperature.
ERROR VECTOR MAGNITUDE (EVM) PERFORMANCE
Error vector magnitude (EVM) is a measure used to quantify
the performance of a digital radio transmitter or receiver by
measuring the fidelity of the digital signal transmitted or
received. Various imperfections in the link, such as magnitude
and phase imbalance, noise, and distortion, cause the
constellation points to deviate from their ideal locations.
In general, a receiver exhibits three distinct EVM limitations
vs. received input signal power. As signal power increases, the
distortion components increase.
• At large enough signal levels, where the distortion compo-
nents due to the harmonic nonlinearities in the device are
falling in-band, EVM degrades as signal levels increase.
• At medium signal levels, where the signal chain behaves
in a linear manner and the signal is well above any notable
noise contributions, EVM has a tendency to reach an optimal level determined dominantly by either the quadrature
accuracy and IQ gain match of the signal chain or the
precision of the test equipment.
• As signal levels decrease, such that noise is a major con-
tributor, EVM performance vs. the signal level exhibits
a decibel-for-decibel degradation with decreasing signal
level. At these lower signal levels, where noise is the
dominant limitation, decibel EVM is directly proportional
to the SNR.
EVM TEST SETUP
The basic setup to test EVM for the ADRF6516 consisted of an
Agilent E4438C used as a signal source and a Hewlett-Packard
89410A vector signal analyzer (VSA) used to sample and calculate
the EVM of the signal. The E4438C IQ baseband differential
outputs drove the ADRF6516 inputs. The I and Q outputs of the
ADRF6516 were loaded with 1 kΩ differential impedances and
connected differentially to two AD8130 differential amplifiers to
convert the signals into single-ended signals. The single-ended
signals were connected to the input channels of the VSA.
EFFECT OF FILTER BANDWIDTH ON EVM
Care should be taken when selecting the filter bandwidth. In
a digital transceiver, the modulated signal is filtered by a pulse
shaping filter (such as a root-raised cosine filter) at both the
transmit and receive ends to guard against intersymbol interference (ISI). If additional filtering of the modulated signal is
done, the signal must be within the pass band of the filter. When
the corner frequency of the ADRF6516 filter begins to encroach
on the modulated signal, ISI is introduced and degrades EVM,
which can lead to loss of signal lock.
Figure 52 shows that a digitally modulated QAM baseband
signal with a bandwidth at 9.45 MHz has excellent EVM even
at a filter corner frequency of 8 MHz. Further reduction in the
corner frequency leads to complete loss of lock. As RF input
power was swept, the ADRF6516 attained an EVM of less than
−45 dB over an input power range of approximately 20 dB.
0
–5
–10
–15
–20
–25
EVM (dB)
–30
–35
–40
–45
–50
–25 –20 –15 –10 –5 0 5
Figure 52. EVM vs. RF Input Power at Several Filter Corner Settings
(256-QAM, 14 MSPS Signal with α = 0.35; Output Differential Signal Level
RF INPUT PO WER (dBm)
Held to 700 mV p-p; OFDS Pulled High)
30MHz
15MHz
10MHz
9MHz
8MHz
GAIN VOLTAGE
Figure 53 shows the degradation that a fixed filter corner has
on EVM as the signal bandwidth corner is increased in fine
increments until loss of signal lock occurs.
0
–5
–10
–15
–20
–25
EVM (dB)
–30
–35
–40
–45
–50
345678910
Figure 53. EVM vs. Signal Bandwidth Corner at a Filter Corner of 5 MHz
FILTER BANDWIDTH CORNER
SIGNAL BANDWIDT H CORNER (MHz)
and a 16-QAM Signal with α = 0.35
0.8
0.7
0.6
0.5
0.4
0.3
0.2
0.1
0
GAIN VOLTAGE (V)
09422-055
09422-054
Rev. A | Page 22 of 28

Data Sheet ADRF6516
EFFECT OF OUTPUT VOLTAGE LEVELS ON EVM
Output voltage level can affect EVM greatly when the signal is
compressed. When changing the output voltage levels of the
ADRF6516, take care that the output signal is not in compres-
sion, which causes EVM degradation.
Figure 54 show EVM performance vs. RF input power for
several maximum differential I and Q output voltage levels
of 350 mV p-p up to 2.4 V p-p. For the lower maximum differential output voltage levels, the EVM is less than −45 dB over
approximately 20 dB of input power range.
0
–5
–10
–15
–20
–25
EVM (dB)
–30
–35
–40
–45
–50
–25 –20 –15 –10 –5 0 5
Figure 54. EVM vs. RF Input Power at Several Output Maximum Differential
Voltage Levels (Filter Corner = 10 MHz, OFDS Pulled High)
For the largest tested maximum differential output voltage level
of 2.4 V p-p, the ADRF6516 begins to compress the signal. This
compression causes EVM to degrade, but it still remains below
−40 dB, albeit over a truncated input power range. At the high
end of the input power range, the signal is in full compression
and EVM is large. Given that the gain is near its minimum, the
input signal level must be lowered to bring the output signal out
of full compression and into the proper linear operating region.
EFFECT OF C
When enabled, the dc offset compensation loop effectively
nulls any information below the high-pass corner set by the
C
capacitor. However, loss of the low frequency information
OFS
of the modulated signal can degrade the EVM in some cases.
As the signal bandwidth becomes larger, the percentage of
information that is corrupted by the high-pass corner becomes
smaller. In such cases, it is important to select a C
that is large enough to minimize the high-pass corner frequency,
which prevents loss of information and degraded EVM.
350mV p-p MAX
700mV p-p MAX
1500mV p-p MAX
2400mV p-p MAX
RF INPUT POWER (dBm)
VALUE ON EVM
OFS
capacitor
OFS
09422-056
Figure 55 shows degradation of the EVM vs. RF input power as
the C
capacitor value becomes smaller, which increases the
OFS
high-pass corner for the dc offset compensation loop.
0
–5
–10
–15
–20
–25
EVM (dB)
–30
–35
–40
–45
–50
Figure 55. EVM vs. RF Input Power at Several C
C
= 1µF
OFS
C
= 220nF
OFS
C
= 1nF
OFS
–35 –30 –25 –20 –15 –10 –5 0 5
RF INPUT PO WER (dBm)
Values (Filter Corner = 10 MHz,
OFS
09422-057
256-QAM, 14 MSPS Signal with α = 0.35; Output Differential Signal Level
Held to 700 mV p-p; OFDS Pulled Low)
Figure 56 shows the effect that C
has on several modulated
OFS
signal bandwidths. The modulated bandwidth was swept while
using 1000 pF and 1 µF values for C
. Total gain was set to
OFS
15 dB, so the high-pass filter corner of the 1000 pF capacitor is
26.67 kHz, and the high-pass filter corner of the 1 µF capacitor
is 26.67 Hz. It is recommended that at moderate signal bandwidths, a 1 µF capacitor for C
be used to obtain the best EVM
OFS
when using the dc offset compensation loop.
0
–5
–10
–15
–20
–25
EVM (dB)
–30
–35
–40
–45
–50
012345678910
SIGNAL BANDWIDTH CORNER (MHz)
Figure 56. EVM vs. Signal Bandwidth Corner with C
= 1000 pF (Filter Corner = 10 MHz)
and C
OFS
C
OFS
C
= 1000pF
= 1µF
OFS
OFS
= 1 μF
09422-058
Rev. A | Page 23 of 28

ADRF6516 Data Sheet
EVALUATION BOARD
An evaluation board is available for testing the ADRF6516.
The evaluation board schematic is shown in Figure 58. Table 6
provides the component values and suggestions for modifying
the component values for the various modes of operation.
EVALUATION BOARD CONTROL SOFTWARE
The ADRF6516 evaluation board is controlled through the
parallel port on a PC. The parallel port is programmed via the
ADRF6516 evaluation software. This software controls the filter
corner frequency, as well as the minimum and maximum gains
for each amplifier in the ADRF6516. For information about the
register map, see Table 4 and Table 5. For information about SPI
port timing and control, see Figure 2 and Figure 3.
After the evaluation software is downloaded and installed, start
the basic user interface to program the filter corner and gain
values (see Figure 57).
To program the filter corner, do one of the following:
• Click the arrow in the Frequency Select section of the
window, select the desired corner frequency from the
menu, and click Write B i ts .
• Click Freq +1 MHz or Freq −1 MHz to increment or
decrement the corner frequency in 1 MHz steps from
the current corner frequency.
When the user clicks the Write B i ts button, a write operation is
executed, immediately followed by a read operation. The updated
information is displayed in the Current Pre-Amp Gain, Current
Frequency, Current VGA Max Gain, and Current Post-Amp
Gain fields.
When the parallel port is updated with a read/write operation,
the current cumulative maximum gain of all the amplifiers is
displayed in the Maximum Gain field. (The analog VGA gain
is not included in this value.)
Because the speed of the parallel port varies from PC to PC,
the Clock Stretch function can be used to change the effective
frequency of the CLK line. The CLK line has a scalar range from
1 to 10; 10 is the fastest speed, and 1 is the slowest.
To program the preamplifier gain, the VGA maximum gain,
and the postamplifier gain, move the slider switch in the
appropriate section of the window to the desired gain.
• The preamplifier gain can be set to 3 dB or 6 dB.
• The VGA maximum gain can be set to 22 dB or 28 dB.
• The postamplifier gain can be set to 6 dB or 12 dB.
Figure 57. ADRF6516 Evaluation Software
09422-060
Rev. A | Page 24 of 28

Data Sheet ADRF6516
V
V
SCHEMATICS AND ARTWORK
PSD
33µH
33µH
R12
OPEN
R11
OPEN
R14
OPEN
R13
OPEN
PS
L2
VPOSDI G_VPOS
C2
10µF
L1
R19
COMCOMD
R37
OPEN
0Ω
OPP1_SE_P
R41
0Ω
T3
C23
0.1µF
R35
0Ω
C24
0.1µF
R20
0Ω
OPEN
R36
0Ω
R38
R42
0Ω
T4
R40
OPEN
R39
OPEN
OPM1
OPM2_SE_P
OPP2
CLK
INP2_SE_P
INM1_SE_ P
INP1
LE
DATA
SDO
INM2
100Ω
R32
R31
0Ω
T1
R30
T2
R44
OPEN
OPEN
R45
OPEN
R43
R29
100Ω
C29
330pF
R33
0Ω
R34
0Ω
R46
OPEN
LE CLKDATA
R49
R50
0Ω
C6
0.1µF
R48
0Ω
0Ω0Ω
R1
10kΩ
C3
0.1µF
R47
0Ω
C28
330pF
R55
OPEN
R56
OPEN
R51
OPEN
R52
OPEN
VPS
VPS
VPSD
0.1µF
0.1µF
VPS
C9
R57
100nF
0Ω
R58
0Ω
C10
100nF
C12
0.1µF
P2
ENBL
INM1
INP1
VPSD
C4
COMD
LE
CLK
ADRF6516
DATA
SDO
C5
COM
VPS
INP2
INM2
COM
R2
1kΩ
C7
R53
100nF
0Ω
R54
C8
0Ω
100nF
VPS
S
VP
C11
0.1µF
10kΩ
COM
COM
R3
VICM
OFDS
OFS1
OFS2
VPS
C27
0.1µF
C14
1000pF
0.1µF
VPS
OPP1
OPM1
COM
GAIN
VOCM
COM
OPM2
OPP2
S
VP
C13
1000pF
P4
SDO
C16
VICM
C17
0.1µF
C18
0.1µF
C15
0.1µF
VPS
VPS
C19
100nF
C20
100nF
C21
100nF
C22
100nF
VPS
R5
0Ω
R6
0Ω
VGAIN
VOCM
C1
10µF
R7
0Ω
R8
0Ω
VGAIN
VOCM
R9
0Ω
R10
0Ω
12345
P1
15
14
16 17
678910
19
18
21
20
11 12 13
22 23 24
25
09422-061
Figure 58. Evaluation Board Schematic
09422-063
09422-062
Figure 59. Top Layer Silkscreen
Figure 60. Component Side Layout
Rev. A | Page 25 of 28

ADRF6516 Data Sheet
Table 6. Evaluation Board Configuration Options
Components Function Default Conditions
C1, C2, C4, C5, C11, C12,
C15, C16, L1, L2, R2
T1, T2, C3, C6, C7 to C10,
R31, R32, R43 to R58
T3, T4, C19 to C24,
R7 to R14, R19, R20,
R35 to R42
P2
P1, C28, C29, R1, R29,
R30, R33, R34
P4, C13, C14, R3
C27
C18, R6
C17, R5
T5, T6, C25, C26,
R21 to R28
Power supply and ground decoupling. Nominal supply decoupling
consists of a 0.1 μF capacitor to ground.
Input interface. Input SMAs INP1, INM1_SE_P, INP2_SE_P, and INM2 are
used to drive the part differentially by bypassing the baluns. Using only
INM1_SE_P and INP2_SE_P in conjunction with the baluns enables
single-ended operation. The default configuration of the evaluation
board is for single-ended operation.
T1 and T2 are 8:1 impedance ratio baluns that transform a single-ended
signal in a 50 Ω system into a balanced differential signal in a 400 Ω
system.
R31, R32, R47, R48, R49, and R50 are populated for appropriate balun
interface. R51 to R58 are provided for generic placement of matching
components.
To bypass the T1 and T2 baluns for differential interfacing, remove the
balun interfacing resistors R31, R32, R47, R48, R49, and R50, and populate
R43, R44, R45, and R46 with 0 Ω resistors.
Output interface. Output SMAs OPP1_SE_P, OPM1, OPP2, and
OPM2_SE_P are used to obtain differential signals from the part when
the output baluns are bypassed. Using OPP1_SE_P, OPM2_SE_P, and the
baluns, the user can obtain single-ended output signals. The default
configuration of the evaluation board is for single-ended operation.
T3 and T4 are 8:1 impedance ratio baluns that transform a differential
signal in a 400 Ω system into a single-ended signal in a 50 Ω system.
R7, R8, R9, R10, R19, R20, R35, R36, R41, and R42 are populated for
appropriate balun interface. R7 to R14 are provided for generic
placement of matching components.
To bypass the T3 and T4 baluns for differential interfacing, remove the
balun interfacing resistors R19, R20, R35, R36, R41, and R42, and populate
R37, R38, R39, and R40 with 0 Ω resistors.
Enable interface. The ADRF6516 is powered up by applying a logic high
voltage to the ENBL pin (Jumper P2 is connected to VPS).
Serial control interface. The digital interface sets the corner frequency,
the preamplifier gain, the postamplifier gain, and the VGA maximum
gain of the device using the serial interface via the LE, CLK, DATA, and
SDO pins. RC filter networks are provided on the CLK and LE lines to filter
the PC signals. CLK, DATA, and LE signals can be observed via SMB
connectors for debug purposes.
DC offset compensation loop. The dc offset compensation loop is enabled
(low) with Jumper P4. When enabled, the C13 and C14 capacitors are
connected to circuit common. The high-pass corner frequency is expressed
as follows:
fHP (Hz) = 6.7 × (Post Filter Linear Gain/C
Input common-mode setpoint. The input common-mode voltage can be
set externally when applied to the VICM pin. If the VICM pin is left open,
the input common-mode voltage defaults to VPS/2.
Output common-mode setpoint. The output common-mode voltage can
be set externally when applied to the VOCM pin. If the VOCM pin is left
open, the output common-mode voltage defaults to VPS/2.
Analog gain control. The range of the GAIN pin is from 0 V to 1 V, creating
a gain scaling of 15 mV/dB.
Calibration path. An on-board calibration path is provided to de-embed
the loss due to the baluns and resistors in the input and output signal paths.
OFS
(μF))
C1, C2 = 10 μF (Size 1210)
C4, C5, C11, C12, C15, C16 = 0.1 μF
(Size 0402)
L1, L2 = 33 μH (Size 1812)
R2 = 1 kΩ (Size 0402)
T1, T2 = ADT8-1T+ (Mini-Circuits)
C3, C6 = 0.1 μF (Size 0402)
C7 to C10 = 100 nF (Size 0602)
R31, R32, R47 to R50, R53, R54, R57,
R58 = 0 Ω (Size 0402)
R43 to R46, R51, R52, R55, R56 =
open (Size 0402)
T3, T4 = ADT8-1T+ (Mini-Circuits)
C19 to C22 = 100 nF (Size 0402)
C23, C24 = 0.1 μF (Size 0402)
R7 to R10, R19, R20, R35, R36, R41,
R42 = 0 Ω (Size 0402)
R11 to R14, R37 to R40 = open
(Size 0402)
P2 = installed for enable
P1 = installed
R1 = 10 kΩ (Size 0402)
C28, C29 = 330 pF (Size 0402)
R29, R30 = 100 Ω (Size 0402)
R33, R34 = 0 Ω (Size 0402)
P4 = installed
C13, C14 = 1000 pF (Size 0402)
R3 = 10 kΩ (Size 0402)
C27 = 0.1 μF (Size 0402)
C18 = 0.1 μF (Size 0402)
R6 = 0 Ω (Size 0402)
C17 = 0.1 μF (Size 0402)
R5 = 0 Ω (Size 0402)
T5, T6 = ADT8-1T+ (Mini-Circuits)
C25, C26 = 0.1 μF (Size 0402)
R23 to R26 = 0 Ω (Size 0402)
R21, R22, R27, R28 = open (Size 0402)
Rev. A | Page 26 of 28

Data Sheet ADRF6516
S
OUTLINE DIMENSIONS
5.00
INDICATOR
1.00
0.85
0.80
EATING
PLANE
PIN 1
12° MAX
BSC SQ
4.75
BSC SQ
TOP VIEW
0.80 MAX
0.65 TYP
0.30
0.25
0.18
COMPLIANT TO JEDEC STANDARDS MO-220-VHHD-2
0.20 REF
0.60 MAX
0.05 MAX
0.02 NOM
COPLANARITY
0.08
0.50
BSC
0.50
0.40
0.30
Figure 61. 32-Lead Lead Frame Chip Scale Package [LFCSP_VQ]
5 mm × 5 mm Body, Very Thin Quad
(CP-32-2)
Dimensions shown in millimeters
25
24
17
16
0.60 MAX
32
1
EXPOSED
PAD
BOTTOM VIEW
3.50 REF
FOR PROPER CO NNECTION O F
THE EXPOSED PAD, REFER TO
THE PIN CONF IGURATIO N AND
FUNCTION DESCRI PTIONS
SECTION O F THIS DAT A SHEET.
3.25
3.10 SQ
2.95
8
9
0.25 MIN
PIN 1
INDICATOR
05-25-2011-A
ORDERING GUIDE
1
Model
ADRF6516ACPZ-R7 −40°C to +85°C 32-Lead LFCSP_VQ, 7” Tape and Reel CP-32-2
ADRF6516-EVALZ Evaluation Board
1
Z = RoHS Compliant Part.
Temperature Range Package Description Package Option
Rev. A | Page 27 of 28

ADRF6516 Data Sheet
NOTES
©2010–2011 Analog Devices, Inc. All rights reserved. Trademarks and
registered trademarks are the property of their respective owners.
D09422-0-9/11(A)
Rev. A | Page 28 of 28
 Loading...