

700 MHz to 1000 MHz,
FEATURES
Operation from 700 MHz to 1000 MHz
Gain of 23 dB at 943 MHz
OIP3 of 44.2 dBm at 943 MHz
P1dB of 30.9 dBm at 943 MHz
Noise figure of 4.8 dB at 943 MHz
Power supply: 5 V
Power supply current: 307 mA typical
Internal active biasing
Fast power-up/power-down function
Compact 4 mm × 4 mm, 16-lead LFCSP
ESD rating of ±1 kV (Class 1C)
Pin-compatible with the ADL5606 (1800 MHz to 2700 MHz)
APPLICATIONS
Wireless infrastructure
Automated test equipment
ISM/AMR applications
GENERAL DESCRIPTION
The ADL5605 is a broadband, two-stage, 1 W RF driver
amplifier that operates over a frequency range of 700 MHz
to 1000 MHz.
The ADL5605 operates on a 5 V supply voltage and a supply
current of 307 mA. The driver also incorporates a fast powerup/power-down function for TDD applications, applications
that require a power saving mode, and applications that
intermittently transmit data.
The ADL5605 is fabricated on a GaAs HBT process and is
packaged in a compact 4 mm × 4 mm, 16-lead LFCSP that
uses an exposed paddle for excellent thermal impedance. The
ADL5605 operates from −40°C to +85°C. A fully populated
evaluation board tuned to 943 MHz is also available.
1 W RF Driver Amplifier
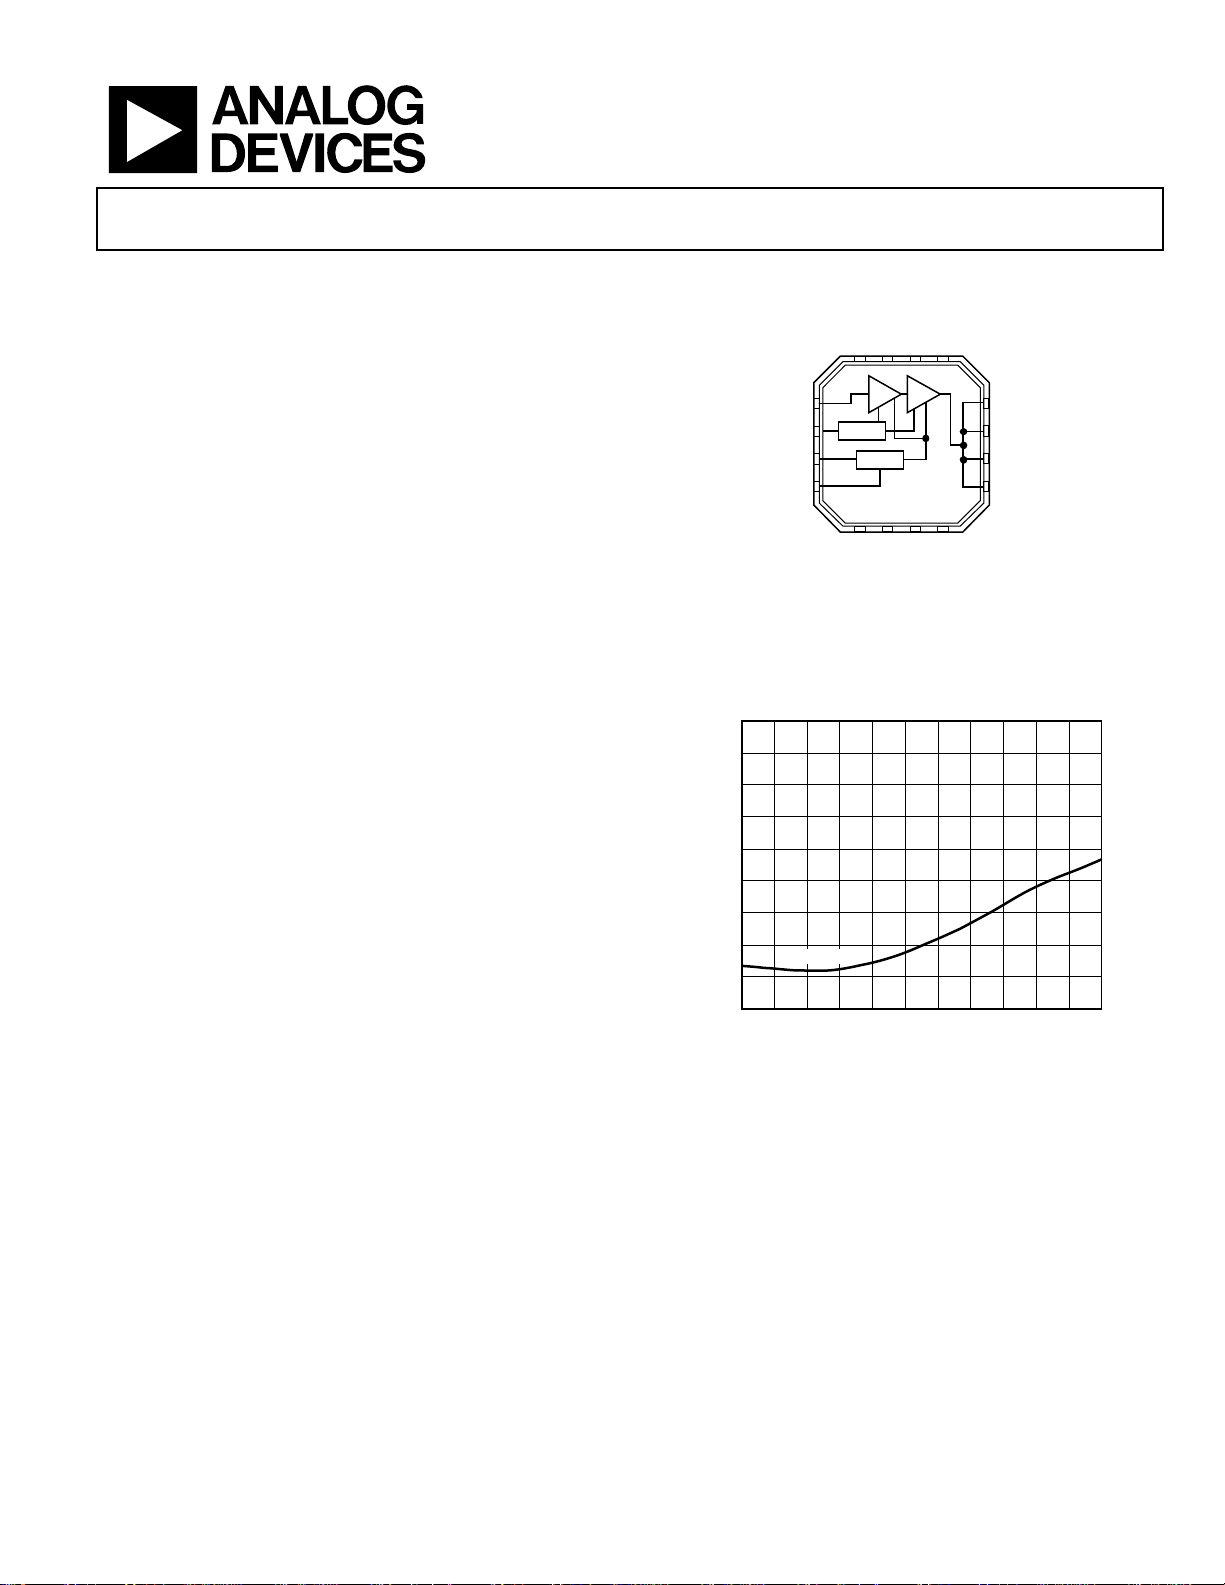
FUNCTIONAL BLOCK DIAGRAM
NC
NC
NC
NC
14
13
15
16
1RFIN
PWDN
2DISABLE
3VCC
4VBIAS
0
–10
–20
–30
–40
–50
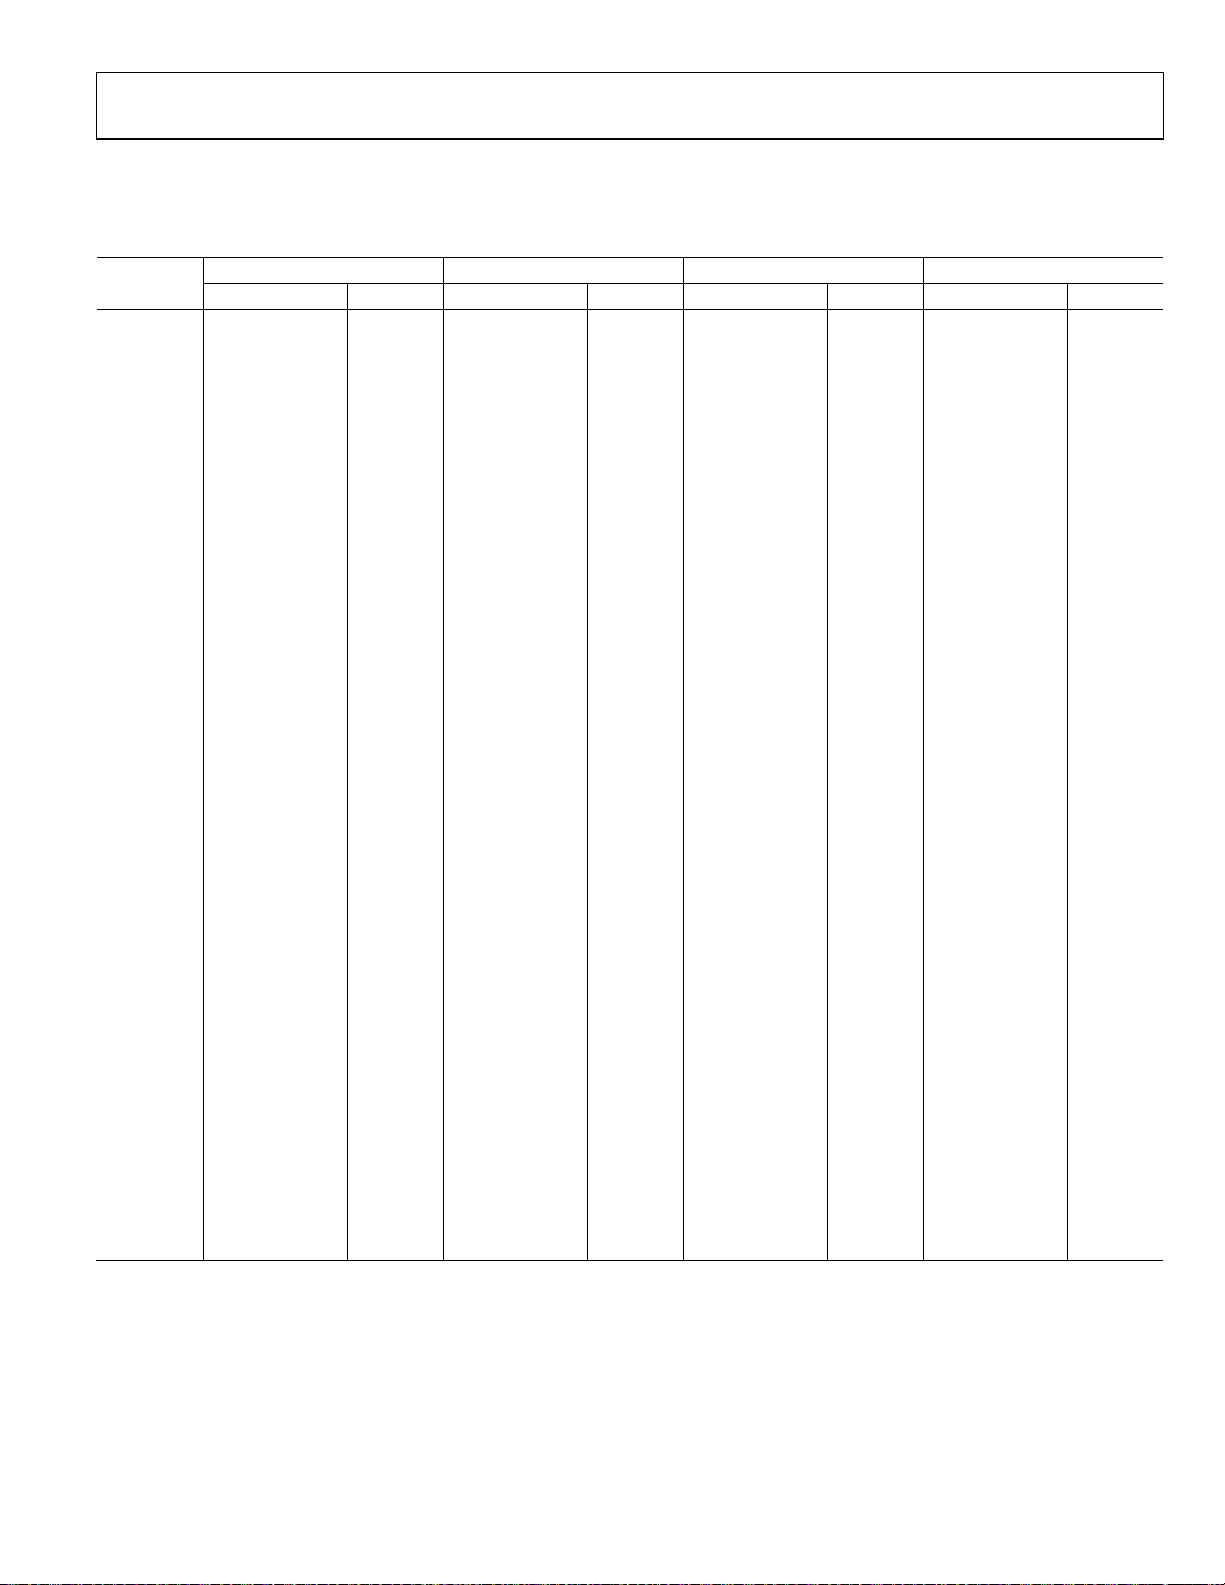
ACPR (dBc)
–60
–70
–80
–90
0 2 4 6 8 10121416182022
Figure 2. ACPR vs. Output Power, 3GPP, TM1-64, at 946 MHz
946MHz
VBIAS
ADL5605
5
6
NC
NC
Figure 1.
P
OUT
7
NC
(dBm)
8
NC
ADL5605
12 RFOUT
11 RFOUT
10 RFOUT
9RFOUT
09353-001
09353-002
Rev. 0
Information furnished by Analog Devices is believed to be accurate and reliable. However, no
responsibility is assumed by Analog Devices for its use, nor for any infringements of patents or other
rights of third parties that may result from its use. Specifications subject to change without notice. No
license is granted by implication or otherwise under any patent or patent rights of Analog Devices.
Trademarks and registered trademarks are the property of their respective owners.
One Technology Way, P.O. Box 9106, Norwood, MA 02062-9106, U.S.A.
Tel: 781.329.4700 www.analog.com
Fax: 781.461.3113 ©2011 Analog Devices, Inc. All rights reserved.

ADL5605
TABLE OF CONTENTS
Features .............................................................................................. 1
Applications ....................................................................................... 1
General Description ......................................................................... 1
Functional Block Diagram .............................................................. 1
Revision History ............................................................................... 2
Specifications ..................................................................................... 3
Typical Scattering Parameters ..................................................... 5
Absolute Maximum Ratings ............................................................ 6
Thermal Resistance ...................................................................... 6
ESD Caution .................................................................................. 6
Pin Configuration and Function Descriptions ............................. 7
Typical Performance Characteristics ............................................. 8
748 MHz Frequency Tuning Band ............................................. 8
881 MHz Frequency Tuning Band ............................................. 9
943 MHz Frequency Tuning Band ........................................... 10
General......................................................................................... 11
Applications Information .............................................................. 13
Basic Layout Connections ......................................................... 13
ADL5605 Matching .................................................................... 14
ACPR and EVM ......................................................................... 15
Thermal Considerations ............................................................ 15
Soldering Information and Recommended PCB Land
Pattern .......................................................................................... 15
Evaluation Board ............................................................................ 16
Outline Dimensions ....................................................................... 18
Ordering Guide .......................................................................... 18
REVISION HISTORY
7/11—Revision 0: Initial Version
Rev. 0 | Page 2 of 20

ADL5605
SPECIFICATIONS
VCC1 = 5 V and TA = 25°C, unless otherwise noted.1
Table 1.
Parameter Test Conditions/Comments Min Typ Max Unit
OVERALL FUNCTION
Frequency Range 700 1000 MHz
FREQUENCY = 748 MHz ± 20 MHz
Gain 24.3 dB
vs. Frequency ±20 MHz +0.01/−0.19 dB
vs. Temperature −40°C ≤ TA ≤ +85°C ±0.8 dB
vs. Supply 4.75 V to 5.25 V ±0.07 dB
Output 1 dB Compression Point (P1dB) 31.4 dBm
vs. Frequency ±20 MHz −0.68/+0.08 dB
vs. Temperature −40°C ≤ TA ≤ +85°C +0.94/−1.99 dB
vs. Supply 4.75 V to 5.25 V −0.24/−0.05 dB
Output Third-Order Intercept (OIP3) ∆f = 1 MHz, P
vs. Frequency ±20 MHz −0.22/+0.16 dB
vs. Temperature −40°C ≤ TA ≤ +85°C +0.07/−1.56 dB
vs. Supply 4.75 V to 5.25 V +0.04/+0.09 dB
Noise Figure 4.8 dB
FREQUENCY = 881 MHz ± 13 MHz
Gain 23.0 dB
vs. Frequency ±13 MHz −0.03/−0.08 dB
vs. Temperature −40°C ≤ TA ≤ +85°C ±0.7 dB
vs. Supply 4.75 V to 5.25 V ±0.05 dB
Output 1 dB Compression Point (P1dB) 31.4 dBm
vs. Frequency ±13 MHz −0.18/−0.11 dB
vs. Temperature −40°C ≤ TA ≤ +85°C ±0.6 dB
vs. Supply 4.75 V to 5.25 V −0.4/+0.3 dB
Output Third-Order Intercept (OIP3) ∆f = 1 MHz, P
vs. Frequency ±13 MHz −0.32/+0.40 dB
vs. Temperature −40°C ≤ TA ≤ +85°C −0.19/−0.99 dB
vs. Supply 4.75 V to 5.25 V +0.21/−0.03 dB
Noise Figure 4.7 dB
FREQUENCY = 943 MHz ± 18 MHz
Gain 23.0 dB
vs. Frequency ±18 MHz +0.28/−0.04 dB
vs. Temperature −40°C ≤ TA ≤ +85°C ±0.8 dB
vs. Supply 4.75 V to 5.25 V ±0.04 dB
Output 1 dB Compression Point (P1dB) 30.9 dBm
vs. Frequency ±18 MHz +0.39/−0.08 dB
vs. Temperature −40°C ≤ TA ≤ +85°C +0.7/−0.9 dB
vs. Supply 4.75 V to 5.25 V −0.43/+0.35 dB
Adjacent Channel Power Ratio (ACPR)
Output Third-Order Intercept (OIP3) ∆f = 1 MHz, P
vs. Frequency ±18 MHz −0.47/−0.10 dB
vs. Temperature −40°C ≤ TA ≤ +85°C +0.7/−1.6 dB
vs. Supply 4.75 V to 5.25 V −0.08/+0.07 dB
Noise Figure 4.8 dB
= 18 dBm, one-carrier W-CDMA,
P
OUT
64 DPCH, frequency = 946 MHz
= 14 dBm per tone 41.9 dBm
OUT
= 14 dBm per tone 43.4 dBm
OUT
51 dBc
= 14 dBm per tone 44.2 dBm
OUT
Rev. 0 | Page 3 of 20

ADL5605
Parameter Test Conditions/Comments Min Typ Max Unit
POWER-DOWN INTERFACE DISABLE pin
Logic Level to Enable V
Logic Level to Disable V
DISABLE Pin Current V
VCC1 Pin Current
1
Enable Time 10% of control pulse to 90% of RFOUT 75 ns
Disable Time 10% of control pulse to 90% of RFOUT 20 ns
POWER INTERFACE RFOUT pin
Supply Voltage 4.75 5 5.25 V
Supply Current 307 385 mA
vs. Temperature −40°C ≤ TA ≤ +85°C −20/+1 mA
1
VCC1 is the supply to the DUT through the RFOUT pins.
decreasing 0 1.1 V
DISABLE
increasing 1.4 5 V
DISABLE
= 5 V 1.4 mA
DISABLE
V
= 5 V 5.5 mA
DISABLE
Rev. 0 | Page 4 of 20
ADL5605
TYPICAL SCATTERING PARAMETERS
VCC1 = 5 V and TA = 25°C; the effects of the test fixture have been de-embedded up to the pins of the device.1
Table 2.
Frequency
(MHz)
100 −2.38 162.05 5.53 133.84 −48.08 12.48 −1.30 −147.53
150 −2.63 153.17 14.11 95.13 −47.50 2.17 −0.55 −172.43
200 −2.95 144.23 18.99 67.83 −55.96 −119.96 −0.68 −173.81
250 −3.50 135.13 22.75 39.76 −55.27 52.76 −1.24 −171.76
300 −4.41 127.84 25.46 −7.79 −61.09 77.07 −1.10 −176.42
350 −4.58 124.74 23.14 −63.51 −61.80 140.72 −1.06 −177.13
400 −5.11 110.20 17.94 −30.49 −52.49 171.89 −1.15 −176.29
450 −6.82 108.32 22.16 −61.71 −67.98 −27.39 −1.11 −177.02
500 −7.26 106.20 21.56 −87.12 −62.64 −21.99 −0.87 −177.37
550 −7.66 101.35 20.40 −105.19 −61.53 34.70 −0.92 −179.14
600 −8.25 95.77 19.42 −118.96 −61.21 99.93 −0.78 179.80
650 −8.86 89.58 18.55 −130.30 −61.13 129.82 −0.87 179.43
700 −9.58 82.66 17.89 −140.88 −59.03 107.89 −0.87 178.46
750 −10.59 75.33 17.40 −150.63 −61.26 91.70 −0.90 178.01
800 −11.75 66.62 17.07 −160.56 −57.17 92.00 −0.93 177.54
850 −13.27 57.13 16.89 −170.83 −56.35 107.58 −0.93 177.22
900 −15.44 46.13 16.84 178.03 −56.74 99.86 −0.96 176.90
950 −18.94 29.27 16.93 165.27 −54.82 107.20 −0.96 176.66
1000 −26.34 −2.06 16.96 150.36 −52.26 73.48 −0.98 176.43
1050 −26.92 −130.02 16.77 132.88 −54.70 68.96 −0.94 176.27
1100 −18.87 −171.63 16.17 113.62 −54.77 47.54 −0.81 176.15
1150 −15.30 163.88 14.89 94.11 −53.44 43.95 −0.76 175.49
1200 −13.83 145.18 13.13 76.86 −55.60 11.97 −0.72 174.79
1250 −13.51 129.85 11.09 62.33 −55.37 33.66 −0.66 173.83
1300 −13.68 117.81 8.95 50.66 −57.24 20.12 −0.68 173.19
1350 −14.26 108.51 6.91 41.54 −59.07 24.50 −0.66 172.57
1400 −14.96 99.61 4.91 33.49 −60.44 14.20 −0.69 171.85
1450 −15.76 92.58 3.04 26.87 −61.45 45.66 −0.63 171.46
1500 −16.83 86.52 1.23 21.09 −57.41 62.21 −0.69 170.87
1550 −17.90 79.79 −0.47 16.01 −62.00 53.37 −0.66 170.42
1600 −19.28 73.87 −2.09 11.40 −56.83 57.90 −0.69 169.98
1650 −20.56 67.65 −3.63 7.32 −57.60 58.62 −0.68 169.51
1700 −22.42 60.60 −5.10 3.62 −59.47 77.96 −0.68 168.99
1750 −24.45 51.72 −6.53 0.23 −58.70 76.85 −0.67 168.59
1800 −26.42 38.39 −7.92 −3.05 −55.11 66.53 −0.68 168.10
1850 −28.73 21.43 −9.27 −6.05 −58.19 37.40 −0.67 167.72
1900 −29.99 −4.11 −10.56 −8.66 −61.08 43.12 −0.68 167.18
1950 −29.61 −32.34 −11.84 −11.11 −57.28 78.91 −0.67 166.94
2000 −27.80 −55.73 −13.07 −13.38 −56.29 83.05 −0.68 166.45
1
VCC1 is the supply to the DUT through the RFOUT pins.
Magnitude (dB) Angle (°) Magnitude (dB) Angle (°) Magnitude (dB) Angle (°) Magnitude (dB) Angle (°)
S11 S21 S12 S22
Rev. 0 | Page 5 of 20
ADL5605
ABSOLUTE MAXIMUM RATINGS
Table 3.
Parameter Rating
Supply Voltage, VCC11 6.5 V
Input Power (50 Ω Impedance) 20 dBm
Internal Power Dissipation (Paddle Soldered) 2 W
Maximum Junction Temperature 150°C
Lead Temperature (Soldering 60 sec) 240°C
Operating Temperature Range −40°C to +85°C
Storage Temperature Range −65°C to +150°C
1
VCC1 is the supply to the DUT through the RFOUT pins.
Stresses above those listed under Absolute Maximum Ratings
may cause permanent damage to the device. This is a stress
rating only; functional operation of the device at these or any
other conditions above those indicated in the operational
section of this specification is not implied. Exposure to absolute
maximum rating conditions for extended periods may affect
device reliability.
THERMAL RESISTANCE
Tabl e 4 lists the junction-to-air thermal resistance (θJA) and the
junction-to-paddle thermal resistance (θ
) for the ADL5605.
JC
For more information, see the Thermal Considerations section.
Table 4. Thermal Resistance
Package Type θJA θ
Unit
JC
16-Lead LFCSP (CP-16-10) 52.1 12.1 °C/W
ESD CAUTION
Rev. 0 | Page 6 of 20

ADL5605
PIN CONFIGURATION AND FUNCTION DESCRIPTIONS
1RFI N
2DISABLE
3VCC
4VBIAS
NOTES
1. THE EXPOSED PADDLE SHOULD BE SOLDERED
TO A LOW IMPEDANCE EL ECTRICAL AND
THERMAL GROUND PLANE.
2. NC = NO CONNECT. DO NOT CONNECT TO THIS PI N.
Table 5. Pin Function Descriptions
Pin No. Mnemonic Description
1 RFIN RF Input. Requires a dc blocking capacitor.
2 DISABLE
Connect this pin to 5 V to disable the part. In the disabled state, the part draws approximately 5 mA
of current from the power supply and 1.4 mA from the DISABLE pin.
3 VCC
Under normal operation, this pin is connected to the power supply and draws a combined 307 mA
of current. When this pin is grounded along with the VBIAS pin, the device is disabled and draws
approximately 1.4 mA from the DISABLE pin.
4 VBIAS Applying 5 V to this pin enables the bias circuit. When this pin is grounded, the device is disabled.
5, 6, 7, 8, 13,
NC No Connect. Do not connect to this pin.
14, 15, 16
9, 10, 11, 12 RFOUT
RF Output. DC bias is provided to this pin through an inductor that is connected to the 5 V power
supply. The RF path requires a dc blocking capacitor.
EP The exposed paddle should be soldered to a low impedance electrical and thermal ground plane.
C
N
NC
NC
NC
14
13
15
16
PIN 1
INDICATOR
ADL5605
TOP VIEW
(Not to Scal e)
5
6
NC
NC
7
NC
12 RFOUT
11 RFO UT
10 RFOUT
9RFOUT
8
NC
Figure 3. Pin Configuration
09353-003
Rev. 0 | Page 7 of 20

ADL5605
TYPICAL PERFORMANCE CHARACTERISTICS
748 MHZ FREQUENCY TUNING BAND
50
45
40
35
30
25
20
15
10
5
NOISE FIGURE, GAIN, P1dB, OIP3 (dB, dBm)
0
728 763733 738 743 748 753 758 768
OIP3 (dBm)
P1dB (dBm)
GAIN (dB)
NF (dB)
FREQUENCY (MHz )
Figure 4. Noise Figure, Gain, P1dB, and OIP3 vs. Frequency
(OIP3 at P
= 14 dBm per Tone)
OUT
09353-004
42
40
38
36
34
32
P1dB (dBm)
30
28
26
24
728 733 738 743 748 753 758 763 768
–40°C
+25°C
+85°C
FREQUENCY ( MHz)
Figure 7. P1dB and OIP3 vs. Frequency and Temperature
(OIP3 at P
= 14 dBm per Tone)
OUT
–40°C
+25°C
+85°C
46
44
42
40
38
36
OIP3 (dBm)
34
32
30
28
09353-007
28
27
26
25
24
GAIN (dB)
23
22
21
20
728 763733 738 743 748 753 758 768
–40°C
+25°C
+85°C
FREQUENCY (MHz )
Figure 5. Gain vs. Frequency and Temperature
0
–10
–20
–30
–40
S-PARAMETERS (dB)
–50
S22
S11
S12
44
43
42
41
OIP3 (dBm)
40
39
38
09353-005
–2 0 2 4 6 8 1012141618
Figure 8. OIP3 vs. P
7
6
5
4
NOISE FI GURE (dB)
3
768MHz
748MHz
728MHz
P
PER TONE (d Bm)
OUT
and Frequency
OUT
+85°C
+25°C
–40°C
09353-008
–60
728 763733 738 743 748 753 758 768
FREQUENCY (MHz )
Figure 6. Input Return Loss (S11), Output Return Loss (S22),
and Reverse Isolation (S12) vs. Frequency
09353-006
Rev. 0 | Page 8 of 20
2
738728 748 758 768
FREQUENCY (MHz )
Figure 9. Noise Figure vs. Frequency and Temperature
09353-009

ADL5605
881 MHZ FREQUENCY TUNING BAND
50
45
40
35
30
25
20
15
10
5
NOISE FIGURE, GAIN, P1dB, OIP3 (dB, dBm)
0
868 873 878 883 888 893
OIP3 (dBm)
P1dB (dBm)
GAIN (dB)
NF (dB)
FREQUENCY (MHz )
Figure 10. Noise Figure, Gain, P1dB, and OIP3 vs. Frequency
(OIP3 at P
= 14 dBm per Tone)
OUT
09353-010
40
38
36
34
32
P1dB (dBm)
30
28
26
868 870 880878876874872 884882 886 888 890 892 894
–40°C
FREQUENCY ( MHz)
+25°C
–40°C
+25°C
+85°C
Figure 13. P1dB and OIP3 vs. Frequency and Temperature
(OIP3 at P
= 14 dBm per Tone)
OUT
+85°C
46
44
42
40
38
OIP3 (dBm)
36
34
32
09353-013
27
26
25
24
23
GAIN (dB)
22
21
20
19
868 870 872 874 876 878 880 882 894892890888886884
–40°C
+25°C
+85°C
FREQUENCY (MHz)
Figure 11. Gain vs. Frequency and Temperature
0
–10
–20
–30
–40
S-PARAMETERS ( dB)
–50
S22
S11
S12
45
44
43
42
OIP3 (dBm)
41
40
39
09353-011
–2024681012141618
Figure 14. OIP3 vs. P
7
6
5
4
NOISE FI GURE (dB)
3
894MHz
881MHz
868MHz
P
PER TONE (d Bm)
OUT
and Frequency
OUT
+85°C
+25°C
–40°C
09353-014
–60
868 873 878 883 888 893
FREQUENCY (MHz )
Figure 12. Input Return Loss (S11), Output Return Loss (S22),
and Reverse Isolation (S12) vs. Frequency
09353-012
Rev. 0 | Page 9 of 20
2
878868 888
FREQUENCY (MHz )
Figure 15. Noise Figure vs. Frequency and Temperature
09353-015

ADL5605
943 MHZ FREQUENCY TUNING BAND
50
45
40
35
30
25
20
15
10
5
NOISE FIGURE, GAIN, P1dB, OIP3 (dB, dBm)
0
925 930 935 940 945 950 955 960
OIP3 (dBm)
P1dB (dBm)
GAIN (dB)
NF (dB)
FREQUENCY (MHz )
Figure 16. Noise Figure, Gain, P1dB, and OIP3 vs. Frequency
(OIP3 at P
= 14 dBm per Tone)
OUT
09353-016
40
38
36
34
32
P1dB (dBm)
30
28
26
925 930 940935 945 950 955 960
+25°C
–40°C
+85°C
–40°C
+85°C
FREQUENCY (MHz)
+25°C
Figure 19. P1dB and OIP3 vs. Frequency and Temperature
(OIP3 at P
= 14 dBm per Tone)
OUT
48
46
44
42
40
OIP3 (dBm)
38
36
34
09353-019
27
26
25
24
23
GAIN (dB)
22
21
20
19
925 930 935 940 945 950 955 960
FREQUENCY ( MHz)
–40°C
+25°C
+85°C
Figure 17. Gain vs. Frequency and Temperature
0
S22
–10
–20
–30
–40
S-PARAMETERS (dB)
–50
S11
S12
46
45
44
43
OIP3 (dBm)
42
41
40
09353-017
960MHz
–2024681012141618
P
OUT
Figure 20. OIP3 vs. P
7
6
5
4
NOISE FIGURE (dB)
3
943MHz
925MHz
PER TONE (d Bm)
and Frequency
OUT
+85°C
+25°C
–40°C
09353-020
–60
925 955930 935 940 945 950 960
FREQUENCY (MHz )
Figure 18. Input Return Loss (S11), Output Return Loss (S22),
and Reverse Isolation (S12) vs. Frequency
09353-018
Rev. 0 | Page 10 of 20
2
930925 935 940 945 950 955 960
FREQUENCY (MHz )
Figure 21. Noise Figure vs. Frequency and Temperature
09353-021

ADL5605
GENERAL
35
35
30
25
20
15
PERCENTAGE (%)
10
5
0
43.7 44.443.8 43.9 44.0 44.1 44 .2 44. 3 44.5 44.6 44.7 44.8
OIP3 (dBm)
Figure 22. OIP3 Distribution at 943 MHz, 14 dBm per Tone
40
35
30
25
20
15
PERCENTAGE (%)
10
5
0
30.5 31.130. 6 30.7 30.8 30.9 31.0 31.2 31.3 31.4 31. 5
P1dB (dBm)
Figure 23. P1dB Distribution at 943 MHz
30
25
20
15
PERCENTAGE (%)
10
5
0
4.45 4.654.50 4.55 4.60 4.70 4.75 4.80
09353-022
NOISE FIGURE (dB)
09353-025
Figure 25. Noise Figure Distribution at 943 MHz
0
–10
–20
–30
–40
–50
ACPR (dBc)
–60
–70
–80
–90
0 2 4 6 8 10121416182022
09353-023
946MHz
Figure 26. ACPR vs. P
P
(dBm)
OUT
, 3GPP, TM1-64, at 946 MHz
OUT
09353-026
40
35
30
25
20
15
PERCENTAGE (%)
10
5
0
22.7 23.122.8 22.9 23.0 23.2 23.3 23.4
GAIN (dB)
Figure 24. Gain Distribution at 943 MHz
09353-024
Rev. 0 | Page 11 of 20
3.5
3.0
2.5
2.0
1.5
EVM (%)
1.0
0.5
0
–10 –5 0 252015105
Figure 27. EVM vs. P
946MHz
P
(dBm)
OUT
, 3GPP, TM1-64, at 946 MHz
OUT
09353-027

ADL5605
320
5.25V
310
300
SUPPLY CURRENT (mA)
290
280
–40 30–30–20–100 1020 4050607080
TEMPERATURE ( °C)
5V
4.75V
Figure 28. Supply Current vs. Temperature and Supply Voltage at 943 MHz
3
3
2
09353-028
CH3 1V Ω
CH2 1V Ω
M20ns 10GS/ s IT 4ps/p t
A CH2 2.5V
9353-030
Figure 30. Turn-On Time, 10% of Control Pulse to 90% of RFOUT
2
CH3 1V Ω
CH2 1V Ω
M20ns 10GS/ s IT 4ps/p t
A CH2 2.5V
Figure 29. Turn-Off Time, 10% of Control Pulse to 90% of RFOUT
09353-029
Rev. 0 | Page 12 of 20

ADL5605
V
APPLICATIONS INFORMATION
BASIC LAYOUT CONNECTIONS
The basic connections for operating the ADL5605 are shown
in Figure 31. The RF matching components correspond to the
943 MHz frequency tuning band.
Power Supply
The voltage supply for the ADL5605, which ranges from 4.75 V
to 5.25 V, should be connected to the VCC1 test pin. The dc bias
to the output stage is supplied through L1 and is connected to the
RFOUT pin. Three decoupling capacitors (C7, C8, and C9) are
used to prevent RF signals from propagating on the dc lines. The
VBIAS and VCC pins can be directly connected to the main
supply voltage. Additional decoupling capacitors (C5, C6, C11,
C12, C13, and C14) are required on the VCC and VBIAS pins.
RF Input Interface
Pin 1 is the RF input pin for the ADL5605. The RF input is easily
matched to 50 Ω with only one shunt capacitor and the microstrip line used as an inductor. For the 881 MHz and 943 MHz
frequency tuning bands, the input requires no external matching
components.
For complete information about component values and spacing
for the different frequency tuning bands, see the ADL5605
Matching section.
RF Output Interface
Pin 9 to Pin 12 are the RF output pins. Inductor L2, the shunt
capacitor, C
, and the inductance from the microstrip line are
OUT
used to match the RF output to 50 Ω. For complete information
about component values and spacing for the different frequency
tuning bands, see the ADL5605 Matching section.
Power-Down
The ADL5605 can be disabled by connecting the DISABLE pin
to 5 V. When disabled, the ADL5605 draws approximately 5 mA
of current from the power supply and 1.4 mA from the DISABLE
pin. Decoupling Capacitor C3 is recommended to prevent the
propagation of RF signals. To completely shut down the device,
connect the VCC pin, the VBIAS pin, and the VCC1 test pin to
ground. In this state, the part draws approximately 1.4 mA from
the DISABLE pin.
RFIN
DISABLE
VCC
BIAS
C11
10µF
C14
10µF
C1
100pF
C6
0.01µF
C13
0.01µF
C3
10pF
C5
100pF
C12
100pF
NC NC NC NC
1
RFIN
DISABLE
2
ADL5605
VCC
3
VBIAS
4
NC NC NC NC
13
RFOUT
RFOUT
RFOUT
RFOUT
8147156165
12
11
10
9
VCC1
L1
18nH
100pF
0.01µF
10µF
C7
C8
C9
L2
1.6nH
C
OUT
8pF
C2
100pF
RFOUT
09353-031
Figure 31. Basic Connections
Rev. 0 | Page 13 of 20

ADL5605
ADL5605 MATCHING
The RF input of the ADL5605 can be easily matched to 50 Ω
with at most one external component and the microstrip line
used as an inductor. The RF output requires one series inductor,
one shunt capacitor, and the microstrip line used as an inductor.
Table 6 lists the required matching component values. Capacitors C
Inductor L2 is a Coilcraft® 0603CS series (0603 size).
For all frequency tuning bands, the placement of C
C
spacing for the various frequency tuning bands. The component
spacing is referenced from the center of the component to the
edge of the package.
and C
IN
is critical. Table 7 lists the recommended component
OUT
are Murata GRM155 series (0402 size), and
OUT
16
NC NC NC NC
1
RFIN
2
DISABLE
RFIN
C1
100pF
C
2.4pF
λ
IN
1
, L2, and
IN
ADL5605
Figure 32 to Figure 34 show the matching networks.
Table 6. Recommended Components for Basic Connections
Frequency (MHz) CIN (pF) L2 (nH) C
728 to 768 2.4 2.7 12.0
868 to 894 N/A 1.6 8.0
925 to 961 N/A 1.6 8.0
Table 7. Matching Component Spacing
Frequency (MHz) λ1 (mils) λ2 (mils) λ3 (mils)
728 to 768 63 94.5 169
868 to 894 N/A 94.5 268
925 to 961 N/A 94.5 240
131415
12
RFOUT
RFOUT
RFOUT
RFOUT
11
10
9
λ
3
λ
2
2.7nH
L1
18nH
C
OUT
C2
100pF
RFOUT
12pF
L2
OUT
(pF)
09353-032
Figure 32. ADL5605 Match Parameters, 748 MHz Frequency Tuning Band
RFIN
C1
100pF
C
OPEN
16
NC NC NC NC
1
2
RFIN
DISABLE
IN
ADL5605
Figure 33. ADL5605 Match Parameters, 881 MHz Frequency Tuning Band
131415
RFOUT
RFOUT
RFOUT
RFOUT
12
11
10
9
λ
3
λ
2
1.6nH
L1
18nH
C
OUT
C2
100pF
RFOUT
09353-033
8pF
L2
RFIN
C1
100pF
C
OPEN
16
NC NC NC NC
1
2
RFIN
DISABLE
IN
ADL5605
131415
RFOUT
RFOUT
RFOUT
RFOUT
12
11
10
9
λ
3
λ
2
1.6nH
L1
18nH
C
OUT
C2
100pF
RFOUT
8pF
L2
09353-034
Figure 34. ADL5605 Match Parameters, 943 MHz Frequency Tuning Band
Rev. 0 | Page 14 of 20

ADL5605
ACPR AND EVM
All adjacent channel power ratio (ACPR) and error vector
magnitude (EVM) measurements were made using a single
W-CDMA carrier and Test Model 1-64.
The signal is generated by a very low ACPR source and is measured at the output by a high dynamic range spectrum analyzer.
For ACPR measurements, the filter setting was chosen for low
ACPR; for EVM measurements, the low EVM setting was selected.
The spectrum analyzer incorporates an instrument noise correction function, and highly linear amplifiers were used to boost
the power levels for ACPR measurements.
Figure 26 shows ACPR vs. P
at 946 MHz. For power levels
OUT
up to 18 dBm, an ACPR of 51 dBc or better can be achieved
at 946 MHz.
Figure 27 shows EVM vs. P
at 946 MHz. The EVM measured
OUT
is 0.5% for power levels up to 18 dBm at 946 MHz. The baseline
composite EVM for the signal source was approximately 0.5%.
When operated in the linear region, there is little or no contribution to EVM by the amplifier.
THERMAL CONSIDERATIONS
The ADL5605 is packaged in a thermally efficient 4 mm ×
4 mm, 16-lead LFCSP. The thermal resistance from junction
to air (θ
was extracted assuming a standard 4-layer JEDEC board with
25 copper plated thermal vias. The thermal vias are filled with
conductive copper paste (AE3030 with thermal conductivity of
7.8 W/mK and thermal expansion α1 of 4 × 10
8.6 × 10
is 12.1°C/W, where the case is the exposed pad of the lead frame
package.
For the best thermal performance, it is recommended that as
many thermal vias as possible be added under the exposed pad
of the LFCSP. The thermal resistance values assume a minimum
of 25 thermal vias arranged in a 5 × 5 array with a via diameter
of 8 mils, via pad of 16 mils, and a pitch of 20 mils. The vias are
plated with copper, and the drill hole is filled with a conductive
copper paste.
) is 52.1°C/W. The thermal resistance for the product
JA
−5
−5
/°C). The thermal resistance from junction to case (θJC)
/°C and α2 of
For optimal performance, it is recommended that the thermal
vias be filled with a conductive paste of the equivalent thermal
conductivity specified earlier in this section; alternatively, an
external heat sink can be used to dissipate heat quickly without
affecting the die junction temperature. It is also recommended
that the ground pattern be extended above and below the device
to improve thermal efficiency (see Figure 35).
SOLDERING INFORMATION AND RECOMMENDED PCB LAND PATTERN
Figure 35 shows the recommended land pattern for the ADL5605.
To minimize thermal impedance, the exposed paddle on the
4 mm × 4 mm LFCSP is soldered to a ground plane along with
Pin 5 to Pin 8 and Pin 13 to Pin 16. To improve thermal dissipation, 25 thermal vias are arranged in a 5 × 5 array under the
exposed paddle. Areas above and below the paddle are tied with
regular vias. If multiple ground layers exist, they should be tied
together using vias. For more information about land pattern
design and layout, see the AN-772 Application Note, A Design
and Manufacturing Guide for the Lead Frame Chip Scale Package
(LFCSP).
16 13
RFIN
RFOUT
09353-035
16 MIL VIA PAD
WITH 8 MIL VIA
Figure 35. Recommended Land Pattern
58
Rev. 0 | Page 15 of 20

ADL5605
EVALUATION BOARD
The schematic of the ADL5605 evaluation board is shown in
Figure 36. The evaluation board uses 25 mils wide, 50 Ω traces
and is made from IS410 material with a 20 mils gap to ground.
The evaluation board is tuned for operation at 943 MHz. The
inputs and outputs should be ac-coupled with appropriately
sized capacitors; therefore, for low frequency applications, the
value of C1 and C2 may need to be increased. DC bias is
provided to the output stage via an inductor (L1) connected
to the RFOUT pin. A bias voltage of 5 V is recommended.
VCC3
R4
OPEN
DISABLE
R1
0Ω
VCC2
RFIN
OPEN
R5
C10
OPEN
C11
10µF
C1
100pF
C4
OPEN
C6
0.01µF
C14
10µF
C3
10pF
C
N/A
IN
C5
100pF
C13
0.01µF
C12
100pF
1
2
3
4
NC NC NC NC
RFIN
DISABLE
VCC
VBIAS
NC NC NC NC
The evaluation board has a short, non-50 Ω line on its output
to accommodate the four output pins and to allow for easier low
inductance output matching. The pads for Pin 9 to Pin 12 are
included on this microstrip line and are included in all matches.
The evaluation board uses numbers as identifiers to aid in the
placement of matching components at both the RF input and
RF output of the device. Figure 37 and Figure 38 show images
of the board layout.
13
12
ADL5605
RFOUT
RFOUT
RFOUT
RFOUT
8147156165
11
10
9
L1
18nH
C7
100pF
C8
0.01µF
C9
10µF
L2
1.6nH
C
OUT
8pF
C2
100pF
RFOUT
R2
0Ω
VCC1
09353-036
Figure 36. Evaluation Board, 943 MHz Frequency Tuning Band
Table 8. Evaluation Board Configuration Options, 943 MHz Frequency Tuning Band
Component Function/Notes Default Value
C1, C2 Input/output dc blocking capacitors. C1, C2 = 100 pF
C3, C4, C5, C6, C7,
C8, C9, C10, C11,
C12, C13, C14
Power supply decoupling capacitors. Power supply decoupling capacitors are required to
filter out the high frequency noise on the power supply. The smallest capacitor should be the
closest to the ADL5605. The main bias that goes through RFOUT is the most sensitive to noise
because the bias is connected directly to the RF output.
C3 = 10 pF
C5, C7, C12 = 100 pF
C6, C8, C13 = 0.01 μF
C9, C11, C14 = 10 μF
C4, C10 = open
CIN
Input matching capacitor. To match the ADL5605 at the 943 MHz or 881 MHz frequency tuning
band, C
is not required. For the 748 MHz frequency tuning band, CIN is set at a specific distance
IN
= open
C
IN
from the device so that the microstrip line can act as inductance for the matching network
(see Table 7). If space is at a premium, an inductor can take the place of the microstrip line.
C
OUT
Output matching capacitor. The output match is set for 943 MHz and is easily changed for
other frequency tuning bands. The tolerance of this capacitor should be tight. C
is set at
OUT
C
= 8.0 pF HQ
OUT
a specific distance from the device so that the microstrip line can act as inductance for the
matching network (see Table 7). If space is at a premium, an inductor can take the place of the
microstrip line. A short length of low impedance line on the output is embedded in the match.
L2
Output matching inductor. The output match is set for 943 MHz and is easily changed for other
L2 = 1.6 nH HQ
frequency tuning bands. A high Q Coilcraft inductor with tight tolerance is recommended.
L1
The main bias for the ADL5605 comes through L1 to the output stage. L1 should be high
L1 = 18 nH
impedance for the frequency of operation while providing low resistance for the dc current.
The evaluation board uses a Coilcraft 0603HP-18NX_LU inductor; this 18 nH inductor provides
some of the match at 943 MHz.
R1, R2, R4, R5
Exposed Paddle The paddle should be connected to both thermal and electrical ground.
To provide bias to all stages through just one supply, set R1 and R2 to 0 Ω, and leave R4 and
R5 open. To provide separate bias to stages, set R1 and R2 to open and R4 and R5 to 0 Ω.
R1, R2 = 0 Ω
R4, R5 = open
Rev. 0 | Page 16 of 20

ADL5605
09353-037
Figure 37. Evaluation Board Layout, Top
Figure 38. Evaluation Board Layout, Bottom
09353-038
Rev. 0 | Page 17 of 20

ADL5605
OUTLINE DIMENSIONS
PIN 1
INDICATOR
1.00
0.85
0.80
12° MAX
SEATING
PLANE
4.00
BSC SQ
TOP
VIEW
0.80 MAX
0.65 TYP
0.35
0.30
0.25
3.75
BSC SQ
0.20 REF
0.60 MAX
0.65 BSC
0.05 MAX
0.02 NOM
COPLANARITY
0.50
0.40
0.30
0.08
0.60 MAX
13
12
EXPOSED
(BOTTOM VIEW)
9
8
1.95 BSC
PIN 1
16
1
PA D
4
5
FOR PROPER CONNECT ION OF
THE EXPOSED PAD, REFER TO
THE PIN CONFIGURATION AND
FUNCTION DESCRIPTIONS
SECTION OF THIS DATA SHEET.
INDICATOR
2.50
2.35 SQ
2.20
0.25 MIN
COMPLIANT TO JEDEC STANDARDS MO-220-VGGC
082008-A
Figure 39. 16-Lead Lead Frame Chip Scale Package [LFCSP_VQ]
4 mm × 4 mm Body, Very Thin Quad
(CP-16-10)
Dimensions shown in millimeters
ORDERING GUIDE
1
Model
ADL5605ACPZ-R7 −40°C to +85°C 16-Lead Lead Frame Chip Scale Package [LFCSP_VQ] CP-16-10
ADL5605-EVALZ Evaluation Board
1
Z = RoHS Compliant Part.
Temperature Range Package Description Package Option
Rev. 0 | Page 18 of 20

ADL5605
NOTES
Rev. 0 | Page 19 of 20

ADL5605
NOTES
©2011 Analog Devices, Inc. All rights reserved. Trademarks and
registered trademarks are the property of their respective owners.
D09353-0-7/11(0)
Rev. 0 | Page 20 of 20
 Loading...