

5 GHz, Low Distortion
FEATURES
−3 dB bandwidth of 5 GHz (AV = 6 dB)
Single resistor programmable gain: 0 dB to 18 dB
Differential or single-ended input to differential output
Low harmonic distortion (HD2/HD3 @ A
−88/−69 dBc @ 250 MHz
−77/−66 dBc @ 500 MHz
−73/−72 dBc @ 1 GHz
IMD3 @ 1 GHz = −63 dBc
Slew rate
8700 V/µs (A
6600 V/s (A
= 6 dB, 2 V step)
V
= 18 dB, 2 V step)
V
Fast settling: 1 ns to 1%, 1.4 ns to 0.1%
Fast overdrive recovery: 6.7 ns to 1%, 9.3 ns to 0.5%
Single-supply operation: 5 V
0.1 dB gain flatness to 300 MHz
DC level translation
Available in 16-lead LFCSP
APPLICATIONS
Differential ADC drivers for giga-sample ADCs
GBPS line drivers with pre-emphasis
High speed data acquisition
Electronic surveillance countermeasures
Pulse capture and conditioning
Oscilloscopes
Satellite communications
Single-ended-to-differential converters
RF/IF gain blocks
GENERAL DESCRIPTION
The ADA4960-1 is a high performance, differential amplifier
optimized for RF and IF applications. It achieves better than 63 dB
IMD3 performance for frequencies up to and beyond 1 GHz,
making it an ideal driver for 8-bit to 10-bit giga-sample analogto-digital converters (ADCs).
The buffered inputs of the ADA4960-1 isolate the gain-setting
resistor (R
input resistance, easing matching and input drive requirements.
The ADA4960-1 has a nominal 150 differential output impedance.
The ADA4960-1 is optimized for wideband, low distortion
performance for frequencies up to and beyond 1 GHz. These
attributes, together with its adjustable gain capability, make this
device the amplifier of choice for general-purpose IF and broadband applications where low distortion, noise, and power are critical.
) from the signal inputs, maintaining a constant 10 k
G
= 6 dB)
V
ADC Driver/Line Driver
ADA4960-1
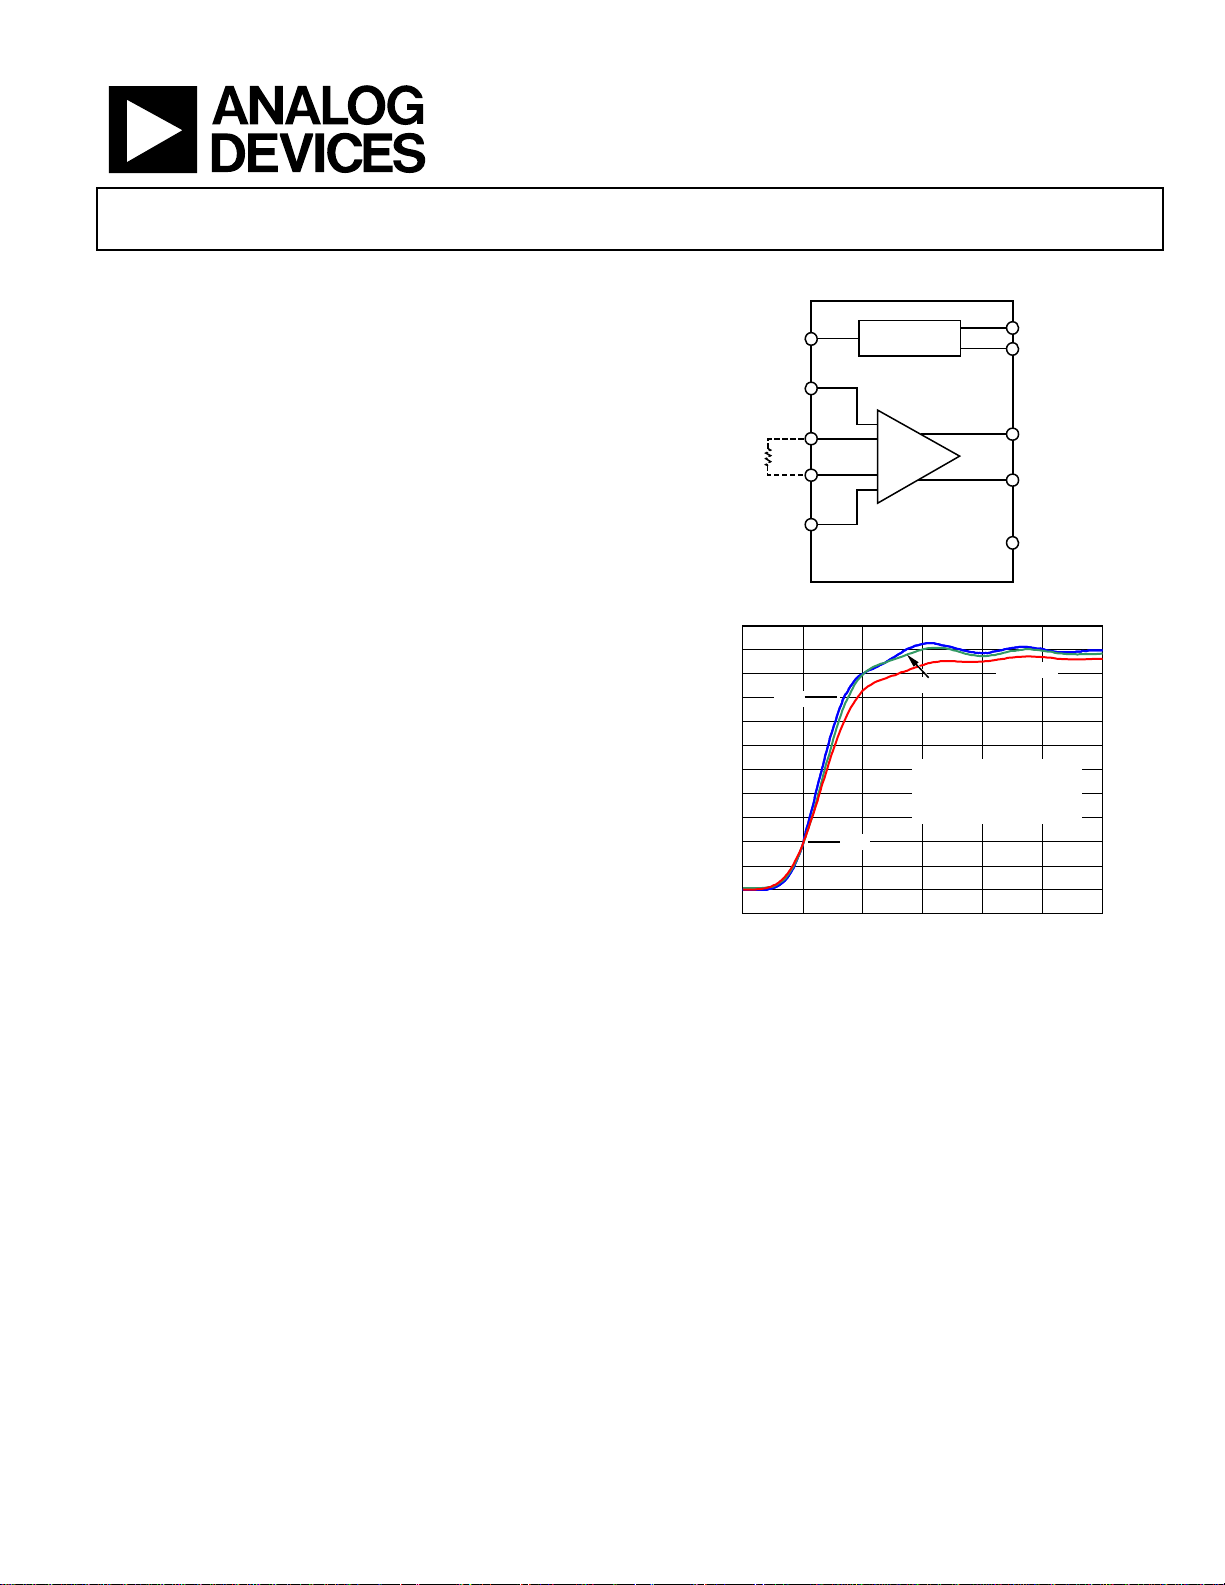
FUNCTIONAL BLOCK DIAGRAM
PD
VIP
IIP
R
G
IIN
VIN
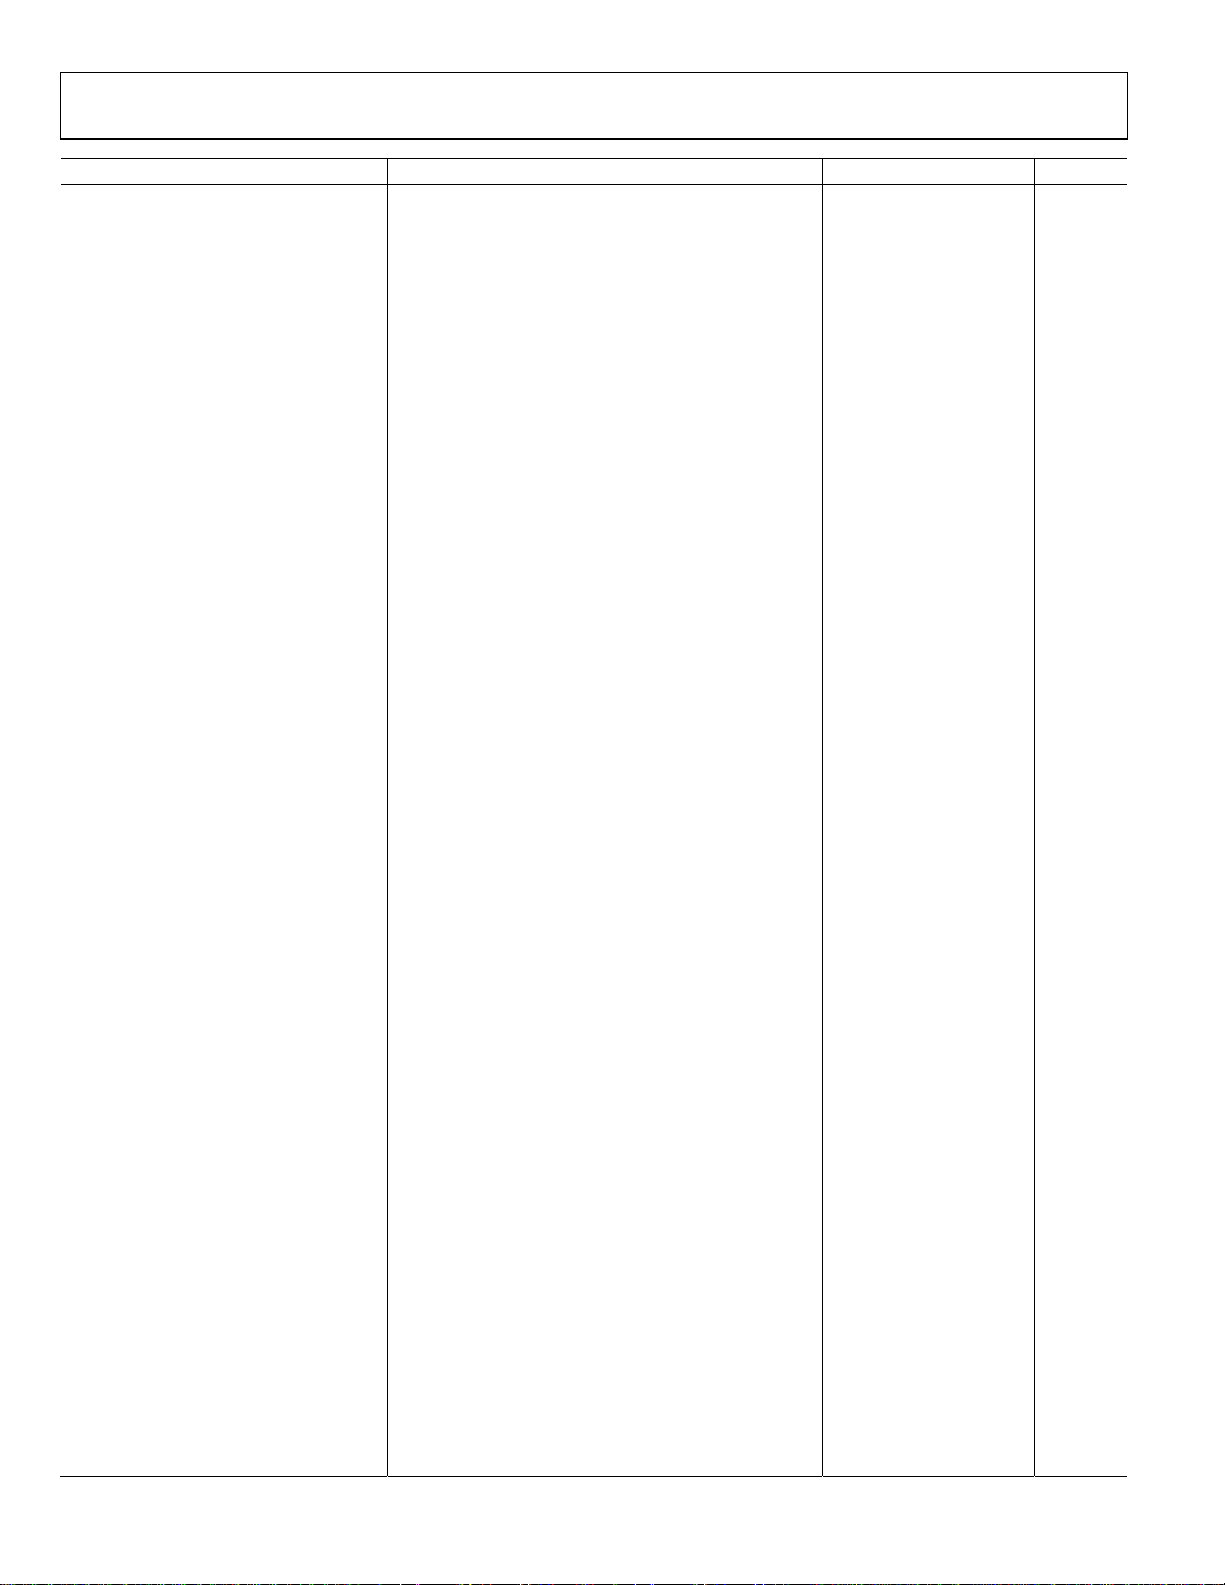
1.2
1.0
0.8
0.6
80%
0.4
0.2
(V)
0
OUT
V
–0.2
–0.4
–0.6
–0.8
–1.0
–1.2
–0.2 0 0.2
Figure 2. Rise Time, V
For A
V
BIAS CELL
ADA4960-1
Figure 1.
= 6dB
A
V
AV = 12dB
AV (dB) SLEW RATE ( V/µs)
6
12
18 6600
20%
0.4 0.6 0.8 1.0
TIME
(ns)
= 2 V p-p, TA = 25°C,
= 6 dB, AV = 12 dB, and AV = 18 dB
OUT
The device is optimized for the best combination of slew rate,
bandwidth, and broadband distortion. These attributes allow it
to drive a wide variety of ADCs. It is ideally suited for driving
mixers, pin diode attenuators, SAW filters, and multi-element
discrete devices.
The user accessible gain adjust and bandwidth extension features
allow configuration of the ADA4960-1 for line driver and
channel equalization applications.
The quiescent current of the ADA4960-1 is typically 60 mA. When
disabled, it consumes less than 3 mA, offering excellent input-tooutput isolation.
Fabricated on an Analog Devices, Inc., high speed SiGe process,
the ADA4960-1 is available in a compact 3 mm × 3 mm, 16-lead
LFCSP. It operates over the temperature range of −40°C to +85°C.
VCC
VOCM
VOP
VON
GND
AV = 18dB
8700
7700
08458-001
08458-047
Rev. 0
Information furnished by Analog Devices is believed to be accurate and reliable. However, no
responsibility is assumed by Analog Devices for its use, nor for any infringements of patents or other
rights of third parties that may result from its use. Specifications subject to change without notice. No
license is granted by implication or otherwise under any patent or patent rights of Analog Devices.
Trademarks and registered trademarks are the property of their respective owners.
One Technology Way, P.O. Box 9106, Norwood, MA 02062-9106, U.S.A.
Tel: 781.329.4700 www.analog.com
Fax: 781.461.3113 ©2010 Analog Devices, Inc. All rights reserved.

ADA4960-1
TABLE OF CONTENTS
Features .............................................................................................. 1
Applications ....................................................................................... 1
Functional Block Diagram .............................................................. 1
General Description ......................................................................... 1
Revision History ............................................................................... 2
Specifications ..................................................................................... 3
Absolute Maximum Ratings ............................................................ 6
Thermal Resistance ...................................................................... 6
Maximum Power Dissipation ..................................................... 6
ESD Caution .................................................................................. 6
Pin Configuration and Function Descriptions ............................. 7
Typical Performance Characteristics ............................................. 8
Test Circuits ................................................................................. 12
REVISION HISTORY
4/10—Revision 0: Initial Version
Circuit Description......................................................................... 13
Basic Structure ............................................................................ 13
Applications Information .............................................................. 14
Basic Connections ...................................................................... 14
Input and Output Interfacing ................................................... 14
Gain Adjust ................................................................................. 15
Bandwidth Extension ................................................................. 15
ADC Interfacing ......................................................................... 16
Line Driver Applications .......................................................... 16
Overdrive and Recovery ............................................................ 17
Layout, Grounding, and Bypassing .............................................. 18
Outline Dimensions ....................................................................... 19
Ordering Guide .......................................................................... 19
Rev. 0 | Page 2 of 20

ADA4960-1
SPECIFICATIONS
VCC = 5 V, VOCM = 2.5 V, RL = 100 Ω differential, AV = 6 dB, CL = 1 pF differential, f = 140 MHz, T = 25°C. Inputs and outputs are ac-coupled.
Table 1.
Parameter Conditions Min Typ Max Unit
DYNAMIC PERFORMANCE
−3 dB Bandwidth AV = 6 dB, V
A
A
Bandwidth for 0.1 dB Flatness V
= 12 dB, V
V
= 18 dB, V
V
≤ 1.0 V p-p 300 MHz
OUT
Gain Accuracy RG = 95.3 Ω 0.5 dB
Gain Supply Sensitivity VS ± 5% 0.2 dB/V
Gain Temperature Sensitivity −40°C to +85°C 2.5 mdB/°C
Slew Rate AV = 6 dB, V
A
A
A
A
A
= 12 dB, V
V
= 18 dB, V
V
= 6 dB, V
V
= 12 dB, V
V
= 18 dB, V
V
Settling Time 1 V step to 1% 1 ns
1 V step to 0.1% 1.4 ns
Overdrive Recovery Time VIN = 1 V to 0 V step, AV = 12 dB, V
V
= 1 V to 0 V step, AV = 12 dB, V
IN
Reverse Isolation (S12) f = ≤1 GHz 68 dB
INPUT/OUTPUT CHARACTERISTICS
Output Common Mode VS/2 V
VOCM Adjustment Range 1 2.75 V
Input Common-Mode Range 2.25 2.75 V
Maximum Output Voltage Swing 1 dB compressed 3.5 V p-p
Output Common-Mode Offset Referenced to VCC/2 −20 +10 mV
Output Common-Mode Drift −40°C to +85°C 0.05 mV/°C
Output Differential Offset Voltage −36 +22 mV
Common-Mode Rejection Ratio (CMRR) 60 dB
Output Differential Offset Drift −40°C to +85°C 0.05 mV/°C
Input Bias Current −40°C to +85°C −20 μA
Input Resistance (Differential) AV = all gains 10 kΩ
Input Capacitance (Differential) AV = all gains 0.4 pF
Input Resistance (Single-Ended) AV = all gains 5 kΩ
Input Capacitance (Single-Ended) AV = all gains 0.8 pF
Output Resistance (Differential) 150 Ω
Output Capacitance (Differential) 1.2 pF
POWER INTERFACE
Supply Voltage 4.75 5.0 5.25 V
ENB Threshold Low to high 2.2 V
High to low 1.3 V
ENB Input Bias Current ENB high 30 μA
ENBL low −180 μA
Quiescent Current ENB high 56 60 64 mA
ENBL low 2.9 mA
≤ 1.0 V p-p 5000 MHz
OUT
≤ 1.0 V p-p 2000 MHz
OUT
≤ 1.0 V p-p 1200 MHz
OUT
= 2 V step, 20% to 80% 8700 V/μs
OUT
= 2 V step, 20% to 80% 7700 V/μs
OUT
= 2 V step, 20% to 80% 6600 V/μs
OUT
= 1 V step, 20% to 80% 7200 V/μs
OUT
= 1 V step, 20% to 80% 4900 V/μs
OUT
= 1 V step, 20% to 80% 3700 V/μs
OUT
≤ 1% 6.7 ns
OUT
≤ 0.5% 9.3 ns
OUT
Rev. 0 | Page 3 of 20
ADA4960-1
Parameter Conditions Min Typ Max Unit
NOISE/HARMONIC PERFORMANCE
140 MHz
Second/Third Harmonic Distortion AV = 6 dB, V
A
A
= 12 dB, V
V
= 18 dB, V
V
OIP3/IMD3 AV = 6 dB, V
A
A
= 12 dB, V
V
= 18 dB, V
V
Noise Spectral Density (RTI) AV = 6 dB 5.4 nV/√Hz
A
A
= 12 dB 3.2 nV/√Hz
V
= 18 dB 2.1 nV/√Hz
V
1 dB Compression Point (RTO) AV = 6 dB 12.0 dBm
A
A
= 12 dB 12.0 dBm
V
= 18 dB 11.9 dBm
V
250 MHz
Second/Third Harmonic Distortion AV = 6 dB, V
A
A
= 12 dB, V
V
= 18 dB, V
V
OIP3/IMD3 AV = 6 dB, V
A
A
= 12 dB, V
V
= 18 dB, V
V
Noise Spectral Density (RTI) AV = 6 dB 5.4 nV/√Hz
A
A
= 12 dB 3.1 nV/√Hz
V
= 18 dB 2.0 nV/√Hz
V
1 dB Compression Point (RTO) AV = 6 dB 12.0 dBm
A
A
= 12 dB 11.9 dBm
V
= 18 dB 11.7 dBm
V
500 MHz
Second/Third Harmonic Distortion AV = 6 dB, V
A
A
= 12 dB, V
V
= 18 dB, V
V
OIP3/IMD3 AV = 6 dB, V
A
A
= 12 dB, V
V
= 18 dB, V
V
Noise Spectral Density (RTI) AV = 6 dB 5.2 nV/√Hz
A
A
= 12 dB 3.0 nV/√Hz
V
= 18 dB 1.9 nV/√Hz
V
1 dB Compression Point (RTO) AV = 6 dB 11.6 dBm
A
A
= 12 dB 11.4 dBm
V
= 18 dB 11.0 dBm
V
750 MHz
Second/Third Harmonic Distortion AV = 6 dB, V
A
A
= 12 dB, V
V
= 18 dB, V
V
OIP3/IMD3 AV = 6 dB, V
A
A
= 12 dB, V
V
= 18 dB, V
V
Noise Spectral Density (RTI) AV = 6 dB 5.0 nV/√Hz
A
A
= 12 dB 3.0 nV/√Hz
V
= 18 dB 1.8 nV/√Hz
V
1 dB Compression Point (RTO) AV = 6 dB 9.7 dBm
A
A
= 12 dB 9.5 dBm
V
= 18 dB 9.5 dBm
V
= 0.9 V p-p −91/−73 dBc
OUT
= 0.9 V p-p −86/−73 dBc
OUT
= 0.9 V p-p −82/−72 dBc
OUT
= 0.9 V p-p composite (2 MHz spacing) +33.2/−79 dBm/dBc
OUT
= 0.9 V p-p composite (2 MHz spacing) +33.4/−78 dBm/dBc
OUT
= 0.9 V p-p composite (2 MHz spacing) +33.3/−78 dBm/dBc
OUT
= 0.9 V p-p −88/−69 dBc
OUT
= 0.9 V p-p −81/−68 dBc
OUT
= 0.9 V p-p −77/−68 dBc
OUT
= 0.9 V p-p composite (2 MHz spacing) +32.5/−77 dBm/dBc
OUT
= 0.9 V p-p composite (2 MHz spacing) +32.6/−77 dBm/dBc
OUT
= 0.9 V p-p composite (2 MHz spacing) +32.1/−76 dBm/dBc
OUT
= 0.9 V p-p −77/−66 dBc
OUT
= 0.9 V p-p −71/−66 dBc
OUT
= 0.9 V p-p −68/−65 dBc
OUT
= 0.9 V p-p composite (2 MHz spacing) +30.2/−72 dBm/dBc
OUT
= 0.9 V p-p composite (2 MHz spacing) +29.9/−71 dBm/dBc
OUT
= 0.9 V p-p composite (2 MHz spacing) +29.1/−70 dBm/dBc
OUT
= 0.9 V p-p −70/−68 dBc
OUT
= 0.9 V p-p −67/−69 dBc
OUT
= 0.9 V p-p −64/−69 dBc
OUT
= 0.9 V p-p composite (2 MHz spacing) +28.3/−67 dBm/dBc
OUT
= 0.9 V p-p composite (2 MHz spacing) +27.7/−67 dBm/dBc
OUT
= 0.9 V p-p composite (2 MHz spacing) +26.9/−65 dBm/dBc
OUT
Rev. 0 | Page 4 of 20

ADA4960-1
Parameter Conditions Min Typ Max Unit
1000 MHz
Second/Third Harmonic Distortion AV = 6 dB, V
A
A
= 12 dB, V
V
= 18 dB, V
V
OIP3/IMD3 AV = 6 dB, V
A
A
= 12 dB, V
V
= 18 dB, V
V
Noise Spectral Density (RTI) AV = 6 dB 4.8 nV/√Hz
A
A
= 12 dB 2.7 nV/√Hz
V
= 18 dB 1.6 nV/√Hz
V
1 dB Compression Point (RTO) AV = 6 dB 8.0 dBm
A
A
= 12 dB 7.7 dBm
V
= 18 dB 7.6 dBm
V
= 0.9 V p-p −73/−72 dBc
OUT
= 0.9 V p-p −69/−78 dBc
OUT
= 0.9 V p-p −67/−85 dBc
OUT
= 0.9 V p-p composite (2 MHz spacing) +26.2/−63 dBm/dBc
OUT
= 0.9 V p-p composite (2 MHz spacing) +26.0/−63 dBm/dBc
OUT
= 0.9 V p-p composite (2 MHz spacing) +25.0/−61 dBm/dBc
OUT
Rev. 0 | Page 5 of 20
ADA4960-1
ABSOLUTE MAXIMUM RATINGS
Table 2.
Parameter Rating
Supply Voltage, VCC 5.25 V
VIP, VIN VCC + 0.5 V
Internal Power Dissipation See Figure 3
Maximum Junction Temperature 150°C
Operating Temperature Range −40°C to +85°C
Storage Temperature Range −65°C to +150°C
Stresses above those listed under Absolute Maximum Ratings
may cause permanent damage to the device. This is a stress
rating only; functional operation of the device at these or any
other conditions above those indicated in the operational
section of this specification is not implied. Exposure to absolute
maximum rating conditions for extended periods may affect
device reliability.
THERMAL RESISTANCE
The power dissipated in the package (P
quiescent power dissipation and the power dissipated in the
package due to the load drive. The quiescent power is the voltage
between the supply pins (V
The power dissipated due to the load drive depends upon the
particular application. The power due to load drive is calculated
by multiplying the load current by the associated voltage drop
across the device. RMS voltages and currents must be used in
these calculations.
Airflow increases heat dissipation, effectively reducing θ
addition, more metal directly in contact with the package leads/
exposed pad from metal traces, through holes, ground, and power
planes reduce θ
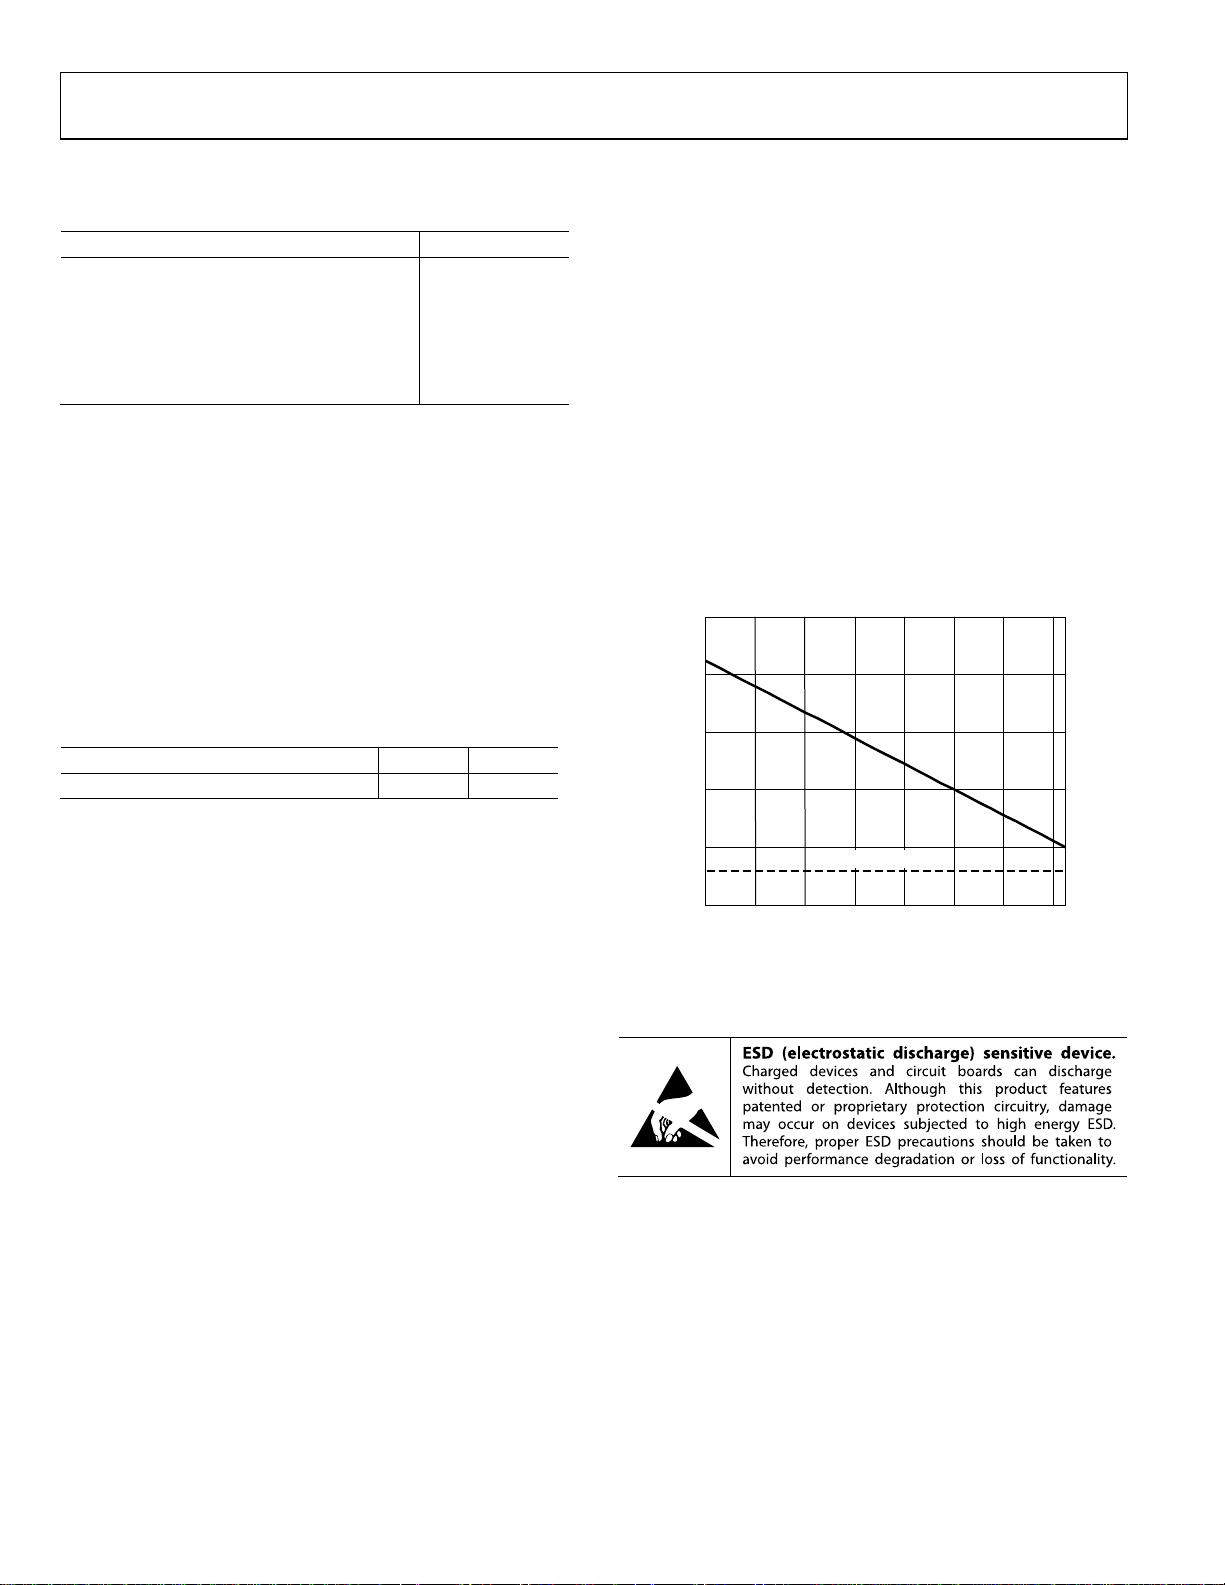
Figure 3 shows the maximum safe power dissipation of the
ADA4960-1 vs. the ambient temperature on a JEDEC standard
4-layer board.
2.5
θJA is specified for the device (including the exposed pad) soldered
to a high thermal conductivity, 4-layer circuit board, as described
2.0
in EIA/JESD 51-7.
) times the quiescent current (IS).
S
.
JA
) is the sum of the
D
JA
. In
Table 3. Thermal Resistance
Package Type θJA Unit
16-Lead LFCSP (Exposed Pad) 89.5 °C/W
MAXIMUM POWER DISSIPATION
The maximum safe power dissipation in the ADA4960-1 package
is limited by the associated rise in junction temperature (T
the die. At approximately 150°C, which is the glass transition
temperature, the plastic changes its properties. Even temporarily
exceeding this temperature limit can change the stresses that the
package exerts on the die, permanently shifting the parametric
performance of the ADA4960-1. Exceeding a junction temperature
of 150°C for an extended period can result in changes in the
silicon devices, potentially causing failure.
) on
J
1.5
1.0
0.5
MAXIMUM POWER DISSIPATION
0
–40 –20 0 20 40 60 80 100
Figure 3. Maximum Power Dissipation vs. Ambient Temperature for 4-Layer Board
QUIESCENT POWER
AMBIENT TEMPERATURE (°C)
08458-002
ESD CAUTION
Rev. 0 | Page 6 of 20

ADA4960-1
PIN CONFIGURATION AND FUNCTION DESCRIPTIONS
16 PD
15 GND
1
VIP
2
IIP
3
IIN
4
VIN
NOTES
1. NC = NO CONNECT.
2. EXPOSE D PAD MUST BE CONNEC T ED TO GND.
ADA4960-1
TOP VIEW
(Not to S cale)
6
5
NC
NC
VOCM
13
14 GND
VCC
12
VOP
11
10
VON
9
VCC
8
7
VCC
VCC
08458-003
Figure 4. Pin Configuration
Table 4. Pin Function Descriptions
Pin No. Mnemonic Description
1 VIP Balanced Differential Input. This pin is internally biased to VCC/2.
2 IIP Gain Setting Resistor. Connect RG between this pin and IIN.
3 IIN Gain Setting Resistor. Connect RG between this pin and IIP.
4 VIN Balanced Differential Input. This pin is internally biased to VCC/2.
5, 6 NC Leave these pins unconnected.
7, 8, 9, 12 VCC Positive 5 V Supply Pins.
10 VON Balanced Differential Output. This pin is biased to the VOCM input voltage.
11 VOP Balanced Differential Output. This pin is biased to the VOCM input voltage.
13 VOCM This pin is internally biased at VCC/2. As an input, this pin sets the dc VOP and VON voltages.
14, 15 GND Ground. Connect this pin to a low impedance ground.
16 PD This pin grounded disables the part, and at 5 V, this pin turns the part on.
EPAD The exposed pad must be connected to GND.
Rev. 0 | Page 7 of 20

ADA4960-1
TYPICAL PERFORMANCE CHARACTERISTICS
VCC = 5 V, VOCM = 2.5 V, RL = 100 Ω differential, AV = 6 dB, CL = 1 pF differential, f = 140 MHz, T = 25°C.
20
AV = 18dB
18
A
= 6dB
V
15
AV = 12dB
10
(dB)
V
A
5
0
–5
0.01 0.1 1 10
AV = 6dB
AV = 0dB
FREQUENCY (G Hz )
Figure 5. Small Signal Frequency Response,
Gain vs. Frequency at A
0.6
0.4
0.2
(V)
0
OUT
V
–0.2
–0.4
–0.6
–0.2 0 0.2
Figure 6. Rise Time, V
= 0 dB, AV = 6 dB, AV = 12 dB, and AV = 18 dB
V
= 6dB
A
V
A
= 18dB
80%
AV = 12dB
20%
TIME
OUT
V
AV (dB) SLEW RATE (V/µs)
6
12
18 3700
(ns)
vs. Time, V
OUT
7200
4900
0.4 0.6
= 1 V p-p
24
16
14
AV = 12dB
12
AV = 18dB
10
SPECTRAL NOISE DENSITY (nV/√Hz)
8
08458-004
100 100050
FREQUENCY ( M Hz )
08458-039
Figure 8. RTO Noise Spectral Density vs. Frequency at
= 6 dB, AV = 12 dB, and AV = 18 dB
A
V
1.2
1.0
0.8
80%
0.6
0.4
0.2
(V)
0
OUT
V
–0.2
–0.4
–0.6
–0.8
–1.0
–1.2
–0.2 0 0.2
08458-053
Figure 9. Rise Time, V
20%
= 6dB
A
V
AV = 12dB
AV (dB) SLEW RATE (V/µs)
6
12
18 6600
0.4 0.6 0.8 1.0
TIME
(ns)
vs. Time, V
OUT
OUT
AV = 18dB
8700
7700
= 2 V p-p
08458-054
13
= 6dB
A
22
20
18
NOISE FIGURE (dB)
16
14
0 200 400 600 800 1000 1200
FREQUENCY ( MHz)
V
AV = 12dB
AV = 18dB
08458-038
Figure 7. Noise Figure vs. Frequency at AV = 6 dB, AV = 12 dB, and AV = 18 dB
Rev. 0 | Page 8 of 20
12
11
10
P1 (dB)
AV = 18dB
9
8
7
100 200 300 400 500
AV = 6dB
AV = 12dB
600 700 800 900 1000
FREQUENCY (MHz)
Figure 10. P1dB vs. Frequency at AV = 6 dB, AV = 12 dB, and AV = 18 dB
08458-007

ADA4960-1
–
–
–
–
40
35
30
OIP3 (dBm)
25
AV = 6dB
AV = 12dB
AV = 18dB
DISTORTION (dBc)
55
–60
–65
–70
–75
–80
TA = +85°C
TA = +25°C
TA = –40°C
20
100 200 300 400 500
FREQUENCY (MHz)
600 700 800 900 1000
08458-008
Figure 11. OIP3 vs. Frequency at AV = 6 dB, AV = 12 dB, and AV = 18 dB,
= 0.45 V p-p/Tone, 2 MHz Spacing
V
OUT
40
35
30
OIP3 (dBm)
25
20
100 200 300 400 500 600 700 800 900 1000
= +85°C
T
A
TA = –40°C
TA = +25°C
FREQUENCY (M Hz)
Figure 12. OIP3 vs. Frequency at AV = 6 dB, TA = −40°C, TA = +25°C, and
T
–60
55
= +85°C, V
A
= 0.45 V p-p/Tone, 2 MHz Spacing
OUT
–85
100 200 300 400 500
FREQUENCY (MHz)
600 700 800 900 1000
08458-011
Figure 14. Two Tone IMD3 vs. Frequency at TA = −40°C, TA = +25°C, and
= +85°C, AV = 6 dB, V
T
A
60
–65
–70
AV = 18dB
–75
–80
DISTORTION (dBc)
–85
–90
–95
100 200 300 400 500 600 700 800 900 1000
08458-040
= 0.45 V p-p/Tone, 2 MHz Spacing
OUT
AV = 12dB
= 6dB
A
V
FREQUENCY (M Hz )
08458-041
Figure 15. HD2 vs. Frequency at AV = 6 dB, AV = 12 dB, and AV = 18 dB,
= 0.9 V p-p
V
OUT
60
–65
–65
–70
–75
DISTORTION (dBc)
–80
–85
100 200 300 400 500
FREQUENCY (MHz)
AV = 18dB
AV = 12dB
AV = 6dB
600 700 800 900 1000
08458-010
Figure 13. Two Tone IMD3 vs. Frequency, AV = 6 dB, AV = 12 dB, and AV = 18 dB,
V
= 0.9 V p-p/Tone, 2 MHz Spacing
OUT
–70
–75
–80
DISTORTION (dBc)
–85
–90
100 200 300 400 500
FREQUENCY (MHz)
AV = 12dB
600 700 800 900 1000
Figure 16. HD3 vs. Frequency at AV = 6 dB, AV = 12 dB, and AV = 18 dB,
= 0.9 V p-p
V
OUT
AV = 6dB
AV = 18dB
08458-013
Rev. 0 | Page 9 of 20

ADA4960-1
–
–
–
–
60
THIRD HARMONIC DISTORTION
–65
–70
–75
–80
–85
DISTORTION (dBc)
–90
–95
–100
100 200 300 400 500 600 700 800 900 1000
SECOND HARMONIC DI S TORTIO N
FREQUENCY ( M Hz )
TA = +85°C
T
= +25°C
A
T
= –40°C
A
Figure 17. HD2 and HD3 vs. Frequency at TA = −40°C, +25°C, +85°C,
1.5
= 6 dB, V
A
V
= 0.9 V p-p
OUT
08458-046
70
60
50
40
30
CMRR (dB)
20
10
0
0.01 0.1 1 10
Figure 20. CMRR vs. Frequency, AV = 6 dB, V
FREQUENCY (GHz)
= 0.9 V p-p
OUT
50
08458-017
1.0
0.5
(V)
0
OUT
V
–0.5
–1.0
–1.5
0 2 4 6 8 101214161820
TIME (ns)
Figure 18. Large Signal Pulse Response, AV = 18 dB
30
–40
–50
–60
–70
DISTORTION (dBc)
–80
f = 140MHz
f = 250MHz
f = 500MHz
f = 750MHz
f = 1GHz
–55
–60
–65
–70
DISTORTION (dBc)
–75
–80
–85
100 200 300 400 500
08458-042
FREQUENCY (MHz)
HD2
HD3
600 700 800 900 1000
08458-018
Figure 21. HD2/HD3 vs. Frequency, Single-Ended Input,
A
= 6 dB, V
V
30
–40
–50
–60
–70
DISTORTION (dBc)
–80
= 0.9 V p-p
OUT
f = 140MHz
f = 250MHz
f = 500MHz
f = 750MHz
f = 1GHz
–90
–100
0.5 1.0 1.5 2.0 2.5 3.0
Figure 19. HD2 vs. VOCM, AV = 6 dB, V
VOCM (V)
= 0.9 V p-p,
OUT
f = 140 MHz, f = 250 MHz, f = 500 MHz, f = 750 MHz, f = 1 GHz
08458-016
–90
–100
0.5 1.0 1.5 2.0 2.5 3.0
Figure 22. HD3 vs. VOCM, AV = 6 dB, V
VOCM (V)
= 0.9 V p-p,
OUT
f = 140 MHz, f = 250 MHz, f = 500 MHz, f = 750 MHz, f = 1 GHz
08458-019
Rev. 0 | Page 10 of 20

ADA4960-1
–
–
50
60
–55
–60
–65
–70
–75
DISTORTION (dBc)
–80
–85
–90
0.5 0.6 0.7 0.8 0.9 1.0 1.1 1.2 1.3 1.4 1.5
500MHz
1GHz
V
OUT
250MHz
(V p-p)
Figure 23. HD3 vs. Output Amplitude @ 250 MHz, 500 MHz, 1 GHz,
= 6 dB, V
A
V
4.0
V
V
OUTP
OUTN
3.5
3.0
(V)
2.5
OUT
V
2.0
1.5
1.0
–8 –6–4–202468101214
Figure 24. Output Overdrive, V
= 0.9 V p-p
OUT
TIME
(ns)
vs. Time, VIN = 1 V p-p, AV =12 dB
OUT
–65
–70
–75
–80
DISTORTION (dBc)
–85
–90
–95
0.50.60.70.80.91.01.11.21.31.41.5
08458-043
Figure 25. HD2 vs. V
0.096
0.072
0.048
(V)
OUT
V
0.024
0
–0.024
02468101214
08458-048
VOCM
@ 250 MHz, 500 MHz, and 1 GHz,
OUT
= 6 dB, V
A
V
V
– V
OUTP
Figure 26. Output Overdrive Recovery, V
V
= 1 V p-p, AV =12 dB, VOCM = 2.4 V
IN
(V p-p)
V
OUT
= 0.9 V p-p
OUT
OUTN
TIME (ns)
1GHz
500MHz
250MHz
1%
0.5%
0.5%
vs. Time,
OUT
0.25%
0.25%
08458-044
08458-049
Rev. 0 | Page 11 of 20

ADA4960-1
V
V
V
TEST CIRCUITS
5
SINE WAVE
GENERATOR
BAND-PASS
FILTER
25Ω
25Ω
0.1µF
0.1µF
R
G
VIP
IIP
ADA4960-1
IIN
VIN
ETC1-1-13 ETC1-1-13
VOP
VON
0.1µF
0.1µF
37.5Ω
37.5Ω
25Ω
25Ω
50Ω
SPECTRUM
ANALYZER
8458-022
Figure 27. Distortion Test Circuit
5
PULSE
SOURCE
50Ω
ETC1-1-13
25Ω
25Ω
0.1µF
0.1µF
R
G
VIP
IIP
ADA4960-1
IIN
VIN
VOP
VON
0.1µF
0.1µF
0Ω
0Ω
50Ω
50Ω
OSCILLOSCOPE
8458-023
Figure 28. Time Domain Test Circuit
5
NETWORK
ANALYZER
50Ω
50Ω
50Ω
50Ω
0.1µF
0.1µF
R
G
VIP
IIP
ADA4960-1
IIN
VIN
VOP
VON
0.1µF
0.1µF
0Ω
0Ω
NETWORK
ANALYZER
50Ω
50Ω
8458-024
Figure 29. S-Parameter Test Circuit
Rev. 0 | Page 12 of 20

ADA4960-1
A
CIRCUIT DESCRIPTION
BASIC STRUCTURE
The ADA4960-1 is a low noise, fully differential amplifier/ADC
driver that uses a single 5 V supply at 60 mA. This amplifier has
buffered inputs that isolate the gain-setting resistor (R
the input signals, keeping a constant 10 k differential input
impedance for all gains.
The differential output impedance is 150 Ω. The gain range is
0 dB to 18 dB and is set using a single resistor (R
0.1µF
R
R
R
S
S
2
2
C
S
2
0.1µF
R
S
2
Figure 30. Basic Structure of the ADA4960-1
VIP
IIP
R
G
IIN
VIN
ADA4960-1
G
).
75Ω
75Ω
) from
G
VOP
VON
08458-025
The ADA4960-1 can be ac-coupled or dc-coupled at the inputs
and/or outputs within the specified input and output commonmode range.
The inputs, VIP and VIN, have a common-mode voltage range of
2.25 V to 2.75 V and are internally set at VCC/2. The outputs, VOP
and VON, have a common-mode voltage range of 1.0 V to 2.75 V
that can be set externally using the VOCM pin. The VOCM pin
is internally set to VCC/2 with no external connection.
The input of the device can be configured as single-ended or
differential with similar HD3 distortion results.
Rev. 0 | Page 13 of 20
ADA4960-1
V
V
APPLICATIONS INFORMATION
BASIC CONNECTIONS
The basic connections for operating the ADA4960-1 are shown
in Figure 33. Connect VCC to 5 V and decouple each supply pin
with a low inductance surface-mount ceramic capacitor of 0.1 µF
placed as close to the device as possible.
In addition, decouple the VOCM pin and the VCI pin by using
a 0.1 µF capacitor, whether or not they are used as inputs.
For normal operation, the enable pin (PD) should be tied to VCC.
When the ADA4960-1 is pulled low, it goes into power-down
mode. The VOP and VON outputs are internally biased at VCC/2
with no external source. The output common-mode range can
be adjusted in the range of 1 V to 2.75 V by applying an external
source voltage to the VCOM pin.
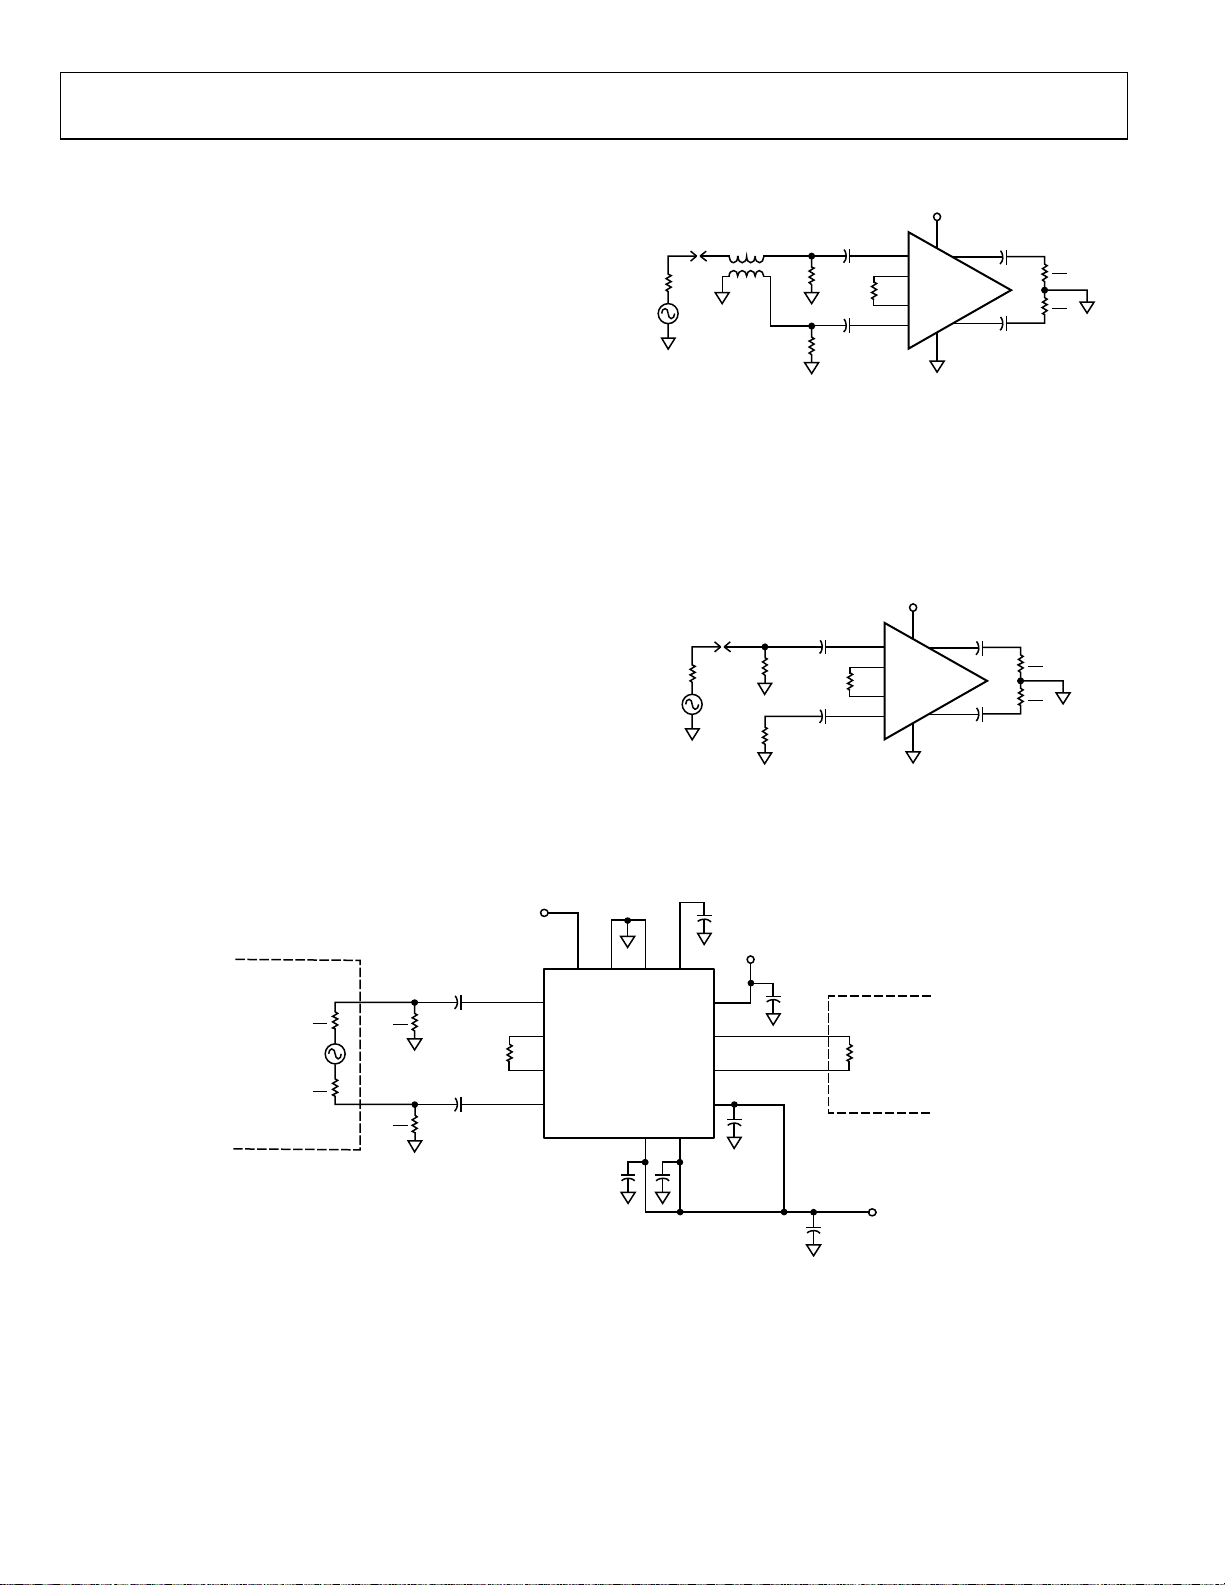
INPUT AND OUTPUT INTERFACING
The ADA4960-1 can be configured as a differential-input-todifferential-output driver, as shown in Figure 31.
The differential broadband input is provided by the ETC1-1-13
balun transformer. The two 25 Ω resistors, R1 and R2, provide
the 50 match to the 50 ac source. The 0.1 µF capacitors,
connected in series with the inputs and outputs, isolate the source
and balanced load from the internal bias. R
resistor. Load R
should equal 100 Ω to provide the expected ac
L
performance (see the Specifications section). Different loads can be
applied with the gain value described by the gain adjust equation
(see the Gain Adjust section).
R
S
BALANCED
SOURCE
AC
2
R
S
2
is the gain-setting
G
V
CC
0.1µF
R
S
2
0.1µF
R
S
2
1
2
R
G
3
4
Figure 33. Basic Connections of the ADA4960-1
16
15
PD
ND
G
VIP
IIP
ADA4960-1
IIN
VIN
NC
NC
6
5
0.1µF 0.1µF
NC = NO CONNECT
5
50Ω
AC
ETC1-1-13
25Ω
25Ω
0.1µF
VIP
0.1µF
IIP
R
G
ADA4960-1
IIN
VIN
R1
R2
VOP
VON
0.1µF
0.1µF
R
L
2
R
L
2
Figure 31. Differential-Input-to-Differential-Output Configuration
The ADA4960-1 can also be configured as a single-ended-inputto-differential-output driver, as shown in Figure 32. R1 provides the
input source match, and R2 balances the input source impedances.
The 0.1 µF capacitors, connected in series with the inputs and
outputs, isolate the source and balanced load from the internal bias.
R
is the gain-setting resistor. RL should equal 100 to provide
G
the expected ac performance (see the Specifications section).
5
50Ω
AC
R1
50Ω
R2
50Ω
0.1µF
0.1µF
R
G
VIP
IIP
ADA4960-1
IIN
VIN
VOP
VON
0.1µF
0.1µF
R
L
2
R
L
2
08458-028
Figure 32. Single-Ended-Input-to-Differential-Output Configuration
0.1µF
V
14
G
VCC
7
ND
13
V
OCM
VCC
VOP
VON
VCC
VCC
8
CC
12
11
10
9
0.1µF
0.1µF
10µF
R
L
BALANCED
LOAD
V
CC
8458-026
08458-030
Rev. 0 | Page 14 of 20

ADA4960-1
V
A
GAIN ADJUST
The gain of the ADA4960-1 is set with a single resistor, RG,
connected across the IIP and IIN pins. Because the output
impedance is 150 Ω, the load affects the gain. The voltage
gain can be calculated for both differential and single-ended
inputs as follows:
⎛
150
⎜
⎜
150
⎝
4.7
=
A
where R
(V/V)
A
Figure 34. A
V
18
16
14
12
10
V
()
35.5
and RG are the load and gain-setting resistors.
L
RL = 500Ω
RL = 200Ω
8
6
4
= 100Ω
R
L
2
0
0 50 100 150 200 250
vs. RG for RL = 100 Ω, RL = 200 Ω, RL = 500 Ω, and RL = 1 kΩ
V
Table 5. AV vs. RG for RL = 100 Ω, RL = 200 Ω, RL = 500 Ω, and
R
= 1 kΩ
L
AV (dB)
RL = 100 Ω RL = 200 Ω RL = 500 Ω RL = 1 kΩ
0 246 370 505 576
6 106 167 237 271
12 35.2 65.7 101 118
18 0 15.2 32.8 41.7
+
+
R
R
L
R
R
= 1kΩ
L
⎞
⎟
⎟
L
⎠
G
(Ω)
R
G
R
G
08458-029
BANDWIDTH EXTENSION
The bandwidth of the ADA4960-1 can be extended for both
differential and single-ended input configurations by connecting
a capacitor, C
shown in Figure 35.
50Ω
C
Figure 36 shows the bandwidth extension for 6 dB and 12 dB gains.
Figure 37 shows the recommended C
(dB)
V
A
(dB)
V
A
, in parallel with the gain-setting resistor, RG, as
S
5
ETC1-1-13
25Ω
25Ω
0.1µF
VIP
0.1µF
R
G
IIP
ADA4960-1
IIN
VIN
R1
C
S
R2
VOP
VON
0.1µF
0.1µF
Figure 35. ADA4960-1 with Bandwidth Extension
values for most gains (dB).
S
14
12
10
8
6
4
2
0
10 100 1k 10k
FREQUENCY (MHz )
CS = 2.2pF
CS = 0.1pF
Figure 36. Bandwidth Extension for 6 dB and 12 dB Gains
14
12
10
8
6
4
2
0
0 0.5 1.0 1.5 2.0 2.5 3.0 3.5 4.0 4.5 5.0
Figure 37. Recommended C
C
(pF)
S
Values for Most Gains
S
R
L
2
R
L
2
08458-031
08458-032
08458-027
Rev. 0 | Page 15 of 20

ADA4960-1
A
V
ADC INTERFACING
The ADA4960-1 is a high speed amplifier with linearity
performance to drive high speed ADCs up to 1 GHz. Several
options are available to the designer to interface with an ADC.
The ADA4960-1 in Figure 38 is a differential input configuration,
using an input balun to provide the differential input signal. The
25 resistors provide the input source match. The ADA4960-1
outputs can be directly connected to the ADC inputs as long as
the ADC input common mode is within the output common-
100Ω
100Ω
output pin is
CM
V
IN+
V
IN–
V
IN+
V
IN–
ADC
ADC
V
CM
V
CM
mode range of the ADA4960-1. The ADC V
connected to the ADA4960-1 VOCM input pin to align the
ADA4960-1 output voltages with the ADC inputs.
A 100 resistor across the outputs of the ADA4960-1 enhances
system bandwidth and distortion performance when the ADA4960-1
is driving an ADC with high input impedance. Lighter load
resistance improves distortion performance and lowers the
overall bandwidth.
5V
50Ω
C
ETC1-1-13
25Ω
25Ω
0.1µF
R
G
0.1µF
VIP
IIP
ADA4960-1
IIN
VIN
VOP
VON
VOCM
Figure 38. Differential Input Configuration Directly Driving the ADC
The ADA4960-1 in Figure 39 is a single-ended input configuration.
The input is matched to the source with 50 resistors. The
ADA4960-1 outputs can be directly connected to the ADC inputs
as long as the ADC input common mode is within the output
common-mode range of the ADA4960-1.
5V
0.1µF
50Ω
AC
50Ω
25Ω
0.1µF
R
G
Figure 39. Single-Ended Input Configuration Directly Driving the ADC
VIP
IIP
ADA4960-1
IIN
VIN
VOP
VON
VOCM
08458-033
08458-034
The signal source can be directly connected to the ADA4960-1
inputs as long as the source dc level is within the common-mode
input range of the ADA4960-1, as shown in Figure 40.
5
VOP
AC
50Ω
VIP
50Ω
V
REF
25Ω
V
REF
V
REF
R
G
IIP
ADA4960-1
IIN
VIN
100Ω
VON
VOCM
V
IN+
ADC
V
IN–
V
CM
Figure 40. Single-Ended Input Configuration, DC-Coupled Inputs and
Outputs
When the ADC input common mode is outside the output
common-mode range of the ADA4960-1, the outputs can be
ac-coupled to provide coupling, as shown in Figure 41.
5V
VOP
VON
0.1µF
100Ω
0.1µF
V
IN+
ADC
V
IN–
50Ω
AC
50Ω
25Ω
0.1µF
0.1µF
R
G
VIP
IIP
ADA4960-1
IIN
VIN
Figure 41. Single-Ended Input Configuration, AC-Coupled to the ADC
LINE DRIVER APPLICATIONS
The user accessible gain adjust and bandwidth extension
features allow configuration of the ADA4960-1 for line driver
and channel equalization applications from dc to 6.5 Gbps.
Because of its extremely low distortion performance and high
linearity, the ADA4960-1 can be deployed in cable and backplane
channels to extend channel length and improve signaling
margin for serial links using receive equalization and transmit
pre-emphasis. The ADA4960-1 unidirectional signal path is
protocol and encoding agnostic, supporting myriad signaling
types such as NRZ and PAM2/4/8/N, coded (8b/10b), uncoded,
and out-of-band (SATA-OOB) data.
08458-050
08458-035
Rev. 0 | Page 16 of 20

ADA4960-1
OVERDRIVE AND RECOVERY
When overdriven, the ADA4960-1 limits its outputs to 3.4 V
typical with no overshoot, as shown in Figure 42. This feature
protects the ADC from transients, eliminating the need for
additional external clamping at the inputs of the ADC.
4.0
V
V
OUTP
OUTN
TIME
(ns)
= 1 V p-p, AV =12 dB
IN
3.5
3.0
(V)
2.5
OUT
V
2.0
1.5
1.0
–8 –6–4–202468101214
Figure 42. Output Overdrive, V
08458-051
Recovery from overdrive is 6.7 ns to 1%, 9.3 ns to 0.5%, and
12.6 ns to 0.25% of the final output voltage, see Figure 43.
0.096
V
– V
OUTP
0.072
0.048
(V)
OUT
V
0.024
0
–0.024
02468101214
VOCM
OUTN
1%
0.5%
0.5%
0.25%
0.25%
TIME (ns)
Figure 43. Output Overdrive Recovery
08458-052
Rev. 0 | Page 17 of 20

ADA4960-1
LAYOUT, GROUNDING, AND BYPASSING
The ADA4960-1 is a high speed device. Realizing its superior
performance requires attention to the details of high speed
printed circuit board (PCB) design.
The first requirement is to use a multilayer PCB with solid ground
and power planes that cover as much of the board area as possible.
Bypass each power supply pin directly to a nearby ground plane, as
close to the device as possible. Use 0.1 µF high frequency ceramic
chip capacitors.
Provide low frequency bulk bypassing, using 10 µF tantalum
capacitors from each supply to ground.
Stray transmission line capacitance in combination with package
parasitics can potentially form a resonant circuit at high frequencies,
resulting in excessive gain peaking or possible oscillation.
Signal routing should be short and direct to avoid such parasitic
effects. Provide symmetrical layout for complementary signals
to maximize balanced performance.
Use radio frequency transmission lines to connect the driver
and receiver to the amplifier.
Minimize stray capacitance at the input/output pins by clearing
the underlying ground and low impedance planes near these pins.
If the driver/receiver is more than one-eighth of the wavelength
from the amplifier, the signal trace widths should be minimal.
This nontransmission line configuration requires the underlying
and adjacent ground and low impedance planes to be cleared
near the signal lines.
The exposed thermal paddle is internally connected to the ground
pin of the amplifier. Solder the paddle to the low impedance
ground plane on the PCB to ensure the specified electrical
performance and to provide thermal relief. To reduce thermal
impedance further, it is recommended that the ground planes
on all layers under the paddle be connected together with vias.
1.5mm
1.2mm
1.2mm
1.5mm
0.3mm DIAMETE R V IAS
Figure 44. Recommended PCB Thermal Attach Pad
08458-036
1.5mm
1.2mm
TOP METAL
GROUND PLANE
POWER PLANE
BOTTOM M E TAL
08458-037
Figure 45. Cross-Section of a 4-Layer PCB Showing Thermal Via Connection to Buried Ground Plane
Rev. 0 | Page 18 of 20

ADA4960-1
OUTLINE DIMENSIONS
PIN 1
INDICATOR
0.80
0.75
0.70
SEATING
PLANE
3.10
3.00 SQ
2.90
0.50
BSC
0.50
0.40
0.30
0.05 MAX
0.02 NOM
0.20 REF
0.30
0.25
0.20
13
12
9
8
BOTTOM VIEWTOP VIEW
COPLANARITY
0.08
1
P
N
I
C
I
N
I
16
EXPOSED
PAD
5
FOR PROPER CONNECTION OF
THE EXPOSED PAD, REFER TO
THE PIN CONFIGURATION AND
FUNCTION DESCRIPTIONS
SECTION OF THIS DATA SHEET.
D
1
1.65
1.50 SQ
1.45
4
0.20 MIN
R
A
O
T
COMPLIANTTOJEDEC STANDARDS MO-229.
091609-A
Figure 46. 16-Lead Lead Frame Chip Scale Package [LFCSP_WQ]
3 mm × 3 mm Body, Very Very Thin Quad
(CP-16-27)
Dimensions shown in millimeters
ORDERING GUIDE
Package
Model1 Temperature Range Package Description
Option
ADA4960-1ACPZ-R2 −40°C to +85°C 16-Lead Lead Frame Chip Scale Package [LFCSP_WQ] CP-16-27 250 H23
ADA4960-1ACPZ-RL −40°C to +85°C 16-Lead Lead Frame Chip Scale Package [LFCSP_WQ] CP-16-27 5,000 H23
ADA4960-1ACPZ-R7 −40°C to +85°C 16-Lead Lead Frame Chip Scale Package [LFCSP_WQ] CP-16-27 1,500 H23
1
Z = RoHS Compliant Part.
Ordering
Quantity
Branding
Rev. 0 | Page 19 of 20

ADA4960-1
NOTES
©2010 Analog Devices, Inc. All rights reserved. Trademarks and
registered trademarks are the property of their respective owners.
D08458-0-4/10(0)
Rev. 0 | Page 20 of 20
 Loading...