

Page 1
Rail-to-Rail Amplifiers
ADA4891-1/ADA4891-2/ADA4891-3/ADA4891-4
Rev. D
rights of third parties that may result from its use. Specifications subject to change without notice. No
Trademarks and registered trademarks are the prop erty of their respective owner s.
Fax: 781.461.3113 ©2010–2012 Analog Devices, Inc. All rights reserved.
08054-026
NC
1
–IN
2
+IN
3
–V
S
4
NC
8
+V
S
7
OUT
6
NC
5
ADA4891-1
NC = NO CONNECT
08054-001
OUT
1
+IN
3
–V
S
2
+V
S
5
–IN
4
ADA4891-1
08054-027
ADA4891-2
OUT1
1
–IN1
2
+IN1
3
–V
S
4
+V
S
8
OUT2
7
–IN2
6
+IN2
5
NC = NO CONNECT
PD1
1
OUT2
14
PD2
2
–IN2
13
PD3
3
+IN2
12
+V
S
4
–V
S
11
+IN1
5
+IN3
10
–IN1
6
–IN3
9
OUT1
7
OUT3
8
08054-073
ADA4891-3
+V
S
+IN2
OUT2
OUT4
+IN4
–V
S
+IN3
OUT3
+IN1
OUT1
1
2
3
4
5
6
7
14
13
12
11
10
9
8
–IN1
–IN2
–IN4
–IN3
08054-074
ADA4891-4
Data Sheet
FEATURES
Qualified for automotive applications (ADA4891-1W,
ADA4891-2W only)
High speed and fast settling
−3 dB bandwidth: 220 MHz (G = +1)
Slew rate: 170 V/µs
Settling time to 0.1%: 28 ns
Video specifications (G = +2, R
0.1 dB gain flatness: 25 MHz
Differential gain error: 0.05%
Differential phase error: 0.25°
Single-supply operation
Wide supply range: 2.7 V to 5.5 V
Output swings to within 50 mV of supply rails
Low distortion: 79 dBc SFDR at 1 MHz
Linear output current: 125 mA at −40 dBc
Low power: 4.4 mA per amplifier
APPLICATIONS
Automotive infotainment systems
Automotive driver assistance systems
Imaging
Consumer video
Active filters
Coaxial cable drivers
Clock buffers
Photodiode preamp
Contact image sensor and buffers
= 150 Ω)
L
Low Cost CMOS, High Speed,
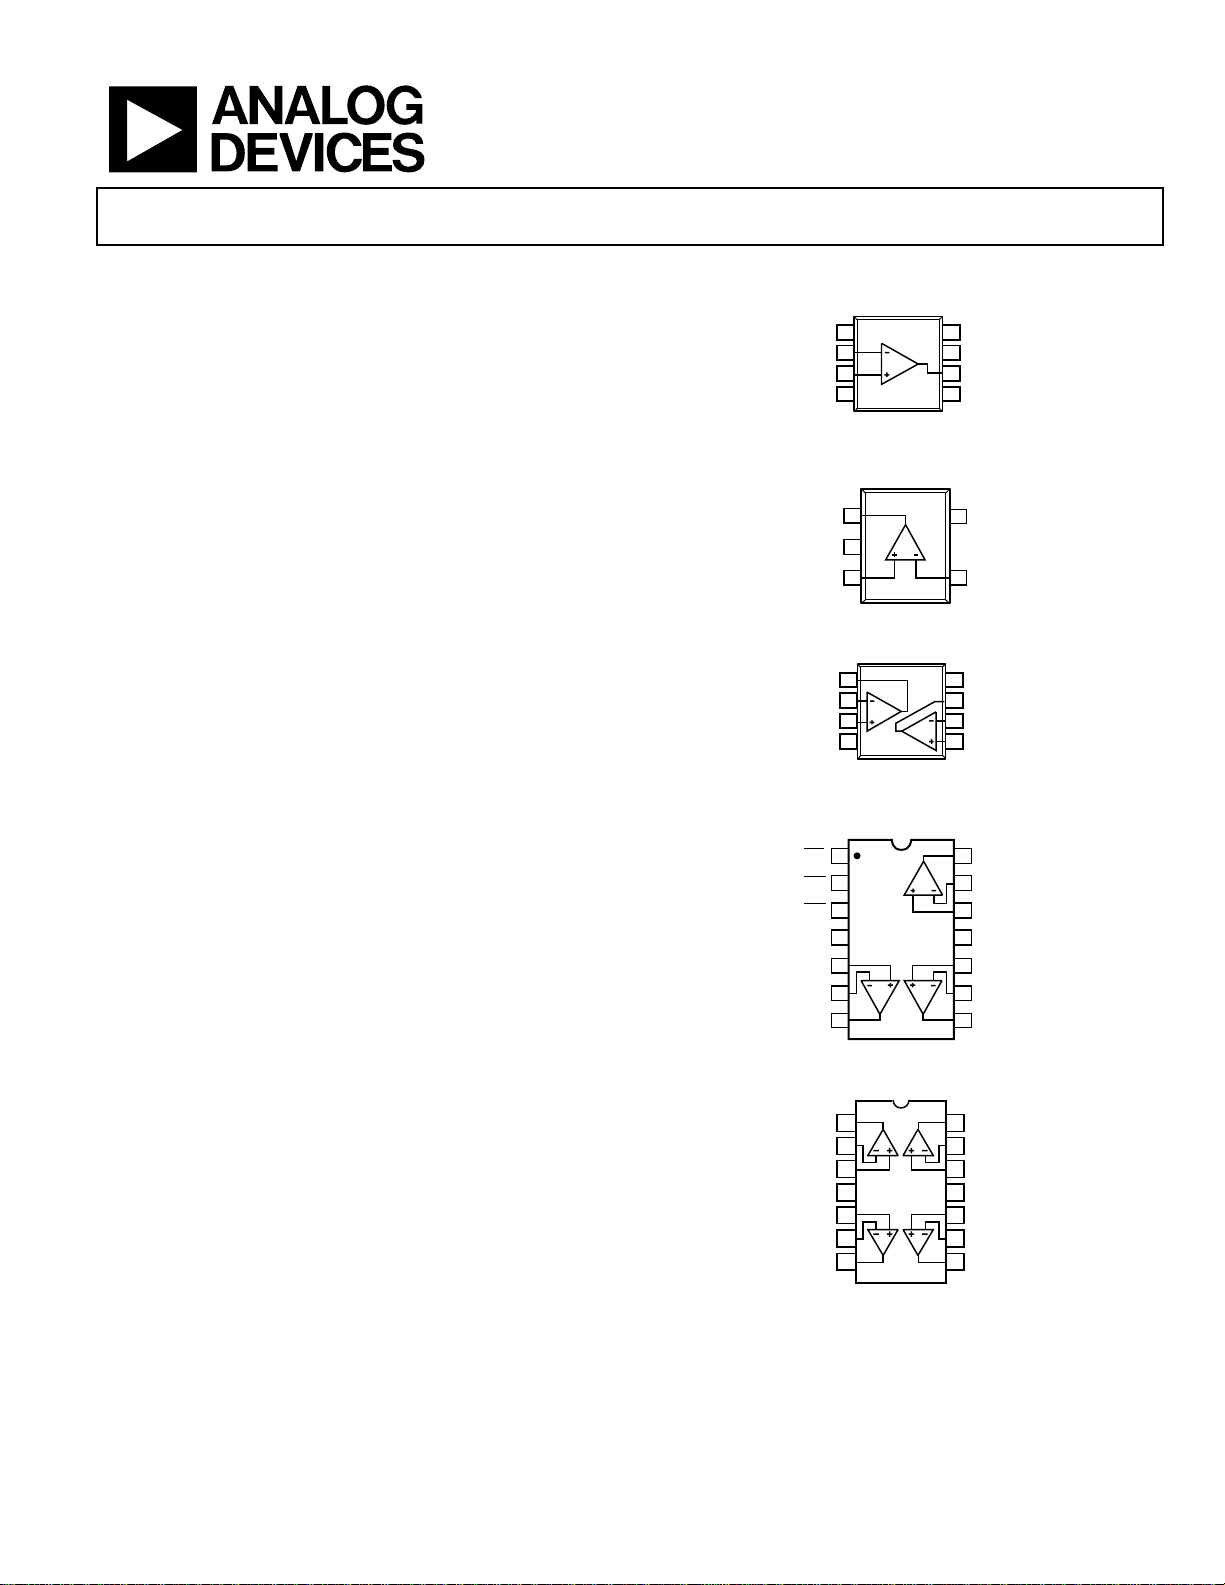
CONNECTION DIAGRAMS
Figure 1. 8-Lead SOIC_N (R-8)
Figure 2. 5-Lead SOT-23 (RJ-5)
Figure 3. 8-Lead SOIC_N (R-8) and 8-Lead MSOP (RM-8)
GENERAL DESCRIPTION
The ADA4891-1 (single), ADA4891-2 (dual), ADA4891-3 (triple),
and ADA4891-4 (quad) are CMOS, high speed amplifiers that
offer high performance at a low cost. The amplifiers feature true
single-supply capability, with an input voltage range that extends
300 mV below the negative rail.
In spite of their low cost, the ADA4891 family provides high
performance and versatility. The rail-to-rail output stage enables
the output to swing to within 50 mV of each rail, enabling maximum dynamic range.
The ADA4891 family of amplifiers is ideal for imaging applications, such as consumer video, CCD buffers, and contact image
sensor and buffers. Low distortion and fast settling time also
make them ideal for active filter applications.
The ADA4891-1/ADA4891-2/ADA4891-3/ADA4891-4 are available in a wide variety of packages. The ADA4891-1 is available
in 8-lead SOIC and 5-lead SOT-23 packages. The ADA4891-2
is available in 8-lead SOIC and 8-lead MSOP packages. The
ADA4891-3 and ADA4891-4 are available in 14-lead SOIC and
Information furnished by Analog Devices is believed to be accurate and reliable. However, no
responsibility is assumed by Analog Devices for its use, nor for any infringements of patents or other
license is granted by implication or otherwise under any patent or patent rights of Analog Devices.
Figure 4. 14-Lead SOIC_N (R-14) and 14-Lead TSSOP (RU-14)
Figure 5. 14-Lead SOIC_N (R-14) and 14-Lead TSSOP (RU-14)
14-lead TSSOP packages. The amplifiers are specified to operate
over the extended temperature range of −40°C to +125°C.
One Technology Way, P.O. Box 9106, Norwood, MA 02062-9106, U.S.A.
Tel: 781.329.4700 www.analog.com
Page 2

ADA4891-1/ADA4891-2/ADA4891-3/ADA4891-4 Data Sheet
TABLE OF CONTENTS
Features .............................................................................................. 1
Applications ....................................................................................... 1
General Description ......................................................................... 1
Connection Diagrams ...................................................................... 1
Revision History ............................................................................... 2
Specifications ..................................................................................... 3
5 V Operation ............................................................................... 3
3 V Operation ............................................................................... 4
Absolute Maximum Ratings ............................................................ 6
Maximum Power Dissipation ..................................................... 6
ESD Caution .................................................................................. 6
Typical Performance Characteristics ............................................. 7
Applications Information .............................................................. 15
Using the ADA4891 ................................................................... 15
Wideband, Noninverting Gain Operation .............................. 15
Wideband, Inverting Gain Operation ..................................... 15
Recommended Values ................................................................ 15
Effect of RF on 0.1 dB Gain Flatness ........................................ 16
Driving Capacitive Loads .......................................................... 17
Terminating Unused Amplifiers .............................................. 18
Disable Feature (ADA4891-3 Only) ........................................ 18
Single-Supply Operation ........................................................... 18
Video Reconstruction Filter ...................................................... 19
Multiplexer .................................................................................. 19
Layout, Grounding, and Bypassing .............................................. 20
Power Supply Bypassing ............................................................ 20
Grounding ................................................................................... 20
Input and Output Capacitance ................................................. 20
Input-to-Output Coupling ........................................................ 20
Leakage Currents ........................................................................ 20
Outline Dimensions ....................................................................... 21
Ordering Guide .......................................................................... 23
Automotive Products ................................................................. 23
REVISION HISTORY
3/12—Rev. C t o R e v. D
Added ADA4891-1W and ADA4891-2W ...................... Universal
Changes to Features Section and Applications Section ............... 1
Changes to Input Offset Voltage, Input Bias Current, and Open-
Loop Gain Parameters, Table 1 ....................................................... 4
Changes to Input Offset Voltage, Input Bias Current, and Open-
Loop Gain Parameters, Table 2 ....................................................... 5
Changes to Ordering Guide .......................................................... 23
Added Automotive Products Section .......................................... 23
9/10—Rev. B t o R e v. C
Changes to Figure 23 and Figure 24 ............................................... 9
7/10—Rev. A to Rev. B
Added ADA4891-3 and ADA4891-4 ............................... Universal
Added 14-Lead SOIC and 14-Lead TSSOP Packages .... Universal
Deleted Figure 4; Renumbered Figures Sequentially ................... 1
Changes to Features Section and General Description Section . 1
Added Figure 4 and Figure 5 ........................................................... 1
Changes to Table 1 ............................................................................ 3
Changes to Table 2 ............................................................................ 4
Changes to Maximum Power Dissipation Section
and Figure 6 ....................................................................................... 6
Added Table 4; Renumbered Tables Sequentially ......................... 6
Deleted Figure 11 ............................................................................... 6
Changes to Typical Performance Characteristics Section ........... 7
Deleted Figure 12 ............................................................................... 7
Changes to Wideband, Noninverting Gain Operation Section,
Wideband, Inverting Gain Operation Section, and Table 5 ..... 15
Added Table 6 ................................................................................. 16
Changes to Figure 52 ...................................................................... 16
Added Figure 53 ............................................................................. 16
Changed Layout of Driving Capacitive Loads Section .............. 17
Added Disable Feature (ADA4891-3 Only) Section
and Single-Supply Operation Section .......................................... 18
Added Multiplexer Section ........................................................... 19
Updated Outline Dimensions ....................................................... 21
Changes to Ordering Guide .......................................................... 23
6/10—Rev. 0 to R e v. A
Changes to Figure 26 ......................................................................... 9
Changes to Figure 33 and Figure 34............................................. 10
Updated Outline Dimensions ....................................................... 18
Changes to Ordering Guide .......................................................... 18
2/10—Revision 0: Initial Version
Rev. D | Page 2 of 24
Page 3

Data Sheet ADA4891-1/ADA4891-2/ADA4891-3/ADA4891-4
Bandwidth for 0.1 dB Gain Flatness
25 MHz
Harmonic Distortion, HD2/HD3
fC = 1 MHz, VO = 2 V p-p, G = +1
−79/−93
dBc
ADA4891-1W/ADA4891-2W only, T
to T
,
66
dB
INPUT CHARACTERISTICS
RL = 150 Ω to 2.5 V
0.08 to 4.90
V
SPECIFICATIONS
5 V OPERATION
TA = 25°C, VS = 5 V, RL = 1 kΩ to 2.5 V, unless otherwise noted. All specifications are for the ADA4891-1, ADA4891-2, ADA4891-3, and
ADA4891-4, unless otherwise noted. For the ADA4891-1 and ADA4891-2, R
unless otherwise noted.
Table 1.
Parameter Test Conditions/Comments Min Typ Max Unit
DYNAMIC PERFORMANCE
−3 dB Small-Signal Bandwidth ADA4891-1/ADA4891-2, G = +1, VO = 0.2 V p-p 240 MHz
ADA4891-3/ADA4891-4, G = +1, VO = 0.2 V p-p 220 MHz
ADA4891-1/ADA4891-2, G = +2, V
= 150 Ω to 2.5 V
R
L
ADA4891-3/ADA4891-4, G = +2, V
R
= 150 Ω to 2.5 V
L
ADA4891-1/ADA4891-2, G = +2, VO = 2 V p-p,
= 150 Ω to 2.5 V, RF = 604 Ω
R
L
ADA4891-3/ADA4891-4, G = +2, V
= 150 Ω to 2.5 V, RF = 374 Ω
R
L
Slew Rate, tR/tF G = +2, VO = 2 V step, 10% to 90% 170/210 V/µs
−3 dB Large-Signal Frequency Response G = +2, VO = 2 V p-p, RL = 150 Ω 40 MHz
Settling Time to 0.1% G = +2, VO = 2 V step 28 ns
NOISE/DISTORTION PERFORMANCE
= 604 Ω; for the ADA4891-3 and ADA4891-4, RF = 453 Ω,
F
= 0.2 V p-p,
O
= 0.2 V p-p,
O
= 2 V p-p,
O
90 MHz
96 MHz
25 MHz
fC = 1 MHz, VO = 2 V p-p, G = −1 −75/−91 dBc
Input Voltage Noise f = 1 MHz 9 nV/√Hz
Differential Gain Error (NTSC) G = +2, RL = 150 Ω to 2.5 V 0.05 %
Differential Phase Error (NTSC) G = +2, RL = 150 Ω to 2.5 V 0.25 Degrees
All-Hostile Crosstalk f = 5 MHz, G = +2, VO = 2 V p-p −80 dB
DC PERFORMANCE
Input Offset Voltage ±2.5 ±10 mV
ADA4891-1W/ADA4891-2W only, T
T
MIN
to T
±3.1 mV
MAX
MIN
to T
±3.1 ±16 mV
MAX
Offset Drift 6 µV/°C
Input Bias Current −50 +2 +50 pA
ADA4891-1W/ADA4891-2W only, T
MIN
to T
−50 +50 nA
MAX
Open-Loop Gain RL = 1 kΩ to 2.5 V 77 83 dB
MIN
MAX
RL = 1 kΩ to 2.5 V
RL = 150 Ω to 2.5 V 71 dB
Input Resistance 5 GΩ
Input Capacitance 3.2 pF
Input Common-Mode Voltage Range
−V
+V
S
S
− 0.3 to
− 0.8
V
Common-Mode Rejection Ratio (CMRR) VCM = 0 V to 3.0 V 88 dB
OUTPUT CHARACTERISTICS
Output Voltage Swing RL = 1 kΩ to 2.5 V 0.01 to 4.98 V
Output Current 1% THD with 1 MHz, VO = 2 V p-p 125 mA
Short-Circuit Current
Sourcing 205 mA
Sinking 307 mA
Rev. D | Page 3 of 24
Page 4

ADA4891-1/ADA4891-2/ADA4891-3/ADA4891-4 Data Sheet
POWER SUPPLY
Negative PSRR
+VS = 5 V, −VS = −0.25 V to 0 V
63 dB
DYNAMIC PERFORMANCE
Slew Rate, tR/tF
G = +2, VO = 2 V step, 10% to 90%
140/230
V/µs
NOISE/DISTORTION PERFORMANCE
Parameter Test Conditions/Comments Min Typ Max Unit
POWER-DOWN PINS (PD1, PD2, PD3)
Threshold Voltage, VTH 2.4 V
Bias Current Part enabled 65 nA
Part powered down −22 µA
Turn-On Time Part enabled, output rises to 90% of final value 166 ns
Turn-Off Time
Operating Range 2.7 5.5 V
Quiescent Current per Amplifier 4.4 mA
Supply Current When Powered Down ADA4891-3 only 0.8 mA
Power Supply Rejection Ratio (PSRR)
Positive PSRR +VS = 5 V to 5.25 V, −VS = 0 V 65 dB
OPERATING TEMPERATURE RANGE −40 +125 °C
3 V OPERATION
TA = 25°C, VS = 3 V, RL = 1 kΩ to 1. 5 V, unless otherwise noted. All specifications are for the ADA4891-1, ADA4891-2, ADA4891-3, and
ADA4891-4, unless otherwise noted. For the ADA4891-1 and ADA4891-2, R
unless otherwise noted.
ADA4891-3 only
Part powered down, output falls to 10% of final
49 ns
value
= 604 Ω; for the ADA4891-3 and ADA4891-4, RF = 453 Ω,
F
Table 2.
Parameter Test Conditions/Comments Min Typ Max Unit
−3 dB Small-Signal Bandwidth ADA4891-1/ADA4891-2, G = +1, VO = 0.2 V p-p 190 MHz
ADA4891-3/ADA4891-4, G = +1, VO = 0.2 V p-p 175 MHz
Bandwidth for 0.1 dB Gain Flatness
ADA4891-1/ADA4891-2, G = +2, V
R
= 150 Ω to 1.5 V
L
ADA4891-3/ADA4891-4, G = +2, V
= 150 Ω to 1.5 V
R
L
ADA4891-1/ADA4891-2, G = +2, V
= 150 Ω to 1.5 V, RF = 604 Ω
R
L
ADA4891-3/ADA4891-4, G = +2, V
R
= 150 Ω to 1.5 V, RF = 374 Ω
L
= 0.2 V p-p,
O
= 0.2 V p-p,
O
= 2 V p-p,
O
= 2 V p-p,
O
75 MHz
80 MHz
18 MHz
18 MHz
−3 dB Large-Signal Frequency Response G = +2, VO = 2 V p-p, RL = 150 Ω 40 MHz
Settling Time to 0.1% G = +2, VO = 2 V step 30 ns
Harmonic Distortion, HD2/HD3 fC = 1 MHz, VO = 2 V p-p, G = −1 −70/−89 dBc
Input Voltage Noise f = 1 MHz 9 nV/√Hz
Differential Gain Error (NTSC) G = +2, RL = 150 Ω to 0.5 V, +VS = 2 V, −VS = −1 V 0.23 %
Differential Phase Error (NTSC) G = +2, RL = 150 Ω to 0.5 V, +VS = 2 V, −VS = −1 V 0.77 Degrees
All-Hostile Crosstalk f = 5 MHz, G = +2 −80 dB
DC PERFORMANCE
Input Offset Voltage ±2.5 ±10 mV
ADA4891-1W/ADA4891-2W only, T
T
MIN
to T
±3.1 mV
MAX
MIN
to T
±3.1 ±16 mV
MAX
Offset Drift 6 µV/°C
Input Bias Current −50 +2 +50 pA
ADA4891-1W/ADA4891-2W only, T
MIN
to T
−50 +50 nA
MAX
Rev. D | Page 4 of 24
Page 5

Data Sheet ADA4891-1/ADA4891-2/ADA4891-3/ADA4891-4
Input Common-Mode Voltage Range
−VS − 0.3 to
V
OUTPUT CHARACTERISTICS
Threshold Voltage, VTH
1.3 V
Supply Current When Powered Down
ADA4891-3 only
0.73 mA
Parameter Test Conditions/Comments Min Typ Max Unit
Open-Loop Gain RL = 1 kΩ to 1.5 V 72 76 dB
ADA4891-1W/ADA4891-2W only, T
= 1 kΩ to 1.5 V
R
L
MIN
to T
MAX
RL = 150 Ω to 1.5 V 65 dB
INPUT CHARACTERISTICS
Input Resistance 5 GΩ
Input Capacitance 3.2 pF
Common-Mode Rejection Ratio (CMRR) VCM = 0 V to 1.5 V 87 dB
Output Voltage Swing RL = 1 kΩ to 1.5 V 0.01 to 2.98 V
RL = 150 Ω to 1.5 V 0.07 to 2.87 V
Output Current 1% THD with 1 MHz, VO = 2 V p-p 37 mA
Short-Circuit Current
Sourcing 80 mA
Sinking 163 mA
POWER-DOWN PINS (PD1, PD2, PD3)
ADA4891-3 only
Bias Current Part enabled 48 nA
Part powered down −13 µA
Turn-On Time Part enabled, output rises to 90% of final value 185 ns
Turn-Off Time
Part powered down, output falls to 10% of final
value
POWER SUPPLY
Operating Range 2.7 5.5 V
Quiescent Current per Amplifier 3.5 mA
60 dB
,
+VS − 0.8
58 ns
Power Supply Rejection Ratio (PSRR)
Positive PSRR +VS = 3 V to 3.15 V, −VS = 0 V 76 dB
Negative PSRR +VS = 3 V, −VS = −0.15 V to 0 V 72 dB
OPERATING TEMPERATURE RANGE −40 +125 °C
Rev. D | Page 5 of 24
Page 6
ADA4891-1/ADA4891-2/ADA4891-3/ADA4891-4 Data Sheet
Input Voltage (Common Mode)
−VS − 0.5 V to +VS
0
0.5
1.0
2.0
1.5
–55 –35 –15 5 25 45 65 85 105 125
AMBIENT TEMPERATURE (°C)
MAXIMUM POWER DISSIPATION (W)
14-LEAD TSS OP
8-LEAD SOIC_N
14-LEAD SOIC_N
5-LEAD SOT-23
8-LEAD MSOP
T
J
= 150°C
08054-002
8-Lead MSOP
133
°C/W
ABSOLUTE MAXIMUM RATINGS
Table 3.
Parameter Rating
Supply Voltage 6 V
Differential Input Voltage ±VS
Storage Temperature Range −65°C to +125°C
Operating Temperature Range −40°C to +125°C
Lead Temperature (Soldering, 10 sec) 300°C
Stresses above those listed under Absolute Maximum Ratings
may cause permanent damage to the device. This is a stress
rating only; functional operation of the device at these or any
other conditions above those indicated in the operational
section of this specification is not implied. Exposure to absolute
maximum rating conditions for extended periods may affect
device reliability.
MAXIMUM POWER DISSIPATION
The maximum power that can be safely dissipated by the
ADA4891-1/ADA4891-2/ADA4891-3/ADA4891-4 is limited
by the associated rise in junction temperature. The maximum
safe junction temperature for plastic encapsulated devices is
determined by the glass transition temperature of the plastic,
approximately 150°C. Temporarily exceeding this limit can
cause a shift in parametric performance due to a change in the
stresses exerted on the die by the package. Exceeding a junction
temperature of 175°C for an extended period can result in
device failure.
The still-air thermal properties of the package (θ
temperature (T
(P
) can be used to determine the junction temperature of the die.
D
), and the total power dissipated in the package
A
The junction temperature can be calculated as
= TA + (PD × θJA) (1)
T
J
The power dissipated in the package (P
) is the sum of the
D
quiescent power dissipation and the power dissipated in the
package due to the load drive for all outputs. It can be calculated by
P
= (VT × IS) + (VS − V
D
OUT
) × (V
OUT/RL
where:
is the total supply rail.
V
T
I
is the quiescent current.
S
is the positive supply rail.
V
S
V
is the output of the amplifier.
OUT
is the output load of the amplifier.
R
L
JA
) (2)
), the ambient
To ensure proper operation, it is necessary to observe the maximum power derating curves shown in Figure 6. These curves
are derived by setting T
= 150°C in Equation 1. Figure 6 shows
J
the maximum safe power dissipation in the package vs. the
ambient temperature on a JEDEC standard 4-layer board.
Figure 6. Maximum Power Dissipation vs. Ambient Temperature
Tabl e 4 lists the thermal resistance (θJA) for each ADA4891-1/
ADA4891-2/ADA4891-3/ADA4891-4 package.
Table 4.
Package Type θJA Unit
5-Lead SOT-23 146 °C/W
8-Lead SOIC_N 115 °C/W
14-Lead SOIC_N 162 °C/W
14-Lead TSSOP 108 °C/W
ESD CAUTION
Rev. D | Page 6 of 24
Page 7
Data Sheet ADA4891-1/ADA4891-2/ADA4891-3/ADA4891-4
–10
–9
–8
–7
–6
–5
–4
–3
–2
–1
0
1
2
3
4
0.1 1 10 100 1k
NORMALIZED CLOSED-LOOP GAIN (dB)
FREQUENCY (MHz)
VS = 5V
V
OUT
= 200mV p-p
R
F
= 604Ω
R
L
= 1kΩ
G = +10
G = +5
G = –1
OR +2
G = +1
08054-028
–15
–12
–9
–6
–3
0
3
6
0.1 1 10 100 1k
CLOSED-LOOP GAIN (dB)
FREQUENCY (MHz)
G = +1
V
OUT
= 200mV p-p
RL = 1kΩ
VS = 2.7V
VS = 5V
08054-029
V
S
= 3V
–4
–3
–2
–1
0
1
2
3
4
5
0.1 1 10 100 1k
CLOSED-LOOP GAIN (dB)
FREQUENCY (MHz)
VS = 5V
G = +1
V
OUT
= 200mV p-p
RL = 1kΩ
08054-030
+125°C
+85°C
+25°C
0°C
–40°C
5
4
3
2
1
0
–1
–2
–3
–4
–5
–6
–7
–8
–9
–10
0.1 1 10 100 1k
FREQUENCY (MHz)
NORMALIZED CLOSED-LOOP GAIN (dB)
08054-076
G = +10
G = +5
G = +1
G = –1 OR +2
VS = 5V
V
OUT
= 200mV p-p
R
F
= 453Ω
R
L
= 1kΩ
6
3
0
–3
–6
–9
–12
–15
0.1 1 10 100 1k
FREQUENCY (MHz)
CLOSED-LOOP GAIN (dB)
08054-077
V
S
= 2.7V
G = +1
V
OUT
= 200mV p-p
R
L
= 1kΩ
V
S
= 3V
V
S
= 5V
–4
–3
–2
–1
0
1
2
3
4
5
0.1 1 10 100 1k
FREQUENCY (MHz)
CLOSED-LOOP GAIN (dB)
08054-078
VS = 5V
G = +1
V
OUT
= 200mV p-p
RL = 1kΩ
+125°C
+85°C
+25°C
0°C
–40°C
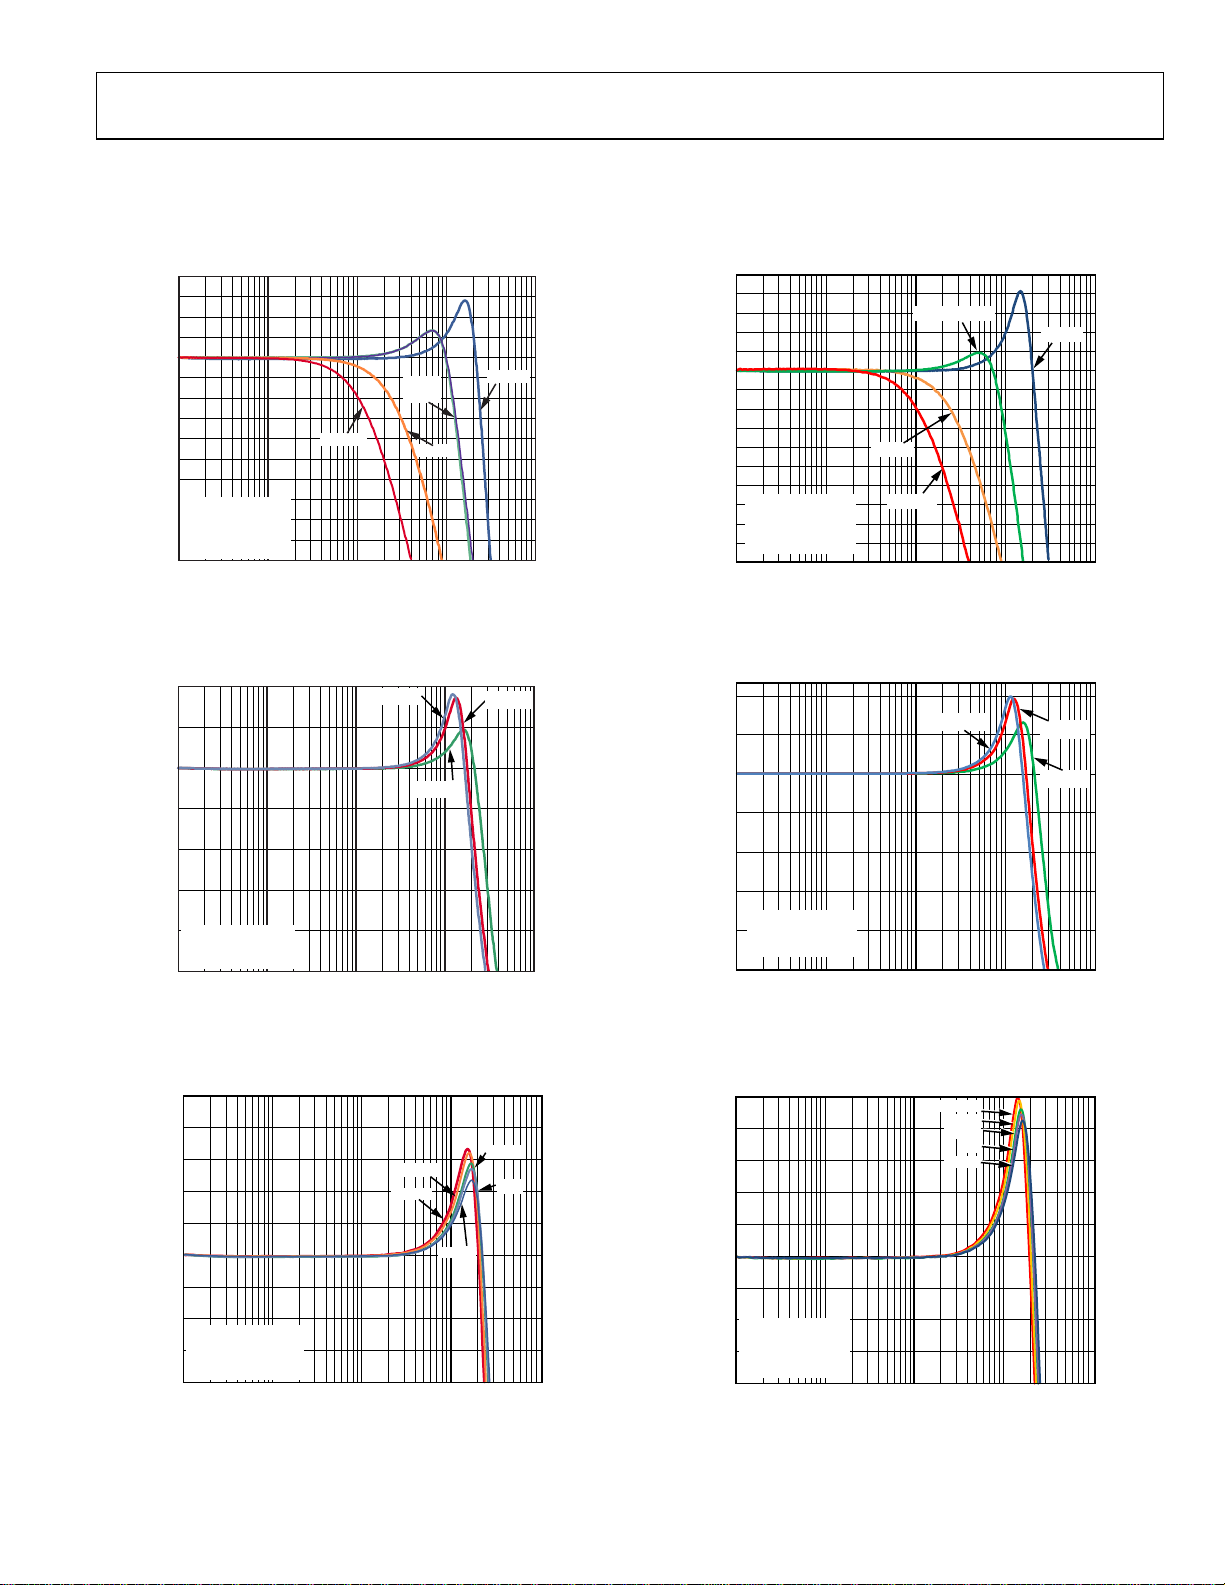
TYPICAL PERFORMANCE CHARACTERISTICS
Unless otherwise noted, all plots are characterized for the ADA4891-1, ADA4891-2, ADA4891-3, and ADA4891-4. For the ADA4891-1
and ADA4891-2, the typical R
Figure 7. Small-Signal Frequency Response vs. Gain, VS = 5 V,
ADA4891-1/ADA4891-2
value is 604 Ω. For the ADA4891-3 and ADA4891-4, the typical RF value is 453 Ω.
F
Figure 10. Small-Signal Frequency Response vs. Gain, V
ADA4891-3/ADA4891-4
= 5 V,
S
Figure 8. Small-Signal Frequency Response vs. Supply Voltage,
ADA4891-1/ADA4891-2
Figure 9. Small-Signal Frequency Response vs. Temperature, VS = 5 V,
ADA4891-1/ADA4891-2
Figure 11. Small-Signal Frequency Response vs. Supply Voltage,
ADA4891-3/ADA4891-4
Figure 12. Small-Signal Frequency Response vs. Temperature, V
= 5 V,
S
ADA4891-3/ADA4891-4
Rev. D | Page 7 of 24
Page 8
ADA4891-1/ADA4891-2/ADA4891-3/ADA4891-4 Data Sheet
CLOSED-LOOP GAIN (dB)
FREQUENCY (MHz)
–6
–5
–4
–3
–2
–1
0
3
4
5
6
1
2
7
0.1 1 10 100 1k
+125°C
+25°C
0°C
–40°C
VS = 3V
G = +1
V
OUT
= 200mV p-p
RL = 1kΩ
08054-031
+85°C
–0.5
–0.4
–0.3
–0.2
–0.1
0
0.1
10.1 10 100
FREQUENCY (MHz)
NORMALIZED CLOSED-LOOP GAIN (dB)
G = +2
R
F
= 604Ω
RL = 150Ω
V
S
= 3V
V
OUT
= 2V p-p
VS = 5V
V
OUT
= 1.4V p-p
V
S
= 3V
V
OUT
= 1.4V p-p
08054-019
VS = 5V
V
OUT
= 2V p-p
–10
–9
–8
–7
–6
–5
–4
–3
–2
–1
0
1
0.1 1 10 100 1k
NORMALIZED CLOSED-LOOP GAIN (dB)
FREQUENCY (MHz)
VS = 5V
R
L
= 150Ω
V
OUT
= 2V p-p
G = +1
R
F
= 0Ω
G = –1
RF = 604Ω
G = +2
R
F
= 604Ω
G = +5
R
F
= 604Ω
08054-036
CLOSED-LOOP GAIN (dB)
FREQUENCY (MHz)
–6
–5
–4
–3
–2
–1
0
3
4
5
6
1
2
7
0.1 1 10 100 1k
VS = 3V
G = +1
V
OUT
= 200mV p-p
R
L
= 1kΩ
08054-079
+125°C
+85°C
+25°C
0°C
–40°C
0.1
0
–0.1
–0.2
–0.3
–0.4
–0.5
0.1 1 10 100
FREQUENCY (MHz)
NORMALIZED CLOSED-LOOP GAIN (dB)
08054-080
VS = 3V
V
OUT
= 1.4V p-p
V
S
= 3V
V
OUT
= 2V p-p
V
S
= 5V
V
OUT
= 2V p-p
G = +2
R
F
= 374Ω
R
L
= 150Ω
V
S
= 5V
V
OUT
= 1.4V p-p
1
0
–1
–2
–3
–4
–5
–6
–7
–8
–9
–10
0.1 1 10 100 1k
FREQUENCY (MHz)
NORMALIZED CLOSED-LOOP GAIN (dB)
08054-081
VS = 5V
R
L
= 150Ω
V
OUT
= 2V p-p
G = +1
R
F
= 0Ω
G = –1
R
F
= 453Ω
G = +5
R
F
= 453Ω
G = +2
R
F
= 453Ω
Figure 13. Small-Signal Frequency Response vs. Temperature, V
ADA4891-1/ADA4891-2
Figure 14. 0.1 dB Gain Flatness vs. Supply Voltage, G = +2,
ADA4891-1/ADA4891-2
= 3 V,
S
Figure 16. Small-Signal Frequency Response vs. Temperature, V
= 3 V,
S
ADA4891-3/ADA4891-4
Figure 17. 0.1 dB Gain Flatness vs. Supply Voltage, G = +2,
ADA4891-3/ADA4891-4
Figure 15. Large-Signal Frequency Response vs. Gain, VS = 5 V,
ADA4891-1/ADA4891-2
Figure 18. Large-Signal Frequency Response vs. Gain, V
= 5 V,
S
ADA4891-3/ADA4891-4
Rev. D | Page 8 of 24
Page 9

Data Sheet ADA4891-1/ADA4891-2/ADA4891-3/ADA4891-4
–
–
–
–
1
0
–1
–2
–3
–4
–5
–6
–7
VS = 3V
–8
R
= 604Ω
F
NORMALIZE D CLOSED-LOOP GAIN ( dB)
R
= 150Ω
–9
L
–10
0.1 1 10 100 1k
G = +2
V
= 2V p-p
OUT
G = +5
V
= 2V p-p
OUT
FREQUENCY (MHz)
G = –1
V
OUT
G = +1
V
OUT
Figure 19. Large-Signal Frequency Response vs. Gain, V
ADA4891-1/ADA4891-2
40
VS = 5V
R
= 1kΩ
L
V
= 2V p-p
OUT
G = +1
SECOND HARMONIC
G = +1
THIRD HARMONIC
0.1 1 10
FREQUE NCY (MHz)
DISTORTION (dBc)
–50
–60
–70
–80
–90
–100
–110
–120
G = +2
SECOND HARMONIC
G = +2
THIRD HARMONIC
Figure 20. Harmonic Distortion (HD2, HD3) vs. Frequency, VS = 5 V
= 2V p-p
= 1V p-p
= 3 V,
S
1
0
–1
–2
–3
–4
–5
–6
–7
VS = 3V
–8
R
F
NORMALIZE D CLOSED-LOOP GAIN ( dB)
R
–9
L
–10
0.1 1 10 100 1k
08054-037
= 453Ω
= 150Ω
G = +2
V
= 2V p-p
OUT
G = +5
V
OUT
FREQUENCY (MHz)
= 2V p-p
Figure 22. Large-Signal Frequency Response vs. Gain, V
G = –1
V
OUT
G = +1
V
OUT
= 2V p-p
= 1V p-p
= 3 V,
S
08054-082
ADA4891-3/ADA4891-4
30
VS = 3V
= 1kΩ
R
L
= 2V p-p
V
OUT
–40
–50
G = +1
SECOND HARMO NIC
–60
–70
DISTORTION (d Bc)
–80
–90
0.1 1 10
08054-038
G = +2
THIRD HARMO NIC
G = +2
SECOND HARMONIC
FREQUENC Y (MHz)
G = +1
THIRD HARMO NIC
+V
= +1.9V
S
IN
50Ω
–V
S
1kΩ
= –1.1V
G = +1 CONFIGURAT ION
OUT
08054-039
Figure 23. Harmonic Distortion (HD2, HD3) vs. Frequency, VS = 3 V
40
VS = 5V
R
= 604Ω
F
–50
R
= 1kΩ
L
f
= 1MHz
C
–60
–70
–80
–90
DISTORT ION (dBc)
–100
–110
–120
0 0.5 1.0 1.5 2.0 2.5 3.0 3.5 4.0 4.5 5.0
G = –1
SECOND HARMONIC
G = +1
THIRD HARMONIC
OUTPUT VOLTAGE (V p-p)
G = +1
SECOND HARMONIC
G = –1
THIRD HARMONIC
Figure 21. Harmonic Distortion (HD2, HD3) vs. Output Voltage, VS = 5 V
8054-040
–50
–60
–70
40
= +1.9V
+V
S
IN
50Ω
–V
= –1.1V
S
G = +1
CONFIGURATION
SECOND HARMO NIC
OUT
1kΩ
G = +1
–80
DISTORTION (dBc)
–90
–100
–110
–120
0
SECOND HARMO NIC
G = –1
G = –1
THIRD HARMO NIC
G = +1
THIRD HARMO NIC
VS = 3V
f
= 1MHz
C
0.51.01.52.02.53.0
OUTPUT VOLTAGE (V p-p)
Figure 24. Harmonic Distortion (HD2, HD3) vs. Output Voltage, VS = 3 V
08054-041
Rev. D | Page 9 of 24
Page 10

ADA4891-1/ADA4891-2/ADA4891-3/ADA4891-4 Data Sheet
–
1k
–50
40
G = +2
R
= 604Ω
F
R
= 150Ω
L
f
= 1MHz
C
VS = 3V
SECOND HARMONIC
VS = 3V
THIRD HARMONIC
–60
–70
–80
DISTORT ION (dBc)
–90
–100
00.51.0
VS = 5V
SECOND HARMONIC
1.5 2.0 2.5 3.0 3.5 4.0 4.5 5. 0
OUTPUT VOLTAGE (V p-p)
VS = 5V
THIRD HARMONIC
Figure 25. Harmonic Distortion (HD2, HD3) vs. Output Voltage, G = +2
90
80
70
60
50
40
30
20
OPEN-LOOP GAIN (dB)
10
0
–10
0.001 0.01 0.1 1 10 100 1k
PHASE
GAIN
FREQUE NCY (MHz)
VS = 5V
R
= 1kΩ
L
0
–18
–36
–54
–72
–90
–108
–126
–144
–162
–180
Figure 26. Open-Loop Gain and Phase vs. Frequency
08054-042
PHASE (Degrees)
100
10
VOLTAGE NOISE (nV/ Hz)
VS = 5V
G = +1
1
10 100
1k 10k 100k 1M 10M
FREQUENCY ( Hz)
08054-045
Figure 28. Input Voltage Noise vs. Frequency
0.06
0.04
0.02
0
–0.02
DIFFERENTIAL
DIFFERENTIAL
08054-043
VS = 5V, G = +2
–0.04
GAIN ERROR (%)
PHASE ERROR (Degrees)
= 604Ω, RL = 150Ω
R
F
–0.06
1ST2ND3RD4TH5TH6TH7TH8TH9TH10
0.3
0.2
0.1
0
–0.1
VS = 5V, G = +2
–0.2
= 604Ω, RL = 150Ω
R
F
–0.3
1ST2ND3RD4TH5TH6TH7TH8TH9TH10
MODULATING RAMP LEVEL (IRE)
TH
TH
08054-060
Figure 29. Differential Gain and Phase Errors
7
6
5
4
3
2
1
0
–1
VS = 5V
–2
G = +2
NORMALIZE D CLOSED-LOOP GAI N (dB)
R
= 150Ω
L
–3
V
= 200mV p-p
OUT
–4
0.1 1 10 100 1k
CL = 47pF
CL = 22pF
CL = 10pF
CL = 0pF
FREQUENCY (MHz)
Figure 27. Small-Signal Frequency Response vs. C
ADA4891-1/ADA4891-2
08054-044
,
L
7
6
5
4
3
2
1
0
–1
VS = 5V
–2
G = +2
NORMALIZE D CLOSED-LOOP GAI N (dB)
= 150Ω
R
–3
L
= 200mV p-p
V
OUT
–4
0.1 1 10 100 1k
CL = 47pF
CL = 22pF
CL = 10pF
CL = 0pF
FREQUENCY (MHz)
Figure 30. Small-Signal Frequency Response vs. C
ADA4891-3/ADA4891-4
08054-083
,
L
Rev. D | Page 10 of 24
Page 11

Data Sheet ADA4891-1/ADA4891-2/ADA4891-3/ADA4891-4
0.01
0.1
1
10
100
0.01 0.1 1 10 100
FREQUENCY (MHz)
V
S
= 5V
G = +1
OUTPUT IMPEDANCE (Ω)
08054-046
OUTPUT VOLTAGE (mV)
100
0
–100
G = +1
V
OUT
= 200mV p-p
RL = 1kΩ
V
S
= 3V
08054-048
VS = 5V
50mV/DIV 5ns/DIV
OUTPUT VOLTAGE (V)
1
0
–1
V
S
= 5V
G = +1
V
OUT
= 2V p-p
RL = 150Ω
RL = 1kΩ
08054-049
0.5V/DIV
5ns/DIV
100k
10k
1k
100
10
1
0.01 0.1 1 10 100
OUTPUT IMPEDANCE (Ω)
FREQUENCY (MHz)
08054-089
VS = 5V
G = +1
1.5
1.0
0.5
0
–0.5
–1.0
–1.5
10 20 30 40 50 60 70 80 90
TIME (ns)
OUTPUT VOLTAGE (V)
08054-047
V
S
= 5V
R
L
= 1kΩ
V
S
= 5V
R
L
= 150Ω
V
S
= 3V
R
L
= 150Ω
V
S
= 3V
RL = 1kΩ
G = +2
V
OUT
= 2V p-p
0.5
0
–0.5
OUTPUT VOLTAGE (V)
R
L
= 150Ω
RL = 1kΩ
VS = 3V
G = +1
V
OUT
= 1V p-p
08054-050
0.5V/DIV
5ns/DIV
Figure 31. Closed-Loop Output Impedance vs. Frequency, Part Enabled
Figure 32. Small-Signal Step Response, G = +1
Figure 34. Closed-Loop Output Impedance vs. Frequency, Part Disabled
(ADA4891-3 Only)
Figure 35. Large-Signal Step Response, G = +2
Figure 33. Large-Signal Step Response, V
= 5 V, G = +1
S
Figure 36. Large-Signal Step Response, V
= 3 V, G = +1
S
Rev. D | Page 11 of 24
Page 12

ADA4891-1/ADA4891-2/ADA4891-3/ADA4891-4 Data Sheet
A
0.30
0.20
0.10
VS=5V
G=+2
= 150Ω
R
L
V
OUT
=2Vp-p
200
190
180
VS = 5V
G = +2
= 150Ω
R
L
FALLING EDGE
0
SETTLING (%)
–0.10
–0.20
–0.30
02530
35 40 45
TIME (ns)
Figure 37. Short-Term Settling Time to 0.1%
3
INPUT
2
OUTPUT
1
AMPLITUDE ( V)
0
–1
Figure 38. Input Overdrive Recovery from Positive Rail
5ns/DIV1V/DIV
= ±2.5V
V
S
G = +1
R
= 1kΩ
L
TE (V/µs)
170
160
SLEW R
150
140
08054-061
1.0 1.5 2.0 2.5 3.0 3.5 4.0 4.5 5.0
RISING EDGE
OUTPUT STEP (V)
08054-051
Figure 40. Slew Rate vs. Output Step
1
VS = ±2.5V
G = +1
= 1kΩ
R
L
0
–1
AMPLITUDE (V)
–2
08054-071
–3
1V/DIV 5ns/DIV
INPUT
OUTPUT
08054-063
Figure 41. Input Overdrive Recovery from Negative Rail
3
OUTPUT
2
1
0
AMPLITUDE (V)
–1
–2
1V/DIV 5ns/DIV
–3
INPUT
Figure 39. Output Overdrive Recovery from Positive Rail
VS = ±2.5V
G = –2
= 1kΩ
R
L
08054-070
Rev. D | Page 12 of 24
3
INPUT
2
1
0
AMPLITUDE (V)
–1
–2
OUTPUT
1V/DIV 5ns/DIV
–3
Figure 42. Output Overdrive Recovery from Negative Rail
VS = ±2.5V
G = –2
R
= 1kΩ
L
08054-052
Page 13

Data Sheet ADA4891-1/ADA4891-2/ADA4891-3/ADA4891-4
–10
–20
–30
–90
–80
–70
–60
–50
–40
0.01 0.1 1 10 100
CMRR (dB)
FREQUENCY (MHz)
08054-090
V
S
= 5V
–80
–70
–60
–50
–40
–30
–20
–10
0.01 0.1 1 10 100
PSRR (dB)
FREQUENCY (MHz)
+PSRR
–PSRR
Vs = 5V
G = +1
08054-054
08054-072
–100
–90
–80
–70
–60
–50
–40
–30
–20
–10
0
0.1 1 10 100 1k
CROSSTALK (dB)
FREQUENCY (MHz)
Vs = 5V
G = +2
R
L
= 1 kΩ
V
OUT
= 2V p-p
0
–10
–20
–30
–40
–50
–60
–70
–80
–90
–100
0.1 1 10 100
1k
FREQUENCY (MHz)
ISOLATION (dB)
08054-084
TSSOP
SOIC
V
S
= 5V
G = +2
R
L
= 150Ω
0
0.1
0.2
0.3
0.4
0.5
0.6
0.7
0.8
0.9
1.0
0 10 20 30 40 50 60 70 80 90 100
OUTPUT SATURATION VOLTAGE (V)
V
OH
, +125°C
V
OH
, +25°C
V
OH
, –40°C
V
OL
, +125°C
V
OL
, +25°C
V
OL
, –40°C
I
LOAD
(mA)
V
S
= 5V
G = –2
R
F
= 604Ω
08054-056
3.0
3.5
4.0
4.5
5.0
5.5
6.0
–40 –20 0 20 40 60 80 100 120
QUIESCENT SUPPLY CURRENT (mA)
V
S
= 5V
TEMPERATURE (ºC)
08054-057
Figure 43. CMRR vs. Frequency
Figure 44. PSRR vs. Frequency
Figure 46. Forward Isolation vs. Frequency (ADA4891-3 Only)
Figure 47. Output Saturation Voltage vs. Load Current and Temperature
Figure 45. All-Hostile Crosstalk (Output-to-Output) vs. Frequency
Figure 48. Supply Current per Amplifier vs. Temperature
Rev. D | Page 13 of 24
Page 14

ADA4891-1/ADA4891-2/ADA4891-3/ADA4891-4 Data Sheet
3.0
3.2
3.4
3.6
3.8
4.0
4.2
4.4
2.7 3.0 3.3 3.6 3.9 4.2 4.5 4.8
QUIESCENT SUPPLY CURRENT (mA)
SUPPLY VOLTAGE (V)
08054-058
Figure 49. Supply Current per Amplifier vs. Supply Voltage
Rev. D | Page 14 of 24
Page 15

Data Sheet ADA4891-1/ADA4891-2/ADA4891-3/ADA4891-4
08054-023
ADA4891
R
F
R
G
R
T
50Ω
SOURCE
R
L
+V
S
–V
S
10µF
0.1µF
V
I
V
O
10µF
0.1µF
08054-024
ADA4891
R
F
R
T
R
G
50Ω
SOURCE
R
L
+V
S
–V
S
V
I
V
O
10µF
0.1µF
10µF
0.1µF
+10
604
67.1
12.7
71
72
0
APPLICATIONS INFORMATION
USING THE ADA4891
Understanding the subtleties of the ADA4891 family of amplifiers
provides insight into how to extract the peak performance from
the device. The following sections describe the effect of gain,
component values, and parasitics on the performance of the
ADA4891. The wideband, noninverting gain configuration of
the ADA4891 is shown in Figure 50; the wideband, inverting
gain configuration of the ADA4891 is shown in Figure 51.
WIDEBAND, NONINVERTING GAIN OPERATION
WIDEBAND, INVERTING GAIN OPERATION
Figure 50. Noninverting Gain Configuration
In Figure 50, RF and RG denote the feedback and gain resistors,
respectively. Together, R
amplifier. The value of R
more information, see the Effect of R
section). Typical R
ADA4891-1/ADA4891-2. Typical R
and RG determine the noise gain of the
F
defines the 0.1 dB bandwidth (for
F
on 0.1 dB Gain Flatness
F
values range from 549 Ω to 698 Ω for the
F
values range from 301 Ω
F
to 453 Ω for the ADA4891-3/ADA4891-4.
In a controlled impedance signal path, R
is used as the input
T
termination resistor designed to match the input source impedance. Note that R
is not required for normal operation. RT is
T
generally set to match the input source impedance.
Figure 51. Inverting Gain Configuration
Figure 51 shows the inverting gain configuration. For the
inverting gain configuration, set the parallel combination of
R
and RG to match the input source impedance.
T
Note that a bias current cancellation resistor is not required in
the noninverting input of the amplifier because the input bias
current of the ADA4891 is very low (less than 2 pA). Therefore,
the dc errors caused by the bias current are negligible.
For both noninverting and inverting gain configurations, it is
often useful to increase the R
output. Increasing the R
value to decrease the load on the
F
value improves harmonic distortion at
F
the expense of reducing the 0.1 dB bandwidth of the amplifier.
This effect is discussed further in the Effect of R
on 0.1 dB Gain
F
Flatness section.
RECOMMENDED VALUES
Tabl e 5 and Tabl e 6 provide a quick reference for various configurations and show the effect of gain on the −3 dB small-signal
bandwidth, slew rate, and peaking of the ADA4891-1/ADA4891-2/
ADA4891-3/ADA4891-4. Note that as the gain increases, the
small-signal bandwidth decreases, as is expected from the gain
bandwidth product relationship. In addition, the phase margin
improves with higher gains, and the amplifier becomes more
stable. As a result, the peaking in the frequency response is
reduced (see Figure 7 and Figure 10).
Table 5. Recommended Component Values and Effect of Gain on ADA4891-1/ADA4891-2 Performance (R
= 1 kΩ)
L
Feedback Network Values −3 dB Small-Signal Bandwidth (MHz) Slew Rate (V/µs)
= 200 mV p-p tR tF
−1 604 604 118 188 192 1.3
+1 0 Open 240 154 263 2.6
+2 604 604 120 170 210 1.4
OUT
+5 604 151 32.5 149 154 0
Rev. D | Page 15 of 24
Peaking (dB) Gain RF (Ω) RG (Ω) V
Page 16

ADA4891-1/ADA4891-2/ADA4891-3/ADA4891-4 Data Sheet
–0.4
–0.3
–0.2
–0.1
0
0.1
0.2
10.1 10 100
FREQUENCY (MHz)
NORMALIZED CLOSED-LOOP GAIN (dB)
VS = 5V
G = +2
V
OUT
= 2V p-p
R
L
= 150Ω
RG = RF = 604Ω
RG = R
F
= 549Ω
RG = RF = 649Ω
RG = RF = 698Ω
08054-022
–0.4
–0.5
–0.3
–0.2
–0.1
0
0.1
0.2
0.3
10.1 10 100
FREQUENCY (MHz)
NORMALIZED CLOSED-LOOP GAIN (dB)
08054-085
V
S
= 5V
G = +2
V
OUT
= 2V p-p
R
L
= 150Ω
R
G
= R
F
= 453Ω
R
G
= R
F
= 402Ω
R
G
= R
F
= 357Ω
R
G
= R
F
= 301Ω
Table 6. Recommended Component Values and Effect of Gain on ADA4891-3/ADA4891-4 Performance (RL = 1 kΩ)
Feedback Network Values −3 dB Small-Signal Bandwidth (MHz) Slew Rate (V/µs)
Gain RF (Ω) RG (Ω) V
−1 453 453 97 186 194 0.9
+1 0 Open 220 151 262 4.1
+2 453 453 97 181 223 0.9
+5 453 90.6 31 112 120 0
+10 453 45.3 13 68 67 0
EFFECT OF RF ON 0.1 dB GAIN FLATNESS
Gain flatness is an important specification in video applications.
It represents the maximum allowable deviation in the signal
amplitude within the pass band. Tests have revealed that the
human eye is unable to distinguish brightness variations of
less than 1%, which translates into a 0.1 dB signal drop within
the pass band or, put simply, 0.1 dB gain flatness.
The PCB layout configuration and bond pads of the chip often
contribute to stray capacitance. The stray capacitance at the
inverting input forms a pole with the feedback and gain resistors.
This additional pole adds phase shift and reduces phase margin
in the closed-loop phase response, causing instability in the
amplifier and peaking in the frequency response.
Figure 52 and Figure 53 show the effect of using various values
for Feedback Resistor R
Figure 52 shows the effect for the ADA4891-1/ADA4891-2.
Figure 53 show the effect for the ADA4891-3/ADA4891-4.
Note that a larger R
additional pole formed by R
shifts down in frequency and interacts significantly with the
internal poles of the amplifier.
Figure 52. 0.1 dB Gain Flatness, Noninverting Gain Configuration,
on the 0.1 dB gain flatness of the parts.
F
value causes more peaking because the
F
and the input stray capacitance
F
ADA4891-1/ADA4891-2
= 200 mV p-p tR tF
OUT
Figure 53. 0.1 dB Gain Flatness, Noninverting Gain Configuration,
To obtain the desired 0.1 dB bandwidth, adjust the feedback
resistor, R
, as shown in Figure 52 and Figure 53. If RF cannot
F
be adjusted, a small capacitor can be placed in parallel with R
to reduce peaking.
The feedback capacitor, C
resistor, which cancels out the pole formed by the input stray
capacitance and the gain and feedback resistors. For a first pass
in determining the C
× CS = RF × CF
R
G
F
where:
R
is the gain resistor.
G
C
is the input stray capacitance.
S
is the feedback resistor.
R
F
C
is the feedback capacitor.
F
Using this equation, the original closed-loop frequency response of
the amplifier is restored, as if there is no stray input capacitance.
Most often, however, the value of C
Figure 54 shows the effect of using various values for the
feedback capacitor to reduce peaking. In this case, the
ADA4891-1/ ADA4891-2 are used for demonstration purposes
and R
= RG = 604 Ω. The input stray capacitance, together with
F
the board parasitics, is approximately 2 pF.
Rev. D | Page 16 of 24
Peaking (dB)
ADA4891-3/ADA4891-4
, forms a zero with the feedback
F
value, use the following equation:
is determined empirically.
F
F
Page 17

Data Sheet ADA4891-1/ADA4891-2/ADA4891-3/ADA4891-4
08054-025
–0.3
–0.2
–0.1
0
0.1
0.2
0.1 1 10 100
NORMALIZED CLOSED-LOOP GAIN (dB)
FREQUENCY (MHz)
C
F
= 3.3pF
C
F
= 0pF
C
F
= 1pF
V
S
= 5V
G = +2
R
F
= 604Ω
R
L
= 150Ω
V
OUT
= 2V p-p
–10
–8
–6
–4
–2
0
2
4
6
8
0.1 1 10 100
MAGNITUDE ( dB)
FREQUENCY (MHz)
VS = 5V
V
OUT
= 200mV p-p
G = +1
R
L
= 1kΩ
CL = 6.8pF
08054-032
OUTPUT VOLTAGE (mV)
50ns/DIV50mV/DIV
VS = 5V
G = +1
R
L
= 1kΩ
C
L
= 6.8pF
0
100
–100
08054-034
MAGNITUDE ( dB)
–10
–8
–6
–4
–2
0
2
4
6
8
0.1 1 10 100
FREQUENCY (MHz)
VS = 5V
V
OUT
= 200mV p-p
G = +1
R
L
= 1kΩ
CL = 6.8pF
RS = 0Ω
R
S
= 100Ω
50Ω
R
L
R
S
C
L
OUT
V
IN
200mV
STEP
08054-033
VS = 5V
G = +1
R
L
= 1kΩ
C
L
= 6.8pF
RS = 100Ω
08054-035
50ns/DIV50mV/DIV
OUTPUT VOLTAGE (mV)
0
100
–100
These four methods minimize the output capacitive loading effect.
• Reducing the output resistive load. This pushes the pole
further away and, therefore, improves the phase margin.
• Increasing the phase margin with higher noise gains. As
the closed-loop gain is increased, the larger phase margin
allows for large capacitive loads with less peaking.
Figure 54. 0.1 dB Gain Flatness vs. C
ADA4891-1/ADA4891-2
, VS = 5 V,
F
• Adding a parallel capacitor (C
output. This adds a zero in the closed-loop frequency
response, which tends to cancel out the pole formed by the
capacitive load and the output impedance of the amplifier.
See the Effect of R
on 0.1 dB Gain Flatness section for
F
more information.
• Placing a small value resistor (R
to isolate the load capacitor from the output stage of the
amplifier.
) with RF, from −IN to the
F
) in series with the output
S
DRIVING CAPACITIVE LOADS
A highly capacitive load reacts with the output impedance of
the amplifiers, causing a loss of phase margin and subsequent
peaking or even oscillation. The ADA4891-1/ADA4891-2 are
used to demonstrate this effect (see Figure 55 and Figure 56).
Figure 55. Closed-Loop Frequency Response, C
ADA4891-1/ADA4891-2
= 6.8 pF,
L
Figure 57 shows the effect of using a snub resistor (R
) on reducing
S
the peaking in the worst-case frequency response (gain of +1).
Using R
= 100 Ω reduces the peaking by 3 dB, with the trade-off
S
that the closed-loop gain is reduced by 0.9 dB due to attenuation
at the output. R
can be adjusted from 0 Ω to 100 Ω to maintain
S
an acceptable level of peaking and closed-loop gain, as shown in
Figure 57.
Figure 57. Closed-Loop Frequency Response with Snub Resistor, C
= 6.8 pF
L
Figure 58 shows that the transient response is also much improved
by the snub resistor (R
= 100 Ω) compared to that of Figure 56.
S
Figure 56. 200 mV Step Response, C
ADA4891-1/ADA4891-2
= 6.8 pF,
L
Rev. D | Page 17 of 24
Figure 58. 200 mV Step Response, C
= 6.8 pF, RS = 100 Ω
L
Page 18

ADA4891-1/ADA4891-2/ADA4891-3/ADA4891-4 Data Sheet
08054-064
–V
S
+V
S
ADA4891
08054-065
2.5kΩ
2.5kΩ
+V
S
ADA4891
>VTH or floating
Enabled
08054-086
C2
1µF
R2
50kΩ
R4
50kΩ
R3
100kΩ
C1
22µF
R1
50Ω
C6
22µF
R
L
150Ω
R
G
453Ω
R
F
453Ω
C5
22µF
ADA4891-3
+5V
V
OUT
V
IN
–V
S
C3
10µF
C4
0.01µF
+5V
TERMINATING UNUSED AMPLIFIERS
Terminating unused amplifiers in a multiamplifier package is
an important step in ensuring proper operation of the functional
amplifier. Unterminated amplifiers can oscillate and draw
excessive power. The recommended procedure for terminating
unused amplifiers is to connect any unused amplifiers in a
unity-gain configuration and to connect the noninverting input
to midsupply voltage. With symmetrical bipolar power supplies,
this means connecting the noninverting input to ground, as
shown in Figure 59.
Figure 59. Terminating Unused Amplifier with
Symmetrical Bipolar Power Supplies
In single power supply applications, a synthetic midsupply
source must be created. This can be accomplished with a simple
resistive voltage divider. Figure 60 shows the proper connection
for terminating an unused amplifier in a single-supply
configuration.
SINGLE-SUPPLY OPERATION
The ADA4891 can also be operated from a single power supply.
Figure 61 shows the ADA4891-3 configured as a single 5 V
supply video driver.
• The input signal is ac-coupled into the amplifier via
Capacitor C1.
• Resistor R2 and Resistor R4 establish the input midsupply
reference for the amplifier.
• Capacitor C5 prevents constant current from being drawn
through the gain set resistor (R
at dc to provide unity gain to the input midsupply voltage,
thereby establishing the output voltage at midsupply.
• Capacitor C6 is the output coupling capacitor.
The large-signal frequency response obtained with singlesupply operation is identical to the bipolar supply operation
(Figure 18 shows the large-signal frequency response).
Four pairs of low frequency poles are formed by R2/2 and C2,
R3 and C1, R
and C5, and RL and C6. With this configuration,
G
the −3 dB cutoff frequency at low frequency is 12 Hz. The
values of C1, C2, C5, and C6 can be adjusted to change the low
frequency −3 dB cutoff point to suit individual design needs.
For more information about single-supply operation of op amps,
see the Analog Dialogue article “Avoiding Op Amp Instability
Problems in Single-Supply Applications” (Vol u me 35, Number 2)
at www.analog.com.
) and enables the ADA4891-3
G
DISABLE FEATURE (ADA4891-3 ONLY)
The ADA4891-3 includes a power-down feature that can be
used to save power when an amplifier is not in use. When an
amplifier is powered down, its output goes to a high impedance
state. The output impedance decreases as frequency increases;
this effect can be observed in Figure 34. With the power-down
function, a forward isolation of −40 dB can be achieved at
50 MHz. Figure 46 shows the forward isolation vs. frequency
data. The power-down feature is asserted by pulling the
PD2
Tabl e 7 summarizes the operation of the power-down feature.
Table 7. Disable Function
Power-Down Pin Connection (
<VTH Disabled
Figure 60. Terminating Unused Amplifier with Single Power Supply
PD3
, or
pi n low.
PDx
)
Amplifier Status
PD1
,
Rev. D | Page 18 of 24
Figure 61. Single-Supply Video Driver Schematic
Page 19

Data Sheet ADA4891-1/ADA4891-2/ADA4891-3/ADA4891-4
R2
47Ω
V
IN
R3
125Ω
R6
6.8Ω
+5V
R7
68.1Ω
R1
C1
51pF
C3
15pF
C4
1nF
R4
1kΩ
R5
1kΩ
R8
75Ω
V
OUT
C2
51pF
08054-062
–39
–36
–33
–30
–27
–24
–21
–18
–15
–12
–9
–6
–3
0
0.03 0.1 1 10 100
MAGNITUDE ( dB)
FREQUENCY (MHz)
08054-059
49.9Ω
453Ω
+2.5V
–2.5V
+2.5V
–2.5V
49.9Ω
49.9Ω
49.9Ω
1V p-p
3MHz
2V p-p
1MHz
V
OUT
SELECT
HCO4
453Ω
453Ω
10µF
0.1µF
10µF
0.1µF
49.9Ω
453Ω
10µF
0.1µF
10µF
0.1µF
08054-087
ADA4891-3
ADA4891-3
1µs/DIV
1V/DIV
1µs/DIV5V/DIV
SELECT
OUTPUT
08054-088
VIDEO RECONSTRUCTION FILTER
A common application for active filters is at the output of video
digital-to-analog converters (DACs)/encoders. The filter, or more
appropriately, the video reconstruction filter, is used at the output
of a video DAC/encoder to eliminate the multiple images that
are created during the sampling process within the DAC. For
portable video applications, the ADA4891 is an ideal choice due
to its lower power requirements and high performance.
For active filters, a good rule of thumb is that the −3 dB bandwidth of the amplifiers be at least 10 times higher than the corner
frequency of the filter. This ensures that no initial roll-off is
introduced by the amplifier and that the pass band is flat until
the cutoff frequency.
An example of a 15 MHz, 3-pole, Sallen-Ke y, l ow -pass video
reconstruction filter is shown in Figure 62. This circuit features
a gain of +2, a 0.1 dB bandwidth of 7.3 MHz, and over 17 dB
attenuation at 29.7 MHz (see Figure 63). The filter has three
poles: two poles are active, with a third passive pole (R6 and C4)
placed at the output. C3 improves the filter roll-off. R6, R7, and
R8 make up the video load of 150 Ω. Components R6, C4, R7,
R8, and the input termination of the network analyzer form a
6 dB attenuator; therefore, the reference level is roughly 0 dB,
as shown in Figure 63.
MULTIPLEXER
The ADA4891-3 has a disable pin used to power down the
amplifier to save power or to create a mux circuit. If two or
more ADA4891-3 outputs are connected together and only one
output is enabled, then only the signal of the enabled amplifier
appears at the output. This configuration is used to select from
various input signal sources. Additionally, the same input signal
is applied to different gain stages, or differently tuned filters, to
make a gain-step amplifier or a selectable frequency amplifier.
Figure 64 shows a schematic of two ADA4891-3 devices used
to create a mux that selects between two inputs. One input is a
1 V p-p, 3 MHz sine wave; the other input is a 2 V p-p, 1 MHz
sine wave.
Figure 62. 15 MHz Video Reconstruction Filter Schematic
Figure 63. Video Reconstruction Filter Frequency Performance
Figure 64. Two-to-One Multiplexer Using Two ADA4861-3 Devices
The select signal and the output waveforms for this circuit are
shown in Figure 65.
Figure 65. ADA4861-3 Mux Output
Rev. D | Page 19 of 24
Page 20

ADA4891-1/ADA4891-2/ADA4891-3/ADA4891-4 Data Sheet
LAYOUT, GROUNDING, AND BYPASSING
POWER SUPPLY BYPASSING
Power supply pins are additional op amp inputs, and care must
be taken so that a noise-free, stable dc voltage is applied. The
purpose of bypass capacitors is to create a low impedance path
from the supply to ground over a range of frequencies, thereby
shunting or filtering the majority of the noise to ground. Bypassing
is also critical for stability, frequency response, distortion, and
PSRR performance.
If traces are used between components and the package, chip
capacitors of 0.1 μF (X7R or NPO) are critical and should be
placed as close as possible to the amplifier package. The 0508
case size for such a capacitor is recommended because it offers
low series inductance and excellent high frequency performance.
Larger chip capacitors, such as 0.1 μF capacitors, can be shared
among a few closely spaced active components in the same
signal path. A 10 μF tantalum capacitor is less critical for high
frequency bypassing, but it provides additional bypassing for
lower frequencies.
GROUNDING
When possible, ground and power planes should be used. Ground
and power planes reduce the resistance and inductance of the
power supply feeds and ground returns. If multiple planes are
used, they should be stitched together with multiple vias. The
returns for the input, output terminations, bypass capacitors,
and R
should all be kept as close to the ADA4891 as possible.
G
Ground vias should be placed at the side or at the very end of
the component mounting pads to provide a solid ground return.
The output load ground and the bypass capacitor grounds should
be returned to a common point on the ground plane to minimize
parasitic inductance and to help improve distortion performance.
INPUT-TO-OUTPUT COUPLING
To minimize capacitive coupling between the inputs and outputs
and to avoid any positive feedback, the input and output signal
traces should not be parallel. In addition, the input traces should
not be close to each other. A minimum of 7 mils between the
two inputs is recommended.
LEAKAGE CURRENTS
In extremely low input bias current amplifier applications, stray
leakage current paths must be kept to a minimum. Any voltage
differential between the amplifier inputs and nearby traces sets
up a leakage path through the PCB. Consider a 1 V signal and
100 GΩ to ground present at the input of the amplifier. The
resultant leakage current is 10 pA; this is 5× the typical input
bias current of the amplifier. Poor PCB layout, contamination,
and the board material can create large leakage currents. Common
contaminants on boards are skin oils, moisture, solder flux, and
cleaning agents. Therefore, it is imperative that the board be
thoroughly cleaned and that the board surface be free of
contaminants to take full advantage of the low input bias
currents of the ADA4891.
To significantly reduce leakage paths, a guard ring/shield should
be used around the inputs. The guard ring circles the input pins
and is driven to the same potential as the input signal, thereby
reducing the potential difference between pins. For the guard ring
to be completely effective, it must be driven by a relatively low
impedance source and should completely surround the input
leads on all sides, above and below, using a multilayer board
(see Figure 66).
GUARD RING
INPUT AND OUTPUT CAPACITANCE
Parasitic capacitance can cause peaking and instability and,
therefore, should be minimized to ensure stable operation.
High speed amplifiers are sensitive to parasitic capacitance between
the inputs and ground. A few picofarads of capacitance reduce
the input impedance at high frequencies, in turn increasing the
gain of the amplifier and causing peaking of the frequency
response or even oscillations, if severe enough. It is recommended
that the external passive components that are connected to the
input pins be placed as close as possible to the inputs to avoid
parasitic capacitance.
In addition, the ground and power planes under the pins of
the ADA4891 should be cleared of copper to prevent parasitic
capacitance between the input and output pins to ground. This
is because a single mounting pad on a SOIC footprint can add
as much as 0.2 pF of capacitance to ground if the ground or
power plane is not cleared under the ADA4891 pins. In fact, the
ground and power planes should be kept at a distance of at least
0.05 mm from the input pins on all layers of the board.
Rev. D | Page 20 of 24
GUARD RING
INVERTING
Figure 66. Guard Ring Configurations
NONINVERTING
The 5-lead SOT-23 package for the ADA4891-1 presents a
challenge in keeping the leakage paths to a minimum. The
pin spacing is very tight, so extra care must be used when
constructing the guard ring (see Figure 67 for the recommended guard ring construction).
OUT
ADA4891-1
–V
S
+IN
+V
S
–IN
INVERTING
Figure 67. Guard Ring Layout, 5-Lead SOT-23
OUT
ADA4891-1
–V
S
+IN
NONINVERTI NG
+V
S
–IN
8054-067
08054-068
Page 21

Data Sheet ADA4891-1/ADA4891-2/ADA4891-3/ADA4891-4
CONTROLLING DIMENSIONS ARE IN MILLIMETERS; INCH DIMENSIONS
(IN PARENTHESES)ARE ROUNDED-OFF MILLIMETER EQUIVALENTS FOR
REFERENCE ONLYAND ARE NOT APPROPRIATE FOR USE IN DESIGN.
COMPLIANT TO JEDEC STANDARDS MS-012-AA
012407-A
0.25 (0.0098)
0.17 (0.0067)
1.27 (0.0500)
0.40 (0.0157)
0.50 (0.0196)
0.25 (0.0099)
45°
8°
0°
1.75 (0.0688)
1.35 (0.0532)
SEATING
PLANE
0.25 (0.0098)
0.10 (0.0040)
4
1
8 5
5.00(0.1968)
4.80(0.1890)
4.00 (0.1574)
3.80 (0.1497)
1.27 (0.0500)
BSC
6.20 (0.2441)
5.80 (0.2284)
0.51 (0.0201)
0.31 (0.0122)
COPLANARITY
0.10
COMPLIANT TO JEDEC STANDARDS MO-178-AA
10°
5°
0°
SEATING
PLANE
1.90
BSC
0.95 BSC
0.60
BSC
5
1 2 3
4
3.00
2.90
2.80
3.00
2.80
2.60
1.70
1.60
1.50
1.30
1.15
0.90
0.15 MAX
0.05 MIN
1.45 MAX
0.95 MIN
0.20 MAX
0.08 MIN
0.50 MAX
0.35 MIN
0.55
0.45
0.35
11-01-2010-A
OUTLINE DIMENSIONS
Figure 68. 8-Lead Standard Small Outline Package [SOIC_N]
Narrow Body
(R-8)
Dimensions shown in millimeters and (inches)
Figure 69. 5-Lead Small Outline Transistor Package [SOT-23]
(RJ-5)
Dimensions shown in millimeters
Rev. D | Page 21 of 24
Page 22

ADA4891-1/ADA4891-2/ADA4891-3/ADA4891-4 Data Sheet
COMPLIANT TO JEDEC STANDARDS MO-187-AA
6°
0°
0.80
0.55
0.40
4
8
1
5
0.65 BSC
0.40
0.25
1.10 MAX
3.20
3.00
2.80
COPLANARITY
0.10
0.23
0.09
3.20
3.00
2.80
5.15
4.90
4.65
PIN 1
IDENTIFIER
15° MAX
0.95
0.85
0.75
0.15
0.05
10-07-2009-B
CONTROLLING DIMENSIONSARE IN MILLIMETERS; INCH DIM E NS IONS
(IN PARENTHESES)ARE ROUNDED-OFF MILLIMETER EQUIVALENTS FOR
REFERENCE ON LY AND ARE NOT APPROPRIATE FOR USE IN DESIGN.
COMPLIANT TO JE DE C S TANDARDS MS-012-AB
060606-A
14
8
7
1
6.20 (0.2441)
5.80 (0.2283)
4.00 (0.1575)
3.80 (0.1496)
8.75 (0.3445)
8.55 (0.3366)
1.27 (0.0500)
BSC
SEATING
PLANE
0.25 (0.0098)
0.10 (0.0039)
0.51 (0.0201)
0.31 (0.0122)
1.75 (0.0689)
1.35 (0.0531)
0.50 (0.0197)
0.25 (0.0098)
1.27 (0.0500)
0.40 (0.0157)
0.25 (0.0098)
0.17 (0.0067)
COPLANARITY
0.10
8°
0°
45°
COMPLIANT TO JEDEC STANDARDS M O-153-AB-1
061908-A
8°
0°
4.50
4.40
4.30
14
8
7
1
6.40
BSC
PIN 1
5.10
5.00
4.90
0.65 BSC
0.15
0.05
0.30
0.19
1.20
MAX
1.05
1.00
0.80
0.20
0.09
0.75
0.60
0.45
COPLANARITY
0.10
SEATING
PLANE
Figure 70. 8-Lead Mini Small Outline Package [MSOP]
(RM-8)
Dimensions shown in millimeters
Figure 71. 14-Lead Standard Small Outline Package [SOIC_N]
Narrow Body
(R-14)
Dimensions shown in millimeters and (inches)
Figure 72. 14-Lead Thin Shrink Small Outline Package [TSSOP]
(RU-14)
Dimensions shown in millimeters
Rev. D | Page 22 of 24
Page 23

Data Sheet ADA4891-1/ADA4891-2/ADA4891-3/ADA4891-4
Model
Temperature Range
Package Description
Package Option
Branding
ADA4891-1ARZ-RL
−40°C to +125°C
8-Lead SOIC_N, 13” Tape and Reel
R-8
ADA4891-3ARZ-RL
−40°C to +125°C
14-Lead SOIC_N, 13” Tape and Reel
R-14
ADA4891-3AR-EBZ
Evaluation Board for 14-Lead SOIC_N
ORDERING GUIDE
1, 2
ADA4891-1ARZ −40°C to +125°C 8-Lead SOIC_N R-8
ADA4891-1ARZ-R7 −40°C to +125°C 8-Lead SOIC_N, 7” Tape and Reel R-8
ADA4891-1ARJZ-R7 −40°C to +125°C 5-Lead SOT-23, 7” Tape and Reel RJ-5 H1W
ADA4891-1ARJZ-RL −40°C to +125°C 5-Lead SOT-23, 13” Tape and Reel RJ-5 H1W
ADA4891-1WARJZ-R7 −40°C to +125°C 5-Lead SOT-23, 13” Tape and Reel RJ-5 H2S
ADA4891-2ARZ −40°C to +125°C 8-Lead SOIC_N R-8
ADA4891-2ARZ-RL −40°C to +125°C 8-Lead SOIC_N, 13” Tape and Reel R-8
ADA4891-2ARZ-R7 −40°C to +125°C 8-Lead SOIC_N, 7” Tape and Reel R-8
ADA4891-2ARMZ −40°C to +125°C 8-Lead MSOP RM-8 H1U
ADA4891-2ARMZ-RL −40°C to +125°C 8-Lead MSOP, 13" Tape and Reel RM-8 H1U
ADA4891-2ARMZ-R7 −40°C to +125°C 8-Lead MSOP, 7" Tape and Reel RM-8 H1U
ADA4891-2WARMZ-R7 −40°C to +125°C 8-Lead MSOP, 7" Tape and Reel RM-8 H2T
ADA4891-3ARUZ −40°C to +125°C 14-Lead TSSOP RU-14
ADA4891-3ARUZ-R7 −40°C to +125°C 14-Lead TSSOP, 7” Tape and Reel RU-14
ADA4891-3ARUZ-RL −40°C to +125°C 14-Lead TSSOP, 13” Tape and Reel RU-14
ADA4891-3ARZ −40°C to +125°C 14-Lead SOIC_N R-14
ADA4891-3ARZ-R7 −40°C to +125°C 14-Lead SOIC_N, 7” Tape and Reel R-14
ADA4891-4ARUZ −40°C to +125°C 14-Lead TSSOP RU-14
ADA4891-4ARUZ-R7 −40°C to +125°C 14-Lead TSSOP, 7” Tape and Reel RU-14
ADA4891-4ARUZ-RL −40°C to +125°C 14-Lead TSSOP, 13” Tape and Reel RU-14
ADA4891-4ARZ −40°C to +125°C 14-Lead SOIC_N R-14
ADA4891-4ARZ-R7 −40°C to +125°C 14-Lead SOIC_N, 7” Tape and Reel R-14
ADA4891-4ARZ-RL −40°C to +125°C 14-Lead SOIC_N, 13” Tape and Reel R-14
ADA4891-1AR-EBZ Evaluation Board for 8-Lead SOIC_N
ADA4891-1ARJ-EBZ Evaluation Board for 5-Lead SOT-23
ADA4891-2AR-EBZ Evaluation Board for 8-Lead SOIC_N
ADA4891-2ARM-EBZ Evaluation Board for 8-Lead MSOP
ADA4891-3ARU-EBZ Evaluation Board for 14-Lead TSSOP
ADA4891-4AR-EBZ Evaluation Board for 14-Lead SOIC_N
ADA4891-4ARU-EBZ Evaluation Board for 14-Lead TSSOP
1
Z = RoHS Compliant Part.
2
W = Qualified for Automotive Applications.
AUTOMOTIVE PRODUCTS
The ADA4891-1W and ADA4891-2W models are available with controlled manufacturing to support the quality and reliability
requirements of automotive applications. Note that these automotive models may have specifications that differ from the commercial
models; therefore, designers should review the Specifications section of this data sheet carefully. Only the automotive grade products
shown are available for use in automotive applications. Contact your local Analog Devices, Inc., account representative for specific
product ordering information and to obtain the specific Automotive Reliability reports for these models.
Rev. D | Page 23 of 24
Page 24

ADA4891-1/ADA4891-2/ADA4891-3/ADA4891-4 Data Sheet
©2010–2012 Analog Devices, Inc. All rights reserved. Trademarks and
NOTES
registered trademarks are the property of their respective owners.
D08054-0-3/12(D)
Rev. D | Page 24 of 24
 Loading...