

Low Noise, High Speed Op Amp
ADA4857-1/ADA4857-2
Rev. B
Information furnished by Analog Devices is believed to be accurate and reliable. However, no
Trademarks and registered trademarks are the property of their respective owners.
Fax: 781.461.3113 ©2008–2011 Analog Devices, Inc. All rights reserved.
NC = NO CONNECT
1PD
2FB
3–IN
4+IN
7 OUT
8 +V
S
6 NC
5 –V
S
ADA4857-1
TOP VIEW
(Not to S cale)
07040-001
FB
1
–IN
2
+IN
3
–V
S
4
PD
8
+V
S
7
OUT
6
NC
5
NC = NO CONNECT
ADA4857-1
TOP VIEW
(Not to Scale)
07040-002
1–IN1
2
+IN1
3NC
4–V
S2
11 NC
12 –V
S1
10 +IN2
9 –IN2
5
OUT2
6
+V
S2
7
PD2
8
FB2
FB1
PD1
+V
S1
OUT1
15
16
14
13
ADA4857-2
TOP VIEW
(Not to S cale)
NC = NO CONNECT
07040-003
Data Sheet
FEATURES
High speed
850 MHz, −3 dB bandwidth (G = +1, R
750 MHz, −3 dB bandwidth (G = +1, R
2800 V/µs slew rate
Low distortion: −88 dBc @ 10 MHz (G = +1, R
Low power: 5 mA/amplifier @ 10 V
Low noise: 4.4 nV/√Hz
Wide supply voltage range: 5 V to 10 V
Power-down feature
Available in 3 mm × 3 mm 8-lead LFCSP (single), 8-lead SOIC
(single), and 4 mm × 4 mm 16-lead LFCSP (dual)
APPLICATIONS
Instrumentation
IF and baseband amplifiers
Active filters
ADC drivers
DAC buffers
= 1 kΩ, LFCSP)
L
= 1 kΩ, SOIC)
L
= 1 kΩ)
L
Ultralow Distortion, Low Power,
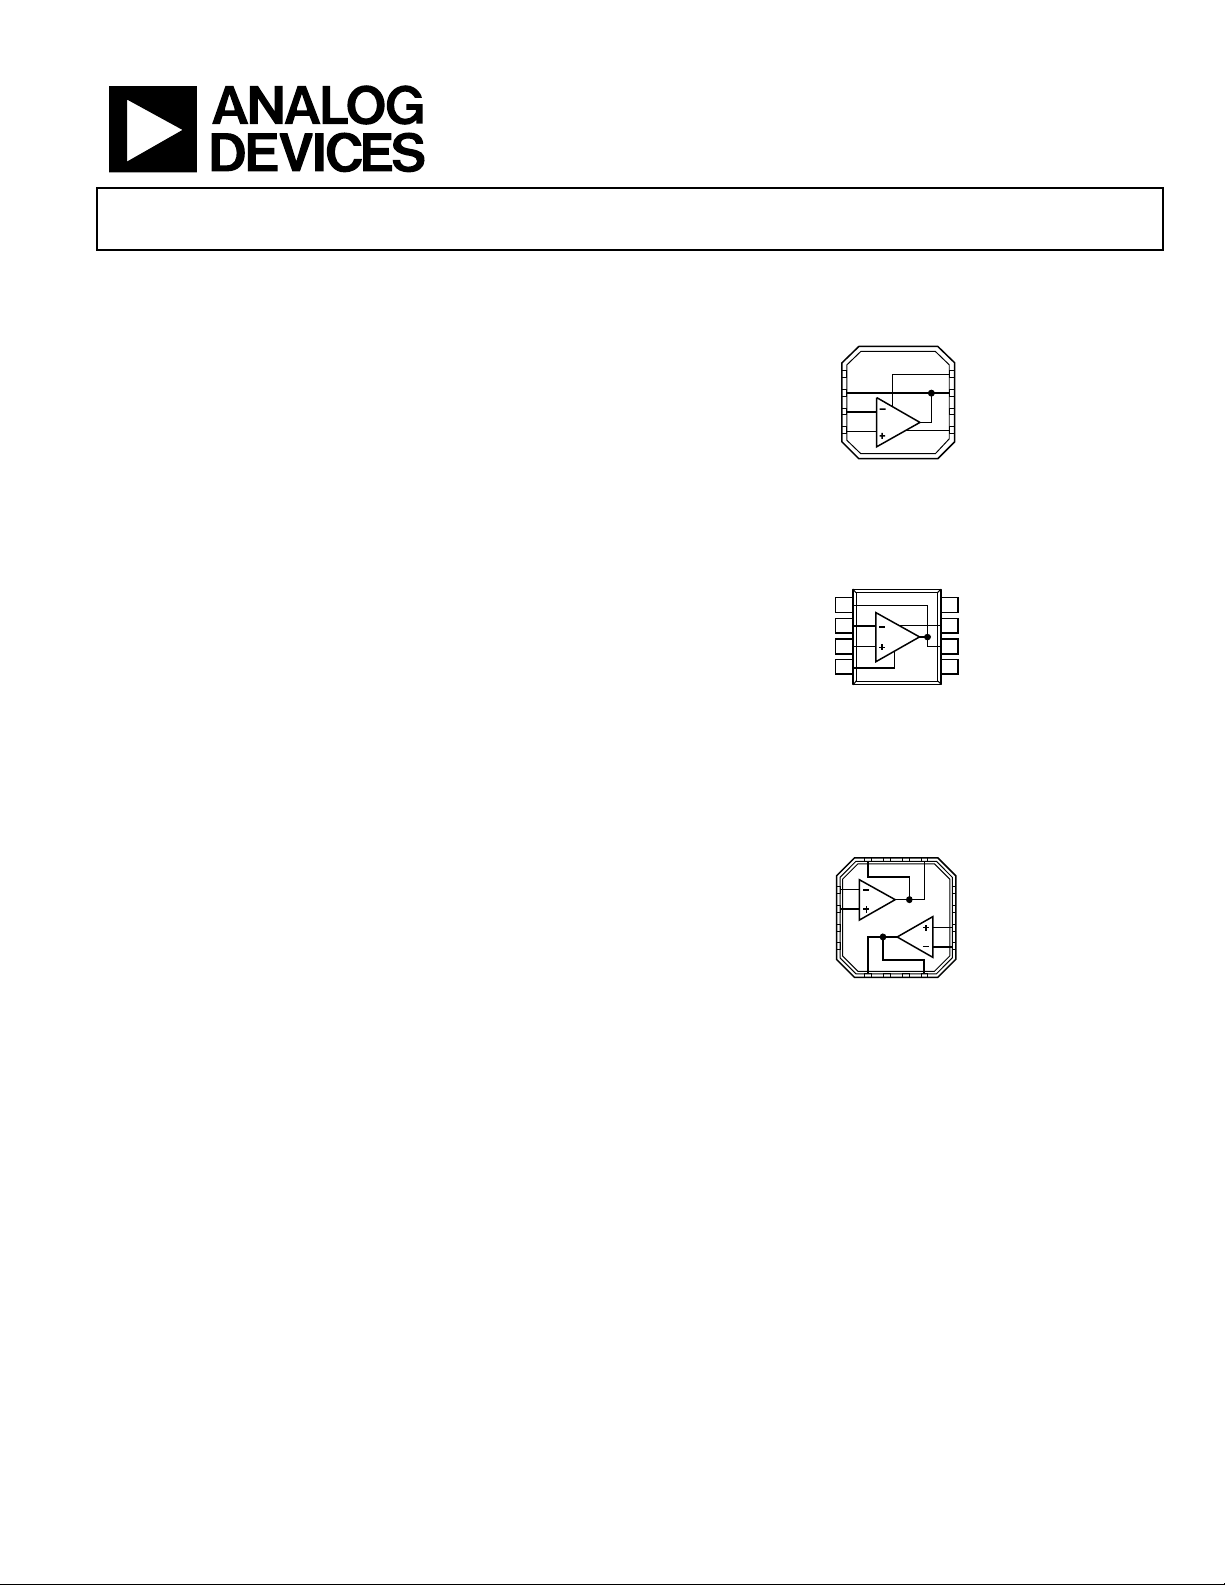
CONNECTION DIAGRAMS
Figure 1. 8-Lead LFCSP (CP)
Figure 2. 8-Lead SOIC (R)
GENERAL DESCRIPTION
The ADA4857 is a unity-gain stable, high speed, voltage feedback
amplifier with low distortion, low noise, and high slew rate. With a
spurious-free dynamic range (SFDR) of −88 dBc @ 10 MHz, the
ADA4857 is an ideal solution for a variety of applications, including
ultrasounds, ATE, active filters, and ADC drivers. The Analog
Devices, Inc., proprietary next-generation XFCB process and
innovative architecture enables such high performance amplifiers.
responsibility is assumed by Analog Devices for its use, nor for any infringements of patents or other
rights of third parties that may result from its use. Specifications subject to change with out notice. No
license is granted by implication or otherwise under any patent or patent rights of Analog Devices.
Figure 3. 16-Lead LFCSP (CP)
The ADA4857 has 850 MHz bandwidth, 2800 V/µs slew rate, and
settles to 0.1% in 15 ns. With a wide supply voltage range (5 V to
10 V), the ADA4857 is an ideal candidate for systems that require
high dynamic range, precision, and speed.
The ADA4857-1 amplifier is available in a 3 mm × 3 mm, 8-lead
LFCSP and a standard 8-lead SOIC. The ADA4857-2 is available in
a 4 mm × 4 mm, 16-lead LFCSP. The LFCSP features an exposed
paddle that provides a low thermal resistance path to the printed
circuit board (PCB). This path enables more efficient heat transfer
and increases reliability. The ADA4857 works over the extended
industrial temperature range (−40°C to +125°C).
One Technology Way, P.O. Box 9106, Norwood, MA 02062-9106, U.S.A.
Tel: 781.329.4700
www.analog.com

ADA4857-1/ADA4857-2 Data Sheet
TABLE OF CONTENTS
Features .............................................................................................. 1
Applications ....................................................................................... 1
Connection Diagrams ...................................................................... 1
General Description ......................................................................... 1
Revision History ............................................................................... 2
Specifications ..................................................................................... 3
±5 V Supply ................................................................................... 3
+5 V Supply ................................................................................... 4
Absolute Maximum Ratings ............................................................ 6
Thermal Resistance ...................................................................... 6
Maximum Power Dissipation ..................................................... 6
ESD Caution .................................................................................. 6
Pin Configurations and Function Descriptions ........................... 7
Typical Performance Characteristics ............................................. 9
Test Circuits ..................................................................................... 15
Applications Information .............................................................. 16
Power-Down Operation ............................................................ 16
Capacitive Load Considerations .............................................. 16
Recommended Values for Various Gains ................................ 16
Active Low-Pass Filter (LPF) .................................................... 17
Noise ............................................................................................ 18
Circuit Considerations .............................................................. 18
PCB Layout ................................................................................. 18
Power Supply Bypassing ............................................................ 18
Grounding ................................................................................... 18
Outline Dimensions ....................................................................... 19
Ordering Guide .......................................................................... 20
REVISION HISTORY
8/11—Rev. A to Rev. B
Changes to Table 1 Conditions ....................................................... 3
Changes to Table 2 Conditions ....................................................... 4
Changes to Typical Performance Characteristics Conditions .... 9
Changes to Figure 18 ...................................................................... 10
Changes to Figure 42 ...................................................................... 15
Changes to Table 9 .......................................................................... 16
Changes to Ordering Guide .......................................................... 20
11/08—Rev. 0 to Rev. A
Changes to Table 5 ............................................................................ 7
Changes to Table 7 ............................................................................ 8
Changes to Figure 32 ...................................................................... 13
Added Figure 44; Renumbered Sequentially .............................. 15
Changes to Layout .......................................................................... 15
Changes to Table 8 .......................................................................... 16
Added Active Low-Pass Filter (LFP) Section .............................. 17
Added Figure 48 and Figure 49; Renumbered Sequentially ..... 17
Changes to Grounding Section ..................................................... 18
Exposed Paddle Notation Added to Outline Dimensions ........ 19
Changes to Ordering Guide .......................................................... 20
5/08—Revision 0: Initial Ve r s ion
Rev. B | Page 2 of 20

Data Sheet ADA4857-1/ADA4857-2
f = 10 MHz, G = +1, V
= 2 V p-p (HD2)
−88 dBc
Common-Mode Rejection Ratio
VCM = ±1 V
−78
−86 dB
Output Overdrive Recovery Time
VIN = ±2.5 V, G = +2
10 ns
SPECIFICATIONS
±5 V SUPPLY
TA = 25°C, G = +2, RG = RF = 499 Ω, RS = 100 Ω for G = +1 (SOIC), RL = 1 kΩ to ground, PD = no connect, unless otherwise noted.
Table 1.
Parameter Conditions Min Typ Max Unit
DYNAMIC PERFORMANCE
–3 dB Bandwidth (LFCSP/SOIC) G = +1, V
G = +1, V
G = +2, V
Full Power Bandwidth G = +1, V
Bandwidth for 0.1 dB Flatness (LFCSP/SOIC) G = +2, V
Slew Rate (10% to 90%) G = +1, V
Settling Time to 0.1% G = +2, V
NOISE/HARMONIC PERFORMANCE
Harmonic Distortion f = 1 MHz, G = +1, V
f = 1 MHz, G = +1, V
f = 10 MHz, G = +1, V
f = 50 MHz, G = +1, V
f = 50 MHz, G = +1, V
Input Voltage Noise f = 100 kHz 4.4 nV/√Hz
Input Current Noise f = 100 kHz 1.5 pA/√Hz
DC PERFORMANCE
Input Offset Voltage ±2 ±4.5 mV
Input Offset Voltage Drift 2.3 µV/°C
Input Bias Current
−2 −3.3 µA
Input Bias Current Drift 24.5 nA/°C
Input Bias Offset Current 50 nA
Open-Loop Gain V
OUT
PD (POWER-DOWN) PIN
PD Input Voltage Chip powered down ≥(VCC − 2) V
Chip enabled ≤(VCC − 4.2) V
Turn-Off Time 50% off PD to <10% of final V
Turn-On Time 50% off PD to <10% of final V
PD Pin Leakage Current Chip enabled 58 µA
Chip powered down 80 µA
INPUT CHARACTERISTICS
Input Resistance Common mode 8 MΩ
Differential mode 4 MΩ
Input Capacitance Common mode 2 pF
Input Common-Mode Voltage Range ±4 V
= 0.2 V p-p 650 850/750 MHz
OUT
= 2 V p-p 600/550 MHz
OUT
= 0.2 V p-p 400/350 MHz
OUT
= 2 V p-p, THD < −40 dBc 110 MHz
OUT
= 2 V p-p, RL = 150 Ω 75/90 MHz
OUT
= 4 V step 2800 V/µs
OUT
= 2 V step 15 ns
OUT
= 2 V p-p (HD2) −108 dBc
OUT
= 2 V p-p (HD3) −108 dBc
OUT
OUT
= 2 V p-p (HD3) −93 dBc
OUT
= 2 V p-p (HD2) −65 dBc
OUT
= 2 V p-p (HD3) −62 dBc
OUT
= −2.5 V to +2.5 V 57 dB
, VIN = 1 V, G = +2 55 µs
OUT
, VIN = 1 V, G = +2 33 ns
OUT
OUTPUT CHARACTERISTICS
Output Voltage Swing RL = 1 kΩ ±4 V
RL = 100 Ω ±3.7 V
Output Current 50 mA
Short-Circuit Current Sinking and sourcing 125 mA
Capacitive Load Drive 30% overshoot, G = +2 10 pF
Rev. B | Page 3 of 20

ADA4857-1/ADA4857-2 Data Sheet
Positive Power Supply Rejection
+VS = 4.5 V to 5.5 V, −VS = −5 V
−59
−62 dB
f = 50 MHz, G = +1, V
= 2 V p-p (HD2)
−69 dBc
PD Pin Leakage Current
Chip enable
8
µA
Parameter Conditions Min Typ Max Unit
POWER SUPPLY
Operating Range 4.5 10.5 V
Quiescent Current 5 5.5 mA
Quiescent Current (Power Down) PD ≥ VCC − 2 V 350 450 µA
Negative Power Supply Rejection +VS = 5 V, −VS = −4.5 V to −5.5 V −65 −68 dB
+5 V SUPPLY
TA = 25°C, G = +2, RF = RG = 499 Ω, RS = 100 Ω for G = +1 (SOIC), RL = 1 kΩ to midsupply, PD = no connect, unless otherwise noted.
Table 2.
Parameter Conditions Min Typ Max Unit
DYNAMIC PERFORMANCE
–3 dB Bandwidth (LFCSP/SOIC) G = +1, V
G = +1, V
G = +2, V
Full Power Bandwidth G = +1, V
Bandwidth for 0.1 dB Flatness (LFCSP/SOIC) G = +2, V
Slew Rate (10% to 90%) G = +1, V
Settling Time to 0.1% G = +2, V
NOISE/HARMONIC PERFORMANCE
Harmonic Distortion f = 1 MHz, G = +1, V
f = 1 MHz, G = +1, V
f = 10 MHz, G = +1, V
f = 10 MHz, G = +1, V
f = 50 MHz, G = +1, V
Input Voltage Noise f = 100 kHz 4.4 nV/√Hz
Input Current Noise f = 100 kHz 1.5 pA/√Hz
DC PERFORMANCE
Input Offset Voltage ±1 ±4.2 mV
Input Offset Voltage Drift 4.6 µV/°C
Input Bias Current
−1.7 −3.3 µA
Input Bias Current Drift 24.5 nA/°C
Input Bias Offset Current 50 nA
Open-Loop Gain V
OUT
PD (POWER-DOWN) PIN
PD Input Voltage Chip powered down ≥(VCC − 2) V
Chip enabled ≤(VCC − 4.2) V
Turn-Off Time 50% off PD to <10% of fin al V
Turn-On Time 50% off PD to <10% of final V
= 0.2 V p-p 595 800/750 MHz
OUT
= 2 V p-p 500/400 MHz
OUT
= 0.2 V p-p 360/300 MHz
OUT
= 2 V p-p, THD < −40 dBc 95 MHz
OUT
= 2 V p-p, RL = 150 Ω 50/40 MHz
OUT
= 2 V step 1500 V/µs
OUT
= 2 V step 15 ns
OUT
= 2 V p-p (HD2) −92 dBc
OUT
= 2 V p-p (HD3) −90 dBc
OUT
= 2 V p-p (HD2) −81 dBc
OUT
= 2 V p-p (HD3) −71 dBc
OUT
OUT
= 2 V p-p (HD3) −55 dBc
OUT
= 1.25 V to 3.75 V 57 dB
, VIN = 1 V, G = +2 38 µs
OUT
, VIN = 1 V, G = +2 30 ns
OUT
Chip powered down 30 µA
INPUT CHARACTERISTICS
Input Resistance Common mode 8 MΩ
Differential mode 4 MΩ
Input Capacitance Common mode 2 pF
Input Common-Mode Voltage Range 1 to 4 V
Common-Mode Rejection Ratio VCM = 2 V to 3 V −76 −84 dB
Rev. B | Page 4 of 20

Data Sheet ADA4857-1/ADA4857-2
Output Current
50 mA
Parameter Conditions Min Typ Max Unit
OUTPUT CHARACTERISTICS
Overdrive Recovery Time G = +2 15 ns
Output Voltage Swing RL = 1 kΩ 1 to 4 V
RL = 100 Ω 1.1 to 3.9 V
Short-Circuit Current Sinking and sourcing 75 mA
Capacitive Load Drive 30% overshoot, G = +2 10 pF
POWER SUPPLY
Operating Range 4.5 10.5 V
Quiescent Current 4.5 5 mA
Quiescent Current (Power Down) PD ≥ VCC − 2 V 250 350 µA
Positive Power Supply Rejection +VS = 4.5 V to 5.5 V, −VS = 0 V −58 −62 dB
Negative Power Supply Rejection +VS = 5 V, −VS = −0.5 V to +0.5 V −65 −68 dB
Rev. B | Page 5 of 20
ADA4857-1/ADA4857-2 Data Sheet
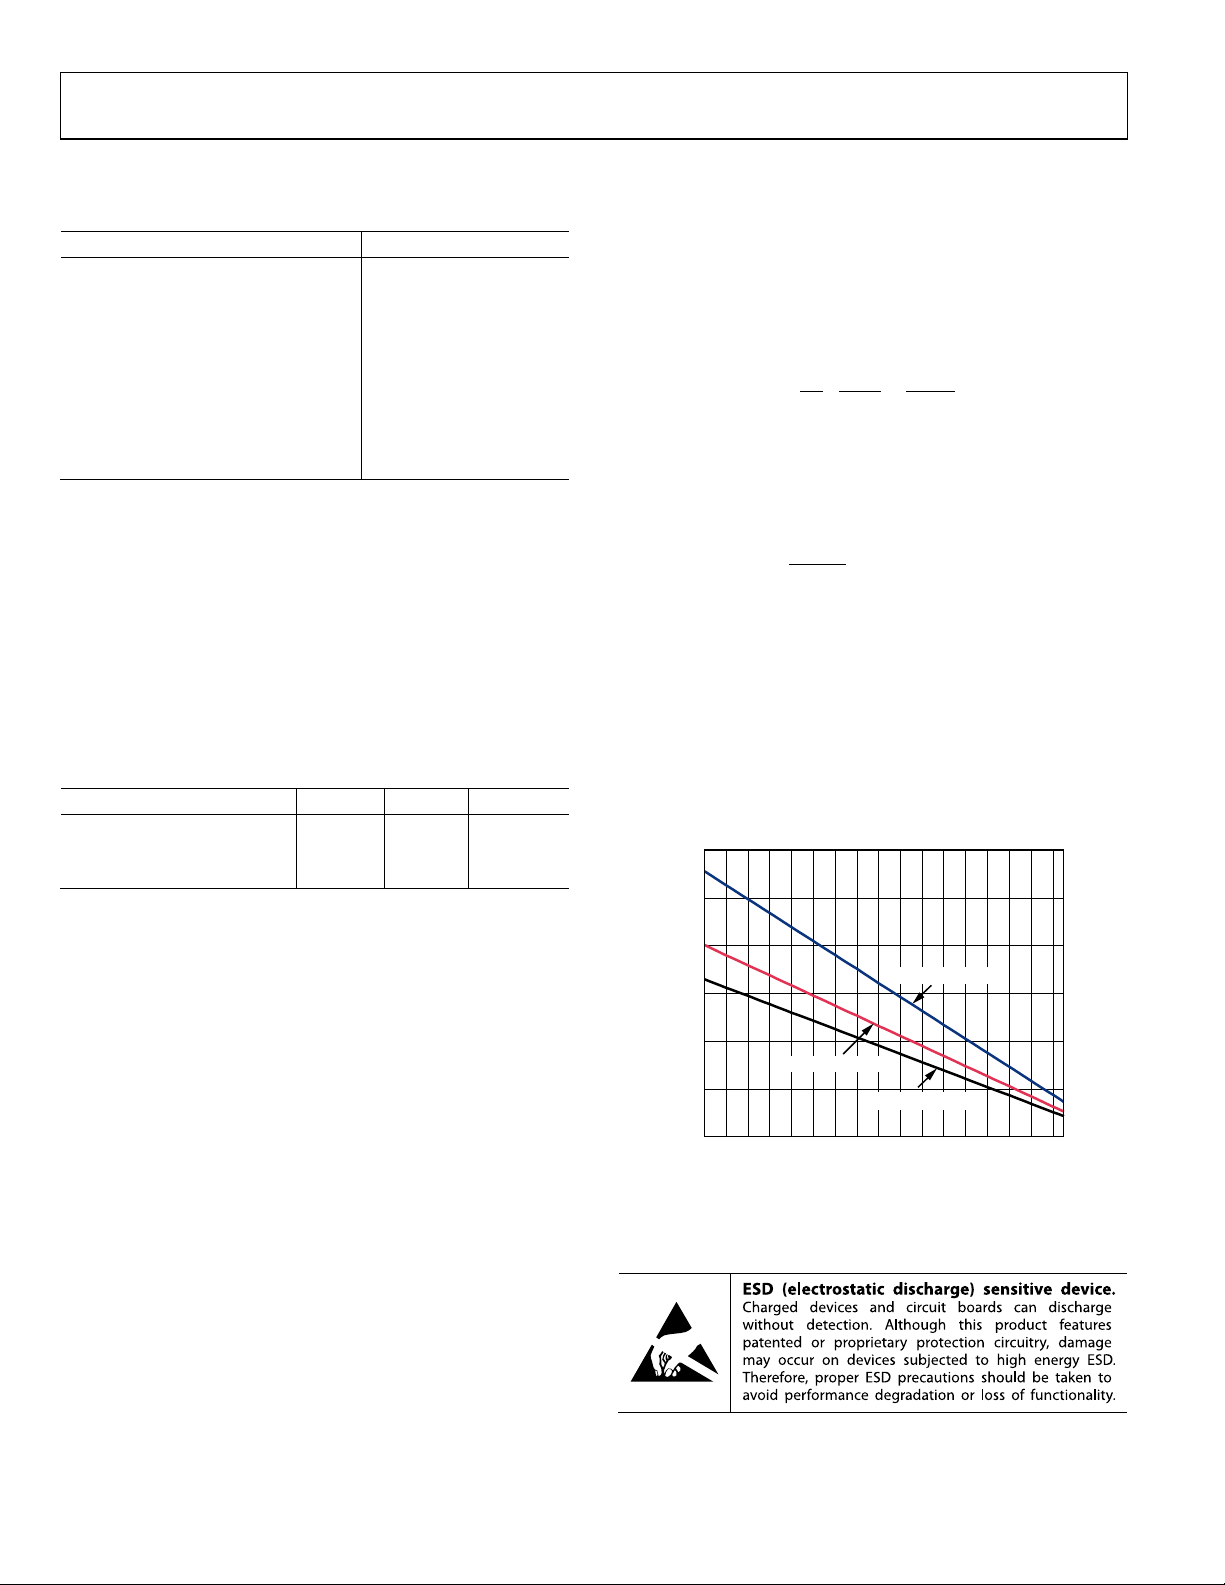
Power Dissipation
See Figure 4
( )
( )
L
S
SS
D
R
V
IVP
2
4/
+×=
0
0.5
1.0
1.5
2.0
2.5
3.0
–40–30 –20–10 0 10 20 30 40
50 60 70 80 90 100 110 120
07040-004
AMBIENT T E M P E RATURE (°C)
MAXIMUM POWER DISSIPATION (W)
ADA4857-1 (SOIC)
ADA4857-1 (LFCSP )
ADA4857-2 (LFCSP )
ABSOLUTE MAXIMUM RATINGS
Table 3.
Parameter Rating
Supply Voltage 11 V
Common-Mode Input Voltage −VS + 0.7 V to +VS − 0.7 V
Differential Input Voltage ±VS
Exposed Paddle Voltage −VS
Storage Temperature Range −65°C to +125°C
Operating Temperature Range −40°C to +125°C
Lead Temperature (Soldering, 10 sec) 300°C
Junction Temperature 150°C
Stresses above those listed under Absolute Maximum Ratings
may cause permanent damage to the device. This is a stress
rating only; functional operation of the device at these or any
other conditions above those indicated in the operational
section of this specification is not implied. Exposure to absolute
maximum rating conditions for extended periods may affect
device reliability.
THERMAL RESISTANCE
θJA is specified for the worst-case conditions, that is, θJA is specified
for device soldered in circuit board for surface-mount packages.
Table 4.
Package Type θJA θJC Unit
8-Lead SOIC 115 15 °C/W
8-Lead LFCSP 94.5 34.8 °C/W
16-Lead LFCSP 68.2 19 °C/W
MAXIMUM POWER DISSIPATION
The maximum safe power dissipation for the ADA4857 is
limited by the associated rise in junction temperature (T
the die. At approximately 150°C, which is the glass transition
temperature, the properties of the plastic change. Even temporarily
exceeding this temperature limit may change the stresses that
the package exerts on the die, permanently shifting the parametric
performance of the ADA4857. Exceeding a junction temperature of
175°C for an extended period can result in changes in silicon
devices, potentially causing degradation or loss of functionality.
) on
J
The power dissipated in the package (P
quiescent power dissipation and the power dissipated in the
die due to the ADA4857 drive at the output. The quiescent
power is the voltage between the supply pins (V
quiescent current (I
= Quiescent Power + (Total Drive Power − Load Power)
P
D
( )
D
).
S
V
V
IVP
SS
OUTS
×+×=
R
2
L
RMS output voltages should be considered. If R
to −V
, as in single-supply operation, the total drive power is
S
V
× I
. If the rms signal levels are indeterminate, consider the
S
OUT
worst case, when V
= VS/4 for RL to midsupply.
OUT
In single-supply operation with R
case is V
= VS/2.
OUT
Airflow increases heat dissipation, effectively reducing θ
In addition, more metal directly in contact with the package
leads and exposed paddle from metal traces, through holes,
ground, and power planes reduces θ
Figure 4 shows the maximum power dissipation in the package
vs. the ambient temperature for the SOIC and LFCSP packages
on a JEDEC standard 4-layer board. θ
Figure 4. Maximum Power Dissipation vs. Temperature for a 4-Layer Board
ESD CAUTION
) is the sum of the
D
) times the
S
L
2
V
OUT
–
R
L
is referenced
L
referenced to −VS, the worst
.
JA
values are approximations.
JA
.
JA
Rev. B | Page 6 of 20

Data Sheet ADA4857-1/ADA4857-2
NC = NO CONNECT
1PD
2FB
3–IN
4+IN
7 OUT
8 +V
S
6 NC
5 –V
S
ADA4857-1
07040-005
TOP VIEW
(Not to Scale)
FB
1
–IN
2
+IN
3
–V
S
4
PD
8
+V
S
7
OUT
6
NC
5
NC = NO CONNECT
ADA4857-1
07040-006
TOP VIEW
(Not to Scale)
EP
GND or VS
Exposed Pad. The exposed pad
PIN CONFIGURATIONS AND FUNCTION DESCRIPTIONS
Figure 5. 8-Lead LFCSP Pin Configuration
Table 5. 8-Lead LFCSP Pin Function Descriptions
Pin No. Mnemonic Description
1 PD Power Down.
2 FB Feedback.
3 −IN Inverting Input.
4 +IN Noninverting Input.
5 −VS Negative Supply.
6 NC No Connect.
7 OUT Output.
8 +VS Positive Supply.
may be connected to GND or VS.
Figure 6. 8-Lead SOIC Pin Configuration
Table 6. 8-Lead SOIC Pin Function Descriptions
Pin No. Mnemonic Description
1 FB Feedback
2 −IN Inverting Input
3 +IN Noninverting Input
4 −VS Negative Supply
5 NC No Connect
6 OUT Output
7 +VS Positive Supply
8 PD Power Down
Rev. B | Page 7 of 20

ADA4857-1/ADA4857-2 Data Sheet
1–IN1
2+IN1
3NC
4–V
S2
11 NC
12 –V
S1
10 +IN2
9 –IN2
5
OUT2
6
+V
S2
7
PD2
8
FB2
FB1
PD1
+V
S1
OUT1
15
16
14
13
ADA4857-2
TOP VIEW
(Not to S cale)
NC = NO CONNECT
07040-007
Figure 7. 16-Lead LFCSP Pin Configuration
Table 7. 16-Lead LFCSP Pin Function Descriptions
Pin No. Mnemonic Description
1 −IN1 Inverting Input 1.
2 +IN1 Noninverting Input 1.
3, 11 NC No Connect.
4 −VS2 Negative Supply 2.
5 OUT2 Output 2.
6 +VS2 Positive Supply 2.
7 PD2 Power Down 2.
8 FB2 Feedback 2.
9 −IN2 Inverting Input 2.
10 +IN2 Noninverting Input 2.
12 −VS1 Negative Supply 1.
13 OUT1 Output 1.
14 +VS1 Positive Supply 1.
15 PD1 Power Down 1.
16 FB1 Feedback 1.
EP GND or Vs Exposed Pad. The exposed pad may be connected to GND or VS.
Rev. B | Page 8 of 20

Data Sheet ADA4857-1/ADA4857-2
–10
–9
–8
–7
–6
–5
–4
–3
–2
–1
0
1
2
3
1 10 100 1000
07040-008
FREQUENCY (MHz)
NORMALIZED CLOSED-LOOP GAIN (dB)
G = +1
G = +2
G = +5
G = +10
V
S
= ±5V
R
L
= 1kΩ
V
OUT
= 0.2V p-p
–10
–9
–8
–7
–6
–5
–4
–3
–2
–1
0
1
2
3
1 10 100 1000
07040-009
FREQUENCY (MHz)
CLOSED-LOOP GAIN (dB)
G = +1
R
L
= 1kΩ
V
OUT
= 0.2V p-p
±5V
+5V
–10
–9
–8
–7
–6
–5
–4
–3
–2
–1
0
1
2
3
1 10 100 1000
07040-010
FREQUENCY (MHz)
CLOSED-LOOP GAIN (dB)
–40°C
+125°C
+25°C
G = +1
V
S
= ±5V
R
L
= 1kΩ
V
OUT
= 0.2V p-p
–10
–9
–8
–7
–6
–5
–4
–3
–2
–1
0
1
2
3
1 10 100 1000
07040-011
FREQUENCY (MHz)
NORMALIZED CLOSED-LOOP GAIN (dB)
G = +1
G = +2
G = +10
VS = ±5V
R
L
= 1kΩ
V
OUT
= 2V p-p
G = +5
1 10 100 1000
07040-012
FREQUENCY (MHz)
CLOSED-LOOP GAIN (dB)
NO CAP LOAD
G = +2
V
S
= ±5V
R
L
= 1kΩ
V
OUT
= 0.2V p-p
–7
–6
–5
–4
–3
–2
–1
0
1
2
3
4
5
6
7
8
9
5pF
10pF
–10
–9
–8
–7
–6
–5
–4
–3
–2
–1
0
1
2
3
1 10 100 1000
07040-013
FREQUENCY (MHz)
CLOSED-LOOP GAIN (dB)
G = +1
V
S
= ±5V
RL = 100Ω
1V p-p
4V p-p
TYPICAL PERFORMANCE CHARACTERISTICS
T = 25°C, G = +1, RF = 0 Ω, and, RG open, RS = 100 Ω for SOIC, (for G = +2, RF = RG = 499 Ω), unless otherwise noted.
Figure 8. Small Signal Frequency Responses for Various Gains (LFCSP)
Figure 9. Small Sign al Frequency Respons e for Various Supply Voltages (LFCSP)
Figure 11. Large Signal Frequency Responses for Various Gains (LFCSP)
Figure 12. Small Signal Fre quency Response for Various Capacitive Loads (LFCSP)
Figure 10. Small Signal Fre quency Response for Various Temperatu res (LFCSP)
Figure 13. Large Signal Frequency Response vs. V
OUT
(LFCSP)
Rev. B | Page 9 of 20

ADA4857-1/ADA4857-2 Data Sheet
1 10 100 1000
07040-014
FREQUENCY (MHz)
CLOSED-LOOP GAIN (dB)
R
L
= 100Ω
G = +2
V
S
= ±5V
V
OUT
= 0.2V p-p
–7
–6
–5
–4
–3
–2
–1
0
1
2
3
4
5
6
7
8
9
RL = 1kΩ
–10
–9
–8
–7
–6
–5
–4
–3
–2
–1
0
1
2
3
1 10 100 1000
07040-015
FREQUENCY (MHz)
NORMALIZED CLOSED-LOOP GAIN (dB)
VS = 5V
RL = 1kΩ
V
OUT
= 0.2V p-p
G = +1
G = +2
G = +10
G = +5
–120
–110
–100
–90
–80
–70
–60
–50
–40
0.2 1 10 100
G = +1, HD2
G = +1, HD3
G = +2, HD2
G = +2, HD3
07040-016
FREQUENCY (MHz)
DISTORTION (dBc)
VS = ±5V
V
OUT
= 2V p-p
RL= 1kΩ
–10
–9
–8
–7
–6
–5
–4
–3
–2
–1
0
1
2
3
1 10 100 1000
07040-017
FREQUENCY (MHz)
CLOSED-LOOP GAIN (dB)
G = +1
V
S
= ±5V
V
OUT
= 2V p-p
R
L
= 100Ω
R
L
= 1kΩ
–10
–9
–8
–7
–6
–5
–4
–3
–2
–1
0
1
2
3
1 10 100 1000
07040-018
FREQUENCY (MHz)
NORMALIZED CLOSED-LOOP GAIN (dB)
VS = ±5V
R
L
= 1kΩ
V
OUT
= 0.2V p-p
G = +1
G = +10
G = +5
G = +2
100Ω
V
IN
R
L
R
T
R
S
V
OUT
+V
S
–V
S
G = +1
–120
–110
–100
–90
–80
–70
–60
–50
–40
0.2 1 10 100
RL = 100Ω, HD2
R
L
= 100Ω, HD3
R
L
= 1kΩ, HD3
07040-019
FREQUENCY (MHz)
DISTORTION (dBc)
G = +1
V
S
= ±5V
V
OUT
= 2V p-p
RL = 1kΩ, HD2
Figure 14. Small Signal Fre quency Response for Various Resistive L oads (LFCSP)
Figure 15. Small Signal Frequency Response for Various Gains (LFCSP)
Figure 17. Large Signal Frequen cy Response for Vario us Resistive Loads (LFCSP)
Figure 18. Small Signal Frequency Response for Various Gains (SOIC),
R
= 100 Ω for G = +1
S
Figure 16. Harmonic Distortion vs. Frequency and Gain (LFCSP)
Figure 19. Harmonic Distortion vs. Frequency and Load (LFCSP)
Rev. B | Page 10 of 20

Data Sheet ADA4857-1/ADA4857-2
1 2 3 4 5 6 7 8
–120
–110
–100
–90
–80
–70
–60
–50
–40
HD2, f = 10MHz
HD3, f = 1MHz
HD3, f = 10MHz
HD2, f = 1MHz
07040-020
OUTPUT VOLTAGE (V p-p)
DISTORTION (dBc)
G = +2
V
S
= ±5V
R
L
= 1kΩ
5.7
5.8
5.9
6.1
6.0
6.2
6.3
1 10 100
07040-021
FREQUENCY (MHz)
CLOSED-LOOP GAIN (dB)
V
OUT
= 2V p-p
V
OUT
= 0.2V p-p
V
S
= ±5V
G = +2
R
L
= 150Ω
OUTPUT VOLTAGE (V)
07040-022
TIME (10ns/DIV)
2.5
–2.5
–2.0
2.0
–1.5
1.5
–1.0
1.0
–0.5
0
0.5
4V p-p
2V p-p
V
S
= ±5V
RL = 1kΩ
G = +2
SETTLING TIME (%)
07040-023
TIME (5ns/DIV)
0.5
–0.5
–0.4
0.4
–0.3
0.3
–0.2
0.2
–0.1
0
0.1
OUTPUT
INPUT
V
OUT
= 2V p-p
G = +2
V
S
= ±5
5.7
5.8
5.9
6.1
6.0
6.2
6.3
1 10 100
07040-024
FREQUENCY (MHz)
CLOSED-LOOP GAIN (dB)
V
OUT
= 2V p-p
V
OUT
= 0.2V p-p
V
S
= ±5V
G = +2
RL= 150Ω
OUTPUT VOLTAGE (V)
07040-025
TIME (10ns/DIV)
2.5
–2.5
–2.0
2.0
–1.5
1.5
–1.0
1.0
–0.5
0
0.5
4V p-p
2V p-p
VS = ±5V
R
L
= 1kΩ
G = +1
Figure 20. Harmonic Distortion vs. Output Voltage
Figure 21. 0.1 dB Flatness vs. Frequency for Various Output Voltages (SOIC)
Figure 23. Short-Term Settling Time (LFCSP)
Figure 24. 0.1 dB Flatness vs. Frequency for Various Output Voltages (LFCSP)
Figure 22. Large Signal Transient Response for Vario us Output Voltages (SOIC)
Figure 25. Large Signal Tra nsient Response for Vario us Output Voltages (LFCSP)
Rev. B | Page 11 of 20

ADA4857-1/ADA4857-2 Data Sheet
OUTPUT VOLTAGE (V)
07040-026
TIME (10ns/DIV)
0.25
–0.25
–0.20
0.20
–0.15
0.15
–0.10
0.10
–0.05
0
0.05
C
L
= 10pF
C
L
= 1.5pF
V
S
= ±5V
R
L
= 1kΩ
G = +1
OUTPUT VOLTAGE (V)
07040-027
TIME (10ns/DIV)
0.25
–0.25
–0.20
0.20
–0.15
0.15
–0.10
0.10
–0.05
0
0.05
V
S
= ±5V
V
S
= ±2.5V
R
L
= 1kΩ
G = +1
0.1
1
10
100
1000
1000
0.1 1 10 100
07040-028
FREQUENCY (MHz)
CLOSED-LOOP OUTPUT IMPEDANCE (Ω)
V
S
= ±5V
G = +2
G = +5
OUTPUT VOLTAGE (V)
07040-029
TIME (10ns/DIV)
2.0
–2.0
–1.6
1.6
–1.2
1.2
–0.8
0.8
–0.4
0
0.4
RL = 1kΩ
R
L
= 100Ω
V
S
= ±5V
G = +2
OUTPUT VOLTAGE (V)
07040-030
TIME (10ns/DIV)
2.0
–2.0
–1.6
1.6
–1.2
1.2
–0.8
0.8
–0.4
0
0.4
R
L
= 1kΩ
RL = 100Ω
VS = ±5V
G = +1
1 10 100 1000
07040-031
FREQUENCY (MHz)
CLOSED-LOOP INPUT IMPEDANCE (
k
Ω)
VS = ±5V
G = +2
0.01
0.1
1
10
100
Figure 26. Small Signal Transient Response for Various Capacitive Loads (LFCSP)
Figure 27. Small Signal Tr ansient Response fo r Various Supply Vo ltages (LFCSP)
Figure 29. Large Signal Tra nsient Response for Various Load Resistances (SOIC)
Figure 30. Large Signal Tra nsient Response for Various Load Res istances (LFCSP)
Figure 28. Closed-Loop Output Impedance vs. Frequency for Various Gains
Figure 31. Closed-Loop Input Impedance vs. Frequency
Rev. B | Page 12 of 20

Data Sheet ADA4857-1/ADA4857-2
PHASE
GAIN
–10
0
10
20
30
40
50
60
80
70
0.1
–180
–160
–140
–120
–100
–80
–60
–40
–20
0
1 10 100 1000
OPEN-LOOP PHASE (Degrees)
07040-032
FREQUENCY (MHz)
OPEN-LOOP GAIN (dB)
VS = ±5V
RL = 1k
Ω
07040-033
OUTPUT VOLTAGE (V)
TIME (40ns/DIV)
8
–8
6
–6
–4
4
–2
0
2
OUTPUT
RL = 100Ω
OUTPUT
R
L
= 1kΩ
INPUT
VS = ±5V
G = +1
–30
–20
–10
0
10
–80
–70
–60
–50
–40
0.1 1 10 100 1000
07040-034
FREQUENCY (MHz)
PSRR (dB)
–PSRR
+PSRR
VS = ±5V
R
L
= 1kΩ
SOIC
LFCSP
–30
–20
–10
0
–100
–70
–80
–90
–60
–50
–40
0.1 1 10 100 1000
07040-035
FREQUENCY (MHz)
PD ISOLATION (dB)
G = +2
VS = ±5V
R
L
= 1kΩ
PD = 3V
07040-036
OUTPUT VOLTAGE (V)
TIME (200ns/DIV)
8
–8
6
–6
–4
4
–2
0
2
OUTPUT
R
L
= 100Ω
OUTPUT
R
L
= 1kΩ
2 × INPUT
VS = ±5V
G = +2
–30
–90
–80
–70
–60
–50
–40
0.1 1 10 100 1000
07040-037
FREQUENCY (MHz)
CMRR (dB)
V
S
= ±5V
R
L
= 1kΩ
Figure 32. Open-Loop Gain and Phase vs. Frequency
Figure 33. Input Overdrive Recovery for Various Resistive Loads
Figure 35. PD Isolation vs. Frequency
Figure 36. Output Overdrive Recovery for Various Resistive Loads
Figure 34. Power Supply Rejection Ratio (PSRR) vs. Frequency
Rev. B | Page 13 of 20
Figure 37. Common-Mode Rejection Ratio (CMRR) vs. Frequency

ADA4857-1/ADA4857-2 Data Sheet
07040-050
FREQUENCY ( Hz )
CURRENT NOIS E ( pA/√Hz)
1
10
100
10 100 1k 10k 100k 1M
V
S
= ±5V
50
40
30
20
10
4.954.904.85 5.00
0
07040-042
SUPPLY CURRENT (mA)
COUNT
5.155.105.05
N = 238
MEAN: 5.00
SD: 0.02
07040-041
FREQUENCY ( Hz )
VOLTAGE NOISE (nV/√Hz)
1
10
1000
100
1 10 100 1k 10k 100k 1M
V
S
= ±5V
07040-043
VOLTAGE (V)
TIME (20µs/DIV)
3.5
–0.5
3.0
0
0.5
2.5
1.0
1.5
2.0
OUTPUT
PD INPUT
Figure 38. Input Current Noise vs. Frequency
Figure 40. Input Voltage Noise vs. Frequency
Figure 39. Supply Current
Figure 41. Disable/Enable Switching Speed
Rev. B | Page 14 of 20

Data Sheet ADA4857-1/ADA4857-2
V
IN
R
S
V
OUT
0.1µF
0.1µF
0.1µF
10µF
+V
S
–V
S
49.9Ω
07040-047
R
L
+
10µF
+
V
OUT
0.1µF
49.9Ω
+V
S
–V
S
07040-045
R
L
10µF
+
AC
V
IN
V
OUT
0.1µF
0.1µF
0.1µF
10µF
+V
S
–V
S
49.9Ω
07040-051
R
L
R
F
R
G
C
L
+
10µF
+
V
IN
V
OUT
0.1µF
0.1µF
0.1µF
10µF
+V
S
–V
S
1kΩ
1kΩ
1kΩ
1kΩ
07040-046
53.6Ω
R
L
+
10µF
+
0.1µF
V
OUT
+V
S
–V
S
07040-048
R
L
10µF
+
AC
49.9Ω
V
IN
V
OUT
0.1µF 0.1µF
0.1µF
10µF
+V
S
–V
S
R
G
R
F
49.9Ω
07040-049
R
L
C
L
+
10µF
+
40Ω
R
SNUB
TEST CIRCUITS
Figure 42. Noninverting Load Configuration
Figure 43. Positive Power Supply Rejection
Figure 45. Common-Mode Rejection
Figure 46. Negative Power Supply Rejection
Figure 44. Typical Capacitive Load Configuration (LFCSP)
Figure 47. Typical Capacitive Load Configuration (SOIC)
Rev. B | Page 15 of 20

ADA4857-1/ADA4857-2 Data Sheet
APPLICATIONS INFORMATION
POWER-DOWN OPERATION
The PD pin is used to power down the chip, which reduces the
quiescent current and the overall power consumption. It is low
enabled, which means that the chip is on with full power when
the PD pin input voltage is low (see Table 8). Note that PD does not
put the output in a high-Z state, which means that the ADA4857
should not be used as a multiplexer.
Table 8. PD Operation Table Guide
Supply Voltage
Condition ±5 V ±2.5 V +5 V
Enabled ≤+0.8 V ≤−1.7 V ≤+0.8 V
Powered down ≥+3 V ≥+0.5 V ≥+3 V
CAPACITIVE LOAD CONSIDERATIONS
When driving a capacitive load using the SOIC package, R
used to reduce the peaking (see Figure 47). An optimum resistor
value of 40 Ω is found to maintain the peaking within 1 dB for
any capacitive load up to 40 pF.
SNUB
is
RECOMMENDED VALUES FOR VARIOUS GAINS
Table 9 provides a useful reference for determining various gains
and associated performance. R
their contribution to the overall noise performance of the amplifier.
and RG are kept low to minimize
F
Table 9. Various Gain and Recommended Resistor Values Associated with Conditions; V
−3 dB SS BW (MHz)
Gain RS (Ω) (CSP/SOIC) RF (Ω) RG (Ω)
+1 0/100 0 N/A 850/750 2350 4.4 4.49
+2 0/0 499 499 360/320 1680 8.8 9.89
+5 0/0 499 124 90/89 516 22.11 23.49
+10 0/0 499 56.2 43/40 213 43.47 45.31
(CSP/SOIC)
Slew Rate (V/μs),
V
= 2 V Step
OUT
= ±5 V, TA = 25°C, RL = 1 kΩ, RT = 49.9 Ω
S
ADA4857 Voltage
Noise (nV/√Hz), RTO
Total Sys tem
Noise (nV/√Hz), RTO
Rev. B | Page 16 of 20

Data Sheet ADA4857-1/ADA4857-2
ACTIVE LOW-PASS FILTER (LPF)
Active filters are used in many applications such as antialiasing
filters and high frequency communication IF strips. With a
410 MHz gain bandwidth product and high slew rate, the
ADA4857-2 is an ideal candidate for active filters. Figure 48
shows the frequency response of 90 MHz and 45 MHz LPFs.
In addition to the bandwidth requirements, the slew rate must
be capable of supporting the full power bandwidth of the filter.
In this case, a 90 MHz bandwidth with a 2 V p-p output swing
requires at least 2800 V/μs.
The circuit shown in Figure 49 is a 4-pole, Sallen-Key LPF. The
filter comprises two identical cascaded Sallen-Key LPF sections,
each with a fixed gain of G = 2. The net gain of the filter is equal
to G = 4 or 12 dB. The actual gain shown in Figure 48 is 12 dB.
This does not take into account the output voltage being divided in
half by the series matching termination resistor, R
load resistor.
Setting the resistors equal to each other greatly simplifies the
design equations for the Sallen-Key filter. To achieve 90 MHz,
the value of R should be set to 182 Ω. However, if the value of R
is doubled, the corner frequency is cut in half to 45 MHz. This
would be an easy way to tune the filter by simply multiplying
the value of R (182 Ω) by the ratio of 90 MHz and the new
corner frequency in megahertz.
+IN1
49.9Ω
R
R
T
R
5.6pF
C2
348Ω
, and the
T
C1
3.9pF
10µF
+5V
0.1µF
U1
10µF
0.1µF
–5V
R2
R1
348Ω
OUT1
Figure 49. 4-Pole, Sallen-Key Low-Pass Filter (ADA4857-2)
Figure 48 shows the output of each stage is of the filter and the
two different filters corresponding to R = 182 Ω and R = 365 Ω.
Resistor values are kept low for minimal noise contribution,
offset voltage, and optimal frequency response. Due to the low
capacitance values used in the filter circuit, the PCB layout and
minimization of parasitics is critical. A few picofarads can detune
the corner frequency, f
of the filter. The capacitor values shown
c
in Figure 49 actually incorporate some stray PCB capacitance.
Capacitor selection is critical for optimal filter performance.
Capacitors with low temperature coefficients, such as NPO
ceramic capacitors and silver mica, are good choices for filter
elements.
15
12
9
6
3
0
–3
–6
–9
–12
–15
–18
–21
MAGNITUDE (d B)
–24
–27
–30
–33
–36
RL = 100Ω
–39
= ±5V
V
S
–42
0.1 1 10 100 500
OUT1, f = 90MHz
OUT1, f = 45MHz
OUT2, f = 90MHz
OUT2, f = 45MHz
FREQUENCY (MHz)
Figure 48. Low-Pass Filter Response
C3
3.9pF
10µF
+5V
0.1µF
R4
348Ω
U2
–5V
10µF
0.1µF
R3
348Ω
R
49.9Ω
T
OUT2
07040-075
R
R
5.6pF
C4
07040-074
Rev. B | Page 17 of 20

ADA4857-1/ADA4857-2 Data Sheet
GAIN FROM
B TO OUTPUT
= –
R2
R1
GAIN FROM
A TO OUTPUT
=
NOISE GAIN =
NG = 1 +
I
N–
V
N
V
N, R1
V
N, R3
R1
R2
I
N+
R3
4kTR2
4kTR1
4kTR3
V
N, R2
B
A
V
N
2
+ 4kTR3 + 4kTR1
R2
2
R1 + R2
I
N+
2
R3
2
+ I
N–
2
R1 × R2
2
+ 4kTR2
R1
2
R1 + R2 R1 + R2
RTI NOISE =
RTO NOISE = NG × RTI NOISE
V
OUT
+
07040-073
R2
R1
)(4kBTR
NOISE
To analyze the noise performance of an amplifier circuit, identify
the noise sources and determine if the source has a significant
contribution to the overall noise performance of the amplifier.
To simplify the noise calculations, noise spectral densities were
used rather than actual voltages to leave bandwidth out of the
expressions (noise spectral density, which is generally expressed
in nV/√Hz, is equivalent to the noise in a 1 Hz bandwidth).
The noise model shown in Figure 50 has six individual noise
sources: the Johnson noise of the three resistors, the op amp
voltage noise, and the current noise in each input of the amplifier.
Each noise source has its own contribution to the noise at the
output. Noise is generally referred to input (RTI), but it is often
easier to calculate the noise referred to the output (RTO) and
then divide by the noise gain to obtain the RTI noise.
Figure 50. Op Amp Noise Analysis Model
All resistors have Johnson noise that is calculated by
where:
k is Boltzmann’s Constant (1.38 × 10
–23
J/K).
B is the bandwidth in Hertz.
T is the absolute temperature in Kelvin.
R is the resistance in ohms.
A simple relationship that is easy to remember is that a 50 Ω
resistor generates a Johnson noise of 1 nV/√Hz at 25°C.
In applications where noise sensitivity is critical, care must
be taken not to introduce other significant noise sources to
the amplifier. Each resistor is a noise source. Attention to the
following areas is critical to maintain low noise performance:
design, layout, and component selection. A summary of noise
performance for the amplifier and associated resistors can be
seen in Table 9.
CIRCUIT CONSIDERATIONS
Careful and deliberate attention to detail when laying out the
ADA4857 board yields optimal performance. Power supply
bypassing, parasitic capacitance, and component selection all
contribute to the overall performance of the amplifier.
PCB LAYOUT
Because the ADA4857 can operate up to 850 MHz, it is essential
that RF board layout techniques be employed. All ground and
power planes under the pins of the ADA4857 should be cleared
of copper to prevent the formation of parasitic capacitance between
the input pins to ground and the output pins to ground. A single
mounting pad on the SOIC footprint can add as much as 0.2 pF
of capacitance to ground if the ground plane is not cleared from
under the mounting pads. The low distortion pinout of the
ADA4857 increases the separation distance between the inputs
and the supply pins, which improves the second harmonics. In
addition, the feedback pin reduces the distance between the output
and the inverting input of the amplifier, which helps minimize
the parasitic inductance and capacitance of the feedback path,
reducing ringing and peaking.
POWER SUPPLY BYPASSING
Power supply bypassing for the ADA4857 was optimized for
frequency response and distortion performance. Figure 42 shows
the recommended values and location of the bypass capacitors.
The 0.1 µF bypassing capacitors should be placed as close as
possible to the supply pins. Power supply bypassing is critical for
stability, frequency response, distortion, and PSR performance.
The capacitor between the two supplies helps improve PSR and
distortion performance. The 10 µF electrolytic capacitors should
be close to the 0.1 µF capacitors; howe ver, it is not as critical. In
some cases, additional paralleled capacitors can help improve
frequency and transient response.
GROUNDING
Ground and power planes should be used where possible. Ground
and power planes reduce the resistance and inductance of the
power planes and ground returns. The returns for the input, output
terminations, bypass capacitors, and R
close to the ADA4857 as possible. The output load ground and the
bypass capacitor grounds should be returned to the same point
on the ground plane to minimize parasitic trace inductance,
ringing, and overshoot and to improve distortion performance.
The ADA4857 LFSCP packages feature an exposed paddle. For
optimum electrical and thermal performance, solder this paddle to
the ground plane or the power plane. For more information on
high speed circuit design, see A Practical Guide to High-Speed
Printed-Circuit-Board Layout at www.analog.com.
should all be kept as
G
Rev. B | Page 18 of 20

Data Sheet ADA4857-1/ADA4857-2
OUTLINE DIMENSIONS
3.25
3.00 SQ
INDICATOR
0.90 MAX
0.85 NOM
SEATING
PLANE
PIN 1
12° MAX
2.75
TOP
VIEW
0.70 MAX
0.65TYP
0.30
0.23
0.18
2.95
2.75 SQ
2.55
0.05 MAX
0.01 NOM
0.20 REF
0.60 MAX
Figure 51. 8-Lead Lead Frame Chip Scale Package [LFCSP_VD]
3 mm × 3 mm Body, Very Thin, Dual Lead (CP-8-2)
Dimensions shown in millimeters
5.00 (0.1968)
4.80 (0.1890)
0.60 MAX
5
EXPOSED
PAD
(BOTT OM VIEW)
0.50
0.40
0.30
4
FOR PROPE R CONNECTION O F
THE EXPOSED PAD, REFER T O
THE PIN CONFIGURATION AND
FUNCTION DE SCRIPTIONS
SECTION OF THIS DATA SHEET.
0.50
BSC
8
1.60
1.45
1.30
1
1.89
1.74
1.59
PIN 1
INDICATOR
72408-B
4.00 (0.1574)
3.80 (0.1497)
0.25 (0.0098)
0.10 (0.0040)
COPLANARITY
0.10
CONTROLL ING DIMENSIONS ARE IN MILLIM E TERS; INCH DIME NS IONS
(IN PARENTHESES) ARE ROUNDED-OFF MILLIMETER EQUIVALENTS FOR
REFERENCE ON LY AND ARE NOT APPROPRIATE FOR USE IN DESIGN.
85
1
1.27 (0.0500)
SEATING
PLANE
COMPLIANT TO JEDEC STANDARDS MS-012-AA
BSC
6.20 (0.2441)
5.80 (0.2284)
4
1.75 (0.0688)
1.35 (0.0532)
0.51 (0.0201)
0.31 (0.0122)
8°
0°
0.25 (0.0098)
0.17 (0.0067)
0.50 (0.0196)
0.25 (0.0099)
1.27 (0.0500)
0.40 (0.0157)
45°
012407-A
Figure 52. 8-Lead Standard Small Outline Package [SOIC_N]
(R-8)
Dimensions shown in millimeters and (inches)
Rev. B | Page 19 of 20

ADA4857-1/ADA4857-2 Data Sheet
COMPLIANT TO JEDEC STANDARDS MO-220-VG GC
2.25
2.10 SQ
1.95
16
5
13
8
9
12
1
4
1.95 BSC
PIN 1
INDICATOR
TOP
VIEW
4.00
BSC SQ
3.75
BSC SQ
COPLANARITY
0.08
(BOTTOM VIEW)
12° MAX
1.00
0.85
0.80
SEATING
PLANE
0.35
0.30
0.25
0.80 MAX
0.65 TYP
0.05 MAX
0.02 NOM
0.20 REF
0.65 BSC
0.60 MAX
0.60 MAX
PIN 1
INDICATOR
0.25 MIN
072808-A
0.75
0.60
0.50
FOR PROP E R CONNECTION OF
THE EXPOSED PAD, REFER TO
THE PIN CO NFIGURATI ON AND
FUNCTIO N DE S CRIPTIONS
SECTION OF THIS DATA SHEET.
ADA4857-2YCPZ-R7
–40°C to +125°C
16-Lead LFCSP_VQ
CP-16-4
1,500
©2008–2011 Analog Devices, Inc. All rights reserved. Trademarks and
Figure 53. 16-Lead Lead Frame Chip Scale Package [LFCSP_VQ]
4 mm × 4 mm Body, Very Thin Quad
(CP-16-4)
Dimensions shown in millimeters
ORDERING GUIDE
Model1 Temperature Range Package Description Package Option Ordering Quantity Branding
ADA4857-1YCPZ-R2 –40°C to +125°C 8-Lead LFCSP_VD CP-8-2 250 H15
ADA4857-1YCPZ-RL –40°C to +125°C 8-Lead LFCSP_VD CP-8-2 5,000 H15
ADA4857-1YCPZ-R7 –40°C to +125°C 8-Lead LFCSP_VD CP-8-2 1,500 H15
ADA4857-1YRZ –40°C to +125°C 8-Lead SOIC_N R-8 98
ADA4857-1YRZ-R7 –40°C to +125°C 8-Lead SOIC_N R-8 2,500
ADA4857-1YRZ-RL –40°C to +125°C 8-Lead SOIC_N R-8 1,000
ADA4857-1YR-EBZ Evaluation Board
ADA4857-1YCP-EBZ Evaluation Board
ADA4857-2YCPZ-R2 –40°C to +125°C 16-Lead LFCSP_VQ CP-16-4 250
ADA4857-2YCPZ-RL –40°C to +125°C 16-Lead LFCSP_VQ CP-16-4 5,000
ADA4857-2YCP-EBZ Evaluation Board
1
Z = RoHS Compliant Part.
registered trademarks are the property of their respective owners.
D07040-0-8/11(B)
Rev. B | Page 20 of 20
 Loading...