

A1
V
IN
CLK CLK
A2
SWITCH
50V
AD9100
62.3V
CLAMP
C
HOLD
22pF
V
OUT
Ultrahigh Speed
a
FEATURES
Excellent Hold Mode Distortion into 250 V
–88 dB @ 30 MSPS (2.3 MHz VIN)
–83 dB @ 30 MSPS (12.1 MHz V
–74 dB @ 30 MSPS (19.7 MHz V
16 ns Acquisition Time to 0.01%
<1 ps Aperture Jitter
250 MHz Tracking Bandwidth
83 dB Feedthrough Rejection @ 20 MHz
3.3 nV/√Hz Spectral Noise Density
MlL-STD-Compliant Versions Available
APPLICATIONS
A/D Conversion
Direct IF Sampling
Imaging/FLIR Systems
Peak Detectors
Radar/EW/ECM
Spectrum Analysis
CCD ATE
GENERAL DESCRIPTION
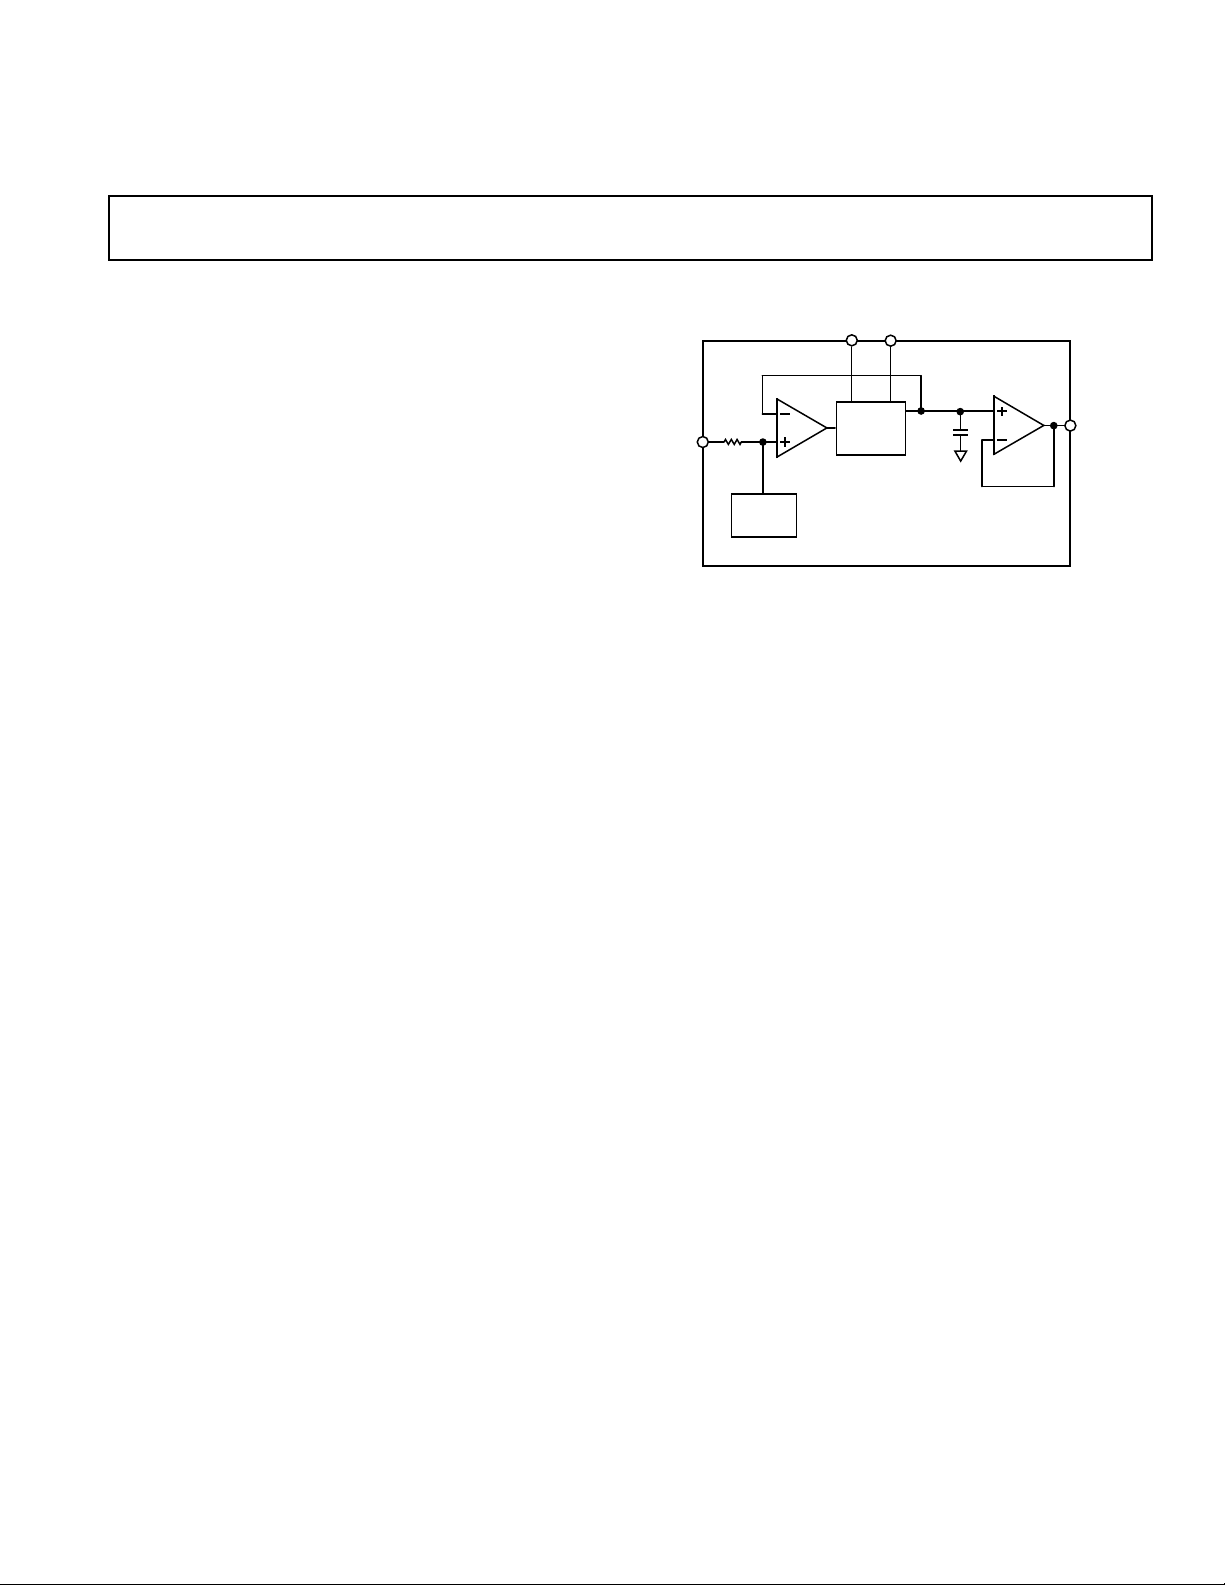
The AD9100 is a monolithic track-and-hold amplifier which
sets a new standard for high speed and high dynamic range
applications. It is fabricated in a mature high speed complementary bipolar process. In addition to innovative design topologies,
a custom package is utilized to minimize parasitics and optimize
dynamic performance.
Acquisition time (hold to track) is 13 ns to 0.1% accuracy, and
16 ns to 0.01%. The AD9100 boasts superlative hold-mode
frequency domain performance; when sampling at 30 MSPS
hold mode distortion is less than 83 dBfs for analog frequencies
up to 12 MHz; and –74 dBfs at 20 MHz. The AD9100 can also
drive capacitive loads up to 100 pF with little degradation in
acquisition time; it is therefore well suited to drive 8- and 10-bit
flash converters at clock speeds to 50 MSPS. With a spectral
noise density of 3.3 nV/√Hz and feedthrough rejection of 83 dB
at 20 MHz, the AD9100 is well suited to enhance the dynamic
range of many 8- to 16-bit systems.
)
IN
)
IN
Monolithic Track-and-Hold
AD9100*
FUNCTIONAL BLOCK DIAGRAM
The AD9100 is “user friendly” and easy to apply: (1) it requires
+5 V/–5.2 V power supplies; (2) the hold capacitor and switch
power supply decoupling capacitors are built into the DIP package; (3) the encode clock is differential ECL to minimize clock
jitter; (4) the input resistance is typically 800 kΩ; (5) the analog
input is internally clamped to prevent damage from voltage
transients.
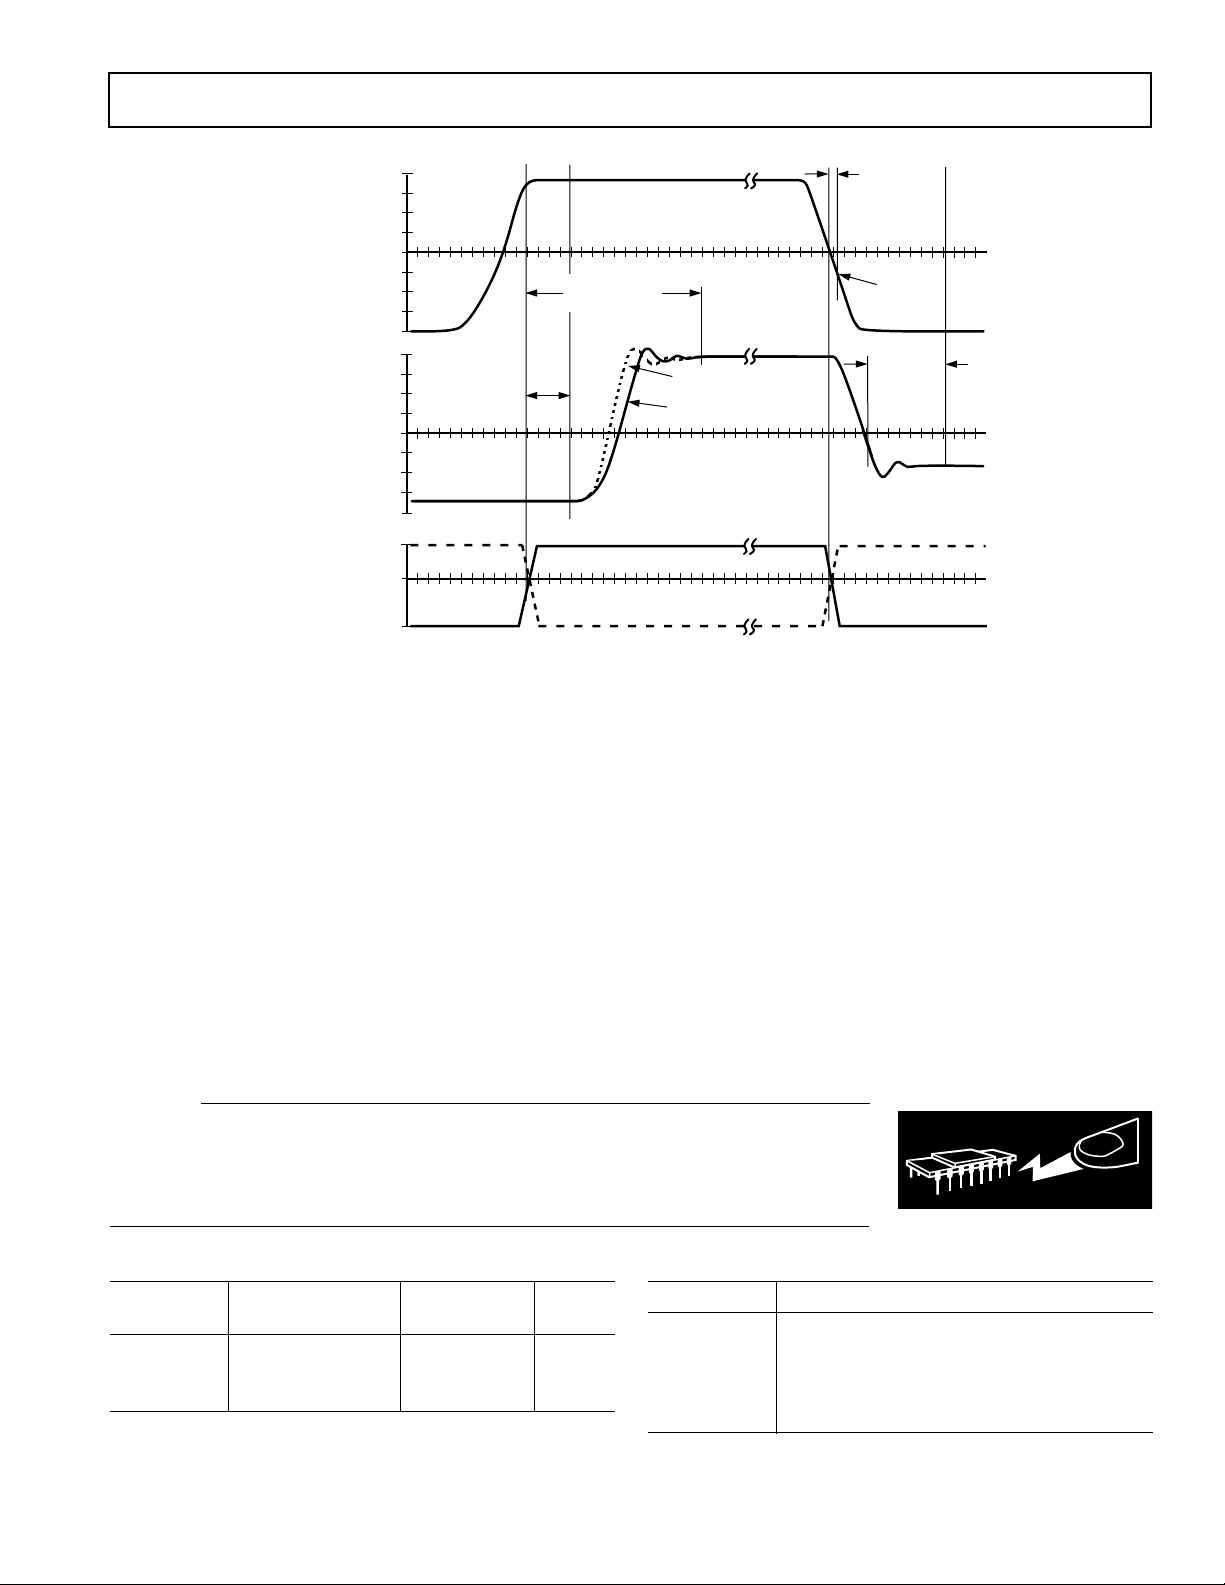
The AD9100 is available in a 20-lead side-brazed “skinny DIP”
package. Commercial, industrial, and military temperature
grade parts are available. Consult the factory for information
about the availability of 883-qualified devices.
PRODUCT HIGHLIGHTS
1. Hold Mode Distortion is guaranteed.
2. Monolithic construction.
3. Analog input is internally clamped to protect against overvoltage transients and ensure fast recovery.
4. Output is short circuit protected.
5. Drives capacitive loads to 100 pF.
6. Differential ECL clock inputs.
*Patent pending.
REV. B
reliable. However, no responsibility is assumed by Analog Devices for its
use, nor for any infringements of patents or other rights of third parties
which may result from its use. No license is granted by implication or
otherwise under any patent or patent rights of Analog Devices.
Information furnished by Analog Devices is believed to be accurate and
One Technology Way, P.O. Box 9106, Norwood, MA 02062-9106, U.S.A.
Tel: 781/329-4700 World Wide Web Site: http://www.analog.com
Fax: 781/326-8703 © Analog Devices, Inc., 1998
AD9100–SPECIFICATIONS
ELECTRICAL CHARACTERISTICS
(unless otherwise noted, +VS = +5 V; –VS = –5.2 V; R
Test AD9100JD/AD/SD
= 100 V; RIN = 50 V)
LOAD
1
Parameter Conditions Temp Level Min Typ Max Units
DC ACCURACY
Gain ∆V
Offset V
= 2 V Full VI 0.989 0.994 V/V
IN
= 0 V Full VI –5 ±1+5mV
IN
Output Resistance 25°C V 0.4 Ω
Output Drive Capability Full VI ±40 ±60 mA
PSRR ∆V
= 0.5 V p-p Full VI 48 55 dB
S
Pedestal Sensitivity to Supply ∆VS = 0.5 V p-p Full VI 0.9 3 mV/V
ANALOG INPUT/OUTPUT
Output Voltage Range Full VI +2 ±2.2 –2 V
Input Bias Current 25°CVI–8±3+8µA
Input Overdrive Current
2
VIN = ±4 V; RIN = 50 Ω 25°CV ±22 mA
Full VI –16 +16 µA
Input Capacitance 25°C V 1.2 pF
Input Resistance 25°C, T
T
CLOCK/
CLOCK INPUTS
Input Bias Current CL/
Input Low Voltage (V
) Full VI –1.8 –1.5 V
IL
CL = –1.0 V Full VI 4 5 mA
MIN
VI 350 800 kΩ
MAX
VI 200 kΩ
Input High Voltage (VIH) Full VI –1.0 –0.8 V
TRACK MODE DYNAMICS
Bandwidth (–3 dB) V
≤ 0.4 V p-p Full IV 150 250 MHz
OUT
Slew Rate 4 V Step 25°C IV 550 850 V/µs
Overdrive Recovery Time
2
(to 0.1%) VIN = ±4 V to 0 V 25°CV 21 ns
4 V Step Full IV 500 V/µs
2nd Harm. Dist. (20 MHz, 2 V p-p) Full V –65 dBc
3rd Harm. Dist. (20 MHz, 2 V p-p) Full V –75 dBc
Integrated Output Noise (1-200 MHz) 25°CV 45 µV
RMS Spectral Noise @ 10 MHz 25°C V 3.3 nV/√Hz
HOLD MODE DYNAMICS
Worst Harmonic (2.3 MHz, 30 MSPS) V
Worst Harmonic (12.1 MHz, 30 MSPS) V
Worst Harmonic (12.1 MHz, 30 MSPS) V
Worst Harmonic (12.1 MHz, 30 MSPS) V
Worst Harmonic (19.7 MHz, 30 MSPS) V
Hold Noise
Droop Rate
3
4
= 2 V p-p 25°C V –83 dBfs
OUT
= 2 V p-p 25°C IV –80 –72 dBfs
OUT
= 2 V p-p T
OUT
= 2 V p-p T
OUT
= 2 V p-p 25°C V –74 dBfs
OUT
MAX
MIN
25°C V 300 3 t
IV –70 dBfs
IV –77 –68 dBfs
H
V/s rms
VIN = 0 V 25°CVI 110±mV/µs
T
T
MIN
MAX
VI 7 40 ±mV/µs
VI 5 30 ±mV/µs
Feedthrough Rejection (20 MHz) VIN = 2 V p-p Full V 83 dB
TRACK-TO-HOLD SWITCHING
Aperture Delay 25°C V +800 ps
Aperture Jitter 25°CV <1ps
Pedestal Offset V
= 0 V 25°CVI–8±1+8mV
IN
Full VI –10 +10 mV
Transient Amplitude VIN = 0 V Full V ±6mV
Settling Time to 1 mV Full IV 7 10 ns
Glitch Product VIN = 0 V 25°C V 15 pV-s
HOLD-TO-TRACK SWITCHING
Acquisition Time to 0.1% 2 V Step 25°CV 13 ns
Acquisition Time to 0.01% 2 V Step Full IV 16 23 ns
Acquisition Time to 0.01% 4 V Step 25°CV 20 ns
POWER SUPPLY
Power Dissipation Full VI 1.05 1.25 W
Current Full VI 96 118 mA
+V
S
–VS Current Full VI 116 132 mA
NOTES
1
AD9100JD: 0°C to +70°C. AD9100AD: –40°C to +85°C. AD9100SD: –55°C to +125°C. DIP θJA = 38°C/W; this is valid with the device mounted flush to a
grounded 2 oz. copper clad board with 16 sq. inches of surface area and no air flow.
2
The input to the AD9100 is internally clamped at ±2.3 V. The internal input series resistance is nominally 50 Ω.
3
Hold mode noise is proportional to the length of time a signal is held. For example, if the hold time (tH) is 20 ns, the accumulated noise is typically 6 µV (300 V/s 3
20 ns). This value must be combined with the track mode noise to obtain total noise.
4
Min and max droop rates are based on the military temperature range (–55°C to +125°C). Refer to the “Droop Rate vs Temperature” chart for min/max limits over
the commercial and industrial ranges.
Specifications subject to change without notice.
–2–
REV. B
AD9100
WARNING!
ESD SENSITIVE DEVICE
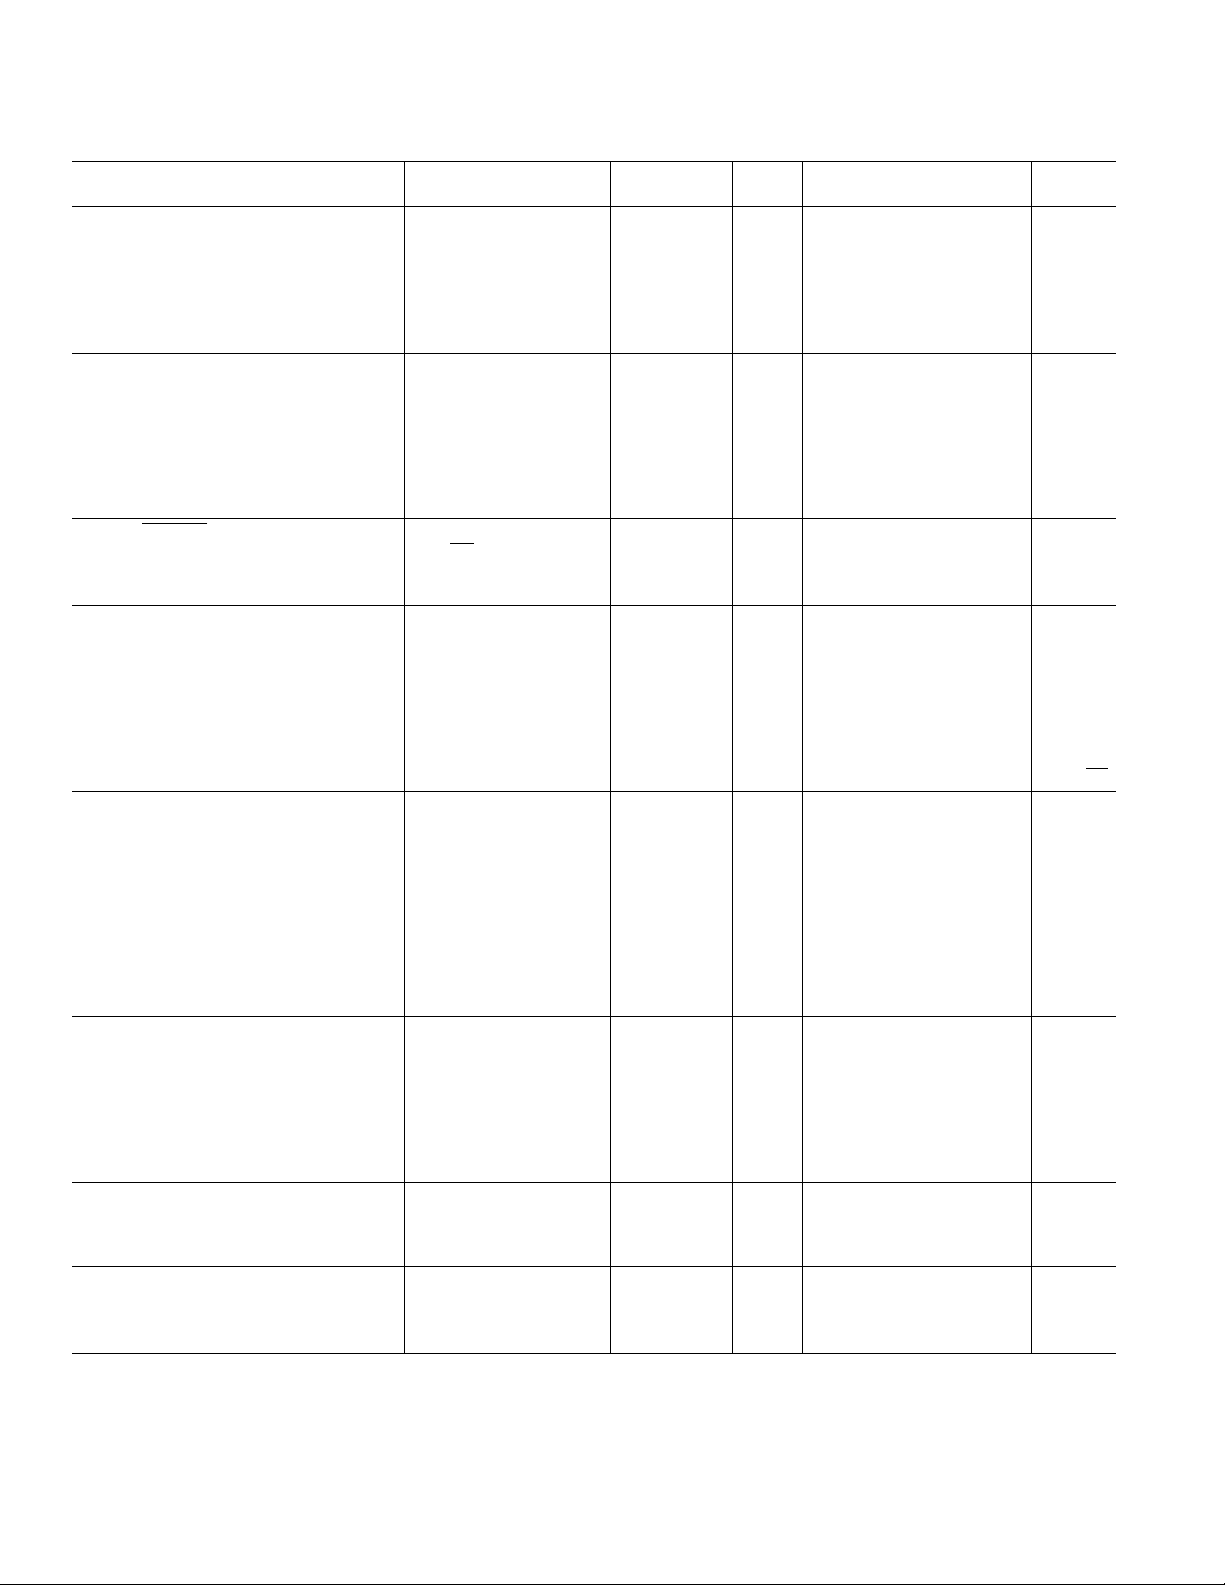
+2V
ANALOG
0V
INPUT
ACQUISITION TIME
(16ns)
TO
HOLD CAPACITOR/
ANALOG OUTPUT
CLOCK
INPUTS
–2V
+2V
0V
–2V
"1"
"0"
"HOLD"
CLOCK (PIN #19)
HOLD
TRACK
SWITCH
DELAY
TIME
(4ns)
Figure 1. Timing Diagram (1 ns/div)
ABSOLUTE MAXIMUM RATINGS
1
Supply Voltages (±VS) . . . . . . . . . . . . . . . . . . . . . . . . . . . ±6 V
Continuous Output Current . . . . . . . . . . . . . . . . . . . . . 70 mA
Analog Input Voltage
2
. . . . . . . . . . . . . . . . . . . . . . . . . . . ±5 V
Operating Temperature Range (Case)
AD9100JD . . . . . . . . . . . . . . . . . . . . . . . . . . . 0°C to +70°C
AD9100AD . . . . . . . . . . . . . . . . . . . . . . . . .–25°C to +85°C
AD9100SD . . . . . . . . . . . . . . . . . . . . . . . .–55°C to +125°C
Junction Temperature . . . . . . . . . . . . . . . . . . . . . . . . . +175°C
Storage Temperature . . . . . . . . . . . . . . . . . . .–65°C to +150°C
Lead Soldering Temperature (10 sec) . . . . . . . . . . . . . +300°C
NOTES
1
Absolute maximum ratings are limiting values to be applied individually, and
beyond which the serviceability of the circuit may be impaired. Functional
operability is not necessarily implied. Exposure to absolute maximum rating
conditions for an extended period of time may affect device reliability.
2
Analog input voltage should not exceed ±VS.
APERTURE
DELAY
(0.8ns)
VOLTAGE
LEVEL HELD
TRACK TO
OBSERVED AT
HOLD CAPACITOR
OBSERVED AT
ANALOG OUTPUT
"TRACK"
CLOCK
HOLD
SETTLING
(7ns)
"HOLD"
EXPLANATION OF TEST LEVELS
Test Level
I – 100% production tested.
II – 100% production tested at +25°C, and sample tested at
specified temperatures.
III – Periodically sample tested.
IV – Parameter is guaranteed by design and characterization
testing.
V – Parameter is a typical value only.
VI – All devices are 100% production tested at +25°C. 100%
production tested at temperature extremes for extended
temperature devices; sample tested at temperature
extremes for commercial/industrial devices.
CAUTION
ESD (electrostatic discharge) sensitive device. Electrostatic charges as high as 4000 V readily
accumulate on the human body and test equipment and can discharge without detection.
Although the AD9100 features proprietary ESD protection circuitry, permanent damage may
occur on devices subjected to high energy electrostatic discharges. Therefore, proper ESD
precautions are recommended to avoid performance degradation or loss of functionality.
ORDERING GUIDE
Temperature Package Package
Model* Range Description Option
AD9100JD 0°C to +70°C Ceramic DIP D-20
AD9100AD –40°C to +85°C Ceramic DIP D-20
AD9100SD –55°C to +125°C Ceramic DIP D-20
*Consult factory about availability of parts screened to MIL-STD-883.
REV. B
–3–
EVALUATION BOARD ORDERING INFORMATION
Part Number Description
AD9100/PWB Printed Wiring Board (Only) of Evaluation
Circuit
AD9100/PCB Evaluation Board for AD9100T/H, Assembled
and Tested [Order AD9100T/H (DIP)
Separately]
AD9100
PIN FUNCTION DESCRIPTIONS/CONNECTIONS
Pin No. Description Connection
1–V
S
–5.2 V Power Supply
2, 3, 8, 10–13, 17 GND Common Ground Plane
4V
5, 7 –V
IN
S
Analog Input Signal
–5.2 V Power Supply
6, 15 BYPASS 0.1 µF to Ground
9V
14, 16, 20 +V
18
OUT
S
CLK Complement ECL Clock
Track-and-Hold Output
+5 V, Power Supply
19 CLK “True” ECL Clock
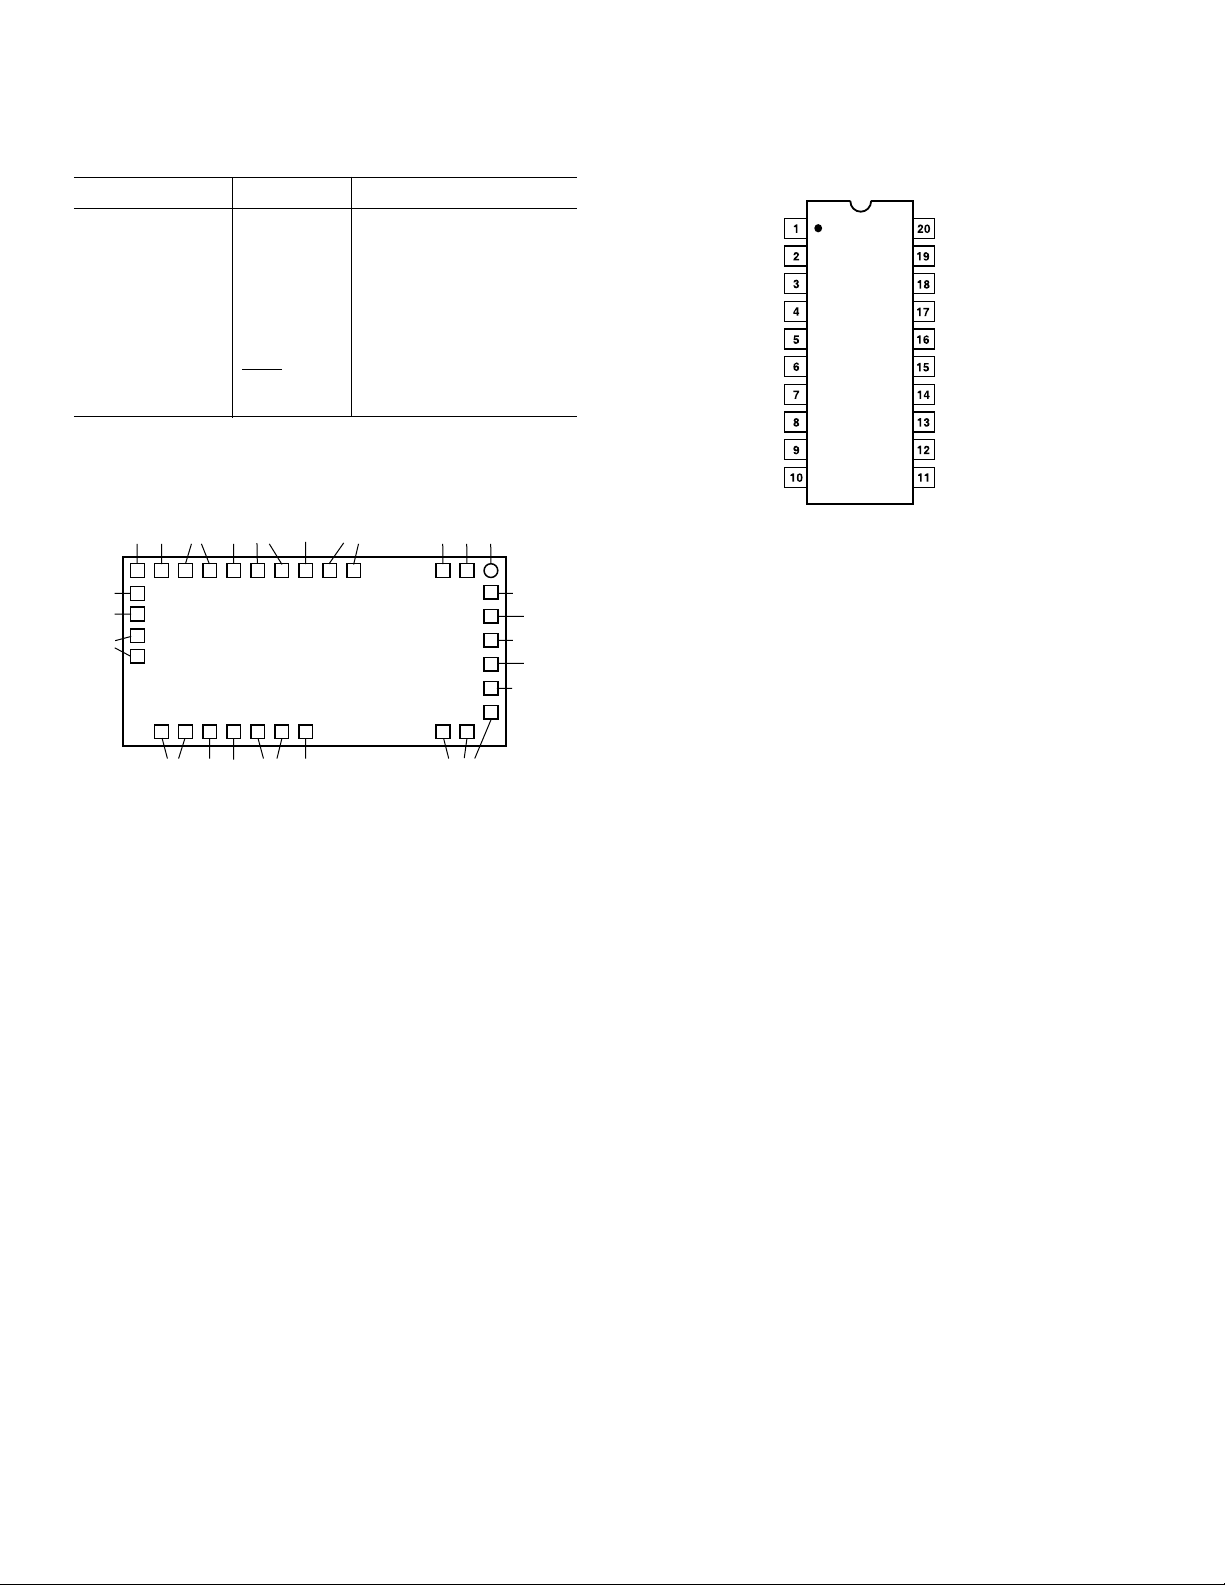
CHIP PAD ASSIGNMENTS
+VS CAP
(NOTE 1)
AD9100
TOP VIEW
(Not to scale)
–VS CAP
(NOTE 1)
HOLD CAP
(NOTE 3)
+VS+V
S
NC
23456789101112
113
32
+V
S
BYPASS
31
(NOTE 2)
+V
30
OUT
BYPASS
29
(NOTE 2)
28
+V
S
27
–V
S
+VS+V
NC
S
14
CLOCK
15
CLOCK
16
GND
17
18 19 20 21 22 23 24 25 26
–V
S
SIZE = 148 3 63 3 15 mils NC = NO CONNECT
NOTES:
1. SUPPLY BYPASS CAPACITOR; 0.01 TO 0.1mF CERAMIC
CONNECTED TO GROUND.
2. 0.01mF CERAMIC CONNECTED BETWEEN PAD 29 AND PAD 31.
3. HOLD CAPACITOR CONNECTED FROM PAD 4 AND PAD 5 TO
GROUND; 10–100pF, NOMINALLY 22pF. DIP PACKAGE DOES NOT
REQUIRE EXTERNAL HOLD CAPACITOR.
+V
GND
S
NC
–V
–V
S
IN
PIN CONFIGURATION
20-Lead Side-Brazed Ceramic DIP
–V
S
GND
GND
V
IN
S
S
AD9100
TOP VIEW
(Not to Scale)
–V
BYPASS
–V
GND GND
V
OUT
GND GND
+V
S
CLK
CLK
GND
+V
S
BYPASS
+V
S
GND
TERMINOLOGY
Analog Delay is the time required for an analog input signal to
propagate from the device input to output.
Aperture Delay tells when the input signal is actually sampled.
It is the time difference between the analog propagation delay of
the front-end buffer and the control switch delay time. (The
time from the hold command transition to when the switch is
opened.) For the AD9100, this is a positive value which means
that the switch delay is longer than the analog delay.
Aperture Jitter is the random variation in the aperture delay.
This is measured in ps-rms and results in phase noise on the
held signal.
Droop Rate is the change in output voltage as a function of
time (dV/dt). It is measured at the AD9100 output with the
device in hold mode and the input held at a specified dc value,
the measurement starts immediately after the T/H switches from
track to hold. Feedthrough Rejection is the ratio of the input
signal to the output signal when in hold mode. This is a measure of how well the switch isolates the input signal from feeding
through to the output.
Hold-to-Track Switch Delay is the time delay from the track
command to the point when the output starts to change and
acquire a new signal.
Pedestal Offset is the offset voltage step measured immediately
after the AD9100 is switched from track to hold with the input
held at zero volts. It manifests itself as an added offset during
the hold time.
Track-to-Hold Settling Time is the time necessary for the
track to hold switching transient to settle to within 1 mV of its
final value.
Track-to-Hold Switching Transient is the maximum peak
switch induced transient voltage which appears at the AD9100
output when it is switched from track to hold.
–4–
REV. B

50
0
100
30
10
20
20
0
40
806040
C – pF
LOAD
R
S
– V
NO RS NEEDED WHEN
C
L
IS LESS THAN 6pF
R
S
C
L
1kV
AD9100
0
–5
GAIN – dB
–10
INPUT FREQUENCY – MHz
30060DC 240180120
Figure 2. Gain vs. Frequency (Track
Mode)
–95
–90
VO = 2V p-p
ENCODE = 30 MSPS
RL = 250V
Typical Performance Characteristics–AD9100
60
50
40
30
PSRR – dB
20
10
Figure 3. Power Supply Rejection
Ratio vs. Frequency
60
DC
INPUT FREQUENCY – MHz
240180120
300
Figure 4. Recommended RS vs. C
for Optimal Settling Times
50
40
TRACK
LOAD
TRACK
HOLD
–85
dBc
–80
–75
–70
0
RL = 100V
4
INPUT FREQUENCY – MHz
20
16128
Figure 5. Worst Hold Mode Harmonic
vs. Analog Input Frequency
58
53
AD9060
48
AIN = 3.5V p-p
ENCODE = 40 MSPS
SNR, INCLUDING HARMONICS – dB
43
DC
AD9060 + AD9100
C
HOLD
C
HOLD
10 20 30
INPUT FREQUENCY – MHz
= 22pF
= 10pF
40
Figure 8. SNR vs. Analog Input
105
95
BEYOND
CAPABILITY
85
OF AVAILABLE
MEASUREMENT
dB
TOOLS
75
65
55
INPUT FREQUENCY – MHz
100212010
Figure 11. Feedthrough Rejection vs.
Input Frequency
REV. B
30
mV/ms
20
10
0
–50
TYPICAL
WORST CASE
+25
0
TEMPERATURE – 8C
+75
+125
Figure 6. Magnitude of Droop Rate
vs. Temperature
AD9100
10
FFT
PROC
CH*
27V
AD9060
A
IN
THE AD9060 IS A 10-BIT, 75MSPS MONOLITHIC
ADC FROM ANALOG DEVICES.
*
THE AD9100XD (DIP) HAS AN INTERNAL 22pF
HOLD CAPACITOR.
Figure 9.
1.0
V
= 2V STEP
OUT
0.1
0.01
% OF FULL SCALE
0.001
10
12 16 1814
ns
Figure 12. Settling Tolerance vs.
Acquisition Time
–5–
CLK
2mV/DIV
10ns
CLK
100ns/DIV
Figure 7. Track-to-Hold-to-Track Switch
Transients
58
56
54
52
AIN = 3.5V p-p
SNR, INCLUDING HARMONICS – dB
ENCODE = 20 MSPS
50
DC 20
AD9060 + AD9100
C
AD9060
5
INPUT FREQUENCY – MHz
Figure 10. SNR vs. Analog Input
20
10ns
HOLD
C
HOLD
= 10pF
= 22pF
1510

AD9100
THEORY OF OPERATION
The AD9100 utilizes a new track and hold architecture. Previous commercially available high speed track and holds used an
open loop input buffer, followed by a diode bridge, hold capacitor, and output buffer (closed or open loop) with a FET device
connected to the hold capacitor. This architecture required
mixed device technology and, usually, hybrid construction. The
sampling rate of these hybrids has been limited to 20 MSPS for
12-bit accuracy. Distortion generated in the front-end amplifier/
bridge limited the dynamic range performance to the “mid-70
dBfs” for analog input signals of less than 10 MHz. Broadband
and switch-generated noise limited the SNR of previous track
and holds to about 70 dB.
The AD9100 is a monolithic device using a high frequency
complementary bipolar process to achieve new levels of high
speed precision. Its patent pending architecture breaks from the
traditional architecture described above. (See the block diagram
on the first page.) The switching type bridge has been integrated
into the first stage closed loop input amplifier. This innovation
provides error (distortion) correction for both the switch and
amplifier, while still achieving slew rates representative of an
open-loop design. In addition, acquisition slew current for the
hold capacitor is higher than standard diode bridge and switch
configurations, removing a main contributor to the limits of
maximum sampling rate and input frequency.
Switching circuits in the device use current steering (versus
voltage switching) to provide improved isolation between the
switch and analog sections. This results in low aperture time
sensitivity to the analog input signal, and reduced power supply
and analog switching noise. Track to hold peak switching transient is typically only 6 mV and settles to less than 1 mV in 7 ns.
In addition, pedestal sensitivity to analog input voltage is very
low (0.6 mV/V) and being first order linear does not significantly
affect distortion.
The closed-loop output buffer includes zero voltage bias current
cancellation, which results in high-temperature droop rates
equivalent to those found in FET type inputs. The buffer also
provides first order quasistatic bias correction resulting in an
extremely high input resistance and very low droop sensitivity vs.
input voltage level (typically less than 1.5 mV/V–µs.) This
closed-loop architecture inherently provides high speed loop
correction and results in low distortion under heavy loads.
The extremely fast time constant linearity (7 ns to 0.01% for a
2 V step) ensures that the output buffer does not limit the
AD9100 sampling rate or analog input frequency. (The acquisition and settling time are primarily limited only by the input
amplifier and switch.) The output is transparent to the overall
AD9100 hold mode distortion levels for loads as low as 250 Ω.
Full-scale track and acquisition slew rates achieved by the
AD9100 are 800 and 1000 V/µs, respectively. When combined
with excellent phase margin (typically 5% overshoot), wide
bandwidth, and dc gain accuracy, acquisition time to 0.01% is
only 16 ns. Though not production tested, settling to 14-bit
accuracy (–86 dB distortion @ 2.3 MHz) can be inferred to be
20 ns.
Acquisition Time
Acquisition time is the amount of time it takes the AD9100 to
reacquire the analog input when switching from hold to track
mode. The interval starts at the 50% clock transition point and
ends when the input signal is reacquired to within a specified
error band at the hold capacitor.
The hold to track switch delay (t
t) cannot be subtracted
DH
from this acquisition time because it is a charging time delay
that occurs when moving from hold to track; this is typically
4 ns to 6 ns and is the longest delay. Therefore, the track time
required for the AD9100 is the acquisition time minus the aperture delay time. Note that the acquisition time is defined as the
settled voltage at the hold capacitor and does not include the
delay and settling time of the output buffer. The example below
illustrates why the output buffer amplifier does not contribute to
the overall AD9100 acquisition time.
V
IN
INPUT
BUFFER
V
CH
V
OUT
t
DHT
6ns
TRACK
TIME
V
CH
OUTPUT
C
H
ACQUISITION TIME AT
TO X%
C
H
BUFFER
t
S
HOLD
V
OUT
PEAK TRANSIENT
SEEN BY OUTPUT
BUFFER
Figure 13. Acquisition Time Diagram
The exaggerated illustration in Figure 13 shows that VCH has
settled to within x% of its final value, but V
(due to slew rate
OUT
limitations, finite BW, power supply ringing, etc.) has not
settled during the track time. However, since the output buffer
always “tracks” the front end circuitry, it “catches up” during
the hold time and directly superimposes itself (less about 600 ps
of analog delay) to V
. Since the small-signal settling time of
CH
the output buffer is about 1.8 ns to ± 1 mV and is significantly
less than the specified hold time, acquisition time should be
referenced to the hold capacitor.
Note that most of the hold settling time and output acquisition
time are due to the input buffer and the switch network. For
track time, the output buffer contributes only about 5 ns of the
total; in hold mode, it contributes only 1.8 ns (as stated above).
A stricter definition of acquisition time would total the acquisition and hold times to a defined accuracy. To obtain 12 bit +
distortion levels and 30 MSPS operation, the recommended
track and hold times are 20 ns and 13.5 ns, respectively. To
drive an 8-bit flash converter with a 2 V p-p full-scale input,
hold time to 1 LSB accuracy will be limited primarily by the
encoder, rather than by the AD9100. This makes it possible to
reduce track time to approximately 13 ns, with hold time chosen
to optimize the encoder’s performance.
–6–
REV. B

AD9100
Hold vs. Track Mode Distortion
In many traditional high speed, open loop track-and-holds,
track mode distortion is often much better than hold mode
distortion. Track mode distortion does not include nonlinearities due to the switch network, and does not correlate to the
relevant hold mode distortion. But since hold mode distortion
has traditionally been omitted from manufacturer’s specification
tables, users have had to discover for themselves the effective
overall hold mode distortion of the combined T/H and encoder.
The architecture of the AD9100 minimizes hold mode distortion
over its specified frequency range. As an example, in track mode
the worst harmonic generated for a 20 MHz input tone is typically –65 dBfs. In hold mode, under the same conditions
and sampling at 30 MSPS, the worst harmonic generated is
–74 dBfs. The reason is the output buffer in hold mode has only
dc distortion relevancy. With its inherent linearity (7 ns settling
to 0.01%), the output buffer has essentially settled to its dc
distortion level even for track plus hold times as short as 30 ns.
For a traditional open-loop output buffer, the ac (track mode)
and dc (hold mode) distortion levels are often the same.
Droop Rate
Droop rate does not necessarily affect a track and hold’s distortion characteristics. If the droop rate is constant versus the input
voltage for a given hold time, it manifests itself as a dc offset to
the encoder. For the AD9100, the droop rate is typically
±1 mV/µs. If a signal is held for 1 µs, a subsequent encoder
would see a 1 mV offset voltage. If there is no droop sensitivity
to the held voltage value, the 1 mV offset would be constant
and “ride” on the input signal and introduce no hold-mode
nonlinearities .
In instances in which droop rate varies proportionately to the
magnitude of the held voltage signal level, a gain error only is
introduced to the A/D encoder. The AD9100 has a droop sensitivity to the input level of 1.5 mV/ V–µs. For a 2 V p-p input
signal, this translates to a 0.15%/µs gain error and does not
cause additional distortion errors.
For the AD9100, droop sensitivity to input level is insignificant.
However, hold times longer than about 2 µs can cause distortion due
to the R 3 C
time constant at the hold capacitor. In addition,
H
hold mode noise will increase linearly vs. hold time and thus
degrade SNR performance.
Layout Considerations
For best performance results, good high speed design techniques must be applied. The component (top) side ground
plane should be as large as possible; two-ounce copper cladding
is preferable. All runs should be as short as possible, and decoupling capacitors must be used.
Figure 14 is the schematic of a recommended AD9100 evaluation board. (Contact factory concerning availability of assembled
boards.) All 0.01 µF decoupling capacitors should be low induc-
tance surface mount devices (P/N 05085C103MT050 from
AVX) and connected on the component side within 30 mils of
the designated pins; with the other sides soldered directly to the
top ground plane.
J6J5
J7
C10
C9
+V
S
+
C13
10mF
C5
TP3
C6
C7
C8
R4
Q
Q
510V
R5
510V
–5.2V
–V
S
C14
10mF
C1
TP1
J1
V
IN
50V
J2
V
OUT
J3
V
BUFF
AD9620
CLOCK
IN
+5V
NOTE:
CONNECT TO W1 FOR TTL CLOCK SIGNALS;
CONNECT TO W2 FOR GROUND-REFERENCED SIGNALS.
C2
R
IN
C3
C4
R
5V
R
L
2kV
R1
100V
R2
W1
6V
W2
R3
4V
AD9100
DUT
(DIP)
S
+V
S–VS
AD96685
LE
Figure 14. AD9100/PCB Evaluation Board Diagram
The 10 µF low frequency power supply tantalum decoupling
capacitors should be located within 1.5 inches of the AD9100.
The common 0.01 µF supply capacitors can be wired together.
The common power supply bus (connected to the 10 µF capaci-
tor and power supply source) can be routed to the underside of
the board to the daisy chain wired 0.01 µF supply capacitors.
For remote input and/or output drive applications, controlled
impedances are required to minimize line reflections which will
reduce signal fidelity. When capacitive and/or high impedance
levels are present, the load and/or source should be physically
located within approximately one inch of the AD9100. Note
that a series resistance, R
6 pF. (The Recommended R
Performance Section” shows values of R
, is required if the load is greater than
S
vs. CL chart in the “Typical
S
for various capacitive
S
loads which result in no more than a 20% increase in settling
time for loads up to 80 pF.) As much of the ground plane as
possible should be removed from around the V
and V
IN
OUT
pins
to minimize coupling onto the analog signal path.
While a single ground plane is recommended, the analog signal
and differential ECL clock ground currents follow a narrow path
directly under their common voltage signal line. To reduce
reflections, especially when terminations are used for transmission
line efficiency, the clock, V
, and V
IN
signals and respective
OUT
ground paths should not cross each other; if they do, unwanted
coupling can result.
High current ground transients via the high frequency decoupling capacitors can also cause unwanted coupling to the V
and V
current loops. Therefore, these analog terminations
OUT
IN
should be kept as far as possible from the power supply decoupling capacitors to minimize feedthrough.
REV. B
–7–

AD9100
Using Sockets
Pin sockets (P/N 6-330808-3 from AMP) should be used if the
device can not be soldered directly to the PCB. High profile or
wire wrap type sockets will dramatically reduce the dynamic
performance of the device in addition to increasing the case-toambient thermal resistance.
Driving the Encode Clock
The AD9100 requires a differential ECL clock command. Due
to the high gain bandwidth of the AD9100 internal switch, the
input clock should have a slew rate of at least 100 V/µs.
To obtain maximum signal to noise performance, especially at
high analog input frequencies, a low jitter clock source is required. The AD9100 clock can be driven by an AD96685, an
ultrahigh speed ECL comparator with very low jitter.
ANALOG
INPUT
AD9100
AD9620
INTO LOW
RESISTIVE
LOAD
Figure 16. Using AD9620 as Isolation Amplifier
Direct IF Conversion
The AD9100 can be used to sample super-Nyquist signals,
making wide dynamic range direct IF to digital conversion practical. By reducing the analog input level to the track and hold,
distortion due to the AD9100 can be minimized. As the input
level is reduced, the gain in the output amplifier (see Figure 17)
must be increased to match the full scale level of the subsequent
analog-to-digital converter.
POST-AMP
CLK
Figure 15. Clock/
1kV
–5.2V
Clock
150V150V
1kV
–5.2V
Input Stage
CLK
Driving the Analog Input
Special care must be taken to ensure that the analog input signal
is not compromised before it reaches the AD9100. To obtain
maximum signal to noise performance, a very low phase noise
analog source is required. In addition, input filtering and/or a
low harmonic signal source is necessary to maximize the spurious free dynamic range. Any required filtering should be done
close to the AD9100 and away from any digital lines.
Overdriving the Analog Input
The AD9100 has input clamps that prevent hard saturation of
the output buffer, thereby providing fast overvoltage recovery
when the analog input transitions to the linear region (±2 V).
The clamps are set internally at ±2.3 V and cannot be altered by
the user. The output settles to 0.1% of its value 21 ns after the
overvoltage condition is alleviated. When the analog input is
outside the linear region, the analog output will be at either
+2.2 V or –2.2 V.
Matching the AD9100 to A/D Encoders
The AD9100’s analog output level may have to be offset or
amplified to match the full-scale range of a given A/D converter.
This can generally be accomplished by inserting an amplifier
after the AD9100. For example, the AD671 is a 12-bit 500 ns
monolithic ADC encoder that requires a 0 to +5 V full-scale
analog input. An AD84X series amplifier could be used to condition the AD9100 output to match the full-scale range of the
AD671.
Ultralow Distortion/Low Resistive Load Applications
When driving low resistive loads or when the widest possible
spurious free dynamic range is required, system performance
can be improved by isolating the load from the AD9100. (See
Figure 16.) The AD9620 low distortion closed-loop buffer
amplifier has an input resistance of 800 kΩ and generates harmonics that are less than those generated by the AD9100. Other
buffers should not be considered if their harmonics are not
lower than those of the AD9100.
IF INPUT
6100 mV
T/H CLOCK
ADC CLOCK
AD9100
GAIN ADJ TO
20ns
UTILIZE MAX
ADC RANGE
5ns
T/H CLOCK ADC CLOCK
TRACK
HOLD
"1"
"0"
ADCAD9618
Figure 17. IF Sampling with Track-and-Hold
This technique is not confined to processing Nyquist signals.
Figure 18 illustrates the spurious free dynamic range of the
AD9100 as a function of analog input signal level and frequency.
Without the output amplifier (2 V p-p input), 70 dB+ dynamic
range is observed only to about 24 MHz. By reducing the
analog input to 200 mV p-p, >70 dB SFDR can be maintained
to 70 MHz IFs.
The optimum T/H input level for a particular IF can be determined by examining the T/H spurious and noise performance.
The highest input signal level which will provide the required
SFDR gives the lowest noise performance. When sampling
super Nyquist signals, the IF will be aliased to baseband and
can be observed by using FFT analysis.
90
80
70
2V p-p INPUT
60
SPURIOUS-FREE DYNAMIC RANGE – dBc
50
10
INPUT FREQUENCY – MHz
500mV p-p INPUT
200mV p-p INPUT
50 604030200
70
Figure 18. SFDR vs. Input Frequency at 10 MSPS
–8–
REV. B

AD9100
AD9618
LOW
LEVEL
SOURCE
TO
ENCODER
AD9100
In the FFT spectrum below (see Figure 19), the 71.4 MHz IF is
observed at 1.4 MHz. Note that the highest frequency observed
(FS/2) is determined by the sample rate of the T/H.
0
–20
–40
–60
–80
–100
78 68 25 3
DC
FREQUENCY – MHz
4
4.03.02.01.0
5.0
Figure 19. 71.4 MHz Signal Sampled at 10 MSPS with
200 mV p-p Input
Low Noise Applications
When processing low level single event signals in which noise
performance is the primary concern, amplification ahead of the
AD9100 can increase overall system signal to noise ratio. Frontend amplification often results in an increase in hold mode
distortion levels because of the track mode limitations of the
amplifier which is used. Depending on the signal levels and
bandwidth, the AD9618 low noise high gain amplifier is a possible candidate for this application. See Figure 20.
As a general rule, if the goal is maximize SNR (minimize noise),
pre-AD9100 amplification is recommended. When the system
goal is to maximize the spurious free dynamic range (minimize
distortion), post-AD9100 amplification is recommended.
Figure 20. Using AD9618 as Pre-Amp for AD9100
REV. B
–9–

AD9100
0.1%
0.025%
0.025%
0.1%
0.1%
0.025%
0.025%
0.1%
TRACK COMMAND
(NOT TO SCALE)
C
VOLTAGE
HOLD
REFERENCE
MEASUREMENT
POINT
+1V
–1V
V
2V INPUT STEP
100V LOAD
100403020
IN
TIME – ns
INPUT
BUFFER
C
HOLD
Figure 21. Acquisition Time
TRACK COMMAND
(NOT TO SCALE)
V
OUT
REFERENCE
MEASUREMENT
POINT
+1V
–1V
2V INPUT STEP
100V LOAD
100403020
C
HOLD
TIME – ns
OUTPUT
BUFFER
R
Figure 22. Output Acquisition Time
V
OUT
HOLD
0
V
= 2V p-p
OUT
R
= 250V
LOAD
20
40
60
dB BELOW FULL SCALE
80
100
120
ENCODE = 30 MSPS
t
= 20ns
TRACK
t
= 13.5ns
TRACK
97658432
Figure 23. Frequency (500 kHz/Division) Analog Input =
540 kHz
0
V
= 2V p-p
OUT
= 250V
R
LOAD
20
40
60
958476
dB BELOW FULL SCALE
80
100
120
ENCODE = 30 MSPS
t
= 20ns
TRACK
t
= 13.5ns
HOLD
ALL HARMONICS
ARE ALIASED
3
2
Figure 24. Frequency (500 kHz/Division) Analog Input =
2.3 MHz
–10–
REV. B

AD9100
0
20
40
60
dB BELOW FULL SCALE
80
100
120
9
5
4
V
= 2V p-p
OUT
R
= 100V
LOAD
ENCODE = 30 MSPS
t
= 20ns
TRACK
t
= 13.5ns
HOLD
ALL HARMONICS
ARE ALIASED
6
7
28
3
Figure 25. Frequency (500 kHz/Division) Analog Input =
12.1 MHz
4 PLACES
0.25 (6.35)
2.5 (63.5)
0.25 (6.35)
0
V
= 2V p-p
OUT
= 100V
R
LOAD
20
40
60
dB BELOW FULL SCALE
80
100
120
ENCODE = 30 MSPS
t
= 20ns
TRACK
t
= 13.5ns
HOLD
ALL HARMONICS
ARE ALIASED
Figure 27. Frequency (500 kHz/Division) Analog Input =
19.8 MHz
+VS GND –VS
J7 J6 J5
a
34809 (A)
3.4
(86.36)
Figure 26. Bottom of AD9100/PCB Evaluation Board Viewed
from Above
J3 VBUFF
AD9100
EVALUATION
BOARD
C13
J4 CLOCK IN
W1
W3
R2
C12
U2
DUT
U1
R3
R1
RS
RL
RIN
J2 VOUT
J1 VIN
W2
R4
R5
TP3
TP1
Figure 28. Top of AD9100/PCB Evaluation Board Viewed
from Above
REV. B
–11–

AD9100
0.175 (4.45)
MAX
SEATING
PLANE
OUTLINE DIMENSIONS
Dimensions shown in inches and (mm).
20-Lead Side-Brazed Ceramic DIP
(D-20)
1.052 6 0.011
(26.721 6 0.279)
20
1
0.020 (0.51)
0.016 (0.41)
PIN 1 IDENTIFIER
0.100 (2.54)
TYP
11
0.290 6 0.010
(7.366 6 0.254)
10
0.020 6 0.005
(0.508 6 0.127)
0.05 (1.27)
TYP
0.150
(3.81)
MIN
0.300 (7.62)
REF
0.010 6 0.002
(0.254 6 0.051)
C1513a–0–6/98
–12–
PRINTED IN U.S.A.
REV. B
 Loading...