

Quad Low Noise, Low Cost
www.BDTIC.com/ADI
FEATURES
Low noise preamplifier (PrA)
Voltage noise = 1.3 nV/√Hz typical
Current noise = 2.4 pA/√Hz typical
NF = 7 dB (R
Single-ended input; V
Active input match
Input SNR (noise bandwidth = 20 MHz) = 92 dB
VGA
Differential output
V
OUT
Gain range (8 dB output gain step)
−10 dB to +38 dB—low gain mode
−2 dB to +46 dB—high gain mode
Accurate linear-in-dB gain control
PrA + VGA performance
−3 dB bandwidth of 85 MHz
Excellent overload performance
Supply: 5 V
Power consumption
95 mW/channel (380 mW total)
65 mW/channel (PrA off; 260 mW total)
Power-down
APPLICATIONS
Medical imaging (ultrasound, gamma cameras)
Sonar
Test and measurement
Precise, stable wideband gain control
= RIN = 50 Ω)
S
maximum = 625 mV p-p
IN
maximum = 5 V p-p, RL = 500 Ω differential
PIP1
PMD1
PMD2
PIP2
PON2
POP2
VIP2
VIN2
VIN3
VIP3
POP3
PON3
PIP3
PMD3
PMD4
PIP4
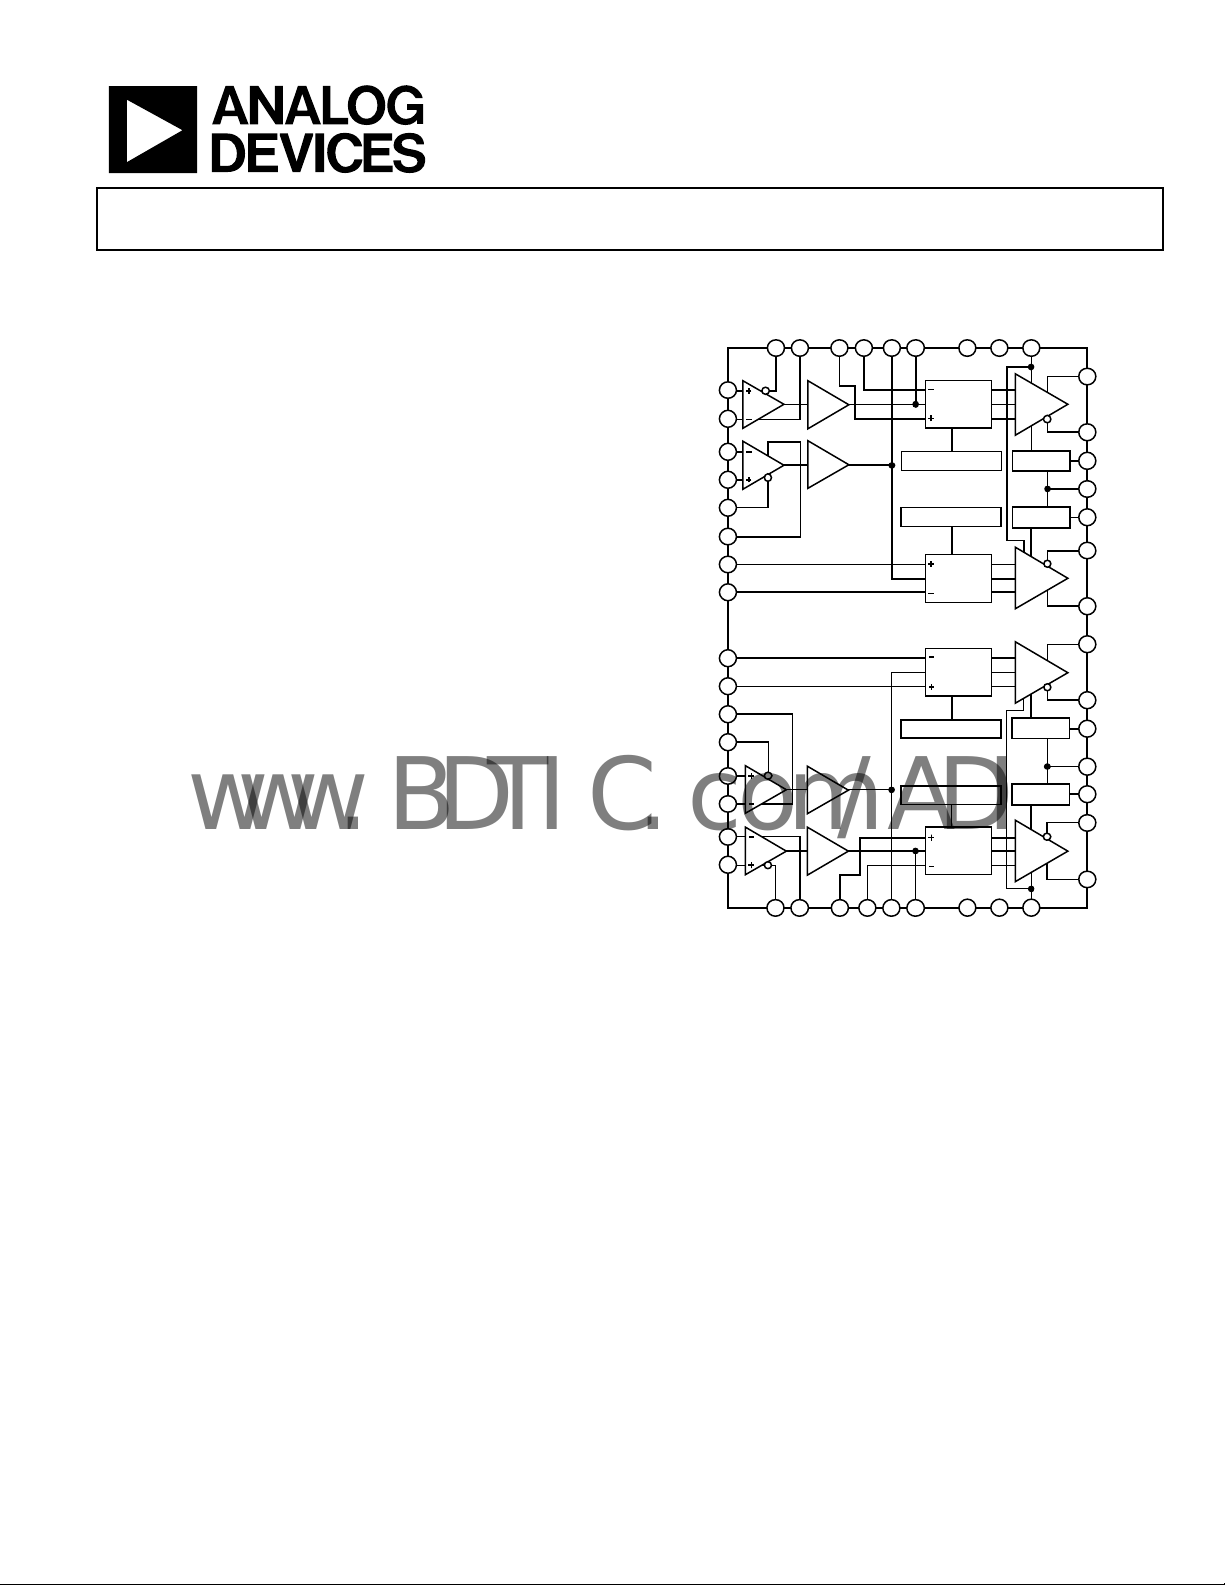
Variable Gain Amplifier
AD8335
FUNCTIONAL BLOCK DIAGRAM
PON160POP159VIP158VIN153VCM255VCM1
61
63
18dB
64
1
18dB
2
4
5
6
7
10
11
12
13
15
18dB
16
17
18dB
18
20
21
PON4
VMD1
VMD2
AD8335
VMD3
VMD4
22
POP4
VIP4
23
VIN4
Figure 1.
28
VCM326VCM4
INTERPOLATOR
INTERPOLATOR
INTERPOLATOR
INTERPOLATOR
52
ATT EN
–48dB TO
0dB
ATT EN
–48dB TO
0dB
ATT EN
–48dB TO
0dB
ATT EN
–48dB TO
0dB
29
EN1251SP1249HL12
20dB
TO
28dB
GAIN INT
GAIN INT
20dB
TO
28dB
20dB
TO
28dB
GAIN INT
GAIN INT
20dB
TO
28dB
30
SP3432HL34
EN34
47
VOH1
46
VOL1
56
VGN1
50
SL12
54
VGN2
43
VOL2
42
VOH2
39
VOH3
38
VOL3
27
VGN3
31
SL34
25
VGN4
35
VOL4
34
VOH4
04976-001
GENERAL DESCRIPTION
The AD8335 is a quad variable gain amplifier (VGA) with low
noise preamplifier intended for cost and power sensitive applications. Each channel features a gain range of 48 dB, fully
differential signal paths, active input preamplifier matching,
and user-selectable maximum gains of 46 dB and 38 dB.
Individual gain controls are provided for each channel.
The preamplifier (PrA) has a single-ended to differential gain
of ×8 (18.06 dB) and accepts input signals ≤625 mV p-p. PrA
noise is 1.2 nV/√Hz and the combined input referred voltage
noise of the PrA and VGA is 1.3 nV/√Hz at maximum gain.
Rev. A
Information furnished by Analog Devices is believed to be accurate and reliable. However, no
responsibility is assumed by Analog Devices for its use, nor for any infringements of patents or other
rights of third parties that may result from its use. Specifications subject to change without notice. No
license is granted by implication or otherwise under any patent or patent rights of Analog Devices.
Trademarks and registered trademarks are the property of their respective owners.
Assuming a 20 MHz noise bandwidth (NBW), the Nyquist
frequency for a 40 MHz ADC, the input SNR is 92 dB. The
HLxx pin optimizes the output SNR for 10-bit and 12-bit
ADCs with 1 V p-p or 2 V p-p full-scale (FS) inputs.
Channel 1 and Channel 2 are enabled through the EN12 pin
and Channel 3 and Channel 4 are enabled through the EN34
pin. For VGA only applications, the PrAs can be powered down,
significantly reducing power consumption.
The AD8335 is available in a 64-lead lead frame chip scale
package (9 mm × 9 mm) for the industrial temperature range
of −40°C to +85°C.
One Technology Way, P.O. Box 9106, Norwood, MA 02062-9106, U.S.A.
Tel: 781.329.4700 www.analog.com
Fax: 781.461.3113 ©2004–2008 Analog Devices, Inc. All rights reserved.

AD8335
www.BDTIC.com/ADI
TABLE OF CONTENTS
Features .............................................................................................. 1
Applications ....................................................................................... 1
Functional Block Diagram .............................................................. 1
General Description ......................................................................... 1
Revision History ............................................................................... 2
Specifications ..................................................................................... 3
Absolute Maximum Ratings ............................................................ 5
ESD Caution .................................................................................. 5
Pin Configuration and Function Descriptions ............................. 6
Typical Performance Characteristics ............................................. 7
Test Circuits ..................................................................................... 15
Theory of Operation ...................................................................... 16
Enable Summary ........................................................................ 16
Preamp ......................................................................................... 17
VGA .............................................................................................. 18
Applications Information .............................................................. 20
Ultrasound .................................................................................. 20
Basic Connections ...................................................................... 21
Preamp Connections ................................................................. 21
Input Overdrive .......................................................................... 22
Logic Inputs................................................................................. 22
Common-Mode Pins ................................................................. 22
Driving ADCs ............................................................................. 22
Evaluation Board ............................................................................ 23
Measurement Setup.................................................................... 23
Board Layout ............................................................................... 23
Bill of Materials ........................................................................... 27
Outline Dimensions ....................................................................... 28
Ordering Guide .......................................................................... 28
REVISION HISTORY
8/08—Rev. 0 to Rev. A
Changes to Features Section............................................................ 1
Changes to Table 1, Scale Factor Parameter .................................. 4
Changes to Theory of Operation Section .................................... 16
Changes to Figure 54 ...................................................................... 16
Changes to Equation 4 ................................................................... 18
Changes to Figure 58 ...................................................................... 21
Added Evaluation Board Section ................................................. 23
Added Figure 60 to Figure 68 ........................................................ 23
Updated Outline Dimensions ....................................................... 28
Changes to Ordering Guide .......................................................... 28
9/04—Revision 0: Initial Version
Rev. A | Page 2 of 28
AD8335
www.BDTIC.com/ADI
SPECIFICATIONS
VS = 5 V, TA = 25°C, RL = 500 Ω, f = 5 MHz, CL = 10 pF, low gain range (−10 dB to +38 dB), RFB = 249 Ω (PrA RIN = 50 Ω) and signal
voltage specified differential, per channel performance, dBm (50 Ω), unless otherwise noted.
Table 1.
Parameter Conditions Min Typ Max Unit
PrA CHARACTERISTICS
Gain
Single-ended input to single-ended output 12 dB
Input Voltage Range PrA output limited to 5 V p-p differential 625 mV p-p
Input Resistance RFB = 249 Ω 50 Ω
R
R
R
Input Capacitance PIPx (Pin 2, Pin 15, Pin 18, Pin 63) 1.5 pF
−3 dB Small Signal Bandwidth With RFB = 249 Ω 110 MHz
Input Voltage Noise RS = 0 Ω, RFB = ∞ 1.15 nV/√Hz
Input Current Noise 2.4 pA/√Hz
Noise Figure
Active Termination Match RS = RIN = 50 Ω, RFB = 249 Ω 7 dB
Unterminated RS = 50 Ω, RFB = ∞ 4.4 dB
PrA + VGA CHARACTERISTICS
−3 dB Small Signal Bandwidth Unterminated: RS = 50 Ω, RFB = ∞ 70 MHz
Matched: RS = RIN = 50 Ω 85 MHz
Slew Rate Low gain, VGN = 3 V, V
High gain, VGN = 3 V, V
Input Voltage Noise VGNx pins = 3 V, RS = 0 Ω, RFB = ∞ 1.3 nV/√Hz
Noise Figure
Active Termination Match
R
Unterminated RS = 50 Ω, RFB = ∞ 5.0 dB
R
Output Referred Noise Low gain; VGN < 2 V 33 nV/√Hz
High gain; VGN < 2 V 80 nV/√Hz
Peak Output Voltage Differential, RL ≥ 500 Ω 5 V p-p
Output Resistance f < 1 MHz, VOHx, VOLx pins 1.2 Ω
Common-Mode Level Set to midsupply for PrA and VGA VS/2 V
Output Offset Voltage
Differential Between VOHx pins and VOLx pins, full gain range −25 +5 +35 mV
Common-Mode
Harmonic Distortion V
HD2 f = 1 MHz −69 dBc
HD3 f = 1 MHz −57 dBc
HD2 f = 10 MHz −57 dBc
HD3 f = 10 MHz −55 dBc
Harmonic Distortion V
HD2 f = 1 MHz −58 dBc
HD3 f = 1 MHz −70 dBc
HD2 f = 10 MHz −55 dBc
HD3 f = 10 MHz −55 dBc
Output 1 dB Compression (OP1dB) VGN = 3 V 18 dBm
VGN = 3 V 8 dBV peak
Single-ended input to differential output 18 dB
= 374 Ω 75 Ω
FB
= 499 Ω 100 Ω
FB
= ∞, low frequency value into PIPx 14.7 kΩ
FB
= 2 V p-p 250 V/µs
OUT
= 2 V p-p 350 V/µs
OUT
VGNx pins = 3 V, f = 1 MHz to 10 MHz
RS = RIN = 50 Ω 7 dB
= RIN = 100 Ω 4.5 dB
S
= 500 Ω, RFB = ∞ 1.3 dB
S
Between VOHx pins and VCMx pins, and between
VOLx pins and VCMx pins
= 1 V p-p, low gain, VGN = 2 V
OUT
= 1 V p-p, high gain, VGN = 2 V
OUT
−20 +0 +20 mV
Rev. A | Page 3 of 28

AD8335
www.BDTIC.com/ADI
Parameter Conditions Min Typ Max Unit
Two-Tone IMD3 Distortion V
f
f
Output IP3 (OIP3) V
f = 1 MHz 33 dBm
f = 10 MHz 31 dBm
Channel-to-Channel Crosstalk V
Overload Recovery PrA or VGA 10 ns
Group Delay Variation Full gain range, f = 1 MHz to 10 MHz 3.0 ns
GAIN CONTROL INTERFACE VGNx pins
Normal Operating Range 0
Maximum Range No gain foldover 0 VS V
Gain Range Low gain mode; (HLxx pins = 0 V) −10 to +38 dB
High gain mode; (HLxx pins = VS) −2 to +46 dB
Scale Factor Nominal (Pin SL12 and Pin SL34 = 2.5 V) 19.1 20.1 21.1 dB/V
Bias Current −0.3 µA
Response Bandwidth 5 MHz
Response Time 48 dB gain change 350 ns
GAIN ACCURACY VGNx pins
Absolute Gain Error 0 ≤ VGN ≤ 0.4 V 1.25 7.5 dB
0.4 ≤ VGN ≤ 2.6 V, 1σ −1.25 ±0.2 +1.25 dB
2.6 ≤ VGN ≤ 3 V −7.5 −1.25 dB
Gain Law Conformance Over Temperature 0.4 ≤ VGN ≤ 2.6 V; −40°C < TA < +85°C ±0.75 dB
Intercept Low gain mode; PrA matched to 50 Ω −16.1 dB
High gain mode; PrA matched to 50 Ω −8.1 dB
Channel-to-Channel Matching 0.4 ≤ VGN ≤ 2.6 V 0.15 dB
LOGIC LEVEL—HIGH/LOW, SHUTDOWN
PREAMP, and ENABLE INTERFACES
Logic High 2.75 5 V
Logic Low 0 1 V
BIAS CURRENT—HIGH/LOW, ENABLE
Logic High 80 µA
Logic Low −12 µA
INPUT RESISTANCE—HIGH/LOW, ENABLE 50 kΩ
BIAS CURRENT— SHUTDOWN PREAMP
Logic High 20 µA
Logic Low 0 µA
INPUT RESISTANCE—SHUTDOWN PREAMP 500 kΩ
High/Low Response Time 0.6 µs
Enable Response Time 100 µs
POWER SUPPLY VPPx and VPVx pins
Supply Voltage 4.5 5 5.5 V
Quiescent Current Each channel—PrA and VGA enabled 19 mA
Each channel—PrA disabled, VGA enabled 13 mA
All channels enabled 76 mA
Over Temperature −40°C < TA < +85°C 16 22.8 mA
Quiescent Power Each channel—PrA and VGA enabled 95 mW
Each channel—PrA disabled, VGA enabled 65 mW
Disable Current All channels disabled 0.8 mA
PSRR VGN = 0 V, all bypass capacitors removed, 1 MHz −60 dB
= 1 V p-p, VGN = 3 V
OUT
= 1 MHz, f2 = 1.05 MHz −69 dBc
1
= 10 MHz, f2 = 10.05 MHz −65 dBc
1
= 1 V p-p, VGN = 3 V
OUT
= 1 V p-p, f = 1 to 10 MHz −80 dBc
OUT
HLxx, SPxx, and ENxx pins
3 V
Rev. A | Page 4 of 28
AD8335
www.BDTIC.com/ADI
ABSOLUTE MAXIMUM RATINGS
Table 2.
Parameter Rating
Voltage
Supply VS 6 V
Preamp Input VS
VGA Inputs VS
Enable, Shutdown Preamp, and
High/Low Interfaces
Gain VS
Power Dissipation (4-Layer JEDEC Board (2s2p)) 2.46 W
θJA 26.4°C/W
θJC 6.8°C/W
Operating Temperature Range −40°C to +85°C
Storage Temperature Range
Lead Temperature Range (Soldering 60 sec) 300°C
V
S
−65°C to
+150°C
Stresses above those listed under Absolute Maximum Ratings
may cause permanent damage to the device. This is a stress
rating only; functional operation of the device at these or any
other conditions above those indicated in the operational
section of this specification is not implied. Exposure to absolute
maximum rating conditions for extended periods may affect
device reliability.
ESD CAUTION
Rev. A | Page 5 of 28
AD8335
www.BDTIC.com/ADI
PIN CONFIGURATION AND FUNCTION DESCRIPTIONS
PMD1
PIP1
VPP1
PON1
POP1
VIP1
VIN1
COM1
VGN1
VCM1
VGN2
VCM2
EN12
SP12
SL12
646362616059585756555453525150
HL12
49
PMD2
PIP2
VPP2
PON2
POP2
VIP2
VIN2
COM2
COM3
VIN3
VIP3
POP3
PON3
VPP3
PIP3
PMD3
10
11
12
13
14
15
16
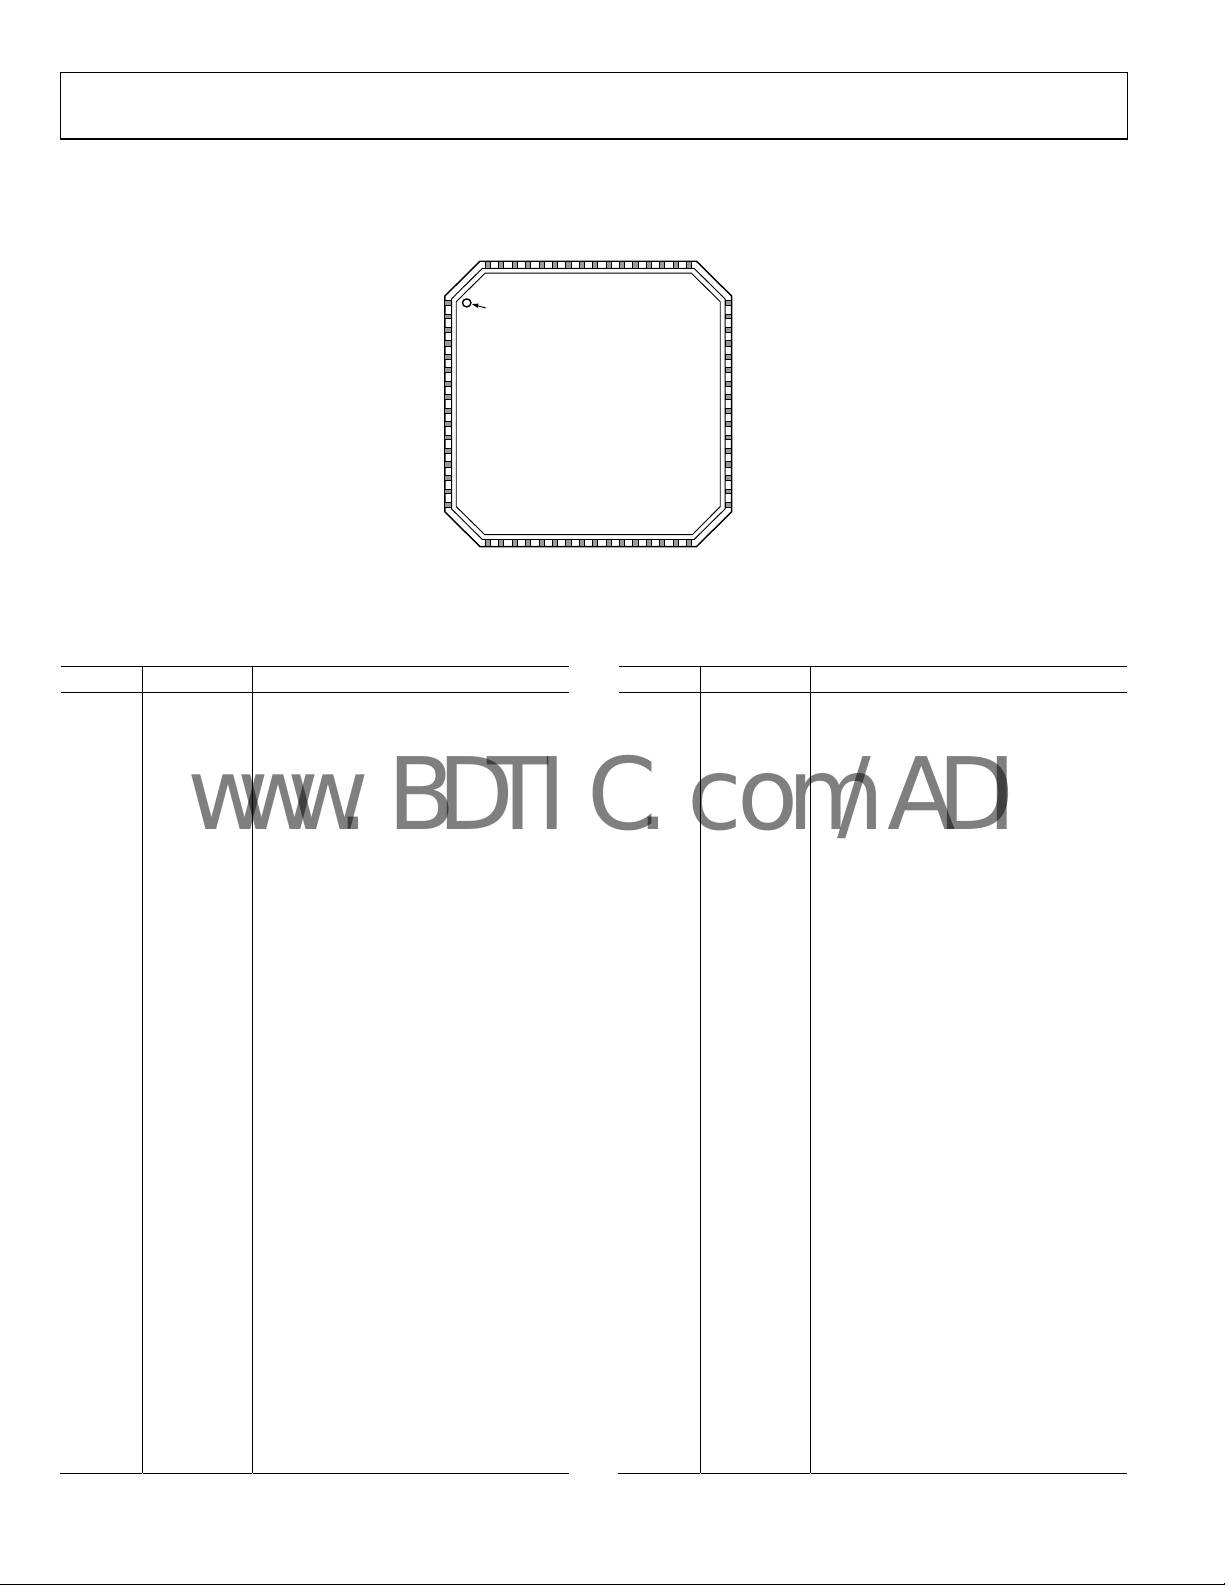
PIN 1
1
IDENTIFIER
2
3
4
5
6
7
8
9
171819202122232425262728293031
PIP4
VPP4
PON4
PMD4
Figure 2. Pin Configuration
Table 3. Pin Function Descriptions
Pin No. Mnemonic Description
1 PMD2 Preamp Input Common—CH2
2 PIP2 Preamp Input—CH2
3 VPP2 Positive Supply Preamp—CH2
4 PON2 Preamp Output Negative—CH2
5 POP2 Preamp Output Positive—CH2
6 VIP2 VGA Input Positive—CH2
7 VIN2 VGA Input Negative—CH2
8 COM2 Ground Preamp—CH2
9 COM3 Ground Preamp—CH3
10 VIN3 VGA Input Negative—CH3
11 VIP3 VGA Input Positive—CH3
12 POP3 Preamp Output Positive—CH3
13 PON3 Preamp Output Negative—CH3
14 VPP3 Positive Supply Preamp—CH3
15 PIP3 Preamp Input—CH3
16 PMD3 Preamp Input Common—CH3
17 PMD4 Preamp Input Common—CH4
18 PIP4 Preamp Input—CH4
19 VPP4 Positive Supply Preamp—CH4
20 PON4 Preamp Output Negative—CH4
21 POP4 Preamp Output Positive—CH4
22 VIP4 VGA Input Positive—CH4
23 VIN4 VGA Input Negative—CH4
24 COM4 Ground Preamp—CH4
25 VGN4 Gain Control—CH4
26 VCM4 Common-Mode Decoupling Pin—CH4
27 VGN3 Gain Control—CH3
28 VCM3 Common-Mode Decoupling Pin—CH3
29 EN34 Enable—CH3 and CH4
30 SP34 Shutdown—Preamp 3 and Preamp 4
31 SL34 Slope Decoupling Pin—CH3 and CH4
32 HL34 High/Low Pin—CH3 and CH4
Rev. A | Page 6 of 28
AD8335
TOP VIEW
(Not to Scale)
VIP4
VIN4
POP4
COM4
48
GND1
47
VOH1
46
VOL1
45
VPV1
44
VPV2
43
VOL2
42
VOH2
41
GND2
40
GND3
39
VOH3
38
VOL3
37
VPV3
36
VPV4
35
VOL4
34
VOH4
33
GND4
32
SL34
SP34
HL34
EN34
VGN4
VGN3
VCM4
VCM3
04976-058
Pin No. Mnemonic Description
33 GND4 Ground VGA—CH4
34 VOH4 VGA Output Positive—CH4
35 VOL4 VGA Output Negative—CH4
36 VPV4 Positive Supply VGA—CH4
37 VPV3 Positive Supply VGA—CH3
38 VOL3 VGA Output Negative—CH3
39 VOH3 VGA Output Positive—CH3
40 GND3 Ground VGA—CH3
41 GND2 Ground VGA—CH2
42 VOH2 VGA Output Positive—CH2
43 VOL2 VGA Output Negative—CH2
44 VPV2 Positive Supply VGA—CH2
45 VPV1 Positive Supply VGA—CH1
46 VOL1 VGA Output Negative—CH1
47 VOH1 VGA Output Positive—CH1
48 GND1 Ground VGA—CH1
49 HL12 High/Low Pin—CH1 and CH2
50 SL12 Slope Decoupling Pin—CH1 and CH2
51 SP12 Shutdown—Preamp 1 and Preamp 2
52 EN12 Enable—CH1 and CH2
53 VCM2 Common-Mode Decoupling Pin—CH2
54 VGN2 Gain Control—CH2
55 VCM1 Common-Mode Decoupling Pin—CH1
56 VGN1 Gain Control—CH1
57 COM1 Ground Preamp—CH1
58 VIN1 VGA Input Negative—CH1
59 VIP1 VGA Input Positive—CH1
60 POP1 Preamp Output Positive—CH1
61 PON1 Preamp Output Negative—CH1
62 VPP1 Positive Supply Preamp—CH1
63 PIP1 Preamp Input—CH1
64 PMD1 Preamp Input Common—CH1
AD8335
www.BDTIC.com/ADI
TYPICAL PERFORMANCE CHARACTERISTICS
VS = 5 V, TA = 25°C, RL = 500 Ω, f = 5 MHz, CL = 10 pF, low gain range (−10 dB to +38 dB), RFB = 249 Ω (PrA RIN = 50 Ω) and signal
voltage specified differential, per channel performance, unless otherwise noted.
50
40
30
20
+25°C
10
GAIN (dB)
0
–10
–20
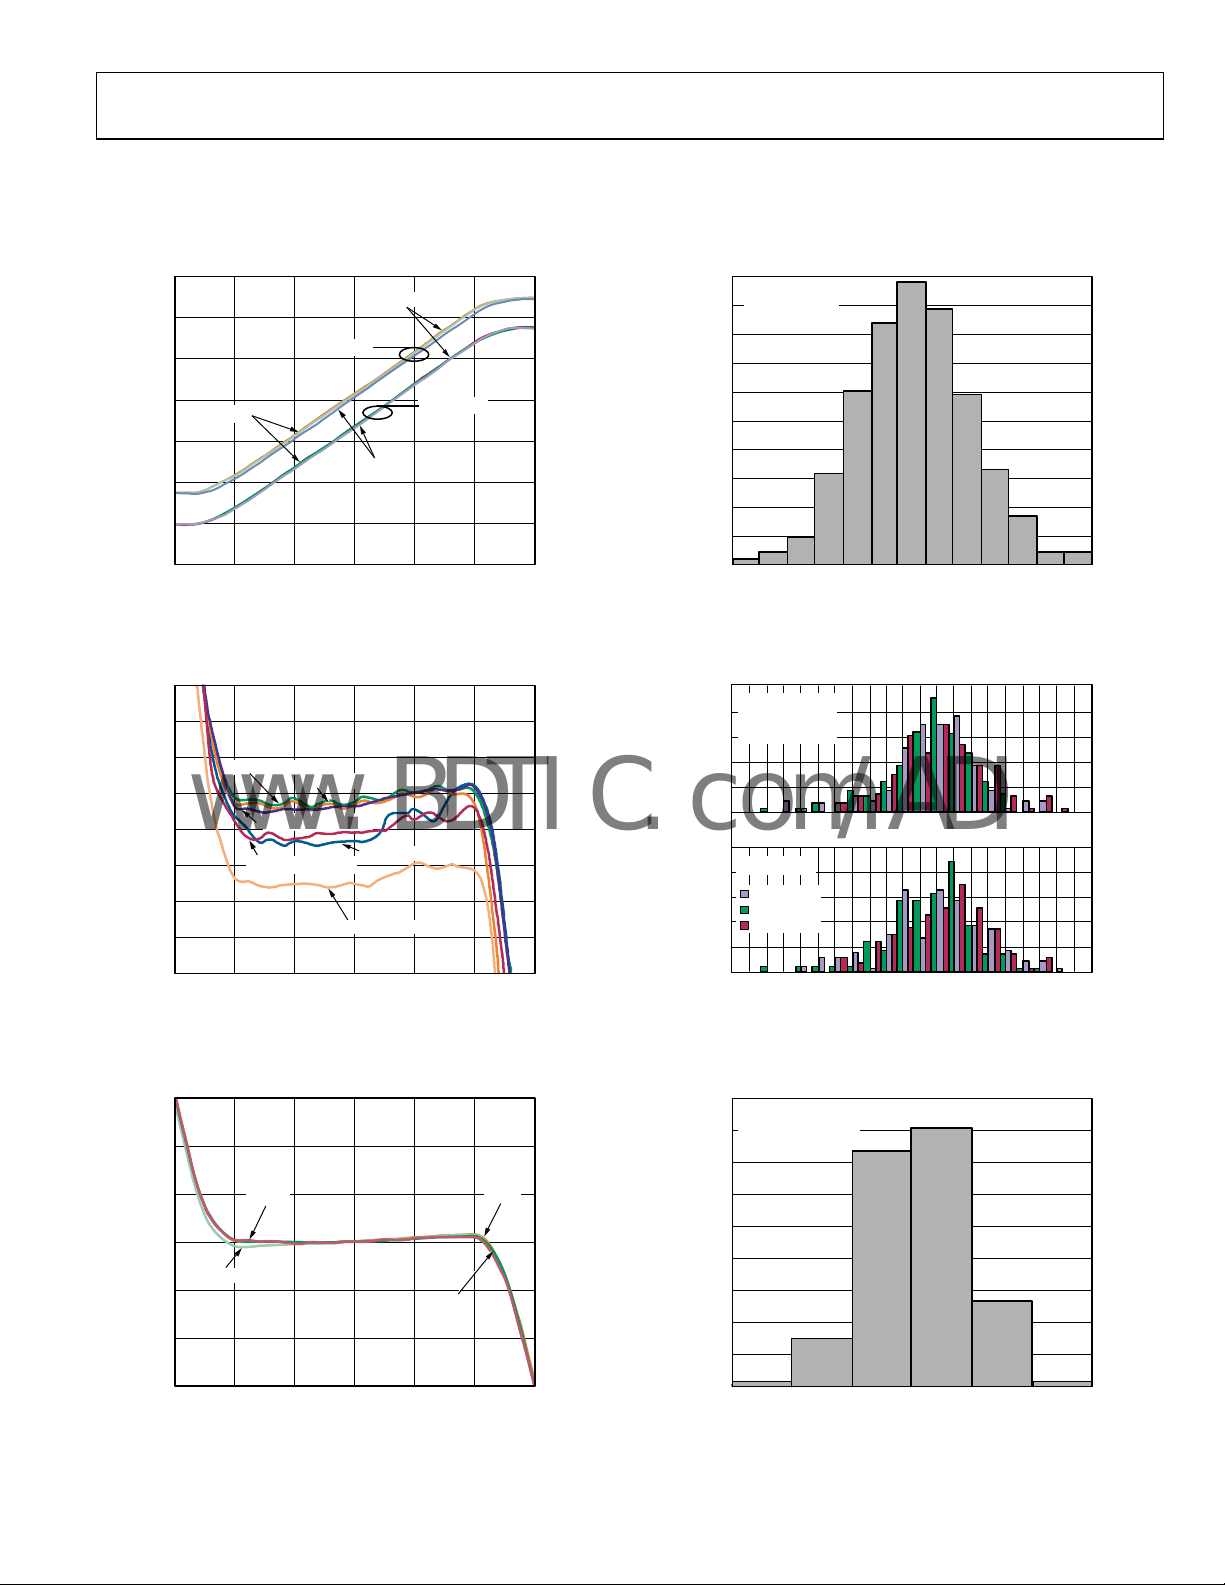
Figure 3. Gain vs. V
+85°C
HIGH GAIN
LOW GAIN
–40°C
1.0 1.50 0.5 2.0 2.5 3.0
at Three Temperatures (See Figure 49)
GAIN
V
GAIN
(V)
04976-002
20
420 CHANNELS
18
(105 UNITS)
V
= 1.5V
GAIN
16
14
12
10
8
% OF UNITS
6
4
2
0
–0.6 –0.5 –0.4 –0.3 –0. 2 0 0.4–0.1 0.1 0.2 0.3 0.5 0.6
GAIN ERROR (dB)
Figure 6. Gain Error Histogram
04976-005
2.0
1.5
1.0
0.5
0
–0.5
GAIN ERROR (d B)
–1.0
–1.5
–2.0
+85°C, LOW GAIN
+25°C, LOW GAIN
+25°C, HIG H GAIN
Figure 4. Gain Error vs. V
6.0
4.0
GAIN ERROR (dB)
2.0
0
–2.0
–4.0
–6.0
20MHz
1MHz
Figure 5. Gain Error vs. V
+85°C, HIGH GAIN
–40°C, LOW GAIN
–40°C, HIG H GAIN
1.0 1.50 0.5 2.0 2.5 3.0
GAIN
1.0 1.50 0.5 2.0 2.5 3.0
GAIN
(V)
V
GAIN
at Three Temperatures (See Figure 49)
5MHz
10MHz
(V)
V
GAIN
at Various Frequencies (See Figure 49)
25
420 CHANNELS
20
(105 UNITS)
V
= 1.0V
GAIN
15
10
5
0
–1.0
–0.9
–0.8
–0.7
–0.6
–0.5
25
% OF UNITS
V
= 2.0V
GAIN
20
CH1 TO CH2
15
CH1 TO CH4
10
CH1 TO CH3
5
0
–1.0
–0.9
04976-003
–0.8
–0.4
–0.7
–0.6
–0.5
–0.4
CHANNEL-TO- CHANNEL GAIN MATCH (dB)
Figure 7. Gain Match Histogram for V
45
420 CHANNELS
(105 UNITS)
40
0.5V < V
35
30
25
20
%TOTAL
15
10
5
0
04976-004
< 2.5V
GAIN
GAIN SCALING FACTOR
Figure 8. Gain Scaling Factor Histogram for 0.5 V < V
0
0.1
0.3
0.4
0.5
–0.3
–0.2
–0.3
–0.2
0.2
–0.1
0
0.1
0.3
0.4
0.5
0.2
–0.1
= 1 V and 2 V
GAIN
0.9
0.6
0.7
0.8
1.0
0.9
0.6
0.7
0.8
1.0
04976-006
20.419.9 20.0 20.1 20.2 20.3
04976-007
< 2.5 V
GAIN
Rev. A | Page 7 of 28
AD8335
–
www.BDTIC.com/ADI
25
20
15
%TOTAL
10
420 CHANNELS
(105 UNITS)
0.5V < V
GAIN
< 2.5V
30
25
20
RS = 50Ω
15
V
= 10mV p-p
IN
10
GAIN (dB)
5
RFB = 249Ω
RFB =
∞
5
0
–16.7
–16.6
–16.5
–16.4
–16.3
–16.1
–16.2
–16.0
–15.9
INTERCEPT ( dB)
–15.8
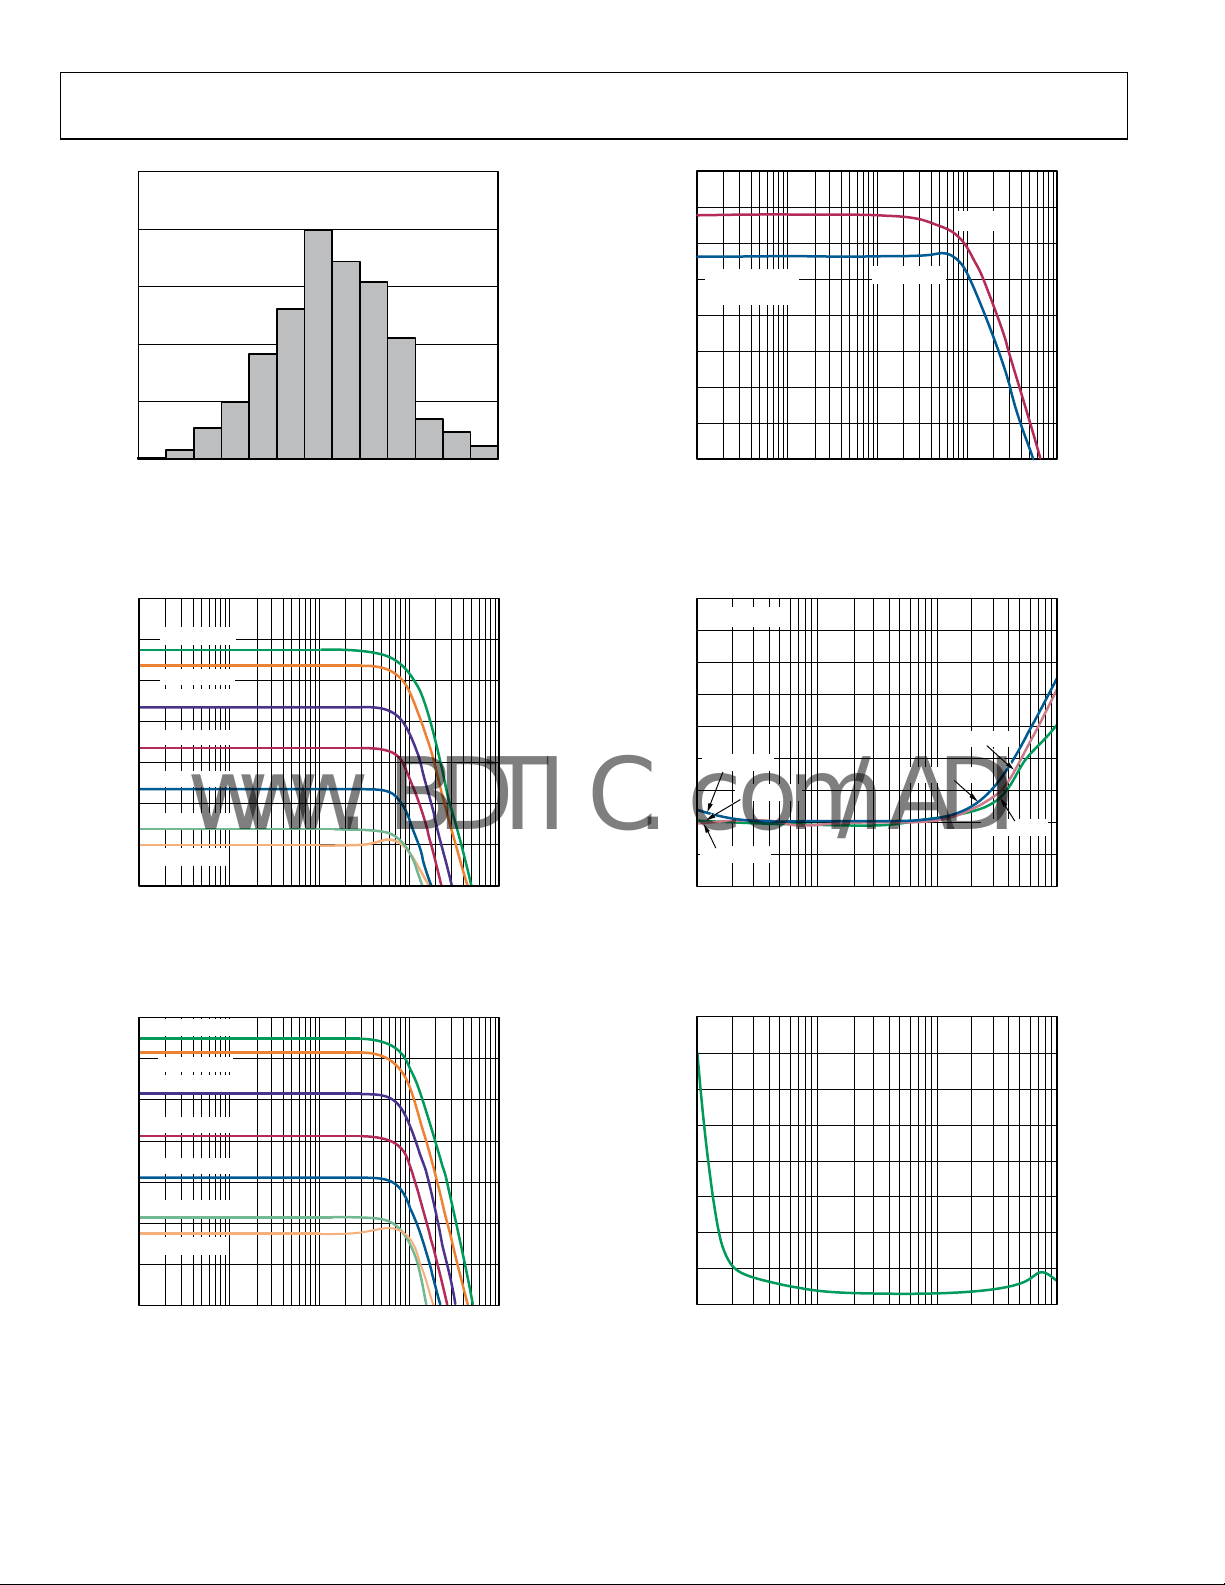
Figure 9. Intercept Histogram
50
V
= 3.0V
GAIN
40
V
= 2.5V
GAIN
30
V
= 2.0V
GAIN
20
V
= 1.5V
GAIN
10
GAIN (dB)
V
= 1.0V
GAIN
0
V
= 0.5V
GAIN
–10
V
= 0V
GAIN
–20
1M100k 10M 100M 1G
FREQUENCY ( Hz)
Figure 10. Frequency Response for Various Values of V
–15.7
–15.6
–15.5
(See Figure 49)
GAIN
0
–5
–10
04976-008
1M100k 10M 100M 1G
FREQUENCY ( Hz)
04976-011
Figure 12. Frequency Response for a Terminated and Unterminated
50 Ω Source (See Figure 49)
10
V
= 1V p-p
OUT
–20
–30
–40
–50
–60
V
= 1V
GAIN
CROSSTALK (dB)
–70
–80
–90
–100
04976-009
V
= 3V
GAIN
V
= 2V
GAIN
100k 10M1M 100M
FREQUENCY ( Hz)
V
GAIN
V
GAIN
= 1V
= 2V
V
GAIN
= 3V
04976-012
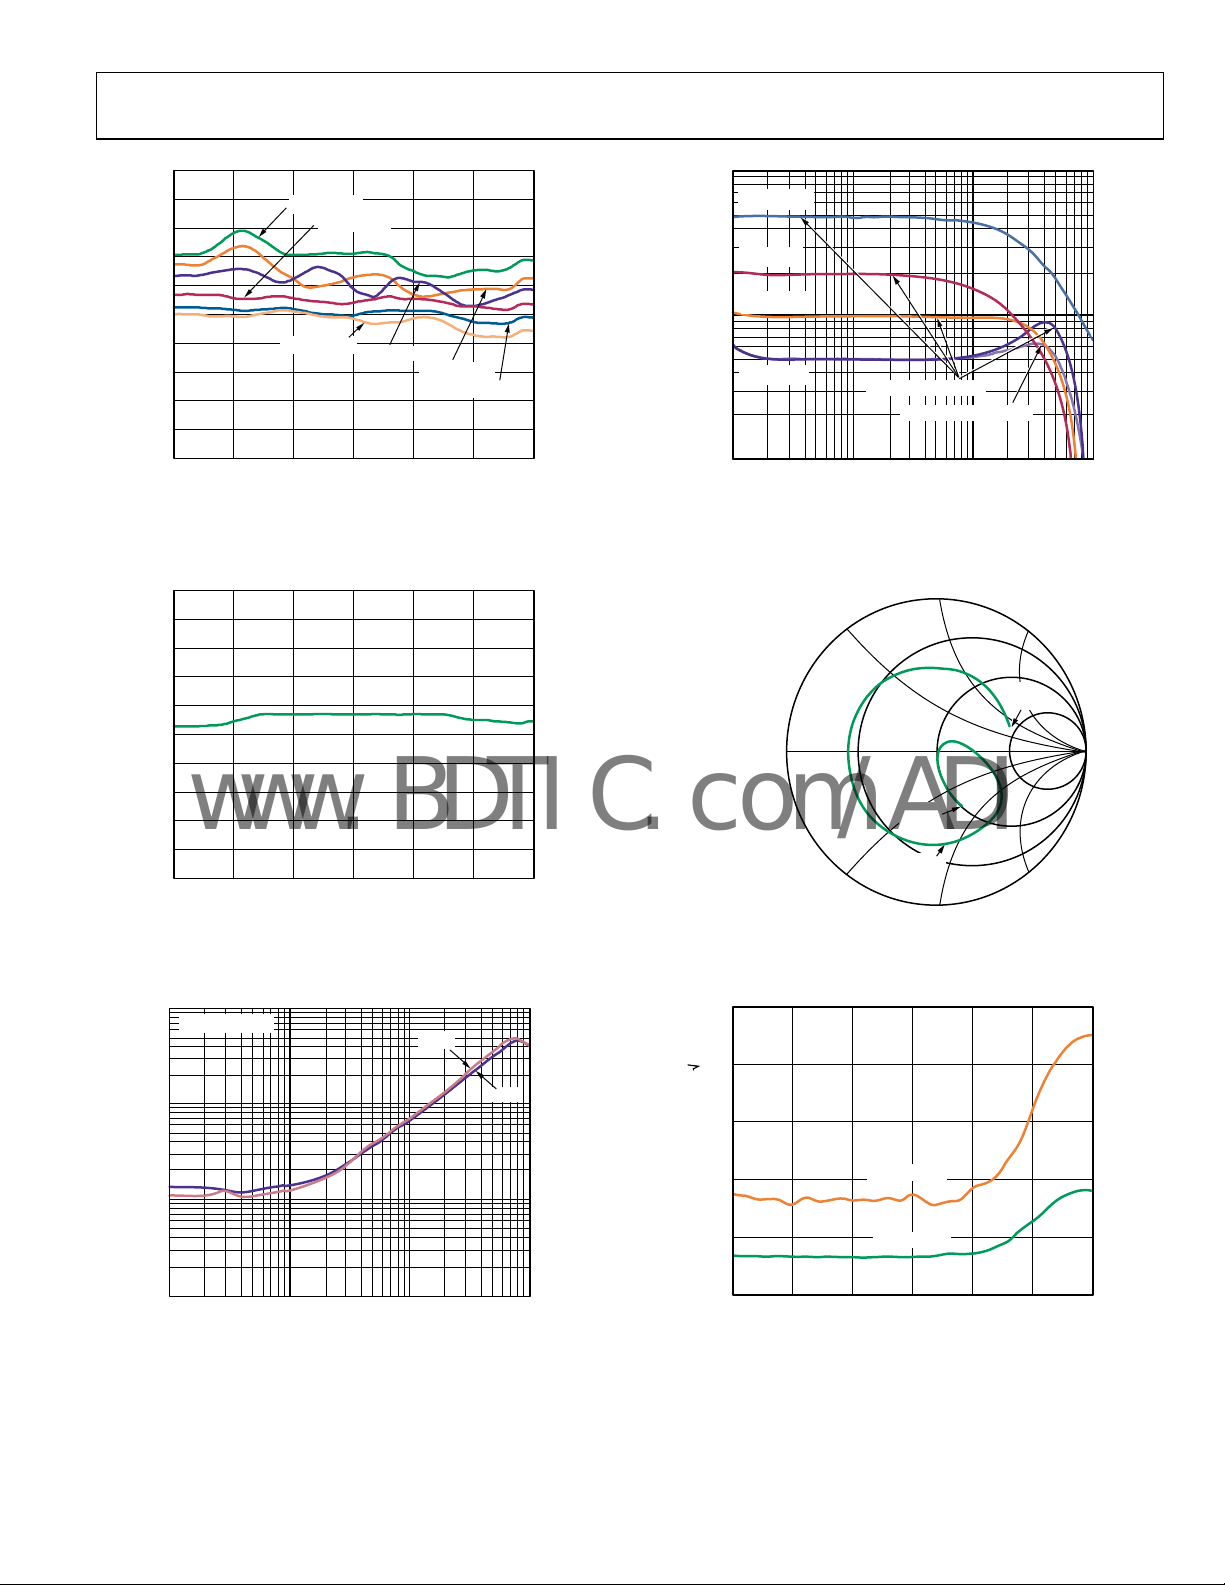
Figure 13. Channel-to-Channel Crosstalk vs. Frequency for
Various Values of V
GAIN
50
V
= 3.0V
GAIN
40
V
= 2.5V
GAIN
V
= 2.0V
GAIN
30
V
= 1.5V
GAIN
20
V
= 1.0V
GAIN
10
GAIN (dB)
V
= 0.5V
GAIN
0
V
= 0V
GAIN
–10
–20
1M100k 10M 100M 1G
FREQUENCY ( Hz)
Figure 11. Frequency Response vs. Frequency for Various Values of V
04976-010
GAIN
,
80
70
60
50
40
30
GROUP DELAY (ns)
20
10
0
100k 10M1M 100M
FREQUENCY ( Hz)
Figure 14. Group Delay vs. Frequency
HLxx = High (See Figure 49)
Rev. A | Page 8 of 28
04976-013
AD8335
www.BDTIC.com/ADI
25
20
15
10
5
0
–5
–10
OFFSET VOLTAGE (mV)
–15
–20
–25
+85°C, HIG H
+85°C, LO W
–40°C, LO W
1.0 1.50 0.5 2.0 2.5 3.0
V
GAIN
–40°C, HIG H
(V)
Figure 15. Differential Output Offset Voltage vs. V
+25°C, HIG H
+25°C, LO W
at Three Temperatures
GAIN
04976-014
1k
RFB = 2.5kΩ
RFB = 1kΩ
R
= 499Ω
FB
100
R
= 249Ω
FB
INPUT IMPE DANCE (Ω)
10
RSH =∞, CSH = 0pF
R
= 49Ω, CSH = 22pF
SH
1M 10M 1G
FREQUENCY ( Hz)
Figure 18. Preamp Input Resistance vs. Frequency for
Various Values of R
FB
04976-017
25
20
15
10
5
0
–5
–10
OFFSET VOLTAGE (mV)
–15
–20
–25
1.0 1.50 0.5 2.0 2.5 3.0
Figure 16. Absolute Offset vs. V
Relative to VCMx Pins
100
VIN = 10mV p-p
10
(V)
V
GAIN
at VOHx and VOLx Pins
GAIN
VOHx
VOLx
50Ω
START
100kHz
100MHz
50j
–50j
150Ω
STOP
1GHz
100j
–75j
04976-018
VIN = 10mV p-p
–10
–20
–30
–40
–50
0Ω
–60
CROSSTALK (dB)
–70
–80
–90
–100
04976-015
25j
17Ω
–25j
Figure 19. Smith Chart S11 vs. Frequency, 100 kHz to 1 GHz
250
R
= 0Ω
S
R
=
∞
FB
200
150
1
OUTPUT IMPEDANCE (Ω)
0.1
1M100k 10M 1G
FREQUENCY ( Hz)
Figure 17. Output Resistance at VOHx and VOLx Pins vs. Frequency
04976-016
100
50
OUTPUT REF ERRED NOISE ( nV/ Hz)
0
Figure 20. Output Referred Noise vs. V
Rev. A | Page 9 of 28
HLxx = HIGH
HLxx = LOW
1.0 1.50 0.5 2.0 2.5 3.0
V
(V)
GAIN
(See Figure 50)
GAIN
04976-019

AD8335
www.BDTIC.com/ADI
1.4
1.2
Hz)
V
= 3.0V
GAIN
1.0
R
= 0Ω
S
R
=
∞
FB
0.8
0.6
0.4
INPUT REFERRED NOISE (nV /
0.2
0
0.1 1011
FREQUENCY (M Hz)
00
04976-020
Figure 21. Short-Circuit Input Referred Noise vs. Frequency at Maximum Gain
(See Figure 50)
60
55
50
45
40
35
30
25
20
NOISE FIGURE (dB)
15
10
5
0
Figure 24. Noise Figure vs. V
f = 10MHz
1.0 1.50 0.5 2.0 2.5 3.0
V
(V)
GAIN
for RS = RIN = 50 Ω
GAIN
04976-062
1k
T = +85°C
100
10
NOISE (nV / Hz)
1.0
0.1
1.0 1.50 0.5 2.0 2.5 3.0
V
Figure 22. Input Referred Noise vs. V
(See Figure 50)
10
f = 1MHz, V
1.0
GAIN
= 3V
T = –40°C
GAIN
T = +25°C
(V)
at Three Temperatures
GAIN
–35
f = 10MHz
= 1V p-p
V
OUT
–40
–45
–50
–55
DISTORTION (dBc)
–60
–65
–70
200 400 600 800 1.0k 1. 2k 1.4k 1. 6k 1.8k 2.0k
04976-021
–20
–30
–40
–50
= 1.5V
V
GAIN
HLxx = LOW
HD2 HD3
(Ω)
R
LOAD
Figure 25. Harmonic Distortion vs. R
f = 10MHz
= 1V p-p
V
OUT
HLxx = LOW
HD3
HLxx = HIGH
HD2 HD3
(See Figure 53)
LOAD
HLxx = HIGH,
HD3
04976-025
–60
INPUT NOISE (nV/ Hz)
0.1
RS THERMAL NOISE
ALONE
101 100 1k
SOURCE RESISTANCE (Ω)
04976-022
Figure 23. Input Referred Noise vs. RS
DISTORTION (dBc)
–70
–80
HLxx = HIGH,
HD2
0 1020304050
Figure 26. Harmonic Distortion vs. C
Rev. A | Page 10 of 28
C
LOAD
(pF)
HLxx = LOW,
HD2
(See Figure 53)
LOAD
04976-200

AD8335
–
www.BDTIC.com/ADI
–20
–30
LOW GAIN
V
= 1V p-p
OUT
–20
–30
HIGH GAIN
V
= 1V p-p
OUT
–40
–50
f = 10MHz
–60
DISTORTIO N (dBc)
–70
–80
0.5 1.0 1.5 2.0 2.5 3.0
Figure 27. HD2 vs. V
–20
–30
–40
–50
–60
DISTORTIO N (dBc)
–70
–80
0.5 1.0 1.5 2.0 2.5 3.0
Figure 28. HD3 vs. V
GAIN
GAIN
V
GAIN
at Three Frequencies, Low Gain (See Figure 53)
LOW GAIN
V
= 1V p-p
OUT
V
GAIN
at Three Frequencies, Low Gain (See Figure 53)
f = 5MHz
f = 1MHz
(V)
f = 1MHz
(V)
f = 10MHz
f = 5MHz
–40
–50
–60
DISTORTIO N (dBc)
–70
–80
0.5 1.0 1.5 2.0 2.5 3.0
04976-026
04976-027
Figure 30. HD3 vs. V
35
–40
–45
–50
–55
–60
–65
DISTORTION (dBc)
–70
–75
–80
0.5 1.0 1.5 2.0 2.5 3.0
Figure 31. HD2 vs. V
GAIN
at Three Output Voltages, Low Gain (See Figure 53)
GAIN
f = 10MHz
f = 5MHz
f = 1MHz
V
(V)
GAIN
04976-030
at Three Frequencies, High Gain (See Figure 53)
f = 1MHz
2V p-p
1V p-p
0.5V p-p
V
GAIN
(V)
04976-031
–20
–30
DISTORTIO N (dBc)
–40
–50
–60
–70
–80
f = 10MHz
f = 1MHz
0.5 1.0 1.5 2.0 2.5 3.0
Figure 29. HD2 vs. V
HIGH GAIN
V
= 1V p-p
OUT
f = 5MHz
V
(V)
GAIN
at Three Frequencies, High Gain (See Figure 53)
GAIN
04976-029
–20
–30
–40
–50
–60
DISTORTION (dBc)
–70
–80
–90
0.5 1.0 1.5 2.0 2.5 3.0
Figure 32. HD3 vs. V
, at Three Output Voltages, Low Gain (See Figure 53)
GAIN
Rev. A | Page 11 of 28
2V p-p
1V p-p
0.5V p-p
V
GAIN
(V)
f = 1MHz
04976-032

AD8335
www.BDTIC.com/ADI
–35
f = 1MHz
–40
–45
–50
–55
DISTORTION (dBc)
–60
–65
2V p-p
1V p-p
0.5V p-p
40
V
= 1Vp-p
OUT
35
30
25
20
IP3 (dBm)
15
10
5
5MHz (HIGH)
5MHz (LOW )
–70
Figure 33. HD2 vs. V
1.0 1.50 0.5 2.0 2.5 3.0
V
(V)
GAIN
at Three Output Voltages, High Gain, f = 1 MHz
GAIN
04976-034
(See Figure 53)
–20
–30
–40
–50
–60
DISTORTION (dBc)
–70
–80
–90
0
0.5 1.0 1.5 2.0 2.5 3.0
Figure 34. HD3 vs. V
0
V
OUT
–10
V
GAIN
–20
–30
–40
–50
IMD3 (dBc)
–60
–70
–80
–90
110100
at Three Output Voltages, High Gain (See Figure 53)
GAIN
= 1V p-p
= 3V
IMD3 (LOW)
FREQUENCY (M Hz)
2V p-p
1V p-p
0.5V p-p
V
(V)
GAIN
IMD3 (HIGH)
f = 1MHz
04976-035
04976-036
Figure 35. IMD3 vs. Frequency
0
Figure 36. Output Referred IP3 (OIP3) vs. V
5
f = 10MHz
0
–5
–10
–15
INPUT POWER (dBm)
–20
–25
–30
10mV
100
90
10
0
HARMONIC DISTORTION (dBc)
50mV
1.0 1.50 0.5 2.0 2.5 3.0
V
(V)
GAIN
HLxx = HIGH
1.0 1.50 0.5 2.0 2.5 3.0
V
(V)
GAIN
Figure 37. Input P1dB (IP1dB) vs. V
10ns
GAIN
HLxx = LOW
GAIN
Figure 38. Small Signal Pulse Response, Low Gain (See Figure 51)
04976-037
04976-038
04976-039
Rev. A | Page 12 of 28

AD8335
www.BDTIC.com/ADI
2V
100
90
100mV
100
90
10
0
HARMONIC DIS TORTION ( dBc)
500mV
10ns
Figure 39. Large Signal Pulse Response, Low Gain (See Figure 51)
2
V
= 2V
GAIN
INPUT
1
(V)
0
OUT
V
–1
INPUT IS NOT TO SCALE
–2
0 102030405060708090100
= 47pF
C
L
C
L
C
CL = 0pF
= 22pF
= 10pF
L
TIME (ns)
Figure 40. Large Signal Pulse Response for Various Capacitive Loads,
= 0 pF, 10 pF, 20 pF, 47 pF Each Output (See Figure 51)
C
L
10
0
HARMONIC DIS TORTION ( dBc)
04976-040
100mV
100µs
04976-043
Figure 42. Small Signal Enable Response (See Figure 51)
2V
100
90
10
0
HARMONIC DIS TORTION ( dBc)
1V
04976-041
100µs
04976-044
Figure 43. Large Signal Enable Response (See Figure 51)
2V
100
90
10
0
HARMONIC DIS TORTION ( dBc)
500mV
Figure 41. Gain Response, V
Stepped from 0 V to3 V, V
GAIN
(See Figure 51)
400ns
= 2 V p-p
OUT
HARMONIC DIS TORTION ( dBc)
04976-042
50 mV p-p to 1.5 V p-p at Preamp Input (Measured at Preamp Output)
1V
100
90
10
0
Figure 44. Preamp Overdrive Recovery,
Rev. A | Page 13 of 28
1µs
04976-045

AD8335
www.BDTIC.com/ADI
95
1V
100
90
90
V
= 2.5V
85
80
75
GAIN
10
0
HARMONIC DIS TORTION ( dBc)
1µs
Figure 45. VGA Overdrive Recovery, 40 mV to 500 mV Input, V
0
–10
V
= 2.5V
GAIN
–20
–30
–40
PSRR (dB)
–50
–60
–70
–80
V
= 0.5V
GAIN
V
GAIN
100k 10M1M 100M
FREQUENCY ( Hz)
V
= 0V
GAIN
= 1.5V
Figure 46. PSRR vs. Frequency (All Bypass Capacitors Removed)
GAIN
04976-046
= 2.5 V
04976-100
70
QUIESCENT SUPPLY CURRENT (mA)
65
60
–40 –20 0 20 40 60 80 100
TEMPERATURE (°C)
Figure 47. Quiescent Supply Current vs. Temperature
2V
100
90
10
0
500mV
1µs
Figure 48 High/Low Response Time
04976-047
04976-101
Rev. A | Page 14 of 28

AD8335
A
R
A
www.BDTIC.com/ADI
TEST CIRCUITS
NETWORK AN
LYZ E
0.1µF
49.9Ω
22pF
50Ω
OUT
18nF
AD8335
0.1µF
249Ω
0.1µF
0.1µF
50Ω
IN
237Ω
28Ω
237Ω
28Ω
Figure 49. Test Circuit for Gain and Bandwidth Measurements
0.1µF
49Ω
22pF
AD8335
0.1µF
0.1µF
1:1
0.1µF
Figure 50. Test Circuit for Noise Measurements
SIGNAL
GENERATOR
50Ω
0.1µF
49.9Ω
50Ω
22pF
1:1
04976-048
Figure 51. Test Circuit for Transient Measurements
SPECTRUM
ANALYZER
50Ω
IN
0.1µF
04976-050
49.9Ω
22pF
Figure 52. Test Circuit for S11 Measurements
18nF
249Ω
0.1µF
0.1µF
237Ω
28Ω
237Ω
28Ω
LPF
0.1µF
50Ω
22pF
AD8335
0.1µF
Figure 53. Test Circuit Used for Distortion Measurements
18nF
AD8335
0.1µF
NETWORK AN
50Ω
18nF
249Ω
AD8335
0.1µF
SPECTRUM
ANALYZER
50Ω
IN
1:1
249Ω
0.1µF
0.1µF
0.1µF
0.1µF
LYZ ER
50Ω
INOUT
237Ω
237Ω
237Ω
28Ω
237Ω
28Ω
04976-051
28Ω
28Ω
50Ω
OSCILLOSCOPE
50Ω
IN
1:1
50Ω
1:1
04976-049
04976-052
Rev. A | Page 15 of 28

AD8335
www.BDTIC.com/ADI
THEORY OF OPERATION
Figure 54 is a simplified block diagram of a single channel. Each
channel consists of a low noise preamplifier (PrA) followed by a
VGA with a user-selectable gain of 20 dB or 28 dB. Channels are
enabled in pairs, Channel 1 and Channel 2, and Channel 3 and
Channel 4. The preamps are enabled by grounding the SPxx
pins and powered down by connecting them to the positive supply.
The ENxx pins are connected to the positive supply to enable
the VGAs and the overall channel. HLxx configures VGA for a
fixed gain of 20 dB or 28 dB, with 0 V or 5 V applied to the
HLxx pins, respectively. Channel 1 and Channel 2 share Pin HL12,
and Channel 3 and Channel 4 share Pin HL34. The HLxx pins
are typically hardwired to adjust the VGA gain according to an
ADC resolution of 12 bits for low gain and 10 bits for high gain.
The signal path is fully differential throughout to maximize
signal swing and reduce even-order distortion; however, the
preamplifiers are designed to be driven from a single-ended
signal source. Gain values are referenced from the single-ended
PrA input to the differential output of either the PrA or the
VGA. Again referring to Figure 54, the system gain is
distributed as listed in Tabl e 4.
In the remainder of this document, the gain values are rounded
to −10 dB to +38 dB for low gain mode and to −2 dB to +46 dB
for high gain mode. If desired, Equation 1 can be used to
calculate the gain at a value of V
GAIN
.
where ICPT = −16.1 dB for low gain mode −8.1 dB for high
gain mode.
Power consumption is 95 mW/channel from a 5 V supply, or
380 mW for all four channels. Power is distributed 35% for the
PrA, and 65% for the remainder of the circuit. The preamps can
be shut down via the SP12 and SP34 pins if a user wants to use
the VGAs only. However, to avoid feedthrough around the
preamp, feedback resistors should not be installed.
Table 4. Channel Gain Distribution
Section
PrA 18.06 18.06
Attenuator 0 to −48.16 0 to −48.16
Output Amp 20 27.96
Aggregate −10.1 to +38.6 −2.14 to +46.02
ENABLE SUMMARY
Table 5 summarizes the enable/shutdown logic and resulting
supply current.
dB
1.20[dB]
V
ICPTVGNGain +=
Low Nominal Gain
(dB)
(1)
High Nominal Gain
(dB)
Table 5. Control Pin Logic and Power Consumption
EN12 SP12 EN34 SP34 PrA1/PrA2 VGA1/VGA2 PrA3/PrA4 VGA3/VGA4 IS
High Low High Low On On On On 76 mA
High High High High Off On Off On 52 mA
Low Low Low Low Off Off Off Off 0.8 mA
Low High Low High Off Off Off Off 0.8 mA
+1
VINx
PONx
RFB
R
S
PIPx
PMDx
PrA
18dB
BIAS
INTERPOLATOR
ATT ENx
–48dB TO 0d B
+1
OUTPUTAMP
20dB OR 28dB
GAIN INTERFACE
+1
+1
+1
+1
VOHx
VOLx
HIGH/LO W
ENxx
POPx
VIPx
Figure 54. Simplified Block Diagram of Single Channel
VCMx
Rev. A | Page 16 of 28
VGNx
SLxx
HLxx
04976-054

AD8335
www.BDTIC.com/ADI
PREAMP
Although the preamp signal path is fully differential, the design
is optimized for single-ended input drive and signal source
resistance matching. Thus, the negative input to the differential
preamplifier PMDx pins must be ac-grounded to provide a
balanced differential signal at the PrA outputs. Detailed information regarding the preamplifier architecture is found in the
LNA section of the AD8331/AD8332 data sheet.
The preamplifier consists of a fixed gain amplifier with differential outputs. With the negative output available and a fixed gain
of 8 (18.06 dB), an active input termination is synthesized by
connecting a feedback resistor between the negative output and
the positive input, Pin PIPx. This technique is well known and
results in the input resistance shown in Equation 2.
R
R
IN
where A/2 is the single-ended gain, or the gain from the PIPx
inputs to the PONx outputs. Since the amplifier has a gain of ×8
from its input to its differential output, it is important to note
that the gain A/2 is the gain from Pin PIPx to Pin PONx, which
is 6 dB lower, or 12.04 dB (×4). The input resistance is reduced
by an internal bias resistor of 14.7 kΩ in parallel with the source
resistance connected to Pin PIPx, with Pin PMDx ac-grounded.
Equation 3 can be used to calculate the needed R
R
, and is used for higher values of RIN.
IN
R (3)
IN
For example, to set R
the simplified Equation 2 is used to calculate R
197 Ω, resulting in a less than 0.1 dB gain error. Factors such as
a widely varying source resistance might influence the absolute
gain accuracy more significantly. At higher frequencies, the
input capacitance of the PrA needs to be considered. The user
must determine the level of matching accuracy and adjust R
accordingly.
The bandwidths (BW) of the preamplifier and VGA are
approximately 110 MHz each, resulting in a cascaded BW of
approximately 80 MHz. Ultimately the BW of the PrA limits the
accuracy of the synthesized R
200 Ω, the best match is between 100 kHz and 10 MHz, where
FB
= (2)
=
)2/1( A
+
for a desired
FB
R
FB
k7.14||
)41( +
= 200 Ω, the value of RFB is 1.013 kΩ. If
IN
, the value is
IN
. For RIN = RS up to approximately
IN
FB
the lower frequency limit is determined by the size of the accoupling capacitors, and the upper limit is determined by the
preamplifier BW. Furthermore, the input capacitance and R
S
limits the BW at higher frequencies.
1k
=∞, CSH = 0pF
R
RIN = 500Ω, RFB = 2.5kΩ
R
= 200Ω, RFB = 1kΩ
IN
100
= 100Ω, RFB = 499Ω
R
IN
= 50Ω, RFB = 249Ω
R
INPUT IMPE DANCE (Ω)
IN
10
100k 1M 10M 50M
Figure 55. R
vs. Frequency for Various Values of RFB;
IN
Effects of R
SH
R
= 50Ω, CSH = 22pF
SH
R
=∞, CSH = 0pF
SH
= 50Ω, CSH = 22pF
R
SH
FREQUENCY ( Hz)
and CSH are also shown.
SH
04976-102
Figure 55 shows RIN vs. frequency for various values of RFB. Note
that at the lowest value, 50 Ω, R
peaks at frequencies greater
IN
than 10 MHz. This is due to the BW roll-off of the PrA as mentioned earlier. The R
and CSH network shown in Figure 58
SH
reduces this peaking.
However, as can be seen for larger R
values, parasitic
IN
capacitance starts rolling off the signal BW before the PrA can
produce peaking and the R
match. Therefore, R
greater than 50 Ω.
R
IN
and CSH should not be used for values of
SH
network further degrades the
SH/CSH
Noise
The total input referred noise (IRN) is approximately 1.3 nV/√Hz.
Allowing for a gain of ×8 in the preamp, the VGA noise is
0.46 nV/√Hz referred to the PrA input. The preamp noise is
1.2 nV/√Hz. It is important to note that these noise values
include all amplifier noise sources, including the VGA and the
preamplifier gain resistors. Frequently, manufacturer noise
specifications exclude gain setting resistors, and the voltage
noise spectral density of an op amp might be presented as
1 nV/√Hz. Including the gain resistors results in a much higher
noise specification.
Rev. A | Page 17 of 28

AD8335
www.BDTIC.com/ADI
Figure 56 shows the simulated noise figure (NF) vs. source
resistance, and various values of preamplifier R
from 50 Ω,
IN
to 14.7 kΩ, the value seen looking into the PIPx pins when
= ∞. As shown in the figure, the minimum NF for RIN = 50 Ω
R
FB
is slightly less than 7 dB. Note that, for this preamplifier, the NF
is optimized for the R
from 50 Ω to 200 Ω; for RFB = ∞, the
IN
minimum NF is at approximately 480 Ω. This optimum noise
resistance can also be calculated by dividing the input referred
voltage noise by the current noise.
16
INCLUDES NOISE OF VGA
14
f
= 1MHz
12
= 100Ω
R
R
IN
R
FB
IN
R
= 500Ω
FB
= 14.7kΩ
=
∞
R
(Ω)
S
IN
10
8
6
NOISE FIGURE (dB)
4
2
SIMULATION
0
10 100 1k
Figure 56. Simulated Noise Figure vs. R
Various Fixed Values of R
RIN = 50Ω
R
= 250Ω
FB
= 75Ω
R
IN
R
= 375Ω
FB
R
= 200Ω
IN
R
= 1kΩ
FB
for
, Actively Matched
S
04976-066
VGA
As seen in Figure 54, the basic architecture, an X-AMP®, consists
of a ladder attenuator, followed by a fixed gain amplifier with
selectable input stages. Earlier examples of this architecture are
to be found in the AD60x series, AD8331/AD8332, and AD8367
VGAs. Through a proprietary, temperature-compensated
interpolator design, the bias currents to the input g
continuously steered from right to left (decreasing attenuation)
resulting in increasing gain.
The HLxx gain pins (HL12 and HL34)select one of two output
amplifier networks consisting of the feedback resistors, amplifier
stages, and buffers.
Optimizing the System Dynamic Range
The VGA output gain switch of 8 dB (×2.5) optimizes the VGA
noise floor for a 10-bit or 12-bit ADC, assuming a full-scale ADC
input voltage of 1 V p-p.
At low gain, the ADC SNR should limit the system noise performance, whereas at high gains, the noise is defined by the source
and preamplifier. The maximum voltage swing is bounded by
the full-scale peak-to-peak ADC input voltage (typically 1 V p-p
to 2 V p-p). The noise performance is optimized by adjusting
the noise floor of the VGA according to the ADC resolution.
The SNR of a 12-bit converter is theoretically 12 dB better than
a 10-bit; however, approximately 8 dB is typical in practice,
accounting for the 8 dB gain option of the AD8335. The IRN
and the power consumption of the VGA are unaffected by
stages are
m
either gain setting; therefore, only the output referred noise
(ORN) changes (by 8 dB) without affecting any other parameters.
Attenuator
The attenuator is an 8-stage differential R-2R ladder with a total
attenuation of 48.16 dB or 6.02 dB per tap. The effective input
resistance per side is 320 Ω nominal for a total differential resistance of 640 Ω. The common-mode voltage of the attenuator
and the VGA is controlled by an amplifier that uses the same
midsupply voltage derived in the preamplifier, permitting dc
coupling of the PrA to the VGA without introducing large offsets
due to common-mode differences. However, when dc coupling
between the PrA and VGA, any offset from the PrA is amplified
as the gain is increased, producing an exponentially increasing
VGA output offset. When the PrA and the VGA are ac-coupled,
the output offset is unchanged with changes in gain (see Figure 15).
As a result, ac coupling is recommended for most applications.
As can be seen from Figure 54, The VCMx pins connect to the
respective midpoints on each channel and are used to ac decouple
the common-mode node at high frequencies. It is very important that at least a 0.1 µF capacitor be used, with better decoupling
at higher frequencies when another smaller capacitor (10 nF) is
connected in parallel. The internal +1 buffer provides correct
common-mode bias levels and any dynamic currents have to be
absorbed by the external decoupling capacitors.
Gain Control
The gain control interface has two inputs, V
(VGNx pins)
GAIN
and VSLP (SLxx pins). The slope input is intended only as a
decoupling pin, and the only guaranteed gain slope is the
20 dB/V default. However, if a voltage is applied to the VSLP
inputs, the gain slope can be increased by reducing the slope
voltage. For example, if a voltage of 1.67 V is applied to the SLxx
pins, the gain slope changes to 30 dB/V. Use Equation 4 to
calculate the gain slope.
VSLP
= (4)
V
varies the gain of the VGA through the interpolator by
GAIN
dB/V1.20V5.2 ×
Slope
selecting the appropriate input stages connected to the input
attenuator. The nominal V
range for 20 dB/V is 0 V to 3 V,
GAIN
with the best gain linearity from approximately 0.5 V to 2.5 V,
where the error is typically less than ±0.2 dB. For V
GAIN
voltages
above 2.5 V and less than 0.5 V, the error increases (see Figure 4).
The value of the V
voltage can be increased to that of the
GAIN
supply voltage, without gain foldover.
Each channel has separate gain control pins that can be
connected to a common voltage source such as found in most
ultrasound applications. For control of individual channels,
connect the appropriate gain control signal to each channel.
Rev. A | Page 18 of 28

AD8335
www.BDTIC.com/ADI
Output Stage
Duplicate output stages of the VGA provide an 8 dB (×2.5) gain
switch. The gain switch is intended to optimize the output noise
floor for either a 10-bit or a 12-bit ADC. The VGA gain is 20 dB
(×10) in low gain mode and 28 dB (×25) in high gain mode. The
logic setting of the HLxx pins selects between output amplifiers
including the gain resistors and feedback buffers.
100 MHz bandwidth is maintained between the amplifiers by
changing the compensation capacitance as the gain switches gain
settings. Power consumption is the same for either level of gain.
In certain applications, power consumption can be reduced by
lowering the supply voltage as much as possible; however, the
output dynamic range is affected by the more limited swing. The
fully differential signal path of the AD8335 restores 6 dB of
dynamic range, and the common-mode level is maintained
automatically at half the supply voltage for maximum signal
swing. The differential signal has the added benefit of suppressing the even order harmonics.
The output amplifier is designed to drive a nominal differential
load of 500 Ω or greater; the signal swing can be as large as
5 V p-p differential before clipping occurs. However, that distortion increases before reaching the clipping level. Distortion is
shown in Figure 25 through Figure 34 for typical values of
1 V p-p or 2 V p-p (full-scale inputs for many ADCs). The
output is ac-coupled to a differential antialias filter driving a
differential ADC. Most modern ADCs have differential inputs
and achieve optimum performance when driven differentially.
For more information, see the Applications Information section.
VGA Noise
As with all X-AMPs, the output noise of the VGA is constant
with gain. This causes the input referred noise to increase as the
gain is decreased. This characteristic is desirable in receiver
applications where wide dynamic range input signals are compressed with a fixed ceiling and noise floor into an ADC. The
VGA output noise is approximately 33 nV/√Hz in low gain
mode and 2.5 times higher than this, 83 nV/√Hz, in high gain
mode. As the gain increases, the noise of the preamplifier prevails
and, at the maximum VGA gain, the output noise is approximately 90 nV/√Hz and 225 nV/√Hz for low and high gain
modes, respectively.
The output SNR is determined by the noise floor and the largest
signal level, typically limited by the FS of the ADC. Modulation
noise, essentially the noise introduced by the gain control input,
can be troublesome. Normally one tends to look at the main
amplifier signal path for noise, but a VGA is really a multiplier
with the following function:
VVV×
IN
GAIN
=
OUT
where
V
REF
noise contributors under certain conditions. It is therefore
important that the gain control signals be kept clean, especially
at higher gain control slopes.
V
(bias) and V
(5)
REF
(gain control interface) are both
GAIN
Rev. A | Page 19 of 28

AD8335
www.BDTIC.com/ADI
APPLICATIONS INFORMATION
ULTRASOUND
The primary application for the AD8335 is medical ultrasound.
Figure 57 shows a simplified block diagram of an ultrasound
system. The most critical function of an ultrasound system is
the time gain control (TGC) compensation for physiological
signal attenuation. Because the attenuation of ultrasound
signals is exponential with respect to distance (time), a linearin-dB VGA is the optimal solution.
Key requirements in an ultrasound signal chain are very low
noise, active input termination, fast overload recovery, low
power, and differential drive to an ADC. Because ultrasound
machines use beamforming techniques requiring large binary
weighted numbers (for example, 32 to 512) of channels, the
lowest power at the lowest possible noise is of key importance.
TX HV AMPs
Most modern machines use digital beamforming. In this
technique, the signal is converted to digital format immediately
following the TGC amplifier; beamforming is done digitally.
Typical ADC resolution in general purpose machines is 10 bits
with sampling rates greater than 40 MSPS, and high-end
systems use 12 bits.
Power consumption and low cost are of primary importance in
low-end and portable ultrasound machines, and the AD8335 is
designed for these criteria.
For additional information regarding ultrasound systems, refer
to “How Ultrasound System Considerations Influence FrontEnd Component Choice”, Analog Dialogue, Vol. 36, No. 3,
May–July 2003.
(www.analog.com/library/analogDialogue/archives/36-03/
ultrasound/index.html)
BEAMFORMER
CENTRAL CONT ROL
MULTICHANNEL
TGC USES MANY VG As
Rx BEAMFORMER
(B AND F MODES)
IMAGE AND
MOTION
PROCESSING
(B MODE)
DOPPLER (PW )
DISPLAY
COLOR
PROCESSING
(F MODE)
04976-053
TRANSDUCER
ARRAY
128, 256 ETC.
ELEMENTS
HV
MUX/
DEMUX
BIDIRECTIO NAL
CABLE
TX BEAMFORMER
T/R
SWITCHES
TIME GAIN COMPENSATION
TGC
Figure 57. Simplified Ultrasound System Block Diagram
AD8335
LNAs
CW (ANALOG)
BEAMFORMER
AUDIO
OUTPUT
VGAs
SPECTRAL
DOPPLER
PROCESSING
MODE
Rev. A | Page 20 of 28

AD8335
×
www.BDTIC.com/ADI
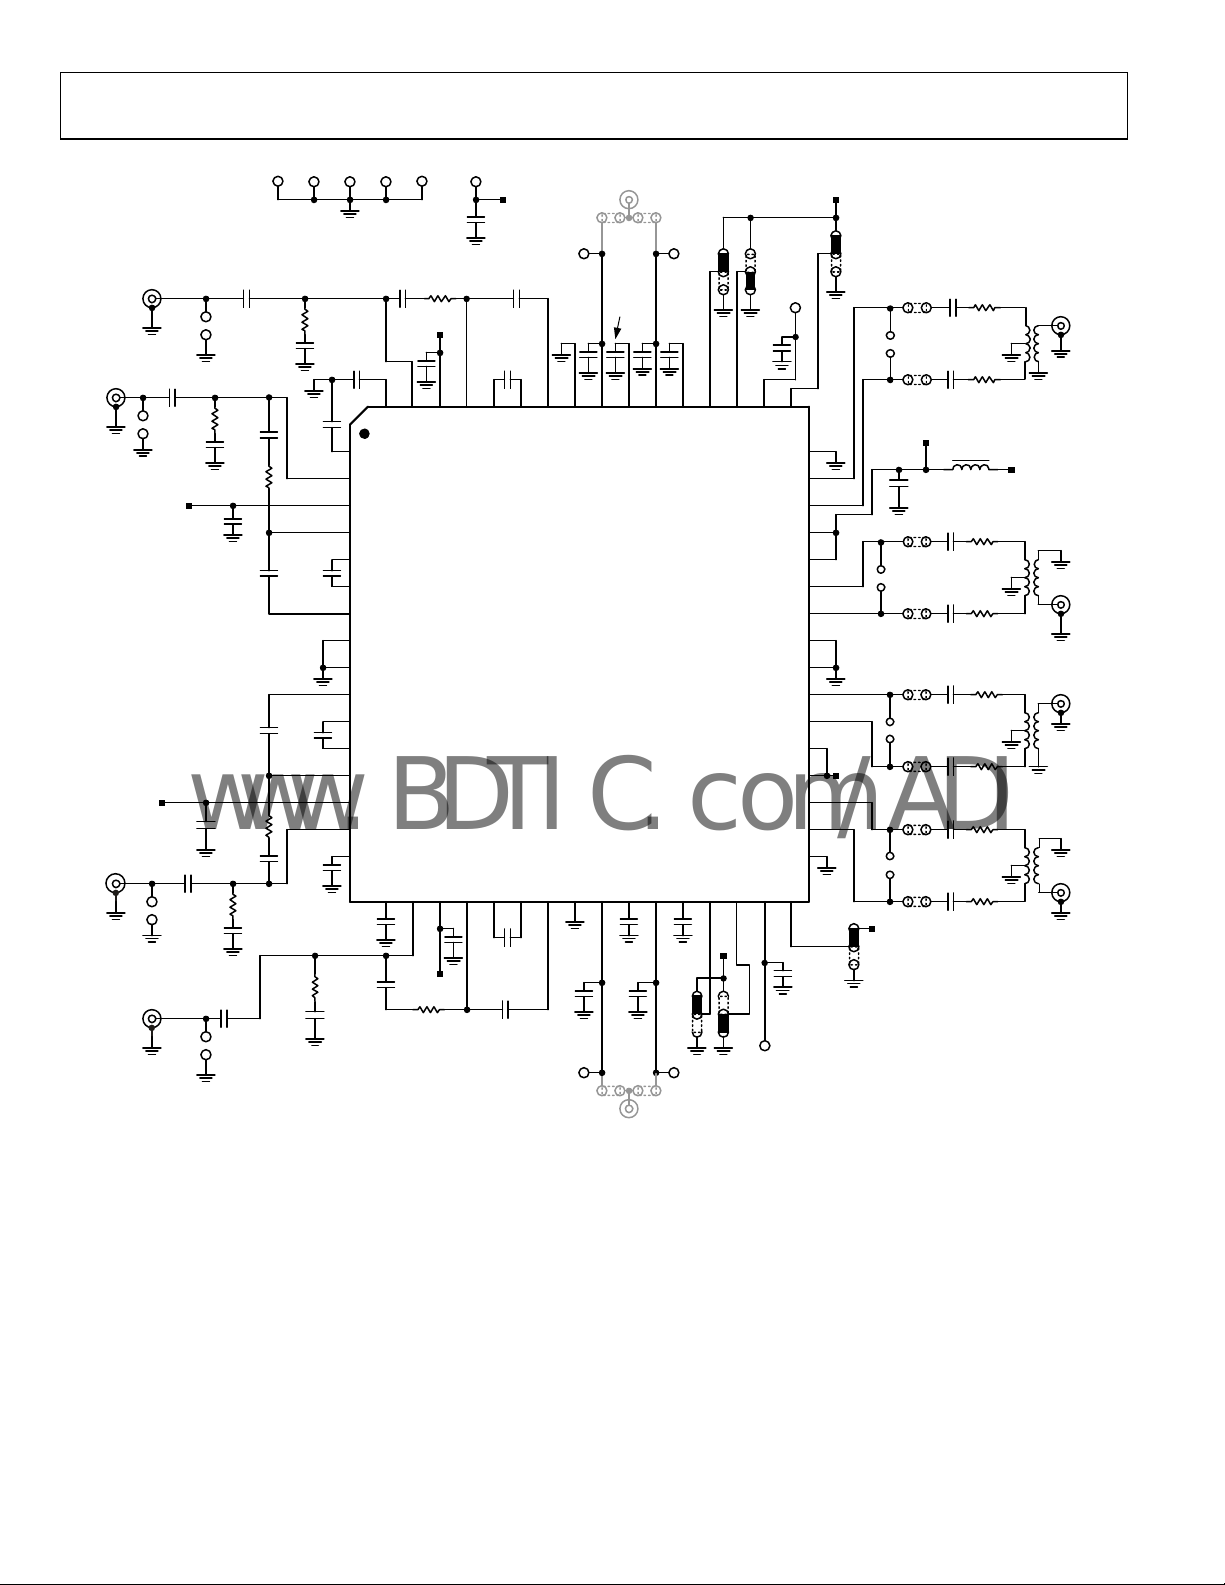
BASIC CONNECTIONS
Figure 58 shows the basic connections for the AD8335. Input
signals enter from the left and output signals exit from the right,
providing straight line signal paths. Of course, a device with
four differential VGAs such as this requires a multilayer printed
circuit board. Power supply isolation is shown for the preamps,
and for the VGA sections. If components are mounted to both
sides of the board, those in the signal path should be located on
the top, with power-supply decoupling components on the
wiring side.
PREAMP CONNECTIONS
To configure the AD8335 for input matching, a feedback resistor
) is ac-coupled between Pin PONx and Pin PIPx. AC coupling
(R
FB
accommodates dissimilar common-mode voltages at the input
and output ports. For values of R
is simply 5 × R
R
FB
. Table 6 lists a few larger values of source
SOURCE
PIP1
0.1µF
PIP2
RSH2
49.9Ω
C
22pF
+5V
PIP3
*SEE TEXT
2
SH
120nH FB
0.1µF
0.1µF
R
49.9Ω
C
22pF
0.1µF
0.1µF
SH
SH
R
FB
249Ω
3
3
PIP4
0.1µF
R
FB
249Ω
3
between 50 Ω and 200 Ω,
SOURCE
0.1µF
R
1
SH
49.9Ω
1
C
2
0.1µF
VPP
0.1µF
22pF
VPP
0.1µF
0.1µF
SH
VPP
0.1µF
0.1µF
49.9Ω
0.1µF
63
64
PMD1
1
PMD2
2
PIP2
3
VPP2
4
PON2
5
POP2
6
VIP2
7
VIN2
8
COM2
9
COM3
10
VIN3
11
VIP3
12
POP3
13
PON3
14
VPP3
15
PIP3
16
PMD3
PMD4
0.1µF
R
4
SH
C
4
SH
22pF
R
1
FB
0.1µF
249Ω
VPP
PIP1
VPP1
PON1
VPP4
VPP
0.1µF
R
FB
249Ω
PON4
20
4
PIP4
Figure 58. Basic Connections for R
0.1µF
0.1µF
5962 61 60
POP1
POP4
0.1µF
0.1µF
resistor (or R
1% feedback resistor. For values other those than listed in Table 6,
can be calculated using Equation 6. For values larger than
R
FB
1 kΩ, it may be advantageous to simply remove R
Table 6. Feedback Resistor Values for Various Input
Resistances
RIN (Ω) Exact RFB Value (Ω) Nearest Standard 1% Value (Ω)
200 1014 1.02k
500 2588 2.61k
1000 5365 5.36k
R
VGN1
1nF*
57
56 55 5154 53 5258
VIP1
VIP4
VIN1
AD8335
VIN4
23
VGN1
COM1
VGN4
COM4
24 29
1nF*
IN
), along with the exact value and nearest standard
IN
.
FB
R
5
1
1nF*
VGN2
VGN3
1nF*
IN
R
IN
−
k7.14
+5V
SL12
H
0.1µF
+5V
EN12
VCM2
VCM3
EN34
2825 26 2717 18 19 21 22
+5V
0.1µF
0.1µF
L
HL12
HL34
0.1µF
0.1µF
VOH1
0.1µF
0.1µF
0.1µF
0.1µF
0.1µF
VPV
0.1µF
0.1µF
+5V
VOL1
+5V
120nH FB
0.1µF
VOL2
VOH2
VOH3
VOL3
VOL4
VOH4
L
04976-056
48
47
46
45
VPV
44
43
42
41
40
39
38
37
36
35
34
33
H
49
50
SL12
SP12
GND1
VOH1
VOL1
VPV1
VPV2
VOL2
VOH2
GND2
GND3
VOH3
VOL3
VPV3
VPV4
VOL4
VOH4
GND4
SP34
SL34
30
31 32
SL34
= (6)
)(
FB
VGN2
0.1µF
VCM1
VCM4
0.1µF
VGN3VGN4
= 50 Ω
Rev. A | Page 21 of 28

AD8335
T
R
V
www.BDTIC.com/ADI
The preamp PMD pins must be capacitively coupled to ground.
Although the preamplifier is a differential design, the PMD pins
are the internal input bias nodes and are made available for
bypassing only. Do not use these pins as signal inputs.
The PIPx inputs must be capacitively coupled from the signal
source because they have a nominal dc level of more than half
the supply voltage. AC coupling capacitors throughout the circuit
should be as large as possible for the application. Although 0.1 µF
capacitors are shown in Figure 58 (and used in most positions
in the evaluation board), values of these capacitors should be
determined by the application. Capacitors used for coupling
PMDx and PIPx pins should be the same value.
When synthesizing low values of R
, the bandwidth of the
IN
preamplifier produces some peaking at the high end of the
frequency response. The optional series R
x/CSHx network
SH
shown in Figure 58 flattens the response (see Figure 55). With a
50 Ω source, the resistor and capacitor values should be 49.9 Ω
and 22 pF. For R
values greater than 100 Ω, the network is not
S
needed. The circuit is stable in either scenario.
The starred capacitors in Figure 58 (*) on the VGNx pins can be
removed when faster gain control signals are required.
INPUT OVERDRIVE
Excellent overload behavior is of primary importance in ultrasound. Both the preamplifier and VGA have built-in overdrive
protection and quickly recover after an overload event.
Input Overload Protection
As with any amplifier, voltage clamping prior to the inputs is
highly recommended if the application is subject to high
transient voltages.
A block diagram of a simplified ultrasound transducer interface
is shown in Figure 59. A common transducer element serves the
dual functions of transmit and receive of ultrasound energy.
During the transmit phase, high voltage pulses are applied to
the ceramic elements. A typical T/R (transmit/receive) switch
may consist of four high voltage diodes in a bridge configuration.
Although they ideally block transmit pulses from the sensitive
receiver input, diode characteristics are not ideal, and resulting
leakage transients impinging on the PIPx inputs can be
problematic.
Because ultrasound is a pulse system, and time-of-flight is
used to determine depth, quick recovery from input overloads
is essential. Overload can occur in the preamp and the VGA.
Immediately following a transmit pulse, the typical VGA gains
are low, and the PrA is subject to overload from T/R switch
leakage. With increasing gain, the VGA can become overloaded
from strong echoes that occur with near field echoes and
acoustically dense materials, such as bone.
Figure 59 illustrates an external overload protection scheme. A
pair of back-to-back Schottky diodes is installed prior to
installing the ac-coupling capacitors. Although the BAS40 is
shown, many types are available and merit investigation by the
Rev. A | Page 22 of 28
user. With such diodes, clamping levels of ±0.5 V or less greatly
enhance the system overload performance.
Rs
RANSDUCE
+H
OPTIONAL
SCHOTTKY
OVERLOAD
CLAMP
3
2
1
–HV
BAS40-04
Figure 59. Input Overload Protection
PIPx
PMDx
RFB
PrA
18dB
PONx
POPx
04976-057
LOGIC INPUTS
The EN12 and EN34 enable pins, the SP12 and SP34 preamp
shutdown pins, and the HL12 and HL34 high/low pins are all
logic inputs of the AD8335. The enable inputs turn on and off
each of the corresponding pairs of channels; the preamp
shutdown pins do the same for the preamplifiers only; inputs
HL12 and HL34 set the high/low gain for Channel 1 and
Channel 2, and Channel 3 and Channel 4, respectively.
Shutting down the preamplifiers allows use of the VGAs alone,
while reducing power consumption. The VGAs cannot be shut
down independently. The SPxx (shutdown preamp) pins are
logic high; thus, the pins are grounded to enable the preamplifiers.
The pins can be enabled by connecting to the supply or to
ground for fixed enable or disable, or to the output of a logic
device. Be sure to check the data sheet of the device for voltage
and current requirements.
COMMON-MODE PINS
The common-mode VCMx pins are provided for bypassing the
internal common-mode reference for each channel to ground.
They require a capacitor at each of the four pins and can neither
be connected together nor driven by an external source.
DRIVING ADCs
The AD8335 VGA is designed to drive 10-bit and 12-bit ADCs
with minimal extra components. Because the AD8335 is a single
supply 5 V part and many of the newest ADCs operate from a 3 V
supply, dissimilar common-mode voltages exist between the VGA
output and the ADC input. This level shift is most easily accommodated by ac coupling, especially if the signal is filtered, as is
the case in most ultrasound and communications applications.
When an antialiasing filter (AAF) is called for, it is advantageous
to implement a differential configuration. A fully differential
AAF requires approximately 1.5 times the number of components
than a single-ended filter, because the components that in the
single-ended case are tied to ground, now connect across the
differential signal path. Although the series components double,
the component count for the differential filter is more economical
when compared to simply building a pair of single-ended filters
requiring twice as many components.

AD8335
www.BDTIC.com/ADI
EVALUATION BOARD
The AD8335 evaluation board enables an efficient means to
become familiar with the operating characteristics and features
of the AD8335 quad VGA. Jumpers provide for exercising the
user-selectable features of the AD8335, such as the preamp and
VGAs and the optional high and low gain ranges. Test pins are
provided for power and gain voltage connections and for probes
used to observe waveforms at the input and outputs. Provisions
are also made for driving the gain controls dynamically.
All channels are tested for full functionality. The board is built
and tested using the components shown in black in the schematic
of Figure 61. Mounting patterns for optional SMA connectors
are provided for applying dynamic gain control inputs. The
components and jumpers are shown in gray in the schematic.
The input impedance of the LNA is configured for 50 Ω to
match the output impedance of most signal generators and
network analyzers. Input impedances up to 14.7 kΩ are obtained
with appropriate values of RFB1-4. refer to Tab le 6 for resistor
values. The board is designed for surface-mount components.
Optional high frequency transformers are provided for
differential to single-ended conversion of the output. Series
resistors protect the outputs from accidental short circuits,
limiting the output current. Transformer coupling is intended
for low impedance loads. 50 single-ended loads can be connected directly via the transformer-coupled SMA connectors.
The preferred signal detector is a high impedance differential
probe connected to the VOx 2-pin headers, as indicated in
Figure 62.
MEASUREMENT SETUP
The basic board connections for measuring bandwidth are
shown in Figure 62. A 5 V, 200 mA (minimum) power supply is
required for the supply rail, and a low noise voltage reference
supply is required for VGNx inputs
BOARD LAYOUT
The evaluation board circuitry is four layers, with power and
ground on the inner layers interconnecting circuitry on the
outer layers. Figure 63 through Figure 68 illustrate various
board layers, and Table 7 is a bill of materials.
Figure 60. Photograph of the AD8335-EVALZ Evaluation Board
Rev. A | Page 23 of 28
04976-060
AD8335
V
www.BDTIC.com/ADI
GND3
RS1
0.1µF
0.1µF
C60
0.1µF
0.1µF
RS4
49.9Ω
CS4
22pF
C9
C84
C21
GND2GND1 GND4
CFB1
0.018µF
C11
C8
0.1µF
0.1µF
63
64
PMD1
1
PMD2
2
PIN2
3
VPP2
4
PON2
5
POP2
6
VIP2
7
VIN2
8
COM2
9
COM3
10
VIN3
11
VIP3
12
POP3
13
PON3
14
VPP3
15
PIN3
16
PMD3
PMD4
C20
0.1µF
CFB4
0.018µF
0.1µF
PIN2
PIN3
PIN1
PIN4
C83
0.1µF
IN2
0.1µF
0.1µF
IN3
C26
C27
IN1
RS2
49.9Ω
CS2
22 pF
+5V
IN4
+5V
C71
0.1µF
CS3
22pF
0.1µF
0.018µF
0.1µF
0.1µF
CFB3
0.018µF
C24
0.1µF
C10
CFB2
RFB2
249Ω
C85
C65
RFB3
249Ω
RS3
49.9Ω
GND
49.9Ω
CS1
22pF
+5
+
C3
10µF
10V
RFB1
249Ω
+5V
PIN1
PIN4
C23
+5V
RFB4
249Ω
COMPONENTS
SHOWN IN GRAY
ARE NOT INSERTED
C14
0.1µF
C1
0.1µF
5962 61 60
VPP1
POP1
PON1
PON4
VPP4
POP4
20
C18
0.1µF
C19
0.1µF
+5V
58
VIP1
VIP4
23
VIN1
AD8335
VIN4
C64
1nF
VGN4
VGN12
VGNM1
VGN1
C16
1nF
57
56 55 5154 53 52
COM1
C68
0.1µF
VGN1
C81
1nF
VCM1
VGNM2
U1
VCM4
COM4
VGN4
24
C74
0.1µF
C80
1nF
VGNM4 VGNM3
VGN34
VGN2
E
SP
D
EN12
EN34
+5V
30
0.1µF
SP12
SP34
SP
SP34
EP
SP12
EP
C57
50
SL12
SL34
31 32
SL34
SL12
49
GND1
VOH1
VOL1
VPV1
VPV2
VOL2
VOH2
GND2
GND3
VOH3
VOL3
VPV3
VPV4
VOL4
VOH4
GND4
EN12
C53
0.1µF
VGN2
VCM2
VGN3
VCM3
29
2825 26 2717 18 19 21 22
C55
0.1µF C62
E
EN34
D
VGN3
HL12
HL34
0.1µF
+5V
H
HL12
L
48
47
46
45
44
43
42
41
40
39
38
37
36
35
34
33
VPV
0.1µF
H
+5V
HL34
L
C7
VO2
VO4
VO1
VO3
W1
W2
W3
W4
W5
W6
W7
W8
VPV
VPV
C34
0.1µF
C36
0.1µF
120 nH FB
C39
0.1µF
C41
0.1µF
C44
0.1µF
C46
0.1µF
C49
0.1µF
C51
0.1µF
R26
237Ω
R28
237Ω
L2
R31
237Ω
R33
237Ω
R36
237Ω
R38
237Ω
R41
237Ω
R43
237Ω
1:1
T4
T1
1:1
+5V
T2
1:1
T3
1:1
VO1
VO2
VO3
VO4
04976-061
Figure 61. AD8335-EVALZ Schematic Diagram
Rev. A | Page 24 of 28

AD8335
V
O
www.BDTIC.com/ADI
PREC ISION
NETWORK AN ALYZER
LTAGE REFERENCE
(FOR VGAIN)
POWER
SUPPLY
GND
GND
+5 V
SIGNAL
INPUT
04976-063
PROB E
POWER SUPPL Y
Figure 62. AD8335-EVALZ Typical Test Connections
DIF FEREN TIAL PROBE
04976-063
Rev. A | Page 25 of 28

AD8335
www.BDTIC.com/ADI
Figure 63. AD8335-EVALZ Assembly
Figure 64. AD8335-EVALZ Component Side Copper
04976-064
Figure 65. AD8335-EVALZ Secondary Side Copper
04976-065
Figure 66. AD8335-EVALZ Internal Power Plane
04976-069
04976-070
Rev. A | Page 26 of 28

AD8335
www.BDTIC.com/ADI
Figure 67. AD8335-EVALZ Internal Ground Plane
04976-071
Figure 68. AD8335-EVALZ Primary Side Silk screen
04976-072
BILL OF MATERIALS
Table 7.
Manufacturer
Qty Reference Designator Description Manufacturer
1 +5 V 0.125 in diameter red test loop Components Corp. TP-104-01-02
5 GND to GND4 0.125 in diameter black test loop Components Corp. TP-104-01-00
6 SL12, SL34, VGN1 to VGN4 0.125 in diameter black test loop Components Corp. TP-104-01-07
35
C1, C7, C8, C9, C10, C11, C14, C18, C19,
C20, C21, C23, C24, C26, C27, C34, C36,
C39, C41, C44, C46, C49, C51, C53, C55,
C57, C60, C62, C65, C68, C71, C74, C83,
C84, C85
4 C16, C64, C80, C81 1 nF, 10%, 100 V, 0603 capacitor Panasonic ECJ-1VB2Z102K
4 CFB1 to CFB4 0.018 F, 0603 capacitor Panasonic ECJ-1VB1E183K
4 CS1 to CS4 22 pF, 5%, 50 V, 0603 Panasonic ECJ-1VC1H220J
16 IN1 to IN4, VO1 to VO4, W1 to W8 0.1 in, 2-pin header FCI 69157-102
8 PIN1 to PIN4, VO1 to VO4 SMA, right angle PC mount/connector Amphenol 901-143-6RFX
1 L2 Ferrite bead, 120 nH, 0603 inductor Murata BLM18BA750SN1D
8 R26, R28, R31, R33, R36, R38, R41, R43 237 Ω, 1%. 1/10 W, 0603 resistor Panasonic-ECG ERJ-6ENF2370V
4 RFB1 to RFB4 249 Ω, 1%. 1/10 W, 0603 resistor Panasonic-ECG ERJ-2RKF2490X
4 RS1 to RS4 49.9 Ω, 1%. 1/10 W, 0603 resistor Panasonic-ECG ERJ-6ENF49R9V
6 EN12, EN34, HL12, HL34, SP12, SP34 0.1 in, 3-pin header Molex 22-10-2031
4 T1 to T4 RF, 0.015 MHz to 300 MHz transformer Mini Circuits T1-6T KK81
1 U1 Integrated circuit, quad VGA Analog Devices AD8335ACPZ
1 C3 10 µF, 10 V, tantalum, Size A capacitor Panasonic-ECG ECS-T1AY106R
0.1 F, 16 V, 0603 ceramic capacitor Kemet C0603C104K4RAC
Part Number
Rev. A | Page 27 of 28

AD8335
www.BDTIC.com/ADI
OUTLINE DIMENSIONS
9.00
BSC SQ
PIN 1
INDICATOR
0.60 MAX
0.60 MAX
49
48
0.30
0.25
0.18
1
PIN 1
INDICATOR
64
1.00
0.85
0.80
SEATING
PLANE
12° MAX
TOP
VIEW
0.80 MAX
0.65 TY P
0.50 BSC
33
32
EXPOSED
PADDLE
4.9 MM SQ
(BOTTOM VIEW)
7.50
REF
8.75
BSC SQ
0.50
0.40
0.30
0.05 MAX
0.02 NOM
0.20 REF
*
COMPLIANT TO JEDEC STANDARDS MO-220-VMMD-4
EXCEPT FOR EXPOSED PAD DIMENSION
17
*
4.85
4.70 SQ
4.55
16
THE EXPOSED PAD IS NOT CONNECTED
INTERNALLY. FOR INCREASED RELIABILITY
OF THE SOLDER JOINTS AND MAXIMUM
THERMAL CAPABILITY IT IS RECOMMENDED
THAT THE PAD BE SOLDERED TO
THE G ROUND PLANE.
Figure 69. 64-Lead Lead Frame Chip Scale Package [LFCSP_VQ]
9 mm × 9 mm Body, Very Thin Quad
(CP-64-1)
Dimensions shown in millimeters
ORDERING GUIDE
Model Temperature Range Package Description Package Option
AD8335ACPZ
AD8335ACPZ-REEL
AD8335ACPZ-REEL7
AD8335-EVALZ
1
Z = RoHS Compliant Part.
1
−40°C to +85°C 64-Lead Lead Frame Chip Scale Package [LFCSP_VQ] CP-64-1
1
−40°C to +85°C 64-Lead Lead Frame Chip Scale Package [LFCSP_VQ] CP-64-1
1
−40°C to +85°C 64-Lead Lead Frame Chip Scale Package [LFCSP_VQ] CP-64-1
1
Evaluation Board
©2004–2008 Analog Devices, Inc. All rights reserved. Trademarks and
registered trademarks are the property of their respective owners.
D04976-0-8/08(A)
Rev. A | Page 28 of 28
 Loading...