

100 dB Range (10 nA to 1 mA)
FEATURES
Optimized for fiber optic photodiode interfacing
Measures current over 5 decades
Law conformance 0.1 dB from 10 nA to 1 mA
Single- or dual-supply operation (3 V to 12 V total)
Full log-ratio capabilities
Nominal slope of 10 mV/dB (200 mV/decade)
Nominal intercept of 1 nA (set by external resistor)
Optional adjustment of slope and intercept
Complete and temperature stable
Rapid response time for a given current level
Miniature 16-lead chip scale package
(LFCSP 3 mm × 3 mm)
Low power: ~5 mA quiescent current
APPLICATIONS
Optical power measurement
Wide range baseband logarithmic compression
Measurement of current and voltage ratios
Optical absorbance measurement
200kΩ
V
BIAS
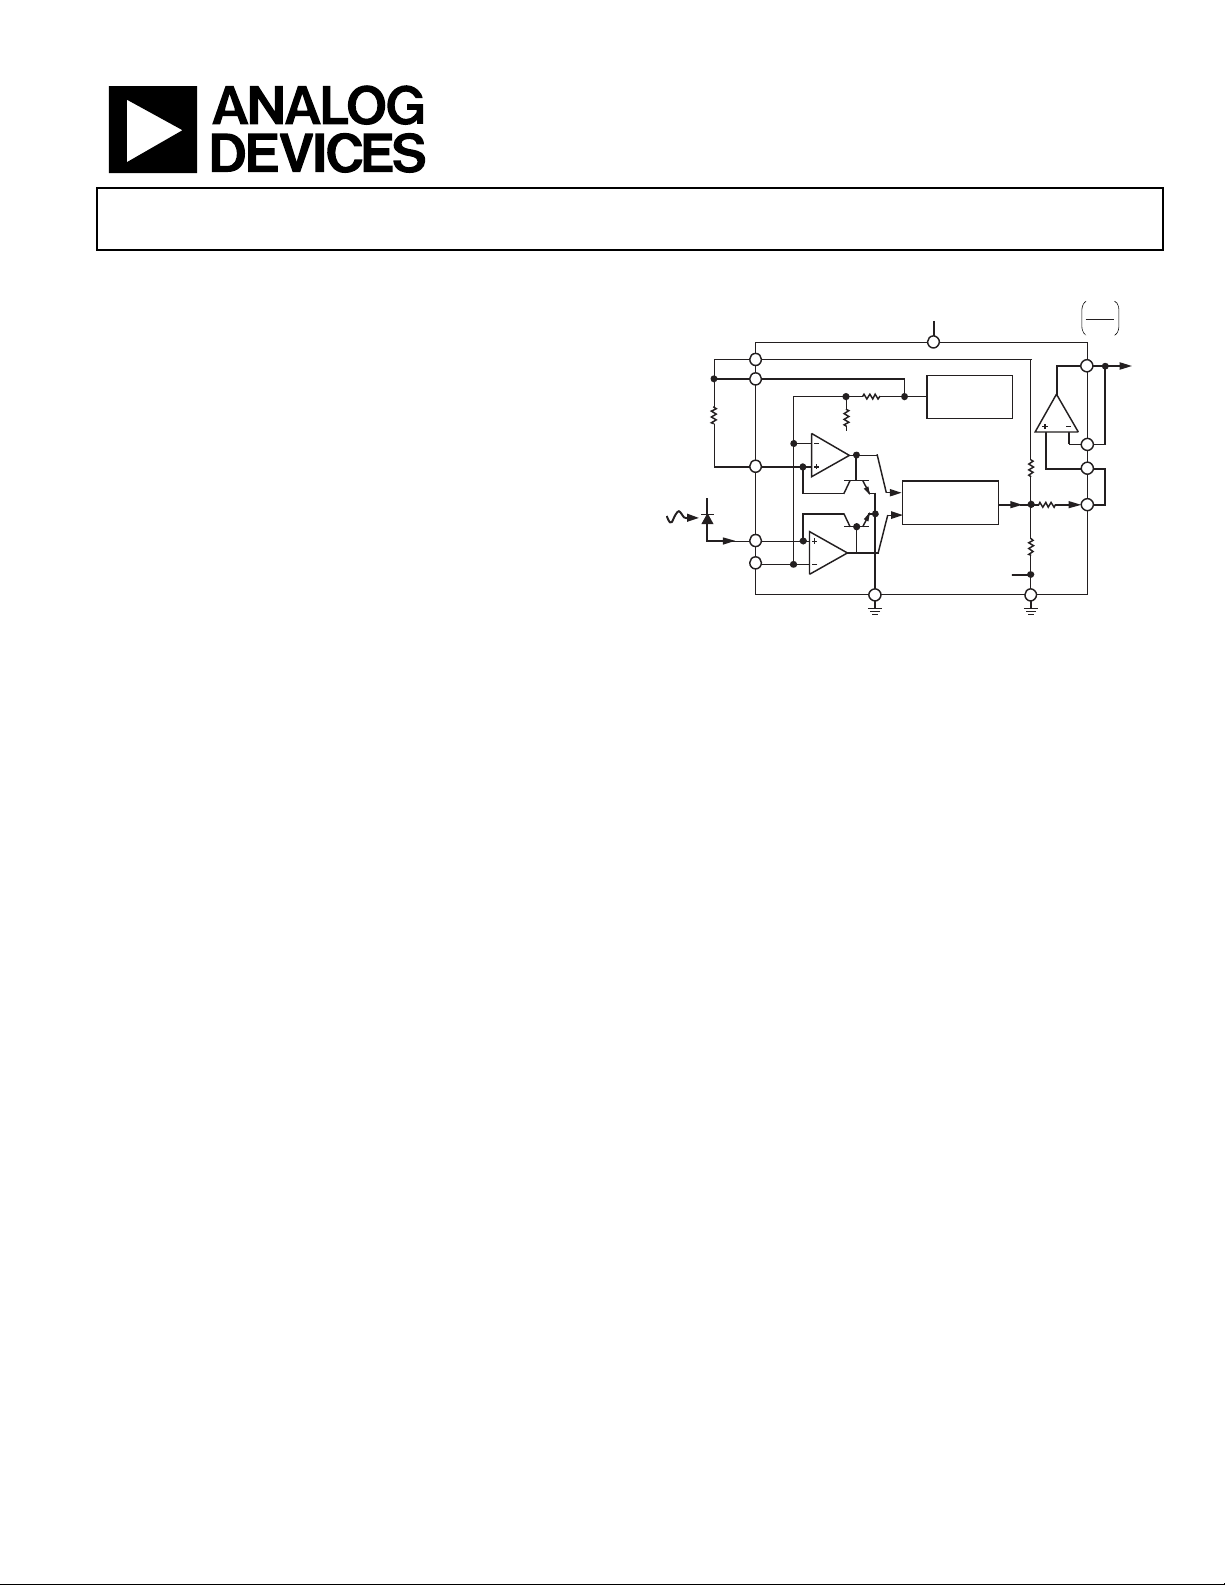
Logarithmic Converter
FUNCTIONAL BLOCK DIAGRAM
V
P
80kΩ
Q2
Q1
VPOS
2.5V
V
BE2
TEMPERATURE
–
+
COMPENSAT ION
V
BE1
Figure 1.
BIAS
GENERATOR
VRDZ
VREF
IREF
I
PD
INPT
VSUM
0.5V
20kΩ
COMM
0.5V
VNEG
AD8305
0.20 log
14.2kΩ
I
LOG
6.69kΩ
COMM
SCAL
451Ω
COMM
10
BFIN
I
PD
1nA
VOUT
VLOG
03053-001
GENERAL DESCRIPTION
The AD83051 is an inexpensive microminiature logarithmic converter
optimized for determining optical power in fiber optic systems. It uses
an advanced implementation of a classic translinear (junction based)
technique to provide a large dynamic range in a versatile and easily
used form. A single-supply voltage of between 3 V and 12 V is
adequate; dual supplies may optionally be used. The low quiescent
current (typically 5 mA) permits use in battery-operated applications.
The input current, I
collector current of an optimally scaled NPN transistor, which converts
this current to a voltage (V
second such converter is used to handle the reference current (I
applied to pin I
(0.5 V). This is generally acceptable for photodiode applications where
the anode does not need to be grounded. Similarly, this bias voltage is
easily accounted for in generating I
front end is available at Pin VLOG.
The basic logarithmic slope at this output is nominally 200 mV/decade
(10 mV/dB). Thus, a 100 dB range corresponds to an output change of
1 V. When this voltage (or the buffer output) is applied to an ADC that
permits an external reference voltage to be employed, the AD8305
voltage reference output of 2.5 V at Pin VREF can be used to improve
the scaling accuracy. Suitable ADCs include the AD7810 (serial 10-bit),
AD7823 (serial 8-bit), and AD7813 (parallel, 8-bit or 10-bit). Other
values of the logarithmic slope can be provided using a simple external
resistor network.
1
Protected by U.S. Patent No. 5,519,308.
, of 10 nA to 1 mA applied to the INPT pin is the
PD
) with a precise logarithmic relationship. A
BE
. These input nodes are biased slightly above ground
REF
. The output of the logarithmic
REF
REF
)
The logarithmic intercept (also known as the reference current) is
nominally positioned at 1 nA by the use of the externally generated
current, I
, of 10 μA, provided by a 200 kΩ resistor connected
REF
between VREF, at 2.5 V, and the reference input, IREF, at 0.5 V. The
intercept can be adjusted over a wide range by varying this resistor.
The AD8305 can also operate in a log ratio mode, with the numerator
current applied to INPT and the denominator current applied to IREF.
A buffer amplifier is provided for driving a substantial load, for use in
raising the basic slope of 10 mV/dB to higher values, as a precision
comparator (threshold detector), or in implementing low-pass filters.
Its rail-to-rail output stage can swing to within 100 mV of the positive
and negative supply rails, and its peak current sourcing capacity is
25 mA.
It is a fundamental aspect of translinear logarithmic converters that the
small signal bandwidth falls as the current level diminishes, and the
low frequency noise-spectral density increases. At the 10 nA level, the
bandwidth of the AD8305 is about 50 kHz and increases in proportion
to I
up to a maximum value of about 15 MHz. Using the buffer
PD
amplifier, the increase in noise level at low currents can be addressed by
using it to realize lowpass filters of up to three poles.
The AD8305 is available in a 16-lead LFCSP package and is specified
for operation from −40°C to +85°C.
Rev. B
Information furnished by Analog Devices is believed to be accurate and reliable. However, no
responsibility is assumed by Analog Devices for its use, nor for any infringements of patents or other
rights of third parties that may result from its use. Specifications subject to change without notice. No
license is granted by implication or otherwise under any patent or patent rights of Analog Devices.
Trademarks and registered trademarks are the property of their respective owners.
One Technology Way, P.O. Box 9106, Norwood, MA 02062-9106, U.S.A.
Tel: 781.329.4700 www.analog.com
Fax: 781.461.3113 ©2003–2010 Analog Devices, Inc. All rights reserved.

AD8305
TABLE OF CONTENTS
Features .............................................................................................. 1
Applications ....................................................................................... 1
Functional Block Diagram .............................................................. 1
General Description ......................................................................... 1
Revision History ............................................................................... 2
Specifications ..................................................................................... 3
Absolute Maximum Ratings ............................................................ 4
ESD Caution .................................................................................. 4
Pin Configuration and Function Descriptions ............................. 5
Typical Performance Characteristics ............................................. 6
General Structure ........................................................................... 11
Theory .......................................................................................... 11
REVISION HISTORY
4/10—Rev. A to Rev. B
Updated Data Sheet ............................................................ Universal
Change to Figure 2 and Table 3 ...................................................... 5
Added Power Supply Sequencing Section ................................... 12
Added Figure 34; Renumbered Sequentially .............................. 12
Changes to Ordering Guide .......................................................... 24
3/03—Rev. 0 to Rev. A
Changes to TPC 3 ............................................................................. 4
Changes to TPC 18 ........................................................................... 6
Changes to Figure 3 ........................................................................ 11
Changes to Figure 8 ........................................................................ 13
Updated Outline Dimensions ....................................................... 18
Managing Intercept and Slope .................................................. 12
Response Time and Noise Considerations ............................. 12
Power Supply Sequencing ......................................................... 12
Applications ..................................................................................... 14
Calibration ....................................................................................... 15
Using A Negative Supply ............................................................... 16
Log-Ratio Applications .................................................................. 17
Reversing The Input Polarity ........................................................ 18
Characterization Methods ............................................................. 19
Evaluation Board ............................................................................ 21
Outline Dimensions ....................................................................... 24
Ordering Guide .......................................................................... 24
Rev. B | Page 2 of 24

AD8305
SPECIFICATIONS
VP = 5 V, VN = 0 V, TA = 25°C, R
Table 1.
Parameter Conditions Min Typ Max Unit
INPUT INTERFACE Pin 4, INPT, Pin 3, IREF
Specified Current Range, IPD Flows toward INPT pin 10 nA
1 mA
Input Current Min/Max Limits Flows toward INPT pin 10 mA
Reference Current, I
, Range Flows toward IREF pin 10 nA
REF
1 mA
Summing Node Voltage Internally preset; may be altered by the user 0.46 0.5 0.54 V
Temperature Drift −40°C < TA < +85°C 0.015 mV/°C
Input Offset Voltage V
LOGARITHMIC OUTPUT Pin 9, VLOG
Logarithmic Slope 190 200 210 mV/dec
−40°C < TA < +85°C 185 215 mV/dec
Logarithmic Intercept
1
0.3 1 1.7 nA
−40°C < TA < +85°C 0.1 2.5 nA
Law Conformance Error 10 nA < IPD < 1 mA 0.1 0.4 dB
Wideband Noise
Small Signal Bandwidth
2
2
I
Maximum Output Voltage 1.7 V
Minimum Output Voltage Limited by VN = 0 V 0.01 V
Output Resistance 4.375 5 5.625 kΩ
REFERENCE OUTPUT Pin 2, VREF
Voltage With Reference to Ground 2.435 2.5 2.565 V
−40°C < TA < +85°C 2.4 2.6 V
Maximum Output Current Sourcing (grounded load) 20 mA
Incremental Output Resistance Load current < 10 mA 2 Ω
OUTPUT BUFFER Pin 10, BFIN; Pin 11, SCAL; Pin 12, VOUT
Input Offset Voltage −20 +20 mV
Input Bias Current Flowing out of Pin 10 or Pin 11 0.4 mA
Incremental Input Resistance 35 MΩ
Output Range RL = 1 kΩ to ground VP − 0.1 V
Incremental Output Resistance Load current < 10 mA 0.5 Ω
Peak Source/Sink Current 25 mA
Small Signal Bandwidth GAIN = 1 15 MHz
Slew Rate 0.2 V to 4.8 V output swing 15 V/μs
POWER SUPPLY Pin 8, VPOS; Pin 6 and Pin 7, VNEG
Positive Supply Voltage (VP − VN) ≤ 12 V 3 5 12 V
Quiescent Current 5.4 6.5 mA
Negative Supply Voltage (Optional) (VP − VN) ≤ 12 V −5.5 0 V
1
Other values of logarithmic intercept can be achieved by adjusting R
2
Output noise and incremental bandwidth are functions of input current, measured using output buffer connected for GAIN = 1.
= 200 kΩ, and VRDZ connected to VREF, unless otherwise noted.
REF
− V
, V
− V
INPT
SUM
IREF
−20 +20 mV
SUM
IPD > 1 μA 0.7 mV√Hz
> 1 μA 0.7 MHz
PD
.
REF
Rev. B | Page 3 of 24
AD8305
ABSOLUTE MAXIMUM RATINGS
Table 2.
Parameter Rating
Supply Voltage VP − VN 12 V
Input Current 20 mA
Internal Power Dissipation 500 mW
1
θ
30°C/W
JA
Maximum Junction Temperature 125°C
Operating Temperature Range −40°C to +85°C
Storage Temperature Range −65°C to +150°C
Lead Temperature (Soldering 60 sec) 300°C
1
With package die paddle soldered to thermal pad containing nine vias
connected to inner and bottom layers.
Stresses above those listed under Absolute Maximum Ratings
may cause permanent damage to the device. This is a stress
rating only; functional operation of the device at these or any
other conditions above those indicated in the operational
section of this specification is not implied. Exposure to absolute
maximum rating conditions for extended periods may affect
device reliability.
ESD CAUTION
Rev. B | Page 4 of 24

AD8305
PIN CONFIGURATION AND FUNCTION DESCRIPTIONS
16 COMM
15 COMM
14 COMM
13 COMM
VRDZ 1
VREF 2
IREF 3
INPT 4
NOTES
1. CONNECT EPAD TO GROUND.
PIN 1
INDICATOR
AD8305
TOP VIEW
(Not to Scale)
VNEG 6
VSUM 5
12 VOUT
11 SCAL
10 BFIN
9 VLOG
VPOS 8
VNEG 7
03053-002
Figure 2. Pin Configuration
Table 3. Pin Function Descriptions
Pin No. Mnemonic Function
1 VRDZ
Top of a Resistive Divider Network that Offsets V
to Position the Intercept. Normally connected to VREF;
LOG
may also be connected to ground when bipolar outputs are to be provided.
2 VREF Reference Output Voltage of 2.5 V.
3 IREF Accepts (Sinks) Reference Current, I
4 INPT
Accepts (Sinks) Photodiode Current, I
.
REF
. Usually connected to photodiode anode such that photo current
PD
flows into INPT.
5 VSUM
Guard Pin. Used to shield the INPT current line and for optional adjustment of the INPT and I
REF
node
potential.
6, 7 VNEG Optional Negative Supply, VN (this pin is usually grounded; for details of usage, see the Applications section.
8 VPOS Positive Supply, (VP − VN ) ≤ 12 V.
9 VLOG Output of the Logarithmic Front End.
10 BFIN Buffer Amplifier Noninverting Input.
11 SCAL Buffer Amplifier Inverting Input.
12 VOUT Buffer Output.
13 to 16 COMM Analog Ground.
EPAD The exposed pad must be soldered to ground.
Rev. B | Page 5 of 24
AD8305
R
R
R
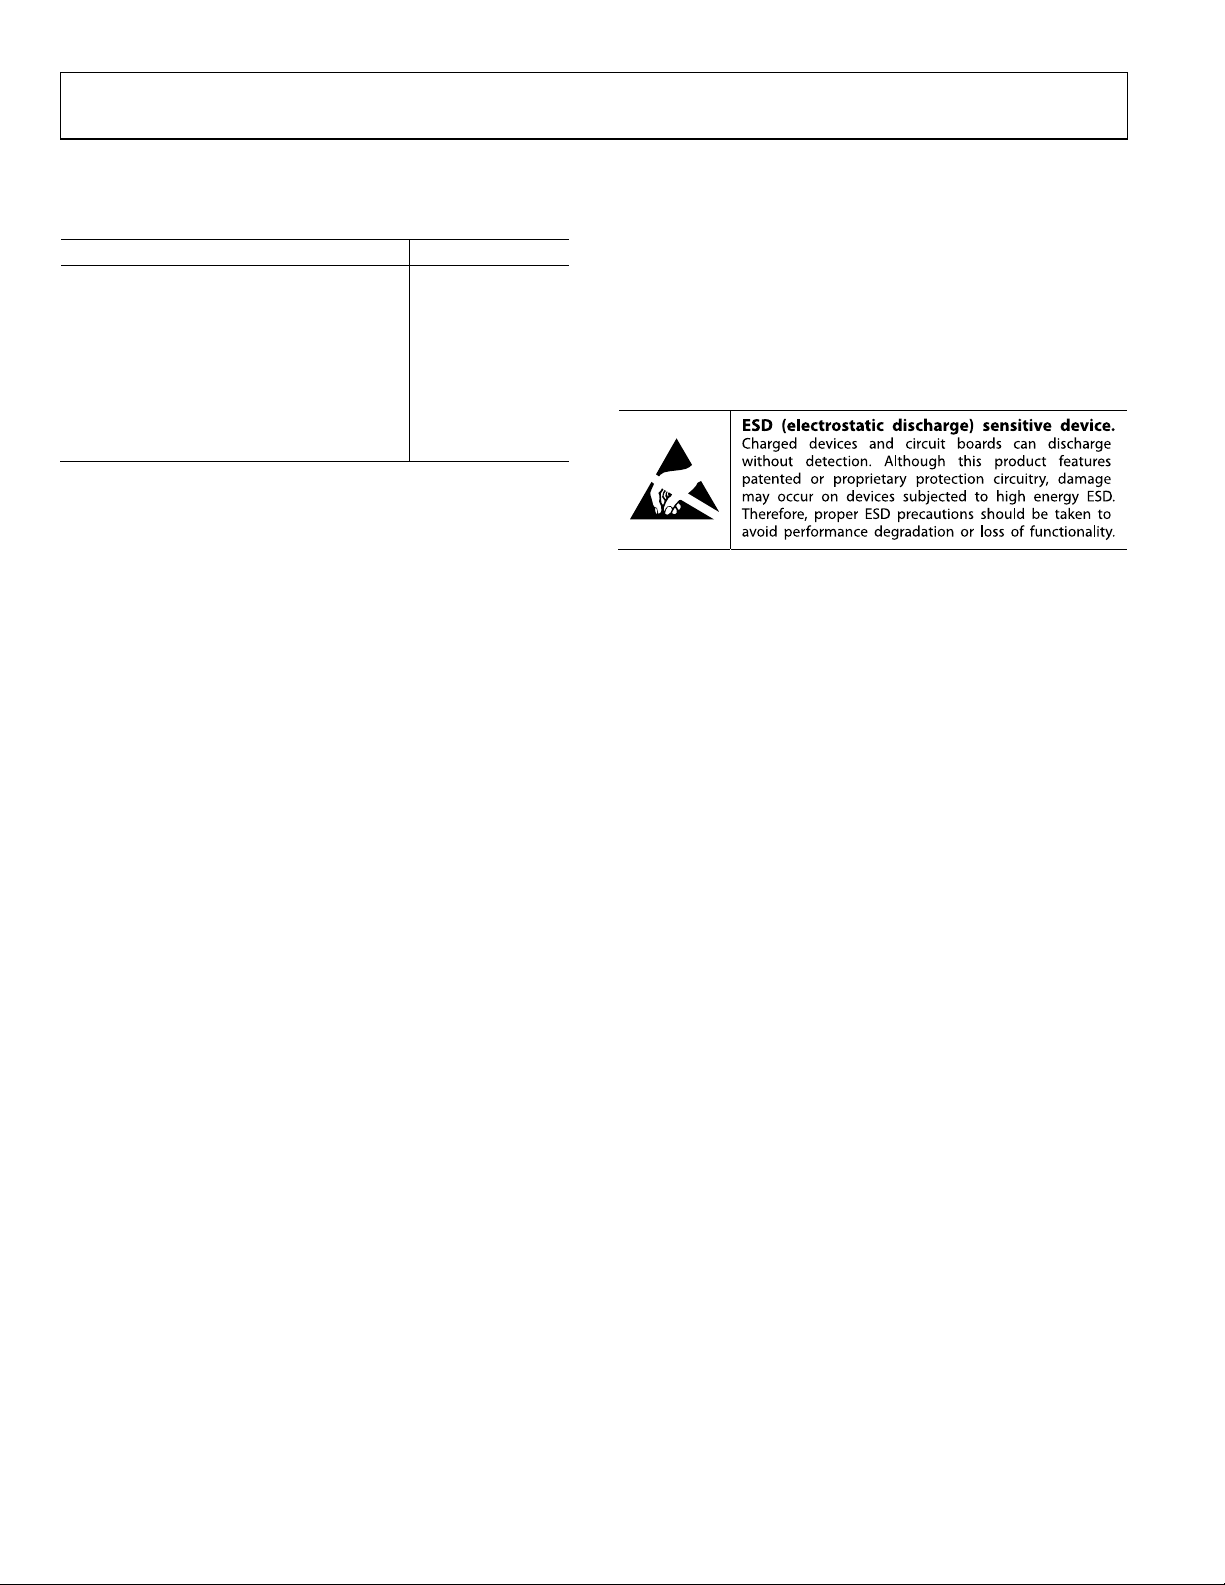
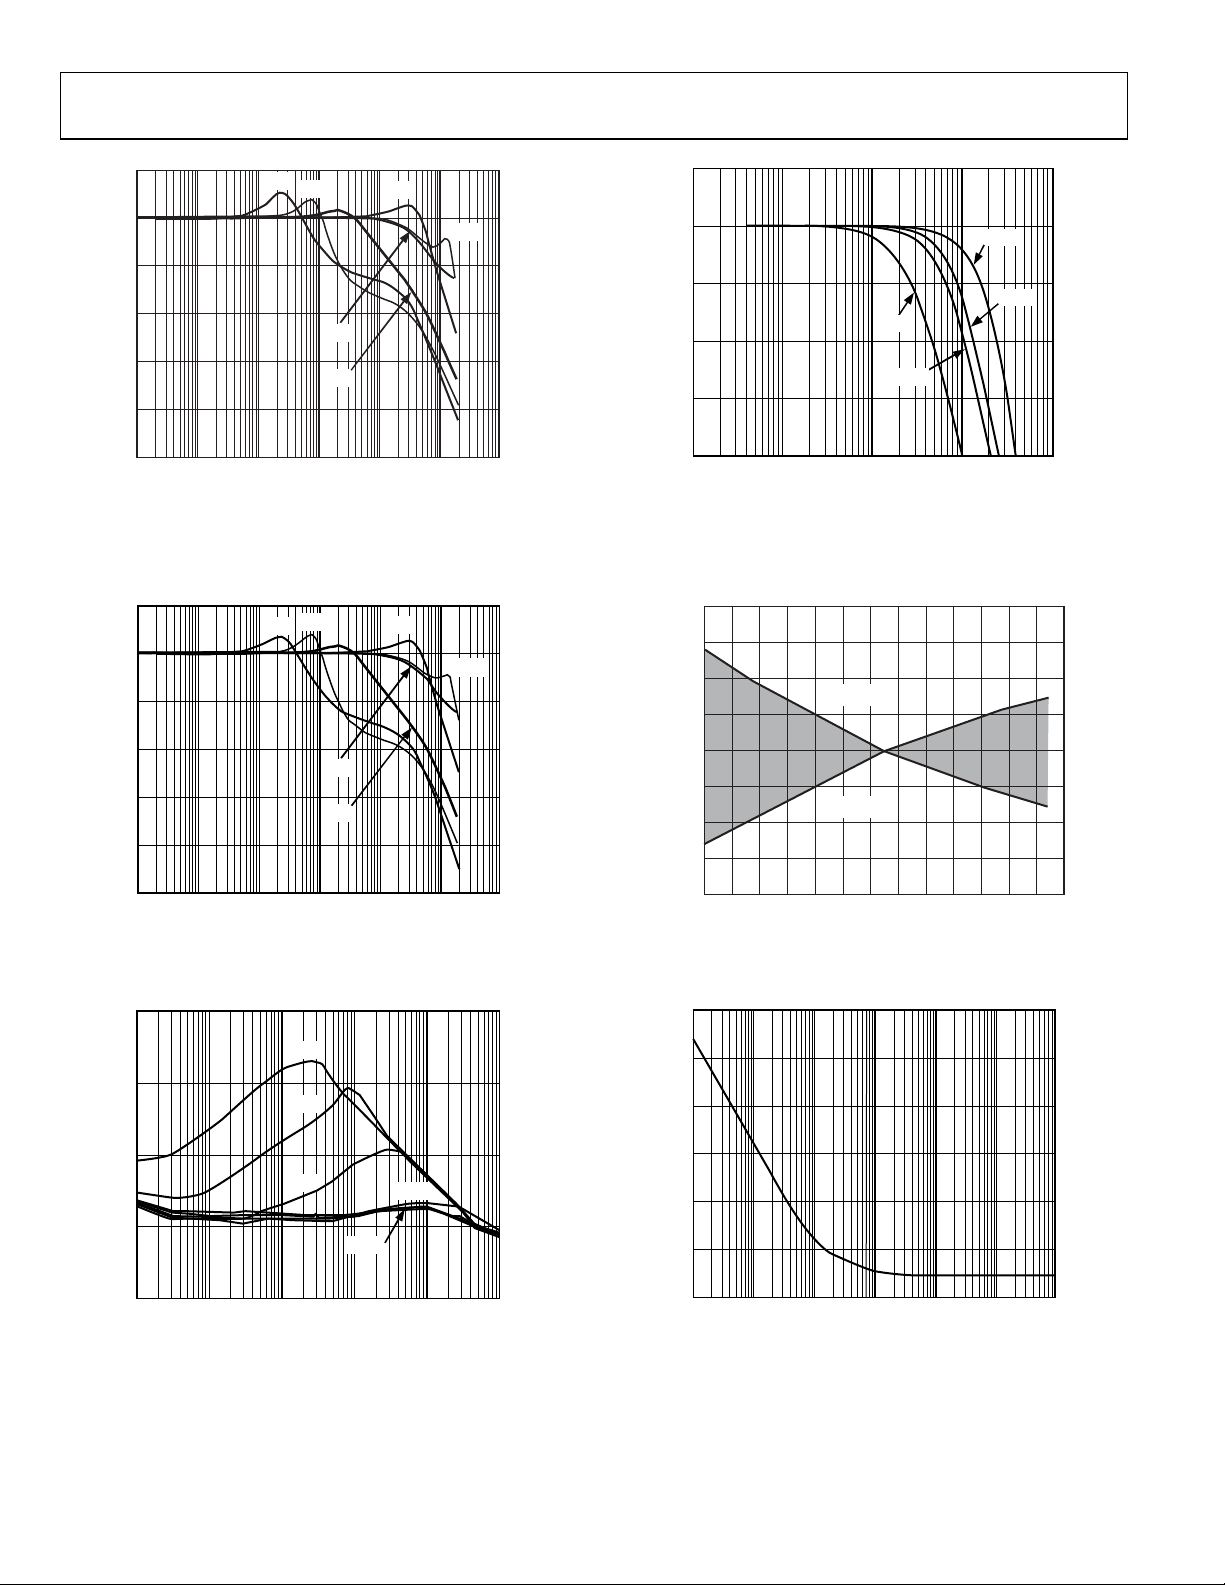
TYPICAL PERFORMANCE CHARACTERISTICS
VP = 5 V, VN = 0 V, R
= 200 kΩ, TA = 25°C, unless otherwise noted.
REF
1.6
TA = –40°C, 0°C, +25°C, +70°C, +85 ° C
= 0V
V
N
1.4
1.2
–40°C
+25°C
+85°C
100n 1µ
10n 10µ 100µ1m10m
vs. IPD for Multiple Temperatures
LOG
–40°C
+25°C
+85°C
10n 10µ 100µ 1m 10m100n 1µ
(V)
LOG
V
( V)
V
1.0
0.8
0.6
0.4
0.2
0
1n
Figure 3. V
1.8
1.6
1.4
1.2
1.0
LOG
0.8
0.6
0.4
0.2
0
1n
0°C
+70°C
IPD (A)
TA = –40°C, 0 °C, +25°C, +70°C, +85°C
V
= 0V
N
0°C
+70°C
I
(A)
REF
2.0
1.5
1.0
0.5
0
–0.5
OR; dB (10mV/dB)
ER
–1.0
–1.5
–2.0
03053-003
–40°C
1n 10n 10µ 100µ1m10m100n 1µ
Figure 6. Law Conformance Error vs. IPD (at I
TA = –40°C, 0°C, +25°C, +70°C, +85°C
= 0V
V
N
+85°C
0°C
+70°C
+25°C
IPD (A)
= 10 μA) for Multiple
REF
03053-006
Temperatures, Normalized to 25°C
2.0
1.5
1.0
0.5
0
–0.5
ERROR; dB (10mV/dB)
–1.0
–1.5
–2.0
03053-004
1n 10n 10µ 100µ1m10m100n 1µ
TA = –40°C, 0°C, +25°C, +70°C, +85°C
= 0V
V
N
+70°C
+25°C
I
(A)
PD
+85°C
0°C
–40°C
03053-007
Figure 4. V
vs. I
for Multiple Temperatures
LOG
REF
Figure 7. Law Conformance Error vs. I
(at IPD = 10 μA) for Multiple
REF
Temperatures, Normalized to 25°C
1.8
1.6
1.4
1.2
1.0
(V)
LOG
0.8
V
0.6
0.4
0.2
0
1n 10n 10µ 100µ 1m 10m100n 1µ
Figure 5. V
vs. IPD for Multiple Values of I
LOG
10nA
100nA
1µA
10µA
100µA
1mA
IPD (A)
(Decade Steps from 10 nA to 1 mA)
REF
3053-005
0.5
0.4
0.3
0.2
0.1
0
–0.1
OR; dB (10mV/dB)
–0.2
E
–0.3
–0.4
–0.5
1n 10n 10µ 100µ 1m 10m100n 1µ
10µA
1µA
100µA 1mA
Figure 8. Law Conformance Error vs. I
10nA
I
(A)
PD
for Multiple Values of I
PD
100nA
(Decade Steps
REF
03053-008
from 10 nA to 1 mA)
Rev. B | Page 6 of 24
AD8305
R
R
V
R
R
1.8
1.6
1.4
1.2
1.0
(V)
LOG
0.8
V
0.6
0.4
0.2
0
1n
10n 100n 1µ 10µ 100µ 1m 10m
10nA
100nA
I
REF
1µA
(A)
10µA
100µA
1mA
03053-009
0.5
0.4
0.3
10µA
0
1mA
100µA
1n 10n 100n 1µ 10µ 100µ 1m 10m
OR; dB (10mV/dB)
E
0.2
0.1
–0.1
–0.2
–0.3
–0.4
–0.5
10nA
100nA
I
(A)
REF
1µA
03053-012
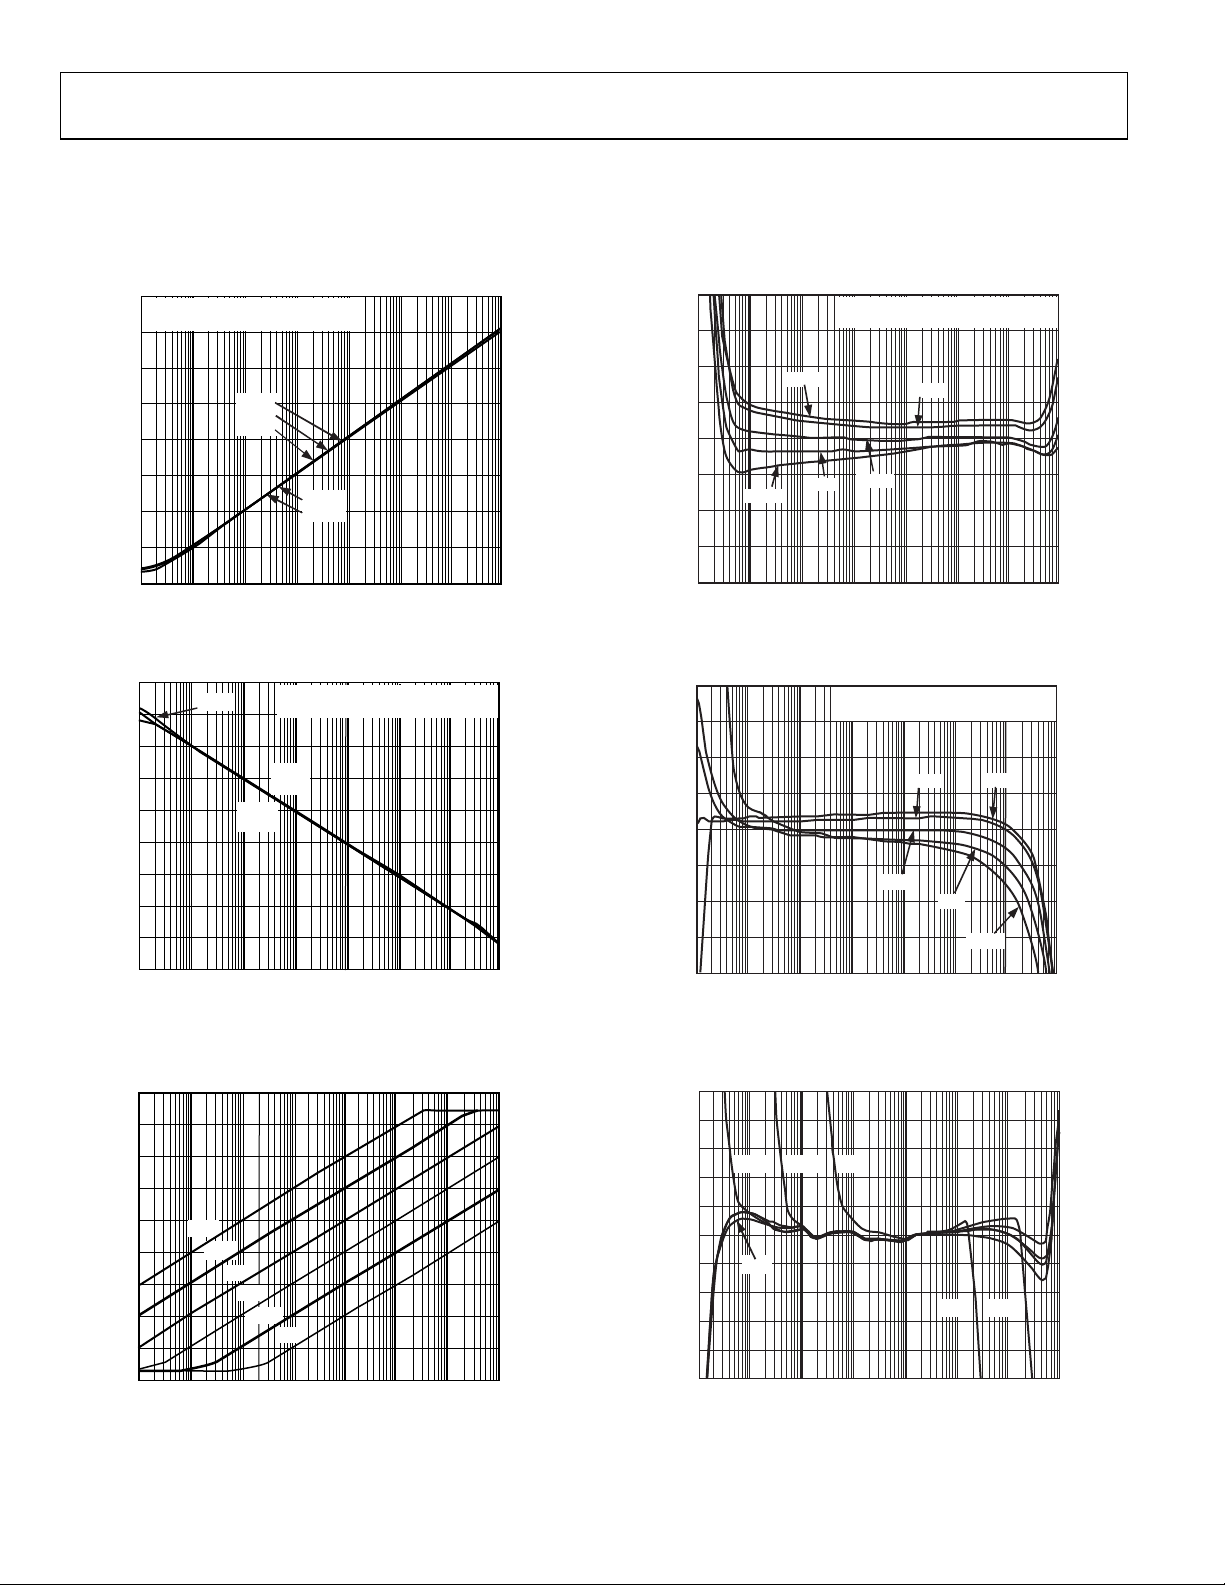
Figure 9. V
vs. I
for Multiple Values of IPD (Decade Steps from
LOG
REF
10 nA to 1 mA)
0.5
0.4
0.3
0.2
0.1
0
–0.1
OR; dB (10mV/dB)
–0.2
E
–0.3
–0.4
–0.5
1n 10n 100n 1µ 10µ 100µ 1m 10m
Figure 10. Law Conformance Error vs. I
+3V, 0V
+5V, 0V
+9V, 0V
+3V, –0.5V
+5V, –5V
IPD (A)
for Various Supply Conditions (See
PD
Annotations)
0.4
0.3
0.2
0.1
(mV)
INPT
0
–
–0.1
SUM
V
–0.2
+12V, 0V
Figure 12. Law Conformance Error vs. I
for Multiple Values of IPD (Decade
REF
Steps from 10 nA to 1 mA)
1.4
1.2
1.0
0.8
(V)
OUT
0.6
V
0.4
0.2
03053-010
1.6
1.4
1.2
1.0
(V)
0.8
OUT
V
0.6
0.4
100µATO 1mA:T-RISE =<1µs,
T-FA LL = < 1µ s
10µATO 10µA:T-RISE = <1µs,
T-FA LL = < 1µ s
1µATO 10µA:T-RISE = 1µs,
T-FAL L = 5µ s
100nA TO 1µA:T- RI S E = 5µs,
T-FALL = 20µs
10nA TO 100nA:T -R I SE = 20µs,
T-FAL L = 30 µs
0
Figure 13. Pulse Response − I
10nATO 100nA:T -R I SE = 30µs,
T-FALL = 20µs
100nA TO 1µA: T-RISE = 30µs,
T-FA LL = 5 µ s
1µATO 10µA:T- RISE = 5µs,
T-FAL L = 1µ s
10µATO 100µA :T-RISE = 1µs,
T-FA LL = < 1µ s
100µA TO 1mA:T-RISE = <1µs,
T-FA LL = < 1µ s
TIME (µs)
PD
to V
OUT
(G = 1)
160140120100806040200–20
180
03053-013
–0.3
–0.4
1n 10n 100n 1µ 10µ 100µ 1m 10m
Figure 11. V
IPD (A)
INPT
− V
SUM
vs. IPD
03053-011
0.2
0
Figure 14. Pulse Response − I
TIME (µs)
160140120100806040200–20
180
03053-014
to V
(G = 1)
REF
OUT
Rev. B | Page 7 of 24
AD8305
√
10
0
–10
(V)
–20
OUT
V
–30
–40
10nA
100nA
10µA
100µA
1mA
1µA
3
0
–3
–6
NORMALIZED RESPONSE (dB)
–9
AV = 5
A
V
= 2.5
= 1
A
V
= 2
A
V
–50
100
1k 10k 100k 1M 10M 100M
FREQUENCY (Hz)
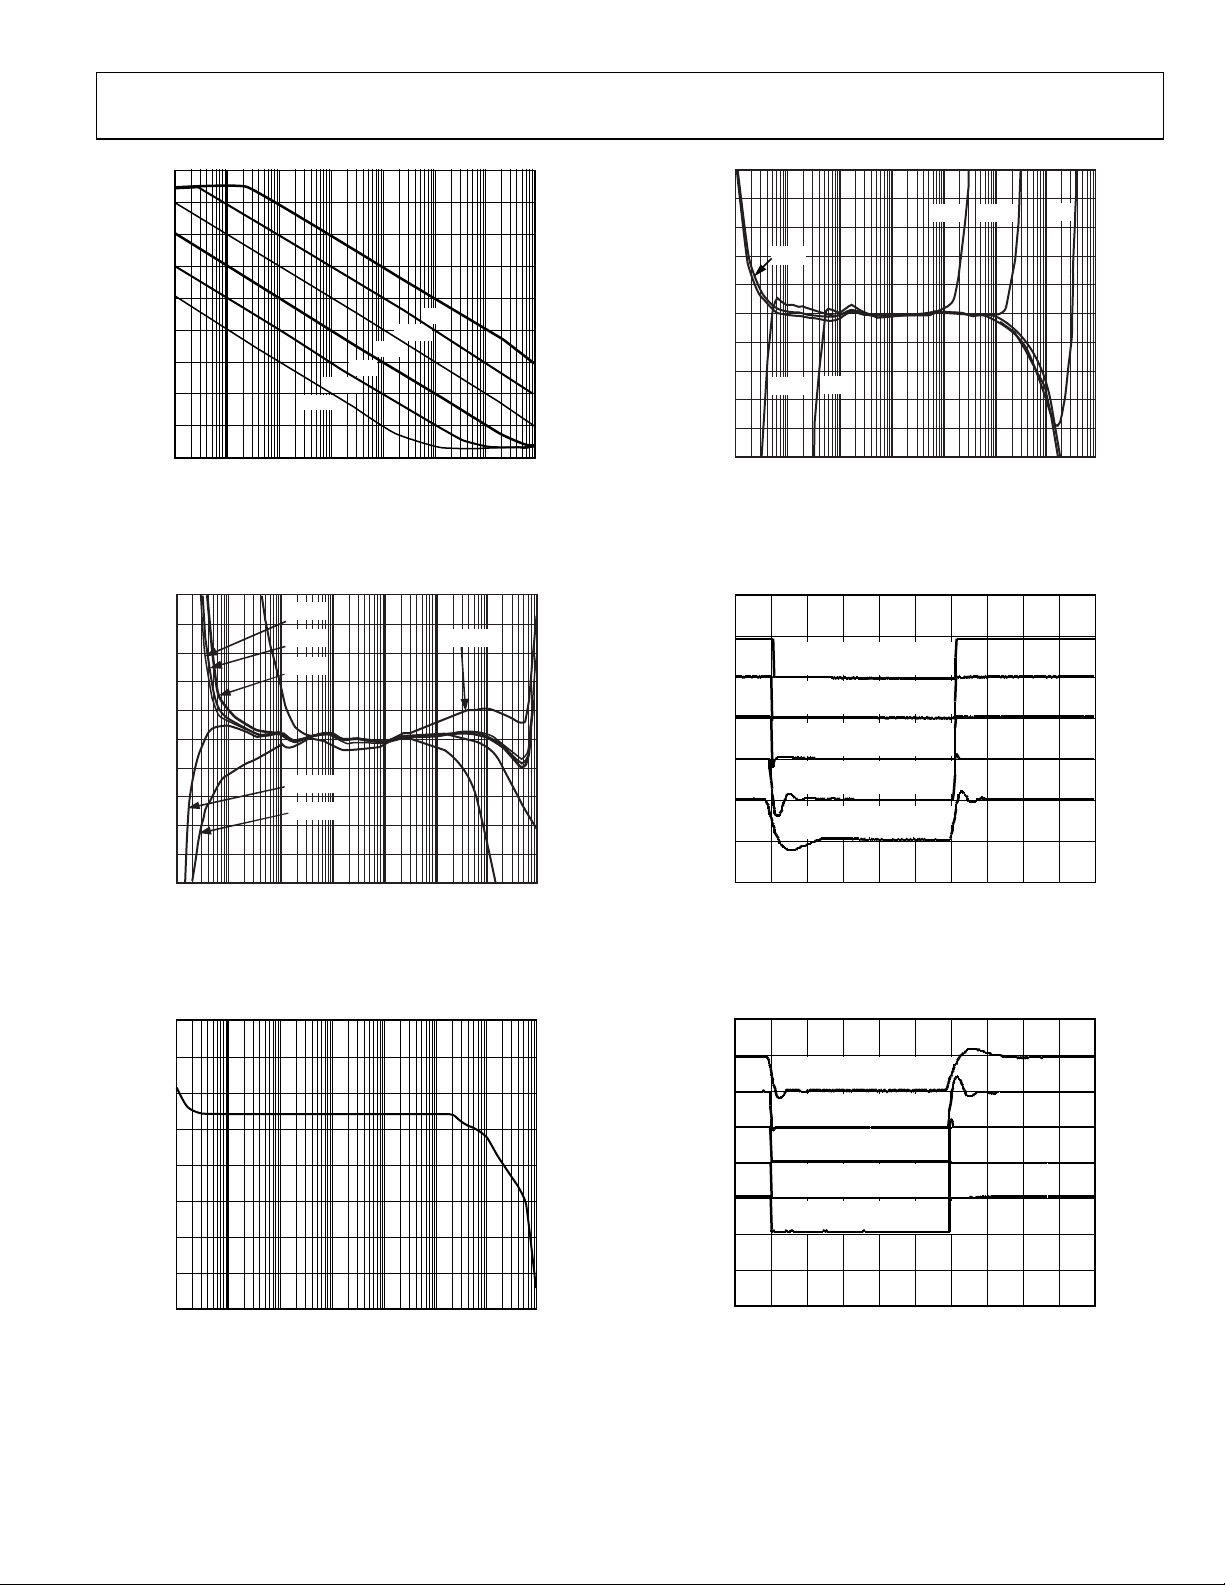
Figure 15. Small Signal AC Response (5% Sine Modulation), from I
(G = 1) for I
10
0
–10
–20
–30
NORMALIZE D RE SPONSE (dB)
–40
–50
100 1k 10k 100k 1M 10M 100M
in Decade Steps from 10 nA to 1 mA, I
PD
100nA
10nA
FREQUENCY (Hz)
10µA
1mA
1µA
= 10 μA
REF
100µA
Figure 16. Small Signal AC Response (5% Sine Modulation), from I
(G = 1) for I
100
in Decade Steps from 10 nA to 1 mA, IPD = 10 μA
REF
–12
10k 100k 1M 10M 100M
03053-015
to V
PD
OUT
03053-016
to V
REF
OUT
Figure 18. Small Signal AC Response of the Buffer for Various Closed-Loop
2.0
1.5
1.0
0.5
0
DRIFT (mV)
–0.5
OS
V
–1.0
–1.5
–2.0
Figure 19. Buffer Input Offset Drift vs. Temperature (3σ to Either Side of
6
FREQUENCY (Hz)
= 1 kΩ CL < 2 pF)
Gains (R
L
MEAN + 3σ
MEAN – 3σ
TEMPERATURE (°C)
Mean)
03053-018
90806040200–20 10 30 50 70–10–30–40
03053-019
10nA
10
Hz)
(µV rms/
0.01
0.1
1
100
1k 10k 100k 1M 10M
100nA
1µA
FREQUENCY (Hz)
Figure 17. Spot Noise Spectral Density at V
10µA
100µA
(G = 1) vs. Frequency for IPD in
OUT
03053-017
5
4
3
(mV rms)
2
1
0
10n 100n 1µ 10µ 100µ 10m1m
IPD (A)
Figure 20. Total Wideband Noise Voltage at V
vs. IPD (G = 1)
OUT
3053-020
Decade Steps from 10 nA to 1 mA
Rev. B | Page 8 of 24

AD8305
R
R
R
R
R
–0.5
OR; dB (10mV/dB)
ER
–1.0
–1.5
–2.0
2.0
1.5
1.0
0.5
MEAN + 3σ
0
MEAN – 3σ
1n
10n 1µ100n 10µ 100µ 1m
IPD (A)
TA = 25°C
10m
03053-021
20
15
10
5
0
–5
DRIFT (mV)
REF
V
–10
–15
–20
–25
MEAN + 3σ
MEAN – 3σ
TEMPERATURE (°C)
90806040200–20 10305070–10–30–40
03053-024
Figure 21. Law Conformance Error Distribution (3σ to Either Side of Mean)
2.0
1.5
1.0
0.5
0
–0.5
OR; dB (10mV/d B)
E
–1.0
–1.5
–2.0
1n 10n 100n 1µ 10µ 100µ 1m 10m
MEAN + 3σ @ 70°C
MEAN ± 3σ @0°C
MEAN – 3σ @ 70°C
IPD (A)
= 0°C, 70°C
T
A
3053-022
Figure 22. Law Conformance Error Distribution (3σ to Either Side of Mean)
4
3
2
1
0
–1
OR; dB (10mV/dB)
E
–2
–3
–4
1n
MEAN ± 3σ @ +85°C
10n 100n 1µ 10µ 100µ 1m 10m
MEAN + 3σ @ –40°C
MEAN – 3σ @ –40°C
IPD (A)
TA= –40°C, +85° C
03053-023
Figure 23. Law Conformance Error Distribution (3σ to Either Side of Mean)
Figure 24. V
20
15
10
5
0
–5
Δ DRIFT (mV)
–10
–15
–20
Figure 25. V
5
4
3
2
1
0
DRIFT (mV)
–1
INPT
V
–2
–3
–4
–5
Figure 26. V
Drift vs. Temperature (3σ to Either Side of Mean)
REF
MEAN + 3σ
MEAN – 3σ
TEMPERATURE (°C)
− V
Drift vs. Temperature (3σ to Either Side of Mean)
REF
IREF
MEAN + 3σ
MEAN – 3σ
TEMPERATURE (°C)
Drift vs. Temperature (3σ to Either Side of Mean)
INPT
90806040200–20 10305070–10–30–40
03053-025
90806040200–20 10305070–10–30–40
03053-026
Rev. B | Page 9 of 24

AD8305
10
8
6
Δ Vy DRIFT (mV/ dec)
–10
4
2
0
–2
–4
–6
–8
MEAN + 3σ
MEAN – 3σ
90806040200–20 10 30 50 70–10–30–40
TEMPERATURE (°C)
Figure 27. Slope Drift vs. Temperature (3σ to Either Side of Mean of
200 mV/decade)
350
03053-027
4000
3500
3000
2500
2000
COUNT
1500
1000
500
0
0.4
0.6 0.8 1.0 1.2 1.4 1.6
INTERCEPT (nA)
Figure 30. Distribution of Logarithmic Intercept (Nominally 1 nA when
= 200 kΩ ± 0.1%) Sample >22,000
R
REF
7000
03053-030
250
150
50
–50
Δ Iz DRIFT (pA)
–150
–250
–350
MEAN + 3σ
MEAN – 3σ
TEMPERATURE (°C)
90806040200–20 10 30 50 70–10–30–40
85
3053-028
Figure 28. Intercept Drift vs. Temperature (3σ to Either Side of Mean of 1 nA)
6000
5000
4000
3000
COUNT
2000
1000
6000
5000
4000
COUNT
3000
2000
1000
0
Figure 31. Distribution of V
6000
5000
4000
3000
COUNT
2000
1000
V
(V)
REF
(RL = 100 kΩ) Sample >22,000
REF
2.54
2.562.44 2.46 2.48 2.50 2.52
03053-031
0
190 195 200 205 210
SLOPE (mV/dec)
Figure 29. Distribution of Logarithmic Slope (Nominally
200 mV/decade) Sample >22,000
3053-029
Rev. B | Page 10 of 24
0
–0.015 –0.010 –0.005 0.005 0.010 0.0150
V
– V
INPT
VOLTAGE (V)
SUM
Figure 32. Distribution of Offset Voltage (V
INPT
− V
) Sample >22,000
SUM
3053-032

AD8305
GENERAL STRUCTURE
The AD8305 addresses a wide variety of interfacing conditions
to meet the needs of fiber optic supervisory systems, and is also
useful in many nonoptical applications. These notes explain the
structure of this unique style of translinear log amp. Figure 33 is
a simplified schematic showing the key elements.
BIAS
PHOTODIODE
INPUT CURRENT
I
PD
INPT
0.5V
Q1
VNEG (NORMALLY G RO UNDED)
GENERATOR
2.5V
80kΩ
20kΩ
0.5V
VSUM
V
VREF
COMM
BE1
IREF
0.5V
Q2
V
BE1
TEMPERATURE
V
V
BE2
VRDZ
BE2
COMPENSATION
(SUBTRACT AND
DIVIDE BY T × K
44µA/dec
451Ω
14.2kΩ
6.69kΩ
COMM
VLOG
I
REF
Figure 33. Simplified Schematic
The photodiode current, IPD, is received at Pin INPT. The
voltage at this node is essentially equal to those on the two
adjacent guard pins, VSUM and IREF, due to the low offset
voltage of the JFET op amp. Transistor Q1 converts the input
current I
Equation 1. A finite positive value of V
to a corresponding logarithmic voltage, as shown in
PD
is needed to bias the
SUM
collector of Q1 for the usual case of a single-supply voltage. This
is internally set to 0.5 V, that is, one fifth of the reference voltage
of 2.5 V appearing on Pin VREF. The resistance at the VSUM
pin is nominally 16 kΩ; this voltage is not intended as a general
bias source.
The AD8305 also supports the use of an optional negative
supply voltage, V
, at Pin VNEG. When VN is −0.5 V or more
N
negative, VSUM may be connected to ground; thus, INPT and
IREF assume this potential. This allows operation as a voltageinput logarithmic converter by the inclusion of a series resistor
at either or both inputs. Note that the resistor setting I
REF
needs
to be adjusted to maintain the intercept value. It should also be
noted that the collector-emitter voltages of Q1 and Q2 are now
the full V
, and effects due to self-heating causes errors at large
N
input currents.
The input dependent, V
V
of a second transistor, Q2, operating at I
BE2
, of Q1 is compared with the reference
BE1
. This is generated
REF
externally, to a recommended value of 10 µA. However, other
values over a several-decade range can be used with a slight
degradation in law conformance (see Figure 3).
Rev. B | Page 11 of 24
03053-033
THEORY
The base-emitter voltage of a BJT (bipolar junction transistor)
can be expressed by Equation 1, which immediately shows its
basic logarithmic nature:
= kT/qIn(IC/IS)
V
BE
where:
I
is its collector current.
C
is a scaling current, typically only 10
I
S
−17
A.
kT/q is the thermal voltage, proportional to absolute
temperature (PTAT) and is 25.85 mV at 300 K.
The current, I
, is never precisely defined and exhibits an even
S
stronger temperature dependence, varying by a factor of
roughly a billion between −35°C and +85°C. Thus, to make use
of the BJT as an accurate logarithmic element, both of these
temperature dependencies must be eliminated.
The difference between the base-emitter voltages of a matched
pair of BJTs, one operating at the photodiode current I
second operating at a reference current I
V
− V
BE1
= kT/q In(IC/IS) − kT/q In(I
BE2
= In(10)kT/qlog
= 59.5 mVlog
10(IPD/IREF
10(IPD/IREF
, can be written as:
REF
)
REF/IS
)
)(T = 300 K) (2)
The uncertain and temperature dependent saturation current
IS, which appears in Equation 1, has thus been eliminated. To
eliminate the temperature variation of kT/q, this difference
voltage is processed by what is essentially an analog divider.
Effectively, it puts a variable under Equation 2. The output of
this process, which also involves a conversion from voltagemode to current-mode, is an intermediate, temperaturecorrected current:
I
where I
= IY log10(IPD/I
LOG
is an accurate, temperature-stable scaling current that
Y
) (3)
REF
determines the slope of the function (the change in current per
decade). For the AD8305, I
is 44 µA, resulting in a temperature
Y
independent slope of 44 mA/decade, for all values of I
. This current is subsequently converted back to a voltage-
I
REF
mode output, V
It is apparent that this output should be zero for I
, scaled 200 mV/decade.
LOG
= I
PD
would need to swing negative for smaller values of input
current. To avoid this, I
smallest value of I
PD
would need to be as small as the
REF
. However, it is impractical to use such a
small reference current as 1 nA. Accordingly, an offset voltage is
added to V
to shift it upward by 0.8 V when Pin VRDZ is
LOG
directly connected to VREF. This has the effect of moving the
intercept to the left by four decades, from 10 µA to 1 nA:
I
where I
= IY log10(IPD/I
LOG
is the operational value of the intercept current. To
INTC
) (4)
INTC
disable this offset, Pin VRDZ should be grounded, then the
intercept I
is simply I
INTC
. Because values of IPD < I
REF
INTC
a negative VLOG, a negative supply of sufficient value is
and the
PD
and
PD
and
REF
result in
(1)

AD8305
V
required to accommodate this situation (see the Using A
Negative Supply section).
The voltage, V
, is generated by applying I
LOG
to an internal
LOG
resistance of 4.55 kΩ, formed by the parallel combination of a
6.69 kΩ resistor to ground and the 14.2 kΩ resistor to the
VRDZ pin. When the VLOG pin is unloaded and the intercept
repositioning is disabled by grounding VRDZ, the output
current, I
where V
, generates a voltage at the VLOG pin of
LOG
V
= I
LOG
× 4.55 kΩ
LOG
= 44 μA × 4.55 kΩ × log
= V
log10(IPD/I
Y
= 200 mV/decade, or 10 mV/dB. Note that any
Y
REF
10(IPD/IREF
)
) (5)
resistive loading on VLOG lowers this slope and also result in
an overall scaling uncertainty due to the variability of the onchip resistors. Consequently, this practice is not recommended.
V
may also swing below ground when dual supplies (VP and
LOG
) are used. When VN = −0.5 V or larger, the input pins INPT
V
N
and IREF may now be positioned at ground level by simply
grounding VSUM.
MANAGING INTERCEPT AND SLOPE
When using a single supply, VRDZ should be directly connected to
VREF to allow operation over the entire five-decade input current
range. As noted previously, this introduces an accurate offset
voltage of 0.8 V at the VLOG pin, equivalent to four decades,
resulting in a logarithmic transfer function that can be written as
V
= VY log10(104 × IPD/I
LOG
= V
log10 (IPD/I
Y
= I
where I
INTC
REF
/104.
Thus, the effective intercept current I
thousandth of I
recommended value of I
, corresponding to 1 nA when using the
REF
REF
The slope can be reduced by attaching a resistor to the VLOG
pin. This is strongly discouraged, in view of the fact that the onchip resistors do not ratio correctly to the added resistance. Also, it
is rare that one would want to lower the basic slope of 10 mV/dB; if
this is needed, it should be effected at the low impedance output
of the buffer, which is provided to avoid such miscalibration and
also allow higher slopes to be used.
The AD8305 buffer is essentially an uncommitted op amp with
rail-to-rail output swing, good load-driving capabilities, and a
unity-gain bandwidth of >12 MHz. In addition to allowing the
introduction of gain, using standard feedback networks and
thereby increasing the slope voltage V
to implement multipole low-pass filters, threshold detectors,
and a variety of other functions. Further details of these can be
found in the AD8304 data sheet.
)
REF
) (6)
INTC
is only one ten-
INTC
= 10 mA.
, the buffer can be used
Y
RESPONSE TIME AND NOISE CONSIDERATIONS
The response time and output noise of the AD8305 are
fundamentally a function of the signal current, I
currents, the bandwidth is proportional to I
. For small
PD
, as shown in
PD
Figure 15. The output low frequency voltage-noise spectraldensity is a function of I
small values of I
REF
(Figure 17) and also increases for
PD
. Details of the noise and bandwidth
performance of translinear log amps can be found in the
AD8304 data sheet.
POWER SUPPLY SEQUENCING
Some applications may result in the presence of large input
signal current (>1 mA) prior to the AD8305 being powered on.
In such cases, it is recommended that power supply sequencing
be implemented such that the AD8305 is powered on prior to
the photodiode or current source.
In those applications where it is not possible to implement
supply sequencing, VSUM should be driven externally by a low
impedance source. In applications where a low-impedance biassource is not readily available, the circuit shown in Figure 34
can be used.
+
P
+V
BIAS
INPT
VSUM
VPOS
VNEG
COMM
03053-049
I
PD
C1
R1
+V
S
+
R
A
≈0.5V
R
B
Figure 34. VSUM Biasing Circuit for Applications Where Large Input Signals
I
E
V
BE
–
2N2907
β
I
C
Are Present Prior to AD8305 Power-On
C
2
The 2N2907 transistor used in Figure 34 is a common PNP-type
switching transistor. R
and Rb are selected such that the voltage
a
at the base of the transistor is ~0.5 V.
In general, V
Setting R
× [Rb/(Ra+Rb)] should equal approximately 0.5 V.
S
= 5 k and Rb = 1 k, results in 500 μA of additional
a
quiescent current for a 3 V supply under normal operation.
Larger resistor values may be used for this divider network by
choosing a transistor with a higher β than the 2N2907.
Given a typical V
of 0.7 V, the voltage at VSUM is ~1.2 V when
be
the AD8305 is off and a large input signal is being applied. Once
the AD8305 is powered on the voltage at VSUM is pulled down
to its nominal value of 0.5 V. The circuit in Figure 34 is tested
for 3 V to 5 V positive supplies over the full temperature range
for the AD8305. C
, and R1 are the components that make up
1
Rev. B | Page 12 of 24

AD8305
the input compensation network and C2 is the recommended
bypassing capacitor on VSUM.
If board space limits the amount of external circuitry to the
AD8305 it is possible to eliminate the transistor in Figure 34
and connect the resistor divider directly to VSUM. In this case
the bias voltage at VSUM and INPT is set by the resistor values
selected for the divider, not the internal biasing of the AD8305.
Rev. B | Page 13 of 24

AD8305
APPLICATIONS
The AD8305 is easy to use in optical supervisory systems and in
similar situations where a wide ranging current is to be
converted to its logarithmic equivalent, which is represented in
decibel terms. Basic connections for measuring a single-current
input are shown in Figure 35, which also includes various
nonessential components.
I
V
1kΩ
200kΩ
BIAS
I
1nF
PD
VRDZ
VREF
IREF
1kΩ
1nF
INPT
VSUM
1nF
0.5V
0.5V
20kΩ
COMM
VNEG
80kΩ
Q2
Q1
+5V
VPOS
GENERATOR
2.5V
V
BE2
–
TEMPERATURE
+
COMPENSATION
V
BE1
BIAS
14.2kΩ
6.69kΩ
COMM
I
LOG
0.5 log
451Ω
COMM
10
VOUT
SCAL
BFIN
PD
1nA
12kΩ
8kΩ
VLOG
C
10nF
FLT
Figure 35. Basic Connections for Fixed Intercept Use
The 2 V difference in voltage between the VREF and INPT pins
in conjunction with the external 200 kΩ resistor R
reference current, I
, of 10 µA into Pin IREF. Connecting pin
REF
provide a
REF
VRDZ to VREF raises the voltage at VLOG by 0.8 V, effectively
lowering the intercept current, I
position it at 1 nA. A wide range of other values for I
, by a factor of 104 to
INTC
REF
, from
under 100 nA to over 1 mA, may be used. The effect of such
changes is shown in Figure 5.
Any temperature variation in R
must be taken into account
REF
when estimating the stability of the intercept. Also, the overall
noise increases when using very low values of I
. In fixed
REF
intercept applications, there is little benefit in using a large
reference current, since this only compresses the low current
end of the dynamic range when operated from a single supply,
here shown as 5 V. The capacitor between VSUM and ground is
recommended to minimize the noise on this node and to help
provide a clean reference current.
03053-034
Because the basic scaling at VLOG is 0.2 V/decade, and a swing
of 4 V at the buffer output would correspond to 20 decades, it is
often useful to raise the slope to make better use of the rail-to- rail
voltage range. For illustrative purposes, the circuit in Figure 35
provides an overall slope of 0.5 V/ decade (25 mV/dB). Thus,
using I
at I
= 10 µA, V
REF
= 1 mA while the buffer output runs from 0.5 V to 3.5 V,
PD
runs from 0.2 V at IPD = 10 nA to 1.4 V
LOG
corresponding to a dynamic range of 120 dB (electrical, that is,
60 dB optical power).
The optional capacitor from VLOG to ground forms a singlepole low-pass filter in combination with the 4.55 kΩ resistance
at this pin. For example, using a C
of 10 nF, the −3 dB corner
FLT
frequency is 3.5 kHz. Such filtering is useful in minimizing the
output noise, particularly when I
is small. Multipole filters are
PD
more effective in reducing the total noise; examples are provided in
the AD8304 data sheet.
The dynamic response of this overall input system is influenced
by the external RC networks connected from the two inputs
(INPT, IREF) to ground. These are required to stabilize the
input systems over the full current range. The bandwidth
changes with the input current due to the widely varying pole
frequency. The RC network adds a zero to the input system to
ensure stability over the full range of input current levels. The
network values shown in Figure 35 usually suffice, but some
experimentation may be necessary when the photodiode
capacitance is high.
Although the two current inputs are similar, some care is
needed to operate the reference input at extremes of current
(<100 nA) and temperature (<0°C). Modifying the RC network
to 4.7 nF and 2 kΩ is recommended for measuring 10 nA at
−40°C. By inspecting the transient response to perturbations in
I
at representative current levels, the capacitor value can be
REF
adjusted to provide fast rise and fall times with acceptable
settling. To fine tune the network zero, the resistor value should be
adjusted.
Rev. B | Page 14 of 24

AD8305
CALIBRATION
The AD8305 has a nominal slope and intercept of 200 mV/decade
and 1 nA, respectively. These values are untrimmed, and the
slope alone may vary as much as 7.5% over temperature. For
this reason, it is recommended that a simple calibration be done
to achieve increased accuracy.
1.4
1.2
1.0
0.8
(V)
LOG
0.6
V
0.4
0.2
0
1n 10n 10µ 100µ 1m 10m100n 1µ
UNCALIBRATED ERROR
MEASURED OUTPUT
CALIBRATED ERRO R
IDEAL OUTPUT
IPD (A)
Figure 36. Using Two-Point Calibration to Increase Measurement Accuracy
4
3
2
1
0
–1
ERROR; dB (10mV/dB)
–2
–3
03053-035
Figure 36 shows the improvement in accuracy when using a two
point calibration method. To perform this calibration, apply
two known currents, I
between 10 nA and 1 mA. Measure the resulting output, V
V
, respectively, and calculate the slope m and intercept b.
2
m = (V
− V2)/[log10(I1) − log10(I2)] (7)
1
– m × log10(I1) (8)
b = V
1
and I2, in the linear operating range
1
and
1
The same calibration is performed with two known optical
powers, P
and P2. This allows for calibration of the entire
1
measurement system while providing a simplified relationship
between the incident optical power and V
m = (V
− V2)/(P1 − P2) (9)
1
− m × P1 (10)
b = V
1
voltage.
LOG
The uncalibrated error line in Figure 36 is generated assuming
that the slope of the measured output was 200 mV/ decade
when in fact it was actually 194 mV/decade. Correcting for this
discrepancy decreased measurement error up to 3 dB.
Rev. B | Page 15 of 24

AD8305
V
USING A NEGATIVE SUPPLY
Most applications of the AD8305 require only a single supply of
3.0 V to 5.5 V. However, to provide further versatility, dual
supplies may be employed, as illustrated in Figure 37.
VOUT
SCAL
BFIN
451
Ω
COMM
SIGMAX
I
PD
10
1nA
12k
Ω
Ω
8k
VLOG
C
FLT
10nF
F
RREF
200k
V
1k
1nF
BIAS
Ω
5V
Ω
COMM
Q2
Q1
VNEG
REF
80k
Ω
–
+
V
VPOS
GENERATOR
2.5V
V
BE2
TEMPERATURE
COMPENSATION
V
BE1
≤ –0.5V
NEG
C1
VRDZ
VREF
Ω
IREF
1k
Ω
1nF
I
INPT
PD
VSUM
+
V
F
–
R
S
V
N
0.5V
I
0.5V
SIG
Iq + I
= IPD + I
20k
SIG
BIAS
14.2k
6.69kΩ
COMM
R
S
0.5 log
Ω
I
LOG
VN – V
≤
Iq + I
Figure 37. Negative Supply Application
The use of a negative supply, VN, allows the summing node to
be placed at ground level whenever the input transistor (Q1 in
Figure 33) has a sufficiently negative bias on its emitter. When
V
= −0.5 V, the VCE of Q1 and Q2 is the same as for the
NEG
default case when VSUM is grounded. This bias does not need
to be accurate, and a poorly defined source can be used. The
5
VPOS
80kΩ
2.5V
Q2
Q1
BIAS
GENERATOR
V
BE2
–
TEMPERATURE
+
COMPENSATION
V
BE1
Figure 38. Optical Absorbance Measurement
REFERENCE
DETECTOR
5V
SIGNAL
DETECTOR
VRDZ
REF
1kΩ
1kΩ
1nF
VREF
IREF
I
1nF
INPT
VSUM
REF
20kΩ
0.5V
I
PD
COMM
0.5V
VNEG
P
P
SIG
03053-036
source does, however, need to be able to support the quiescent
current as well as the INPT and IREF signal current. For
example, it may be convenient to utilize a forward-biased
junction voltage of about 0.7 V or a Schottky barrier voltage of a
little over 0.5 V. The effect of supply on the dynamic range and
accuracy can be seen in Figure 10.
With the summing node at ground, the AD8305 may now be
used as a voltage-input log amp at either the numerator input,
INPT, or the denominator input, IREF, by inserting a suitably
scaled resistor from the voltage source to the relevant pin. The
overall accuracy for small input voltages is limited by the
voltage offset at the inputs of the JFET op amps.
The use of a negative supply also allows the output to swing
below ground, thereby allowing the intercept to correspond to a
midrange value of I
. However, the voltage, V
PD
LOG
referenced to the ACOM pin, and while it does not swing
negative for default operating conditions, it is free to do so,
thus, adding a resistor from VLOG to the negative supply
lowers all values of VLOG, which raises the intercept. The
disadvantage of this method is that the slope is reduced by the
shunting of the external resistor, and the poorly defined ratio of
on-chip and off-chip resistances causes errors in both the slope
and the intercept.
14.2kΩ
6.69kΩ
COMM
I
LOG
VOUT
SCAL
451Ω
VLOG
COMM
BFIN
44.2kΩ
28.0kΩ
33nF
12.1kΩ
0.5 log
18nF
I
PD
+ 2
10
I
REF
, remains
03053-037
Rev. B | Page 16 of 24

AD8305
LOG-RATIO APPLICATIONS
It is often desirable to determine the ratio of two currents, for
example, in absorbance measurements. These are commonly
used to assess the attenuation of a passive optical component,
such as an optical filter or variable optical attenuator. In these
situations, a reference detector is used to measure the incident
power entering the component. The exiting power is then
measured using a second detector and the ratio is calculated to
determine the attenuation factor. Because the AD8305 is
fundamentally a ratiometric device, having nearly identical
logging systems for both numerator and denominator (I
I
, respectively), it can greatly simplify such measurements.
REF
PD
and
Figure 38 illustrates the AD8305 log-ratio capabilities in optical
absorbance measurements. Here a reference detector diode is
used to provide the reference current, I
, proportional to the
REF
optical reference power level. A second detector measures the
transmitted signal power, proportional to I
. The AD8305
PD
calculates the logarithm of the ratio of these two currents, as
shown in Equation 11, and which is reformulated in power
terms in Equation 12. Both of these equations include the
internal factor of 10,000 introduced by the output offset applied
to V
via pin VRDZ. If the true (nonoffset) log ratio shown in
LOG
Equation 4 is preferred, VRDZ should be grounded to remove
the offset. As already noted, the use of a negative supply at Pin
VNEG allows both V
and the buffer output to swing below
LOG
ground, and also allow the input pins INPT and IREF to be set
to ground potential. Therefore, the AD8305 may also be used to
determine the log ratio of two voltages.
Figure 38 also illustrates how a second order Sallen-Key lowpass filter can be realized using two external capacitors and one
resistor. Here, the corner frequency is set to 1 kHz and the filter
Q is chosen to provide an optimally flat (overshoot-free) pulse
response. To scale this frequency either up or down, simply
scale the capacitors by the appropriate factor. Note that one of
the resistors needed to realize this filter is the output resistance
of 4.55 kΩ present at Pin VLOG. While this does not ratio
exactly to the external resistor, which may slightly alter the Q of
the filter, the effect on pulse response is be negligible for most
purposes. Note that the gain of the buffer (×2.5) is an integral
part of this illustrative filter design; in general, the filter may be
redesigned for other closed-loop gains.
The transfer characteristics can be expressed in terms of optical
power. If we assume that the two detectors have equal
responsivities, the relationship is
V
= 0.5 V log10(104 × P
OUT
Using the identity log
10
attenuation as −10 × log
(AB) = log10A + log10B and defining the
10(PSIG/PREF
) (11)
SIG/PREF
), the overall transfer
characteristic can be written as
V
= 2 − 50 mV/dB × α (12)
OUT
where α = −10 × log
10(PSIG/PREF
)
Figure 39 illustrates the linear-in-dB relationship between the
absorbance and the output of the circuit in Figure 38.
2.5
2.0
1.5
(V)
LOG
V
1.0
0.5
0
Figure 39. Example of an Absorbance Transfer Function
10 15 20 25 30 35 40 45
ATTENUATION (dB)
500 5
03053-038
Rev. B | Page 17 of 24

AD8305
REVERSING THE INPUT POLARITY
Some applications may require interfacing to a circuit that
sources current rather than sinks current, such as connecting to
the cathode side of a photodiode. Figure 40 shows the use of a
current mirror circuit. This allows for simultaneous monitoring
of the optical power at the cathode, and a data recovery path
using a transimpedance amplifier at the anode. The modified
Wilson mirror provides a current gain very close to unity and a
high output resistance. Figure 41 shows measured transfer
function and law conformance performance of the AD8305 in
conjunction with this current mirror interface.
5V
MAT03
MAT03
I
PD
0.1µF
1kΩ
1nF
2.5V
200kΩ
1nF
≈
I
I
IN
PD
10nA TO 1mA
16 131415
COMM COMM COMM COMM
VRDZ
1
VREF
2
0V
IREF
3
0V
4
INPT
0.1µF
AD8305
VSUM
VNEG VNEG VPOS
578
6
VOUT
SCAL
BFIN
VLOG
5V
V
log
OUT
= 0.2 ×
(IPD/1nA)
10
OUTPUT
12
11
10
9
1.6
1.4
1.2
1.0
(V)
0.8
LOG
V
0.6
0.4
+3V
+5V
0.2
0
1n 10n 100n 1µ 10µ 100µ 1m 10m
5V
IPD(A)
5V
+5V
+3V
1.00
0.75
0.50
0.25
0
–0.25
–0.50
–0.75
–1.00
ERROR; dB (10mV/dB)
Figure 41. Log Output and Error Using Current Mirror with Various Supplies
3053-040
TIA
DATA PATH
03053-039
Figure 40. Wilson Current Mirror for Cathode Interfacing
Rev. B | Page 18 of 24

AD8305
CHARACTERIZATION METHODS
During the characterization of the AD8305, the device was
treated as a precision current-input logarithmic converter,
because it is not practical for several reasons to generate
accurate photocurrents by illuminating a photodiode. The test
currents are generated by using well calibrated current sources,
such as the Keithley 236, or by using a high value resistor from a
voltage source to the input pin. Great care is needed when using
very small input currents. For example, the triax output
connection from the current generator was used with the guard
tied to VSUM. The input trace on the PC board was guarded by
connecting adjacent traces to VSUM.
These measures are needed to minimize the risk of leakage
current paths. With 0.5 V as the nominal bias on the INPT pin,
a leakage-path resistance of 1 GΩ to ground would subtract
0.5 nA from the input, which amounts to an error of −0.44 dB
for a source current of 10 nA. Additionally, the very high output
resistance at the input pins and the long cables commonly
needed during characterization allow 60 Hz and RF emissions
to introduce substantial measurement errors. Careful guarding
techniques are essential to reduce the pickup of these spurious
signals.
VPOS
VOUT
BFIN
VLOG
VSUM
KEITHLEY 236
KEITHLEY 236
IREF
CHARACTERIZATION
INPT
VNEGVREF
AD8305
BOARD
OUTPUT
AD8138
BOARD
AD8138
B
A
+IN
EVALUATION
PROVIDES DC OFFSET
Figure 43. Configuration for Buffer Amplifier Bandwidth Measurement
Figure 43 shows the configuration used to measure the buffer
amplifier bandwidth. The AD8138 evaluation board includes
provisions to offset VLOG at the buffer input, allowing
measurements over the full range of I
The network analyzer input impedances were set to 1 MΩ.
HP 3577A
NETWORK ANALYZ ER
INPUT R INPUT A INPUT B
BNC-T
16 131415
COMM COMM COMM COMM
VRDZ
1
VREF
2
AD8305
3
IREF
4
INPT
VSUM
VNEG VNEG VPOS
578
6
PD
12
VOUT
11
SCAL
10
BFIN
9
VLOG
+V
S
0.1µF
using a single supply.
03053-042
TRIAX CONNECTORS
(SIGNAL – I NP T AND IREF
GUARD – VSUM
SHIELD – GROUND)
DC MATRIX/DC SUPPLIES/DMM
Figure 42. Primary Characterization Setup
The primary characterization setup shown in Figure 42 is used
to measure V
, the static (dc) performance, logarithmic
REF
conformance, slope and intercept, the voltages appearing at pins
VSUM, INPT and IREF, and the buffer offset and V
drift with
REF
temperature. To ensure stable operation over the full current
range of I
and temperature extremes, filter components of
REF
C1 = 4.7 nF and R13 = 2 kΩ are used at pin to IREF ground. In
some cases, a fixed resistor between pins VREF and IREF was
used in place of a precision current source. For the dynamic
tests, including noise and bandwidth measurements, more
specialized setups are required.
HP 3577A
NETWORK ANALY Z E R
INPUT BINPUT AINPUT R
16 131415
COMM COMM COMM COMM
VRDZ
VREF
VOUT
SCAL
AD8305
IREF
INPT
VSUM
VNEG VNEG VPOS
578
6
BFIN
VLOG
0.1µF
12
11
10
9
+V
S
3053-043
AD8138
+IN
EVALUATION
BOARD
OUTPUT
POWER
SPLITTER
B
A
1nF
R1
1kΩ
1nF
1kΩ
1
2
R2
3
4
3053-041
Figure 44. Configuration for Logarithmic Amplifier Bandwidth Measurement
Rev. B | Page 19 of 24

AD8305
A
The setup shown in Figure 44 was used for frequency response
measurements of the logarithmic amplifier section. The
AD8138 output is offset to 1.5 V dc and modulated to a depth
of 5% at frequency. R1 is chosen (over a wide range of values up
to 1.0 GΩ) to provide I
. The buffer was used to deload VLOG
PD
from the measurement system.
HP 89410A
LECROY 9210
CH A
9213
TDS5104
CH1
CHANNEL 2
16 131415
VOUT
SCAL
AD8305
BFIN
VLOG
VSUM
VNEG VNEG VPOS
578
6
0.1µF
12
11
10
9
ALKALINE
“D” CELL
+
–
+
–
+
–
LKALINE
“D” CELL
SOURCE
1nF
+
–
TRIGG E R CHANNEL 1
200kΩ
1kΩ
R1
1kΩ
1nF
COMM COMM COMM COMM
VRDZ
1
VREF
2
IREF
3
4
INPT
Figure 45. Configuration for Noise Spectral Density Measurement
The configuration in Figure 45 is used to measure the noise
performance. Batteries provide both the supply voltage and the
input current to minimize the introduction of spurious noise
and ground loop effects. The entire evaluation system,
including the current setting resistors, is mounted in a closed
aluminum enclosure to provide additional shielding to external
noise sources.
16 131415
COMM COMM COMM COMM
VOUT
SCAL
BFIN
VLOG
12
11
10
9
0.1µF
+V
S
3053-045
200kΩ
1nF
1kΩ
1nF
VRDZ
1
VREF
2
AD8305
IREF
3
1kΩ
R1
4
INPT
VNEG VNEG VPOS
VSUM
578
6
Figure 46. Configuration for Logarithmic Amplifier Pulse Response
Measurement
Figure 46 shows the setup used to make the pulse response
measurements. As with the bandwidth measurement, the
VLOG is connected directly to BFIN and the buffer amplifier is
configured for unity gain. The output of the buffer is connected
03053-044
through a short cable to the TDS5104 scope with input
impedance set to 1 MΩ. The LeCroy’s output is offset to create
the initial pedestal current for a given value of R1, the pulse
then creates one-decade current step.
Rev. B | Page 20 of 24

AD8305
EVALUATION BOARD
An evaluation board is available for the AD8305, the schematic for which is shown in Figure 49. It can be configured for a wide variety of
experiments. The buffer gain is factory-set to unity, providing a slope of 200 mV/decade, and the intercept is set to 1 nA. Tab l e 4 describes
the various configuration options.
Table 4. Evaluation Board Configuration Options
Component Function Default Condition
P1 Supply interface. Provides access to supply pins, VNEG, COMM, and VPOS. P1 = installed
P2, R8, R9, R10,
R11, R17, R18
R2, R3, R4, R6,
R14, C2, C7, C9,
C10
R1, R7, R19, R20
R12, R15, C3, C4,
C5, C6
C11 VSUM decoupling capacitor. C11 = 1 nF (size 0603)
R13, R16, C1, C8
IREF, INPT, PD,
LK1, R5
J1 SC-Style Photodiode. Allows for direct mounting of SC style photodiodes. J1 = not installed
Monitor Interface. By adding 0 Ω resistors to R8, R9, R10, R11, R17, and R18, the
VRDZ, VREF, VSUM, VOUT, and VLOG pin voltages can be monitored using a high
impedance probe.
Buffer amplifier/output interface. The logarithmic slope of the AD8305 can be
altered using the buffer’s gain-setting resistors, R2 and R3. R4, R14, and C2 allow
variation in the buffer loading. R6, C7, C9, and C10 are provided for a variety of
filtering applications.
Intercept adjustment. The voltage dropped across resistor R1 determines the
intercept reference current, nominally set to 10 μA using a 200 kΩ 1% resistor. R7
and R19 can be used to adjust the output-offset voltage at the VLOG output.
Supply Decoupling.
Input compensation. Provides essential HF compensation at the input pins, INPT
and IREF.
Input interface. The test board is configured to accept a current through the SMA
connector labeled INPT. An SC-style packaged photodiode can be used in place
of the INPT SMA for optical interfacing. By removing R1 and adding a 0 Ω short
for R5, a second current can be applied to the IREF input (also SMA) for evaluating
the AD8305 in log-ratio applications.
P2 = Not installed
R8 = R9 = R10 = Open (size 0603)
R17 = R18 = Open (size 0603)
R2 = R6 = 0 Ω (size 0603)
R3 = R4 = open (size 0603)
R11 = R14 = 0 Ω (size 0603)
C2 = C7 = open (size 0603)
C9 = C10 = open (size 0603)
VLOG = VOUT = installed
R1 = 200 kΩ (size 0603)
R7 = R19 = 0 Ω (size 0603)
R20 = open (size 0603)
C3 = C4 = 0.01 μF
(size 0603)
C5 = C6 = 0.1 μF (size 0603)
R12 = R15 = 0 Ω (size 0603)
R13 = R16 = 1 kΩ (size 0603)
C1 = C8 = 1 nF (size 0603)
IREF = INPT = installed
PD = not installed
LK1 = installed
R5 = open (size 0603)
Rev. B | Page 21 of 24

AD8305
Figure 47. Component Side Layout
03053-046
Figure 48. Component Side Silkscreen
03053-047
Rev. B | Page 22 of 24

AD8305
VOUT
SC-STYLE
PD
IREF
INPT
LK1
VRDZ
VREF
R4
OPEN
R8
OPEN
R11
0Ω
R10
OPEN
R14
0Ω
VOUT
VLOG
VLOG
1
2
3
4
5
6
16 15 14 13
R20
R9
OPEN
OPEN
R7
0Ω
R1
200kΩ
1%
R13
1kΩ
C1
1nF
R19R18
0Ω
R16
1kΩ
C8
1nF
I
REF
I
PD
R17
OPEN
OPEN
R5
OPEN
1
2
3
C11
1nF
VSUM
COMM COMM COMM COMM
1
VRDZ
2
VREF
AD8305
IREF
3
INPT
4
VSUM VNEG VNEG VPOS
5678
C3
0.01µF
R15
0Ω
C6
0.1µF
123
VNEG
AGND
R12
12
VOUT
R2
0Ω
SCAL
11
BFIN
10
9
VLOG
C4
0.01µF
0Ω
C5
0.1µF
VPOS
P1
R3
OPEN OPEN
R6
0Ω
C10
OPEN
C7
OPEN
OPEN
C9
VRDZ
AGND
VOUT
VREF
VSUM
VLOG
C2
P2
03053-048
Figure 49. Evaluation Board Schematic
Rev. B | Page 23 of 24

AD8305
OUTLINE DIMENSIONS
0.50
0.40
PIN 1
INDICATOR
1.00
0.85
0.80
SEATING
PLANE
12° MAX
3.00
BSC SQ
TOP
VIEW
0.30
0.23
0.18
*
COMPLIANT
EXCEPT FO R EXP O S ED PAD DI ME NSION.
2.75
BSC SQ
0.80 MAX
0.65 TYP
0.05 MAX
0.02 NOM
0.20 REF
TO
JEDEC STANDARDS MO - 220- V E E D- 2
0.45
0.50
BSC
1.50 REF
0.60 MAX
13
12
9
8
FOR PROPE R CONNECTION O F
THE EXPOSED PAD, REFER TO
THE PIN CONFIGURATION AND
FUNCTION DE SCRIPTIONS
SECTION OF THIS DATA SHEET.
Figure 50. 16-Lead Lead Frame Chip Scale Package [LFCSP_VQ]
3 mm × 3 mm Body, Very Thin Quad
(CP-16-2)
Dimensions shown in millimeters
ORDERING GUIDE
1
Model
Temperature Range Package Descri ption Package Option Ordering Quantity Branding
AD8305ACP-R2 −40°C to +85°C 16-Lead LFCSP
AD8305ACP-REEL7 −40°C to +85°C 16-Lead LFCSP, 7” Tape and Reel CP-16-2 1500 JEA
AD8305ACPZ-R2 −40°C to +85°C 16-Lead LFCSP CP-16-2 250 JEA#
AD8305ACPZ-RL7 −40°C to +85°C 16-Lead LFCSP, 7” Tape and Reel CP-16-2 1500 JEA#
AD8305-EVALZ Evaluation Board
1
Z = RoHS Compliant Part; # denotes lead-free product may be top or bottom marked.
(BOTTOM VIEW)
EXPOSED
PAD
0.30
16
1
4
5
CP-16-2
PIN 1
INDICATOR
*
1.45
1.30 SQ
1.15
0.25 MIN
250
072208-A
JEA
©2003–2010 Analog Devices, Inc. All rights reserved. Trademarks and
registered trademarks are the property of their respective owners.
C03053-0-4/10(B)
Rev. B | Page 24 of 24
 Loading...