

High Precision Voltage Reference
R3
R
B
R1
R2
R4
R5
R6
GAIN
ADJ
GND
SENSE
+IN
GND
SENSE
–IN
V
LOW
BAL
ADJ
V
CT
A4 IN
–V
S
+V
S
A4 OUT
FORCE
A4 OUT
SENSE
A3 OUT
FORCE
A3 OUT
SENSE
A3 IN
V
HIGH
NOISE
REDUCTION
A1
A4
AD588
A3
A2
FEATURES
Low Drift: 1.5 ppm/ⴗC
Low Initial Error: 1 mV
Pin Programmable Output:
+10 V, +5 V, +65 V Tracking, –5 V, –10 V
Flexible Output Force and Sense Terminals
High Impedance Ground Sense
Machine lnsertable DIP Packaging
MIL-STD-883 Compliant Versions Available
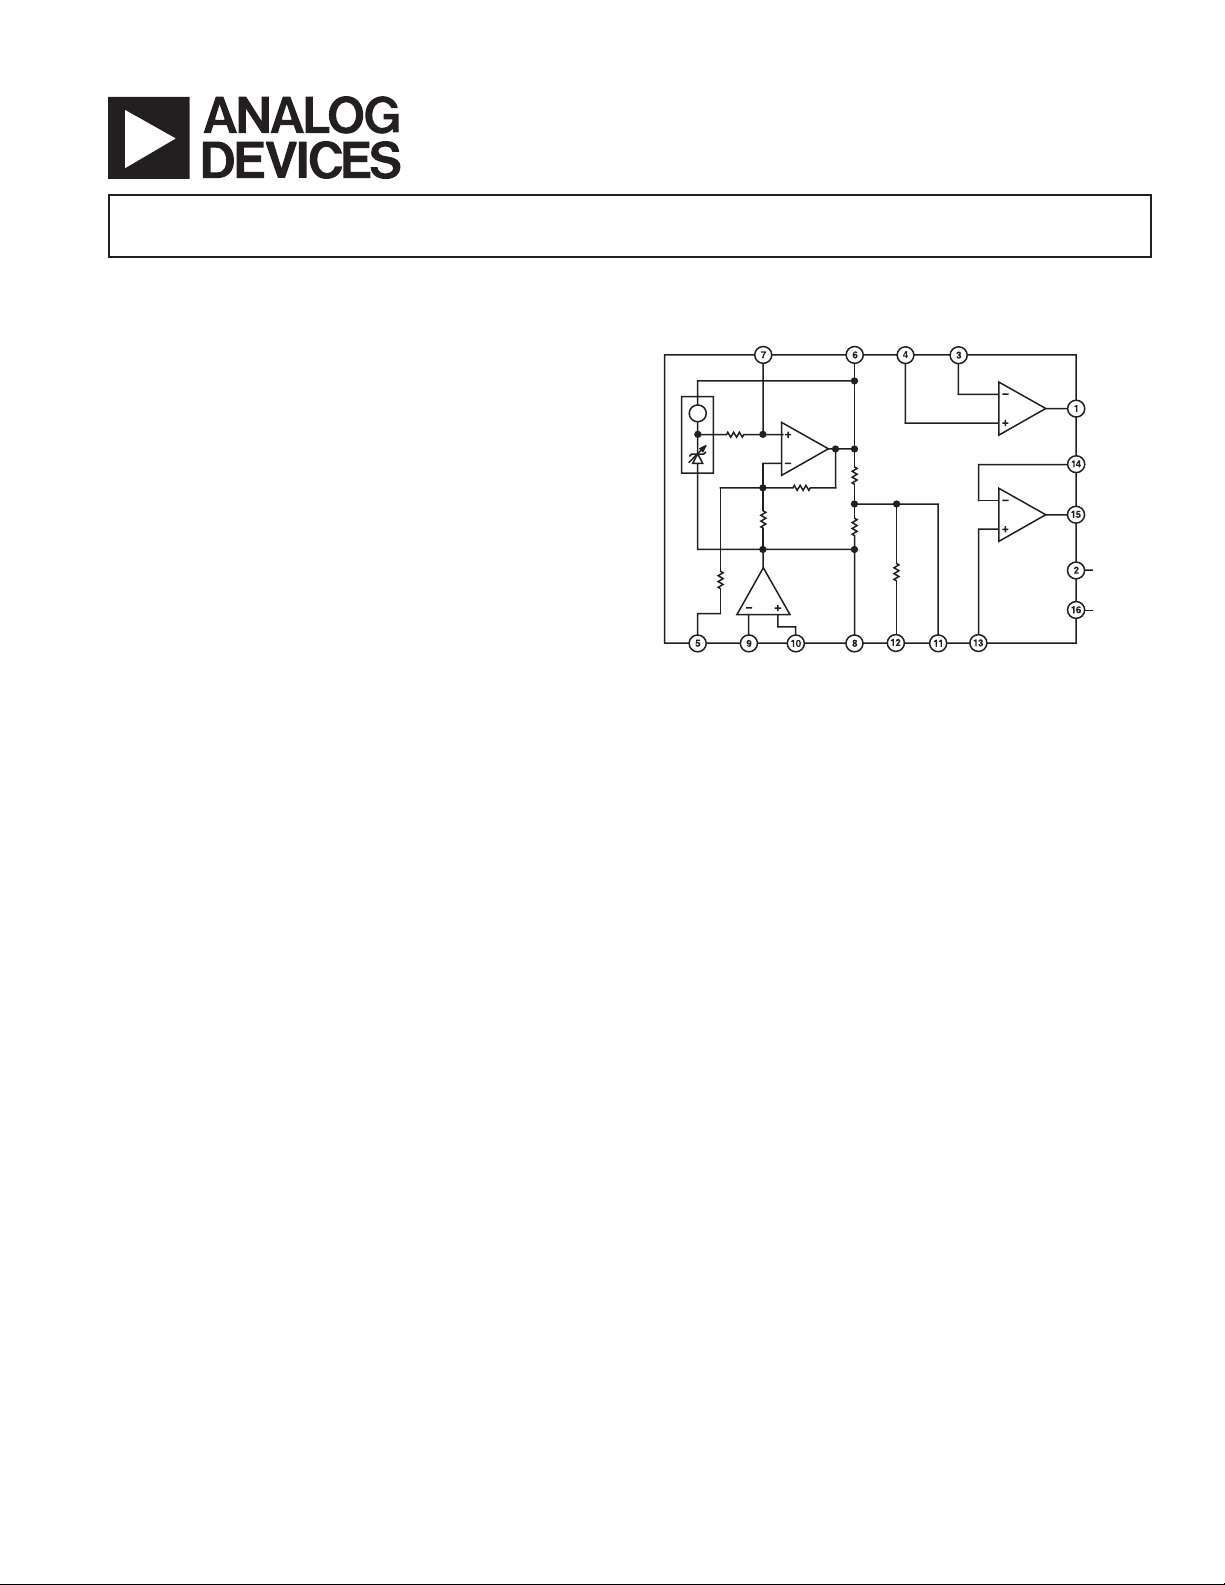
GENERAL DESCRIPTION
The AD588 represents a major advance in the state-of-the-art
in
monolithic voltage references. Low initial error and low temperature drift give the AD588 absolute accuracy performance
previously not available in monolithic form. The AD588 uses a
proprietary ion-implanted buried Zener diode, and laser-waferdrift trimming of high stability thin-film resistors to provide
outstanding performance at low cost.
The AD588 includes the basic reference cell and three additional
amplifiers that provide pin programmable output ranges. The
amplifiers are laser-trimmed for low offset and low drift to maintain the accuracy of the reference. The amplifiers are configured
to allow Kelvin connections to the load and/or boosters for driv-
long lines or high current loads, delivering the full accuracy
ing
of the AD588 where it is required in the application circuit.
The low initial error allows the AD588 to be used as a system
reference in precision measurement applications requiring 12-bit
absolute accuracy. In such systems, the AD588 can provide a
known voltage for system calibration in software, and the low
drift allows compensation for the drift of other components in
system. Manual system calibration and the cost of periodic
a
recalibration can therefore be eliminated. Furthermore, the
mechanical instability of a trimming potentiometer and the
potential for improper calibration can be eliminated by using
the AD588 in conjunction with autocalibration software.
The AD588 is available in four versions. The AD588JQ and
AD588KQ and grades are packaged in a 16-lead CERDIP and
are specified for 0°C to 70°C
operation. AD588AQ and BQ
grades are packaged in a 16-lead CERDIP and are specified for
the –25°C to +85°C industrial temperature range.
AD588
*
FUNCTIONAL BLOCK DIAGRAM
PRODUCT HIGHLIGHTS
1. The AD588 offers 12-bit absolute accuracy without any user
adjustments. Optional fine-trim connections are provided for
applications requiring higher precision. The fine trimming does
not alter the operating conditions of the Zener or the buffer
amplifiers, and thus does not increase the temperature drift.
2. Output noise of the AD588 is very low—typically 6 µV p-p.
A pin is provided for additional noise filtering using an external capacitor.
3. A precision ±5 V tracking mode with Kelvin output connections is available with no external components. Tracking error
is less than 1 mV and a fine-trim is available for applications
requiring exact symmetry between the +5 V and –5 V outputs.
4. Pin strapping capability allows configuration of a wide variety of outputs: ±5 V, +5 V, +10 V, –5 V, and –10 V dual
outputs or +5 V, –5 V, +10 V, and –10 V single outputs.
*Protected by Patent Number 4,644,253.
REV. D
Information furnished by Analog Devices is believed to be accurate and
reliable. However, no responsibility is assumed by Analog Devices for its
use, nor for any infringements of patents or other rights of third parties that
may result from its use. No license is granted by implication or otherwise
under any patent or patent rights of Analog Devices. Trademarks and
registered trademarks are the property of their respective companies.
One Technology Way, P.O. Box 9106, Norwood, MA 02062-9106, U.S.A.
Tel: 781/329-4700 www.analog.com
Fax: 781/326-8703 © 2003, Analog Devices, Inc. All rights reserved.

AD588–SPECIFICATIONS
(Typical @ 25°C, 10 V output, VS = ⴞ15 V, unless otherwise noted.1)
AD588JQ/AQ AD588BQ/KQ
Parameter Min Typ Max Min Typ Max Unit
OUTPUT VOLTAGE ERROR
+10 V, –10 V Outputs ±3–1 +1mV
+5 V, –5 V Outputs ±3–1 +1mV
±5 V TRACKING MODE
Symmetry Error ±1.5 ±0.75 mV
OUTPUT VOLTAGE DRIFT
0°C to 70°C (J, K, B) ±2 ±3 ±1.5 ppm/°C
–25°C to +85°C (A, B) ±3 ±3 ppm/°C
GAIN ADJ AND BAL ADJ
2
Trim Range ±4 ±4mV
Input Resistance 150 150 kΩ
LINE REGULATION
T
to T
MIN
MAX
3
±200 ±200 µV/V
LOAD REGULATION
T
to T
MIN
+10 V Output, 0 mA < I
–10 V Output, –10 mA < I
MAX
< 10 mA ±50 ±50 µV/mA
OUT
< 0 mA ±50 ±50 µV/mA
OUT
SUPPLY CURRENT
T
MIN
to T
MAX
6 10 6 10 mA
Power Dissipation 180 300 180 300 mW
OUTPUT NOISE (Any Output)
0.1 Hz to 10 Hz 6 6 µV p-p
Spectral Density, 100 Hz 100 100 nV/√Hz
LONG-TERM STABILITY (@ 25°C) 15 15 ppm/1000 hr
BUFFER AMPLIFIERS
Offset Voltage 100 10 µV
Offset Voltage Drift 1 1 µV/°C
Bias Current 20 20 nA
Open-Loop Gain 110 110 dB
Output Current A3, A4 –10 +10 –10 +10 mA
Common-Mode Rejection (A3, A4)
= 1 V p-p 100 100 dB
V
CM
Short Circuit Current 50 50 mA
TEMPERATURE RANGE
Specified Performance
J, K Grades 0 70 0 70 °C
A, B Grades –25 +85 –25 +85 °C
NOTES
1
Output Configuration
+10 V Figure 2a
–10 V Figure 2c
+5 V, –5 V, ± 5 V Figure 2b
Specifications tested using +10 V configuration, unless otherwise indicated.
2
Gain and balance adjustments guaranteed capable of trimming output voltage error and symmetry error to zero.
3
Test Conditions:
+10 V Output –VS = –15 V, 13.5 V ≤ +VS ≤ 18 V
–10 V Output –18 V ≤ –VS ≤ –13.5 V, +VS = 15 V
±5 V Output +VS = +18 V, –VS = –18 V
For ± 10 V output, ± VS can be as low as ± 12 V.
Specifications subject to change without notice.
Specifications shown in boldface are tested on all production units at final electrical test. Results from those tests are used to calculate outgoing quality
levels. All min and max specifications are guaranteed, although only those shown in boldface are tested on all production units.
+VS = +10.8 V, –VS = –10.8 V
REV. D–2–
AD588
ABSOLUTE MAXIMUM RATINGS*
+VS to –VS . . . . . . . . . . . . . . . . . . . . . . . . . . . . . . . . . . . . . 36 V
Power Dissipation (25°C) . . . . . . . . . . . . . . . . . . . . . . 600 mW
Storage Temperature Range . . . . . . . . . . . . . –65°C to +150°C
Lead Temperature Range (Soldering 10 sec) . . . . . . . . . 300°C
Package Thermal Resistance (JA/JC) . . . . . . . . 90°C/25°C/W
Output Protection: All Outputs Safe if Shorted to Ground
*Stresses above those listed under Absolute Maximum Ratings may cause perma-
nent damage to the device. This is a stress rating only; functional operation of the
device at these or any other conditions above those indicated in the operational
sections of this specification is not implied. Exposure to absolute maximum rating
conditions for extended periods may affect device reliability.
ORDERING GUIDE
Part Number1Initial Error (mV) Temperature Coefficient
2
Temperature Range (°C) Package Option
AD588AQ 3 3 ppm/°C –25 to +85 CERDIP (Q-16)
AD588BQ 1 1.5 ppm/°C –25 to +85
AD588JQ 3 3 ppm/°C0 to 70 CERDIP (Q-16)
AD588KQ 1 1.5 ppm/°C0 to 70 CERDIP (Q-16)
NOTES
1
For details on grade and package offerings screened in accordance with MIL-STD-883, refer to the Analog Devices Military Products Databook or current
AD588/883B.
2
Temperature coefficient specified from 0°C to 70°C.
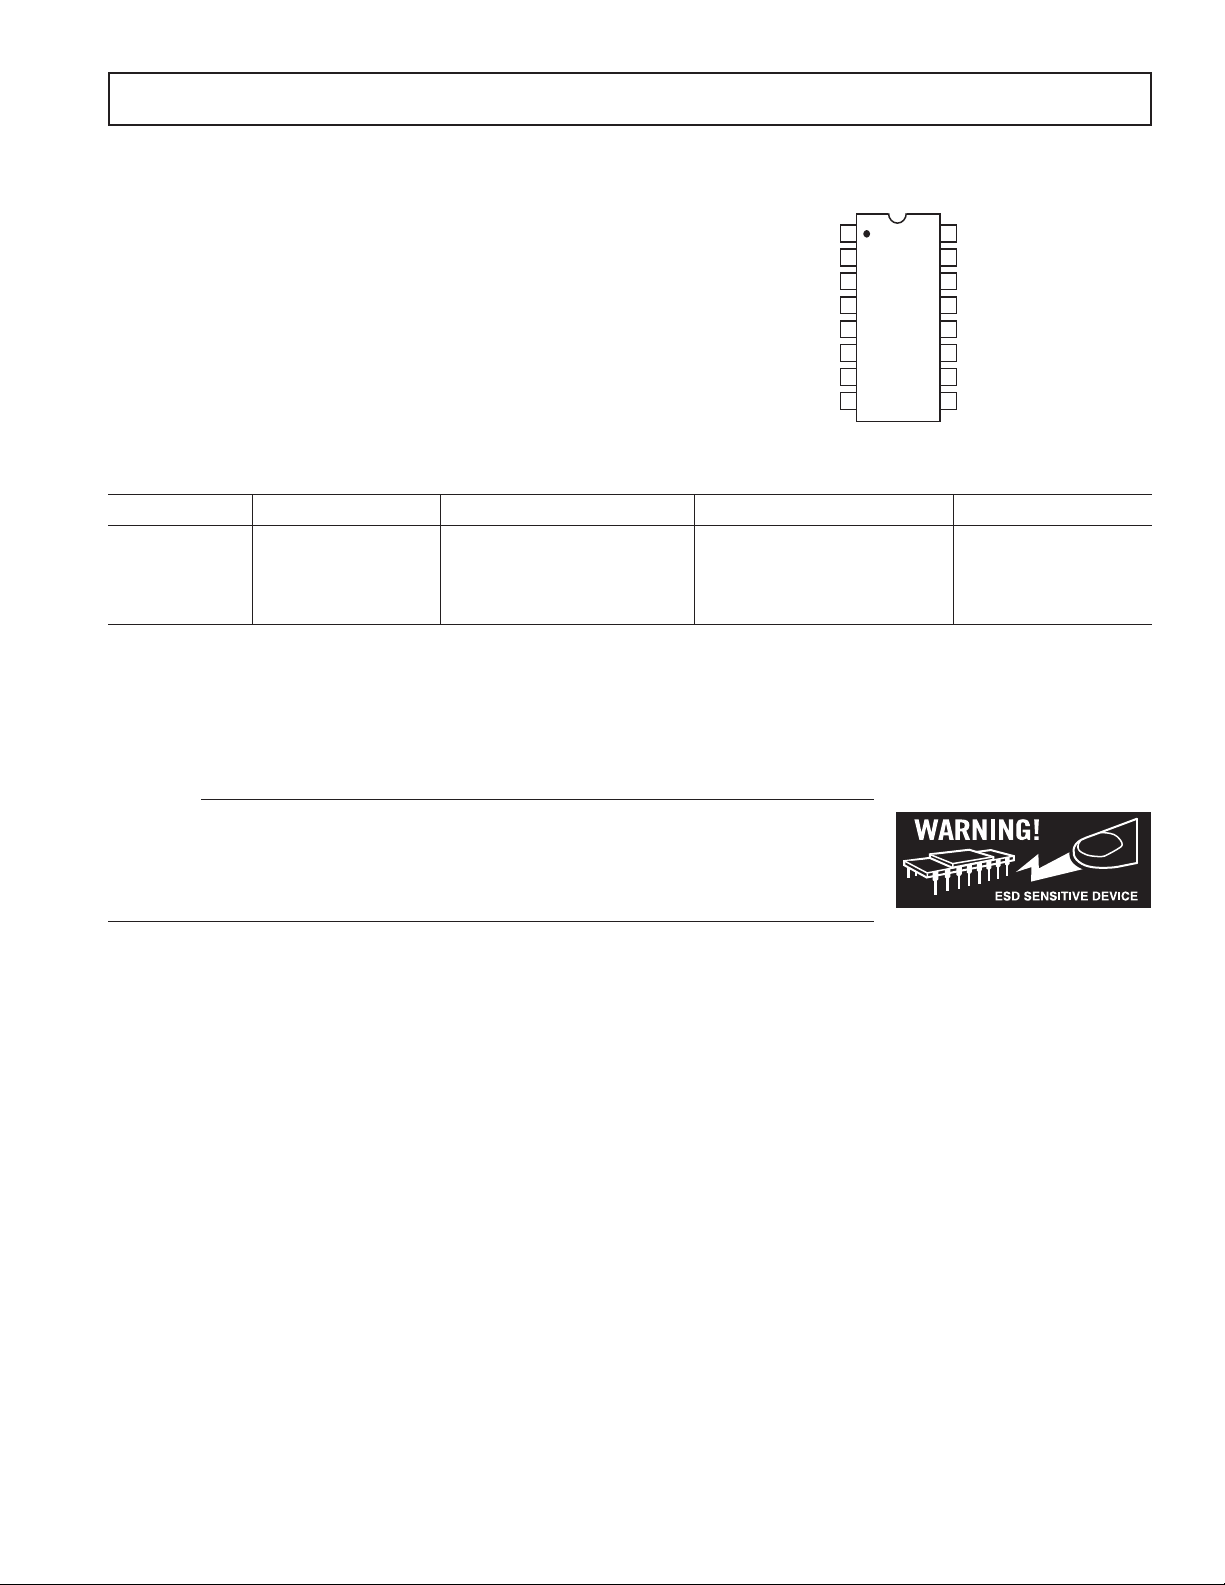
PIN CONFIGURATION
+V
A3 IN
V
HIGH
NOISE
V
LOW
2
1
2
S
3
4
5
6
7
8
AD588
TOP VIEW
(Not to Scale)
A3 OUT FORCE
A3 OUT SENSE
GAIN ADJ
REDUCTION
16
–V
S
15
A4 OUT FORCE
14
A4 OUT SENSE
13
A4 IN
12
BAL ADJ
11
V
CT
10
GND SENSE –IN
9
GND SENSE +IN
CERDIP (Q-16)
CAUTION
ESD (electrostatic discharge) sensitive device. Electrostatic charges as high as 4000 V readily
accumulate on the human body and test equipment and can discharge without detection. Although the
AD588 features proprietary ESD protection circuitry, permanent damage may occur on devices
subjected to high energy electrostatic discharges. Therefore, proper ESD precautions are recommended
to avoid performance degradation or loss of functionality.
REV. D
–3–
AD588
THEORY OF OPERATION
The AD588 consists of a buried Zener diode reference, amplifiers
used to provide pin programmable output ranges, and associated thin-film resistors as shown in Figure 1. The temperature
compensation circuitry provides the device with a temperature
coefficient of 1.5 ppm/°C or less.
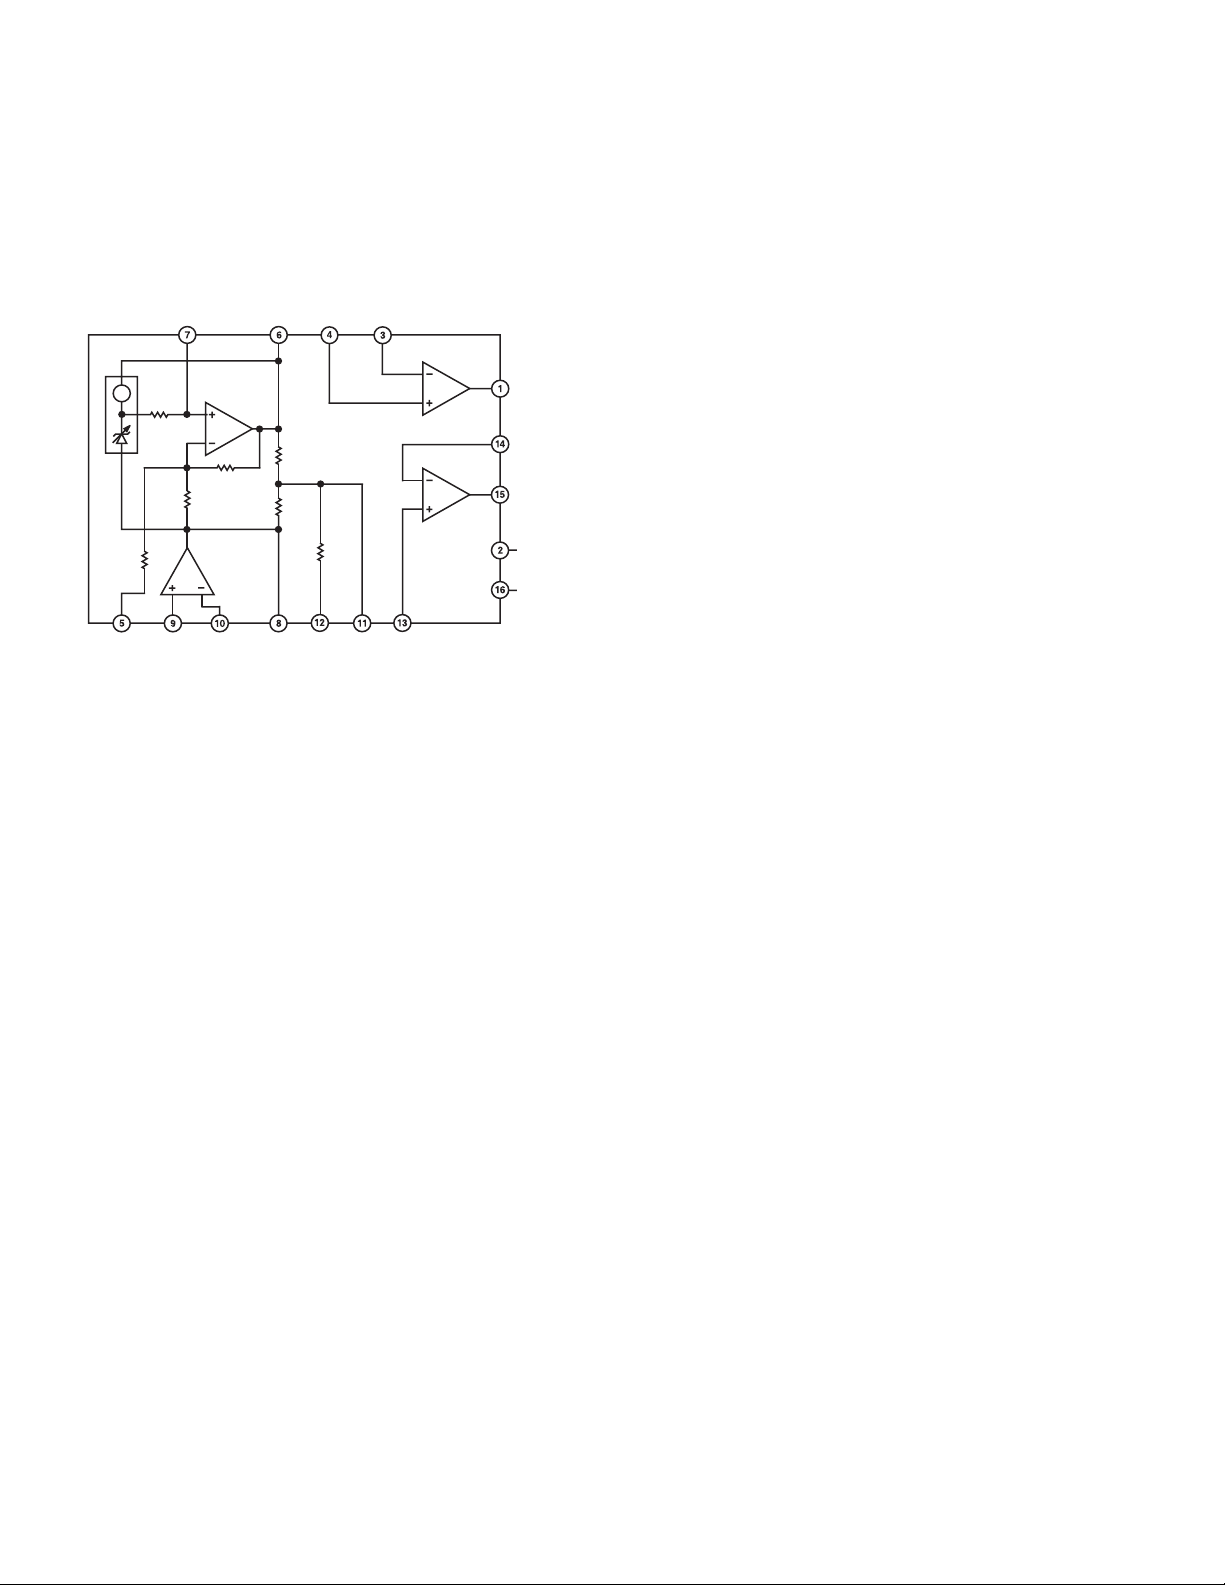
APPLYING THE AD588
The AD588 can be configured to provide +10 V and –10 V
reference outputs as shown in Figures 2a and 2c, respectively. It
can also be used to provide +5 V, –5 V, or a ±5 V tracking
reference, as shown in Figure 2b. Table I details the appropriate
pin connections for each output range. In each case, Pin 9 is
connected to system ground and power is applied to Pins 2 and 16.
NOISE
REDUCTION
V
HIGH
A3 IN
A3 OUT
SENSE
The architecture of the AD588 provides ground sense and
uncommitted output buffer amplifiers that offer the user a great
deal of functional flexibility. The AD588 is specified and tested
R
B
A1
R1
R2
R3
A2
R4
R5
R6
A3
A4
AD588
A3 OUT
FORCE
A4 OUT
SENSE
A4 OUT
FORCE
+V
S
–V
S
in the configurations shown in Figure 2a. The user may choose
to take advantage of the many other configuration options available
with the AD588. However, performance in these configurations
is not guaranteed to meet the extremely stringent data sheet
specifications.
As indicated in Table I, a +5 V buffered output can be provided
using amplifier A4 in the +10 V configuration (Figure 2a). A –5 V
buffered output can be provided using amplifier A3 in the –10 V
configuration (Figure 2c). Specifications are not guaranteed for
the +5 V or –5 V outputs in these configurations. Performance
will be similar to that specified for the +10 V or –10 V outputs.
GAIN
ADJ
GND
SENSE
+IN
GND
SENSE
–IN
V
LOW
BAL
ADJ
V
A4 IN
CT
As indicated in Table I, unbuffered outputs are available at
Pins 6, 8, and 11. Loading of these unbuffered outputs will
impair circuit performance.
Figure 1. AD588 Functional Block Diagram
Amplifier A1 performs several functions. A1 primarily acts to
amplify the Zener voltage from 6.5 V to the required 10 V output.
In addition, A1 also provides for external adjustment of the
10 V output through Pin 5, GAIN ADJ. Using the bias compensation resistor between the Zener output and the noninverting
nput to A1, a capacitor can be added at the NOISE REDUCTION
i
pin (Pin 7) to form a low-pass filter and reduce the noise contribution of the Zener to the circuit. Two matched 10 kΩ nominal
thin-film resistors (R4 and R5) divide the 10 V output in half.
Pin V
(Pin 11) provides access to the center of the voltage
CT
span and Pin 12 (BAL ADJ) can be used for fine adjustment
of this division.
Ground sensing for the circuit is provided by amplifier A2. The
noninverting input (Pin 9) senses the system ground, which
will be transferred to the point on the circuit where the inverting input (Pin 10) is connected. This may be Pin 6, 8, or 11.
The output of A2 drives Pin 8 to the appropriate voltage. Thus, if
Pin 10 is connected to Pin 8, the V
pin will be the same
LOW
voltage as the system ground. Alternatively, if Pin 10 is connected to the V
pin, it will be ground and Pin 6 and Pin 8 will
CT
be +5 V and –5 V, respectively.
Amplifiers A3 and A4 are internally compensated and are used
to buffer the voltages at Pins 6, 8, and 11, as well as to provide a
full Kelvin output. Thus, the AD588 has a full Kelvin capability
by providing the means to sense a system ground and provide
forced and sensed outputs referenced to that ground.
Amplifiers A3 and A4 can be used interchangeably. However,
the AD588 is tested (and the specifications are guaranteed) with
the amplifiers connected as indicated in Figure 2a and Table I.
When either A3 or A4 is unused, its output force and sense pins
should be connected and the input tied to ground.
Two outputs of the same voltage may be obtained by connecting both A3 and A4 to the appropriate unbuffered output on
Pins 6, 8, or 11. Performance in these dual-output configurations will typically meet data sheet specifications.
CALIBRATION
Generally, the AD588 will meet the requirements of a precision
system without additional adjustment. Initial output voltage
error of 1 mV and output noise specs of 10 µV p-p allow for
accuracies of 12 bits to 16 bits. However, in applications where
an even greater level of accuracy is required, additional calibration may be called for. Provision for trimming has been made
through the use of the GAIN ADJ and BAL ADJ pins (Pins 5 and
12, respectively).
The AD588 provides a precision 10 V span with a center tap
(V
achieve the voltage output configurations in Table I. GAIN
ADJUST and BALANCE ADJUST can be used in any of these
configurations
the position of the center tap within the span. The GAIN
ADJUST should be performed first. Although the trims are not
interactive within the device, the GAIN trim will move the
BALANCE trim point as it changes the magnitude of the span.
) that is used with the buffer and ground sense amplifiers to
CT
to trim the magnitude of the span voltage and
REV. D–4–
AD588
Table I. Pin Connections
Connect Buffered
Pin 10 Unbuffered* Output on Pins Output Buffered Output on Pins
Range to Pin: –10 V –5 V 0 V +5 V +10 V Connections –10 V –5 V 0 V +5 V +10 V
+10 V 8 8 11 6 11 to 13, 14 to 15 15
6 to 4, and 3 to 1 1
–5 V or +5 V 11 8 11 6 8 to 13, 14 to 15, 15
6 to 4, and 3 to 1 1
–10 V 6 8 11 6 8 to 13, 14 to 15, 15
11 to 4, and 3 to 1 1
+5 V 11 6 6 to 4 and 3 to 1 1
–5 V118 8 to 13 and 14 to 15 15
*Unbuffered outputs should not be loaded.
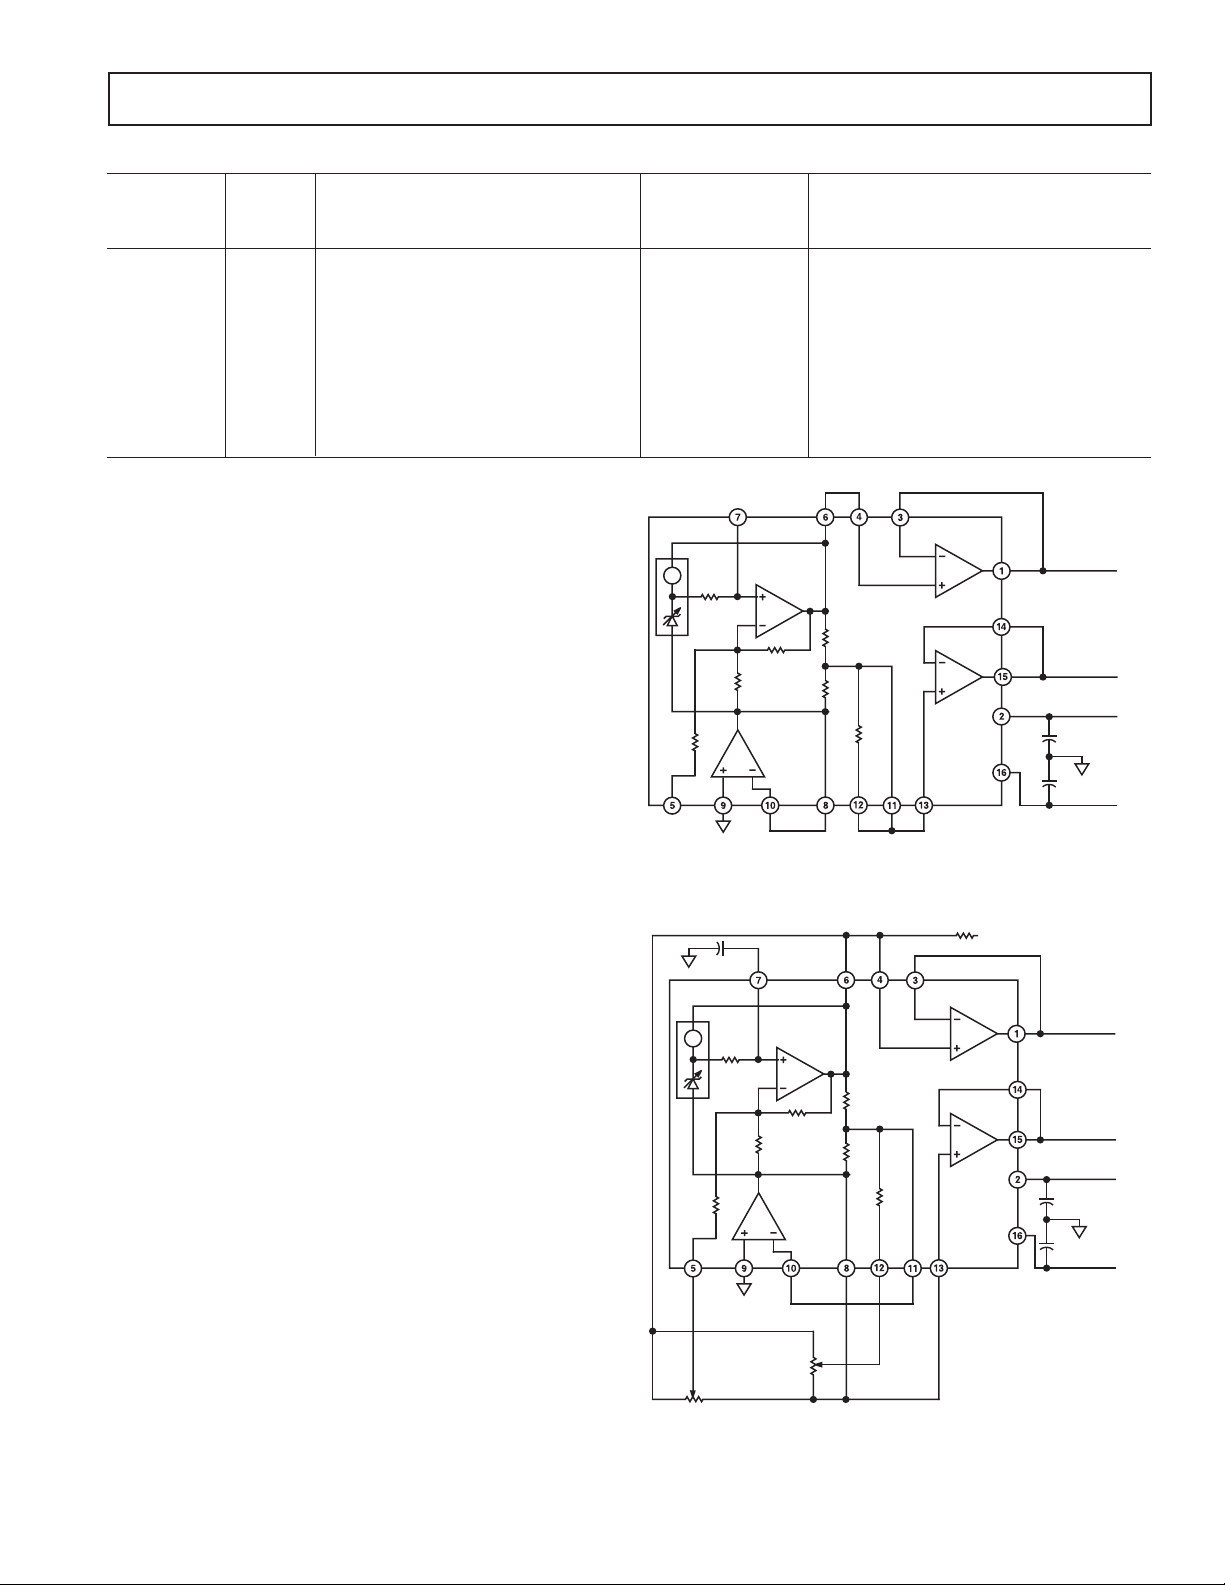
Figure 2b shows GAIN and BALANCE trims in a +5 V and
–5 V tracking configuration. A 100 kΩ 20-turn potentiometer is
used for each trim. The potentiometer for GAIN trim is connected between Pin 6 (V
) and Pin 8 (V
HIGH
) with the wiper
LOW
connected to Pin 5 (GAIN ADJ). The potentiometer is adjusted
to produce exactly 10 V between Pin 1 and Pin 15, the amplifier
outputs. The BALANCE potentiometer, also connected between
Pin 6 and Pin 8 with the wiper to Pin 12 (BAL ADJ), is then
adjusted to center the span from +5 V to –5 V.
Trimming in other configurations works in exactly the same
manner. When producing +10 V and +5 V, GAIN ADJ is used
to trim +10 V and BAL ADJ is used to trim +5 V. In the –10 V
and –5 V configuration, GAIN ADJ is again used to trim the
magnitude of the span, –10 V, while BAL ADJ is used to trim
the center tap, –5 V.
In single output configurations, GAIN ADJ is used to trim outputs
utilizing the full span (+10 V or –10 V), while BAL ADJ is used
to trim outputs using half the span (+5 V or –5 V).
Input impedance on both the GAIN ADJ and BAL ADJ pins is
approximately 150 kΩ. The GAIN ADJUST trim network
effectively attenuates the 10 V across the trim potentiometer
by a factor of about 1500 to provide a trim range of –3.5 mV to
+7.5 mV with a resolution of approximately 550 µV/turn
(20-turn potentiometer). The BAL ADJ trim network attenuates the trim voltage by a factor of about 1400, providing a
trim range of ±4.5 mV with resolution of 450 µV/turn.
R3
R
B
R2
SYSTEM
GROUND
1F
R
R3
A2
B
R2
A1
R1
R4
R5
R6
Figure 2a. +10 V Output
NOISE
REDUCTION
A1
R1
A2
R4
R5
A3
A4
+V
S
AD588
–V
S
+15V
A3
A4
+V
R6
AD588
–V
S
S
0.1F
0.1F
0.1F
0.1F
+10V
+5V
+15V
SYSTEM
GROUND
–15V
+5V
–5V
–15V
SYSTEM
GROUND
–15V
REV. D
–5–
SYSTEM
GROUND
100k⍀
20T
GAIN ADJUST
100k⍀
20T
BALANCE
ADJUST
Figure 2b. +5 V and –5 V Outputs

AD588
0.1F
0.1F
R3
R
B
R2
A2
SYSTEM
GROUND
NOISE
REDUCTION
A1
R1
A3
R4
R5
R6
A4
+V
AD588
–V
S
S
0.1F
0.1F
–5V
–10V
+15V
SYSTEM
GROUND
–15V
Figure 2c. –10 V Output
Trimming the AD588 introduces no additional errors over
temperature, so precision potentiometers are not required.
For single-output voltage ranges, or in cases when BALANCE
ADJUST is not required, Pin 12 should be connected to Pin 11.
If GAIN ADJUST is not required, Pin 5 should be left floating.
NOISE PERFORMANCE AND REDUCTION
The noise generated by the AD588 is typically less than 6 µV p-p
over the 0.1 Hz to 10 Hz band. Noise in a 1 MHz bandwidth is
approximately 600 µV p-p. The dominant source of this noise is
the buried Zener, which contributes approximately 100 nV/√Hz.
In comparison, the op amp’s contribution is negligible. Figure 3
shows the 0.1 Hz to 10 Hz noise of a typical AD588.
Note that a second capacitor is needed in order to implement
the NOISE REDUCTION feature when using the AD588 in
the –10 V mode (Figure 2c.). The NOISE REDUCTION capacitor is limited to 0.1 µF maximum in this mode.
Figure 4. Effect of 1 µF Noise Reduction Capacitor
on Broadband Noise
TURN-ON TIME
Upon application of power (cold start), the time required for the
output voltage to reach its final value within a specified error
band is the turn-on settling time. Two components normally
associated with this are: time for active circuits to settle and
time for thermal gradients on the chip to stabilize. Figures 5a
and 5b show the turn-on characteristics of the AD588. It
shows the settling to be about 600 µs. Note the absence of any
thermal tails when the horizontal scale is expanded to 2 ms/cm in
Figure 5b.
Figure 3. 0.1 Hz to 10 Hz Noise (0.1 Hz to 10 Hz BPF
with Gain of 1000 Applied)
If further noise reduction is desired, an optional capacitor, CN,
may be added between the NOISE REDUCTION pin and ground,
as shown in Figure 2b. This will form a low-pass filter with the
4 kΩ R
on the output of the Zener cell. A 1 µF capacitor will
B
have a 3 dB point at 40 Hz and will reduce the high frequency
(to 1 MHz) noise to about 200 µV p-p. Figure 4 shows the 1 MHz
noise of a typical AD588 both with and without a 1 µF capacitor.
Figure 5a. Electrical Turn-On
Figure 5b. Extended Time Scale Turn-On
Output turn-on time is modified when an external noise reduction capacitor is used. When present, this capacitor presents an
REV. D–6–

AD588
A
A
A
A
A
A
(
additional load to the internal Zener diode’s current source,
resulting in a somewhat longer turn-on time. In the case of a
1 µF capacitor, the initial turn-on time is approximately 60 ms
(see Figure 6).
Note: If the NOISE REDUCTION feature is used in the ±5 V
configuration, a 39 kΩ resistor between Pin 6 and Pin 2 is required
for proper startup.
DEVICE
GRADE
D588JQ
D588JQ
D588JQ
D588JQ
D588JQ
D588JQ
MAXIMUM OUTPUT CHANGE – mV
0ⴗC TO +70ⴗC –25ⴗC TO +85ⴗC –55ⴗC TO +125ⴗC
2.10
1.05
1.40(typ)
1.05
3.30
3.30
10.80
7.20
Figure 8. Maximum Output Change—mV
KELVIN CONNECTIONS
Force and sense connections, also referred to as Kelvin connections, offer a convenient method of eliminating the effects of
voltage drops in circuit wires. As seen in Figure 9, the load
current and wire resistance produce an error (V
ERROR
= R × IL) at
the load. The Kelvin connection of Figure 9 overcomes the
problem by including the wire resistance within the forcing loop
of the amplifier and sensing the load voltage. The amplifier
corrects for any errors in the load voltage. In the circuit shown,
Figure 6. Turn-On with CN = 1 F
the output of the amplifier would actually be at 10 V + V
ERROR
and
the voltage at the load would be the desired 10 V.
TEMPERATURE PERFORMANCE
The AD588 is designed for precision reference applications
where temperature performance is critical. Extensive temperature testing ensures that the device’s high level of performance is
The AD588 has three amplifiers that can be used to implement
Kelvin connections. Amplifier A2 is dedicated to the ground
force-sense function, while uncommitted amplifiers A3 and A4
are free for other force-sense chores.
maintained over the operating temperature range.
Figure 7 shows typical output voltage drift for the AD588BD
and illustrates the test methodology. The box in Figure 7 is
bounded on the sides by the operating temperature extremes
and on top and bottom by the maximum and minimum output
voltages measured over the operating temperature range. The
slope of the diagonal drawn from the lower left corner of the
box determines the performance grade of the device.
OUTPUT
VOLTS
10.002
10V
+
–
R
LOAD
I
L
V = 10V – RI
R
R
L
I = 0
Figure 9. Advantage of Kelvin Connection
In some single-output applications, one amplifier may be unused.
In such cases, the unused amplifier should be connected as a
R
I = 0
V = 10V + RI
V = 10V
R
I
LOAD
L
L
unity-gain follower (force + sense pin tied together), and the
V
MAX
10.001
V–V
MAX MIN
(T – T ) 10 1
MAX MIN
10.0013V 10.00025V
85 C –25 C) 10 10
°− ° × ×
=° 0.95ppm / C
××
−
V
10.000
MIN
–35 –15 5 25 45 65
T
min
TEMPERATURE – ⴗC
SLOPE T.C. =
85
T
max
=
Figure 7. Typical AD588BD Temperature Drift
Each AD588A and B grade unit is tested at –25°C, 0°C, +25°C,
+50°C, +70°C, and +85°C. This approach ensures that the
variations of output voltage that occur as the temperature changes
within the specified range will be contained within a box whose
diagonal has a slope equal to the maximum specified drift. The
position of the box on the vertical scale will change from device
to device as initial error and the shape of the curve vary. Maxi-
input should be connected to ground.
An unused amplifier section may be used for other circuit functions
as well. Figures 10 through 14 show the typical performance of
–6
A3 and A4.
–6
100
80
60
40
20
OPEN-LOOP GAIN – dB
0
PHASE
GAIN
0
–30
–60
–90
–120
PHASE – Degrees
–150
mum height of the box for the appropriate temperature range is
shown in Figure 8. Duplication of these results requires a combination of high accuracy and stable temperature control in a test
–20
10 10M100
1k 10k 100k 1M
FREQUENCY – Hz
–180
system. Evaluation of the AD588 will produce a curve similar to
that in Figure 7, but output readings may vary depending on the
test methods and equipment utilized.
REV. D
Figure 10. Open-Loop Frequency Response (A3, A4)
–7–

AD588
110
100
80
60
40
20
POWER SUPPLY REJECTION – dB
10
10 10M100
1k 10k 100k 1M
FREQUENCY – Hz
+SUPPLY
–SUPPLY
VS = ⴞ15V WITH
1V p-p SINE WAVE
Figure 11. Power Supply Rejection vs. Frequency (A3, A4)
Figure 12a. Unity-Gain Follower Pulse Response
(Large Signal)
110
100
80
60
CMRR – dB
40
20
0
10 10M100
1k 10k 100k 1M
FREQUENCY – Hz
VS = ⴞ15V
VCM = 1V p-p +25ⴗC
Figure 13. Common-Mode Rejection vs.
Frequency (A3, A4)
100
90
80
70
60
50
40
30
20
NOISE SPECTRAL DENSITY – nV/ Hz
10
0
1 10k10
100 1k
FREQUENCY – Hz
Figure 14. Input Noise Voltage Spectral Density
Figure 12b. Unity-Gain Follower Pulse Response
(Small Signal)
DYNAMIC PERFORMANCE
The output buffer amplifiers (A3 and A4) are designed to
provide the AD588 with static and dynamic load regulation
superior to less complete references.
Many A/D and D/A converters present transient current loads
to the reference, and poor reference response can degrade the
converter’s performance.
Figures 15a and 15b display the characteristics of the AD588
output amplifier driving a 0 mA to 10 mA load.
A3 OR A4
10V
1k⍀
V
I
V
OUT
L
10V
L
0V
Figure 15a. Transient Load Test Circuit
REV. D–8–

AD588
Figure 15b. Large-Scale Transient Response
Figures 16a and 16b display the output amplifier characteristics
driving a 5 mA to 10 mA load, a common situation found when
the reference is shared among multiple converters or is used to
provide a bipolar offset current.
A3 OR A4
V
OUT
10V
I
L
V
L
2k⍀ 2k⍀
10V
0V
+
–
Figure 16a. Transient and Constant Load Test Circuit
Figure 17b. Output Response with Capacitive Load
Figures 18a and 18b display the crosstalk between output amplifiers. The top trace shows the output of A4, dc-coupled and
offset by 10 V, while the output of A3 is subjected to a 0 mA
to 10 mA load current step. The transient at A4 settles in about
1 µs, and the load-induced offset is about 100 µV.
V
A4
+
10V
–
OUT
V
A3
1k⍀
10V
L
0V
10V
+
–
Figure 18a. Load Crosstalk Test Circuit
Figure 16b. Transient Response 5 mA to10 mA Load
In some applications, a varying load may be both resistive and
capacitive in nature or be connected to the AD588 by a long
capacitive cable.
Figures 17a and 17b display the output amplifier characteristics
driving a 1,000 pF, 0 mA to 10 mA load.
A3 OR A4
V
OUT
1k⍀
10V
L
0V
10V
1000pF
C
L
V
Figure 17a. Capacitive Load Transient Response
Test Circuit
REV. D
–9–
Figure 18b. Load Crosstalk

AD588
Attempts to drive a large capacitive load (in excess of 1,000 pF)
may result in ringing or oscillation, as shown in the step response
photo (Figure 19a). This is due to the additional pole formed by
the load capacitance and the output impedance of the amplifier,
which consumes phase margin. The recommended method of
driving capacitive loads of this magnitude is shown in Figure 19b.
The 150 Ω resistor isolates the capacitive load from the output
stage, while the 10 kΩ resistor provides a dc feedback path and
preserves the output accuracy. The 1 µF capacitor provides a
high frequency feedback loop. The performance of this circuit is
shown in Figure 19c.
Figure 19a. Output Amplifier Step Response, CL = 1 µF
10k⍀
1F
USING THE AD588 WITH CONVERTERS
The AD588 is an ideal reference for a wide variety of A/D and
D/A converters. Several representative examples follow.
14-Bit Digital-to-Analog Converter—AD7535
High resolution CMOS D/A converters require a reference voltage
of high precision to maintain rated accuracy. The combination
of the AD588 and AD7535 takes advantage of the initial accuracy, drift, and full Kelvin output capability of the AD588 as
well as the resolution, monotonicity, and accuracy of the AD7535
to produce a subsystem with outstanding characteristics. See
Figure 20.
16-Bit Digital-to-Analog Converter—AD569
Another application that fully utilizes the capabilities of the
AD588 is supplying a reference for the AD569, as shown in
Figure 21. Amplifier A2 senses system common and forces V
CT
to assume this value, producing +5 V and –5 V at Pin 6 and
Pin 8, respectively. Amplifiers A3 and A4 buffer these voltages
out to the appropriate reference force-sense pins of the AD569.
The full Kelvin scheme eliminates the effect of the circuit traces
or wires and the wire bonds of the AD588 and AD569 themselves, which would otherwise degrade system performance.
SUBSTITUTING FOR INTERNAL REFERENCES
Many converters include built-in references. Unfortunately,
such references are the major source of drift in these converters.
By using a more stable external reference like the AD588, drift
performance can be improved dramatically.
150⍀
+
V
IN
–
C
1F
V
OUT
L
Figure 19b. Compensation for Capacitive Loads
Figure 19c. Output Amplifier Step Response
Using Figure 19b Compensation
REV. D–10–

AD588
B
N.C. V
V
REFS
+10V
V
+V
–V
REFF
AGNDS
AGNDF
S
S
R
B
A1
R1
R2
R3
A2
R4
R5
AD588
R6
A3
A4
14-BIT DAC
14
DAC REGISTER
68
MS
INPUT
REGISTER
LS
INPUT
REGISTER
DD
AD7535
DGNDDB0DB13
R
FS
I
OUT
LDAC
CSLSB
CSMS
WR
V
SS
Figure 20. AD588/AD7535 Connections
+12V
–12V
–V
S
AD569
S
E
L
T
E
A
C
P
T
O
R
V
OUT
–5V TO
+5V
AD588
+V
S
V
A1
A3 + IN
H
10k⍀
10k⍀
A2
A
3
OUT
A3
– IN
A
3
– IN
A
2
+ IN
A
2
– IN
A
4
A
4
OUT
A4
+V
REF
FORCE
+V
+5V
V
–5V
REF
SENSE
S
S
E
REF
E
L
G
E
M
C
E
T
N
O
T
R
CT
–V
REF
SENSE
–V
FORCE
REV. D
V
L
+ IN
A
4
GND
CS LDAC
DB15
8 MSBs
8 LSBs
LATCHES
HBE LBE
DB0
Figure 21. High Accuracy ±5 V Tracking Reference for AD569
–11–

AD588
12-Bit Analog-to-Digital Converter—AD574A
The AD574A is specified for gain drift from 10 ppm/°C to
50 ppm/°C, (depending on grade) using its on-chip reference.
The reference contributes typically 75% of this drift. Therefore,
the total drift using an AD588 to supply the reference can be
improved by a factor of 3 to 4.
Using this combination may result in apparent increases in fullscale error due to the difference between the on-board reference
by which the device is laser-trimmed and the external reference
with which the device is actually applied. The on-board reference
is specified to be 10 V ± 100 mV, while the external reference is
specified to be 10 V ± 1 mV. This may result in up to 101 mV
of apparent full-scale error beyond the ±25 mV specified AD574
gain error. External resistors R2 and R3 allow this error to be
nulled. Their contribution to full-scale drift is negligible.
The high output drive capability allows the AD588 to drive up
to six converters in a multiconverter system. All converters will
have gain errors that track to better than ±5 ppm/°C.
RTD EXCITATION
The resistance temperature detector (RTD) is a circuit element
whose resistance is characterized by a positive temperature
coefficient. A measurement of resistance indicates the measured
temperature. Unfortunately, the resistance of the wires leading
to the RTD often adds error to this measurement. The 4-wire
ohms measurement overcomes this problem. This method uses
two wires to bring an excitation current to the RTD and two
additional wires to tap off the resulting RTD voltage. If these
additional two wires go to a high input impedance measurement
circuit, the effect of their resistance is negligible. Therefore, they
transmit the true RTD voltage.
I
EXC
R
R
RTD
I = 0
R
R
I = 0
+
␣R
V
OUT
RTD
–
Figure 23. 4-Wire Ohms Measurement
A practical consideration when using the 4-wire ohms technique
with an RTD is the self-heating effect that the excitation current
has on the temperature of the RTD. The designer must choose
the smallest practical excitation current that still gives the desired
resolution. RTD manufacturers usually specify the self-heating
effect of each of their models or types of RTDs.
Figure 24 shows an AD588 providing the precision excitation
current for a 100 Ω RTD. The small excitation current of 1 mA
dissipates a mere 0.1 mW of power in the RTD.
12 8
CS
AO
R/C
CE
R1
20 TURN
V
IN
10V
S
R3
500⍀
61.9⍀
50⍀
R2
R
B
A1
R1
R2
R3
A2
R4
R5
R6
A3
A4
AD588
+V
–V
S
REF IN
REF OUT
BIPP OFF
10V
IN
20V
IN
ANA COM
AD574A
STS
HIGH
BITS
MIDDLE
BITS
LOW
BITS
+5V
+15V
–15V
DIG
COM
Figure 22. AD588/AD574A Connections
REV. D–12–

AD588
R
C
VISHAY S102C
OR SIMILAR
R
B
A1
R4
R1
R2
R3
A2
R5
R6
A3
A4
AD588
RC = 10k⍀
1.0mA
0.01%
+
–15V
OR
V
OUT
–
100⍀
+V
S
–V
S
GROUND
RTD = OMEGA K4515
0.24ⴗC/mW SELF-HEATING
Figure 24. Precision Current Source for RTD
BOOSTED PRECISION CURRENT SOURCE
In the RTD current-source application, the load current is
limited to ±10 mA by the output drive capability of amplifier
A3. In the event that more drive current is needed, a series-pass
transistor can be inserted inside the feedback loop to provide
higher current. Accuracy and drift performance are unaffected
by the pass transistor.
voltage equal to approximately VIN/2. Further processing of this
signal may necessarily be limited to high common-mode rejection techniques such as instrumentation or isolation amplifiers.
Figure 26b shows the same bridge transducer, this time driven
from a pair of bipolar supplies. This configuration ideally eliminates the common-mode voltage and relaxes the restrictions on
any processing elements that follow.
R4
+
V
IN
–
R3
+–
E
O
R1
R2
Figure 26a. Bridge Transducer Excitation—
Unipolar Drive
+
R4
V
1
–
+
V
2
–
R3
+–
E
O
R1
R2
Figure 26b. Bridge Transducer Excitation—
Bipolar Drive
+15V
220⍀
Q1 =
2N3904
V
CC
R
B
A1
R1
R2
R3
A2
AD588
R4
R5
R6
A3
A4
220⍀
+V
–V
Q
S
S
LOAD
1
10V
IL =
R
C
LIMITED BY
AND R
Q
1
POWER
DISSIPATION
C
Figure 25. Boosted Precision Current Source
BRIDGE DRIVER CIRCUITS
The Wheatstone bridge is a common transducer. In its simplest
form, a bridge consists of four, two-terminal elements connected
to form a quadrilateral, a source of excitation connected along
one of the diagonals and a detector comprising the other diagonal. Figure 26a shows a simple bridge driven from a unipolar
excitation supply. EO, a differential voltage, is proportional to
the deviation of the element from the initial bridge values. Unfortunately, this bridge output voltage is riding on a common-mode
R
B
A1
R1
R2
R3
A2
AD588
R4
R5
R6
A3
+V
–V
220⍀
S
S
A4
E
–15V
+–
O
Q
2
2N3904
=
Figure 27. Bipolar Bridge Drive
As shown in Figure 27, the AD588 is an excellent choice for the
control element in a bipolar bridge driver scheme. Transistors
Q1 and Q2 serve as series-pass elements to boost the current
drive capability to the 28 mA required by a typical 350 Ω bridge.
A differential gain stage may still be required if the bridge balance
is not perfect. Such gain stages can be expensive.
REV. D
–13–

AD588
Additional common-mode voltage reduction is realized by using
the circuit illustrated in Figure 28. A1, the ground sense amplifier, serves the supplies on the bridge to maintain a virtual ground
at one center tap. The voltage that appears on the opposite
center tap is now single-ended (referenced to ground) and can
be amplified by a less expensive circuit.
+15V
220⍀
R
B
A1
R1
R2
R3
A2
R4
R5
R6
A3
A4
AD588
220⍀
–15V
+V
S
–V
S
Figure 28. Floating Bipolar Bridge Drive with Minimum CMV
Q
=
1
2N3904
=
Q
2
2N3904
AD OP-07
R1
R2
+
V
OUT
–
REV. D–14–

OUTLINE DIMENSIONS
16-Lead Ceramic DIP-Glass Hermetic Seal Package [CERDIP]
(Q-16)
Dimensions shown in inches and (millimeters)
AD588
0.005
(0.13)
MIN
PIN 1
0.200 (5.08)
MAX
0.200 (5.08)
0.125 (3.18)
0.023 (0.58)
0.014 (0.36)
CONTROLLING DIMENSIONS ARE IN INCHES; MILLIMETERS DIMENSIONS
(IN PARENTHESES) ARE ROUNDED-OFF INCH EQUIVALENTS FOR
REFERENCE ONLY AND ARE NOT APPROPRIATE FOR USE IN DESIGN
0.098 (2.49)
16
0.840 (21.34) MAX
MAX
18
0.070 (1.78)
0.100
(2.54)
0.030 (0.76)
BSC
9
0.310 (7.87)
0.220 (5.59)
0.060 (1.52)
0.015 (0.38)
SEATING
PLANE
0.150 (3.81)
MIN
15
0
0.320 (8.13)
0.290 (7.37)
0.015 (0.38)
0.008 (0.20)
Revision History
Location Page
2/03—Data Sheet changed from REV. C to REV. D.
Added KQ model and deleted SQ and TQ models . . . . . . . . . . . . . . . . . . . . . . . . . . . . . . . . . . . . . . . . . . . . . . . . . . . . . . . .Universal
Changes to GENERAL DESCRIPTION . . . . . . . . . . . . . . . . . . . . . . . . . . . . . . . . . . . . . . . . . . . . . . . . . . . . . . . . . . . . . . . . . . . . . 1
Change to PRODUCT HIGHLIGHTS . . . . . . . . . . . . . . . . . . . . . . . . . . . . . . . . . . . . . . . . . . . . . . . . . . . . . . . . . . . . . . . . . . . . . . 1
Changes to SPECIFICATIONS . . . . . . . . . . . . . . . . . . . . . . . . . . . . . . . . . . . . . . . . . . . . . . . . . . . . . . . . . . . . . . . . . . . . . . . . . . . . 2
Change to ORDERING GUIDE . . . . . . . . . . . . . . . . . . . . . . . . . . . . . . . . . . . . . . . . . . . . . . . . . . . . . . . . . . . . . . . . . . . . . . . . . . . . 3
Updated OUTLINE DIMENSIONS . . . . . . . . . . . . . . . . . . . . . . . . . . . . . . . . . . . . . . . . . . . . . . . . . . . . . . . . . . . . . . . . . . . . . . . 15
10/02—Data Sheet changed from REV. B to REV. C.
Changes to GENERAL DESCRIPTION . . . . . . . . . . . . . . . . . . . . . . . . . . . . . . . . . . . . . . . . . . . . . . . . . . . . . . . . . . . . . . . . . . . . . 1
Changes to SPECIFICATIONS . . . . . . . . . . . . . . . . . . . . . . . . . . . . . . . . . . . . . . . . . . . . . . . . . . . . . . . . . . . . . . . . . . . . . . . . . . . . 2
Changes to ORDERING GUIDE . . . . . . . . . . . . . . . . . . . . . . . . . . . . . . . . . . . . . . . . . . . . . . . . . . . . . . . . . . . . . . . . . . . . . . . . . . . 3
Changes to TABLE 1 . . . . . . . . . . . . . . . . . . . . . . . . . . . . . . . . . . . . . . . . . . . . . . . . . . . . . . . . . . . . . . . . . . . . . . . . . . . . . . . . . . . . 5
Deleted Figure 10c . . . . . . . . . . . . . . . . . . . . . . . . . . . . . . . . . . . . . . . . . . . . . . . . . . . . . . . . . . . . . . . . . . . . . . . . . . . . . . . . . . . . . . 7
OUTLINE DIMENSIONS updated . . . . . . . . . . . . . . . . . . . . . . . . . . . . . . . . . . . . . . . . . . . . . . . . . . . . . . . . . . . . . . . . . . . . . . . . 15
REV. D
–15–

C00531–0–2/03(D)
–16–
PRINTED IN U.S.A.
 Loading...