

Page 1

User Guide
UG000418
TCS3701
ALS/Color and Proximity Sensor for Use Behind
OLED Displays Evaluation Kit
TCS3701 EVM
v1-00 • 2019-Jan-11
Page 2

Document Feedback
TCS3701
Content Guide
Demo Kit Manual • PUBLIC
UG000418 • v1-00 • 2019-Jan-11
21 │ 2
Content Guide
1 Introduction .................................... 3
1.1 Kit Content .................................................... 3
1.2 Ordering Information .................................... 4
2 Getting Started ............................... 5
3 Hardware Description .................... 6
4 Software Description ..................... 7
4.1 Connect Software to Hardware .................... 7
4.2 System Menus .............................................. 8
4.3 System Level Controls ............................... 10
4.4 Automatic Polling........................................ 10
4.5 Device ID Information ................................ 11
4.6 Log Status and Control Information ........... 11
4.7 “ALS” Tab ................................................... 12
4.8 “Prox” Tab .................................................. 15
5 Resources .................................... 19
6 Revision Information ................... 20
7 Legal Information ........................ 21
Page 3
Document Feedback
TCS3701
Introduction
Demo Kit Manual • PUBLIC
UG000418 • v1-00 • 2019-Jan-11
21 │ 3
1 Introduction
No.
Item
Description
1
TCS3701 Daughter Card
PCB with TCS3701 sensor installed
2
EVM Controller Board
Used to communicate USB to I2C
3
USB Cable (A to Mini B)
Connects EVM controller to PC
4
Flash Drive
Includes application installer and documents
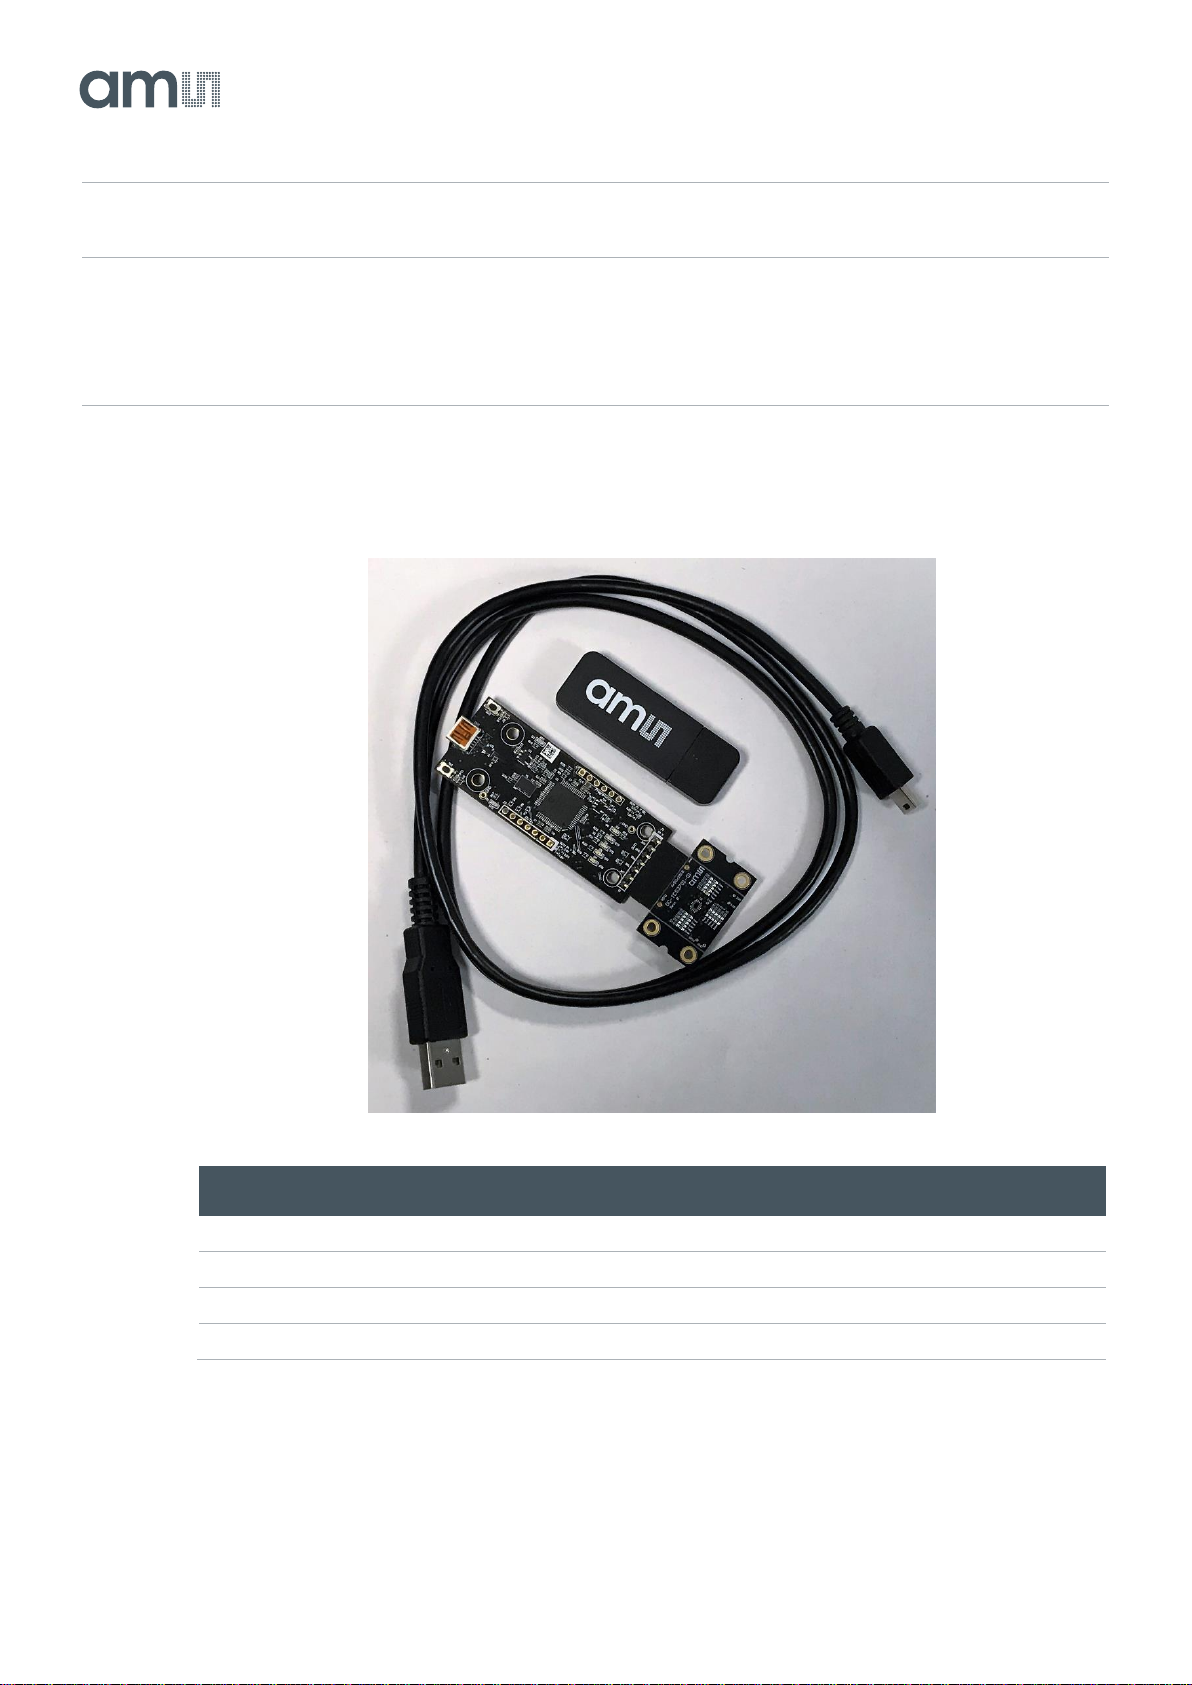
The TCS3701 evaluation kit comes with everything needed to evaluate the TCS3701 . The device
features ambient light and color (RGB) sensing in parallel with proximity detection.
1.1 Kit Content
Figure 1 :
Evaluation Kit Contents
Page 4

Document Feedback
TCS3701
Introduction
Demo Kit Manual • PUBLIC
UG000418 • v1-00 • 2019-Jan-11
21 │ 4
1.2 Ordering Information
Ordering Code
Description
TCS3701 EVM
TCS3701 ALS/Color and Proximity Sensor for Use Behind
OLED Displays Evaluation Kit
Page 5

Document Feedback
TCS3701
Getting Started
Demo Kit Manual • PUBLIC
UG000418 • v1-00 • 2019-Jan-11
21 │ 5
2 Getting Started
The software should be installed prior to connecting any hardware to the computer. Follow the
instructions found in the Quick Start Guide (QSG). This loads the required driver for the USB interface
and also the device’s graphical user interface (GUI).
The balance of this document identifies and describes the controls available on the GUI. In
combination with the TCS3701 datasheet, the QSG and application notes available on the ams
website, there should be enough information to allow evaluation of the TCS3701 device.
Page 6

Document Feedback
TCS3701
Hardware Description
Demo Kit Manual • PUBLIC
UG000418 • v1-00 • 2019-Jan-11
21 │ 6
3 Hardware Description
The hardware consists of the EVM Controller, the TCS3701 EVM daughter card, and a USB interface
cable. The EVM controller board provides power and I2C communication to the daughter card through
a seven pin connector. When the EVM controller is connected to the PC through USB, a green LED
on the board flashes once on power up to indicate the system is getting power.
For schematics, layout and BOM information, please see the documents included with the install
located in the TCS3701 EVM folder (All Programs -> ams -> TCS3701 EVM > Documents).
Figure 2 :
Evaluation Kit Hardware
Page 7
Document Feedback
TCS3701
Software Description
Demo Kit Manual • PUBLIC
UG000418 • v1-00 • 2019-Jan-11
21 │ 7
4 Software Description
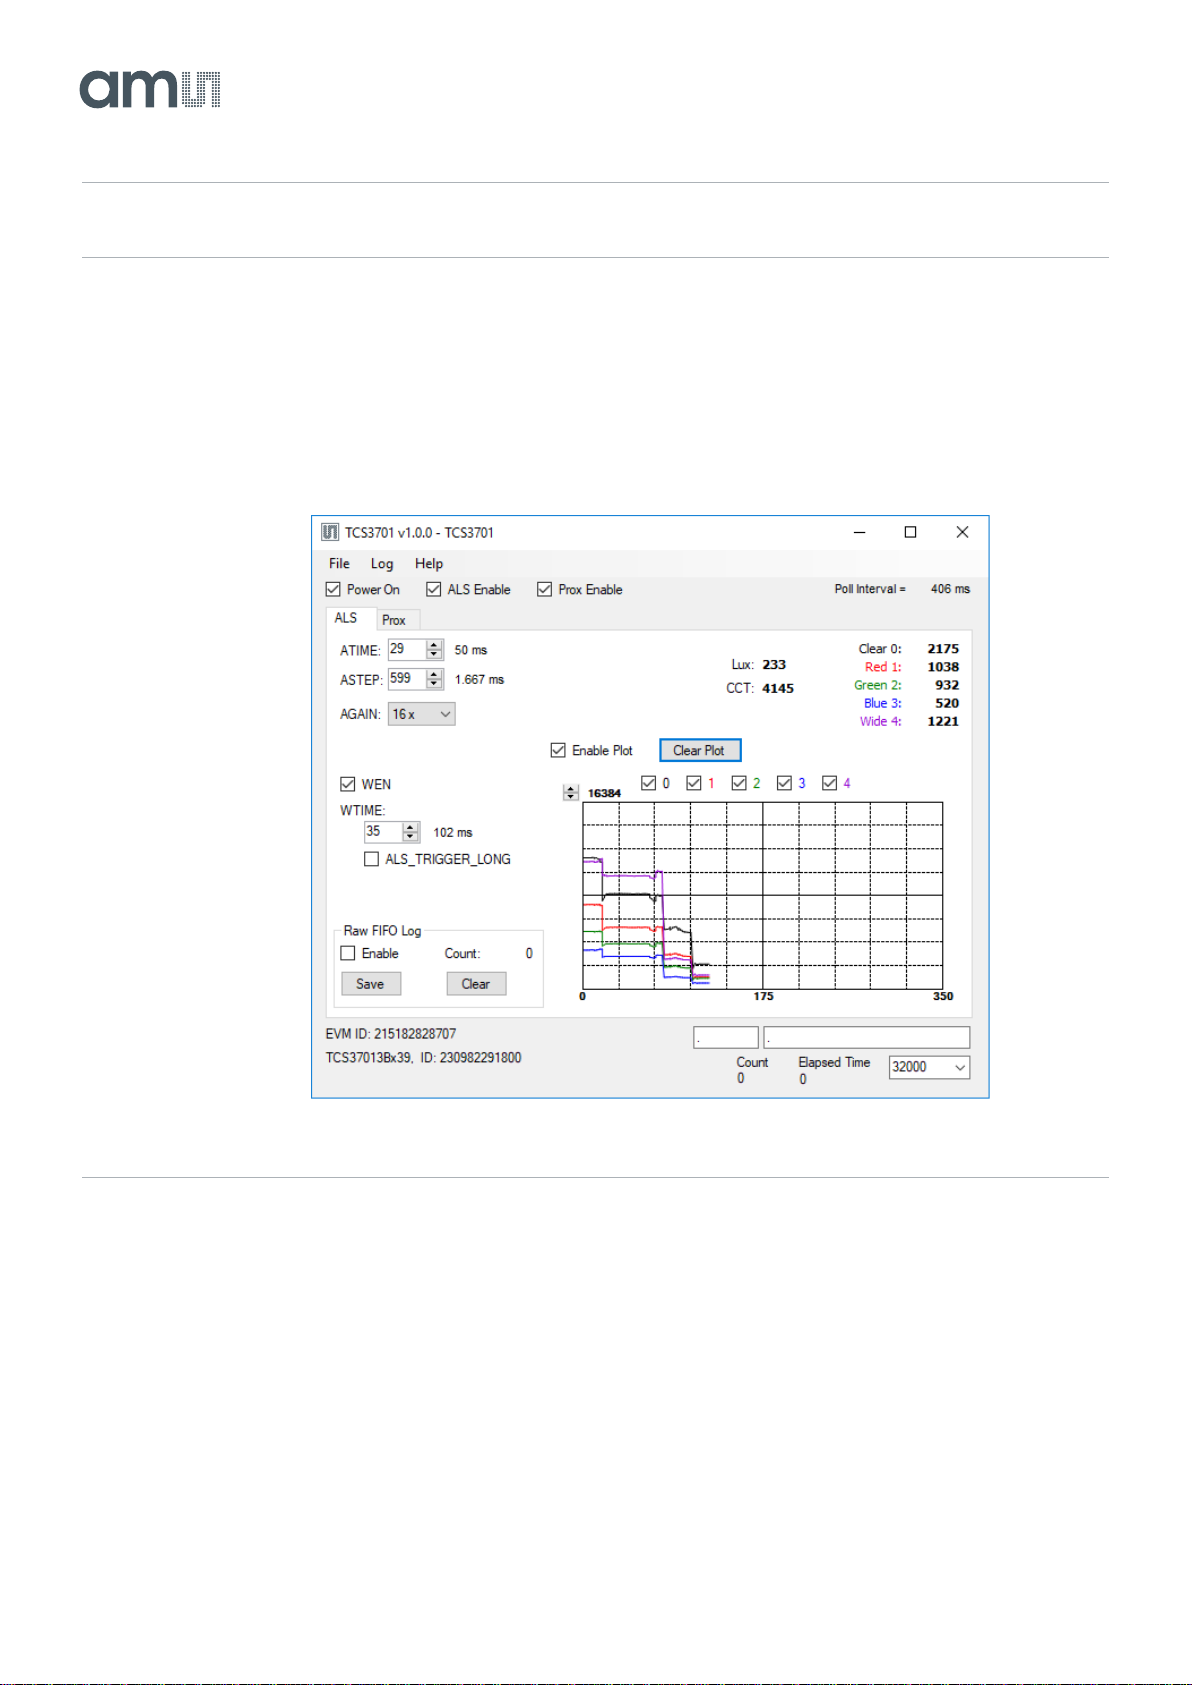
The main window (Figure 3) contains the system menus, system level controls, device information and
logging status. The ALS tab contains controls for the light sensing function. The Prox tab contains
settings for the proximity function. The application polls the ALS and proximity raw data continuously
and calculates the Lux, CCT, and prox standard deviation values.
Figure 3 :
Graphical User Interface (GUI) Main Window
4.1 Connect Software to Hardware
On startup, the software automatically connects to the hardware. On successful initialization, the
software displays a main window, containing controls pertinent to the connected device. If the software
detects an error, an error window appears. If “Device not found or is unsupported” appears, verify the
correct daughterboard is properly connected to the EVM controller board. If “Cannot connect to EVM
board” appears, verify the USB cable is connected. When the EVM controller board is connected to
the USB, a green LED on the board flashes once on power up to indicate the USB cable is connected
and providing power to the system.
Page 8

Document Feedback
TCS3701
Software Description
Demo Kit Manual • PUBLIC
UG000418 • v1-00 • 2019-Jan-11
21 │ 8
If the EVM board is disconnected from the USB bus while the program is running it displays an error
message and then terminates. Reconnect the EVM board and restart the program.
4.2 System Menus
At the top of the window there are pull-down menus labeled “File”, “Log”, and “Help”. The File menu
provides basic application-level control. The Log menu is used to control the logging function, and the
Help menu provides version and copyright information for the application.
4.2.1 File Menu
The File menu contains the following functions:
Figure 4 :
File Menu
The Reread Registers function forces the program to re-read all of the control registers from the
device and display them on the screen. This does not read the output data, because those registers
are continually read while the program is running.
The Lux Coefficients menu allows the user to Display, Load or Save the lux coefficients used to
calculate lux. See the ALS Lux Coefficients section for more details.
Click on the Exit command to close the main window and terminate the application. Any unsaved log
data is cleared from memory. The application can also be close by clicking the red “X” in the upper
right hand corner.
Page 9

Document Feedback
TCS3701
Software Description
Demo Kit Manual • PUBLIC
UG000418 • v1-00 • 2019-Jan-11
21 │ 9
4.2.2 Log Menu
The Log menu is used to control the logging function and to save the log data to a file. Log data is
accumulated in memory until it is discarded or written to a data file.
Figure 5 :
Log Menu
Click Start Logging to start the logging function. Each time the program polls the output information
from the device, it creates a new log entry showing the raw data values, the values of various control
registers, and the values entered by the user into the text fields near the bottom right corner of the
window.
Click Stop Logging to stop the logging function. Once logging is stopped, the data can be written to a
file, or the user can continue collecting additional data by clicking Start Logging again.
The Log a Single Entry command causes logging to start, collect one single entry, and immediately
stop again. This function is not available when logging is already running.
Click Clear Log to discard any data that has already been collected. If there is data in memory, which
has not been saved to disk, this function displays a prompt asking to verify it is OK to discard the data.
If the log is running when this function is clicked, the log continues running after the existing data is
discarded.
Click Save Log to save the collected log data to a csv file. This stops the logging function, if it is
active, and displays a file dialog box to specify where to store the logged data. The default file name
is described in the Log Status and Control Information section, but the file name may be changed if
desired.
4.2.3 Help Menu
The Help menu contains a single function: About.
Figure 6 :
Help Menu
Page 10

Document Feedback
TCS3701
Software Description
Demo Kit Manual • PUBLIC
UG000418 • v1-00 • 2019-Jan-11
21 │ 10
The About function displays a dialog box (Figure 7) showing the version and copyright information for
the application and library. Click the OK button to close this window and continue.
Figure 7 :
About Window
4.3 System Level Controls
Immediately below the top menu bar there are checkboxes used to control the system level functions
of the TCS3701 device.
The Power On checkbox controls the PON function of the TCS3701 . When this box is checked, the
power is on and the device can operate. When this box is unchecked, the power is off and the device
does not operate (The control registers can still be written, but the device does not function).
The ALS Enable checkbox controls the AEN function of the TCS3701. When this box is checked, the
device collects and report ALS data as programmed. When this box is unchecked, the ALS functions
do not operate.
The Prox Enable checkbox controls the PEN function of the TCS3701. Proximity detection is enabled
when this box is checked or disabled when unchecked.
4.4 Automatic Polling
The application automatically polls the TCS3701 raw data of ALS and Prox if enabled. The Poll
Interval displays the time between reads of the device.
Page 11

Document Feedback
TCS3701
Software Description
Demo Kit Manual • PUBLIC
UG000418 • v1-00 • 2019-Jan-11
21 │ 11
4.5 Device ID Information
The lower left corner of the window displays the ID number of the EVM Controller board, identifies the
device being used and displays the ID of the device.
4.6 Log Status and Control Information
The lower right corner of the window contains status information and controls for the logging function:
Figure 8 :
Logging Status
This section contains text boxes that are stored in the log file data and used to build the file name for
the log file. If the data in these fields are changed, the new values are stored with any new data
logged. The default log file name is based on these values at the time the log file is written. If nothing
is entered in these boxes they default to a period (“.”).
Sample default file name:
TCS3707_1-2-3_Log_HH_MM_SS.csv
From Application
From User Input
The Count value displayed is a count of the number of samples currently in the log buffer.
The Elapsed Time value indicates the elapsed time since data logging was started.
Page 12

Document Feedback
TCS3701
Software Description
Demo Kit Manual • PUBLIC
UG000418 • v1-00 • 2019-Jan-11
21 │ 12
4.7 “ALS” Tab
The main portion of the screen contains a tab labeled ALS. The controls in this tab are divided into 3
sections, each performing a separate function.
Figure 9 :
ALS Tab
4.7.1 ALS Controls
The left side of the ALS tab contains controls to set various ALS settings.
The ATIME control sets the steps of the ALS/color integration from 1 to 256.
The ASTEP control sets the integration time per step in increments of 2.78µs.
The AGAIN control is a pulldown menu which sets the analog gain of the ALS sensor. The values
available are 0.5x, 1x, 2x, 4x, 8x, 16x, 32x, 64x, 128x, 256x, 512x, and 1024x.
The WEN checkbox controls the ALS Wait feature. When this box is checked, the values for WTIME
and ALS_TRIGGER_LONG are used to determine the time between ALS cycles. When this box is
unchecked, there is no wait period between ALS cycles and the values of WTIME and
ALS_TRIGGER_LONG are ignored.
The WTIME control sets the time to wait between ALS cycles. WTIME can be adjusted in 2.778ms
steps.
The ALS_TRIGGER_LONG checkbox control sets the WTIME factor. When this box is checked, the
wait time between ALS cycles is multiplied by a factor of 16.
Page 13

Document Feedback
TCS3701
Software Description
Demo Kit Manual • PUBLIC
UG000418 • v1-00 • 2019-Jan-11
21 │ 13
The lower left corner of the ALS Tab contains a box titled Raw FIFO Log. Because of the operating
speed of the PC and polling rate of the GUI program, the GUI does not display every sample, since
the actual TCS3701 is operating faster than the GUI can display and log the data. This is not normally
an issue, since the operating environment is not rapidly changing. The Raw FIFO Log is a special
function that is designed to capture all of the ALS Data for Channels 0 and 1, without skipping any
data.
When this function is enabled, the TCS3701 will store channel 0 and 1 data into its internal FIFO.
When the GUI performs its normal data polling it will also extract all of the data in the FIFO and store it
in memory. You may then store this data to a special log file.
The Raw FIFO Log controls function as follows:
The Enable checkbox will activate the FIFO and collect the data into memory while polling.
The Count field displays the number of channel0/1 pairs that have been collected in memory.
The Save button will store the accumulated data from memory into a user-specified file. The data in
the log file is identified with a time stamp showing when the data was read from the FIFO and a zerobased sequential index number for each time stamp (since there may be several data samples each
time the FIFO is emptied.
The FIFO can hold up to 64 channel 0/1 data pairs. If the index numbers for any time stamp increment
all the way to 63, then there has likely been FIFO overload which means that data has been lost. This
situation should only occur when the ATIME/ASTEP settings are very so small that the TCS3701 is
producing several data values per millisecond.
4.7.2 ALS Lux Coefficients
The TCS3701 supplies information that is used to calculate Lux (unit of illumination). The Lux equation
for the TCS3701 uses a combination of data from the sensor and various coefficients to calculate the
Lux value. The software is pre-configured with coefficients for an open-air configuration. When the
sensor is placed behind glass, different coefficients should be loaded into the software to update the
Lux equation. The coefficients can be loaded or saved to an XML file using the File menu. To ensure
the proper XML format first save the current coefficients using File > Lux Coefficients > Save. Once
the file is saved locate the XML file created and edit with a text editor such as notepad to change the
coefficients. Then go to File > Lux Coefficients > Load and select the XML file that was updated.
The software can also automatically load new coefficients upon starting the GUI. To do this save the
XML file as TCS3701_luxeq.xml in the system documents directory (%USERPROFILE%\Documents,
also known as My Documents). When GUI is started, you will see a dialog appear with the new
coefficients displayed.
Page 14

Document Feedback
TCS3701
Software Description
Demo Kit Manual • PUBLIC
UG000418 • v1-00 • 2019-Jan-11
21 │ 14
If you are experiencing trouble loading new coefficients, this may indicate a problem with the file
format. The XML file must contain all the required Lux equation elements to be loaded. The format of
the file follows the standard XML format and is as follows:
<?xml version="1.0" encoding="utf-8"?>
<!-- Device:TCS3701 Saved:1/9/2019 2:10:00 PM -->
<luxeq>
<eq_values>
<coef name="DGF" value="801.65" />
<coef name="C_Coef" value="0.081" />
<coef name="R_Coef" value="-0.099" />
<coef name="G_Coef" value="0.309" />
<coef name="B_Coef" value="-0.247" />
<coef name="CT_Coef" value="5089" />
<coef name="CT_Offset" value="1635" />
</eq_values>
</luxeq>
4.7.3 ALS Output Data
The top right corner of the ALS tab displays the output data. This data is continuously polled. The
polling interval is shown above the tab.
● Clear 0 displays the Clear Channel data count.
● Red 1 displays the Red Channel data count.
● Green 2 displays the Green Channel data count or the IR Channel counts if IR Mux is checked.
● Blue 3 displays the Blue Channel data count.
● Wide 4 displays the Wideband Channel data count.
● Lux displays the calculated lux.
● CCT displays the calculated correlated color temperature.
4.7.4 ALS Data Plot
The remaining portion of the ALS tab is used to display a running plot of the collected ALS values and
calculated Lux. The last 350 values are collected and plotted on the graph. As additional values are
added, the old values will be deleted from the left side of the graph. To start the plotting function,
check the Enable Plot checkbox and select any of the 0, 1, 2, 3 or 4 checkboxes.
Page 15

Document Feedback
TCS3701
Software Description
Demo Kit Manual • PUBLIC
UG000418 • v1-00 • 2019-Jan-11
21 │ 15
Figure 10 :
ALS Data Plot
The scale of the Y-axis of the plot can be adjusted by clicking on the small up and down arrows at the
top left corner of the plot. The scale can be set to any power of 2 from 64 through 65536.
Click the Clear Plot button to discard the current data and continue plotting the new data. Note if the
Clear Plot button is clicked while the plot is disabled, the data is discarded, but the actual plot will not
be updated until the plot function is re-enabled.
4.8 “Prox” Tab
The main portion of the screen contains a tab labeled Prox. The controls on this tab control the
operation of the Proximity function of the TCS3701.
Page 16

Document Feedback
TCS3701
Software Description
Demo Kit Manual • PUBLIC
UG000418 • v1-00 • 2019-Jan-11
21 │ 16
Figure 11 :
Prox Tab
4.8.1 Prox Controls
The left side of the Prox tab contains controls to set various Prox settings.
The PPULSE controls the number of pulses used for each prox cycle. The number of pulses is the
PPULSE value plus 1 and is displayed immediately to the right of the box.
The PPULSE_LEN control sets the width of all IR LED pulses within the proximity cycle. Longer
pulses result in increased proximity range and typically result in less electrical noise generated in the
analog front end. This drop-down box works in conjunction with the 16x checkbox to select the actual
pulse length that is used The values that can be chosen are 4 µs / 64 µs, 8 µs / 128 µs,
16 µs / 256 µs and 32 µs / 512 µs.
When the 16 x box is checked, the longer pulse length values will be used. When the box is not
checked, the system will use the shorter pulse lengths.
The PGAIN control is a pulldown menu that lets you select the analog gain of the proximity IR sensor.
The values that can be chosen are 1x, 2x, 4x and 8x.
The PLDRIVE control sets the drive strength of the IR LED current. The values range 4mA to 258mA.
The PTIME control sets proximity sample time to (n + 1) × 2.778 ms, where n is the PTIME value.
The PINT control displays if an interrupt is generated. Clicking on this control will clear the interrupt. If
the interrupt condition still exists, it will occur again on the next cycle.
The PIHT control sets proximity interrupt high threshold value.
Page 17

Document Feedback
TCS3701
Software Description
Demo Kit Manual • PUBLIC
UG000418 • v1-00 • 2019-Jan-11
21 │ 17
Value
Interrupt generated when…
0
Every proximity cycle
1
Any proximity value outside of threshold range
2
2 consecutive proximity values out of range
3
3 consecutive proximity values out of range
… … 15
15 consecutive proximity values out of range
Information
The Offset Range Extension feature of the TCS3701 is known to cause the PDATA values to drift
over time. Use of this feature IS NOT recommended.
The PIHL control sets proximity interrupt low threshold value.
The PPERS control sets proximity interrupt persistence value. It defines a filter for the number of
consecutive occurrences that PDATA must remain outside the threshold range before a PINT interrupt
is generated. The frequency of generated interrupts is as follows:
The PBSLN control displays a proximity baseline, the minimum PDATA since last calibration.
Figure 12:
PPERS Interrupt Generation
The Enable control in the Offset range extension group box enables the coarse offset range when
checked.
The Steps control in the Offset range extension group box sets the offset range if the Adjust control
and Enable control is not set. It read out the offset range here which is set automatically when the
Adjust control and Enable control are checked.
The Adjust during cal control in the Offset range extension group box enables the coarse offset
range calibrated automatically if checked.
The POFFSET control shifts PDATA to remove crosstalk from the proximity data. The values range
from -255 to 255.
The Cal button triggers the sensor’s proximity offset calibration sequence. This function automatically
selects a POFFSET to remove crosstalk from PDATA.
The Auto Offset Adjust control, when checked, will decrease the proximity offset register when
proximity ADC measurement is zero. When this box is checked, manual changing of the POFFSET
control is disabled and The POFFSET value is read from the device on each update cycle.
Page 18

Document Feedback
TCS3701
Software Description
Demo Kit Manual • PUBLIC
UG000418 • v1-00 • 2019-Jan-11
21 │ 18
The Disable APC control disables the automatic pulse control (APC) function. When this function is
active, the range of the PDATA value is 0-1023.
The Dropdown control in the Prox Filter group box enables and disables the Proximity Filter. This
causes a running average of 1 (Disabled), 2, 4, or 8 samples to be reported in the PDATA register.
When the Downsample control in Prox Filter group box is checked, proximity results are checked for
interrupts and persistence, and the PDATA register is updated only every Nth time, based on the
setting of the dropdown.
4.8.2 Prox Data Plot
The remaining portion of the Prox tab is used to display a running plot of the collected PDATA values
and/or the calculated average of the most recent 32 PDATA values. The last 350 values are collected
and plotted on the graph. As additional values are added, the old values will be deleted from the left
side of the graph. To start the plotting function, check the Enable Plot checkbox.
Figure 13 :
Prox Plot Data
Check the Prox or ProxAvg boxes to select the value(s) to be displayed.
The scale of the Y-axis of the plot can be adjusted by clicking on the small up and down arrows at the
top left corner of the plot. The scale can be set to any power of 2 from 16 to 16384.
Click the Clear Plot button to discard the current data and continue plotting the new data. Note if the
Clear Plot button is clicked while the plot is disabled, the data is discarded, but the actual plot will not
be updated until the plot function is re-enabled.
Page 19

Document Feedback
TCS3701
Resources
Demo Kit Manual • PUBLIC
UG000418 • v1-00 • 2019-Jan-11
21 │ 19
5 Resources
For additional information regarding the TCS3701, please refer to the datasheet. For information
regarding the installation of the TCS3701 EVM host application software please refer to the TCS3701
EVM Quick Start Guide.
Designer’s Notebooks dealing with various aspects of optical measurement and optical measurement
applications are available.
Additional Resources:
● TCS3701 Datasheet
● TCS3701 EVM Quick Start Guide (QSG)
● TCS3701 EVM User’s Guide (this document)
● TCS3701 EVM Schematic Layout
● TCS3701 Optical Design Guide
● TCS3701 Proximity Design Guide
Page 20

Document Feedback
TCS3701
Revision Information
Demo Kit Manual • PUBLIC
UG000418 • v1-00 • 2019-Jan-11
21 │ 20
6 Revision Information
Changes from previous version to current revision v1-00
Page
Initial Release
All
● Page and figure numbers for the previous version may differ from page and figure numbers in the current revision.
● Correction of typographical errors is not explicitly mentioned.
Page 21

Document Feedback
TCS3701
Legal Information
Demo Kit Manual • PUBLIC
UG000418 • v1-00 • 2019-Jan-11
21 │ 21
7 Legal Information
Headquarters
ams AG
Tobelbader Strasse 30
8141 Premstaetten
Austria, Europe
Tel: +43 (0) 3136 500 0
Please visit our website at www.ams.com
Buy our products or get free samples online at www.ams.com/Products
Technical Support is available at www.ams.com/Technical-Support
Provide feedback about this document at www.ams.com/Document-Feedback
For sales offices, distributors and representatives go to www.ams.com/Contact
For further information and requests, e-mail us at ams_sales@ams.com
Copyrights & Disclaimer
Copyright ams AG, Tobelbader Strasse 30, 8141 Premstaetten, Austria-Europe. Trademarks Registered. All rights reserved.
The material herein may not be reproduced, adapted, merged, translated, stored, or used without the prior written consent of the
copyright owner.
Demo Kits, Evaluation Kits and Reference Designs are provided to recipient on an “as is” basis for demonstration and
evaluation purposes only and are not considered to be finished end-products intended and fit for general consumer use,
commercial applications and applications with special requirements such as but not limited to medical equipment or automotive
applications. Demo Kits, Evaluation Kits and Reference Designs have not been tested for compliance with electromagnetic
compatibility (EMC) standards and directives, unless otherwise specified. Demo Kits, Evaluation Kits and Reference Designs
shall be used by qualified personnel only.
ams AG reserves the right to change functionality and price of Demo Kits, Evaluation Kits and Reference Designs at any time
and without notice.
Any express or implied warranties, including, but not limited to the implied warranties of merchantability and fitness for a
particular purpose are disclaimed. Any claims and demands and any direct, indirect, incidental, special, exemplary or
consequential damages arising from the inadequacy of the provided Demo Kits, Evaluation Kits and Reference Designs or
incurred losses of any kind (e.g. loss of use, data or profits or business interruption however caused) as a consequence of their
use are excluded.
ams AG shall not be liable to recipient or any third party for any damages, including but not limited to personal injury, property
damage, loss of profits, loss of use, interruption of business or indirect, special, incidental or consequential damages, of any
kind, in connection with or arising out of the furnishing, performance or use of the technical data herein. No obligation or liability
to recipient or any third party shall arise or flow out of ams AG rendering of technical or other services.
RoHS Compliant & ams Green Statement
RoHS Compliant: The term RoHS compliant means that ams AG products fully comply with current RoHS directives. Our
semiconductor products do not contain any chemicals for all 6 substance categories, including the requirement that lead not
exceed 0.1% by weight in homogeneous materials. Where designed to be soldered at high temperatures, RoHS compliant
products are suitable for use in specified lead-free processes.
ams Green (RoHS compliant and no Sb/Br): ams Green defines that in addition to RoHS compliance, our products are free of
Bromine (Br) and Antimony (Sb) based flame retardants (Br or Sb do not exceed 0.1% by weight in homogeneous material).
Important Information: The information provided in this statement represents ams AG knowledge and belief as of the date that
it is provided. ams AG bases its knowledge and belief on information provided by third parties, and makes no representation or
warranty as to the accuracy of such information. Efforts are underway to better integrate information from third parties. ams AG
has taken and continues to take reasonable steps to provide representative and accurate information but may not have
conducted destructive testing or chemical analysis on incoming materials and chemicals. ams AG and ams AG suppliers
consider certain information to be proprietary, and thus CAS numbers and other limited information may not be available for
release.
 Loading...