

GENERAL ELECTROMAGNETIC MOVEMENT SENSOR
[GEMS]
USER’S MANUAL________
Revision B Version 2

1 TABLE OF CONTENTS
1 TABLE OF CONTENTS .........................................................................................2
2 INTRODUCTION ....................................................................................................4
2.1 GENERAL DESCRIPTION .......................................................................................5
2.2 SENSOR UNIT.......................................................................................................5
2.3 CHARGER.............................................................................................................8
2.4 ANTENNAE...........................................................................................................9
2.5 PARTS LIST ........................................................................................................10
2.6 GETTING STARTED.............................................................................................11
3 SPECIFICATIONS................................................................................................12
4 PERFORMANCE MEASUREMENT ..................................................................13
4.1 TEST SETUP........................................................................................................13
4.2 PERFORMANCE TESTS .......................................................................................13
4.2.1 Highpass Filter Distortion Compensation................................................15
4.2.2 Measurement sheet ...................................................................................16
4.3 CALCULATING THE SNR AND THE MINIMUM DETECTABLE AMPLITUDE...........17
5 ACQUIRING GEMS DATA.................................................................................19
5.1 NATIONAL INSTRUMENTS’ LABVIEW VIS ..........................................................19
5.1.1 Installation of the software..............................................................................19
5.1.2 Main and configuration screens ......................................................................20
5.1.3 Real time data display .....................................................................................22
5.1.4 4 channel recording.........................................................................................23
5.2 RECORDING DATA FROM THE GLOTTAL AREA ..................................................24
5.3 RECORDING DATA FROM THE CHEEK AREA ........................................................26
5.4 OTHER LOCATIONS ............................................................................................28
6 FILTER DISTORTIONS DUE TO HP FILTER................................................29
7 SAFETY & COMPLIANCE.................................................................................31
Aliph GEMS User Manual Page 2 of 2

8 FAQ..........................................................................................................................32
9 TROUBLESHOOTING.........................................................................................35
9.1 GEMS SIGNAL..................................................................................................35
9.2 LABVIEW PROGRAMS.........................................................................................36
9.3 TECHNICAL SUPPORT .........................................................................................36
10 CONTACT INFORMATION............................................................................38
Aliph GEMS User Manual Page 3 of 3

2 INTRODUCTION
Thank you for choosing an Aliph sensor. We hope this sensor will serve you well for
many years and become the basis for many discoveries.
The General Electromagnetic Movement Sensor (GEMS) was developed at Aliph for the
purpose of detecting vibratory motion of human tissue. The present sensor is the third
iteration of a design first constructed in 1999. It was designed to be mass-producible and
easily constructed using standard parts.
The sensor is an extremely sensitive phase-modulated quadrature motion detector that
accurately determines the motion vs. time of one or more moving objects in its field of
view. If several moving objects are present and detectable, the GEMS signal will
represent a combination of their motions. Thus the output of the GEMS is a onedimensional voltage that represents a combination of three-dimensional velocities.
Therefore, care must be taken when interpreting the GEMS signal as it is not always clear
what object is responsible for the observed signal.
This manual is intended to inform a scientifically minded user how to use the GEMS to
record vibratory signals associated with human speech. It is not necessary for the user to
have a background in electromagnetics (EM) or radiofrequency (RF) to use the sensor
effectively. Although the sensor can be used to detect any type of motion anywhere on
the body, we will restrict ourselves to motion caused by voiced speech in the sub-glottal
and cheek/jaw areas. As we will see, the subglottal region can yield information on the
excitation function of human speech and the cheek/jaw area may contain phonetic
information about the produced speech. The user is encouraged to capture signals from
other parts of the body, but we will restrict this manual to the two above as they return
the most reliable and repeatable signals.
Any comments on the sensor or this manual are welcome and contact information is
included in chapter 10. Additional information on the sensor and its interaction with the
Aliph GEMS User Manual Page 4 of 4

human body can be found in Gregory C. Burnett’s doctoral thesis, available at UMI
(http://www.umi.com/hp/Products/Dissertations.html), thesis # 9925723, or online at
www.aliph.com/Burnett_thesis.
2.1 General Description
The GEMS consists of three major subsections – the sensor, the antenna, and the battery
and its charger. The sensor body is installed in an empty battery charger shell, and the
rechargeable battery simply slides into a receptacle at the bottom of the sensor body. On
the opposite side is a belt clip that can be used to attach the sensor to a belt or similar
object. The antenna plugs into the top of the sensor body with the supplied reverse
polarity SMA cable. Due to FCC regulations, only the antennae supplied by Aliph can be
used with the sensor. If you wish to use other types of antennas, you should contact
Aliph. Aliph is not responsible for any liabilities relating to user safety or FCC
compliance that may arise from connecting antennas or other components not supplied
and/or certified by Aliph.
2.2 Sensor Unit
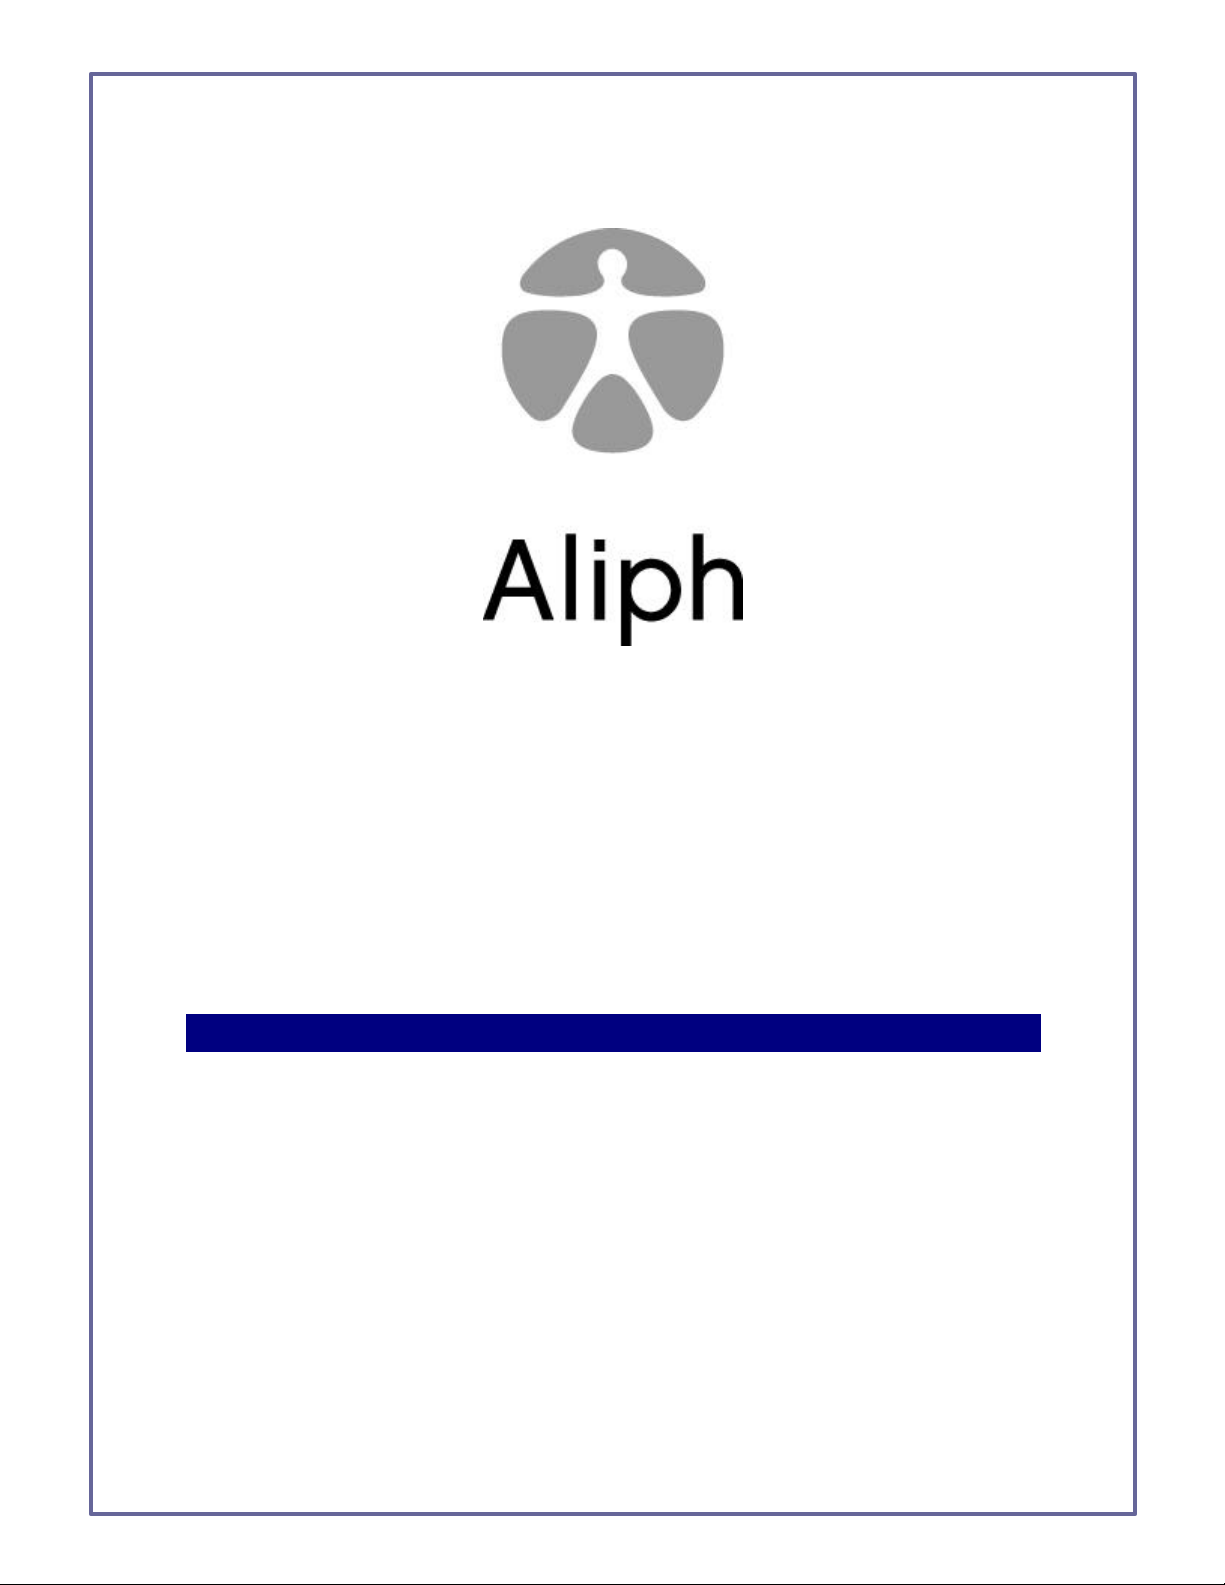
The sensor body is shown in Figures 2.1, 2.2, and 2.3 and the charger in Figure 2.4. On
the bottom front of the sensor body, the power switch is flanked by two indicator lights.
The red power indicator is lit when power is applied, while the battery condition light
varies:
Indicator light: Steady Green Blinking Green Steady Orange
Battery state: Battery Good Battery Charging Battery Low
Underneath the lights and power switch are the filter selector switches, illustrated in
Figure 2.2. The switches can be manipulated to select both the highpass 3-dB point (20
or 100 Hz) and the lowpass 3-dB point (500, 2000, or 8000 Hz). The use of the filters
Aliph GEMS User Manual Page 5 of 5
Filter
Power LED
Power
Output
Switch
Gain
Potentiometer
Battery Bay
Selection
Battery LED
DC Power Connector
Figure 2.1. Isometric view of the bottom of the sensor body
can introduce phase distortion (see Chapter 6), so it is recommended that if low distortion
is desired to use a highpass frequency of 20 Hz and a lowpass of 8000 Hz.
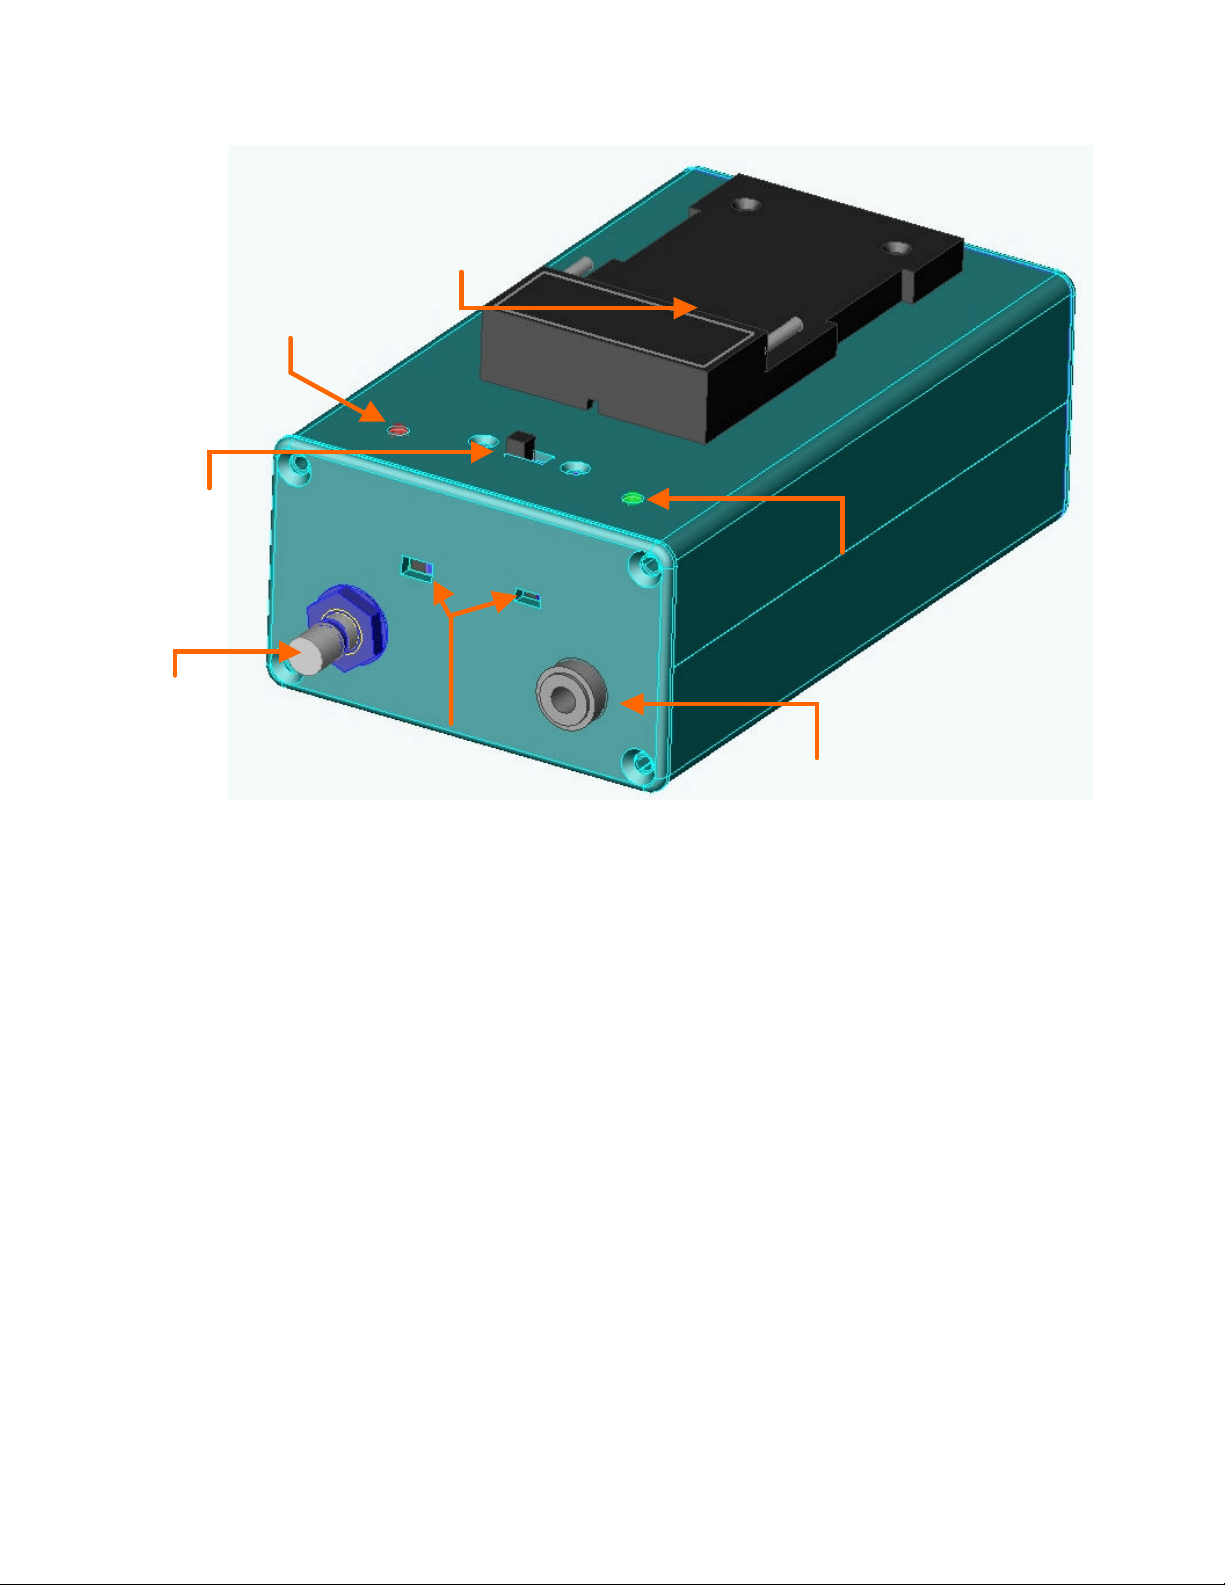
On the sides near the power switch there is a 3.5 mm power connector that connects to
the charger, and a potentiometer that varies the gain by approximately 20 dB. The power
connector is used in concert with the charger to charge the battery on the sensor, which
can be used while the battery is charging. The charger itself can be used to charge an
extra battery. HOWEVER, UNDER NO CIRCUMSTANCES SHOULD A
BATTERY BE USED ON THE CHARGER AND THE SENSOR AT THE SAME
TIME WHEN BOTH UNITS ARE CONNECTED. IN ADDITION, THERE MUST
BE A BATTERY ON THE CHARGER OR ON THE SENSOR WHEN THE
Aliph GEMS User Manual Page 6 of 6
SENSOR IS OPERATING. Failure to follow these guidelines can damage the sensor,
SMA
Belt Clip
the charging components, and the battery.
The gain potentiometer should be used to control the signal size so that the size of the
signal corresponds well to the A/D recording device. For example, if the A/D is set to
acquire signals from +- 1 Volt, the gain should be set during normal voiced speech to
approximately +- 0.5 V. This allows for larger transients to be captured while using most
Auxiliary
Connector
of the resolution of the A/D. Setting the gain to be too large can result in clipping of the
(not used)
signal, where the level of the signal no longer corresponds to the amplitude of motion.
This distorts the signal and should always be avoided by choosing a lower gain.
On the bottom of the sensor are the antenna connectors and the stereo output connector.
Stereo Audio Output
The stereo output contains the demodulated in-phase (I) and quadrature (90 degrees out
of phase, or Q) signals. These signals represent the motion of the target and it is
recommended that the largest energy signal of the two be used, as it is normally the best
(least distorted) representation of the motion. The smaller the signal, the more distortion
can be present. In any situation, however, one of the modulations will always be nearly
distortion -free due to the use of quadrature modulation.
Antenna
(under)
Figure 2.2. Isometric view of the top of the sensor body.
The sensor has two antenna connectors to allow a future bi-static (different transmit and
receive antennae) mode. However, this is disabled in the current version and only a
single antenna connection is used (mono-static configuration). Due to FCC requirements,
it is not possible to use antennae not supplied or approved by Aliph. Only the supplied
antennae are to be used with the supplied reverse-polarity cables. If there is a specific
antenna that you wish to use with the Aliph sensor, please contact us.
Aliph GEMS User Manual Page 7 of 7
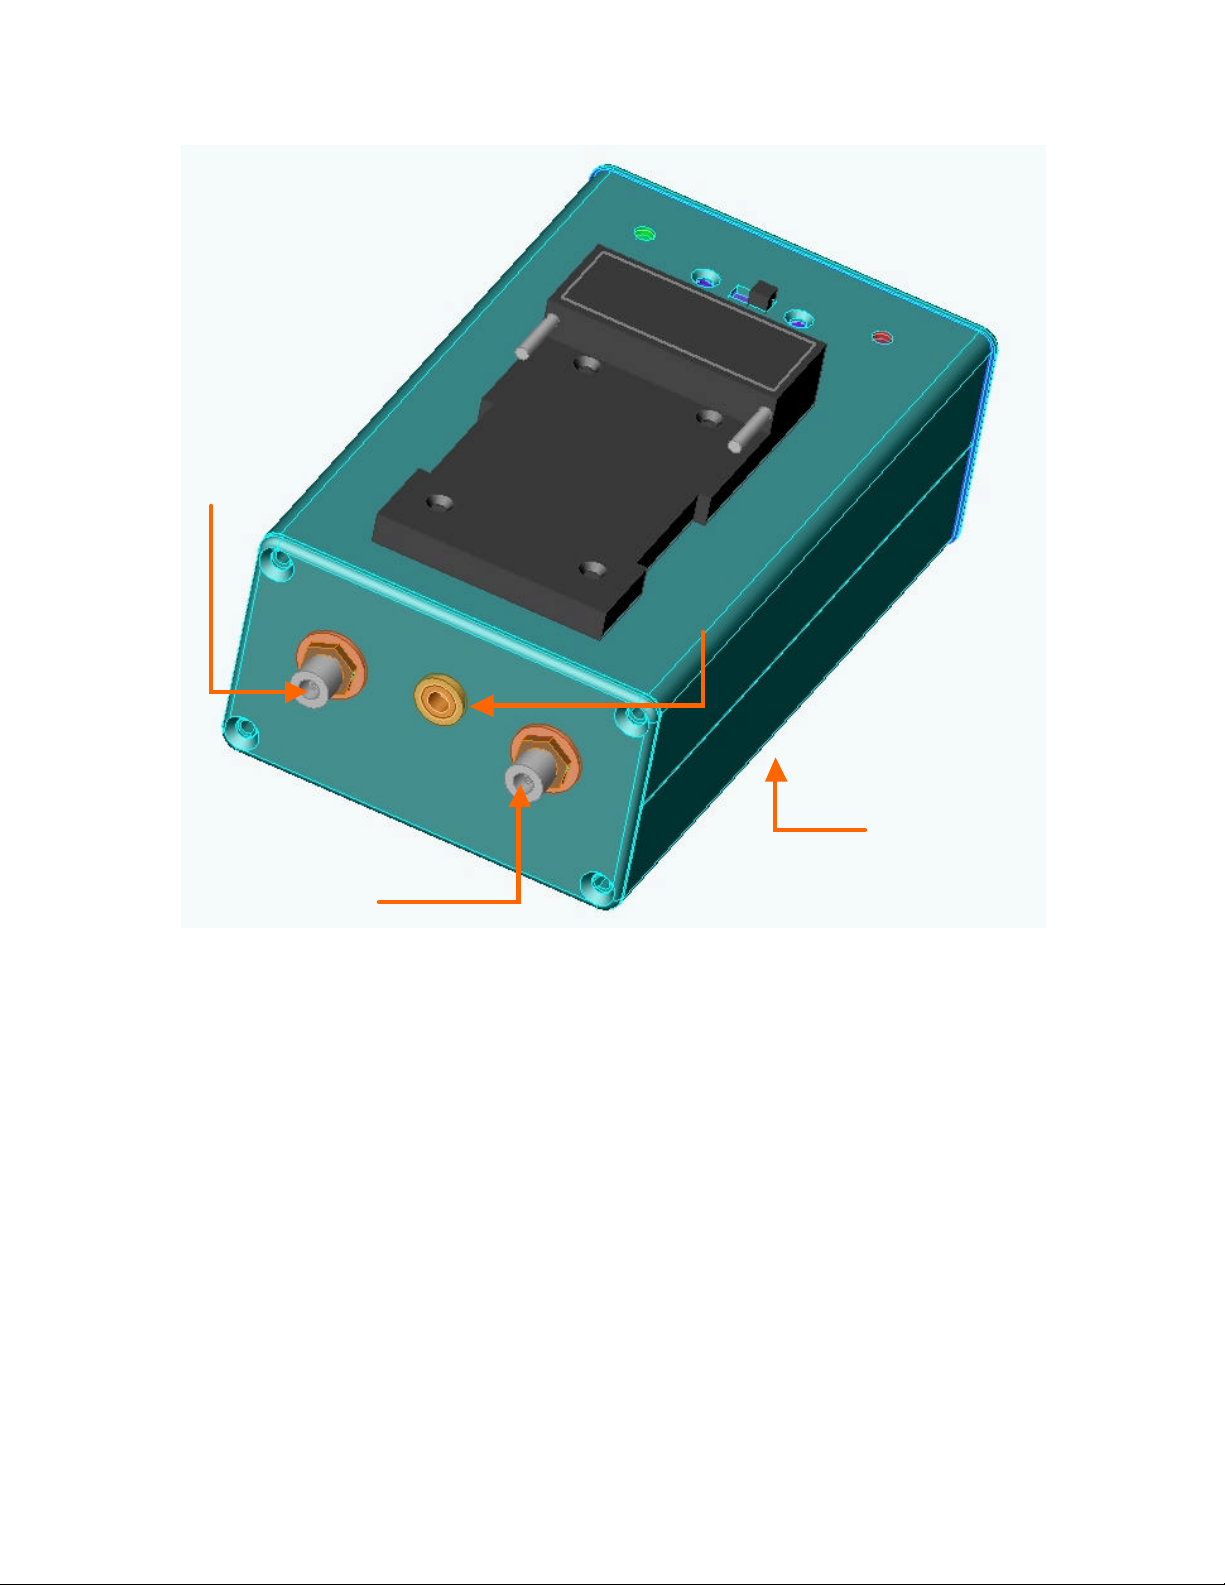
Charging State LED
Battery Bay
Power LED
To Sensor
To AC Power
Figure 2.3. Isometric view of the battery charger. Make sure that at all times there is only one battery on
either the charger or the sensor. The use of no or two batteries may damage the sensor electronics.
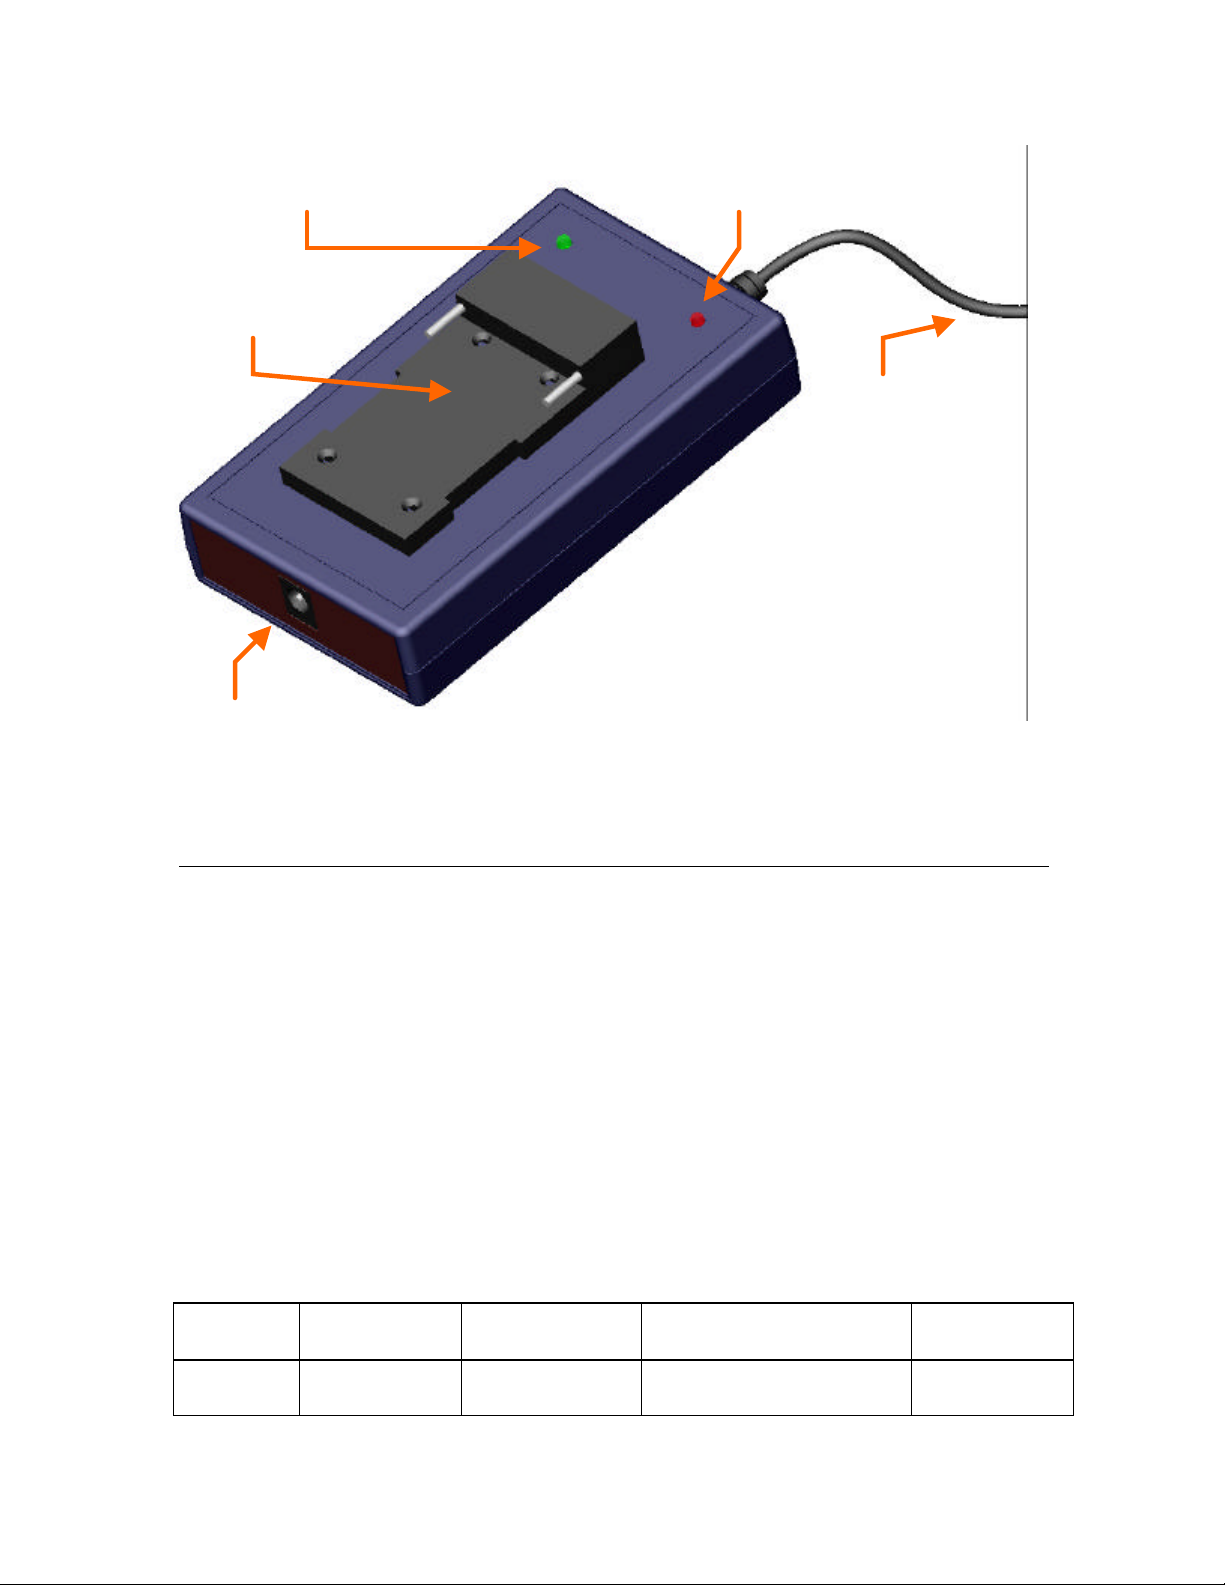
2.3 Charger
The charger will charge a battery in its battery bay OR a battery in the sensor’s battery
bay, but not both at the same time. TRYING TO CHARGE TWO BATTERIES
WITH THE SAME CHARGER WILL RESULT IN DAMAGE TO THE GEMS
ELECTRONICS. The sensor can also be used while its battery is being charged but
should not be used with an AC power supply if the battery is not connected – this will
introduce noise into the output signals and may damage GEMS components. The charger
has two LEDs – one red LED to indicate that the AC power is connected, and red/green
LED to indicate charging state. The changing state is indicated as follows:
LED: Steady Red Red with slow
Red with rapid flash Steady Green
f lash
Charging
state:
Aliph GEMS User Manual Page 8 of 8
Normal
charging
Minor fault,
slow charging
Major fault, follow
reactivation procedure
Recharging
complete

“Slow flash” means 1 flash every 5 to 10 seconds, “rapid flash” is 1 flash every second.
A fault may be introduced in the battery if it is deeply discharged. To reactivate a battery
with a major fault (deeply discharged or shorted) follow this procedure:
Place the battery in the charger and power up the charger. Allow the battery to remain in
the charger for at least 10 minutes with the Charge Mode LED flashing quickly. After
more than 10 minutes, remove the battery and disconnect the charger from AC power.
Re-insert the battery into the charger and power the charger unit. If this procedure does
not reactivate the battery (i.e.. the charging state LED is still flashing quickly) the battery
has been destroyed and a new battery must be procured.
2.4 Antennae
The antennae supplied with the sensor are specially designed to work well next to human
tissue. Normally, antennae are designed to function efficiently in air, which has a relative
dielectric constant near unity and very low conductivity. However, at 2.4 GHz, the body
has a relatively high dielectric constant (ranges from ~30-50) and significant conductivity
(~2 S/m). Operation of the antenna near the body therefore affects the efficiency and
resonant frequencies of the antenna and this must be taken into account during the design
and testing phase.
The net effect of the operation of the antenna near the body is an overall lowering of the
resonant frequencies of the antenna. For example, for one type of antenna the resonant
frequency was observed to drop from 4.2 GHz (in air) to 2.7 GHz (near the body). The
amount of drop is determined by several factors, including the radiating pattern of the
antenna, the substrate of the antenna, and any materials present between the antenna and
the body. It has been observed that even very thin materials can shift the resonance
frequency 50 MHz or more, depending on the material and thickness.
Aliph GEMS User Manual Page 9 of 9

Therefore the antennae can be “tuned” to operate more efficiently by placing ordinary
cellophane (“Scotch”) tape on the surface of the antennae. This works best with the
rectangular micropatch antennae, and will be discussed further in Chapter 5.
There are three rectangular patch antennae and one spiral patch antenna supplied with the
sensor. The rectangular antennae are recommended for the neck region, and the spiral for
the cheek, although they will work in both places. Insight into the selection and tuning of
the antennae will also be covered in Chapter 5.
2.5 Parts List
The parts that were included with your Aliph GEMS kit should include the following:
Quantity Description
1 General Electromagnetic Movement Sensor (GEMS) Unit
4 Micropatch antennae (3 rectangular, 1 spiral)
2 SMA cables (30cm and 90cm)
1 3.5 mm Stereo to RCA Cable
2 RCA to BNC connectors
1 Battery charger with AC power cable, sensor power cable
1 Li -Ion rechargeable battery
1 CD with Data Acquisition software and support materials
1 User’s manual
1 GEMS/accelerometer measurement sheet
Please take a moment to check the contents of your kit and contact us if there are any
discrepancies.
Aliph GEMS User Manual Page 10 of 10

Additional batteries and chargers are available and can be ordered directly from Aliph.
Only the antennae supplied by Aliph have been approved with by the FCC as legal to use
with this device. If you would like to use an antenna of your own design with the GEMS,
contact Aliph and we will make arrangements for the necessary manufacturing and
testing procedures.
2.6 Getting Started
Step 1: Slide the battery provided into the battery bay on the sensor body
Step 2: Attach the power cable between the charger and sensor
Step 3: Plug in the charger’s AC power supply
Step 4: Firmly attach one SMA cable to the operating antenna port
Step 5: Firmly attach 1 antenna (e.g. 9p6+7_80) to the SMA cable
Step 6: Make sure the bandpass filter switches are in the desired positions
Step 7: Insert the stereo 3.5 mm cable between the sensor and a DAQ device
Step 8: Switch on the sensor unit
Step 9: Apply the antenna to your trachea (and speak) to observe signals
Step 10: Adjust the audio output gain using the sensor gain adjustment knob
Note: Please read instructions on proper battery charging routines, antenna uses, and
DAQ guidelines.
Aliph GEMS User Manual Page 11 of 11

3 SPECIFICATIONS
The GEMS sensor is a continuous wave phase modulated radiofrequency device that
operates at a frequency of precisely 2.4 GHz. It uses a monostatic antenna configuration
that uses reverse polarity SMA connectors. The maximum theoretical RF power output is
1 milliwatt while the effective power will depend on the efficiency of the antenna. It
returns a voltage signal limited to +- 2.5 V that indicates the amplitude of motion of a
periodic or quasi-periodic motion of a target in its field of view. It is capable of
measuring very small (micron order) vibrations from 20 Hz to 8 kHz both inside and
outside the body. It operates on a rechargeable 7.4 V Li-Ion battery and draws
approximately 170 mA of power.
GEMS
Maximum RF Power Output (Antenna Port) 0 dBm (1 mW)
Audio Signal Output ~5.0 V max peak -to-peak
Output Signal Operating Bandwidth 20 Hz - 8000 Hz
Maximum Sensitivity In Air (at 10dB SNR) ~5 µm
AC Power Supply 110V - 120V AC
Input Voltage 6V - 9V DC (Regulated)
Operating Temperature (recommended) 0° to 35° C
Dimensions (approx) 115 x 60 x 32 mm
Weight 200 g
Battery
Battery Capacity 1180 mAh
Battery Maximum Output Voltage DC 8.4 V
Low Voltage Threshold 6 V
Operating Temperature 0° to 40° C
Dimensions (approx) 38 x 20 x 56 mm
Weight 76 g
Aliph GEMS User Manual Page 12 of 12

4 PERFORMANCE MEASUREMENTS
The performance criteria for this type of device are defined by its operating
characteristics and ability to directly represent the vibrational state of its targets. In this
section we will explore the criteria used to determine the performance of the sensor.
The GEMS is, simply put, a vibration analysis device. It can detect very small quasiperiodic or periodic motion of targets with very little distortion in one or both of the
quadrature-related channels. As the GEMS is a vibration detector, it is reasonable to use
a NIST-traceable shaker table to check the accuracy of the GEMS.
4.1 Test Setup
We chose for our testing the Gilchrist Technology Model 4000 portable shaker table.
Information on this table can be found at http://www.gilchristtechnology.com . The target
was a 4 inch diameter aluminum disk, manufactured to be under the 500 gram weight
limit for the shaker table. A calibrated accelerometer was included as part of the table,
and the frequency and amplitude of the shaker signal can be varied from 20 Hz to 10 kHz
with a maximum displacement of 0.2 mm peak-to-peak at 100 Hz. The accelerometer
output was available and was compared to the sensor outputs.
For the tests, a 2.45 GHz antenna (one that is efficient in air) was connected to the GEMS
of interest and placed in a test stand above the shaker head and lowered to just above the
shaker table. Although the antenna is usually isotropic, normally the only vibrations in
the correct frequency range are those of the shaker head, so interference was not a
problem.
4.2 Performance Tests
The signals from the GEMS and the accelerometer signal were recorded using the
supplied Aliph GEMS DAQ software and an analog to digital data acquisition system
recording at 20 kHz. The distance measurements began at 0.8 cm (~?/16) and were
Aliph GEMS User Manual Page 13 of 13

increased by ? /16 twice. At these distances the first measurement is taken with the I
()(
)
()(
)
channel near its maximum, the second when the I and Q channels are about the same size,
and the third when the Q channel is at its maximum. This allows us to test all of the
signals at their strongest and weakest points. There was occasionally increased noise in
the signals due to the proximity and perfect reflectivity of the metal target which was not
observed when the antenna was placed on the skin. This caused the phase measurements
to vary somewhat, but this should not be a problem in normal use.
The frequency of the shaker was set at 75 and 150 Hz, with a few seconds between
recordings to allow the head to stabilize. These frequencies are slightly lower than
normal male and female pitch, respectively, and were chosen mainly because above these
frequencies the amplitude of the shaker head diminished rapidly to the point where
accurate (+-5 degrees) phase measurements could not be made. Two different shaker
amplitudes at each frequency were recorded and compared to the relative change in
magnitude of the largest GEMS signal to test the linearity of the GEMS. After
processing (see below), the accelerometer and GEMS signals were compared to ensure
that the phase and frequency information was correct.
To compare the position measured by the sensor to that derived from the accelerometer,
we can either differentiate the sensor signal twice to get acceleration or integrate the
accelerometer signal twice to get position. Or, since the accelerometer signal is
composed of only a single frequency:
φ+π= ft2sinAta
0
the actual position signal will also be a single frequency
0
When we differentiate this twice with respect to time, we get
φ+π= ft2sinXtx
Aliph GEMS User Manual Page 14 of 14

()()(
)
′′
(
)
Setting the amplitude factors equal, we see we may derive the position signal from the
accelerometer signal quite simply:
−
( )
= ft2sin
tx
( )
2
0
A
0
( )
2
π
f2
φ+ππ−==
ft2sinX)f2(tatx
φ+π
.
This requires only a sign change (180 degree phase shift) and division by
not, however, ready to compare the signals directly – we still need to account for the
phase distortion of the inherent GEMS 20 Hz HP filter.
2
f2π . We are
4.2.1 Highpass Filter Distortion Compensation
The GEMS has a built-in HP filter with a 3-dB point of about 20 Hz, and several other
selectable filters to allow the user to examine several frequencies of interest. These
filters change not only the magnitude but the phase of the signal that passes through
them, distorting the resulting filtered signal. Therefore if we want to compare the
accelerometer and GEMS signals directly, we can either attempt to remove the filter
effects from the GEMS data, or we can filter the accelerometer signal with models of the
GEMS filters that have similar magnitude and phase responses. The second method is
much simpler and is what we will employ.
The measured response of the 20 Hz filter is shown in Chapter 6 in Figures 6.1 and 6.2.
It is a relatively simple 2nd order analog highpass filter coupled with a delay of about 150
µsec. The only real distortion is caused by the highpass filter below about 300 Hz.
Above that, the phase is linear. To compensate for this phase distortion in our tests the
accelerometer data was filtered with a model constructed using Matlab. This
compen sation assures that both the accelerometer and sensor signals have been distorted
in the same manner, making a meaningful comparison possible. Once the differentiation
and highpass filter distortion compensation operations were performed on the
accelerometer signal, the result was compared directly with the sensor signals.
Aliph GEMS User Manual Page 15 of 15

4.2.2 Measurement sheet
After the data at each frequency, antenna-to-target distance, and amplitude was recorded
it was processed to determine the following:
1. Dominant GEMS channel (dG)
2. Frequency of vibration as recorded by the accelerometer (Hz)
a. Calculated using a PSD, 0.1 Hz resolution
3. Frequency of vibration as recorded by the dG (Hz). This should be exactly the
same as that recorded by the accelerometer.
a. Calculated using a PSD, 0.1 Hz resolution
4. Strength of the fundamental signal compared to the 1st harmonic (dB). This is an
indication of distortion and 30 dB or greater is preferred.
5. Signal to noise ratio (SNR, dB). This should be 30 dB or more at every distance
and frequency. The GEMS normally is around 40-50 dB but can go as high as 90
dB.
6. Calculated shaker amplitude (mm, peak-peak). This is the amplitude calculated
from the accelerometer signal given the accelerometer frequency of vibration
from step 2. This did not always match up with the amplitude set on the shaker,
as its accuracy can vary +-3%.
7. GEMS RMS-derived amplitude (V, p-p). The RMS amplitude of the GEMS was
calculated in Volts and then transformed to peak-peak.
8. Minimum amplitude detectable (µm, p-p). See below for details. A
measurement independent of target amplitude that describes the sensitivity of the
GEMS. 1-10 µm is good, 0.1-1.0 µm is great, and < 0.1 µm is superlative.
9. Phase difference between the filter-compensated accelerometer signal and the dG
signal (degrees). We would like to see differences of less than +-20 degrees,
although there are some cases where we observed slightly more than that, usually
at the lower frequencies. For the most part, though, even a difference of 20
degrees is negligible and should not affect the performance of the device on the
skin. The reasons that there is some variation in the phase are:
a. Slight differences in the components that make up the 20 Hz HP filter and
the 8000 Hz LP
Aliph GEMS User Manual Page 16 of 16

b. Noise due to the large reflected signal of the metal disk
(
)
095.0
()(
)
c. Poor model fit
10. Linear amplitude error (percent). This is calculated at the same distance and
frequency but for different target amplitudes using the information from Steps 6
and 7. If the change in amplitude is perfectly linear, the error should be 0%. We
are looking for errors less than 10%. Possible reasons for error are slight
differences in distances, rounding errors, and low amplitude resolution. For
example, we can only measure the shaker amplitude reliably to 3 significant
figures (i.e. 0.095 and 0.191 mm). We can also only measure voltage to 2
significant figures (i.e. 0.80 and 1.58 V).
58.1
error =⋅
=
An error in the GEMS measurements of only +-0.02 V can increase the error to
5.4%, and +- 0.04 V can lead to an error of 8.9%. Therefore, considering the
accuracy of our system, +-10% is reasonable.
191.0
095.0
191.0
80.0
⋅−
%8.1100
80.0
⋅
4.3 Calculating SNR & Minimum Detectable Amplitude
At each test frequency the SNR was calculated using a background noise file (no shaker
motion) as the noise level. The result was then extrapolated back to what the signal level
would be at 10 dB SNR (amplitude of the signal would be 3.16 times the amplitude of the
noise). This allows us to determine the minimum amplitude that can be reliably detected
at that frequency. Of course, this test is in air, so any extrapolation to vibrational
amplitudes in tissue will have to account for conductive losses, imperfect reflections, and
scattering losses. The minimum amplitude for which a 10 dB SNR is possible is
calculated by
VN16.3
=
where So is the observed accelerometer amplitude in mm, N1 is the noise amplitude in
volts, and S1 is the signal amplitude in Volts. We may use either peak-to-peak or RMS
voltages in the amplitude calculations, as we are dealing with ratios of amplitudes. For
Aliph GEMS User Manual Page 17 of 17
)mm(Sampmin_
0
( )
1
1
VS

example, if the observed voltage for an amplitude of 0.1 mm was 2 Volts, and the
(
)
2
background noise amplitude was 20 mV, then the initial SNR would be
2000
20
=
dB40
=
0
log20SNR
and the smallest detectable signal with an SNR of 10 dB would be
mm1.0ampmin_ ===
02.016.3
mµ3mm003.0
which corresponds to a voltage of 60 mV, three times that of the noise level of 20 mV.
This measurement is a convenient way to view the SNR independent of target amplitude.
Aliph GEMS User Manual Page 18 of 18

5 ACQUIRING GEMS DATA
The GEMS is a useful device, allowing us to sense motion inside the human body.
However, it requires some practice and finesse to operate correctly and robustly. The
sensor itself is usually not at fault, it is normally the combination of antenna placement
and cable movement that give new users the most problems. The cables will contribute
noise to the system if they are moved or vibrated during data acquisition. If your subject
is to move during the experiment, make sure that the cables are secured and not allowed
to move freely. This will minimize the noise in the GEMS signal.
5.1 National Instruments’ Labview VIs
To assist users in visualizing and recording GEMS data, stand-alone and regular Labview
virtual instrument files are included as part of the GEMS package. These files can
display the GEMS data plus two more data channels and record them in a binary or text
file. To use the software, data acquisition hardware and software from National
Instruments (the E series at http://sine.ni.com/apps/we/nioc.vp?cid=1038&lang=US is
recommended, it uses NI-DAQ software) must be installed and correctly configured. To
test your configuration after installation, try the “Test Panel” option using the NI
Measurement and Automation Explorer.
This software is provided as a courtesy by Aliph and has only been tested on National
Instruments hardware running under Windows 2000 and Windows 98.
5.1.1 Installation of the software
The installation routine for the executable software is on the CD. Simply place the CD in
your CD drive. If the setup screen does not automatically start, open the CD and select
“setup”. The executable files will be copied into a directory of your choice, and a
directory called “Aliph GEMS DAQ” will be created on your StartàPrograms menu.
Clicking on “Aliph GEMS DAQ” will launch the program. Remember that you must
have the NI hardware and software installed before you can used the Aliph software.
Aliph GEMS User Manual Page 19 of 19

As a courtesy to those that may wish to customize the VIs, the source code is included in
the \source directory. To use these files, you must have at least the Professional version
of Labview 6.1 installed on your computer. Otherwise you may use the stand-alone
applications described above.
5.1.2 Main and configuration screens
In Figure 5.1, the main menu of the Labview program is shown. Before data can be
recorded or displayed, the hardware must be configured. This is why some of the buttons
are disabled (grayed out) – because in this screen the hardware has not yet been
configured. To configure the hardware for the first time, press “Configure DAQ” to open
Figure 5.1. Main screen of the Aliph data acquisition package.
Aliph GEMS User Manual Page 20 of 20

the hardware configuration screen.
If you have saved a configuration
default or other file, you can press
“Load config default” or “Load
config file” to save time. You
must load a config file or manually
enter a configuration every time
the program executes.
The configuration screen is shown
in Figure 5.2. Here, you can load
the default setting (Load default),
load any configuration file
(Load…), save the current settings
as the default setting (Save as
default), save the current settings
to a file (Save…), do nothing and
leave the program (Cancel), or use
the current settings for the current
DAQ session without saving them
Figure 5.2. The hardware configuration screen.
to a file (OK). The configuration
files can be named anything; they are stored in text format. A help menu explains all the
settings available.
Hitting “OK” or “Cancel” will return the user to the main menu. If a valid configuration
has been chosen, the previously unavailable options will be enabled. In the future, you
may load the default file or any saved configuration file from the main screen and skip
the manual configuration entry.
Aliph GEMS User Manual Page 21 of 21

Figure 5.3. Real time configuration screen.
5.1.3 Real time data display
Two options are given for real -time data display – a 1 channel display and a 4 channel
display. They work in the same way, so we’ll go through just the 1 channel, shown in
Figure 5.3. First, select a channel to display and a time scale to display it with. Values
from 5 msec to 1000 msec may be chosen, and that amount of data will be displayed at
once. This value also controls the refresh rate. The scan rate in Hz is displayed below
the time scale, and is set in the hardware configuration screen (see Figure 5.2). The scan
rate is the entered scan rate divided by the decimation factor.
Press “Start” and the screen will display the channel selected. If the time scale is grayed
out, it cannot be changed when data is being acquired. When the display is no longer
needed, press “Stop” and then the data that was being displayed is available to view. Use
the palette on the right side of the plot to zoom in and out of the data. When finished,
Aliph GEMS User Manual Page 22 of 22

press “Start” again to restart the data display, or press “Return” and the window will
close and you will be back at the main program (Figure 5.1).
The 4 channel real time display system works the same way, except that all four channels
(from 0-3) are displayed simultaneously. The sampling rate is again set in the
configuration screen.
5.1.4 4 channel recording
The final algorithm offers 4 channels of data recording in either binary or text format.
All four data streams are stored in the same file. The binary is recommended due to its
smaller size, and a Matlab file is included (see the readme.txt file on the CD) that will
translate the .bin file to a Matlab matrix. The interface is shown in Figure 5.4. To begin,
enter the filename of the file you want to save the data in and the amount of time you
want to record (a setting of zero here will record until you press “Stop”). The type of file
recorded will be determined by the “Data file format” drop down menu. If you have
specified a file suffix (like .bin) in your filename, this will override the selection on the
drop down menu. If you specify a three letter extension in your filename but it is not .bin
or .txt, the program will return an error and terminate. The simplest thing to do is to just
specify a filename without suffix and choose the type of file you want to save from the
drop-down menu.
Now press “Start”, and the “Recording” light will come on and the program will begin to
record the data. You can stop the data acquisition at any time by pressing “Stop”. When
the data acquisition is complete, the “Recording” light will go out and the data will be
displayed. Displaying the data can take a while of the file is long. You will now be able
to examine the data in greater detail using the graph palettes on the right side of the
graphs. When you are satisfied with the data, you may take more data by pressing “Start”
again (be sure to change the filename first of you want to save the data!) or you can
return to the main menu by hitting “Return”.
Aliph GEMS User Manual Page 23 of 23

Figure 5.4. 4 Channel Data recording screen.
5.2 Recording Data from the Glottal Area
The glottis is the area between the vocal folds, and has been the subject of most GEMS
research until now (see Chapter 2). It was observed that the rear subglottal tracheal wall
responded readily to the pressure pulses caused by the operation of the vocal folds and
glottis and the largest GEMS signal was obtained directly under the laryngeal notch
(Adam’s apple). This signal represents the motion of the rear wall of the subglottal
trachea, and can be used to determine when the voiced excitation pulses occur. The
Aliph GEMS User Manual Page 24 of 24

subglottal signal can be picked up further
below the laryngeal notch, but the
sharpness of the pulses decreases due to
damping by the tracheal tissue. The
trachea also recedes into the neck as it
approaches the chest, decreasing the size of
the signal due to conductive loss. A similar
signal may be picked up at the side of the
neck, although it is usually smaller and less
robust (that is, more sensitive to antenna
placement and contact).
For maximum signal strength and
robustness, the antenna should be placed
flat on the skin just below the laryngeal
notch (see Figure 5.5). The long dimension
of the antenna should be placed in the
Figure 5.5. Approximate placement of the
antenna for subglottal tracheal detection.
horizontal position for the best signal. The
resulting signal (using the filters at 20 Hz and 8 kHz) should look similar to the data in
Figure 5.6, although it will vary with user and type of voicing. Remember to use the
modulation that has the most energy, and that the signal may be upside down (multiplied
by –1). It is essential that there be no air gaps between the antenna face and the skin.
This will result in an inappropriate shift of the resonance frequency of the antenna and
signal strength will be poor. The antenna may be affixed to the neck using Velcro
fasteners or masking tape. The user should start with the 9p6+8_80 antenna and test the
return with the GEMS gain as high as it will go. If a sizeable signal is returned, that
antenna should be used. If not, proceed to the 9p6+7_80 and 9p6+6_80 antennae. One
of the three should work with almost any subject. It is imperative during these tests that
the antenna face be flush with the skin. It may be difficult to achieve this with women,
children, or anyone with a small trachea. Once a good sized signal is observed, tune the
gain to restrict the signal so that clipping is not observed.
Aliph GEMS User Manual Page 25 of 25

Sample GEMS signal
800
600
400
200
0
-200
-400
Magnitude
-600
-800
-1000
-1200
0 50 100 150 200 250 300
time (samples at 10 kHz)
Figure 5.6. Example of a GEMS signal sampled at 10 kHz.
If you are not getting a good signal using the above technique, you should move the
antenna up and down from the original position while speech is being produced. This
will allow you to find an area that works well with your subject. It is very easy to get a
signal from most male subjects due to the larger and more prominent trachea, but
sometimes can be difficult for those with smaller and more recessed tracheas. If all else
fails, you can try to tune the 9p6+6_80 antenna using pieces of cellophane (“Scotch”
brand) tape. Place one piece of tape over the antenna and see if that improves the
amplitude of the signal. Keep adding pieces until the amplitude decreases again, and then
use the number of layers of tape that resulted in the largest signal. Add no more than
about 5-6 pieces of tape – after that, the effects are minimal.
5.3 Recording data from the cheek area
In this area, there is a lot more leeway in terms of antenna location, but the amplitude of
vibration of the cheek is far less than the trachea, and it can be a lot more difficult to get a
good signal. The recommended area for cheek antenna placement is shown in Figure 5.7,
Aliph GEMS User Manual Page 26 of 26
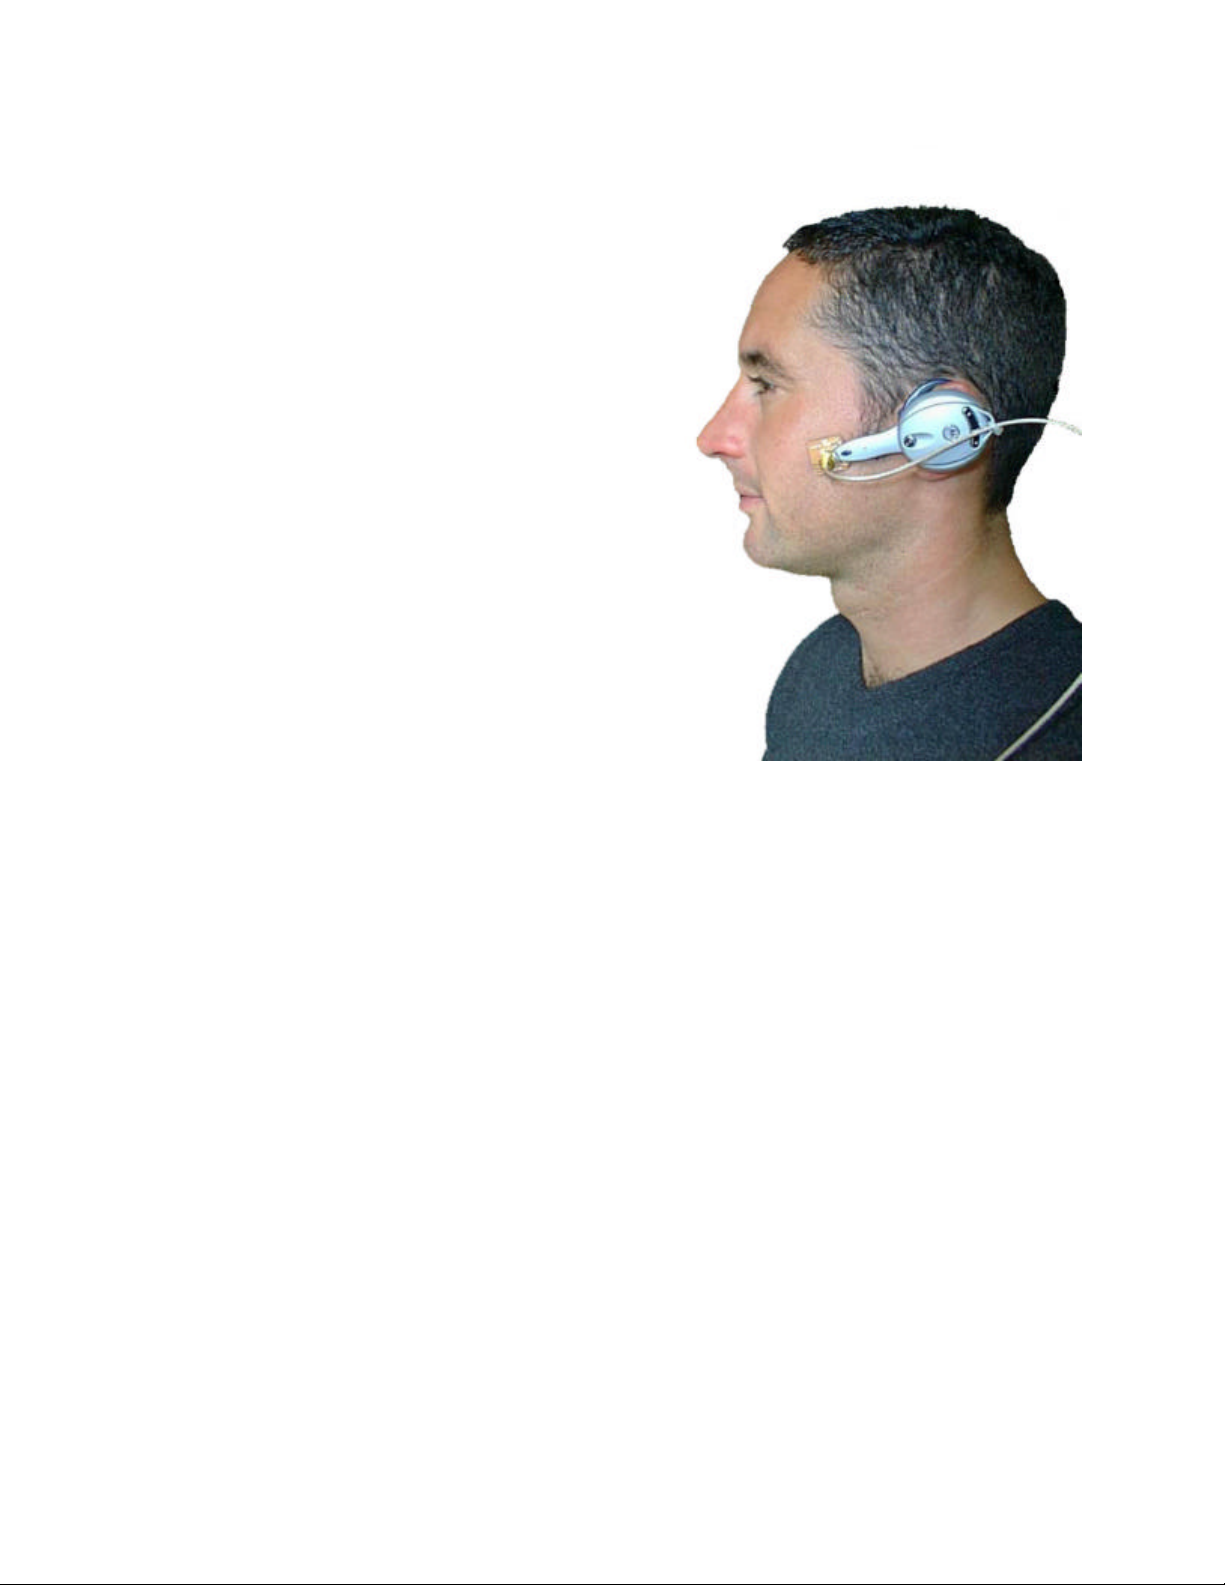
although signals may be detected in a variety
of areas around the cheek, jaw, and nose.
Again, the antenna may be affixed using
masking tape, but the headset configuration
shown in Figure 5.7 is more comfortable,
although it may require more care to ensure
that the antenna is flat against the skin. The
spiral patch antenna should be used for the
cheek area, as it has the potential of a much
better match against the skin. However, this
sensitivity means that it may not work for all
people, and it may be necessary to tune the
antenna using cellophane tape as described
above. Even then, there is a chance that it
will not match well and it may be necessary
to use a rectangular patch antenna that,
although less sensitive, matches better with a
Figure 5.7. One method of obtaining GEMS
cheek data.
wider range of people. Again,
experimentation is the key here – try adjusting the position of the antenna while the user
says “mm” – this should result in the largest signal. Be sure that the antenna is flat
against the skin, but don’t press it too firmly into the cheek.
Keep in mind that the data from the cheek area reflects directly on the speech being
produced, so both the shape and amplitude of the wave will vary with the speech being
produced. For example, an “ee” results in a large signal, as there is a significant amount
of energy reflected at the mouth back into the oral cavity. In contrast, an “ah” results in a
small signal, as there is a more efficient coupling to the air at the mouth and little energy
is left over to vibrate the cheek. You may need maximum gain to observe the signals at
the cheek, as they are normally much smaller than the glottal signals.
Aliph GEMS User Manual Page 27 of 27

5.4 Other Locations
The GEMS is sensitive enough to pick up vibrations from a number of places on the
body, including the back and sides of the neck and the chin and jaw. Vibrations from
different areas can contain different information – for example, the glottal area signal
reflects the pressure pulses that become the speech, and the cheek area contains more
information about the sound being produced. Experiment with the sensor and the
antennae, and you may be surprised at what you find!
Aliph GEMS User Manual Page 28 of 28

6 FILTER DIS TORTIONS DUE TO HP FILTER
The GEMS electronics includes a simple analog HP filter to reduce low frequency noise.
This filter has a 3-dB point at approximately 20 Hz. The measured response of the filter
is shown in Figures 6.1 and 6.2. It is clear that there is some non-linear phase distortion
of the filtered signal for frequencies below about 300 Hz. Above that frequency, the only
phase response is a linear phase, which translates directly to a simple delay. In this case,
the delay is about 150 µsec. This delay does not in any way affect the shape of the
GEMS signal, and therefore does not need to be removed. For those desiring absolute
accuracy for signals with components greater than 300 Hz, simply advance the GEMS
signal by 150 µsec. However, remember when comparing the GEMS and acoustic
signals that the GEMS signals are traveling at the speed of light and the acoustic signals
at the speed of sound. A pressure pulse produced at the glottis will have to travel about
20 cm to get to a close-talk microphone near the lips, and at 330 m/s that will take about
600 µsec. For all intents and purposes, the GEMS signals are generated and reflected
instantly. Adding in the 150 µsec delay means that for proper alignment of the acoustic
and GEMS information, the GEMS should be delayed approximately 450 µsec. In
practice this is rarely an issue.
Removing the nonlinear distortion of the 20 Hz filter for the frequencies of interest (~40
Hz and up) can be done, but will not be covered in this manual. An example is given in
Burnett’s thesis (see Chapter 2), but will not be needed for the vast majority of
applications, as the phase distortion is insignificant for most frequencies and does not in
any way affect the frequency content of the signal. The 100 Hz HPF option, however,
can cause significant phase distortion and should not be used if it is not needed. Once
again, it is recommended to select the 20 Hz and 8 kHz filter options for minimum phase
distortion.
If you feel that you must remove the phase distortion from the 20 Hz filter, contact us and
we will supply you with a Matlab program that will be able to remove a significant
Aliph GEMS User Manual Page 29 of 29

amount of the distortion. Perfect removal is not likely due to normal variation in the
0 100 200 300 400 500
Frequency (Hz)
0 2000 4000 6000 8000 10000
Frequency (Hz)
filter response.
Magnitude (dB)
-60 -40 -20 0 20
Figure 6.1. Magnitude response of the intrinsic 20 Hz filter of the
GEMS. The frequency range here is from DC to 500 Hz. The
spike near DC is not real, but rather an inaccuracy of the
instrument.
Phase (degrees)
-200 -100 0 100 200
Figure 6.2. Phase response of the intrinsic 20 Hz GEMS filter. The
rapid change at 3347 Hz is simply the phase wrapping around to
stay between +-180 degrees. This phase response has the
characteristics of both an IIR and FIR filter. The frequency range is
from DC to 10000 Hz.
Aliph GEMS User Manual Page 30 of 30

The user is cautioned that changes made to this equipment that are
not authorized by Aliph may void the user's authority to operate this
equipment.
7 SAFETY & COMPLIANCE
Your GEMS device is a transmitter and a receiver. In operation, it transmits less than 1
mW (0 dBm) of power in the frequency range of 2400-2500 MHz. Your GEMS device is
designed to operate in compliance with the RF exposure guidelines and limits set by the
national authorities (FCC) and international health agencies when used as instructed in
this manual.
The GEMS complies with Part 15 of FCC regulations concerning the use of
intentional and unintentional radiators in the 2.4GHz ISM band.
For additional information concerning interference or safety issues, please refer to the
“Aliph GEMS Safety and Compliance Report”, which will be provided to GEMS owners
upon request.
Aliph GEMS User Manual Page 31 of 31

8 FAQ
Does the GEMS “image” the vocal folds?
No. The GEMS is a vibration detector and simply returns a signal that is proportional to
the movement of a target in the area. If there are several vibrating surfaces, the resulting
signal will be a nonlinear combination of all of the movements of the surfaces. Since the
GEMS only detects signals above about 20 Hz or so and the skin depth (depth in tissue
that the EM wave is reduced in energy to 1/e) is only a few cm, normally there will only
be one major contributor to the signal. However, care must be taken when interpreting
the signal.
Is the GEMS safe to use?
The GEMS is a radiofrequency (RF) device that emits electromagnetic (EM) energy at a
frequency of 2.4 GHz, the same frequency many cordless phones and wireless headsets
use. However, the GEMS emits less than 1/1000 of the power of a mobile phone and
complies completely with all US and foreign standards for continuous exposure to EM
energy at this frequency. Future versions of the GEMS will emit even less energy.
Does the antenna have to be touching the body to get a signal?
No. The use of normal, in-air antenna held off the skin can return a useable signal.
However, for this study the emphasis has been for on-body antenna to reduce the power
output as much as possible and to make the signal as robust and repeatable as possible.
Does the GEMS directly sense the motion of the vocal folds?
No. The vocal folds are too small and their surfaces poorly positioned to reflect EM
energy. Their action, though, causes pulses of air to be formed and propagate both above
and below the glottis (the airspace between the vocal folds). These pulses cause the
surrounding tissues to pulse, and this motion is easily detectable.
Aliph GEMS User Manual Page 32 of 32

How do I go from tracheal motion to glottal pulse location?
Once the tracheal wall position has been detected by the GEMS, the pulses may be
located as the places where the position changes rapidly. For most people, the closure of
the folds has a much larger effect on the signal than the opening, but normally both may
be detected. For more information see Gregory C. Burnett’s thesis:
http://www.aliph.com/Burnett_thesis
We don’t have a data acquisition (DAQ) PC card, we only have a DAT tape player (or
similar). Can we still use the Aliph Labview programs to collect data?
Aliph only supports PC-based data acquisition. We recommend any of the E-Series
National Instruments DAQ boards (such as the PCI-6023E or the PCI-6034E) as well as
their line of BNC based connector boards such as the BNC-2110.
What sampling frequency should we use to capture the GEMS data?
Although the GEMS allows signals as high as 8 kHz to be detected, the response of the
tissue to the speech pulses is poor above 2-3 kHz and it is unlikely that any significant
energy will be in the GEMS above 4-5 kHz. Still, to ensure that aliasing is not present,
we have found that recording the data at 24 or 32 kHz and then digitally filtering and
decimating to 8 kHz has been quite successful in capturing the GEMS signal without
aliasing. In a pinch, 16 kHz will do, but is not recommended.
Does the GEMS sensor work on all people?
We have been able to get a useful subglottal signal from all of our subjects. This does
not mean that all people will return one, but the vast majority of people should yield a
useable subglottal signal. However, the cheek signal is not as reliable. If the subject is a
soft speaker or if the tissue of the cheek is incompatible with our antenna, a useful cheek
signal is sometimes not available. We are working on a more sensitive version of the
GEMS that will ensure a cheek signal for all subjects.
Aliph GEMS User Manual Page 33 of 33

Does the subglottal GEMS signal contain phonetic information?
No; or at the most, very little. The subglottal pulses detected by the GEMS do not
contain significant phonetic information. Since the phoneme is generated by the
rearrangem ent of vocal articulators in the supraglottal region (including the larynx,
pharynx, and oral cavity) and the reflection of acoustic energy at every change in crosssectional area in the vocal tract, there is undoubtedly some phonetically shaped air
pressu re leakage from the supra- to the subglottal region. However, it will be quite small,
as the glottis (the air space between the vocal folds) is small compared to the vocal folds
and most energy will be reflected back to the vocal tract. In addition, the large pulses of
air that excite the vocal tract will be many times stronger than the small amount of
leakage past the folds. That is not to say that with concentrated effort some phonetic
information may not be obtained.
What about the cheek/jaw information? Is that phonetically related?
Yes. The vibrations of the cheek and jaw are caused by oral cavity air pressure
fluctuations, which are the result of the shaping of the glottal pulses by the vocal tract.
Depending on the phoneme, the vibrations should have different frequency content and
amplitude. The frequency content comes from the frequency content of the phoneme
being produced, and the amplitude variations are related to how well the phoneme being
produced couples with the air. An “ee”, for example, does not couple well with air and
there is ample energy inside the oral cavity to vibrate the cheek and jaw. An “ah”, on the
other hand, couples very well with air and there is little oral cavity energy left to vibrate
the cheek and jaw.
Aliph GEMS User Manual Page 34 of 34

9 TROUBLESHOOTING
9.1 GEMS Signal
The GEMS is a relatively simple device to use, especially in the subglottal area. Try that
area first, as that is the area where the signal is the largest and most robust. If there is still
no signal from the subglottal area, try the following troubleshooting guide:
• Check the gain potentiometer to make sure it is all the way up (full clockwise).
• Ensure that the battery is charged or charging through the supplied AC supply.
• Make sure there is only 1 battery in the charger/sensor system. The system
cannot charge two batteries at once and the use of two batteries may damage the
sensor. If connected to the AC power supply, ensure that there is a battery in the
GEMS unit.
• Check the antenna connection to make sure it is firmly connected to the sensor.
• If using a rectangular patch antenna, make sure the long edge of the patch is
perpendicular to the trachea.
• Try a different antenna and make sure that it is flat against the skin.
If a signal is returned from the trachea, but not the cheek, try the following:
• Use the spiral antenna. It has the potential to match better with the cheek.
• Vary the position of the spiral antenna while you make the sound “mm” with your
mouth closed. This should result in the largest signal amplitude possible.
• Vary the amount of pressure used to press the antenna to the cheek. Vary it from
lightly touching to firmly touching.
• Try to match the skin better using cellophane tape, as described in Chapter 5.
Aliph GEMS User Manual Page 35 of 35

9.2 Labview Programs
Since we are not supplying any data acquisition (DAQ) hardware with the GEMS,
support for DAQ hardware issues is not included in your package, but may be available
on a pay-per-time basis. Support for problems you may be having with the Labview
software is included, BUT ONLY FOR SOFTWARE THAT HAS NOT BEEN
MODIFIED. If you modify the included Labview VIs for your own use, as is allowed,
you are responsible for the results. Don’t come crying to us.
Before calling us with software questions, you must make sure your hardware system is
working correctly by using the Test Panel in the Measurement and Automation Explorer,
part of the NI-DAQ software series (available with any hardware purchase or download
from www.ni.com ). Input a signal from a synthesizer or frequency generator on the
channels that you want to use and check to make sure that they are being correctly
received by the DAQ card. Common mistakes include connecting the incoming signals
to the wrong DAQ inputs and not ensuring tight cable connections. The Aliph software
uses channels 0, 1, 2, and 3 to input data. It is not necessary to use all of these channels,
but the signals you want to record should be connected to one of the above four channels.
If you are detecting these known signals on the correct channels, then the next step is to
see if the GEMS is producing a signal. You can use an oscilloscope or input to a
computer soundcard to see if GEMS signals are being produced from the subglottal
region. The subglottal signal can be recorded and sounds like muffled speech with no
phonetic information. If these signals are being recorded correctly, and the input to
Labview is working correctly, the system should function.
9.3 Technical Support
If you are still having problems, please feel free to contact us. Five hours of support
time, which should be scheduled in advance, are included with the purchase of a new
Aliph GEMS User Manual Page 36 of 36

sensor. Contact us and we’ll be glad to go through your problem with you. After the
included support time is exhausted, we would be happy to provide more support although
this may result in additional fees.
Aliph GEMS User Manual Page 37 of 37

10 Contact information
You may contact Aliph in the following ways:
Phone: 415-512-9191
Fax: 415-512-9190
Email: support@aliph.com
Mail: Aliph
410 Jessie Street, Unit 601
San Francisco, CA 94103
Aliph GEMS User Manual Page 38 of 38

Aliph GEMS Quick Reference
Stereo Output (1/8")
To DAQ
GEMS Unit
Battery
SMA Cable
BATTERY EITHER IN SENSOR OR
CHARGER BUT NOT BOTH!
Aliph Antenna
Charger Unit
Battery
Quick start:
Step 1: Slide the battery provided into the battery bay on the sensor body
AC Power Cable
Step 2: Attach the power cable between the charger and sensor
Step 3: Plug in the charger’s AC power supply
Step 4: Firmly attach the reverse polarity SMA cable to the antenna port
Step 5: Firmly attach 1 antenna (e.g. 9p6+7_80) to the SMA cable
Step 6: Make sure the bandpass filter switches are in the desired positions
Step 7: Insert the 3.5 mm stereo cable between the sensor and a DAQ device
Step 8: Switch on the sensor unit
Step 9: Apply the antenna to your trachea (and speak) to observe signals
Step 10: Adjust the audio output gain using the sensor gain adjustment knob
Note: Please read instructions on proper battery charging routines, antenna uses, and
DAQ guidelines. ONE AND ONLY ONE BATTERY CAN BE USED AT A TIME.
OPERATING THE GEMS WITH EITHER TWO BATTERIES OR NO
BATTERIES CAN DAMAGE IT!
Aliph GEMS User Manual Page 39 of 39
 Loading...