

Page 1

PSA6005 & PSA3605
6GHz & 3.6GHz Spectrum Analyzers
Page 2

CONTENTS
1 Product Introduction .....................................................................................................6
1.1 Items Supplied ..........................................................................................................6
1.2 Using this Manual - Cross References .....................................................................6
1.3 Product Description and Capabilities ........................................................................6
1.4 Initial Use - Charging the Battery | Switching On ......................................................7
1.4.1 Setting the Date and Time ......................................................................................7
2 Basics of Operation ......................................................................................................8
2.1 External Connections ...............................................................................................8
2.1.1 DC Power Input ......................................................................................................8
2.1.2 RF Signal Input .......................................................................................................8
2.1.3 Demodulated Audio Output .....................................................................................8
2.1.4 USB Host Connector (for USB Flash Memory) .......................................................9
2.1.5 USB Device Connector (for connection to a PC) .....................................................9
2.1.6 Trigger Input/Output ................................................................................................9
2.2 Bench-top and Portable Use.....................................................................................9
2.2.1 Tilt Stand.................................................................................................................9
2.2.2 Screen Protector and Sun Shield ............................................................................9
2.3 Batteries and AC Line Power .................................................................................. 10
2.3.1 Battery Operation ..................................................................................................10
2.3.2 AC Line Operation ................................................................................................10
2.3.3 Power Saving for Battery Operation ......................................................................10
2.4 Display and Controls Layout ................................................................................... 11
2.5 Touch Screen Operati on ........................................................................................ 12
2.5.1 Finger Tip Operation .............................................................................................12
2.5.2 Stylus Operation ...................................................................................................12
2.5.3 Operation using only the H ar d K eys .....................................................................12
2.5.4 Navigator Keys - Mode Selection ..........................................................................12
2.6 Instrument Status Information................................................................................. 12
2.7 On-screen Help ...................................................................................................... 12
3 Quick Start Guide ........................................................................................................ 13
4 Operation using the Menu System ............................................................................ 14
4.1 Setting the Frequency Range of the Sweep ........................................................... 14
4.1.1 Centre ...................................................................................................................15
4.1.2 Span .....................................................................................................................15
4.1.3 Start/Stop ..............................................................................................................16
4.1.4 Step Size ..............................................................................................................16
4.1.5 Frequency Presets ................................................................................................17
4.1.6 Sweep Time ..........................................................................................................17
4.2 Zero Span Mode (Demodulation Mode) ................................................................. 17
4.2.1 Audio Demodulation Sub Men u ............................................................................17
4.2.2 Waveform Demodulation Sub Me nu (when fitted) .................................................18
4.3 Setting the Sweep Mode, Bandwidth (RBW / VBW) & Detector ............................. 19
4.3.1 RBW / VBW ..........................................................................................................19
4.3.2 Sweep Time (and the Sweep Progres s Indicator Line) .........................................19
4.3.3 Sweep Control ......................................................................................................20
4.3.4 Scan Mode (when fitted) .......................................................................................20
4.3.4.1 Manually Controlling the Sweep .....................................................................20
4.3.4.2 Triggered Sweep (when fitted) .......................................................................21
4.3.5 Sweep Mode .........................................................................................................21
Page 1
Page 3

4.3.6
Detector Type .......................................................................................................21
4.4 Setting the Level Attenuator, Amplitude Scale, and Limits ..................................... 22
4.4.1 Measurement Units and Graticule .........................................................................22
4.4.2 Reference Level ....................................................................................................22
4.4.3 Vertical Scaling .....................................................................................................23
4.4.4 Amplitude Offset and Compensation Tables (when fitted) ....................................23
4.4.5 Amplitude Limits ( when fitted) ...............................................................................24
4.4.5.1 Channel Marker Files .....................................................................................24
4.4.6 Overload Indication ...............................................................................................24
4.5 Controlling and Storing Traces and Images ........................................................... 25
4.5.1 Displaying Traces; Controlling the View Trace ......................................................25
4.5.1.1 Understanding the Live, View and Reference Traces ....................................25
4.5.2 Sweep Progress Indicator Line .............................................................................26
4.5.3 Setting the Trace W rit ing Mode .............................................................................26
4.5.3.1 Dual Trace Mode............................................................................................27
4.5.4 Storing and Recalling Trac es and Screen Images ................................................27
4.6 Using Measurement Markers.................................................................................. 28
4.6.1 Setting-up Markers................................................................................................28
4.6.2 Controlling Markers ...............................................................................................29
4.6.2.1 Controlling Markers with the Hard Keys .........................................................29
4.6.2.2 Further Notes on the Use of Mark er s .............................................................29
4.7 Instrument Setups and Additional Functions .......................................................... 31
4.7.1 The Data Logging Function (when fitted) ..............................................................31
4.7.2 Automatic Measurements (when fitted) .................................................................31
4.7.3 Frequency Counter Options ..................................................................................32
4.8 Storing and Recalling Set-ups | System Settings ................................................... 33
4.8.1 Storing and Recalling Instrument Setups ..............................................................33
4.8.2 System Settings, Screen B r ightness, Filing System and USB Operations ............33
4.9 Status Information | On-screen Help | System Utilities ........................................... 34
4.9.1 Status Display .......................................................................................................34
4.9.2 Help Screens ........................................................................................................34
4.9.3 System Utilities .....................................................................................................34
4.9.3.1 Screen Utilities ...............................................................................................34
4.9.3.2 Power Options, Power-on State, Clock Setting ..............................................35
4.9.3.3 Alerts ..............................................................................................................35
4.9.3.4 System Updating and Calibration ...................................................................35
4.10 Using Instrument Presets | Automatic Setting ..................................................... 36
4.10.1 The User Preset ....................................................................................................36
4.10.2 Custom Presets (when fit ted) ................................................................................36
5 File Storage for Traces, Screen Images & Set-ups .................................................. 37
5.1 Storing Traces or Screens ...................................................................................... 37
5.1.1.1 Default File Name Rules ................................................................................38
5.2 Recalling Traces and Images ................................................................................. 38
5.2.1 Traces and States .................................................................................................38
5.3 Storing Instrument Set-up Files .............................................................................. 39
5.4 File Recall Screen .................................................................................................. 39
5.5 File Utilities Screen ................................................................................................. 40
5.6 File Operations Screen ........................................................................................... 40
5.6.1 Editing File Names ................................................................................................41
5.6.2 File Names Created or Renamed Externally .........................................................42
6 Upgrade Option U02 ................................................................................................... 43
Page 2
Page 4

6.1 Additional Functions from Option U02 .................................................................... 43
6.1.1 Scan Mode ............................................................................................................43
6.1.2 Logging of Values, Traces or S c reens ..................................................................43
6.1.3 Automatic Measurements .....................................................................................43
6.1.4 Modulation Waveform Display ..............................................................................43
6.1.5 Triggering ..............................................................................................................43
6.1.6 Limit Lines, Limit Pat terns & Channel Markers......................................................43
6.1.7 Level Offsets .........................................................................................................43
6.1.8 Compensation Tables ...........................................................................................44
6.1.9 Custom Presets ....................................................................................................44
6.1.10 View on PC ...........................................................................................................44
6.1.11 PSA-Manager Software ........................................................................................44
7 Further Notes on Operation ....................................................................................... 45
7.1 Signal Overload Levels and Indication ................................................................... 45
7.1.1 ADC Overload .......................................................................................................45
7.2 Operation using the Hard Keys Only ...................................................................... 45
7.3 Setting Frequencies ................................................................................................ 45
7.3.1 Set by Keypad ......................................................................................................46
7.3.2 Set by Tab/Jog ......................................................................................................46
7.3.3 Shortcuts to setting a Specific Frequency Span ....................................................46
7.3.4 Repetitive Operations ...........................................................................................47
7.3.5 Using Custom Presets (when fitted) ......................................................................47
7.3.6 Creating Channel Mark er s (when fitted) ................................................................47
7.4 Measuring Relative Amplitude ................................................................................ 48
7.5 Sweep Modes & Signal Image Rejection ................................................................ 48
7.5.1 Default Sweep Mode – Normal (Auto) ...................................................................48
7.5.2 Advanced Options.................................................................................................48
7.5.3 Revealing the Image .............................................................................................50
7.5.4 Sweep Times ........................................................................................................50
7.6 Radiated and Injected Signals ................................................................................ 51
7.6.1 Self-radiated Signals .............................................................................................51
7.6.2 External Signal Injec tion .......................................................................................51
7.7 Detector Types ....................................................................................................... 51
7.8 Triggered Operation ............................................................................................... 52
7.8.1 External Trigger Input ...........................................................................................52
7.8.2 Trigger Output .......................................................................................................52
7.9 Level Offset and Compensation Tables .................................................................. 52
7.9.1 Dynamic Range and Maxim um Signal ..................................................................52
7.9.2 Creating and using Compensation Tables ............................................................52
7.10 Limit Lines & the Limits Comparator | Creating Limit Patterns ............................ 53
7.10.1 Setting Limits ........................................................................................................53
7.10.2 The Limit Comparator ...........................................................................................53
7.10.3 Creating and Loading Limit Patterns .....................................................................54
7.10.4 Limit Offset ............................................................................................................54
7.10.5 Limit Fix/Unfix .......................................................................................................54
7.10.6 Creating and Loading Channel Markers ................................................................54
7.11 The Logging Function .......................................................................................... 55
7.11.1 The Logging Control Menu ...................................................................................55
7.11.2 Manual Logging ....................................................................................................56
7.11.2.1 The Run/Stop key and Sweep Control key .....................................................56
7.11.3 Logging from the Tim er .........................................................................................56
7.11.4 Logging from External Tr igger ...............................................................................56
Page 3
Page 5

7.11.5
7.11.6 Logging Every Sweep (Continuous) ......................................................................56
7.11.7 File Sizes and Maximum Loggi ng Times ...............................................................56
7.11.8 Viewing and Analyzing Logging Files ....................................................................57
Logging from Amplitude Limits ..............................................................................56
7.12 Using Automatic Measurements.......................................................................... 57
7.12.1 Channel Power (CP) .............................................................................................57
7.12.2 Adjacent Channel Power Ratio (A C P R) ................................................................58
7.12.3 Occupied Bandwidth (OBW) .................................................................................58
8 Scan Mode ................................................................................................................... 59
8.1 Scan Mode Explanation .......................................................................................... 59
8.1.1 Limitation of Norm al S weep Mode ........................................................................59
8.1.2 Benefits of Scan Mode ..........................................................................................59
8.1.3 Displaying Scan Mode Files ..................................................................................59
8.1.4 Saving, Recalling and Exporting Scan Mode Files ................................................60
8.2 Scan Mode Operation ............................................................................................. 60
8.2.1 Setting up the Analyzer .........................................................................................60
8.2.2 Entering Scan Mode .............................................................................................60
8.2.3 Using Scan Mode..................................................................................................60
8.2.3.1 The Scan Display ...........................................................................................61
8.2.3.2 Viewing a Scan and using the Marker ............................................................61
8.2.3.3 Storing and Recalling a S c an .........................................................................62
8.2.3.4 Exporting Scan Files ......................................................................................63
8.2.4 Scan files and PSA-Manager ................................................................................63
9 USB Connections | File System & Files Types ......................................................... 64
9.1.1 Understanding USB Connect ions .........................................................................64
9.1.2 Using an External Flash Drive ...............................................................................64
9.1.3 Linking to a PC via USB ........................................................................................65
9.2 File System and File Types .................................................................................... 65
9.2.1 Internal Filing System Organisation ......................................................................65
9.2.2 File Types .............................................................................................................65
9.2.3 Trace Files ............................................................................................................66
9.2.4 Screen Image Files ...............................................................................................66
9.2.5 Setup Files ............................................................................................................66
9.2.6 Other File Types ...................................................................................................66
9.2.6.1 Scan Files ......................................................................................................66
9.2.6.2 Compensation Tables ....................................................................................67
9.2.6.3 Limit Pattern and Channel Mark er Files .........................................................67
9.2.6.4 Logging Files ..................................................................................................67
10 Default Settings | Power On State | Hard Reset .................................................... 68
10.1 Restoring to Factory Defaults .............................................................................. 68
10.2 Standard Preset .................................................................................................. 68
10.3 Unrecoverable Fault Condition - Hard Reset ....................................................... 68
10.4 Power-On State ................................................................................................... 69
11 Firmware Updates | Upgrades | Maintenance ........................................................ 70
11.1 Updating the Firmware ........................................................................................ 70
11.2 Upgrading the Firmware (Option U02) ................................................................ 70
11.3 Maintenance, Re-calibration & Cleaning ............................................................. 70
11.4 Battery Replacement ........................................................................................... 70
12 Safety Information ................................................................................................... 71
13 Specification ............................................................................................................ 72
Page 4
Page 6

13.1.1
13.1.2 Amplitude Measurement (Level) ...........................................................................73
13.1.3 Sweep and Traces ................................................................................................74
13.1.4 Scan Mode (only with Option U02) .......................................................................74
13.1.5 Memory Storage and Data Logging ......................................................................75
13.1.6 Connectors and Displa y ........................................................................................75
13.1.7 Power Requirements ............................................................................................76
13.1.8 Mechanical, Environmental and Safety .................................................................76
Frequency Measurement ......................................................................................72
14 Appendix A: Optional Accessories ....................................................................... 77
15 Appendix B: PSA-Manager and PSA-View Software ........................................... 77
16 Appendix C: Factory Default Settings ................................................................... 79
17 Appendix D: Menu Tree Diagram ........................................................................... 80
Page 5
Page 7

1 Product Introduction
1.1 Items Supplied
Portable Spectrum Analyzer (PSA3605 or PSA6005) wi t h removable stylus and detachable
bench-stand/screen-protector.
Spare stylus duplicates the stylus fitted into the ins trument.
USB lead Mini B plug to standard A plug.
Trigger input converter plug 3.5mm jack to BNC socket.
AC line power-supply/charger Uni v er sal voltage with interch angeable country specific plugs.
Short Guide (English, French, German, Italian and S panish).
Full instruction manual ( E ngli s h only).
Support CD Containing hyper-linked PDF versions of the printed manuals, plus support files.
1.2 Using this Manual - Cross References
This manual covers both t he PSA6005 and PSA3605 spectrum analyzers. Within t he text they
may be referred to jointly as PS Axx05 or PSA Series 5. The manual is also provided as a P DF
file on the accompanying CD. The manual includes many cross r eferences which are shown as
follows - see section X.X. The Table of Contents is also fully hyperlinked.
Within a PDF file, the shaded number is a hyperlink to that s ec tion number which enables the
user to jump rapidly to the sect i on r eferred to and then jump back to continue reading the
original section. (N.B. for hyperlink navigation within Acrobat Reader, enable “show all page
navigation tools” or use the keyboard shortcuts Alt+Right_Arrow and Alt+Left_Arrow).
1.3 Product Description and Capabilities
The PSA6005 and PSA3605 ar e fully portable RF spectrum analyzers that incorporate a high
resolution colour TFT touch screen. They are sufficiently small and lightweight to be operated
as true handheld instruments and have a battery life of more than 3 hours from each charge.
As bench instruments they can be powered by the supplied ac -line adaptor/charger. They can
be set horizontally or vertically, or at an angle of about 40 degr ees using the built-in tilt stand.
For field use, the stand can be moved to the top of the instrument to form a screen protector
and sun shield.
The frequency range is 10MHz to 6000MHz (PSA6005) or 10MHz t o 3600MHz (PSA3605). The
span can be set between 0.0270 MHz and 5990.000 MHz or 3590.000 MHz respectively with a
setting resolution of 100Hz. Start, stop or centre frequenc ies can be set to the sam e r esolution.
The resolution bandwidth (RBW) is selectable between 300Hz and 10MHz in a 1:3:10
sequence or can be set to Auto. Video bandwidth (VBW) is similarly settable between 300Hz
and 10MHz or RBW tracking.
The on-screen amplitude r ange is approximately 84 dB with a reference level variable between
-40dBm and +20dBm. Amplitudes can alternative ly b e di s played in dBµV. Vertical
magnification down to 1dB/div can be selected. Average noi s e floor is typically bett er than
-120dBm at -40dBm reference level and 10 kHz RBW/VBW.
Sweeps can be repeating or single s hot, and the trace can be normal (over-write), peak hold or
average (2 to 48 sweeps). A zero span mode is available with AM or FM waveform
demodulation with variable timebase. Audio demodulation is provided vi a a built-in speaker.
Multiple detector modes include Positive Peak (default), Negative Peak, Alternate Peak, Lin or
Log Average, RMS, and Sample.
Twin vertical marker lines are available giving a readout of frequency and amplitude together
with difference values. Mark er s can be manually positioned or automatically peak finding or
tracking. A frequency counter c an be used at the marker position with resolution down to 10Hz.
Page 6
Page 8

A reference trace and a view trac e can be displayed in addition to the live trace. Up to 999
traces can be stored to permanent memory for recall to the s c r een or for data export. 999
instrument set-ups and 999 complete screen bitmaps can also be stored. All files can be given
user defined names.
USB interfaces are provided for direct file transfer t o a P C or for connection of a USB Flash
drive.
Extensive convenience features f or repetitive operation include aut o-set, frequency presets,
and storage of the instrument state together with the trace file for simultaneous or independent
recall.
Pressing the Status/Help hard key brings up a full status screen and access to help sc r eens
relevant to the current menu position.
An optional upgrade package ( retro installable) prov ides additional featur es i nc luding high
resolution data capture (scan mode), data logging, sweep triggering, limit patterns,
compensation tables, automatic measurements, and more - see section 6.
More details of the product capabilities are given in the S pec i fications - section 15.
1.4 Initial Use - Charging the Battery | Switchi ng O n
As supplied, the internal battery is likely to be part ly or fully discharged. At fir s t us e, the
instrument should therefore be plugged into the char ger until the lamp next to the c harge socket
stops flashing, which could take up to three hours - see s ec tion 2.1.1. The instrum ent can still
be used during this period.
The instrument is turned on or off by pressing the small round key marked Power for about one
second. When turning on, t he screen backlight will flas h briefly and a short beep will sound to
indicate that the key press has been recognised, ther e i s then a short delay prior to operation
starting.
If the battery is too far dischar ged to allow operation, the instrument will turn off again and a
second short beep will be sounded.
1.4.1 Setting the Date and Time
The instrument contai ns a r eal -time clock that is used for time stamping of files. As supplied
the date and/or time may be incorr ect.
Date and time can be checked from page 4 of the Status screens, or can be checked and
altered from Setup/Functions > System/File Ops > S yst em Utilities > Power/Clock.
Note that the date format is DD -MM-YY and the time format is 24 hour .
Page 7
Page 9
2 Basics of Operation
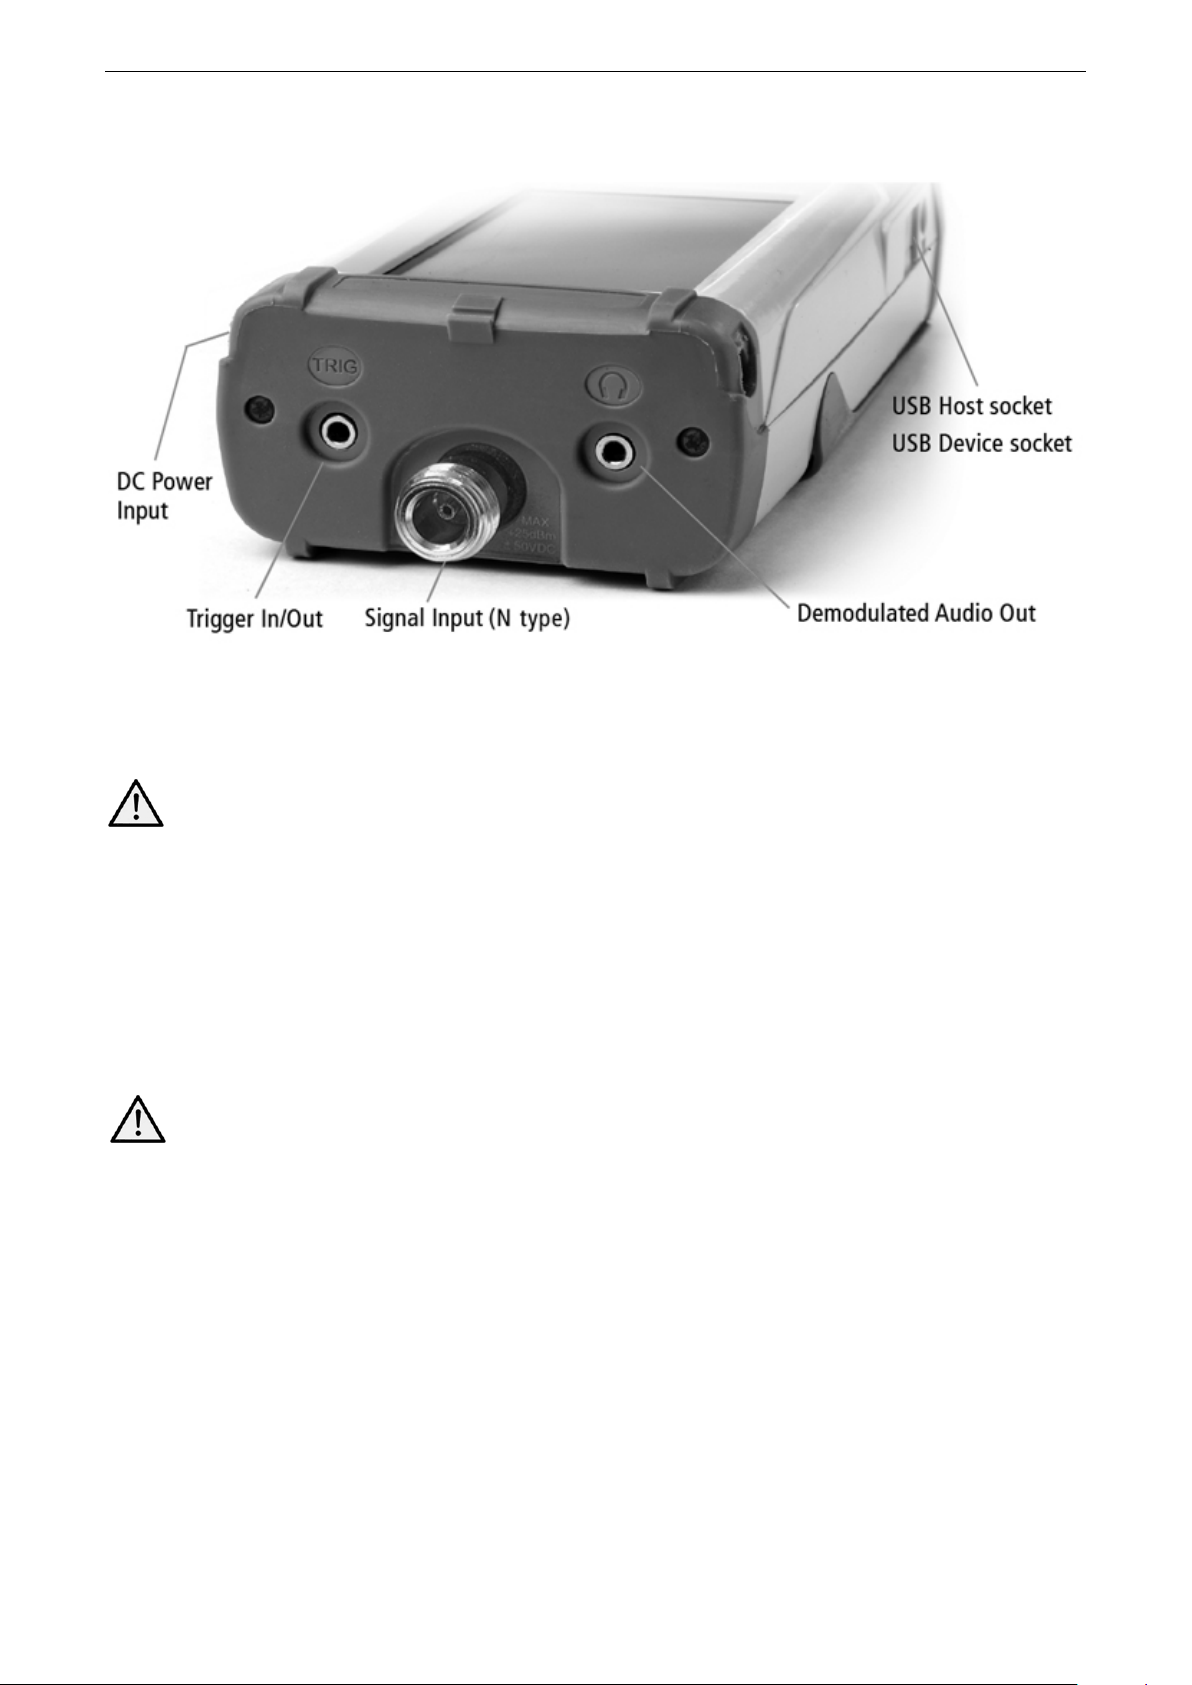
2.1 External Connections
2.1.1 DC Power Input
DC power to operate and/or r ec harge the instrument is connected via a 1.3mm power socket
mounted on the right hand side of the instrument.
Use ONLY the power-supply/charger provided by Aim-TTi with the unit. Use of any
other power source will void the warranty.
The red lamp next to the socket flashes whilst charging is taking place and becom es continuous
once charging is complete.
2.1.2 RF Signal Input
The signal to be measured is connected via a standard N connector mounted at the top of the
instrument. The input impedance is 50 Ohms. The maximum useable signal input is + 20dB m
or +127 dBuV.
The absolute maximum signal input level is +25dBm or +132dBuV of RF power (approximately
4 volts RMS), or 50V DC.
Applying a signal above this level could damage the unit and s uc h damage would not
be covered by the product warranty.
2.1.3 Demodulated Audio Output
Demodulated audio (when in Z er o Span Mode) is available via the built-in speaker, with the
volume level adjustable from within the application. The signal is also provided via a 3. 5mm
stereo jack socket m ounted at the top of the instrument. Maximum power output is 30 milliwatts
into 32 Ohms.
The signal is mono but connection can be made using either a mono or stereo plug. In the
latter case the signal will be pres ent on both channels. Connecting the jack plug automatically
disconnects the internal speaker.
Page 8
Page 10
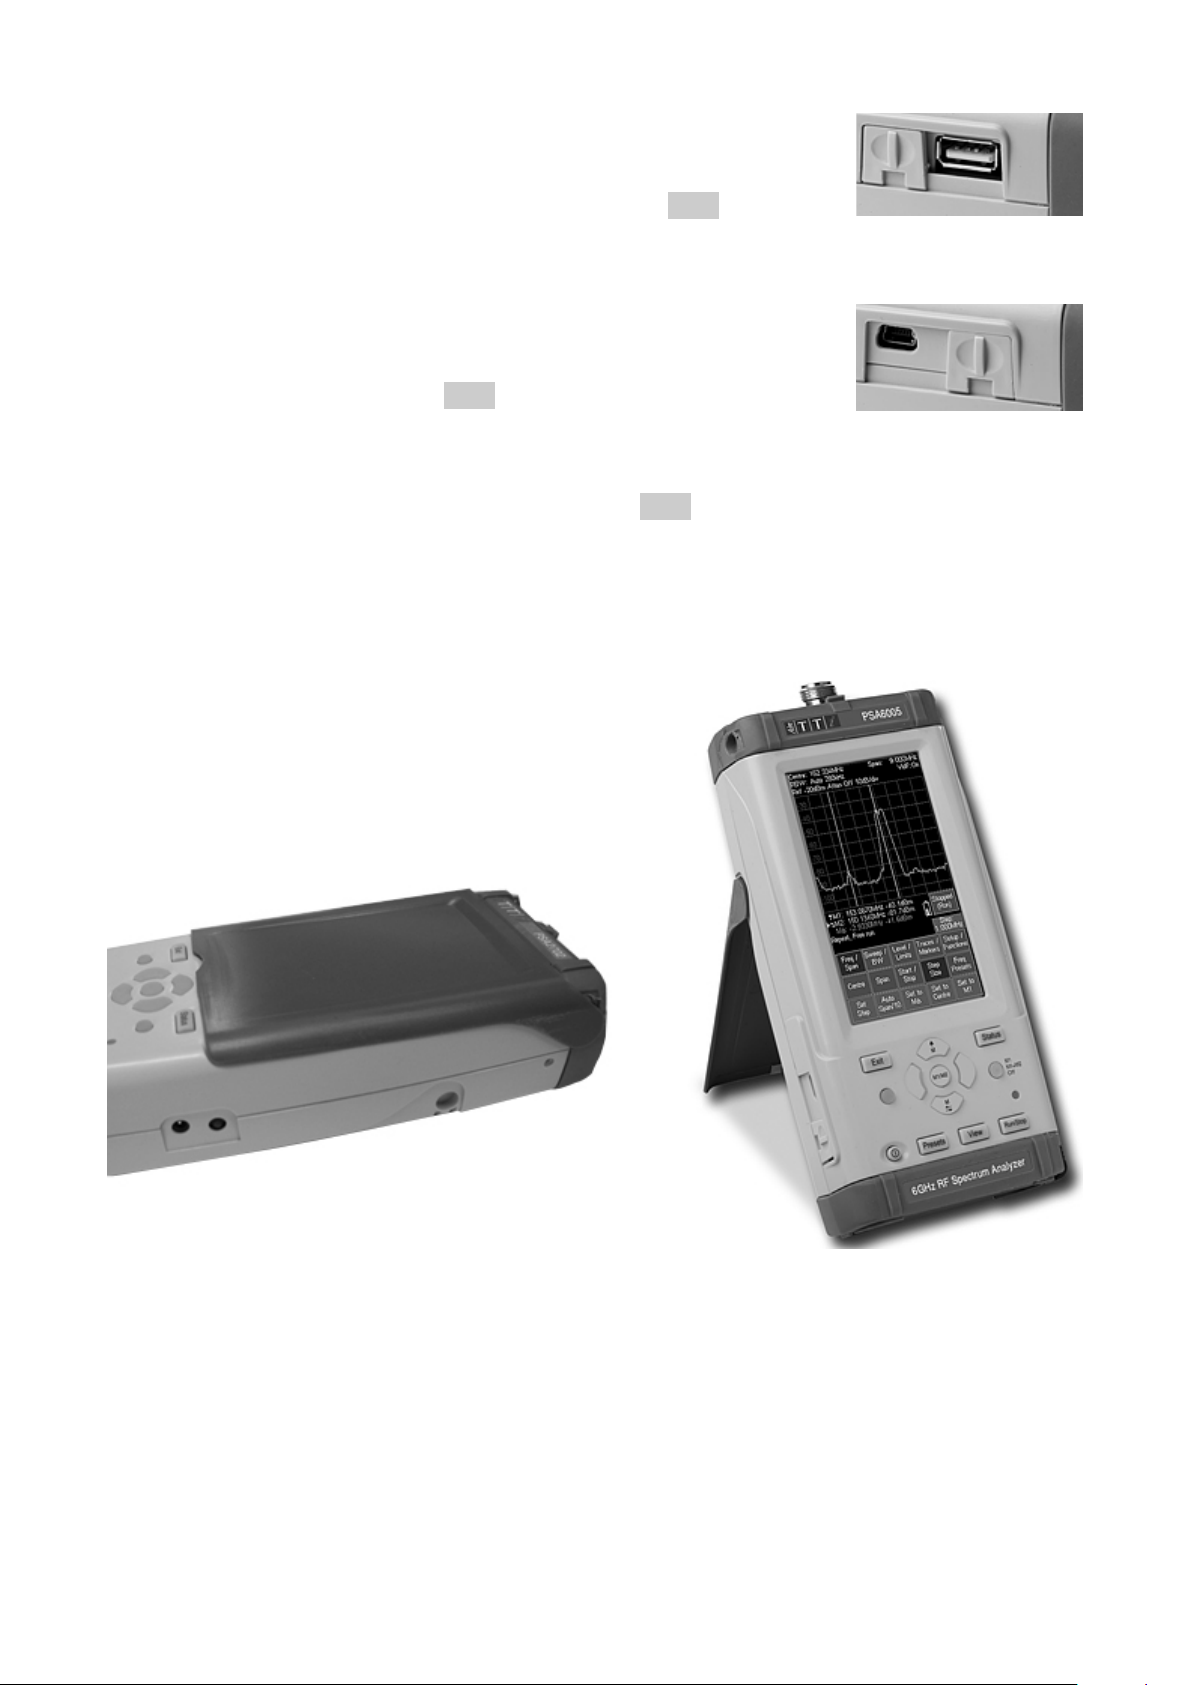
2.1.4 USB Host Connector (for USB Flash Memory)
A standard USB type A connector is pr ovided on the left hand side of
the instrument which is revealed by moving the sliding cov er towards
the top of the instrum ent. This is intended exclusively for the
connection of a USB Flash m em ory stick. See section 9.1.2 for full
information.
2.1.5 USB Device Connector (for connection to a PC)
A USB type mini-B connector is pr ov i ded on the left hand side of the
instrument which is revealed by moving the sliding cover towards the
base of the instrument. This is intended exclusively for connection to a
personal computer. S ee section 9.1.3 for full information.
2.1.6 Trigger Input/Output
A 3.5mm mono jack socket is mounted at the top of the instrument for trigger signals. This has
no function unless option U02 is fitted - see section 6.1.5. An adaptor is provided that converts
from the jack s oc k et to a standard BNC connector.
2.2 Bench-top and Portable Use
The instrument is int ended for both hand-held and bench-top applications. It has rubber feet for
horizontal or vertical use, or can be angled using the tilt stand.
2.2.1 Tilt Stand
The instrument is s upplied with the tilt stand folded
away and magnetically l atched at the bottom of the
instrument. It can be hinged outwards to tilt the unit at
an angle of about 40 degrees.
2.2.2 Screen Protector and Sun Shield
To protect the screen when in trans it, the tilt stand can
be detached from the bott om of the instrument and re-attached on the top to act as a screen
protector.
The stand is removed by f lexin g i t outwards at the hinged end until t he lugs disengage from t he
sockets.
For outdoors use, the sc r een protector can be hinged up wards to form a sun shield which
improves the screen visibil ity in direct sunlight.
When not required, it can be detached and stowed away on the back of the instrument where it
functions as a tilt stand .
Page 9
Page 11

2.3 Batteries and AC Line Power
2.3.1 Battery Operation
The instruments operates from an internal Lithium-ion rechargeable battery which can provide
more than 3 hours of continuous operation (screen brightness dependent).
The battery condition is indicated on the display via a multi-segment battery symbol. When it
changes colour to yellow, e xpect ed battery life has f all en below 30 minutes. When it turns red,
expected battery life has fallen below 10 minutes, and the analyzer should be rechar ged.
The approximate battery life remaining is also displayed in hours and minutes within the Status
information screens.
The battery is charged from the supplied 5V/2A charger which can recharge a fully discharged
battery in under 3 hours.
When the battery is being charged, the red lamp next to the charging socket flashes. When
charging is complete, flashing ceases but the lamp remai ns ill uminated while the charger is
connected.
It is also possible to slow charge the instrument fr om the USB port of a personal comput er
provided that the instrument is turned off. Charge time may be up to 10 hours. Connection to
the PC must be made from the m i ni US B “device” port of the instrument using the supplied
cable. It is not possible to oper ate the instrument fr om U S B power.
2.3.2 AC Line Operation
For bench-top operation, the instrument can be operated continuously from the suppli ed ac-line
operated charger. The internal power management circuitry ensures that the battery cannot be
overcharged.
2.3.3 Power Saving for Battery Operation
The battery life of the ins trument is affected by the screen brightness which can be adjusted
over a wide range (see sect ion 4.8.2). Setting the brightn es s to maximum, for example, will
reduce battery life by up to 1 hour relative to the normal setting (40%).
To conserve the battery the instrument should be turned off when not in use. In addition, AutoOff mode can be selected whereby the unit turns off automatically after a defined per iod from
the last key press. The period can be set between 5 and 60 minutes - see section 4.9.3.2.
Auto-Off is automatically disabled when external po wer is c onnected, and when data-logging is
enabled. All data is retaine d when the instrument is off .
A short beep is sounded when the inst r ument turns off.
Page 10
Page 12
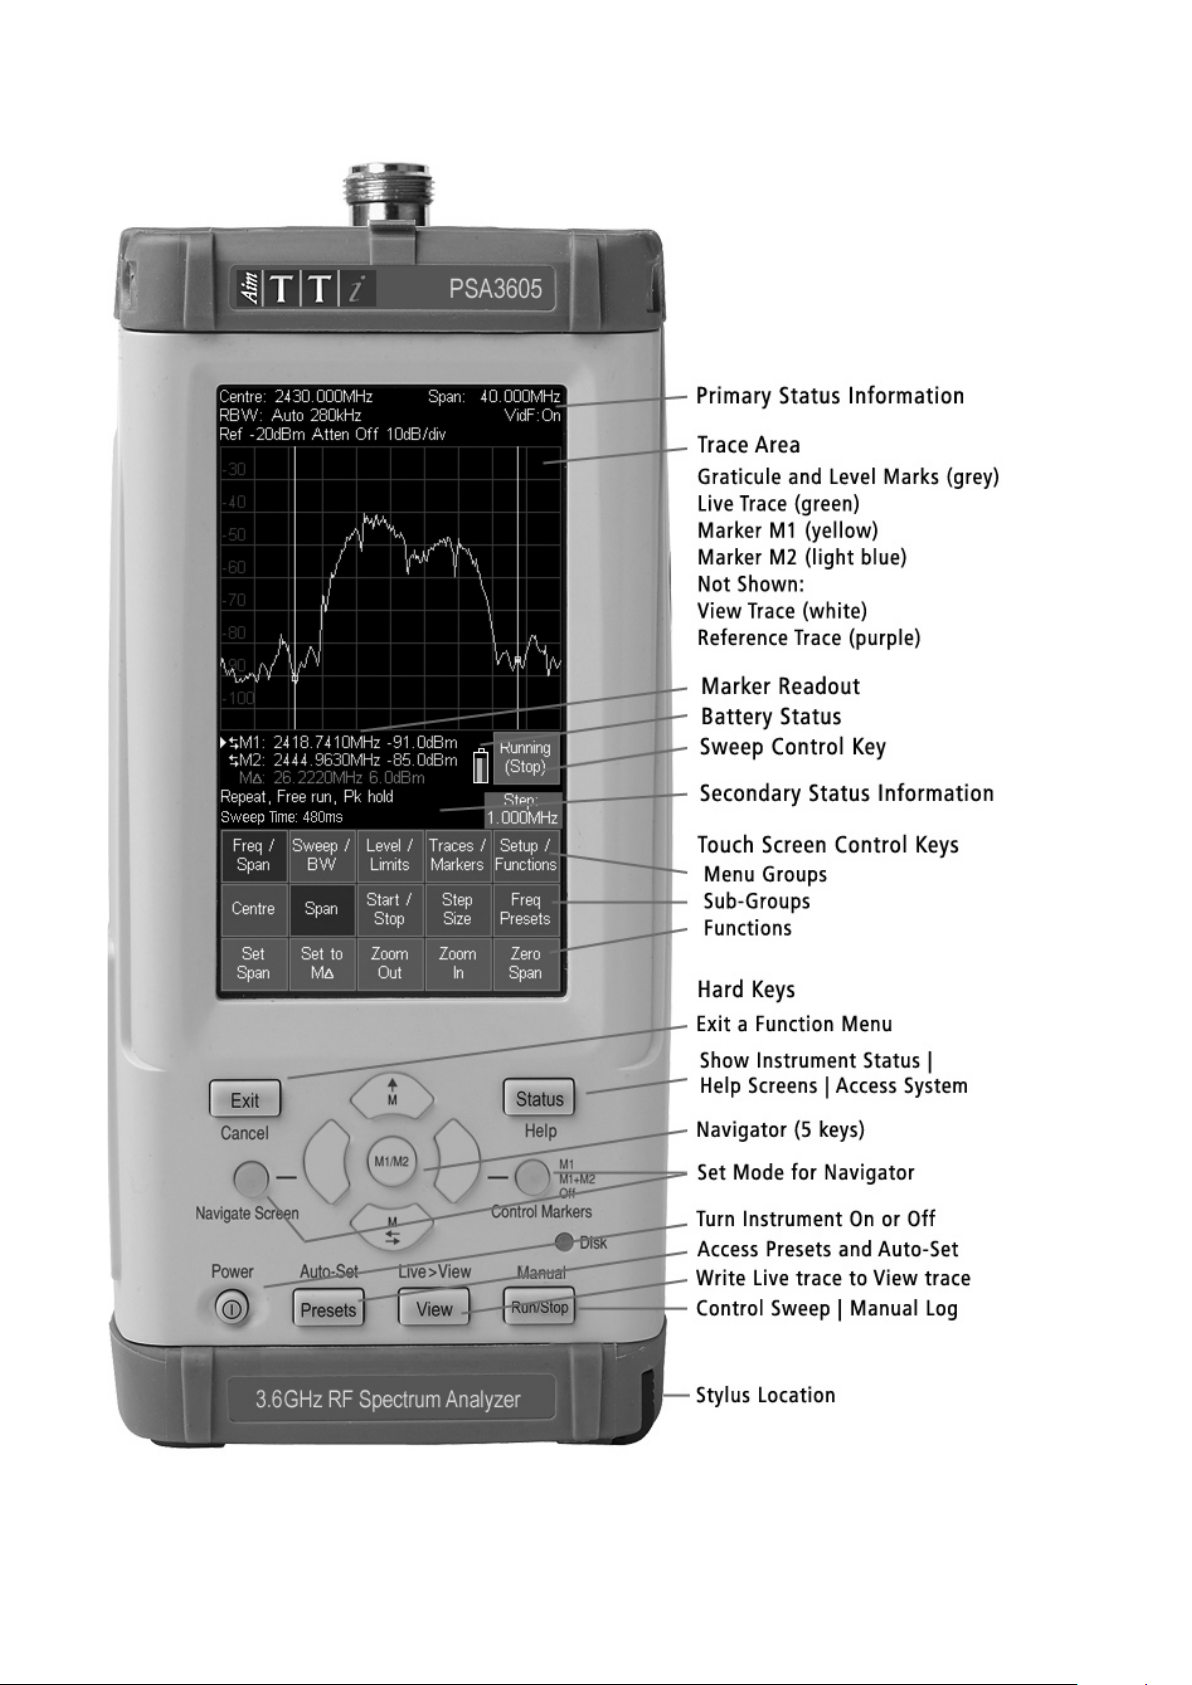
2.4 Display and Controls Layout
Fig. 1
Page 11
Page 13

2.5 Touch Screen Operation
The normal mode of operation of the spectrum analyzer is by using the touch-screen keys
within the display supplemented, when required, by t he har d keys below.
The touch screen keys are normally operated by pressing with the finger or thumb, but c an
alternatively be operated using the supplied stylus .
2.5.1 Finger Tip Operation
The touch screen is a resistive single-touch type (rather than the capacitive multi-touch type used
on many smart phones).
It can be operated by pressing the key area firmly with the soft part of the finger or thumb.
However, for greater positional accuracy it can also be operated by pressing gently with the finger
nail.
When a key is depressed, its colour changes from blue to purple. The key action is performed when
the key is released.
2.5.2 Stylus Operation
Some users may prefer to use a stylus to operate the touch sc reen. The supplied stylus has a
soft point. Sharply pointed objects should never be used to oper ate the screen as they could
cause damage.
The stylus should be replaced into its mounting slot at the base of the instrument to prevent i t
being mislaid. The st ylus des ign is compatible with those used with the Nintendo DS handheld
games console, and spares are widely available.
2.5.3 Operation using only the Hard Keys
It is also possible to use the spectrum analyzer without touching the screen at all, by us i ng the
five “navigator” hard keys t o operate each of the touch scr een functions. See section 7.2 for a
full explanation of this mode of operation.
2.5.4 Navigator Keys - Mode Selection
The five hard keys that mak e up the Navigator have two alternative modes of operation which
are selected by the small illuminated keys on either side.
The modes are:
Control Markers (default) - see section 4.6.2.1, and Navigate Screen - see section 7.2.
Whenever the navigator mode is changed, an information box appears explaining the current
action of the navigator keys. If preferred this can be turned of f - see section 4.9.3.3.
2.6 Instrument Status Information
The most important elements of the instrument status ar e di s played at the top of the screen
(see Fig. 1 in section 2.4). Further status informat ion relevant to the current menu function is
shown directly above th e k ey area.
In addition, the full status of the instrument can be displayed at any time by pressing the hard
key marked Status/Help - see section 4.9.1.
2.7 On-screen Help
The instrument incorpor ates extensive help information to assist the user. Help is ac c essed by
pressing the hard key marked S tatus/Help - see secti on 4.9.2.
Page 12
Page 14

3 Quick Start Guide
It is recommended that all users, including those fully familiar with RF spectrum analyzers, take
a little time to read through t his instruction manual before using the instrument.
However, for users who wish to get started with hands-on operation as quickly as possible, the
following may prove useful.
1. Press and hold the Power key unt il a s hort beep is heard. Wait a few seconds and then
check the battery condition indicator on the display. If it shows less than ¼ full the instrument
should be connected to its charger.
2. Connect the signal to be meas ur ed to the N-type connector at t he top of the instrument. The
maximum allowable signal without damage is +25dBm (+132dBuV or 4V rms). The maximum
measurable signal is +2 0dBm (+ 127dBuV or 2.23mV rms ). If t her e is a possibility of the signal
exceeding these levels, add suitable in-line attenuation.
3. Ensure that the Navigator k eys are set to Control Markers (key illuminated green). If not
press the round key marked Control Markers. This also selects touch-screen key control.
4. Press the hard key marked P resets (Auto-Set) . Select Auto Set and press Execute.
The instrument will perf orm a full span sweep (10MHz to 3590/ 5990MHz) at maximum
reference level (+20dBm) and find the highest level within the sweep. It will then perform a
number of further sweeps at narrower spans and, where appropriate, lower reference levels.
During this time a red background message of Status: S CA N NING with be displayed. When
finished the message will become Status: COMPLETE.
When Auto Set has complet ed, the analyzer should be set with a fairly narrow span (typically
10MHz) centred on the signal with the M1 marker at the centre frequency and in Peak-find
mode (indicated by an upwards ar row prior to the M1 readout). RBW will be set to Auto and
VBW to Track.
5. Press Exit to return to the m ai n menu.
The M2 marker can be turned on from the hard key marked Control Mar kers. Markers are
moved using the Navigator har d k eys – Left/Right moves the markers, Up sets peak-find mode
where the selected marker jumps to peaks within the trac e, Down sets scroll mode where the
marker moves across the screen in one pixel steps (1/270
under control is selected by the centre key (M1/M2) and indicated by an arrow before the
marker readout.
From the main menu adjustm ents can be made to centre frequenc y a nd span (or start and
stop), sweep mode, detector type, RBW and VBW, refer enc e level, displayed traces and
markers.
The menu system is hierarchical with each top-line ke y selec ting a set of five second-line
sub-menu keys. Each of these pr ovi des access to a set of keys on the bottom line that perform
the actual functions.
Context sensitive help f or each sub-menu group can be accessed by pressing the hard key
marked “Status (Help)” followed, if not already sel ec ted, by Context Help. This provides
sufficient inform ation to understand the principle s of operation.
th
of the span). The marker currently
Page 13
Page 15
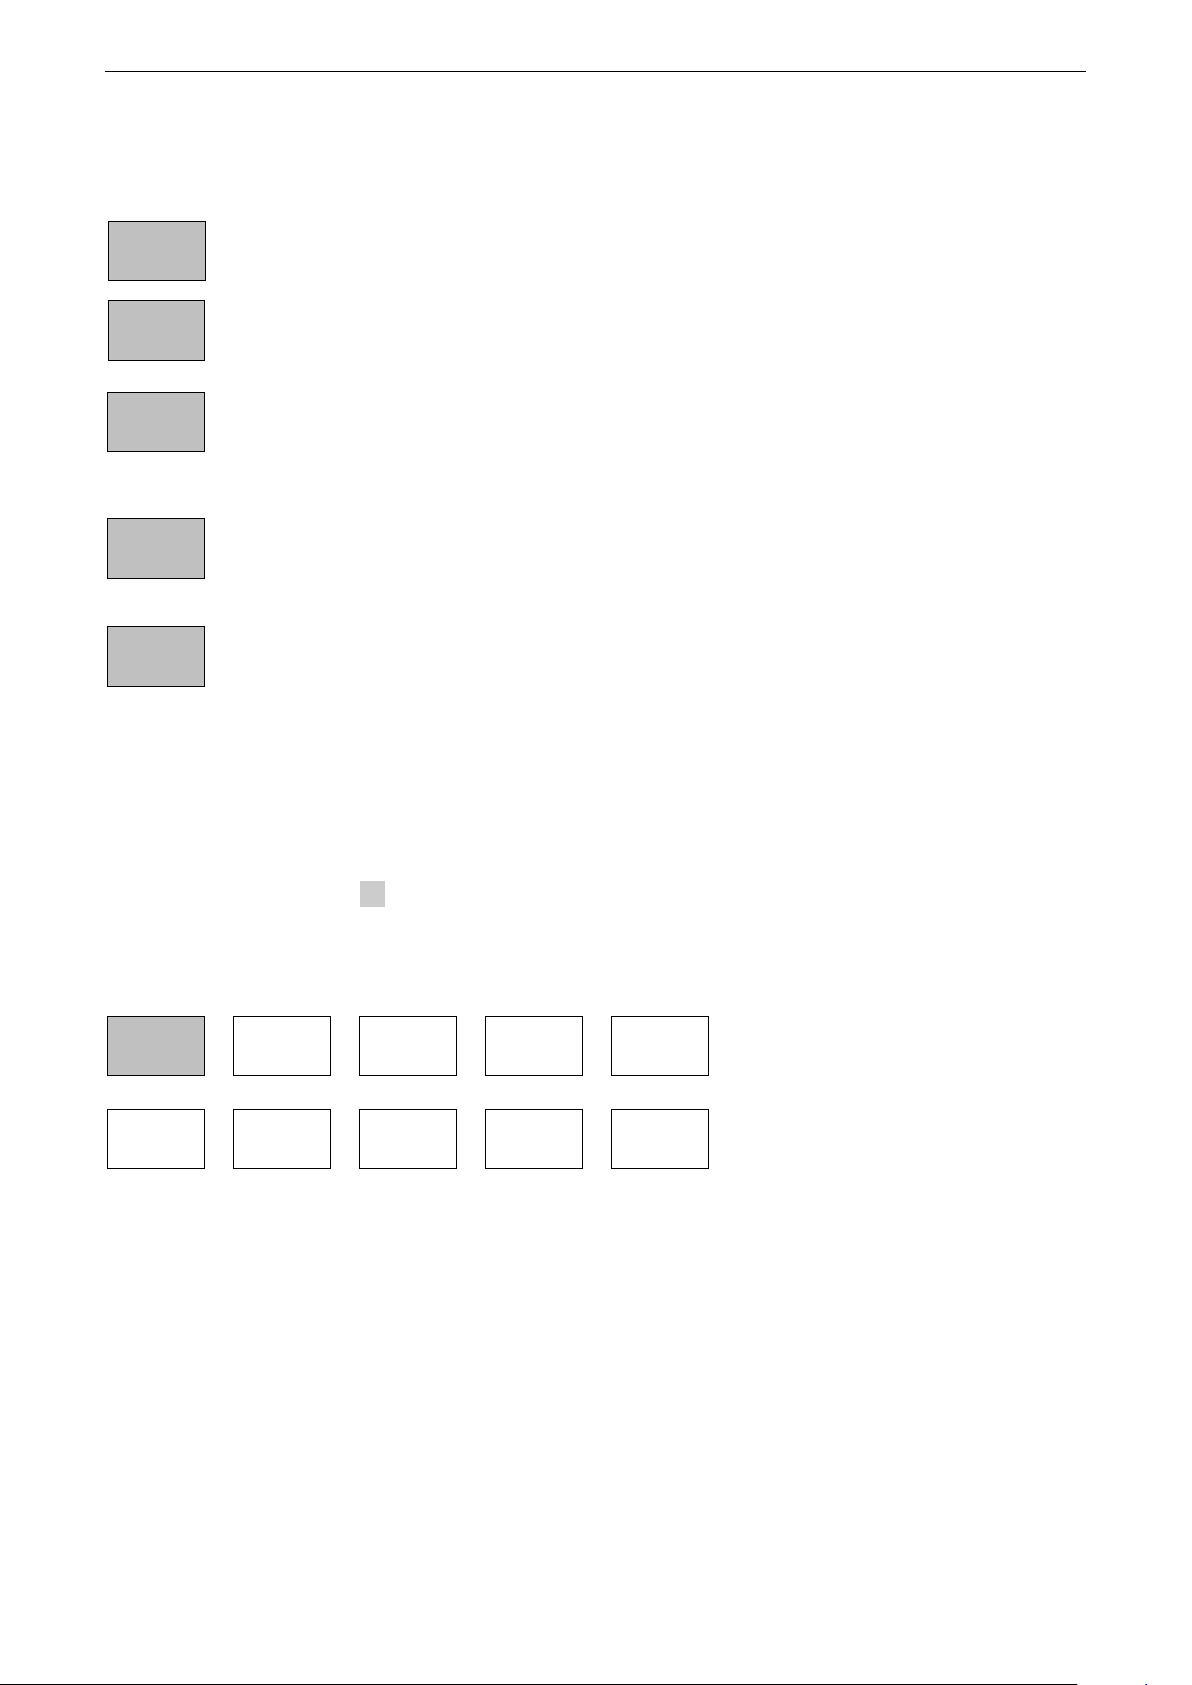
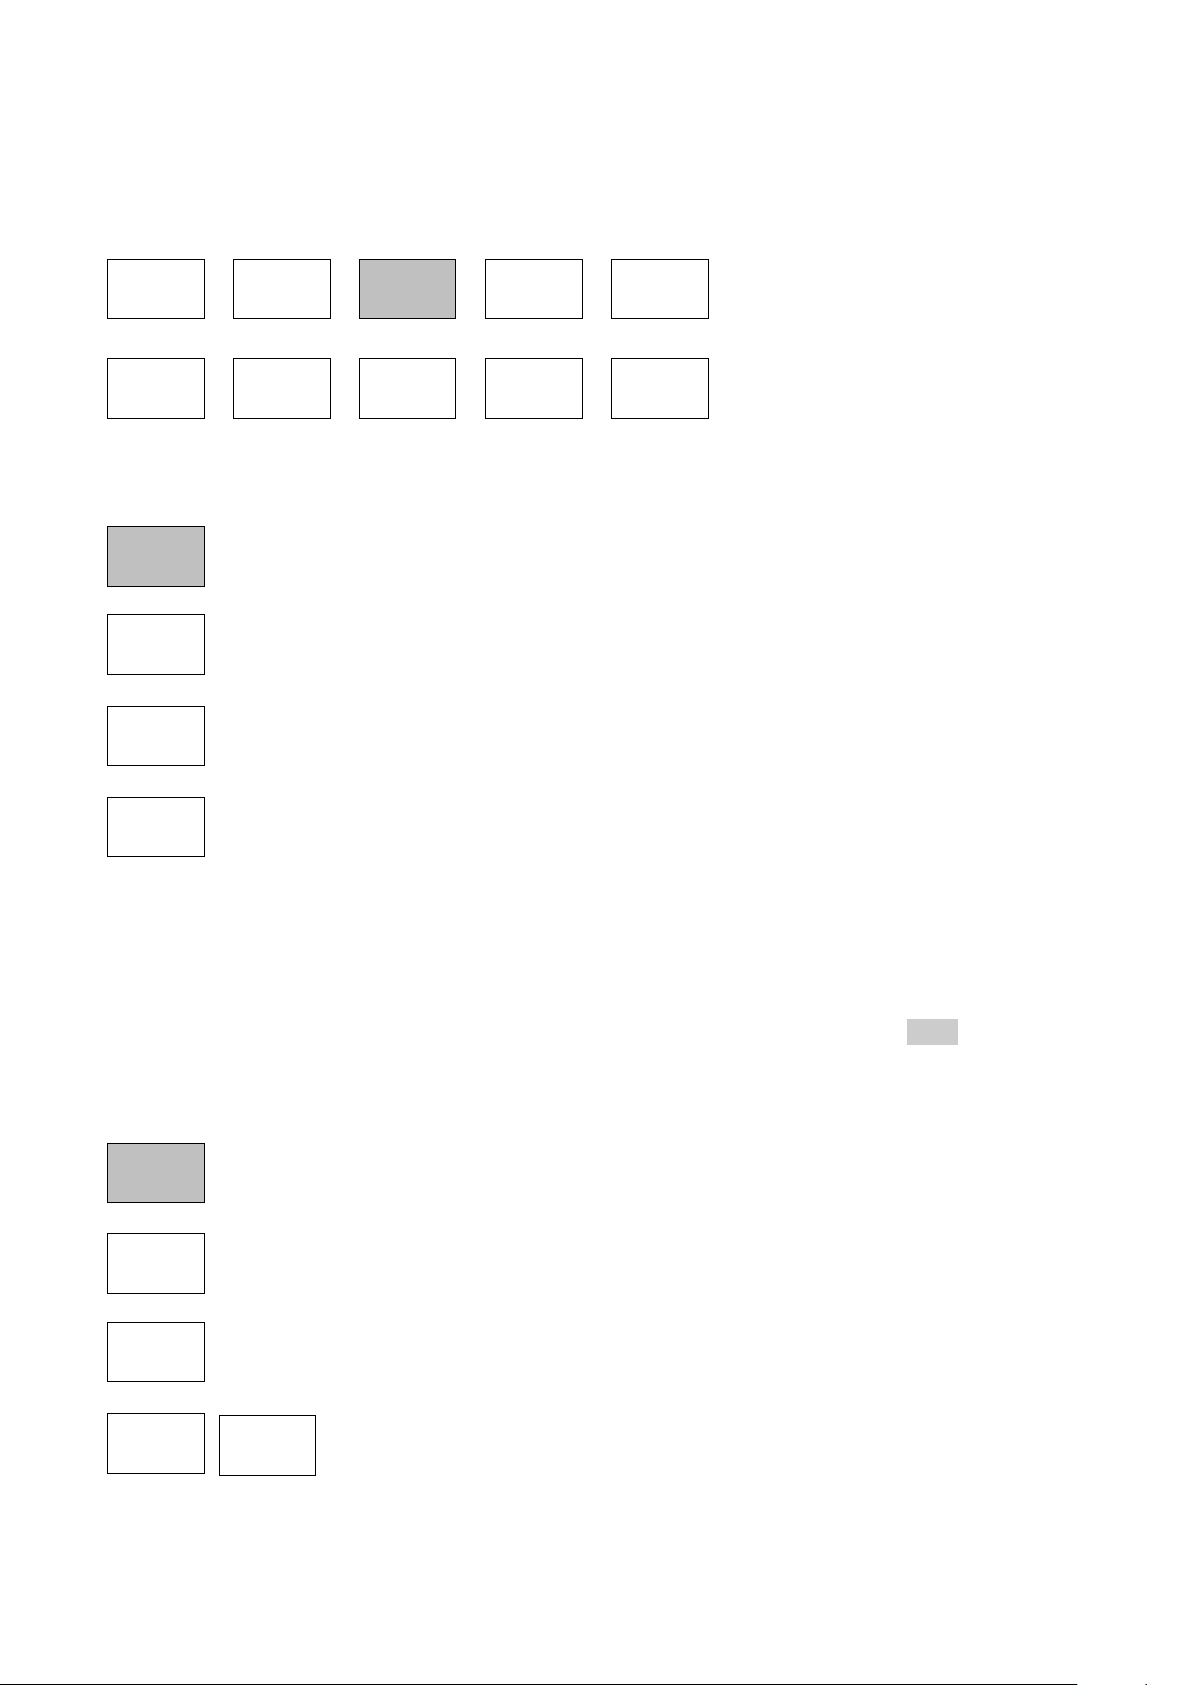
4 Operation using the Menu System
Freq/
Span
Sweep/
BW
Level/
Limits
Traces/
Markers
Setup/
Functions
Centre
Span
Start/
Stop
Step
Size
Freq
Presets
Freq/
Span
The default menu system for the spectrum analyzer consists of three rows of five keys. The
upper row represents the t op lev el of the menu system and defines five “menu groups” as
follows:
enables the frequency range of sweep to be set in terms of start and stop
frequencies or centre frequency plus span, as well as zero span demodulation.
enables control of the sweep and bandwidth filtering for the sweep. Controls are
provided for RBW and VBW settings , sweep mode, sweep time, sweep control and
detector type selection. When option U02 is fitted, it also controls sweep triggering.
enables the reference level to be changed, the amplitude units to be changed, and
the vertical scaling to be altered. When option U02 is fitted, it also enables the
setup and control of limit lines and patterns, and the application of external offsets
and compensation tables.
provides control of the dis play traces including t r ace processing modes, alon g with
the storage function f or both traces and screen images . Also provides setup and
control of the measurement markers.
provides access to the stor age of instrument setups and access to system utilities
and setting of the frequency counter gate time. When option U02 is fitted, it al s o
provides access to automatic logging functions.
Each group has up to five “sub-groups” which appear on the middle row of keys. The current ly
selected group and sub-group is s hown by the relevant key being dark blue.
The bottom row of keys represent the “functions” that c an be performed for each of the many
sub-groups. These keys may perform an immediate action, or bring up a pop-up menu, or
create a special control sc reen for numeric entry or file operations.
See Appendix D,section 19, for a graphical summary of the menu tree.
4.1 Setting the Frequency Range of the Sweep
This menu group controls t he frequency range for the curr ent sweep of the spectrum analy zer.
The range can be set in terms of eit her a centre frequency plus a span width, or in terms of a
start frequency and a stop frequency.
Pressing Centre or Span will cause the frequency range to be dis played at the top of the screen
in terms of a centre frequenc y and a span. Pressing Start/S top will cause it to be displayed in
terms of a start frequency and a st op frequency.
The lowest start frequenc y is 10MHz. The highest stop frequency is 6000MHz or 3600MHz.
The minimum span width is 0. 027MHz which results in minimum and maximum centre
frequencies of 10.0135MHz and 5999.9865MHz or 3599.9865MHz respectively.
Page 14
Page 16
Centre
Set
Centre
Set
C=M1
Set
C=Pk
Step
Down
Step
Up
Span
Set
Span
Set to
Mdelta
Zoom
Out
Zoom
In
Zero
Span
4.1.1 Centre
controls the centre f requency for the sweep. Also sets t he annotation to
Centre/Span if it was previously Start/Stop. Creates a set of bottom-row function
keys as follows:
enables the centre fr equency to be set to a specific value. T he menu keys are
replaced by a numeric keyboard from which a centre frequency can be entered in
MHz to a resolution of 0.0001 (100Hz).
Press OK to activate the new frequency without leaving the screen or O K & Exit to
return to the Centre menu. Once a new frequency has been set from this screen,
the Previous key can be used to return to the previous fr equency and then toggle
between the two.
Pressing Set by Tab/Jog selects an alter native setting screen in which frequencies
are set by “jogging” each digit up or down. Note that whichever method of setting
frequency is used becomes the default whenever Set Cent re is pressed. See
section 7.3 for an illus trated description of frequency setting.
sets the centre frequency to the frequency value of the M1 m ar k er (when active).
sets the centre frequency to the frequency value of the highest amplitude point in the current
sweep.
changes the centre frequency by the value of the step size
- see section 4.1.4.
4.1.2 Span
controls the span for t he sweep. Also sets the annotation to Centre/Span if it was
previously Start/St op. Creates a set of bottom-row funct i on k eys as follows:
enables the span to be set to a spec ific value. The method for sett ing the s pan is
similar to that for setting the Centre frequency - see section 7.3 for an illus trated
description of frequency setting.
sets the span equal to the f r equency difference between the M1 and M2 markers (if
active).
changes the sweep mode of the spectrum analyser and opens the Zero Span sub
menu - see section 4.2.
sets the span to a higher or lower value in a 1-2-5 sequence starting from
the existing span value. (Example: if the existing span is 1.7MHz, the first
press of Zoom Out will take it to 2MHz and the next press to 5MHz).
Page 15
Page 17
4.1.3 Start/Stop
Start
Stop
Set
Start
Set
Stop
Start=M1
Stop=M2
-more1 of 2
Fix
Start
Fix
Stop
Step
Down
Step
Up
-more2 of 2
Step
Size
Auto
Span/10
Set to
Mdelta
Set to
Centre
Set to
M1
Set
Step
Undo
controls the start and stop frequencies for the sweep. Als o s ets the annotation to
Start/Stop if it was previ ously Centre/Span. Creates a set of bottom-row function
keys as follows:
enables the start or stop frequency to be set to a specif i c value. The
method for setting these is s imilar to that for setting the Centre frequency
- see section 7.3 for an illustrated description of frequency setting.
sets the start frequency to the frequency of the M1 mark er and the stop frequency to
the frequency of the M2 m arker. M1 and M2 must both be active and M2 must be at
a higher frequency than M1.
reverts to the start and stop frequencies that existed directly before the
Start=M1/Stop=M2 key was pressed.
opens a second set of actions keys: Fix Start/Fix Stop and St ep Down/Step Up.
changes the action of the Step Up/Down keys so that only the stop
frequency or start fr equenc y respectively is changed by t he s tep value.
The fixed start or stop freque nc y is pr eceded by the word Fix. Pressing
the key again, or leaving this function-set (by pressing -more- 2 of 2 or any group or sub-group
key) will cancel the fixed s tart or stop frequency.
changes the start and/or stop frequencies by the value of the step size
(see next section). The action of the Fix Start/Fix Stop keys determines
whether both are stepped or only one is stepped.
Note that, if the start or stop f requency is “fixed” and the step size is s et to Auto, the step size
will change on each press of step up/down so that it is always equal t o one graticule division.
returns to the alternativ e s et of action keys for Start-Stop. Cancels the fixed start or
stop frequency if set.
4.1.4 Step Size
sets the size of frequency stepping using the Step Up/Down keys. When relevant,
the current step size is displayed within a green box above the keys. Creates a set
of bottom-row function keys as follows:
enables the step size to be set to a specific value. The met hod for setting the step
size is similar to that for setting the Centre frequency - s ee s ection 7.1 for an
illustrated description of frequency setting.
causes the step size to be automatically linked to the width of the span. Thus
Step/Up down will cause t he c entre frequency to change in st eps of one graticule
division. Auto step size is i ndic ated by the word Auto above the step size value.
sets the step size equal t o the frequency difference between the M1 and M2
markers (if active).
sets the step size equal t o ei ther the centre frequency or t o the frequency
of the M1 marker (if active). This can be useful for observing the
harmonics of a fundamental frequency.
Page 16
Page 18
4.1.5 Frequency Presets
Freq
Presets
Full
Span
Recall
Preset
Toggle
Last
Audio
Demod
Wavefm
Demod
Store
Preset
Exit
Z-Span
Demod
Type
Depth/
Dev.
enables up to six frequency ranges to be quickly stored and recalled. Only the
centre and span (or equivalent start and stop frequencies) are stored. This differs
from a Trace State or Set-up file for which more parameter s are stored (see sections
9.2.3 or 9.2.5 respectively). Frequency preset s ar e retained when the instrument is off.
Creates a set of bottom-ro w func tion keys as follows:
sets the sweep to the full range of the instrument (10MHz to 3.6GHz or 6.0GHz).
brings up a menu of six preset numbers (1 to 6) into which the current value of the
sweep frequency range can be stored. Existing values are o ver -written.
brings up a menu of six preset numbers (1 to 6) which recall previously stored
frequency ranges. Empty positions are ignored.
switches between the curr ent sweep frequency range and t he las t range to be
recalled from a preset (or from Full Span).
4.1.6 Sweep Time
The normal sweep time and update rate is automatical ly set from the Span and the RBW and is
displayed within the lo wer annotation area. Narrower RBW settings create longer sweep times.
For each RBW, the normal sweep time is broadly proportional to the frequency span. The
sweep time can be manually reduced at the expense of amplitude accuracy. See section 4.3.2.
4.2 Zero Span Mode (Demodulation Mode)
Zero span is a special case of frequency range setting. It is set from the Span sub-menu - see
section 4.1.2. Pressing Zero Span removes the normal sweep displa y and enables audio and
waveform demodulation of AM and FM signals.
Pressing Zero Span brings up an alternative set of function keys as follows:
creates sub-menu from which audio demodulation of AM and FM signals can be
controlled. See section 4.2.1.
only available if opti on U02 is i ns talled. Creates a sub-menu from which the
modulation waveform can be displayed and controlled. See s ec tion 4.2.2.
exits zero span mode and retur ns to a normal swept trace and the normal Span submenu key functions.
4.2.1 Audio Demodulation Sub Menu
The demodulated audio is routed to a built-in loudspeaker . Alternatively, the audio can be
outputted via a 3.5mm jack soc k et - see section 2.1.3.
selects the type of demodulation as AM or FM. Note that this select ion is al s o
applied to Waveform Demodulation.
enables the AM depth or FM deviat ion to be adjusted using Up/Down keys.
The range is 1.25%/div to 25%/div equivalent to +/-5% to +/-100% full scale (AM) or
0.25kHz/div to 250kHz/div equivalent to +/-1kHz to + /-1MHz full scale (FM).
Note that this selection is also applied to Waveform Demodulation
Page 17
Page 19

controls the volume i n 15 steps as shown on a bar graph. The audio can also be
Audio
Volume.
Display
Type
Depth/
Dev.
Time/
Div.
Trigger
muted and a hiss reducing filter applied.
Note that the RBW needs to be set appropriately for the m odulation. As a broad guide the
RBW should be set greater than the channel bandwidth. Ho wever, setting an excessively wi de
RBW will introduce unneces sary noise.
4.2.2 Waveform Demodulation Sub Menu (when fitted)
When option U02 is installed, the waveform of the modulat ion c an be displayed for AM or FM
signals. Alternatively the carrier level can be displayed against time. If option U02 is not
installed, only the carrier level is displayed.
selects the display to be either the modulation ( A M or FM) or the carrier. The carrier
display can be either the carrier le vel regularly sampled, or the carrier waveform
against a timebase.
Note that the selection of AM or FM is also applied to Audio Demodulation.
enables the AM depth or FM deviation to be adjusted using Up/Down keys.
The range is 1.25%/div to 25%/div equivalent to +/-5% to +/-100% full scale (AM) or
0.25kHz/div to 250kHz/div equivalent to +/-1kHz to + /-1MHz full scale (FM).
Note that this selection is also applied to Audio Dem odulation
sets the display timebas e within the range 5us/div to 20ms/div using Up/Down keys.
The timebase is used for A M, FM and Carrier Waveform display ty pes .
the modulation wavefor m can be triggered to create a stable dis play for a tone or
other repetitive wavef or m. The trigger level is shown by a blue line on the screen
that can be shifted up or down. When the mode is set to Auto, the waveform will
trigger at that level on the ris i ng or falling edge. In Free Run mode the trigger is ignored.
Note that the RBW needs to be set appropriately for the m odulation. As a broad guide the
RBW should be set greater than the channel bandwidth in order t o avoid waveform clipping.
Page 18
Page 20

4.3 Setting the Sweep Mode , Bandwidth (RBW / VBW) & Detector
RBW/
VBW
Sweep
Time
Sweep
Control
Sweep
Mode
Detector
Type
Sweep/
BW
RBW/
VBW
RBW
Auto
RBW
Set
Sweep
Time
VBW
Track
Auto
(Norm)
Track
Offset
Set
VBW
This menu group control s the sweep, the resolution bandwidth filters and the detector mode.
This enables the resolution bandwidth of the sweep fil ter and the subsequent video f il tering to
be controlled along with sweep time (normal or fast) and the type of sweep (repeat or single) . It
also provides control of the detector, and options for changing the image rejection method
(sweep mode). If option U02 is fitted, sweep triggering can also be controlled.
4.3.1 RBW / VBW
controls the resolution bandwidth of the sweep filt er prior to the detector (RBW) and
of the filter that fol lows the detector (VBW). A narrower RBW provides greater
frequency resolution and l ower noise, but increases the sweep time. A narrower
VBW similarly reduces noise but increases sweep tim e Creates a set of bottom-row function
keys as follows:
causes the RBW to be automat ic all y changed to suit the frequency span. The RBW
value is displayed at the top of the screen and is preceded by the word Auto.
cancels Auto mode and creates a pop-up menu from which a specific RBW value
can be selected. The range is 300Hz to 10MHz in a 1:3:10 sequence. The selected
value is displayed at the top of the screen.
causes the VBW to be automatically changed to track the RBW value subject to the
VBW offset. The VBW value is displayed at t he top of the screen and is preceded
by the word Trk.
cancels Track mode and creates a pop-up menu from which a specific VBW value
can be selected. The range is 300Hz to 10MHz in a 1:3:10 sequence. The selected
value is displayed at the top of the screen.
sets the relationship bet ween V BW and RBW for VBW Track mode. Positive
numbers set a VBW one or more steps higher while negative numbers set i t one or
more steps lower. The default is zero
4.3.2 Sweep Time (and the Sweep Progress Indicator Line)
The normal sweep time and update rate is automatically set from the Span and t he RBW and is
displayed within the lower annotation area. Narrower RBW settings create longer sweep times. For
each RBW, the normal sweep time is broadly proportional to the frequency span. The sweep time
can be manually reduced at the expense of amplitude accuracy.
enables the sweep to be speede d up at the expense of level accuracy. Creates a
set of bottom-row function keys as follows:
selects the normal sweep t ime and ensures the highest degree of level accuracy.
The sweep time is dependent upon the span and the RBW/VBW settings and is
displayed in seconds within the lower annotation area followed by [N].
Page 19
Page 21
enables the sweep time to be reduced in order to speed up the response
Manual
Down
Manual
Up
Sweep
Repeat
Single
Sweep
Trigger
Single
ReArm
Stopped
(Run)
Running
(Stop)
Stopped
(Single)
Scan
Mode
to changing events. Three levels of speed up are available indiciated by
[F1], [F2], [F3] replacing the [N] after the sweep tim e di s play. To warn
the user of reduced level measurement accuracy, a yellow bac k gr ound is applied. The
maximum levels of sweep time reduction are 2, 5 or 10 but the actual reductions are dependent
upon span and RBW/VBW settings – see section 7.5.4.
For sweep times longer than about 1 second, a yellow indicator l ine below the graticule
indicates the progress of the sweep – see section 4.5.2.
4.3.3 Sweep Control
controls how and when the sweep runs. Creates a set of bott om-row function keys
as follows:
causes the sweep to be automatically restarted aft er t he c ompletion of the previous
sweep unless halted by the Sweep Control key (or the S weep Tri gger s ettings).
enables single sweeps that are commenced by the S weep Contr ol key (or the
Sweep Trigger settings) .
Note that, whenever the sweep is stopped, whether in repeat or single mode, c hanging the
frequency span or the reference level will re-run the sweep once.
Sweep Trigger is only availabl e with the upgrade option U02 is fitted. It provides a
choice of how the sweep is star ted or stopped. The trigger source can be manual,
external, or internal f r om limit lines or patterns. See section 4.3.4.2 for an
explanation of trigger functions.
provides a choice of automatic or manual re-arming of t he tr igger when triggering is
enabled and the sweep m ode is set to Single.
When the menu system is set to Sweep/BW the sweep status is displayed in the lower
annotation area directly above the keys.
4.3.4 Scan Mode (when fitted)
when Option U02 is fitted, this key in the Sweep Control menu selects an entirely
different mode of operat i on. Scan Mode operation is explai ned in section 8.1.
4.3.4.1 Manually Controlling the Sw eep
The sweep can be started or stopped us ing the touch screen S weep Control key
directly under the gratic ule on the right hand side. This k ey changes c olour to
indicate the current stat e of the sweep. The action of the k ey is duplic ated by the
hard key marked Run/Stop.
When the sweep is running, the k ey is gr een and is marked Running (Stop). The word in
brackets indicates the action that will be performed by pressing the key.
When the sweep is stopped, and the sweep mode is Repeat, the key is blue and is
marked Stopped (Run). Stopping the sweep freezes the c urrent sweep trace on the
display so that it can be obser v ed.
When the sweep is stopped, and the sweep mode is Single, the ke y is blue and is
marked Stopped (Single) .
At other times, when the s weep is t emporarily halted by the system, the key
becomes red and is marked Paused. When sweep triggering is enabled (see next section) the
key can provide triggeri ng and arming functions which are indicated by other colours and
markings.
Page 20
Page 22

4.3.4.2 Triggered Sweep (when fitted)
Detector
Type
Default
(Positive)
Set
Detector
Sweep
Mode
Normal
Auto
Manual
Align
Reveal
Images
Advanced
Options
When upgrade option U02 is fitted, it is possible to trigger the sweep using an external or
internal trigger signal. Triggered sweep has a different action dependent upon t he sweep mode
(Single or Repeat).
If the sweep mode is set to Single, the effect of the trigger is t o start the sweep. When a trigger
event occurs a single sweep wil l be initiated. The trigger optio ns are None, Ext +ve (trigger
from a positive going edge on the external trigger input) or E xt -ve.
If Single ReArm is set to Auto, a sweep will be initiated ever y t ime a trigger event occurs. If
Single ReArm is set to Manual, further trigger inputs ar e ignored after the fir s t sweep. The
Sweep Control key turns yellow and is labelled Stopped (Arm). Pressing the key changes t he
labelling to Run on Trigger , and a further sweep will be initiated when a trigger event occurs.
If the sweep mode is set to Repeat, the effect of the trigger is to stop the sweep. The options
are Free Run (no triggering), Ext +ve (trigger from a pos itive going edge on the external trigger
input), Ext -ve, and Limit s (trigger from the Limits comparator - see section 7.10.2). The key
marking becomes Stop on Tr igger.
When a trigger occurs the current sweep will be com pleted after which the sweep control k ey
will become blue and the sweep will remain stopped until i t is restarted with the sweep control
key. There is no separate Arming function for repeat mode sweeps.
Sweep triggering is turn ed off whenever the sweep m ode is c hanged between Single and
Repeat or vice versa.
Note that, when a Logging f il e is ini tiated, triggered sweep is aut omatically cancelled and set to
Repeat mode and Free Run.
4.3.5 Sweep Mode
sets the sweep method used to reject signal images and minimise spurii. For a full
explanation see section 7.5.
selects the default mode whereby image rejection occurs automatically in real t ime.
Occasional interruptions of the sweep will take place as an alignment is run to
optimise the image rejection ratio.
only becomes operation al when the mode has been set to Normal (Manual) in
Advanced Options. Initiates an alignment procedur e to optimise the image rej ec tion
ratio.
turns off image rejection for a period of 1.5 seconds or one sweep, whichever is the
longer, thus enabling signal images to be seen.
creates a new sub menu from which additional sweep m ode options can be
selected. See section 7.5.2.
4.3.6 Detector Type
enables the type of signal detector to be changed. Creates a set of bottom-row
function keys as follows :
by default the analyzer uses a Positive Peak detector. This gives appropriate results
in the majority of sit uations.
creates a pop-up menu that enables alternatives to posit i ve pe ak to be selected.
These are Negative Peak, S ample, Linear or Log Average, Alter nate Peak or RMS.
See section 7.7 for a brief explanation of detector types.
Page 21
Page 23
4.4 Setting the Level Attenuator, Amplitude Scale, and Limits
Units/
Graticule
Ref
Level
Scale/
Shift
Offset/
Tables
Limits
Level/
Limits
Units/
Graticule
dBm
dBuV
Graticule
Ref
Level
Set
Ref
Set
Step
Ref
-
Ref
+
This menu group controls t he input attenuator, thus changing the reference level, and controls
the measurement units and s c aling of the amplitude displ ay. When option U02 is fit ted, it also
enables the sweep amplitude t o be c ompared with limit l ines or patterns and the use of level
offset and compensation tables.
4.4.1 Measurement Units and Graticule
sets the measurement units and controls t he graticule display. Creates a set of
bottom-row function keys as follows:
provides measurement in dBm (dB milliwatts into 50 Ohms, where 0dBm = 1mW)
and sets the graticule and graticule markings accordingly.
provides measurement in dBuV (dB micro volts across 50 O hms, where 0dBuV =
1uV) and sets the graticule and graticule markings acc or di ngly.
creates a pop-up menu enabling the Graticule to be dimmed, set to horizontal lines
only, or turned off completely.
Note that, when the measurement units are set to dBuV, the top graticule division is reduc ed to
7dB in order that subsequent graticule lines correspond t o whole decade values.
4.4.2 Reference Level
The reference level represents the maximum signal that can be displayed. The top line of the
graticule is at the ref er enc e l evel unless Scale/Shift is being used (see section 4.4.3).
The reference level is var iable between -40dBm (67dB) and + 20dB m (127dBuV) to a resoluti on
of 1dB. It’s current value is displayed in the top annotation ar ea.
the reference level for amplitude measurement can be set either numerically or by
increment/decrement keys:
opens a numeric keyboard from which the reference level can be set directly as a
numeric value in dBm or dBuV.
creates a pop-up menu from which the increment/decrem ent step size can be set as
1dB, 2dB or 5dB.
increments or decrements the reference level value b y t he s tep size set
with the Set Step key.
Page 22
Page 24
4.4.3 Vertical Scaling
Scale/
Shift
Scale
Shift
Down
Shift
Down
Offset/
Tables
Clear
All
Set
enables the vertical amplit ude s caling to be changed. Creates a set of bottom-row
function keys as follows :
creates a pop-up menu enabling the vertic al s caling to be set to 10dB/di v (t he
default) through to 1dB/ div.
For scales below 10dB/di v onl y a portion of the sweep ampli tude will be
visible and the Shift U p/Shift down keys can be used to pan the t r ace
through the amplitude range of the graticule. These ke ys auto-repeat.
4.4.4 Amplitude Offset and Compensation Tables (when fitted)
enables the amplitude scaling to be offset to match external attenuation or gain, or
to add frequency dependent amplitude compensation tables to match transducers or
antennae. These functions are only available when the upgrade option U02 is fitted
- see section 6. Creates a set of bottom-row function keys as follows:
cancels any offset or compensations that have been set and returns the amplitude
scaling to normal.
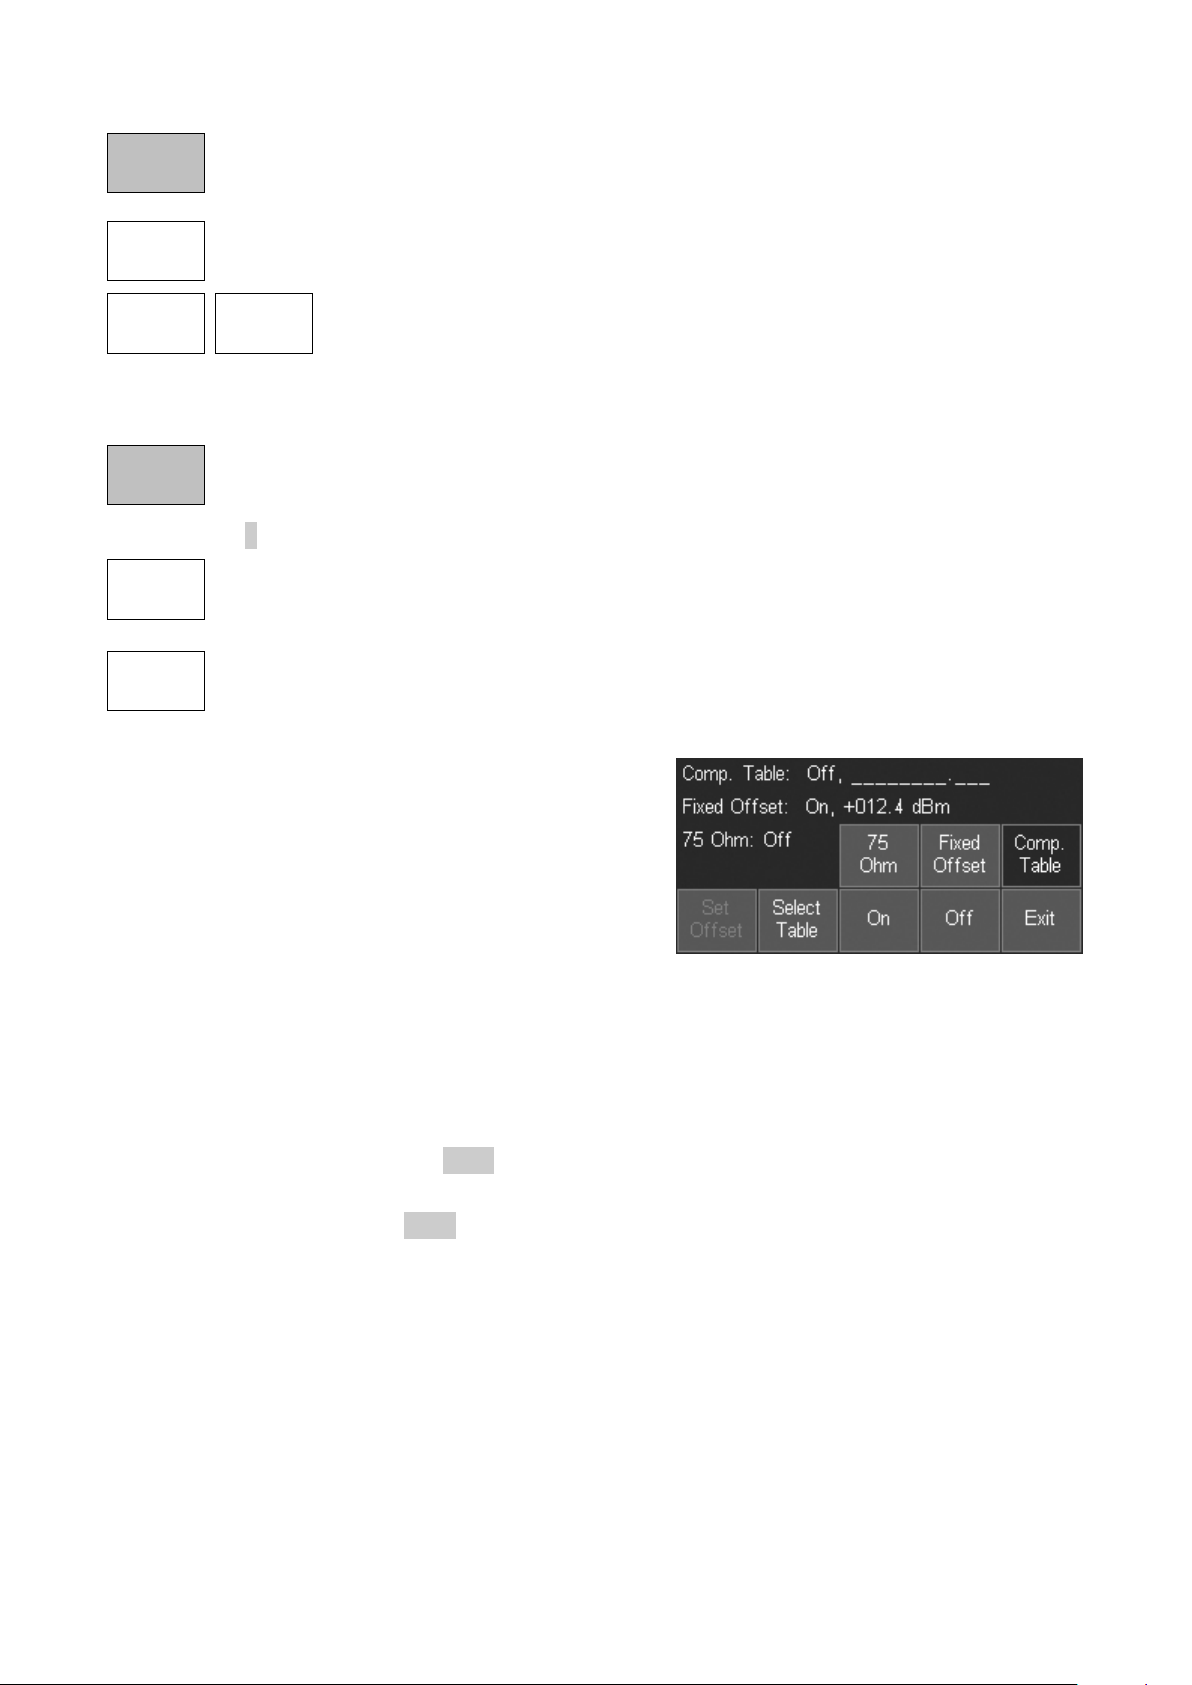
opens a control menu that enabl es compensation for a 75 Ohm s our c e impedance,
a fixed attenuation or gain, or a frequency dependent compensation table to be
used. The functions can be used individually or together.
The three keys on the upper line s elec t which function
is to be controlled.
For 75 Ohm source, the options ar e On or Off.
When set to On in firmware, V1.xx and V2.xx all
readout values are adjusted by +1.9dB to calibrate
back to a 50 Ohm system.
In firmware, V3.00 dBuV readout is adjusted by
+1.9dB and readout is unchanged to indicate values in a 75 Ohm system.
For Fixed Offset, the Set Offset key creates a dialogue box by which an offset can be set
between
-50.0dB and +50.0dB. The set f igure is added to the displayed ref erence level and to the
graticule values and marker readout.
For Compensation Table, the Select Table key opens a file list of stored compensation tabl es
that can be loaded. See section 7.9.2 for a full explanation.
Whenever offsets or com pens ations are active, a warning message is displayed at the top right
of the graticule. See sect ion 7.9.1 for safety warnings on the use of these function.
Page 23
Page 25

4.4.5 Amplitude Limits (when fitted)
Limits
Limit
Conditio
Limit
Action
Set
Limits
Limit
Condition
Limit
Action
Limit
Offset
Limit
Fix/Unfix
sets one or two horizontal lines or complex patterns that can be compared with the
sweep. This function is only available when the upgrade option U02 is fitted - see
section 6. Creates a set of bottom-row function keys as follows:
creates a control screen that enables the selection of lines and patterns, or allows
existing ones to be turned on or off. When Set Line is pressed, t he val ue can be
entered numerically in dBm or dBuV. When Select Patt er n i s pr essed, a Recall File
screen is opened enabling a pattern to be loaded from a file. See sec tion 7.10.1.
creates a pop-up menu that selects the criteria upon which a limit condit ion is
created. The options are None, A bove, Below, Outside or I ns ide.
creates a pop-up menu that selects an action t hat will be performed when the limit
condition occurs. The options are None, Beep, Pulse Out, or Beep + Pulse Out.
Note that other actions (sweep triggering or log file entry) can also be created f rom the limits
condition. Further information on the Limit s func tion is given in section 7.10.
creates a control screen from which a limit can be off s et f rom its initial values. This
is particularly useful for limit patterns which would otherwise have to be recreated.
See section 7.10.4 for more information.
enables a pattern that was cr eated for a particular centr e frequency (e.g. a
modulation channel width limit pattern) to be applied to a different centre f r equency.
Pressing the key fixes the patt er n relative to the screen and displays a message of
“Lim Fix” on the top RH side of the graticule. See section 7.10.5 for more information.
4.4.5.1 Channel Marker Files
A Channel Marker file is a special c as e of a Limit Pattern fil e which produces only vertical li nes
at frequencies defined within the file. See section 7.10.6
4.4.6 Overload Indication
Signal levels that are gr eater than the reference level c an not be displayed and may caus e
errors in the measurement.
Two types of overload indication are provided. Signals that c ause the trace to rise above the
reference level are indicated by a red arrow at the top of the graticule. Overload of the ADC is
indicated by a red background warning message below the graticule area. More inf ormation
about signal overload and measurement error is provided in s ec tion 7.1.
Page 24
Page 26

4.5 Controlling and Storing Traces and Images
Traces
Control
Trace
Mode
Trace
Stores
Marker
Setup
Marker
Control
Traces/
Markers
Traces
Control
View
View
Off/On
Swap
Ref.
Off/On
Live
Off/On
This menu group controls t he traces that appear on the screen (as well as the markers that are
used for measurement).
There are three traces: Live (gr een) , View (white) and Reference (purple). Only the Live trace
is updated from the sweep. The View trace is a temporary copy of the live trace created
whenever the View key is pressed. The reference trace is rec alled from a trace file stored
within the instrum ent. Trace files can be saved from either the live trace or the view trace.
Complete images of the scr een c an al s o be saved.
A further version of the Live tr ace is available when the Trace Mod e is set to Peak-hold or
Average – see section 4.5.3.1.
4.5.1 Displaying Traces; Controlling the View Trace
enables each of the three trace types to be turned on or off, cont rols the View trace,
and enables traces and scr een images to be stored and recalled. Creates a set of
bottom-row function keys as follows:
copies the current Live t r ac e to the View trace, and turns the View trace on if it was
off. The View trace sits behind the live trace and can therefore be partly obscured
. This key duplicates t he V i ew hard key.
by it
halts the live trace and swaps the order of the traces on t he screen. Thus the View
trace (white) sits in front of the halted live trace enabling it to be observed and
analyzed using the marker s . When the sweep is restarted with the Sweep Control
key, the traces are swapped back so that the Live trace sits in front again.
toggles the View trace off, or back on without creating a new View.
toggles the Reference trace on or off.
toggles the Live trace on or off. If dual trace mode is selected both traces will be
turned on or off.
4.5.1.1 Understanding the Live, View and Reference Traces
The instrument can display three traces - Live, View and Ref erence which can be turned on or
off individually using t he Show key. Only the Live trace is updated from the sweep.
Note that a further version of the live trace is available when the Trace Mode is set to Peak -hold
or Average, in which case up to four traces can be displayed – see section 4.5.3.1.
The Live trace is green and is normally on-top of the other traces. The Live trace can be
“frozen” at any time by pressing the Sweep Control key dir ec tly under the graticule (see section
2.4) or the hard key marked Run/S top. This also stops the sweep.
The Live trace can be duplicated to the View trace by pressing View. This enables an
“instance” of the sweep to be captured without stopping the sweep. The View trace is white
and is normally located behind the Live trace. The Vie w trace is r etained when the instrument
is turned off.
Page 25
Page 27

The measurement markers normally operate on the Live trace. However, the Live and View
Trace
Mode
Normal
Peak
Hold
Average
Reset
-more1 of 2
Single
Trace
Dual
Trace
traces can be “swapped” by pressing the Swap k ey. This stops the sweep and causes the View
trace to be placed in front of the Live trace. When the traces are swapped, the measurement
markers operate on the View trace.
When the sweep is re-started (or the Swap key pressed again), the View and Live traces are
swapped back.
Either the Live trace or the Vie w tr ac e c an be saved to a trace file (s ee section 5.1).
The Reference trace is purple a nd is always underneath the other traces if they are on. The
reference trace is cr eated by recalling a trace file from the memory. Measurement mar k ers
cannot be used on a Ref er enc e trace.
Note that the View and Reference traces relate to the fr equency span, RBW and level settings
that existed when they were st or ed. Changing these parameters will result in the graticule
values and annotations no long er being correct for these traces.
However, it is possible to recall a Reference trace along with its State. This restores the
frequency span, RBW and level set tings that existed when it was stored (see section 5.1).
4.5.2 Sweep Progress Indicator Line
There are two modes by which t he live trace is updated from the sweep. For sweep times
below approximately 1 second, the trace is updated at t he end of the sweep. For longer sweep
times, the trace is updated cont inuously while the s weep is t aking place.
In this latter mode a yello w line a ppear s at the bottom of the graticule indicating the progress of
the sweep through its span.
4.5.3 Setting the Trace Writing Mode
provides control of the way i n which the sweep is written to the Live trace. Creates
a set of bottom-row function keys as follows:
each frequency point of the trace is written with the amplitude obtained from the
current sweep.
the trace is written with the highes t amplitude value found for each frequency point
since the sweep mode was selected and s wee ping c ommenced.
the trace is written with the average amplitude value over a number of sweeps.
operates in both Averag e and P eak hold modes and re-starts the averaging or peak
hold process from zero.
opens a second set of action keys which are onl y act ive when either Peak Hold or
Average have been selected, as detailed below:
this is the default mode in which the “proces sed” trace (Peak Hold or Average) is
displayed in place of the Normal trac e.
enables the Normal trace and the “ processed” trace (Peak Hold or Average) to be
displayed simultaneously – see section 4.5.3.1. The default is for the Normal t race
to be displayed in front of the “processed” trace.
Page 26
Page 28

swaps the traces so that the “processed” trace is in front of the Normal trace – see
Average
Number
Trace
Stores
Store
Recall
Swap
Traces
-more2 of 2
section 4.5.3.1.
creates a pop-up menu that enables the number of sweeps averaged t o be set
between 2 and 48
.
returns to the first set of actions keys as detailed above.
4.5.3.1 Dual Trace Mode
When the trace writing m ode i s s et to Peak Hold or Average, a dual trac e mode can be selected
whereby the processed and un-processed traces are displ ayed simultaneously.
When first selected, the processed trace (Peak Hold or Average) will be shown in yellow with
the un-processed (Normal) trace shown in green in fr ont of it. Pressing Swap Traces change s
this so that the processed trace is shown in green with the un-processed trace in yellow.
The green trace is always at the front and represents the true live trace. The yellow trace is
updated only at the end of eac h sweep which can result in it lagging the green trace.
Markers operate only on the gr een trace. Store functions (Store Trace and Log Trace) operate
only on the green trace.
4.5.4 Storing and Recalling Traces and Screen Images
Traces or complete Sc reen Images can be stored as fi les under automatically
incrementing names or user assigned names. Creates a set of bottom-row function
keys as follows:
enables the Live trace, the View trace, or a complete screen image, to be saved as
a file. See section 5.1 for a full des c ription of the Store func tion.
enables a stored trace to be r ec alled to the Reference trace on t he s creen. The Ref
trace is purple and is always behind both the Live trace and the View trace. Recall
also enables stored scr een images to be viewed. See section 5.2 for a full
description of the Recall function.
Page 27
Page 29

4.6 Using Measurement Markers
Marker
Setup
Function
Fix /
Unfix M1
Move M2
to M1
Units
Select
Traces/
Markers
Traces
Control
Trace
Mode
Trace
Stores
Marker
Setup
Marker
Control
This menu group controls t he markers that are used for meas ur ement (as well as the traces
that appear on the screen).
There are two markers M1 and M2 whic h provide a readout of am plitude at any frequency point
on the trace. M2 can only be on if M1 is on, and the frequency difference between the two is
also shown. Markers can be set t o automatically find peaks, or track the largest peak.
4.6.1 Setting-up Markers
controls the visibility of the markers, their function, and their measurement units.
Creates a set of bottom-ro w func tion keys as follows:
creates a pop-up menu that enables the markers, M1 and M2, the be turned on or
off. Note that M2 can only be on if M1 is als o on.
creates a pop-up menu that enables the marker measurement units to be set.
Graticule Units provides l ogar ithmic measurem ents in dBm or dBuV (as set within
the Level/Limits > Units/Graticule menu). uW (micro watts) or mV (millivolts)
changes the marker measurement to the appropriate lin ear scaling.
creates a pop-up menu with a choice of Scroll, Peak Find, or Peak Track modes. In
Scroll mode a single press of the Move Left/Right keys cause the s elected marker to
move in one pixel steps (i.e. a frequency step of span/270), whilst holding a key
down auto-repeats in larger s teps.
In Peak Find mode the Move Left/Right keys cause the selected marker to jump to the next
peak of the trace in that direc tion. In Peak Track mode, the marker will attempt to maintain i ts
position on the highest peak of the trace even when the peak frequency is changing (see
section 4.6.2.2 for a fuller explanation of Peak Find/Track modes).
The current mode of a mar k er is shown on the left hand side of the marker read out. Two
horizontal arrows indicate scroll mode whereas an upwards vertical arrow indicates peak-find
mode. An upward arrow follo wed by a small T indicates peak-track mode.
A frequency counter can be sel ec ted to operate at the active marker point c aus ing a short
pause as the measurement tak es place. This can be turned on or off from the Function key
pop-up. The counter resoluti on is set from Setup/Funct ions>Freq. Counter, see s ec tion 4.7.3.
fixes the amplitude reading of the M1 marker so that it no longer follows level
changes from the sweep. The marker readout is preceded with the word “Fix”.
Pressing it again, or pressing either marker “move” keys, restores normal operation.
moves the M2 marker to the frequency position of the M1 m arker (also turns M2 on
if it was off). This is intended for use with the Fix M1 function to enable amplitude
changes at a specific freque nc y to be monitored.
Page 28
Page 30

4.6.2 Controlling Markers
Marker
Control
Move
Left
M1/M2
Active
Move
Right
Marker
>Centre
Manual
Set
controls the frequency position of the markers. Creates a set of bottom-row function
keys as follows:
selects which marker is contr ol led by the marker movement keys. The active
marker is indicated by an arr ow (>) in front of its readout.
enables the frequency position of the active marker t o be s et numerically using
similar frequency entry screens as for Set Centre (see sec tion 4.1.1). Note that the
marker position can be set outside of the current span and therefore off the screen.
moves the active mark er to the sweep centre frequency (i.e. t he c entre of the trace).
This is particularly useful if the active marker i s off the screen.
moves the active mark er left or right either in frequency steps or from
peak to peak of the trace depending on the Marker Mode (Scroll or P eak
Find). In Scroll mode, a single press moves one pixel on the displa y and
holding the key down causes it to move continuously in steps of about ten pixels.
4.6.2.1 Controlling Markers with the Hard Keys
The normal function of the five “navigator” hard keys in the
centre of the instrument is to control the markers. This allo ws
control at all times witho ut the need to select the Marker Set up
or Marker Control sub-group menus.
When the navigator keys ar e in this mode, the round key
marked Control Markers i s ill uminated. If not, pressing the
key will restore this m ode. Pressing the key repeatedly cycles
through selection of the visible markers (Both Off > M1 O nly >
M1 and M2 > Both Off).
Pressing the centre button on the navigator toggles the active marker between M1 and M2, or
turns M2 on if it is off. Pressing the Up key selects Peak Find function, while pressing the Down
key select Scroll func tion. Whenever the Up key is pressed, the selected marker will jump to
the highest peak.
The Left and Right keys m ove the ac tive marker left or right either in screen resolution steps or
from peak to peak of the trace depending on the function.
Whenever the navigator mode is changed, an information box appears. This alert c an be
turned off if preferred - see section 4.9.3.3.
4.6.2.2 Further Notes on the Use of Markers
Function = Peak Find
Peak Find mode is selected f r om Marker Setup > Function or from the Navigate Up hard key,
and is indicated by an upwards arr ow on the left hand side of the marker readout. The mode is
selected for the mark er that i s c urrently active.
Pressing the Navigate Up hard key places the currently selec ted marker on the largest peak of
the trace.
Pressing the Move Left/Right keys will cause the instr ument to attempt to position the marker
on the next peak of the trace in t hat direction. The peak-find algorithm may sometimes place
the marker on the rising or falling edge of a peak and its performance will depend upon signal
and noise levels.
Function = Scroll
Scroll mode is selected from Marker Setup > Function or from the Navigate Down hard key, and
is indicated by two horizontal arrows on the left hand side of the marker readout. The mode is
selected for the mark er that i s c urrently active.
Page 29
Page 31

Function = Peak Track
Peak Track mode can only be selected for M1. It is selected from Mark er S etup > Function, and
is indicated by an upwards arr ow followed by a capital T on the left hand side of the marker
readout.
When selected the marker will attempt to track the highest peak of the live trace.
Marker Frequency Preci sion
The frequency position of a marker is always shown to a resolution of 0.0001MHz (100Hz).
However, the actual posit ion of the marker is a function of the span. If, for example, the span is
set to 50MHz, each frequency poi nt on the trace represents a “buck et” of frequencies 185kHz
wide (span/270).
If the marker is set using the Move Left/Right keys, it will give a frequency readout equ al to the
upper frequency of the bucket. If the marker is set num er i c ally t o a s pecific frequency using
Manual Set, the marker positi on on screen will jump to the upper frequency of the bucket that
contains that numer ical value.
If the span is reduced, the accuracy of the marker frequenc y readout improves. However, it is
only when the span is reduced to 27kHz that the marker frequenc y position becomes accurate
to 100Hz.
The Frequency Counter function can be used to measure the carrier signal frequency at t he
marker point precisely.
“Off Screen” Markers
Markers are positioned by absolut e frequency. Consequently, when the frequency span of the
sweep is changed, the marker may no longer appear within the trace area. This is indicated by
an arrow within the marker r eadout replacing the amplitude value.
The frequency position of the marker is retained, but no amplitude information is available. If
the frequency span is subsequently changed to include t he marker frequency, it will reappear in
the correct position.
Pressing the Navigate Up hard key (Peak Find mode) will brin g the marker on screen at the
highest level in the trace.
Re-positioning a marker using the Move Left/Right keys will c aus e it to reappear imm ediately
from the appropriate side of the graticule. Alternativ ely pressing Marker>Centre in the Marker
Control sub-group menu will caus e it to appear in the centre of the screen.
Marker Mode Symbols
Marker Difference Readout
If both markers are tur ned on, t he di fference in frequency and level is shown in grey underneath
as Mdelta. The readout represents the M2 values minus the M1 values (M2 - M1).
Page 30
Page 32

Logging
Auto
Measure
Freq.
Counter
Setups
System/
File Ops
Setup/
Functions
Logging
Timer
Setup
Log
Type
Log
Trigger
Logging
Control
Auto
Measure
Measure
Type
On/
Off
Mode
Set Chn
B/W
Set %
Power
4.7 Instrument Setups and Additional Functions
This menu group controls logging and automatic measurement functions when fitted (see
section 6). It also controls store/recall of instrument set-ups and access to system functions and
file operations, which are covered in the following section - section 4.8.
4.7.1 The Data Logging Function (when fitted)
Logging is only availabl e when the upgrade option U02 is fitted. Logging enables
files containing mult iple traces, screen images or peak values to be created in
response to trigger event s or a timer. Creates a set of bottom-row function keys as
follows:
creates a pop-up menu that enables the type of log file to be select ed. Centre
Amplitude logs only the amplitude at the centre frequency. Peak Value logs the
frequency and amplitude of the highest peak in every sweep. Trace logs the whole
trace. Screen Image logs the whole screen as a bit-map image.
creates a pop-up menu that enables selection of the trigger event that will cause
each logging entry. The options ar e Manual, Timer, Ext + ve, E xt -ve, Limits and
Continuous.
enables the time interval between logging events to be set. The timer value is only
used when the log trigger is s et to Timer.
opens a new control menu from which the logging function to be controlled
(see section 7.11.1).
For a more detailed descript i on of the Logging function see secti on 7.11 .
4.7.2 Automatic Measurements (when fitted)
Automatic measurements are only available when the upgrade option U02 is fitted.
Measurements of Channel Power (CP), Adjacent Channel Power Ratio (ACPR) and
Occupied Bandwidth (OBW) are available.
turns the measurement function (as selected with the Measure Type key) On or Off.
When turned On, the markers are disabled and the m eas ur ement results are
displayed within the marker readout area.
creates a pop-up menu that enables selection both the measurement mode (single
or continuous) and the displa y mode (Results or Setup)
.
creates a pop-up menu from which the three measurement types can b e selected.
Set Channel B/W appears for measure types of CP and ACPR.
Set % of Power appears for measure type OBW. Opens a numeric entry
screen enabling the channel bandwidth to be enter ed i n MH z or the % of
total power to be entered in %.
Page 31
Page 33

only appears for ACPR measurement type. Opens a numeric entry screen enabling
Freq.
Counter
Toggle
On/Off
Set
Resolutn
Set Chn
Spacing
the channel spacing to be ent ered in MHz.
Note the Span and associated RBW/VBW are not set by the Automatic Measurement function,
but must be set manually to an appropriate value. For further information about the Automatic
Measurements function see section 7.12.
4.7.3 Frequency Counter Options
A frequency counter can be sel ec ted to operate at the active marker point causing a
short pause as the measurement takes place. The counter provides much higher
accuracy than the marker readout since the latter is related to the span (accuracy =
span/270).
turns the counter function on or off. Note that the counter can also be turned on or
off from the Marker Function key pop-up – see section 4.6.1.
enables the resolution o f the counter to be set to 1kHz, 100Hz or 10Hz.. The
measurement time is approximately 200ms for 1kHz resolution, 210ms for 100Hz
resolution, and 300ms for 10Hz resolution.
Frequency measurem ent is performed at the active m arker frequency at the end of the sweep.
Note that the counter requires a s ignal to be continuously present at the marker point during the
period when the measurement is made. Modulation and other s ignal disturbances will caus e
the counter reading to jitter.
Page 32
Page 34

4.8 Storing and Reca lling Set-ups | System Settings
Logging
Auto
Measure
Freq.
Counter
Setups
System/
File Ops
Setup/
Functions
Setups
Store
Setup
Recall
Setup
Load
Defaults
System/
File Ops
Display
Darker
Display
Brighter
System
Utilities
File Ops
Presets
This menu group controls storing and recalling complete instrument set-ups, and acces s to
system functions such as s creen brightness and file oper ations (as well logging when fitted see section 4.7.1).
4.8.1 Storing and Recalling Instrument Setups
enables the complete set up of the instrument to be stored and rec alled via user
nameable files. See section 9.2.5 for an explanation of setup files. Creates a set of
bottom-row function keys as follows:
opens the Presets menu, dupli c ating the action of the P R E S E T hard key
(see section 4.10).
opens the store and recall cont r ol screens for setup files. See sections
5.3 for a description of the store screens, and section 5.4 for a
description of the recall s c reen.
loads the factory default setup, thus restoring t he i ns trument status to its original ex-
factory settings – see section 18. No user-created files are modified or deleted.
4.8.2 System Settings, Screen Brightness, Filing System and USB Operations
provides access to some system and file management opt ions, including screen
brightness and file transfer via USB. Creates a set of bottom-row function keys as
follows:
opens the System Utilities special menu,
which is also available via the Status/Help
hard key (see section 4.9)
enables file management in terms of
renaming, deleting and copying of files to
or from a Flash Memory Drive or a PC
using the USB link (see sect ion 5.6).
changes the screen brightness and provides a bar graph showing the
current brightness level.
Page 33
Page 35

4.9 Status Infor mation | On-screen Help | System Utilities
Context
Help
System
Utilities
Bright
Calibrate
Screen
Screen
Topics
List
View
On PC
This menu group is accessed using the hard key marked ST A TUS/Help or by the soft key
Setup/Functions > System/File-Ops > System Utilities. When the key is pressed, the normal
key menu is replaced by a special menu as shown
opposite.
4.9.1 Status Display
When the Status/System key is selected, the top part
of the screen is replaced by a detailed listing of the
current instrument s etup conditions.
The status information is s pl it over four pages. Press
Status again to access the next page or press Exit to
return to normal operation and restore the menu
group and sub-group that were in place when the
Status hard key was pressed.
4.9.2 Help Screens
Help information is availabl e from the same menu
system as is status, by pressing the Context Help or
Topic List keys.
brings up a help screen rele vant to the
menu sub-group that was in use prior to
the Status/Help key being pressed.
Context Help may cover several pages, these are
selected with the Next/Pr ev Page keys.
brings up a topics list from which all of the individual help screens can be selected.
Select the required menu sub-group using Move Up/Down an d c onfirm with Select
Topic.
Pressing Exit when displaying a Help screen returns the analyzer to normal operation.
4.9.3 System Utilities
Pressing Setup/Functions > System/File-Ops > System Utilities, or the Status har d
key followed by Status/Syst em brings up a sub-group menu as follows:
4.9.3.1 Screen Utilities
enables aspects of the TFT color screen to be adjusted. Creates a set of bottom-
row function keys as f ollows:
opens a calibration screen for the touch screen. (The touch screen is a resistive
layer which overlays the TFT screen. From time to time it may be necessar y to re-
calibrate the positiona l ac c uracy of the system).
Calibration must be done using a s tylus, and the centre of the “ bull s ey e” must be touched
accurately in each of thr ee pos itions. To abort the calibration, press the Exit har d k ey.
View on PC is only available with the upgrade option U02 is fitted. It places the
instrument into a special mode in which the graphics of the display are sent to a PC
via USB. See section 17 (Appendix A).
Level**
screen.
opens an information box expl aining where the screen brightness controls are
located (Setup/Functions > System/File Ops). This is because screen brightness
should be adjusted with the trace and graticule displayed rather than the status
Page 34
Page 36

4.9.3.2 Power Options, Power-on State, Clock Setting
Pwr-On
State
Auto
Off
Power/
Clock
Set Date
& Time
Alerts
System
Update
Update
Firmware
Navig.
Prompt
Calibrate
Hardware
Install
Options
Beep
enables aspects of the po wer on-off system to be set, along with t he real-time clock.
Creates a set of bottom-ro w func tion keys as follows:
opens a dialogue box from which t he date and time can be set for t he real-time
clock. Times are in 24 hour format and dates are day-month-year.
creates a pop-up menu that enables the instrument to be automatically turned off
after a period of inactivity. Options are Never and 5 mins to 60 mins. Auto Off
ceases to operate when t he i ns trument is externally power ed.
creates a pop-up menu that enables the condition of the instrument at switch-on to
be set. Options are Last Us ed ( r estore the settings that existed at switch off), or
User Preset (over-ride previous settings with tho s e defined in the User Preset - see
section 4.10.1).
4.9.3.3 Alerts
enables certain elements of the user interface to be turned on or off. Creates a set
of bottom-row function keys as follows:
creates a pop-up menu that enables the warning beep to be turned on or off. Beeps
are created in response to illegal operations such as setting an out-of-range value
creates a pop-up menu that enables the information boxes that c onfirm and explain
the current mode of the na vigat or keys (control mar k er s or navigate touch screen) to
be turned on or off.
4.9.3.4 System Updating and Calibration
enables updating of t he instrument firmware or recalibration of the instrument.
Creates a set of bottom-ro w func tion keys as follows:
opens a dialogue box which enabl es the instrument to be recalibrated.
Recalibration should only be performed by skilled personnel with access to precision
equipment and in conjunct i on with the Service Guide.
enables firmware-based options to be installed. S ee s ec tion 11.1.
enables firmware updates to be installed. See section 11.1 .
Page 35
Page 37

4.10 Using Instrume nt Presets | Automatic Setting
Standard
Preset
User
Preset
Auto
Set
Recall
Setup
Restore
Previous
Standard
Preset
Auto
Set
Recall
Setup
Restore
Previous
Execute
User
Preset
Exit
Presets
Help
Custom
Presets
This special menu is accessed using the hard key marked PRESET (Presets/Auto). Its function
is to enable the overall setup of the instrument to be changed quickly to suit specific
requirements.
sets the frequency, level and sweep p ar ameters back to known state and cancels
the more complex funct ions of the instrument (see section 10.2).
sets the frequency, level and sweep parameters back t o defined state as set by the
user. It is initially identi c al to the Standard Preset, but c an be modified by the user
to match their specific preferences - see section 4.10.1.
performs a maximum-span sweep at the widest RBW and then sets the centre
frequency, span, RBW and Level t o c reate a useful display of the highest amplitude
point found within the initial sweep. The Auto Set func tion takes several seconds to
complete.
goes directly to the Recall S etup control screen f r om which any setup file can be
recalled.
restores the setup to its condition at the point that the P resets hard key was
pressed.
executes the operation selec ted by any of the above keys.
this is only available wh en the upgrade option U02 is fitted. Custom Presets
enables multiple presets to be saved/recalled just by entering a number.
creates a Help screen specific to the Presets function.
restores the menu and sub-group menu that were in place when the Presets hard
key was pressed.
4.10.1 The User Preset
The User Preset is a user-modified version of the Standard Preset. To change the action of the
user preset, set up the spectr um analyzer as required and select Save Current from the User
Preset function keys. The parameters as described in section 10.2 will be overwritten by their
current values.
If preferred, the User P reset can be loaded whenever the instrument is switched back on fr om
off - see section 4.9.3.2.
4.10.2 Custom Presets (when fitted)
Custom Presets is only available when Option U02 is fitted. It enables multiple presets to be
saved/recalled just by e ntering a number. See section 7.3.5.
Page 36
Page 38

5 File Storage for Traces, Screen Images & Set-ups
Quick
Save
Save
As
The instrument incorpor ates a large Flash based disk drive for the storage of a variety of
different file types including Traces, Screen Images and Instrument Set-ups . When the
upgrade pack (U02) is fitt ed i t may also include Logging Files, Limit Pattern Tables and
Amplitude Compensation Tables.
The instrument filing s ystem provides a consistent m ethod for storing, recalling, renaming,
deleting and copying files. Files can be transferred to and from a personal computer for
backup, analysis, print ing and documentation purposes.
Whenever files are being ac c essed, the front panel LED marked Disk flashes. Depending upon
the file operation in progr es s, there may be a significant delay before further key operations are
possible.
5.1 Storing Traces or Screens
Storing of Traces or Screen Images is
controlled from the menu function:
Traces/Markers > Traces/Stores > Store. (as
described in section 4.5.4)
This function enables a tr ac e or screen image to be
stored as a file within the internal memory. (N.B.
external memory cannot be us ed to store files
directly, although files can be copied to
external
memory later).
The menu keys are replaced b y a cont rol
screen as shown.
The top row of keys sets what will be s tored: the
Live Trace, the View Trace, or a S c reen
Image. The currently selected file type is
shown in the green box above the keys.
See section 9.2 for an explanation of Trace files and Screen Image files.
There are two methods for savin g to a file: Quick Save and Save As.
stores the trace or scr een under a n automatically incrementing name (e.g.
TRACE001 etc.) as set by the Default name as described below in section 5.1.1.1.
The key can be pressed repeatedly to store traces/images as they appear. The next
name that will be used is shown in yellow within the area above the k eys.
halts the trace update (causing the
sweep status key to go to Pause) and
enters the next screen as shown.
The auto-allocated file name is shown (based
upon the current default f i le name), and
pressing Save will store the file under t hat
name. However, the option als o exist to
change the name before saving.
Pressing Change Name brings up an alphanumeric keypad which can be used to enter any
name of up to eight characters that the user may
choose.
See section 5.6.1.
Pressing Save completes the storing of the file under the chos en name.
The default name can also be changed by pressing
Change Default. Any name of up to five characters can be used - see section 5.1.1.1 below.
Page 37
Page 39

It is also possible to delet e or rename files from this scr een by pressing File Utilities - see
section 5.5.
5.1.1.1 Default File Name Rules
Default names are al ways five characters long, but the user can choose to enter less t han
five characters and the system will add the appropriate number of underscores at the end.
The five characters are followed by a three digit num ber that starts at 001 and autoincrements up to 999.
Deleting files will have no effect on the increment system so that, if the user had created
fifteen files and then deleted them all, the next file saved would still have the number 016.
Should the number reach 999, the auto increment will star t again at 001. If this file alread y
exists, the user will be prompted to delete or rename files or to change the default name.
If the user needs to check t he l is t of existing stored files, or to rename or delete files, this can be
done by pressing File Utilities - see section 5.5.
5.2 Recalling Traces and Images
The Recall function from the Traces/Stores sub-group
menu (see section 4.5.4) cr eates a control screen as
shown.
The top line of keys enable the s elec tion of the type
of file to be recalled.
Trace files can be recalled in three different ways,
Trace & State, Trace Only, or State Only
See section 9.2.3 for an explanat ion.
Screen images can also be rec alled from this screen. A recalled s creen image overwrites the
existing graticule and annotation area. Recalling an image takes around three seconds, with
the image building from the bottom upwards.
Pressing Recall File opens a file list which can show any of the currentl y st ored files of the
selected type. See section 5.4 for an explanation of the File Recall screen.
Pressing Recall Next or Recall Prev. recalls the next or previous file in the list without the need
to re-enter the File Recall scr een. This is particularly useful when searching through stored
screen images.
5.2.1 Traces and States
A trace file represents the swept trace as it appears upon the screen along with information that
defines the frequency span, R BW, VBW and reference level at the time that it was stored. The
latter information is r eferred to as the State.
When a trace file is recalled, the user can choose to recall the whole file (Recall Trace & State),
the trace amplitude values only (Recall Trace) or the State values only (Recall Stat e).
Whenever the State is recalled, the spectrum analyser set-up is changed to match t he
parameters within the rec all ed file.
Page 38
Page 40

5.3 Storing Instrument Set-up Files
Storing of Instrument Set-ups is controlled from the
menu function:
Setup/Functions > Setups > Store Setup.
(as described in section 4.8.1)
This function enables a complete instrument set-up to
be stored as a file within the internal memory. (N.B.
external memory cannot be us ed to store files
directly, although files can be copied to external
memory later).
The menu keys are replaced b y a cont rol screen as
shown.
The auto-allocated file name is shown (based upon
the current default f i le name), and pressing Save will
store the file under that name. However, the option also e xist to change the name before
saving.
Pressing Change Name brings up an alpha-n umeric keypad (see illust r ation in section 5.6.1)
which can be used to enter any name of up to eight characters that the user may choose.
In the event that a file with that name already exists, a warning message will be displayed.
The default name can also be changed by pressing Change Default. Any name of up to five
characters can be used - see s ection 5.1.1.1
It is also possible to delet e or rename files from this scr een by pressing File Utilities - see
section 5.5.
5.4 File Recall Screen
The recall screen for any file type uses the whole of
the display area in order t o inc l ude a file list. The list
consists of the file name (without its extension) t he
date of storage (in format dd/mm/yy) and the time of
storage (in 24 hour format hh:mm). A moveable
pointer operated by the Up and Down keys shows
which file is to be executed.
The keys that control the file selection are in a vertical
list on the right hand side.
One screen can show 20 fil es s imultaneously.
Pressing Page Up or Page Down scrolls t hr ough the
files in blocks of twenty.
By default, files appear within the list in date/time
order with the oldest files at the top.
Pressing All Files returns to this listing type at any
time.
Pressing Latest Files will show a screen of up to 20
files that represent the most recently stored or
recalled files.
Files can also be found from their starting character
using File A-Z.
Pressing Find A-Z brings up an alpha numeric
keyboard. When a charact er is pressed the keypad
disappears and the listing then shows only files that start with that character.
Pressing Recall executes the file operat ion.
It is also possible to delet e or rename files from this scr een by pressing File Utilities - see
section 5.5.
Page 39
Page 41

5.5 File Utilities Screen
Store and Recall screens inc l ude a File Utilities key
which enables files to be renamed or deleted.
The layout is similar t o a File Recall screen - see
section 5.4 .
Pressing Rename brings up the alpha-numeric keypad
from which the file name can be chang ed.
See section 5.6.1 for an explanat ion of file renaming.
Pressing Delete asks for confirmation before
permanently deleting the selected file.
5.6 File Operations S creen
The File Operations screen is an extended version of
the File Utilities screen provided for Store and Recall.
It can be used for all types of file, supports external
Flash memory drives, and also pr ovides access for t he
“Link to PC” USB connection.
File Operations is selected from the Setup/Functions
menu:
Setup/Functions > System/FileOps > File Ops.
The upper row of keys enables t he file type to be
selected (Traces, Im ages , Setups etc.).
The upper section of the screen s hows a file list for the
selected file type, and is s imilar to the File Utilities
screen except that the options of Latest Files and Find
A-Z are not available.
The lower row of keys provides further options and
actions.
Pressing Switch Drive enables the fi les present on an
external USB Flash drive to be listed in place of the
internal drive. If no exter nal drive is connected, the
key will have no effect.
Pressing the key repeatedly alternates between the
two drives. The currently selec ted drive is displayed
within the green box.
Page 40
Page 42

On the first occasion that the external drive is accessed there will be a delay and a warning
message will be displayed - see section 9.1.2.
Pressing Link to PC causes all spectrum analy zer
operation to be suspended and e nables a connection
to be made to a personal computer.
See section 9.1.3 for a detailed explanation.
Pressing File Actions changes the scr een to provide
options of Rename, Delete or Copy.
Rename and Delete operate in a similar way as for the File Utili ties screen - see section 5.5.
The Copy function copies a f ile from the currently
selected drive. Files can therefore be copied from the
internal drive to the exte r nal drive or vice versa by
using Switch Drive on the previous screen.
It is also possible to copy all files of the selected file
type by using Copy All.
5.6.1 Editing File Names
Editing a file name (Store File screen) or renaming a
file (File Utilities or File Ops screens) uses an alpha
numeric key matrix. The matrix replaces the upper
screen area.
The whole of the required name must be entered. It is
not possible to edit an existin g name character by
character.
The new name appears at the bottom of the screen
replacing the eight tri angles shown in the illustration.
Names can be from one to eight c har acters long and
can include upper case lett er s , numbers, dash (-), and
underscore ( _ ).
Corrections can be made during e ntry using the backspace key.
In the event that a file with that name already exists, a
warning message will be displ ayed.
Pressing Save applies the new name and returns to
the previous screen.
Pressing Back returns to the previous screen w ithout
applying the new name.
Pressing Exit leaves the selected filing system function
immediately.
Page 41
Page 43

5.6.2 File Names Created or Renamed Externally
Files may be cr eated externally or created within the instrument and renamed externally (e.g.
using Link to PC mode). Such files may have long file names and/or include lower case
characters and additional c har acters such as ?.
The instrument will correctly list all such files t hat conform with an 8.3 naming s yst em and which
have the correct extension for the relevant folder. Where the file name exceeds eight
characters, it will truncate the file name using a ~1 convention.
Files with the wrong extension, or which have been placed in the wrong folder will not be visible
to the instrument filing system. See section 9.2 for a description of file types and their file
extensions.
Page 42
Page 44

6 Upgrade Option U02
The capabilities of the instrument can be enhanced by installing the upgrade option U02 which
adds additional firmware to the instrument.
Option U02 can be downloa ded from the Aim-TTi website and can be installed by the user
without any requirement to return the instrument to its supplier. Activation of the upgrade is
achieved via an activati on c ode which can be purchased from Aim-TTi, or from our dis tributors
and agents across the world.
6.1 Additional Functions from Option U02
Installing Option U02 provides the additional functions listed below. Further functions may have
been added since this m anual was written - see the Aim -TTi website for up to date information.
6.1.1 Scan Mode
Scan mode is a different m ode of operation in which a frequency span can be captured at a
much higher resolution of up to 210,000 points.
See section 8.1 for more information.
6.1.2 Logging of Values, Traces or Screens
The Logging function enabl es results to be saved into log fi les i n r es ponse to a timer or to a
trigger event. Individua l amplitude values, complet e traces, or full screen images can be saved.
See section 4.7.1 for more information.
6.1.3 Automatic Measurements
Automatic measurement calculation of Channel Power, Adjacent Channel Power Ratio, and
Occupied Bandwidth. See section 4.7.2 for more information.
6.1.4 Modulation Waveform Display
The modulation wavefor m for AM and FM signals can be displayed. S ee section 4.2.2 for more
information.
6.1.5 Triggering
The triggering function enables sweeps or logging to be t r iggered in response to an internal or
external trigger event. The internal trigger event c an be generated by the Limits function.
See section 7.8 for more information.
6.1.6 Limit Lines, Limit Patterns & Channel Markers
Limit lines and patterns can be s hown on the display, and compared with the trace. They can
be used to trigger a logging event, generate an audible warnings or output a trigger pulse.
Limit lines are simple horizontal lines whereas l imit patterns are freque nc y de pendent amplitude
limits that are stored as files. Two limits can be used sim ultaneously. Channel markers ar e a
special version of a limit pattern that creates only vertic al l ines.
See section 7.10 for more information.
6.1.7 Level Offsets
The level offset functi on enables the level values for the graticule and markers to be corrected
for external attenuation or gain. Compensation can als o be made for signals com ing from a
75Ω source.
Page 43
Page 45

6.1.8 Compensation Tables
Compensation tables are lis ts of amplitude versus frequency which enable frequency related
amplitude variations from antennae or transducers to be compensated for within t he spectrum
analyzer. Compensatio n tables are stored as files. See section 7.9.2 for more information.
6.1.9 Custom Presets
Custom Presets enables multiple presets (set-ups) t o be saved/recalled just by enter ing a
number. See section 7.3.5.
6.1.10 View on PC
View on PC places the instrument into a special mode in which the graphics of the display are
sent to a PC via USB. The screen can then be viewed at any size using PSA -View PC
software. See section 17 (Appendix A) for more information.
6.1.11 PSA-Manager Software
PSA-Manager is a Windows based software application which is used in conjunction with the
instrument. It provides t he capability for displaying and printing Traces and Scr een Images,
display and analysis of Log files, and creation of Limit Patterns and Compensat ion Tables.
See section 17 (Appendix A) for more information.
PSA-Manager software is provided on the support CD supplied with the product and the latest
version is free to download from the support section of the Aim-TTi website. It has limited
functionality for ins truments that do not have option U02 fitted but can be useful for dis playing
and printing traces and screen images.
Page 44
Page 46

7 Further Notes on Operation
7.1 Signal Overload Levels and Indicati on
The maximum input level without damage is +25dBm or +132dBuV of RF power
(approximately 4 volts RMS) , or 50V DC. The maximum s ignal that can be measured is
+20dBm with the Reference level set to +20dBm.
Signals that would cause the trace to rise above the reference level are indicated by a red
arrow at the top of the graticule. However, no indication is given if the trace is above (or below)
the graticule as a result of Scale/Shift, Offs et or Compensation Table, provided that it is below
the reference level.
Large signals outside of the displayed span can cause measurement errors because of
overload in the analog mixers and amplifiers. Consequently a full-span sweep should be run to
check for any high levels s ignal s within the frequency range of the analyzer.
7.1.1 ADC Overload
For spans below 20MHz, overload of the ADC can occur from signals that do not cause a
normal overload indication (the red arrow at the top of the graticule). Overload of t he ADC is
indicated by a red background warning message below the graticule area.
Signals that are more than 10MHz away from the centre of t he current span will have a rapidly
decreasing effect . Possible causes of overload can be check ed by performing a sweep with a
span of 40MHz or wider. As a general guide, signals of up to 40dB above the chosen reference
level (absolute maximum +25dBm), that are more than 20MHz away from the centre of the
desired span, should not cause ADC overload.
7.2 Operation using the Hard Keys Only
Although the instrum ent is des igned to be operated via the touch
screen, it is also possible to operate it using only the hard keys.
This may be appropriate in part i c ular circumstances such as
when the user is wearing glo ves.
Hard-key-only operation is ac tivated by pressing the circular
button marked Navigate Screen which then illuminates. This
changes the function of the five Navigator keys from controlling
the Markers to controlling the position of the on-scr een k ey
highlight.
The highlight position is shown by a change in the key color t o pur pl e. Pressing the centre
button operates the key.
Normal menu funct ions can be operated in this way. Pop-up menus and other special function
screens can be exited by pressi ng the EXIT hard key. An exception is the S et by Tab/Jog
function, described in sec tion 7.3.2 , where the horizont al and vertical navigator keys operate
the tab and jog functions respectively.
Note that, if a touch-screen key is pressed directly, t he " hard-key only" mode is cancelled and
the Navigate Screen button ceases to be illuminated. To re-enable the mode, the button must
be pressed again.
Whenever the navigator mode is changed, an information box appears similar to that shown
above. If preferred, t hi s r eminder can be turned off - see section 4.9.3.3.
7.3 Setting Frequencies
The control screens used for setting frequencies ar e c ommon to Set Centre, Set Span, Set
Start, Set Stop, Set St ep and Mark er Manual Set. The following illustrated example is for Set
Centre but is similar for all other frequency setting functions.
Page 45
Page 47

pressing this key will bring up either the Set by Keypad sc r een or the Set by Tab/Jog
Set
Centre
screen depending upon which one was last used for sett i ng that frequency
parameter.
7.3.1 Set by Keypad
This control screen replac es the menu with a 0 to 9
keypad. The frequency is entered in MHz using the
decimal point if required (maximum resolution
0.0001MHz). Frequencies c an be entered just to the
resolution required – following digits become zeros.
Entry errors can be corrected with the back-space key
().
Pressing OK sets the entered frequency without
leaving the control screen. The frequency value is
cleared ready for entering a new value.
Pressing OK & Exit sets the entered frequency and
returns to the menu.
Pressing Exit/Cancel returns to the menu without setting t he entered frequency.
Pressing Toggle Last returns the frequency to the value direct ly prior to the last frequency entry.
Pressing Tab/Jog changes to t he alternate control screen as detailed below.
7.3.2 Set by Tab/Jog
This control screen replac es the menu with a display
of the existing frequency and enables it to be
changed.
Pressing either of t he Tab keys moves the arrows left
or right along the digits.
Pressing either of the Jog keys increments or
decrements the value of t hat digit.
The Jog keys auto-repeat, and the new frequency is accepted and executed after a delay of
around two seconds.
Pressing Exit returns to the menu. Pressing Set by Keypad changes to the alternate control
screen as detailed above.
Note that when Navigate Scr een mode is selected, the navigat or keys perform the tab/jog
function directly - see section 7.1.
7.3.3 Shortcuts to setting a Specific Frequency Span
Narrower Span
Having set a frequency span in which the signals of int er est are visible, the user may wish to
examine a specific part of the span at greater resolution.
If the point of interest i s the highes t level within the current sweep, it can be moved to t he c entre
of the screen from the Centre sub-gr oup menu (Freq/Span > Cent r e > Set C=Pk).
Alternatively, mark er M1 can be placed at the point of interest and moved to the centre of the
screen from the Centre sub-group menu (Freq/Span > Centre > S et C=M1).
Once the point of interest i s in the centre of the screen, the resol ution can be increased using
the Zoom In function from the Span sub-group menu (Freq/ S pan > S pan > Zoom In/Out).
An alternative method which enables a more precise span to be set is to place marker M1 at
the start of the area of inter es t and marker M2 at its end. The new span is then set from the
Start/Stop sub-group menu ( Freq/Span > Start/Stop > Start=M1,Stop=M2).
Page 46
Page 48

Wider Span
Having set a frequency span in which the signals of int er est are visible, the user m ay wish to
examine a wider span in order to see further signals not current l y visibl e.
One method of doing this is to zoom out from the Span sub-group menu ( Freq/Span > Span >
Zoom) which shows frequencies both above and below the current span.
Alternatively, the user may wish to look only at frequencies above (or below) the current span.
This can be done from the Start/Stop sub-group menu (Freq/Span > Start/Stop > Fix Start or
Stop). Once the start or st op frequency is fixed, the word Fi x is dis played next to its frequency
at the top of the screen. The Step Up and Step down keys can then be used to increase or
decrease the opposite frequency only. Pressing the key again will cancel the condition. See
section 4.1.3.
7.3.4 Repetitive Operations
A common requirement for a spectrum analyzer user is to change r epetitively between two or
more frequency ranges. The PSAxx05 provides several methods for doing this.
1. When setting the centre fr equency using the keyboard, the Pr ev ious key can be used to
toggle between two centr e frequencies - see section 7.3.1. The same facility is provided for Set
Span, Set Start and Set Stop.
2. Frequency Presets, selected via the Frequency/Span menu group, enable up to six
frequency spans to be stored and rapidly recalled - see section 4.1.5. Only Centre/Span or the
equivalent Start/Stop frequencies are stored. Other parameters such as RBW are not affected
(unless set to Auto).
3. Trace States are files which contain not only the fr equenc y span, but the RBW, the Level
setting and the graticule scale and units. Up to 999 trac e files can be stored and are recalled
from the Traces/Stores control screen - see section 4.5.1.
4. The hard key marked “Presets” brings up a menu of set-up states - see section 4.10. Note,
however, that these change many parameters of the instrument simultaneously.
7.3.5 Using Custom Presets (when fitted)
Custom Presets is only available when Option U02 is
fitted. It is accessed using the P resets hard key - see
section 4.10.
Pressing the Custom Preset s key brings up a menu
as shown.
Custom Presets is an extended version of the User Preset from which multiple presets can be
saved or recalled by enter ing just a number. To save a new preset, set up the instrument as
required and press the Save Preset key followed by a number.
Each Preset is a special t ype of Setup file stored in the SETUPS directory with a file name of
the form $PST0001 where the $ is fixed and the next three character s (default PST) can be
changed to create mult iple groups of presets. The last f our characters represent the number by
which the preset is saved or r ecalled. Any number in the range 1 to 9999 can be used, although
the number of presets simultaneously available is set by the directory lim it of 999 files.
Applications for which C ustom Presets might be used include frequency selection via channel
numbers, or repetitive st eps within a test environm ent.
7.3.6 Creating Channel Markers (when fitted)
Channel markers are only available when Opti on U02 is fitted and provide a con ven ient method
of showing multiple fixe d frequency points on the displa y via vertical lines that overlay or
replace the graticule.
They are created via a special type of limit pattern fil e. See section 7.10.6 for details.
Page 47
Page 49

7.4 Measuring Rela tive Amplitude
Normal
(Auto)
Normal
Manual
Threshold
DC
Mode 1
DC
Mode 2
When both measurement markers are turned on, a readout is provi ded of the difference
between them in terms of both frequency and level.
A common requirement is t o measure the signal amplitude at a specific frequency under
different conditions. The PSAxx05 provides a convenient method of doing this.
Having measured the amplitude in the initial condition using marker M1, the value can be fixed
from the Marker Setup sub-grou p menu (Traces/Markers > Marker Setup > Fix/Un fix M1). The
M1 readout shows Fx at the left hand s ide. With the new condition applied, the measurement
can be made again by moving M2 to the same frequency using the key Move M2 to M1. The
difference in amplit ude lev el c an then be read directly.
To return M1 to normal operation, press Fix/Un f ix M1 ag ai n. See section 4.6.1.
7.5 Sweep Modes & Signal Image Rejection
In any spectrum analyzer an input signal creates a potential image at a distance away of twice
the IF frequency. The PSA Series 5 uses a combination of analog and digital techniques to
suppress these images.
Image Rejection Ratio (IRR)
The image rejection ratio (IRR) is expressed in dBs and is the ratio between the amplitude of
the real signal and the amplitude of the visible im age. Thus if the IRR is 60dB, a signal with a
level of -15dBm would create an im age with a level of -75dBm.
7.5.1 Default Sweep Mode – Normal (Auto)
In the PSA Series 5 default sweep mode, image suppress i on is achieved in real time as the
sweep progresses. In order to ensure that the IRR is sufficient to bring the image down to the
noise floor, an alignment procedure has to be run.
The alignment is run when the inst rument is first switched on and is repeated from time to t ime
thereafter as temperature changes and other factors al ter the analog parameters . During
alignment the sweep is halt ed for a brief period and an “Alignment in Progress” message is
displayed.
7.5.2 Advanced Options
A number of alternative image rejection methods are offered. These are selected using the
Advanced Options key on the Sweep Modes sub-menu (see section 4.3.5).
Normal (Manual)
If the user wishes to avoid the occas i onal interruption of the sweep that can occur in Norm al
(Auto) mode, alignm ent can be set to Manual instead of A uto. In this mode the IRR may
gradually deteriorate r esulting in images being visible above the noise floor. When this occurs
a warning message of “Alignment Recommended” will appear, and alignment can be run at any
time by pressing the Status har d key or Manual Align key (see sec tion 4.3.5).
Threshold
The IRR after alignment is typically >60dB. Whether an image appears above the noise floor is
dependent upon the IRR, the noise floor (which is related to RBW/VBW) and the level of the
real signal.
The frequentness with which auto alignment takes place in Normal (Auto) mode, or the
“Alignment Recommended” message appears in Normal ( Manu al ) mode, can be reduced by
Page 48
Page 50

allowing potential images of signals at the reference level to exceed the noise floor by a userdefined amount bef or e acti on is i nitiated.
The Threshold key can be used t o s et the tolerated image level to be 0dB (default), 3dB, 6dB,
or 12dB above the noise floor with the current RBW for a signal at the reference level.
Data Comparison (D.C.) Mo des - General
Two alternative sweep modes are available that provid e a different balance between sweep
speed and image rejection. These sweep methods use data comparison techniques to reject
images and can have advantages over Normal mode in specific situations.
Subject to specific c r iteria, the IRR can be greater than the dis play range of the analyzer
resulting in complete s uppr ession of the image.
The technique involves c omparing data from two or mor e s weeps t hat have been subject to
different frequency mixing offsets. Because the dat a points are captured at different times, this
technique gives poor results when the signal level is varying.
A further problem exists in terms of the frequency offset used. If two real signa ls ex i s t that are
spaced by a particular multiple of the frequency offset, the data comparison will fail and the
image will not be supressed. This problem exists not just for signals at the exact frequency
spacing but for signals spaced at that frequency +/-(2 x RBW).
Useful improvement s can be made by using multiple sweeps with multiple offsets, however this
slows the sweep rate down still further and may still give erroneous results where multiple
signals exist within the span of the frequency offs et values.
N.B. The Normal sweep mode of the PSA Series 5 uses combined analog and digital
techniques which provides image rejection in real t ime and does not suffer from either of
the problems discuss ed abov e.
Where the user is confident t hat neither rapidly varyin g s ignals, nor multiple large signals
spaced close to the frequency offset(s) are likely to be a problem, data comparison can give a
higher level of IRR than other methods.
D.C. Mode 1
This mode provides perfect rejection of images for signals of constant level subject to a specific
criterion. The sweep speed wil l become slightly slower for spans below 50MHz (and by a
maximum factor of two for spans below 20MHz), but will be similar to Normal sweep mode for
wider spans.
The criterion for image rejection is that there are no signals within the span that are 40M Hz +/(2 x RBW) apart. Any such signals will create an image whose magnitude depends upon how
close the signal spacing is to 40MHz. Signals not s pac ed 40MHz +/- (2 x RBW) apart will not
create an image.
The minimum frequency in D.C. Mode 1 is 30MHz (rather t han 10MHz when in Normal mode).
D.C. Mode 2
This mode provides perfect rejection of images for signals of constant level subject to another
specific criterion. The sweep speed will be slower f or spans below 50MHz (halving the speed
for a span of 20MHz and quartering it for spans of 2MHz and below) but will be similar to
Normal sweep modes for wider spans.
The criterion for image rejection is that there are no signals within the span that are 40M Hz +/(2 x RBW) apart simultaneously with signals that are spaced 32 MHz +/- (2 x RBW ) apart. This
is an unlikely situation to occur and is consequently “safer” in terms of image r ejection than D.C.
Mode 1.
The minimum frequency in D.C. Mo de 1 i s 30MHz (rather than 10MHz when in Normal mode).
Spurii Reduction
Page 49
Page 51

Distortion and non-linea r ities within the analog circ uitry of the instrument can c reate very low
level signals that could be visible for settings where the noise floor is very low. These ar e
referred to as Spurii.
DC Modes have the further advantage of reducing Spurii.
7.5.3 Revealing the Image
The multiple IF frequen c ies used within the PSA Series 5 c an r esult in a group of up to three
images appearing close together at around 20MHz belo w the s ignal frequency. If this is outside
of the current span, the im age(s) will not be visible.
However, images can exist of signals that are outside of the span. For example, a large signal
at 433MHz and a span set at 400MHz to 420MHz could result in a potent ial ly visible image(s)
even though the signal itself would not be visible.
With wide RBWs (1MHz and above) the noise floor is high enough that images are unlikely to
be visible above the nois e. Similarly signals well below the reference level will not create a
visible image because the I RR will supress the image to below the noise floor.
Images become a problem when it is unclear whether an apparent small signal is “real” or just
an image of a large signal circa 20MHz above.
The user can check whether an image exists by pressing the key marked “Reveal Images ” ( see
section 4.3.5). This c auses the analyzer to operate briefly with image rejection tur ned off
resulting in the level of any images increasing by the IRR value.
7.5.4 Sweep Times
Sweep times are a function of frequency span and RBW/V BW. Generally the sweep time
varies in a direct relat ionship with the span and an inverse relationship with the RBW. For
narrow spans and/or wide RBWs, the minimum sweep time of just under 0.1 seconds will apply.
Note, however, that the maximum display update rat e is l imited to about five per secon d.
Where the sweep time is significantly longer than the minimum, the user is able to decrease the
sweep time by a target factor of 2, 5 or 10 (F1, F2 or F3) from the Sweep Time menu (see
section 4.1.6). This has a relat i v ely small effect upon signal amplitude accuracy and can be
very useful when faster response i s important.
The degree of speed up actually achieved is dependent pr imarily on the RBW. For a 1kHz
RBW and 1MHz span the normal sweep time is 12.8 seconds, but this c an be r educed to 1.2
seconds by selecting F3. However for wider RBWs the degree of s peed up is reduced.
In D.C.1 and D.C.2 sweep m odes , the degree of speed up will be limited even at narrow RBW
settings.
Page 50
Page 52

7.6 Radiated and Injected Signals
7.6.1 Self-radiated Signals
In common with most handheld spect rum analyzers, low level s ignals generated from the
internal circuitry can be pi c k ed up with an antenna.
Indicative measurements made with a 30cm (12”) whip antenna, mounted directly onto t he
signal connector and extendi ng in line with the instrument, showed self-radiated peaks typically
around -90dBm. Connecting the same antenna at the end of a 1m (3ft) extension cable and
moving it away from the instr ument reduced these to below the noise floor at maximum
sensitivity.
7.6.2 External Signal Injection
The RF circuitry of the instrument is extensively s c reened in order to avoid signals being picked
up via any route other than through the signal connector. Nev ertheless very high fi eld
strengths, as might be created by a transmitter in close proximity, could cause meas urement
errors through direct ra diated signal injection. The vulnerability to this increas es with increasing
frequency.
If such measurement error s are suspected, a measurement should be done with a N-Type
shorting connector in pl ac e, in order to quantify the effect.
7.7 Detector Types
The detector converts the signals captured during the sweep into the set of DC levels that are
shown on the display. A full explanation of detector types is out side the scope of this m anual,
but some basic explanati on is given here.
Each sample point on the displ ay is a representation of the signal l evels found within the range
of frequencies defined by each sample point. For example, a span of 27MHz resu lts in each
display point represent ing signals within a “bucket” of frequencies 100kHz wide.
The default detector type of Positive Peak displays the highest signal value found within the
bucket. This is the most commonly used detector type and gives the most accurate result f or
the majority of measurement situations whilst guaranteeing not to miss any signa ls.
Certain types of measurement, however, benefit fr om different detector types, and the PSA
Series 5 offers six other detector options. The degree to which the results diff er from the
default detector depend not only on the signal but on the relations hip between the RBW and the
bucket width.
The Negative Peak detector uses the lowest value found within the bucket. This is occas ionally
used for comparative purpos es in noise and EMC measurements.
The Sample detector us es the value found at the end of the buck et. It can have advantages
over the default detector when measuring CW levels close to the noise floor but risks missing
signals if the RBW is narro w relat ive to the bucket width.
The Lin and Log Average and R MS detectors use a level related t o the average or root mean
square value of signals within the bucket. They are used for signal accumulation measurements
such as channel power.
The Alternate Peak detector distinguishes between s ignal and noise found withi n the bucket by
detecting whether the level both rises and falls within the bucket. It gives a m or e accurate
indication of noise than a peak or sample detector. However, under some circumst ances signal
peaks can be displaced one sample point to the right.
Selection of detector type is explained in section 4.3.6.
Page 51
Page 53

7.8 Triggered Operation
Triggered operation is only available when the upgrade o ption U02 is fitted (see secti on 6).
Triggering is used either to start or stop the sweep, or to init iate logging of sweeps or screen
images. The trigger can be gener ated manually (by a key press), externally (from t he tr igger
input) or internally from the sweep in combination with a limit line or limit pattern.
For a description of Triggered Sweep see section 4.3.4.2. For a description of Trigger ed
Logging see section 7.11.
7.8.1 External Trigger Input
The external trigger input is provided via the 3.5mm jack socket at the top of the instrument.
This can be converted to a standar d B NC s oc ket using the adaptor provi ded. The selection
between positive or negati ve tr ansition triggering is made from the Sweep Trigger or Logging
Trigger functions. It has a TTL threshold and a high input im pedance. Maximum input
voltage is limited t o +/-20V. Voltages above this level could d amage the instrument.
7.8.2 Trigger Output
A trigger output pulse can be generated using the same s oc ket as trigger input (see above).
The signal is generated by the Limits comparator funct ion (see section 7.10.3) and is a pos itive
going TTL level pulse of appr oximately 10ms duration from a 1kΩ source impedance.
The trigger output is not available if either sweep trigger or log trigger is set to external
triggering.
7.9 Level Offset and Compensation Tables
These functions are only avai lable when the upgrade opti on U02 is fitted - see section 6. They
enable the amplitude scaling t o be offset to match external attenuation or gain, or to add
frequency dependent amplitude compensation tables t o match transducers or antennae. A
description of the menu keys used to control the function is given in section 4.4.4.
7.9.1 Dynamic Range and Maximum Signal
Adding offset or compensation can create confusion as t o the maximum and minimum
signal levels that can be vie wed.
This could result in the instrument being in amplitude overload even when the displayed
amplitude value is appar ently within the instrument range. Where an offset is set to a large
negative value (to compensate for an external gain element) there is a danger that the absolute
maximum signal level could be exceeded resulting in damage to the instrument - see section
2.1.2.
Offset levels and compensation tables should therefore be used with care !
7.9.2 Creating and using Compensation Tables
Compensation tables are normalised files of amplitude vers us frequency that are used to
compensate for frequency related non-linearity in antennae or t ransducers.
The files contain lists of up to 49 frequency/amplitude po ints. When a file is used by the
instrument, linear int er pol ation is employed between the points.
Every point on the trace is t hen c hanged by the amount calculated from the interpolated
compensation table. Note that this could result in parts of the trace being outside of the
graticule area.
Compensation Tables m ust be created outside of the instrument using PSA-Manager software see section 6.1.11.
Compensation Table files hav e the extension .CMP and are located in the folder named
TABLES. Files can be transf er red using either a USB Flash dri ve, or by direct connection to the
USB port of a PC. See section 5 for an explanation of copying and tr ansferring files.
Page 52
Page 54

A compensation table f i le is l oaded in a similar way to other types of file using a File Recall
screen - see section 5.4 .
Note that compensation t abl es and li mit patterns are both placed in a folder called Tables and
can therefore appear within the same File Utilities screen. It is possible to toggle between the
two file types by pressing the k ey marked Tables (toggle).
7.10 Limit Lines & the Limits Comparator | Creating Limit Patterns
These functions are only avai lable when the upgrade opti on U02 is fitted - see section 6. A
description of the menu keys used to control the function is given in section 4.4.5 .
Two types of limits are availa ble, Lines and Patterns. Up to two limits can be displayed, Limit 1
in red and Limit 2 in blue.
A Line is a simple horizontal lin e ( single amplitude level) that can be set to any value.
A Pattern can have multiple le v el s and c an include vertical steps and angled lines. Patterns are
contained within files that are lists of up to 49 frequenc y/amplitude points. When a file is used
by the instrument, linear interpolation is employ ed between the points.
Lines or patterns may be used as s imple visual aids to determ ine whether a signal is within a
specific level range, or t hey may be used in conjunction with the Limits Comparator to create an
automatic action.
7.10.1 Setting Limits
Pressing the Set Limit s key (Le v el/Limits > Limits >
Set Limits) brings up a control screen as shown.
The keys on the top line select which limit is to be
controlled by the bottom row keys. Where a limit line
or pattern has already been set , it can be turned on or
off using Limit On/Limit Off.
The status of the two lim its is displayed within the
area directly above the keys.
Pressing Set Line defines the currently selected l imit as a line (if it was previously a pattern)
and brings up a numeric entry keypad or tab/jog system by which the level of the line can be set
numerically in graticule uni ts.
Pressing Select Pattern brings up a list of files from which a limit pattern can be loaded. Limit
pattern files have the default prefix PTN and are placed in the Tables folder. Pressing Recal l
from the Recall Limits files screen will load the pattern as the selected limit.
7.10.2 The Limit Comparator
The limits comparator enabl es automated actions to be selected in response to specifi ed limit
conditions. The acti ons inc l ude audible warning, pulse output from the trigger sock et, stopping
of the sweep, or entry into a logging file.
The limit condition is created from the trace being either above or below the limit line/pattern. If
the measurement markers are turned off, or if only M1 is turned on, any part of the swept trace
being above or below the line will create the condition. If both M1 and M2 are turned on, the
limits comparison takes place only on the part of the t r ace between the markers.
The Limit Condition options are None, Above, Below, Outside or Inside. Where two limits are
being displayed, the limit conditions of Inside or Out side can be used. Note that there is no
concept of an upper or lower limit line. Above means above the higher point of the two limit
lines, Below means belo w the lower point of the two limit lines, Outside means either above the
higher point or below the lo wer point of the two limit lines, while Inside means between the
higher and lower points.
Page 53
Page 55

The Limit Action can be set to None, Beep, Pulse Out, Beep and Pulse Out together, or
Message. The action only takes places when the sweep has com pleted. The Pulse Out is
provided at the Trigger soc k et - see section 7.8.2.
Regardless of the setti ng of the Trigger Action, it is also pos s ible to use the limit condition to
stop the sweep (see secti on 4.3.4.2) or to create an entry into a logging file (see section
7.11.5).
7.10.3 Creating and Loading Limit Patterns
Limit Patterns must be creat ed outside of the instrument using PSA-Manager software - see
section 6.1.11.
Limit Patterns files have the extension .CSV and are located in the folder named TABLES .
Files can be transferr ed us i ng either a USB Flash drive, or by direc t connection to the USB port
of a PC. See section 5 for an explanation of copying and transferring files.
A limit pattern table file is loaded in a similar way to other types of file using a File Recall scr een
- see section 5.4. Up to 999 patter n files can be held within the memory of the instrument.
Note that limit patterns and compensation tables are bot h placed in a folder called Tables and
can therefore appear within the same File Utilities screen. It is possible to t oggle between the
two file types by pressing the k ey marked Tables (toggle).
7.10.4 Limit Offset
The Limit Offset function enables a l imit to be offset
from its initial value. It is intended primarily for limit
patterns (which would otherwise have to be
regenerated) but can also be used with limit lines.
The Limit Offset control screen enables a limit to be
“nudged” up or down in steps of 1dB or 0.1dB.
Where a limit has had an offset applied to it, a **
symbol is displayed within the Set Limits control scr een.
7.10.5 Limit Fix/Unfix
Limit patterns use absolute frequency points. Whenever the frequency range is changed, the
pattern on the screen is recalculated to be correct for the new frequency range.
In some circumstances, however, it is useful to avoid this recalculation taking place. If, for
example, a limit patter n had been created for the modulation around a specific centre
frequency, it may be useful to be able to apply that same pattern to a different centre frequency.
Pressing the Limit Fix/Unfix key fixes the pattern relative to the screen and displays a message
of “Lim Fix” on the top RH side of the graticule. Changes can no w be made to centre frequency
without the pattern changing.
Note that the pattern is fix ed on the screen and will become inc orrect if the span or the
reference level is chang ed. Pressing the key again cancels the fix mode and recalculates the
limit pattern to be cor r ect for the current centre frequency, span and reference level.
7.10.6 Creating and Loading Channel Markers
A special type of limit pattern file is available whic h c onsists only of vertical lines at frequency
points defined within th e file. These can be displayed as an alternative to limit lines/patterns.
Up to two files can be displa yed simultaneously in differing c olours. Each file can contain up to
49 frequency points.
Channel Marker files are c reated using PSA Manager software. This is described further in
Appendix A (section 17).
Page 54
Page 56

7.11 The Logging Function
The Logging function is only available when the upgrade option U02 is fitted (see section 6).
A description of the menu keys used to control the functi on is given in section 4.7.1.
The logging function saves res ults into log files within the memory of the instrument. The type
of result saved can be selected as Centre Level (logs onl y the amplitude at the centr e
frequency), Peak Level (logs the frequency and am plitude of the highest peak in ever y sweep),
Full Trace (logs the whole trace) or Screen Image (logs the whole screen as a bit-map image).
The saving of an entry into the file can be after
every sweep (continuous ) or in response to a Timer,
a key press (manual trigger), the external trigger
input, or the Limits function.
Each entry within the f ile includes the time of the
entry as read from the instrument’s real time clock.
Up to 25,000 entries can be sav ed within a single
file with the exception of S c reen Image logging
where the entries are limited to 2,500. The saving
of an entry takes a finite length of time varying from 0.1 seconds (centre amplitude or peak
value) up to 1.5 seconds (sc r een image). Entries are only saved after the sweep has been
completed, and the sweep cannot re-start until the entry has been s aved.
Note that, when a logging f i le is “enabled”, the sweep mode is automatically set to Repeat and
the sweep trigger is set to F r ee R un. No changes can be made to the set-up of the analyser
while logging is in progr es s.
7.11.1 The Logging Control Menu
Selecting Logging Control from the Logging sub-group menu (see section 4.7.1) opens a new
control screen as shown opposit e.
The type of data to be logged, t he trigger type, and the timer interval (if used) must be set prior
to entering Logging Cont rol. This information is shown within the area above the keys.
Similarly the spectrum analyzer state (frequency span, level etc). must also ha ve been set-up in
advance.
Once logging has comm enced it is not possible to make any changes to the instrument ’s set-up
without closing the logging file. It is also not possible to turn the instrument power to Off without
closing the file fir st.
Change Name: the name of the logging file that will be created is displayed at the top of the
menu area. The file name i s an auto-incrementing numeric of the default file name (shown in
green). Pressing Change Name opens an alpha-num er ic keypad from which a user-chosen
name of up to 8 characters can be ent er ed.
Change Default: enable s the default file name that will be automatically allocated t o the next
logging file to be changed. Standard default file nam e rules apply - see section 5.1.1.1
Enable Logging: commences the opening of a logging file under the currently displayed name.
An information message is displayed and logging is actually enabled after conf irming with the
Status hard key.
Pause/Enable: causes new entries into the current logging file to be suspended and re-started.
However it is not possible to exit from the logging control menu without closing the current file.
Close File: closes and saves t he c urrent logging file. Once closed the file cannot be re-opened
(although it can be renamed or deleted). The Log File nam e c hanges to the next default name
ready for the next logging file to be enabled.
Cancel/Exit: exits the logging control menu provided that a logging file is not cur r ently enabled
or paused, in which case a warning message is displayed t ell ing the user that exiting will
disable logging and close and save the current file.
Page 55
Page 57

File Utilities: displays a list of logging files currently within the instrument. Oper ates similarly to
other file utilities sc reens – see section 5.5.
7.11.2 Manual Logging
The logging function can be set via the Log Trigger key to save ent r ies in response to a manual
key press. Both the Run/Stop har d k ey a nd the sweep control touch-screen key act as the
manual trigger.
The data that is logged will relate to the sweep that was in progress when the key was pressed .
7.11.2.1 The Run/Stop key and Sweep Control key
When logging, the Run/Stop hard key and sweep control touch-screen key have no funct ion
unless the Log Trigger has been set to Manual, in which case both act as a manual trigger key.
In all other trigger modes ( timer, external, limits or continuous) the keys are inactive. However,
the touch-screen key does provide visual feedback of t he stages of the logging process. When
no trigger event has yet occurred the key is green and m ar k ed Awaiting Trigger. When a
trigger has occurred but the sweep has yet to complete it becomes yellow and is marked
Triggered. When the sweep is completed and the log file ent r y is being made it becomes red
and is marked Writing File.
7.11.3 Logging from the Timer
The logging function can be set via the Log Trigger key to save entr ies triggered at a fixed time
interval.
The Timer Setup key enables a time between trigger events to be s et between 5 seconds and
100 minutes. However, if the timer interval is set to a short period, the actual time between
logging entries may be considerably longer than the trigger interval. This is because, for each
entry, a sweep must be complet ed and the data must be saved. If the sweep is set to a wide
span and/or narrow RBW, the sweep time could be several tens of seconds.
The timer is asynchronous with respect to the sweep. Consequently the time between logging
entries will be longer than t he timer interval by a variable amount which is a function of the
sweep time. The log entry time stamp represents the time at the end of the logged sweep.
To achieve the fastest possible logging use Continuous trigger - see section 7.11.6.
7.11.4 Logging from External Trigger
The logging function can be set via the Log Trigger key to save entries on either a positive or
negative going edge applied to the Trigger socket - see section 7.8.1.
The data that is logged will relate to the sweep that was in progress when the trigger signal
occurred.
7.11.5 Logging from Amplitude Limits
The logging function can be set via the Log Trigger key to save entries when a trigger is
generated by the Amplitude Limits Comparator. The dat a that is logged will relate to the sweep
that was in progress when the limit condition occurred.
The Limits function m ust be set to have a potentially valid co ndition as set by Limit Condition,
however the logging trigger is independent of the Limit Action which can be set t o any value
including none. See section 7.10 for an explanation of the Limits function.
7.11.6 Logging Every Sweep (Continuous)
The logging function can be set via the Log Trigger key to save entries continuously, i.e. after
every sweep. The actual speed wil l depend upon the sweep rate and the type of data being
logged. The fastest possible logging rate is about two per sec ond.
7.11.7 File Sizes and Maximum Logging Times
Logging files can vary in size from a few kB to more than 100MB depending upon the number
of entries and the type of data being logged.
Page 56
Page 58

Although the filing syste m allows up to 999 .LOG files to be stored, the practical number may be
limited by the internal memory size (approximatel y 1.8GB). Where large files are being created,
care must be taken not to overflow the memory. Memory space can be restored by copying
files to a Flash drive or directly to a PC, and then deleting them on the instrument.
The instrument has the potential to log over very long periods . Where it is required to log for a
period close to or exceeding the battery life, the inst r ument must be operated from external AC
power.
In the event of the memory becoming full or the power being lost, the current logging file will be
automatically closed.
7.11.8 Viewing and Analyzing Logging Files
The instrument has no capability for viewing the content s of a logging file. Instead, the file must
be copied to a Windows based PC where the file can be viewed and analyzed using the PSA
Manager software - see section 6.1.11.
Log files have the extension .LOG and are located in the folder named LOGS. Up to 999
logging files can be stored within the memory of the instrument. Files can be transfer r ed using
either a USB Flash drive, or by direc t connection to the US B por t of a PC.
See section 5 for an explanation of copying and transferring files.
7.12 Using Automatic Measurements
The Automatic Measurement function is only available when the upgrade option U02 is fitted
(see section 6). A description of the menu keys used to contr ol the function is given in secti on
4.7.2.
When turned on, the automatic measurement function changes the sweep mode of t he analy zer
so that 1081 points of data are collec ted per sweep instead of the normal 271. This, combined
with the calculation time, reduces the sweep update rate s ubs tantially.
The number of points displayed remains at 271, with each pixel showing the appropriate value
in each block of four as set by the detector mode. However, all 1081 points are us ed to
calculate the measurement r esult.
When automatic measurement is turned on, the st andar d moveable markers are disabled and
replaced by markers which are pos itioned by either the measurement setup or the
measurement result. The calculated results or setup parameters (as chosen with the Mode
key) are displayed within the area below the graticule normally used for mark er readouts.
The measurement function can r un continuously or as a single measurement, as set by the
Mode key. The measurement sweeps are contr olled with the Run/Stop as normal.
Note that the choice of single or c ontinuous within the Auto Measure function overrid es the
setting within the Sweep Control menu, and will rem ai n set when the function is turned off .
For all measurement types t he user must start by setting the desired centre frequency for the
channel of interest and choosing a span appropriate for the bandwidth. These are set from the
normal Frequency/Span menus.
The RBW would normally be set to Auto, and typically the span would be set to be a sufficient
amount wider than the channel bandwidth(s) so as to fully display the skirts.
An excessively wide span would reduce accuracy because of the lower number of
measurement points. If the span is set below the necessary bandwidth, the result will be sho wn
as “Setup Error”.
Depending upon the signal type that is being measured it may be beneficial to set t he trace
write mode to Average, or to Peak Hold.
7.12.1 Channel Power (CP)
This measures the total power, in dBm, within a channel of a user specified bandwidth at a user
specified centre frequency.
Page 57
Page 59

Setting the channel bandwidth and turning the meas ur ement function on causes two yellow
markers to be positioned at the channel limits, equidistant from the centre frequency. The
Channel Power is shown in dBm.
7.12.2 Adjacent Channel Power Ratio (ACPR)
This measures the relative power, in dBm, of a main channel to its higher and lower adjacent
channels.
Setting the channel bandwidth, channel spacing and turning the measurement function on
causes two yellow markers to be positioned at the channel limits of the central channel, and two
pairs of light blue mark ers to be positioned at the limits of t he upper and lower channels.
The main channel power is shown in dBm, followed by the ACPR of the lower and upper
channels in dB.
7.12.3 Occupied Bandwidth (OBW)
This measurement determines the channel ban dwidth necessary to achieve a user s pec i fied
percentage of the total power found across the span. The measurement is made relative to the
start and stop frequencies of the span.
Setting the required per centage of total power and turning the measurement function on causes
two yellow markers to be positioned at the frequency points that contain that power. These will
not necessarily be symmetrically placed around the centre frequency.
The bandwidth between the markers (OBW) is displayed in MH z along with the centre
frequency calculated from the mid-point of the m arkers and the error between this and the
chosen centre frequenc y.
Page 58
Page 60

8 Scan Mode
8.1 Scan Mode Explanation
Scan mode is a facility which en ables spans to be analyzed with a hig her resolution than in
normal sweep mode. In scan mode the analyzer creates a file containing data that would
normally be discarded. This hi gh r es olution file can be anal yzed us ing the display of the PSA,
on a PC using PSA-Manager, or exported as a CSV file for us e with other programs.
Scan mode is only available when option U02 ( and Updatable Firmware v2.xx or above) is
installed.
8.1.1 Limitation of Normal Sweep Mode
The normal sweep mode of the analyz er displays the level at 271 points across the span. The
resolution is defined by the RBW filter, and to adequately res olve a signal frequency, at least
three display points per RBW are needed. Auto RBW set the RBW value to the narrowest
available that will maintain three points per filter width across the screen.
When the RBW is manually set to be narrower than this, the analyzer will continue to sam ple at
least three points per fi lter width, but combines these points before displaying them. The level
shown is a single value calculated from all the levels in the block of frequencies represented by
each display point.
Setting an RBW narrower than span/90 provides only limited improvement in resolution and
none at all beyond span/270.
8.1.2 Benefits of Scan Mode
It can be useful to observe and rec or d frequencies and levels to high resolution over a wide
span. This is outside of the c apabili ty of a conventional swept spectrum analyzer because of
the limited number of collection and display point s available.
For a wide sweep at a narrow RBW the analyzer is collecting more data points than it can
display. Normally these points are discarded with only a sin gl e level (as defined by the
detector) being retained for each display point.
In Scan Mode, all of these data points are retained and are saved in a file. This process is
referred to as a “scan” rather than a sweep. The number of points saved is a function of the
span and the RBW, and is equal to ( 3 x Span/ RBW) +1. For example, for a span of 165MHz at
a 30kHz RBW, the number of point s saved would be 16,501.
The absolute maximum num ber of points that can be stored within a scan is 210,000 whilst the
minimum is 541.
For a conventional sweep of a 200MHz span, the appropriate RBW would be 3MHz providing
limited resolution. Ho wever in scan mode the RBW could be decr eased as far as 3kHz, an
improvement in resolution of 1,000 times.
8.1.3 Displaying Scan Mode Files
Because the scan mode f il e c ontains more points than the 271 of the display, a different
method has be used to show the cont ents.
No information is displaye d while the scan is taking place, and only a progress line is shown.
Once the scan is completed, an ov er view of its contents is displayed. The scan can then be
analyzed in detail using zo om and pan controls.
Note that the scan file is saved within volatile memory and the contents will be lost if the
instrument is turned off , or if scan mode is exited. To ret ain the scan file data it will be
necessary to save it to a perm anent file.
Page 59
Page 61

8.1.4 Saving, Recalling and Exporting Scan Mode Files
Scan
Control
Zoom/
Pan
Marker
Store/
Recall
Cancel/
Exit
Scan
Control
Start
Scan
The files created from scan mode can be saved in a similar way to t race files. These can be
recalled to the display of the PSA or can be exported to a PC for dis pl ay and a nalysis using
PSA-Manager or third party software.
Scan files are saved to the TRA CE S directory of the PSA, and are distinguished from trace files
by having a file name that st ar ts with a $ symbol. Exported files us e a C S V format and can be
chosen to include header information or to omit it.
8.2 Scan Mode Operation
8.2.1 Setting up the Analyzer
The analyzer should be set up pr ior to entering scan mode. It should be set up in a similar way
as for normal sweep mode with the exception of RBW. Auto RBW would cause the RBW to be
set to a value appropriate for the span in normal sweep mode. For scan mode, the RBW
should be set manually t o the value required to achieve the greater frequency resolution
desired.
The narrower the RBW, the lar ger will be the number of poi nts in the scan file and the longer
the scan will take to complete. The number of points = (3 x Span/RBW) +1.
The time taken to perf orm a scan is slightly longer than the t ime to perform a normal sweep at
the same span and RBW/VBW. This time can be seen within the Sweep/BW menu. For
narrow RBW/VBW settings, the sweep can be speeded up usin g the Sweep Time function –
see section 7.5.4.
The maximum span of the analyser i n s c an mode is 10MHz to 3600/6000MHz, however if a
Sweep Mode of D.C. 1 or D.C. 2 has been set, it will be necessary to set t he mode back to
Normal if a start frequency below 30MHz is required.
8.2.2 Entering Scan Mode
Scan mode is selected from the Sweep/BW menu (Sweep/BW > Sweep Control > Scan Mode)
and creates a sub-menu as shown bel ow.
Upon entering scan mode, the existing set-up of the analy zer is s aved and will be restored
when exiting back to normal operation. A Help key provides explanatory inform ation specific to
scan mode.
Many functions become inoperative within scan m ode, these include multiple trac e dis plays,
sweep triggering, frequency counter, vertical sc ali ng and offset, limit actions, data logging and
automatic measurements.
8.2.3 Using Scan Mode
Scan control enables the scan to be started or stopped. If the number of points that
would be created by the scan is below 541 or above 210,000 it will be flagged as
invalid and it will not be possible to start the scan.
starts the scan operation. The progress of the scan through the c hos en span is
indicated by a horizontal yel low line at the base of the graticule moving from left to
right. The approximat e scan t ime is shown at the top right of t he gr aticule once the
scan has commenced. The scan t ime can be reduced from the sweep time function – see
section 4.3.2.
Unlike the normal s weep, t he scan can not be set to automaticall y repeat. Note that the
Run/Stop hard key can also be used to start the scan, but not to abort it.
Page 60
Page 62

stops the scan operation. A scan can not be paused, once aborted the data is lost
Zoom/
Pan
Abort
Scan
Zoom
In
Zoom
Out
Max.
Zoom
and it must be run again from the start.
8.2.3.1 The Scan Display
When a scan is completed, or when a st or ed s can is recalled, the graticule ar ea shows an
overview of the compl ete sc an i n light blue. In addition, the area dir ectly below the graticul e
shows a vertically compressed version in light grey.
Unlike the normal s weep display which shows a
single level for each display point, the scan display
is an envelope created by drawing a vertical line
between the highest and lo west level found for the
block of frequency samples r epresented by each
display point.
A single yellow marker appear s in the centre of
graticule along with a fr equency readout directly
below. The frequency repres ents the centre of the
block of frequencies represented by the display
point. No level is shown.
When the display is zoom ed to show more detail,
the lower area continues to show the full scan, with
the zoomed area represent ed by a grey box. The
marker position is sho wn in green on the lower
display.
In the example shown, the span has been set to
165MHz and the RBW to 30kHz, generating a scan
of 16,501 points.
The zoom has been set to level three giving a
graticule scaling of 2.16MHz per division
(21.6MHz of the span shown within the graticule area, cent red around 229.4MHz).
For this particular scan, the maximum zoom level would be six, giving a scale of 0.27MHz per
division (27 x RBW/3). When this is reached the trace colour changes to green and, because
each display point represents a single data point within the scan, a marker level is displ ayed.
8.2.3.2 Viewing a Scan and using the Marker
Zoom and Pan enables the scan to be observed in detail.
the zoom operates around the posi tion of the marker. Initially the total
number of samples in the scan is di s played, but each zoom st ep s hows a
number of samples which is a binary multiple of 271.
For example, for a scan of 12,000 points, the first level of zoom would be to 8,672 points, then
4,336 points – eventuall y end i ng at 271 points (zoom step 6).
The compressed display cont inues to show the full scan with the zoomed area indicated by a
grey rectangle behind it. The zoomed graticule scaling is s hown in the lower annotation ar ea as
Scale: nnn.nnnn MHz/div.
this key is a shortcut to the m aximum available zoom (a display of the 271 samples
around the marker position). At maximum zoom, each display poi nt represents a
single sample and has a single l evel value associated with it.
At maximum zoom the display col our changes from light blue to green, and the level at the
marker position is displayed in addition to the freque nc y.
Page 61
Page 63

this key is the alternate function of the Max. Zoom key and is therefore only
View Fu ll
Scan
Pan
< Left
Pan
Right >
Marker
Marker
< Left
Marker
Right >
Scroll
Store/
Recall
Store
Recall
Peak
Find
Pan to
Marker
available at maxim um zoom. It is a shortcut back to the display of the full scan
the pan keys move the zoomed dis play in steps of ten display points.
The keys auto repeat. The m ar k er moves with the pan so that its position
on the graticule does not c hange.
In scan mode there is only one marker position. This can be contr olled using the
navigator keys as with a conve ntional sweep marker.
The marker position is duplic ated in the lower display area, and can be moved anywhere in t he
scan including outside of the zoomed area.
in Scroll mode a single press of the Move Left/Right keys cause the selected marker
to move in one pixel steps. Holding a k ey down auto-repeats in lar ger steps. Scroll
mode can also be selected by pressing the down key of the navigat or har d keys.
in Peak Find mode the Move Left/Right keys cause the selected marker to jump to
the next peak of the trace in that di r ec tion. Peak Find mode can also be s elected by
pressing the up key of the navig ator hard keys.
this key moves the zoom ed dis pl ay so as to re-centre it around the current marker
position. It can also be select ed by pressing the centre of t he navigator hard keys
(marked M1/M2).
moves the marker in steps as set by the Scroll or Peak Find funct ion.
The marker can alternatively be moved using left/right keys of the
navigator hard keys.
The marker can be moved anywhere within the scan,
regardless of the zoom level. However, peak find can only be
used within the zoom area (i.e. the graticule area) and scrol l
mode must be selected in order to move outside it.
In scroll mode the marker moves in steps of one display point,
or in steps of 10 display point s with the key held down.
Within the zoomed area the movement is related to the
display points of that ar ea ( i.e. the graticule area), but outside of the zoomed area the
movement is related to the display points of the overvie w display. Consequently when s c rolling
the marker across the whole scan, its speed will reduce whilst c rossing the zoomed ar ea.
Note that the marker fr equenc y acc ur acy is a function of the zoom level
8.2.3.3 Storing and Recalling a Scan
Scan files can be permanently saved for future displa y or for external analysis.
They are stored in the TRACES folder and are distinguished f rom conventional trace
files by having a file name that starts with a $ symbol.
creates a small sub menu enablin g the current scan to be saved under a default
name ($SCANnnn) using Quick Save, or a user defined name ( $xxxxxxx) using
Save As.
opens a file access screen similar to that for Traces - s ee s ection 5.2. Only files
starting with a $ symbol are valid as s can files.
Scan files can be recalled with or without their State. The “state” is the set-up of the analyzer
when the san was originally created. Recalling the s tate enables the scan to be run again using
the same set-up parameter s . Note, however, that this st ate will be lost when exiting from s c an
mode.
Page 62
Page 64

A scan that is recalled without its state retains its frequency and level information so that the
Build for
Export
Store/
Recall
graticule scaling and mark er readout remain correct. However, the information in the upper
annotation area will sho w the current setup rather than the state for the recalled file.
8.2.3.4 Exporting Scan Files
Exportable scan files are in .CSV format (comma separated variable format) and can be
transferred to a PC for extern al us e in a similar way to trace files. However, unlike a trace file, a
scan file has to be “built” before it is exported.
Scan files can contain large amounts of data (up to 210,000 data points) and creating a large
CSV file can take considerable time. To minimise dela ys t he file is stored internall y in a binary
format which is much f aster to create and to read.
To be useable with an externa l pr ogram, the file needs to use a universal format such as CSV .
When the binary file is created, a C S V file of the same name is also cr eated, but initially this file
contains no data.
this function enables the file to be filled with data prior to its transfer to
an external device. If the file is intended only for viewing within the PSA
it is not necessary to use this f unction.
Pressing the key create s a further sub-menu along with a file selection window similar to the file
recall screen. The windo w shows both trace files and scan files. Only scan files (files that
commence with a $ symbol) shoul d be s elected.
Before commencing the proc edur e with the Execute key, the user should choose whether the
file should contain only t he data part of the scan (Data Only) or both the data and a header that
describes the set-up of the analyzer when the file was stored (Data & State).
Some third party analysis programs require that CSV files do not include any header
information. In this c ase Data Only should be selected prior to pr es sing Execute.
Certain programs also require a lower case file extension and/or file name. The PS A uses an
8.3 file name system for which lower case characters are il legal. Any changes to the file name
must therefore be made within the environment of the PC where t he pr ogram is located.
The build procedure takes just under one second per 1,000 poi nts. Consequently for f i les
containing a large number of points, there can be a long dela y. Dur i ng this time a warning
message appears and the Disk lamp will flash.
Copying from the Traces Folder
The Traces folder contains both trace files and scan files. Scan files can be distinguis hed from
Trace files by their file name which always commences with a $ character.
Storing a trace creates a single file that has a .CSV extension. Storing a scan file, however,
creates three files with t he s ame name but different extension (.CSV, .TXT, and . BIN ) . The
.TXT and .BIN files are for internal use only, whilst the .CSV version is for external use only
When viewed on the PSA, extensions are not shown and only one file will be visible. The Copy
function will copy only the . C S V vers ion to the external device.
When viewed from a PC using a USB cable and the Link to PC function, the full contents of t he
folder will be visible including the .BIN and .TXT versions of scan files. These should not be
copied nor altered in any wa y.
Note that a .CSV file is created immediately when the scan is s aved, but that it contain no data
until the Build for Export function is used. Prior to t his , the file will include text but no dat a.
8.2.4 Scan files and PSA-Manager
Scan files can be viewed and analyzed using PSA-Manager (v 3.x or later). PSA-Manager is a
free Windows applicatio n that can be downloaded fr om the Aim-TTi web site.
User instructions are included with the application.
Page 63
Page 65

9 USB Connections | File System & Files Types
9.1.1 Understanding USB Connections
The instrument has two USB por ts only one of which may be used at a time. The required port
is accessed by a sliding shutter which ensures that only the ex posed port can be used.
The Type A port presents a US B hos t interface which will accept flash drives conforming to the
USB Mass Storage Class (MSC). Drives with capacities from 32MB to 32GB are supported.
USB Hard Disk Drives are not s upported and this port is not compatible with any other class of
device including the HUB c lass.
If any unsupported device t ype is c onnected a message will be disp layed to alert the user.
NOTE: Certain small capacity USB flash drives have been seen that try to connect as a hub
before exposing the MSC device. This type of flash drive is not c ompatible and cannot be used
with this instrument .
When a compatible flash drive is connected to the instrum ent there will be no activity until the
Setup/Functions > System/File Ops > File Ops control screen is called up, then the Disk light
will flash and the Switch Drive key will become active. This key wi ll allow access to the fil es
stored on the flash drive. The Copy key in the File Actions cont rol screen will also become
available. See section 9.1.2 “Using an External Flash Drive” f or more information on reading
and writing the flash dri ve.
The Mini B port is for connection t o a P C and has two possible uses, each will cause the
instrument to expose a different device type to the PC. When the instrument is powered on the
Mini B port is inoperative and t he PC, if connected, will not be ab le to 'see' the instrument. The
correct device type will be ex pos ed when the user performs an appropriate action. The two
types of device that the instr ument can expose are Mass Storage Class (MSC) and
Communications Device Cl as s (CDC). These classes and their us es are discussed in the
following paragraphs.
The PSA will expose the MSC when the user executes Setup/Func tions > System/F ile Ops >
File Ops and then chooses the Li nk to PC option from the File Ops cont r ol screen. See section
9.1.3 “Linking to a PC via US B ” for more information.
The instrument will expose the CDC when the user executes Setup/Functions > System/File
Ops > System Utilities follo wed by Status/System > Screen > View on PC. This function i s only
available with Option U02 enabled. For more inf ormation see 17 Appendix A “View on PC”.
It should be noted that CDC is used only for screen data exchange when V iew on PC is
selected. It is not possi ble to transfer file data while in this mode. To exchange files between
instrument and PC requires MSC and in this mode View on PC is not avail able.
The user can, however, switch freely between these m odes by executing the key sequences
above but connection to the View on PC application will be l os t when Link to PC is selected.
9.1.2 Using an External Flash Drive
The USB Type A connector on t he left hand side of the instrument is arranged as USB Host
and is intended exclusively for the connection of a USB Flash Drive. This enables files to be
copied to and from the inter nal memory of the instrument. Note that files cannot be loaded from
or saved to external memory directly.
Copy operations are performed using the File Ops (File O per ations) function - see secti on 5.6.
The instrument pre-defi nes a folder system for the USB Fl as h Drive whereby different file types
are placed in specific f olders. These folders are automatically created when the File O ps
function is selected with a Flash Drive plugged in.
A master folder is created called PSA within which are sub-folders named TRACES, IMAGES,
SETUPS, LOGS, and TABLES. Files c opi ed from the instrument onto the external drive are
automatically placed into the correct folder. However, where files are being placed onto the
external drive from a pers onal computer, they must be put into the correct folder or it will not be
possible to copy them onto the instrument.
Page 64
Page 66

Note that, whenever the File Ops function is first used after a USB Flash Drive has been
plugged in or the instrument has been switched off, the fi les on the Flash Drive will be
interrogated and an information message will appear asking the user to wait for this to take
place.
If the Flash Drive is of large capac ity and/or contains a large n umber of files, the interrogation
could take a long time. If t he us er wishes to abort this procedure, they may do so by simply
unplugging the Flash Dri v e. To avoid long delays, it is r ec om mended that Flash Drives
containing large numbers of un-related files are not us ed.
Note that it is not possible t o c onnect a USB Flash Drive if the US B Link to PC connection is in
place.
9.1.3 Linking to a PC via USB
The USB Type Mini B connector on the left hand side of the inst r ument is arranged as USB
“device” and is intended exclusively for connect ion to the USB port of a personal computer for
the transfer of files to or from the internal memory of the instrument.
The connection should be made using the cable supplied, which is a standard USB Mini B plug
to USB Standard A plug. Not e that it is not possible to use the USB Link to PC when a USB
Flash Drive is connected.
“Link to PC” mode is selected vi a S etup/Functions > System/FileOps > File Ops > Link to PC
see section 5.6. When the key is press ed all spectrum analyzer ac tivity is suspended and the
instrument waits f or the PC to r ec ogni s e its Flash based disc drive and “log it on”.
When the link is enabled, the internal drive of the instrument appears on the PC as a removable
disc drive. When in this condit ion, the PC is in control of the link and file operations are
performed on the PC using Windows Explorer or a similar file system manager.
When in this mode, all of t he us er area of the internal drive becomes accessible. It is
therefore possible to rename files and directories, delete directories or to add i nvalid
files. Care must be taken NOT to do this.
The internal drive contains a master folder named PSA within which are five folders: TRACES,
IMAGES, SETUPS, LOGS, and TABLES. Only the correct file types must be placed into t hes e
folders, no files should be placed in the Root folder and no additional folders created.
Note that it is possible to place files with long filenames into the folders provided that the
extension is correct and the files themselves are valid - s ee s ection 5.6.2.
The link can be closed by pressing t he EXIT hard key. When this happ ens , the instrument rechecks its filing system in order to ensure that changes have not been made that would cause
system problems. This may take several seconds.
When this has been completed, normal spectrum analyzer operation resumes.
9.2 File System and File Types
9.2.1 Internal Filing System Organisation
The organisation of t he inst r ument filing system is not visible to the user from within the
instrument. Although a folder system exists, files are automatically placed into, or retrieved
from, the correct folder whenever a particular type of file is being used.
Similarly, when an external flash drive is connected, the instrument will autom atically select the
correct external folder f or the current file type.
The folder structure of the int ernal drive is only visible when linked to a PC - see section 9.1.3.
9.2.2 File Types
The basic instrument uses t hree file types: Traces, Im ages and S etups. If option U02 is
installed, several further file types become available.
Page 65
Page 67

9.2.3 Trace Files
A trace file represents the swept trace as appears upon the screen. A trace file can be recalled
to the screen as a reference t r ac e (purple).
The file consists of a set of 271 values r epresenting the trace amplitude from left to right ac ross
the screen in CSV (comma s eparated variable) format, plus additional information that defines
the frequency span, RBW, VBW and reference level. Values ar e always in dBm.
The latter information is referred to as the State. When a tr ac e file is recalled, the user can
choose to recall the whole file (Recall Trace & State), the trace amplitude values only (Rec all
Trace) or the State values onl y (Rec all State). Whenever the St ate is recalled, the spectrum
analyser set-up is changed to match the parameters within the recalled file.
Trace files are small being a few kilobytes each. Within the instrument they use an 8.3 naming
format with the extension .CSV. A maximum of 999 files can be stored within the internal
memory of the instrument. Trace files can be copied to a P C and imported into graphing
programs such as Excel, MathCad etc.
Trace files can also be displayed using PSA-Manager s oftware which is supplied on the
accompanying disk or f reel y available to download from the web site.
9.2.4 Screen Image Files
A screen image file represent s a "snapshot" of the whole of the screen excluding the key area.
A screen file can be recalled i n a similar way to an image on a digital camera, whilst sweeping
of the spectrum analyse r is suspended (Paused). It c an also be exported to a PC and printed
for documentation purp oses.
Screen files are indexed c olour bitmaps of about 50 kilobytes in size. Within the instrument
they use an 8.3 naming format with the extension .BMP A maximum of 999 files can be stored
within the internal memory of the instrument. Screen files c an be copied to a PC and imported
into photo viewing and editing programs such as Wi ndows Pictur e and Fax Viewer, Paint,
Photoshop etc.
Image files can also be displa y ed using PSA-Manager software which is supplied on the
accompanying disk or f reel y available to download from the web site.
9.2.5 Setup Files
A setup file records the complete state of the instrument at the point that it was saved, including
marker positions, t he vie w trace and the reference trace.
When option U02 is installed, additional files such as Limit Patterns and Compensation Tables
are also included.
A setup file contains all of the parameters listed within the Factory Default Setup listing (see
Appendix B section 18) with the e xception of screen brightness and Auto power-off timer
settings.
Setup files are small being a few kilobytes each. Within the instrument they use an 8.3 naming
format with t he extension .SET. A maximum of 999 files can be stored within the inter nal
memory of the instrument. Setup files can be copied to a m emory stick or onto a PC for backup
purposes, but have no funct ion outside of the instrument.
9.2.6 Other File Types
When Option U02 is fitted (see sect i on 6) five other file types c an exist. These are Scan files,
Compensation Table files , Limit Pattern files, Chann el M arker files, and Logging files. Details of
the functions are provided within section 6 of the manual.
9.2.6.1 Scan Files
Scan files are created when the analyzer is in Scan Mode (see s ection 8.1). Scan files are
similar to Trace files but c an c ontain much more data (up to 210, 000 entries).
Scan files are located in the TRACES folder, but have a file name that always starts with a $
symbol. A full explanation of Scan files is provided in section 8.2.3.3.
Page 66
Page 68

9.2.6.2 Compensation Tables
Compensation tables are normalised files of amplitude vers us frequency which mus t be created
outside of the instrument using PSA-Manager software. They are a few kilobytes in size.
They files have the extension . CMP and are located in the folder named TABLES. Files can be
transferred using either a US B Flash drive, or by direct connec tion to the USB port of a PC.
9.2.6.3 Limit Pattern and Channel Marker Files
Limit pattern tables ar e normalised files of amplitude versus frequency which must be created
outside of the instrument using PSA-Manager software. They are a few kilobytes in si ze.
They have the extension .CSV and are located in the folder named TABLES. Files can be
transferred using either a US B Flash drive, or by direct connection to the USB port of a PC.
A channel marker file is a special version of a limit pattern file designed to create only vertical
lines. Channel marker file names start with a $ symbol.
9.2.6.4 Logging Files
Logging Files record multiple entries of sweep data in response to a variety of trigger s ignal s .
They can contain several t ypes of data and are variable in siz e up to tens of megabytes. They
have the extension .LOG and are located in the folder named LOGS.
Amplitude values contai ned within a logging file are al wa ys in dBm.
The files are created within the i ns trument and must be transferred to a PC for analysis using
PSA-Manager software. Files can be transferred using either a US B Flash drive, or by direct
connection to the USB port of a P C.
Page 67
Page 69

10 Default Settings | Power On State | Hard Reset
Frequency/Span
(Mode = Centre/Span)
Centre = 3005MHz/1805MHz
Span = 5990MHz/3590MHz
Sweep/Bandwidth
RBW = Auto (10MHz)
VBW = Track,
Sweep Control = Repeat
Trigger = Free Run, Auto Rear m
Sweep Time = Auto
Sweep Mode = Normal (A ut o)
Detector Type = Default (+ ve)
Level/Limits
Ref Level = 0dBm
Units = dBm, Graticule =
Normal
Scale = Normal (10db/div )
75Ohm Compensation = Off
Fixed Offset = Off
Compensation Table = O ff
Limit 1 = Off, Limit 2 = Off
Traces/Markers
Live Trace = On,
View Trace = Off
Reference Trace = Off
Mode = Normal
Display = Single Trace
Marker 1 = On, Marker 2 = Off
Frequency Counter = Of f
Markers Function = Scrol l
Setup/Functions
Logging = Disabled
Auto Measure = Disabled
10.1 Restoring to Factory Defaults
When shipped from the factory, the set-up of the instrument is as described within Appendix B
(section 18). The instr ument can be returned to its factory defaults condition f rom
Setup/Functions > Setups > Load D efaults (see section 4.8.1).
10.2 Standard Preset
The standard preset is access ed by pressing the hard key marked Preset. It returns the
instrument to a set of kno wn cond i tions as below:
(Note that some parameters are relevant only if option U02 is fitted)
M1 = 3005MHz / 1805MHz
M1 Fix = Off
Parameters not included within the listing above ar e left unchanged.
The User Preset is a custom i s able vers ion of the Standard Preset whereby any of the
parameter values of the s tandard preset can be changed to match the requirements of the
current user – see section 4.10.1.
10.3 Unrecoverable Fault Condition - Hard Reset
If the spectrum analyzer gets into a condition in which normal operation is not possi ble, it can
be returned to normal operation by reloading the Fact ory Default settings - see section 4.8.1.
However, if it “locks up” (i.e. will not respond to key presses) or
cannot be recovered by using Load Defaults, it can be put
through a Hard Reset.
The reset button is access ed through a small hole at the t op
right hand side of the case. It can be operated using the stylus
(or other thin rigid objec t). Press and hold for longer than 1
second.
Hard Reset will re-load the operating system, return all
parameters to their factory defaults, and clear all of the nonvolatile buffers. Us er data and s ettings that have been saved
as files will not be affected.
Page 68
Page 70

10.4 Power-On Stat e
The set-up of the instrument each time that it is turned on (from off) is normally set to “Last
Used”. This results in no change occur ring when the instrument is powered off and then back
on.
Alternatively, the user can choose to load the User Preset which overwrites the major settings
with ones chosen by the user (s ee s ection 4.10.1). This choice is made from:
STATUS >System Utils > Power/Clock > P wr-On State - see section 4.9.3.2.
Page 69
Page 71

11 Firmware Updates | Upgrades | Maintenance
11.1 Updating the Firmware
From time to time Aim-TTi may make updated versions of the instr um ent firmware available in
order to add new features or to correct “bugs”. These will be do wnloadable from the Aim-TTi
website without charge. The current version is display ed within the Status display screens.
The method of updating requires the use of a USB Flash drive. Full information on how to
perform the update will be provided with the firm ware f ile.
11.2 Upgrading the Firmware (Option U02)
Installing option U02 is done i n a s imilar way to a firmware update, but an additional step of
entering an activation code will be needed (see secti on 6). Full details are provided with the
option.
11.3 Maintenance, Re-calibration & Cleaning
To ensure that the accuracy of the instrument remains within specification, the cal ibr ation
should be checked (and if necessary adjusted) annually. Aim-TTi or their agents overseas will
provide a calibration service for any PSA3605/6005 and will rep ai r any PSA developing a fault.
Where owners wish to undertak e their own recalibration, this should only be done by skilled
personnel in conjunctio n with the Service Guide which may be obtained directly from Aim-TTi or
their agents overseas. Recalibration requires the us e of a precision signal generator as
specified in the Service G uide
Cleaning: If the unit requires cleaning, use a cloth that is only lightly dampened with water or a
mild detergent. Take parti c ular care in cleaning the t ouc h screen area.
11.4 Battery Replacement
The instrument is f itt ed with a rechargeable Lithium ion polymer battery which should only be
recharged using the charger s upplied.
The battery requires no maintenance but capacity will reduce over time and it may eventually
require replacement. The battery is a custom design and replacements are only available from
Aim-TTi or from our authorised distributor s or agents.
Refer to the Service Guide for detailed inform ation on bat tery replacement and disposal.
Page 70
Page 72

12 Safety Information
Spectrum Analyzer
This instrument is S afety Class III according to IEC classi fication and has been designed t o
meet the requirements of EN61010-1 (Safety Requirements for Electrical Equipment for
Measurement, Contr ol and Laboratory Use).
This instrument has been tested in accordance with EN61010-1 and has been supplied in a
safe condition. This ins truction manual contains s ome information and warnings which have to
be followed by the user to ensure s afe operation and to retain the ins trument in a safe
condition.
This instrument has been des igned for indoor use in a Pollutio n D egr ee 2 environment in the
temperature range 5°C to 40°C, 20% - 80% RH (non-condensin g) . It may occasionally be
subjected to temper atures between +5° and -10°C without degradat ion of its safety. Do not
operate while condensat i on is present.
This instrument is fitted with a rechargeable Lithi um ion polymer battery; do not exp ose the
instrument to heat sources or high-temperature environments such as an unattended vehicle in
the sun. Only recharge the battery, in the instrument, using the charger supplied.
Do not incinerate the ins trument and/or battery; ref er to the Service Guide for information on
battery replacement and disposal.
Use of this instrument in a manner not specified by these instruc tions may impair the safety
protection provided.
WARNING!
All accessible parts will be at the same voltage as the outer body of the N-Type signal input
connector. In particular, note that the shells of both US B c onnectors are galvanically connected
to the body of the signal input and will therefore be at ear th ground potential when either US B
port is connected to a desktop PC . To maintain user safety under all other circumstances it is
essential that the input is not connected to a voltage above 30V dc or 30Vrms with respect to
earth ground which is the limit of Safe Extra Low Voltage (SELV) by IEC definition.
The instrument shall be disc onnected from all voltage sourc es before it is opened for any
adjustment, replacement, maintenance or repair . Any adjustment, maintenance and r epair of
the opened instrument shall be car ried out only by a skilled person in conjunction with the
Service Guide, see Maintenance section 11.3
Do not wet the instrument when cleaning it; see Maintenance section 11.3 for further details.
The following symbols ar e used on the instrument and in this manual.
Direct Current
CAUTION – refer to accompanying documentation.
Damage to the instrument may occur if these precautions are ignored.
Adaptor/Charger
The adaptor/charger supplied has a universal input voltage rating of 100-240VAC, 50/60Hz. It is
a Class II (double insulated) device, fully approved t o E N 60950-1 and UL 60950-1 (UL listing
E245390).
Page 71
Page 73

13 Specification
Frequency Range:
10 MHz to 6000 MHz [10 MHz to 3600 MHz] i n one r ange for Normal
comparison) sweep modes
Setting Modes:
Centre frequency plus Span, or S tart frequency plus Stop frequency
Maximum Span:
5990 MHz [3590 MHz] for Normal sweep mode
Minimum Span:
27 kHz, or Zero Span with dem odulation
Setting Resolution:
100 Hz at any frequency
Setting Accuracy:
Reference Frequency Acc ur ac y for Start, Stop and Centre frequencies.
Initial Accuracy:
Better than ± 1 ppm at 20oC
Stability:
Better than ± 1 ppm over 10oC to 30oC
Ageing:
Better than ± 1 ppm per year
Phase Noise: Typical)
Carrier Frequency = 1 GHz
-83 dBc/Hz at 30 kHz offset
-99 dBc/Hz at 100 kHz offset
-116 dBc/Hz at 1 MHz offset
Carrier Frequency = 3 GHz
-94 dBc/Hz at 30 kHz offset
-109 dBc/Hz at 100 kHz offs et
-117 dBc/Hz at 1 MHz offset
Carrier Frequency = 6 GHz
-83 dBc/Hz at 30 kHz offset
-97 dBc/Hz at 100 kHz offset
-114 dBc/Hz at 1 MHz offset
RBW:
Selectable as 300Hz to 10MH z in 1: 3:10 sequence, or Auto
VBW:
Selectable as 300Hz to 10MH z in 1:3:10 sequence, or RBW Tracking
Number of Markers:
One, Two, or None
Marker Resolution:
0.1 kHz at all frequencies
Marker Accuracy:
1/270th of Frequency Span ± 10Hz + Refer enc e Frequency Accuracy
Frequency Readout:
Display of absolute and dif ference frequencies for bot h markers
Counter Type:
Selectable frequency co unter at the position of the active marker
Resolution:
Selectable as 1kHz, 100Hz or 1 0Hz.
Accuracy:
Reference frequency accuracy +/- 1 count (at > noise level + 25 dB)
Channel markers are vertical lines on the screen based upon frequency
values within a file. They are a spec ial case of Limit Patter ns .
Number of Markers:
Up to 49 markers per file. Two files can be displayed in differing colors.
PSA3605 limits, where dif ferent, are shown in square brackets [ ] after the PSA6005 limits.
13.1.1 Frequency Measurement
Frequency Span
sweep mode
30 MHz to 6000 MHz [30 MHz to 3600 MHz] in one range for DC (data
Reference Frequency Accuracy
Phase Noise (RBW = 3 kHz, VBW = 1 kHz and Positive Detector)
Resoluti on Bandwidth and Video Bandwidth
Frequency Markers
Frequency Counter
Channel Markers (only with Option U02)
Page 72
Page 74

Zero Span Audio Demodulation
Demod. Modes:
AM or FM
Internal Audio:
Internal loudspeaker with adjustable volume and mute
Audio Out:
30 mW into 32 Ohms mono or stereo headphones, adjustable vo lume,
Audio Filter
Selectable low-pass filter to attenuate high fr equency interference.
Display Types:
AM Waveform, FM Waveform, Carrier Level or Carrier Waveform.
Modulation Range:
+/-5% to +/-100% full scale (AM) or +/-1k Hz to +/-1MHz full scale (FM).
Modulation Rate:
35Hz to 100KHz.
Waveform Trigger
Variable trigger point on rising or falling edge.
Display Range:
84 dB typical
Measurement Units
dBm or dBµV (dB milliwatts or dB micro volts)
Reference Level:
Selectable between -40dBm (67 dBµV) and +20dBm (127 dBµV) with a
Ref. Level Accuracy:
Better than ± 1 dB at 2000 MHz at 10 dB bel ow reference level
Level Flatness:
Better than ± 1 dB relative to 2000 MH z o ver 10 MHz to 6000 MHz
Amplitude Linearity:
Better than ± 1 dB over 60dB rang e down from reference level
DANL:
Better than – 120 dBm (-13 dBuV) av er age displayed noise f loor
Noise per Hz:
Better than -160 dBm per Hz equi valent
3rd Order Intermod.:
< – 60dBc (typically -65dBc) for two signals at 10dB below the
Harmonic:
< –65dBc at 10dB below reference level (100MHz)
Signal Images:
<– 55dBc, typically <– 60dBc (Normal sweep, 300Hz to 3MHz RBW)
Other Signal Related
< – 60dBc for signals 10dB below the reference level.
Residual Spurii:
< – 70 dB below the reference level.
Number of Markers:
One, Two, or None
Marker Resolution:
0.1 dB
Amplitude Readout:
Display of absolute and dif ference amplitudes for both markers in
Limit Types:
Limit Lines from num er ic values , or Limit Patterns from F i les . Pattern
Number of Limits :
One or two limits on screen. Up to 999 patterns can be stored
Limits Comparator :
Conditions of Above, Below, Inside or Outside creat ing ac tions of
3.5mm jack socket (auto disconnect of internal loudspeaker)
2 pole filter with turnover poi nt at approximately 3 kHz.
Zero Span Waveform Demodulation (only with Option U02)
13.1.2 Amplitude Measurement (Level)
Amplitude Range
resolution of 1dB
Amplitude Accuracy
[10 MHz to 3600 MHz]
Displayed Average Noi se Level (DANL)
(ref. level = – 40 dBm (+67 dBuV), RBW = 10 kHz, VBW = 1 kHz, span
1MHz) over 10 MHz to 5500 MHz [10 MHz to 3600 MHz]
Distortion and Spurii
reference level, 500MHz and 502MHz.
Spurii
Amplitude Markers
graticule units (dBm or dBuV) or linear units (mV or uW).
Amplitude Limits (only with Option U02)
files are created using PSA-Manager software.
beep, stop sweep, log sweep and pul s e out
Page 73
Page 75

Amplitude Compensation (only with Option U02)
Offset:
Amplitude can be offs et by up to +/-50dB to compensate for external
75Ω Compensation
Compensation can be made for inputs from a 75Ω source impedance.
Compensation
Linearly interpolated t ables of up to 49 frequency/amplitude points can
PSA-Manager software.
Measurement Types:
Channel Power, Adjacent Channel Power Ratio, Occupied Bandwidth.
Data Points:
1081 data points are used for calculation.
Measurement Type:
Single or Continuous.
Channel Power:
Displays power for a user-set centre frequency and channel width.
Adjacent Channel
Displays the absolute power of the main channel and the relative
Occupied Bandwidth:
Positions markers and displays bandwidth and true power centre
frequency for a user-s e t % power across the set sweep.
Sweep Method:
Detection for 271 points per sweep. The level, as set by the detector
(sub-span = span/270).
Sweep Time:
Set automatically by Sp an, RBW/VBW and Sweep Mode.
Sweep Control:
Normal (repeat) or Singl e , (Triggerable with Option U02)
Sweep Trigger
(Only with Option U02), External or Limits Com parator
Sweep Modes
Several sweep modes can be selected offering a different balance
Detector Type
Selectable as Positive Peak ( default), Negative Peak, Alternate Peak,
Sample, Linear or Log Avera ge, or RMS.
Graticule:
8.5 x 10 divisions light gr ey graticule. Selectable as normal, dim, or
Displayed Points:
271 points per sweep.
Number of Traces:
Up to 3 – Live, View and Reference (up to 4 when in Dual Trace
Live Trace:
Dot-joined trace fr om curr ent or held sweep. Selectable on or off.
View Trace
Additional trace created from the live trace. Select abl e on or off.
Reference Trace:
Trace recalled from a f ile. S elec table on or off.
Trace Modes:
Normal, Peak Hold, or Average (2 to 48 sweeps)
Dual Trace Option:
In Peak Hold or Average trac e modes, the Normal trace can be
Scan Method:
High resolution capture of up to 210,000 points defined by span and
RBW. Number of points = 3 x (Span/RBW) +1.
Scan Display:
Over-view display of whole scan with Zoom and Pan c apability to
Marker:
Moveable marker with frequency readout with Pan/Zoom around
marker point. Amplit ude readout at maximum magnification.
attenuation or gain.
Tables:
Automatic Measurements (only with Option U02)
Power Ratio:
be used. Up to 999 tables can be stored. Table files are creat ed us ing
power of the upper and lower adjacent channels.
13.1.3 Sweep and Traces
Sweep
type (default = positive peak) , found within each sub-span is stored
Manual control is provided enabling sweep time to be reduced in three
steps subject to a potential r educ tion in level accuracy.
between image reject i on and sweep speed.
Traces
off.
mode)
displayed simultaneously with the processed t race.
13.1.4 Scan Mode (only with Option U02)
magnify view up to 1 display poi nt per capture point.
Page 74
Page 76

File Storage:
Scan files can be saved under automatic or user defined names and
recalled to the screen or exported to external programs.
Memory Type:
Internal non volatile Flash memory (1.8GB nominal).
Store Trace:
Up to 999 traces can be stored under either default file names or user
Recall Trace:
Recalls any stored trace to the reference trace of the display. The
State can be recalled independently from the Trace
Store Screen:
This function copies the whole screen area (excluding key area) to
Recall Screen:
Recalls any stored screen image to the display.
Store Set-up:
Up to 999 instrument set -ups can be stored under either def aul t file
Recall Set-up:
Recalls any stored set-up, overwriting the existing settings of the
instrument.
Store Scan:
Only with Option U02. Up to 999 scans c an be stored under either
Recall Scan:
Recalls any stored Scan to the display. The State can be recalled
Store Logging File:
Only with Option U02. Up to 999 logging files can be stored for
download and analysis by PSA-Manager software.
Log Files
Files of up to 25,000 data entries can be created. Up to 999 files can
Logged Data:
Log files can be created f rom Peak Value, Centre Frequency Level,
Log Trigger:
Log entry can be triggered by Key Pres s, Continuous (every s wee p) ,
Timer Interval
Adjustable between 2 seconds and 100 minutes per entry
Time Stamp
Each entry is time stamped from the real-time clock
Input Connector:
N connector, 50 Ohms
VSWR:
1.5:1 typical
Maximum
Absolute Maximum Input Leve l:
Power Connector:
1.3mm dc power socket for A C power adaptor/charger as supplied.
USB link to PC
Mini USB connector (5 pin mini B) which acts as a USB “device” for
13.1.5 Memory Storage and Data Logging
Memory Storage
entered file names. Tr aces are stored as tables of am pli tude versus
frequency and can be im ported into other programs, as well as be i ng
recalled to the screen. Trac es can be stored from either the live tr ace
or the view trace and include St ate information.
memory as a bit-map image. U p to 999 sc reens can be stored under
either default file names or user entered file names..
names or user entered file names. All settings of the instrument are
saved.
default file names or user entered file names. Scans are stored as
tables of amplitude versus frequency and can be imported into other
programs, as well as being recalled to the screen. Sc ans can include
State information.
independently from the S c an.
Data Logging (only with Option U02)
be stored. Files are read using PSA-Manager Software.
Complete Sweep, or Screen Image
External Input, Inter nal Timer, or Limits Comparator
13.1.6 Connectors and Display
Signal Input
Input Level:
Other Connectors
interface:
+ 25 dBm or +132 dBµV (4V rms) or 50V dc
connection to a personal computer.
Page 75
Page 77

USB Flash Drive
interface:
USB standard A connector (USB Host) for connection of US B Flash
Audio Connector:
3.5 mm jack socket for demodulated au dio out (mono/stereo plugs) .
Trigger connector:
3.5mm mono jack socket for connection of BNC adaptor (supplied) .
Display Type:
4.3 inch (10.9 cm) transflective backlit TFT LCD, 480 x 272 pix el s
Graticule:
8.5 x 10 divisions light gr ey graticule. Selectable as normal, dim,
The PSAxx05 operates f rom internal rechargeable batter ies. The
Battery Type:
Li-ion 3.7V, 3Ahr nominal
Battery Life:
> 3 hours continuous operation
Recharge Time:
< 3 hours from fully discharged
Auto-Sleep Mode:
To conserve battery life, the system can be set to automatically switch
The PSAxx05 can be operated continuous ly from mains power using
Input Voltage
Range:
100V to 240V nominal 50Hz/60Hz. Interchangeable plus for UK, Euro,
USA and Australia are suppli ed.
Size:
192 x 92 x 49mm (7.5 x 3.6 x 1.9”) plus 12mm projection of N-Type
Weight:
560 grms (1lb 4oz).
Tilt Stand:
Built-in tilt stand for bench use which angles the unit at approximately
Screen Protector
For portable use, the tilt s tand can be moved from the rear of the
instrument to the front where it acts as a s c reen protector/sun shield.
Operating Range:
+5oC to + 40oC, 20% to 80% RH.
Storage Range:
-10oC to +50oC
Environmental:
Indoor use at altitudes to 2000m, Pollution Degree 2.
Safety & EMC:
Complies with EN60950-1 & EN61326-1.
Display
memory d rive
total, 16 colours, resistive touch screen.
levels only, or off.
13.1.7 Power Requirements
Battery Operation
batteries are recharged using the AC power adaptor supplied.
into sleep mode after a defined time from the last key pres s . This can
be set between 5 mins and 60 mins (or never).
AC Line Operation
the AC power adaptor provided b y Aim-TTi. This also recharges the
internal battery.
13.1.8 Mechanical, Environmental and Safet y
Mechanical
signal connector
40 degrees to the horizontal.
Environmental and Safety
For details, request the E U Dec l ar ation of Conformity for this
instrument via
http://www.aimtti.com/support (serial no. needed).
Page 76
Page 78

14 Appendix A: Optional Accessories
Firmware Upgrade (PSA-U02) – provides increas ed c apabilities - see sec tion 6 .
Fitted Soft Case (PSA-SC2) – protective carrying case with space for accessories
Telescopic Antenna (PSA-ANT2) – wideband telescopic antenna with adaptor for N-type
connection direct to the PSA.
Vehicle Charger (PSA-VC) – charger operat ing from 12V or 24V.
NOTE: All of the above items are included within the PSA3605USC and PSA6005US C
products.
Connection Kit (PSA-CK) – high quality SMA connection cable a long with adaptors to and
from N-Type connectors, plus N to BNC adaptor for lower frequency cable connections.
15 Appendix B: PSA-Manager and PSA-View Software
PSA-Manager is a Windows* PC application for the creation, editing, analysis and management
of PSAxx05 files. It is compatible with versions of Windows from XP onwards ( i nc luding 32 and
64 bit versions).
PSA-Manager is supplied on the CD accompanying the instrument, or may be freely
downloaded from the web sit e which may have an updated versi on. A secondary application
called PSA-View is similarly av ailable.
An explanation of how to use PSA -Manager is provided within the pr ogram’s own Help funct i on.
PSA-Manager Functions
Trace File Display
Trace files do wnlo aded from the instrum ent can be viewed on the PC.
Limit Patterns Creation
Limit pattern files c an be us ed within the Limits function of the instrument when option U02 is
installed. Limit patt er ns are tables of amplitude against frequency that are created within PSAManager and uploaded to the instrument.
Limit pattern table f iles can be created from scratch or imported and edited from CS V fi les .
Editing tools include bot h numeric entry and graphical editing.
Channel Marker List Creation
Channel Marker List files are a spec ial type of limit pattern file that contain only vertical li nes .
They can be particularly useful for showing channel positi on frequencies. PSA-Manager
provides an editor that enab l es them to be created by entering a list of frequencies. They have
the same extension as a limit pattern file (.CSV) but the file name commences with $ symbol.
Compensation Tables Creation
Compensation tables fi les c an be used within the Offset /Tables function of the instrument when
option U02 is installed. Compensation tables are normalised tables of amplitude against
frequency that are created within PSA-Manager and uploaded to the instrument.
Compensation table files can be created from scratch or imported and edited from CSV files.
Editing tools include bot h numeric entry and graphical editing.
Log File Analysis
Logging files downloaded from the instrument can be viewed and analysed. (The logging
function requires Opti on U02)
Page 77
Page 79

PSA-View
PSA-View is an additional PC applic ation which can be used with the View-on-PC function of
the instrument when option U02 is installed. It enables t he screen of the instrument to be
duplicated on the PC at any desired s ize.
The View on PC function places the instrument into a special mode in which the graphics of the
display are sent to a PC via USB. The screen can then be viewed at an y size using the
PSA-View application which m ay be supplied on the CD accompanying the instrument or is
freely available from A im-TTi website.
To communicate with PSA-View, the USB interface functions as a virtual COM port which can
be controlled by a PC as if it was an RS232 device. The instrum ent is supplied with a CD
containing a .inf file for the standard Mic r os oft drivers available in Windows 2000, XP, Vista and
Windows 7 and 8; the installation wizard will install t he dr iver (32-bit or 64-bit) appropriate to the
PC’s operating system. Any updates are available via the Aim-TTi website.
Installation of the interface driver is achieved by c onnecting the instrument t o a P C via the USB
cable supplied and sele c ting Setup/Functions > System/file Ops > System Utilit ies followed by
Status/System > Screen > View on PC. The Windows’ plug and play functions should
automatically recognise the addition of new hardware attached to the USB interface and, if this
is the first time the connect i on has been made, prompt for the location of a suitable driver. (If
this does not happen, it will be necessary to open Device Manager on the PC and force a
manual installation of the driver).
On installing the driver, Windows will establish a virtual COM port within the PC. The number of
the new COM port will depend upon the number of co-existing COM ports. The driver will
remain installed on the PC s o that the establishment of a virt ual COM port is done automatically
each time the instrument is connected to the PC via USB in the future. The instrument is
assigned a new virtual COM port when it is first connected and t he s ame COM port will be
assigned each time that instrument is subsequently connec ted.
Once the driver is loaded, and with the instrument still connected to the PC, open the PSA-View
application on the PC. PSA-V iew will load with two windows open, the graphics windo w which
will initially contain t he message "No Communication Link" and a control window. On the cont rol
window COM Port dropdown select the C OM port which is connected to the instrument.
To discover which COM port this is the user can look in Device Manage r where the virtual COM
ports are displayed with the name of the device that they are connected to. e.g PSAxx05
Spectrum Analyser (COM8). Once the COM port is selected c li c k on the Connect button and,
after a short delay, the ins trument screen data should appear in the graphics window.
Thereafter changes on the instrument screen will also be seen in the graphics wi n d o w.
Operation of the instr ument will slow down a little due to t he lar ge volume of data now flowing t o
the PC.
To stop viewing on the PC do an y of the following:
Close the PSA-View application and disconnect the USB c able | or | Select View on PC again
and press Status in response to the information box | or |Power off the instrument | or | Set the
instrument into Link t o PC mode.
Before using PSA-View and the V iew on PC function, it is advisab le to read section 9.1.1 which
explains USB connections in more detail.
* Windows is a trademark of Microsoft, inc.
Page 78
Page 80

16 Appendix C: Factory Default Settings
Frequency/Span
(Mode = Centre/Span)
Centre = 3000.0000MHz
(Start = 2750.0000MHz)
Span = 500.0000MHz
(Stop = 3250.0000MHz)
Fix Start/Fix Stop = Off
Freq. Presets = Empty
Step Size = 1.0000MHz
Auto Step Size = Off
Zero Span Demodulation
Demod = AM, Depth = +/-100%
Wvfrm Display = Carrier L evel
Off
Sweep/Bandwidth
RBW = Auto (10MHz)
VBW = Track, Trk Offset = 0
Sweep Time = Auto
Sweep Control = Repeat
Rearm
Sweep Mode = Normal (Auto)
Detector Type = Default (+ ve)
Level/Limits
Ref Level = 0dBm
Units = dBm, Graticule =
Normal
Scale = Normal (10db/div )
Offset/Tables
75Ohm Compensation = Off
Fixed Offset = Off (set to -10dB)
Compensation Table = O ff
Compensation File = None
Limits
Limit 1 = Off (set to -50dBm)
Pattern Files = None
Limit Condition = None
Limit Offsets = 0, Step = 1dB
Traces/Markers
Live Trace = On
Reference Trace = Off
Ref. Trace File = None
Trace Mode
Mode = Normal
Average Number = 16
Display = Single Trace
Trace Stores
Store Type = Live Trace
Recall Type = Trace Only
Default File Names = TRACE
and IMAGE
Marker Setup
Marker 1 = On, Marker 2 = Off
Frequency Counter = Of f
Marker Units = As Graticu le
M1 Fix = Off
Setup/Functions
Status = Disabled
Default File Name = LOG_
Trigger =Timer
Auto Measure
Status = Disabled
Ch. Power BW = 0.0160 MHz
Occupied B/W = 99.000 %
Frequency Counter
Status = Off
Resolution = 1kHz
Setups
Default File Name = SETUP
System/File Ops
Selected Folder = TRACES
Brightness = 40%
System Utilities
View on PC = Disabled
Auto Power Off = Never
Power-On State = Last Used
When shipped from the factory, or following a reset to factory defaults, or operation of the hard
reset button, the instr ument will be set up as follows:
(note that some parameters are relevant only if Option U02 is fitted)
Setup
Trace Control
Audio Volume = 6, Mute = On
Limit 2 = Off (set to -60dBm)
View Trace = Off
Timebase = 20ms/div, Tr ig =
Trigger = Free Run, Auto
Limit Action = None
Logging
M1 = 3000MHz, M2 = 3050MHz
Type = Centre Level
Mode = Repeat
Type = Channel Power
Markers Function = Scroll
Timer Interval = 1 sec.
Channel Spacing = 0.025 0 M Hz
The operation to reset to Factory Defaults is described in section 4.8.1.
Page 79
Page 81

17 Appendix D: Menu Tree Diagram
Page 80
Page 82

Page 81
Page 83

Thurlby Thandar Instruments
Ltd
.
Glebe Road • Huntingdon • Cambridgeshire • PE29 7DR • England (United Kingdom
Telephone: +44 (0)1480 412451 • Fax: +44 (0)1480 450409
International web site:
Aim Instruments and Thurlby Thandar Instruments
www
.aimtti.com • UK web site:
Email: info@aimtti.com
)
www
.aimtti.co.uk
Book Part No. 48511-1590 Issue 7
 Loading...