

Page 1

PSA2702 & PSA1302
2.7GHz & 1.3GHz Spectrum Analyzers
Page 2

CONTENTS
1 Product Introduction .................................................................................................... 5
1.1 Items Supplied ......................................................................................................... 5
1.2 Using this Manual - Cross References .................................................................... 5
1.3 Product Description and Capabilities ....................................................................... 5
1.4 Initial Use - Charging the Battery | Switching On ..................................................... 6
1.4.1 Setting the Date and Tim e ...................................................................................... 6
2 Basics of Operation ..................................................................................................... 7
2.1 External Connections ............................................................................................... 7
2.1.1 DC Power Input ...................................................................................................... 7
2.1.2 RF Signal Input ...................................................................................................... 7
2.1.3 Demodulated Audio Output .................................................................................... 7
2.1.4 USB Host Connector (for USB Flash Memory) ....................................................... 8
2.1.5 USB Device Connector (for connection to a PC) .................................................... 8
2.1.6 Trigger Input/Output ............................................................................................... 8
2.2 Bench-top and Portable Use .................................................................................... 8
2.2.1 Tilt Stand ................................................................................................................ 8
2.2.2 Screen Protector and Sun Shield ........................................................................... 8
2.3 Batteries and AC Line Power ................................................................................... 9
2.3.1 Battery Operation ................................................................................................... 9
2.3.2 AC Line Operation .................................................................................................. 9
2.3.3 Power Saving for Battery Operation ....................................................................... 9
2.4 Display and Controls Layout .................................................................................. 10
2.5 Touch Screen Operati on ........................................................................................ 11
2.5.1 Finger Tip Operation ............................................................................................ 11
2.5.2 Stylus Operation ................................................................................................... 11
2.5.3 Operation using only the Hard Keys ..................................................................... 11
2.5.4 Navigator Keys - Mode Selection ......................................................................... 11
2.6 Instrument Status Information ................................................................................ 11
2.7 On-screen Help ...................................................................................................... 11
3 Quick Start Guide ....................................................................................................... 12
4 Operation using the Menu System ........................................................................... 13
4.1 Setting the Frequency Range of the Sweep .......................................................... 13
4.1.1 Centre .................................................................................................................. 14
4.1.2 Span ..................................................................................................................... 14
4.1.3 Start/Stop ............................................................................................................. 15
4.1.4 Step Size .............................................................................................................. 15
4.1.5 Frequency Presets ............................................................................................... 16
4.2 Sweep Time ........................................................................................................... 16
4.3 Zero Span Mode (Demodulation Mode) ................................................................. 16
4.4 Setting the Sweep Mode and Sweep Bandwidth (RBW) ....................................... 17
4.4.1 RBW ..................................................................................................................... 17
4.4.2 Video Filter ........................................................................................................... 17
4.4.3 Sweep .................................................................................................................. 17
4.4.3.1 Sweep Rate and the Sweep Progress I ndi cator Line ..................................... 18
4.4.3.2 Manually Controlling the Sweep .................................................................... 18
4.4.3.3 Triggered Sweep (when fitted) ....................................................................... 18
4.5 Setting the Level Attenuator, Amplitude Scale, and Limits .................................... 19
4.5.1 Measurement Units and Gr aticule ........................................................................ 19
4.5.2 Reference Level ................................................................................................... 19
Page 1
Page 3

4.5.3
Vertical Scaling ..................................................................................................... 20
4.5.4 Amplitude Offset and Compensation Tables (when fitted) .................................... 20
4.5.5 Amplitude Limits ( when fitted) ............................................................................... 20
4.5.5.1 Channel Marker Files ..................................................................................... 21
4.5.6 Overload Indication ............................................................................................... 21
4.6 Controlling and Storing Traces and Images ........................................................... 22
4.6.1 Displaying Traces; Controlling the View Trace ..................................................... 22
4.6.1.1 Understanding the Live, V i ew and Reference Traces .................................... 22
4.6.2 Sweep Progress Indicator Li ne ............................................................................. 23
4.6.3 Setting the Trace W rit ing Mode ............................................................................ 23
4.6.3.1 Dual Trace Mode ........................................................................................... 24
4.6.4 Storing and Recalling Trac es and Screen Images ................................................ 24
4.7 Using Measurement Markers ................................................................................. 25
4.7.1 Setting-up Markers ............................................................................................... 25
4.7.2 Controlling Markers .............................................................................................. 26
4.7.2.1 Controlling Markers with the Hard Keys ......................................................... 26
4.7.2.2 Further Notes on the Use of Marker s ............................................................. 26
4.8 Data Logging Functions (when fitted) ..................................................................... 28
4.8.1 Setting-up the Logging Func tion ........................................................................... 28
4.9 Storing and Recalling Set-ups | System Settings ................................................... 29
4.9.1 Storing and Recalling Instrument Setups .............................................................. 29
4.9.2 System Settings, Screen B r i ghtness, Filing System and USB Operations ............ 29
4.10 Status Information | On-screen Help | System Utilities ........................................ 30
4.10.1 Status Display ...................................................................................................... 30
4.10.2 Help Screens ........................................................................................................ 30
4.10.3 System Utilities ..................................................................................................... 30
4.10.3.1 Screen Utilities ............................................................................................... 30
4.10.3.2 Power Options, Power-on State, Clock Setting .............................................. 31
4.10.3.3 Alerts ............................................................................................................. 31
4.10.3.4 Preferences ................................................................................................... 31
4.10.3.5 System Updating and Calibration .................................................................. 31
4.11 Using Instrument Presets | Automatic Setting ..................................................... 32
4.11.1 The User Preset ................................................................................................... 32
4.11.2 Custom Presets (when fit ted) ............................................................................... 32
5 File Storage for Traces, Screen Images & Set-ups .................................................. 33
5.1 Storing Traces or Screens ...................................................................................... 33
5.1.1.1 Default File Name Rules ................................................................................ 34
5.2 Recalling Traces and Images ................................................................................. 34
5.2.1 Traces and States ................................................................................................ 34
5.3 Storing Instrument Set-up Files .............................................................................. 35
5.4 File Recall Screen .................................................................................................. 35
5.5 File Utilities Screen ................................................................................................. 36
5.6 File Operations Screen ........................................................................................... 36
5.6.1 Editing File Names ............................................................................................... 37
5.6.2 File Names Created or Renamed Externally ........................................................ 37
6 Upgrade Option U01 ................................................................................................... 38
6.1 Additional Functions from Option U01 .................................................................... 38
6.1.1 Logging of Values, Traces or S creens .................................................................. 38
6.1.2 Triggering ............................................................................................................. 38
6.1.3 Limit Lines, Limit Pat terns & Channel Markers ..................................................... 38
6.1.4 Level Offsets ........................................................................................................ 38
Page 2
Page 4

6.1.5
Compensation Tables .......................................................................................... 38
6.1.6 Custom Presets .................................................................................................... 38
6.1.7 View on PC .......................................................................................................... 38
6.1.8 PSA-Manager Software ........................................................................................ 39
7 Further Notes on Operation....................................................................................... 40
7.1 Signal Overload Levels and Indication ................................................................... 40
7.2 Operation using the Hard Keys Only ..................................................................... 40
7.3 Setting Frequencies ............................................................................................... 41
7.3.1 Set by Keypad ...................................................................................................... 41
7.3.2 Set by Tab/Jog ..................................................................................................... 41
7.3.3 Shortcuts to setting a Specific Frequency Span ................................................... 41
7.3.4 Repetitive Operations ........................................................................................... 42
7.3.5 Using Custom Presets (when fitted) ..................................................................... 42
7.3.6 Creating Channel Mark er s (when fitted) ............................................................... 43
7.4 Measuring Relative Amplitude ............................................................................... 43
7.5 Triggered Operation ............................................................................................... 44
7.5.1 External Trigger Input ........................................................................................... 44
7.5.2 Trigger Output ...................................................................................................... 44
7.6 Level Offset and Compensation Tables ................................................................. 44
7.6.1 Dynamic Range and Maxim um Signal ................................................................. 44
7.6.2 Creating and using Compensation Tables ............................................................ 44
7.7 Limit Lines & the Limits Comparator | Creating Limit Patterns ............................... 45
7.7.1 Setting Limits ........................................................................................................ 45
7.7.2 The Limit Comparator ........................................................................................... 45
7.7.3 Creating and Loading Limit Patterns .................................................................... 46
7.7.4 Limit Offset ........................................................................................................... 46
7.7.5 Limit Fix/Unfix ....................................................................................................... 46
7.7.6 Creating and Loading Channel Markers ............................................................... 46
7.8 The Logging Function ............................................................................................ 47
7.8.1 The Logging Control Menu ................................................................................... 47
7.8.2 Manual Logging .................................................................................................... 48
7.8.2.1 The Run/Stop key and Sweep Control key .................................................... 48
7.8.3 Logging from the Tim er ........................................................................................ 48
7.8.4 Logging from External Tr i gger .............................................................................. 48
7.8.5 Logging from Amplitude Limits ............................................................................. 48
7.8.6 Logging Every Sweep (Continuous) ..................................................................... 49
7.8.7 File Sizes and Maximum Logging Times .............................................................. 49
7.8.8 Viewing and Analyzing Logging Files ................................................................... 49
8 USB Connections | File System & Files Types ........................................................ 50
8.1.1 Understanding USB Connect ions ......................................................................... 50
8.1.2 Using an External Flash Drive .............................................................................. 50
8.1.3 Linking to a PC via USB ....................................................................................... 51
8.2 File System and File Types.................................................................................... 51
8.2.1 Internal Filing System Organisation ...................................................................... 51
8.2.2 File Types............................................................................................................. 52
8.2.3 Trace Files ........................................................................................................... 52
8.2.4 Screen Image Files .............................................................................................. 52
8.2.5 Setup Files ........................................................................................................... 52
8.2.6 Other File Types ................................................................................................... 53
8.2.6.1 Compensation Tables .................................................................................... 53
8.2.6.2 Limit Pattern and Channel Mark er Files ......................................................... 53
Page 3
Page 5

8.2.6.3
Logging Files ................................................................................................. 53
9 Default Settings | Power On State | Hard Reset ....................................................... 54
9.1 Restoring to Factory Defaults ................................................................................. 54
9.2 Standard Preset ..................................................................................................... 54
9.3 Unrecoverable Fault Condition - Hard Reset .......................................................... 54
9.4 Power-On State ...................................................................................................... 55
10 Firmware Updates | Upgrades | Maintenance ....................................................... 55
10.1 Updating the Firmware ........................................................................................ 55
10.2 Upgrading the Firmware (Option U01) ................................................................ 55
10.3 Maintenance, Re-calibration & Cleaning ............................................................. 55
10.4 Battery Replacement ........................................................................................... 55
11 Safety Information ................................................................................................... 56
12 Specification ............................................................................................................ 57
12.1.1 Frequency Measurement ...................................................................................... 57
12.1.2 Amplitude Measurement (Level) ........................................................................... 57
12.1.3 Sweep and Traces ................................................................................................ 58
12.1.4 Memory Storage and Data Logging ...................................................................... 59
12.1.5 Connectors and Displa y ....................................................................................... 59
12.1.6 Power Requirements ............................................................................................ 60
12.1.7 Mechanical, Environmental and Safety ................................................................. 60
13 Appendix A: Optional Accessories ....................................................................... 61
14 Appendix B: PSA-Manager and PSA-View Software ........................................... 61
15 Appendix C: Factory Default Settings .................................................................. 63
16 Appendix D: Menu Tree Diagram .......................................................................... 64
Page 4
Page 6

1 Product Introduction
1.1 Items Supplied
Portable Spectrum Analyzer (PSA1302 or PSA2702) wi t h removable stylus and detachable
bench-stand/screen-protector.
Spare stylus duplicates the stylus fitted into the instrument.
USB lead Mini B plug to standard A plug.
Trigger input converter plug 3.5mm jack to BNC socket.
AC line power-supply/charger Universal voltage with interc hangeable country spec i fic plugs.
Short Guide (English, French, German, Italian and Spanish).
Full instruction manual ( E ngl is h only).
Support CD Containing hyper-linked PDF versions of the printed manuals, plus support files.
1.2 Using this Manual - Cross References
This manual covers both t he PSA2702 and PSA1302 spectrum analyzers. Within the t ext they
may be referred to jointly as PSAxx02 or PSA Series 2. T he manual is also provided as a PDF
file on the accompanying CD. The manual includes many cross references which are sho wn as
follows - see section X.X. The Table of Contents is also fully hyperlinked.
Within a PDF file, the shaded number is a hyperlink to that s ec tion number which enables the
user to jump rapidly to the sect i on r eferred to and then jum p back to continue reading the
original section. (N.B . for hyperlink navigation within Acrobat Reader, enable “ s how all page
navigation tools” or use the keyboard shortcuts Alt+Right_Arrow and Alt+Left_Arrow).
1.3 Product Description and Capabilitie s
The PSA2702 and PSA1302 ar e fully portable RF spectrum analyzers that incorporate a high
resolution colour TFT touch screen. They are sufficiently small and lightweight to be operated
as true handheld instruments and have a battery life of more than 8 hours from each charge.
As bench instruments they can be powered by the supplied ac-line adaptor/charger. T hey can
be set horizontally or vertically, or at an angle of about 40 degr ees using the built-in til t stand.
For field use, the stand can be moved to the top of the instrument to form a screen protector
and sun shield.
The frequency range is 1MHz to 2700MHz (PSA2702) or 1MHz to 1300MH z (PSA1302). The
span can be set between 0.270 MHz and 2699.000 MHz or 1299.000 MHz respectively with a
setting resolution of 1kHz. Start, stop or centre frequencies can be se t to the same resolution.
The resolution bandwidth (RBW) is selectable as 1MHz, 280k Hz or 15kHz.
The on-screen amplitude r ange is 85 dB with a reference level of -20dBm or 0dBm. Amplitudes
can alternatively be dis played in dBµV. Vertical magnification down to 1dB/di v can be s elec ted.
Average noise floor is better than -95dBm at -20dBm reference level and 15 kHz RBW (video
filter on).
Sweeps can be repeating or single s hot, and the trace can be normal (over-write), peak hold or
average (2 to 48 sweeps). A zero span mode is available with AM or FM audio demodulation
via a built-in speaker.
Twin vertical marker lines are available giving a readout of frequency and ampl itude together
with difference values. Markers can be manually positioned or automaticall y peak finding or
tracking.
A reference trace and a view trac e c an be displayed in addition to t he live trace. Up to 999
traces can be stored to permanent memory for recall to the sc reen or for data export. 999
Page 5
Page 7

instrument set-ups and 999 complete screen bitmaps can also be stored. All fil es c an be gi v en
user defined names.
USB interfaces are provided for direct file transfer t o a P C or for connection of a USB Flash
drive.
Extensive convenience features for repetitive oper ation include auto-set, frequency presets,
and storage of the instrument state together with the tr ace file for simultaneous or independent
recall.
Pressing the Status/Help hard key brings up a full status screen and access to help sc r eens
relevant to the current menu position.
An optional upgrade package ( r etro installable) provides additional features i nc luding data
logging, sweep triggering, limit patterns, and compensation tables - see s ec tion 6.
More details of the product capabilities are given in the S pec ifications - section 14.
1.4 Initial Use - Charging the Battery | Switchi ng O n
As supplied, the internal battery is likely to be partly or fully discharged. At fir s t us e, the
instrument should therefore be plugged into the char ger until the lamp next to the char ge s ocket
stops flashing, which could take up to three hours - see section 2.1.1. The instrument can still
be used during this period.
The instrument is turned on or off by pressing the sm all round key marked Power for about one
second. When turning on, t he s creen backlight will flash briefly to indicate that the key press
has been recognised, there is then a short delay prior to operat ion starting.
If the battery is too f ar dischar ged to allow operation, the instrument will turn of f again and a
second short beep will be sounded.
1.4.1 Setting the Date and Time
The instrument contai ns a r eal -time clock that is used for time stamping of files. As supplied
the date and/or time may be incorrect.
Date and time can be checked from page 4 of the Status screens, or can be checked and
altered from Setup/Functions > System/File Ops > S ystem Utilities > Power/Clock.
Note that the date format is DD -MM-YY and the time format is 24 hour .
Page 6
Page 8
2 Basics of Operation
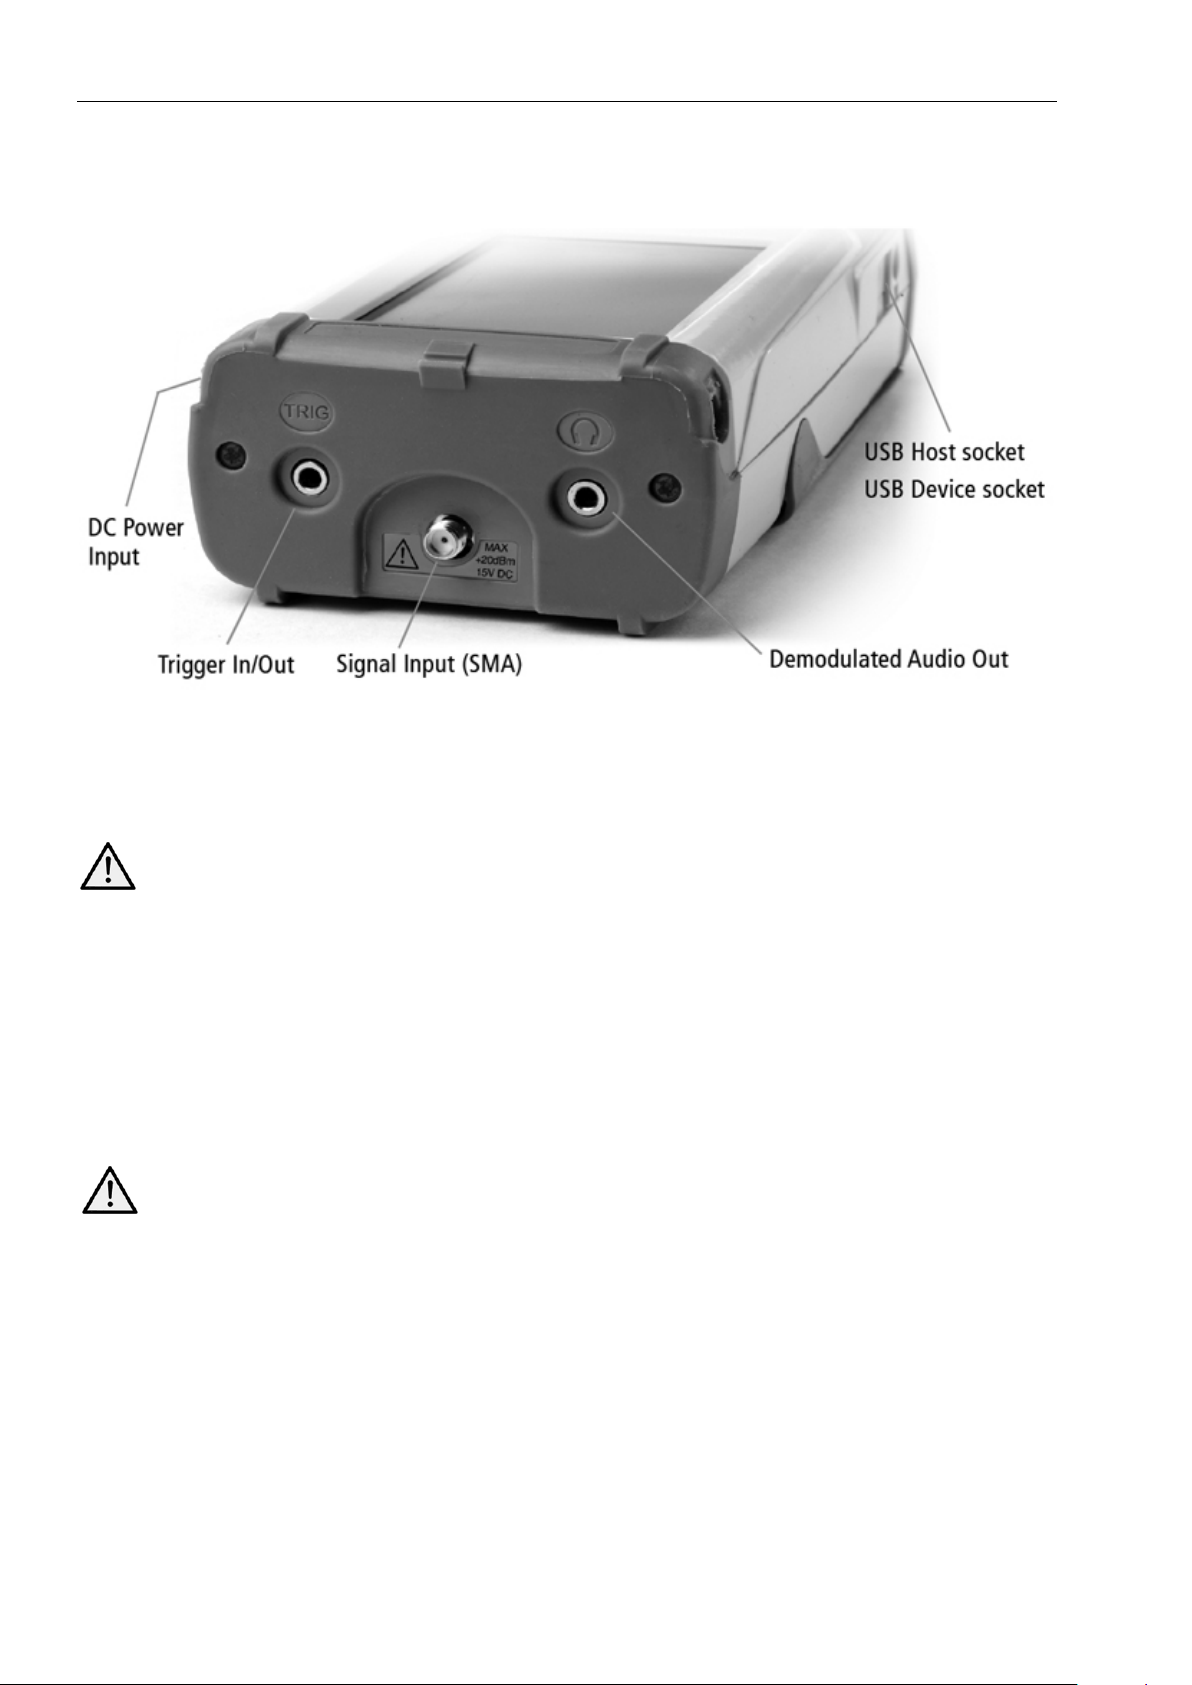
2.1 External Connections
2.1.1 DC Power Input
DC power to operate and/or r ec harge the instrument is connected via a 1.3mm power socket
mounted on the right hand side of the instrument.
Use ONLY the power-supply/charger provided by Aim-TTi with the unit. Use of any
other power source will void the warranty.
The red lamp next to the socket flashes whilst charging is taking place and becom es continuous
once charging is complete.
2.1.2 RF Signal Input
The signal to be measured is connected via a standard SMA connector mounted at the top of
the instrument. The input impedance is 50 Ohms. The maximum useable signal input is 0dBm
or +107 dBuV.
The absolute maximum signal input level is +20dBm or +127dBuV of RF power (approximately
2.2 volts RMS), or 50V DC.
Applying a signal above this level could damage the unit and s uc h damage would not
be covered by the product warranty.
2.1.3 Demodulated Audio Output
Demodulated audio (when in Z er o Span Mode) is available via the built-in speaker, with the
volume level adjustable from within the applicat ion. The signal is also provided via a 3.5mm
stereo jack socket m ounted at the top of the instrument. Maximum power output is 30 milliwatts
into 32 Ohms.
The signal is mono but connection can be made using either a mono or stereo plug. In the
latter case the signal will be pr es ent on both channels. Connecting the jack plug automatically
disconnects the internal speaker.
Page 7
Page 9
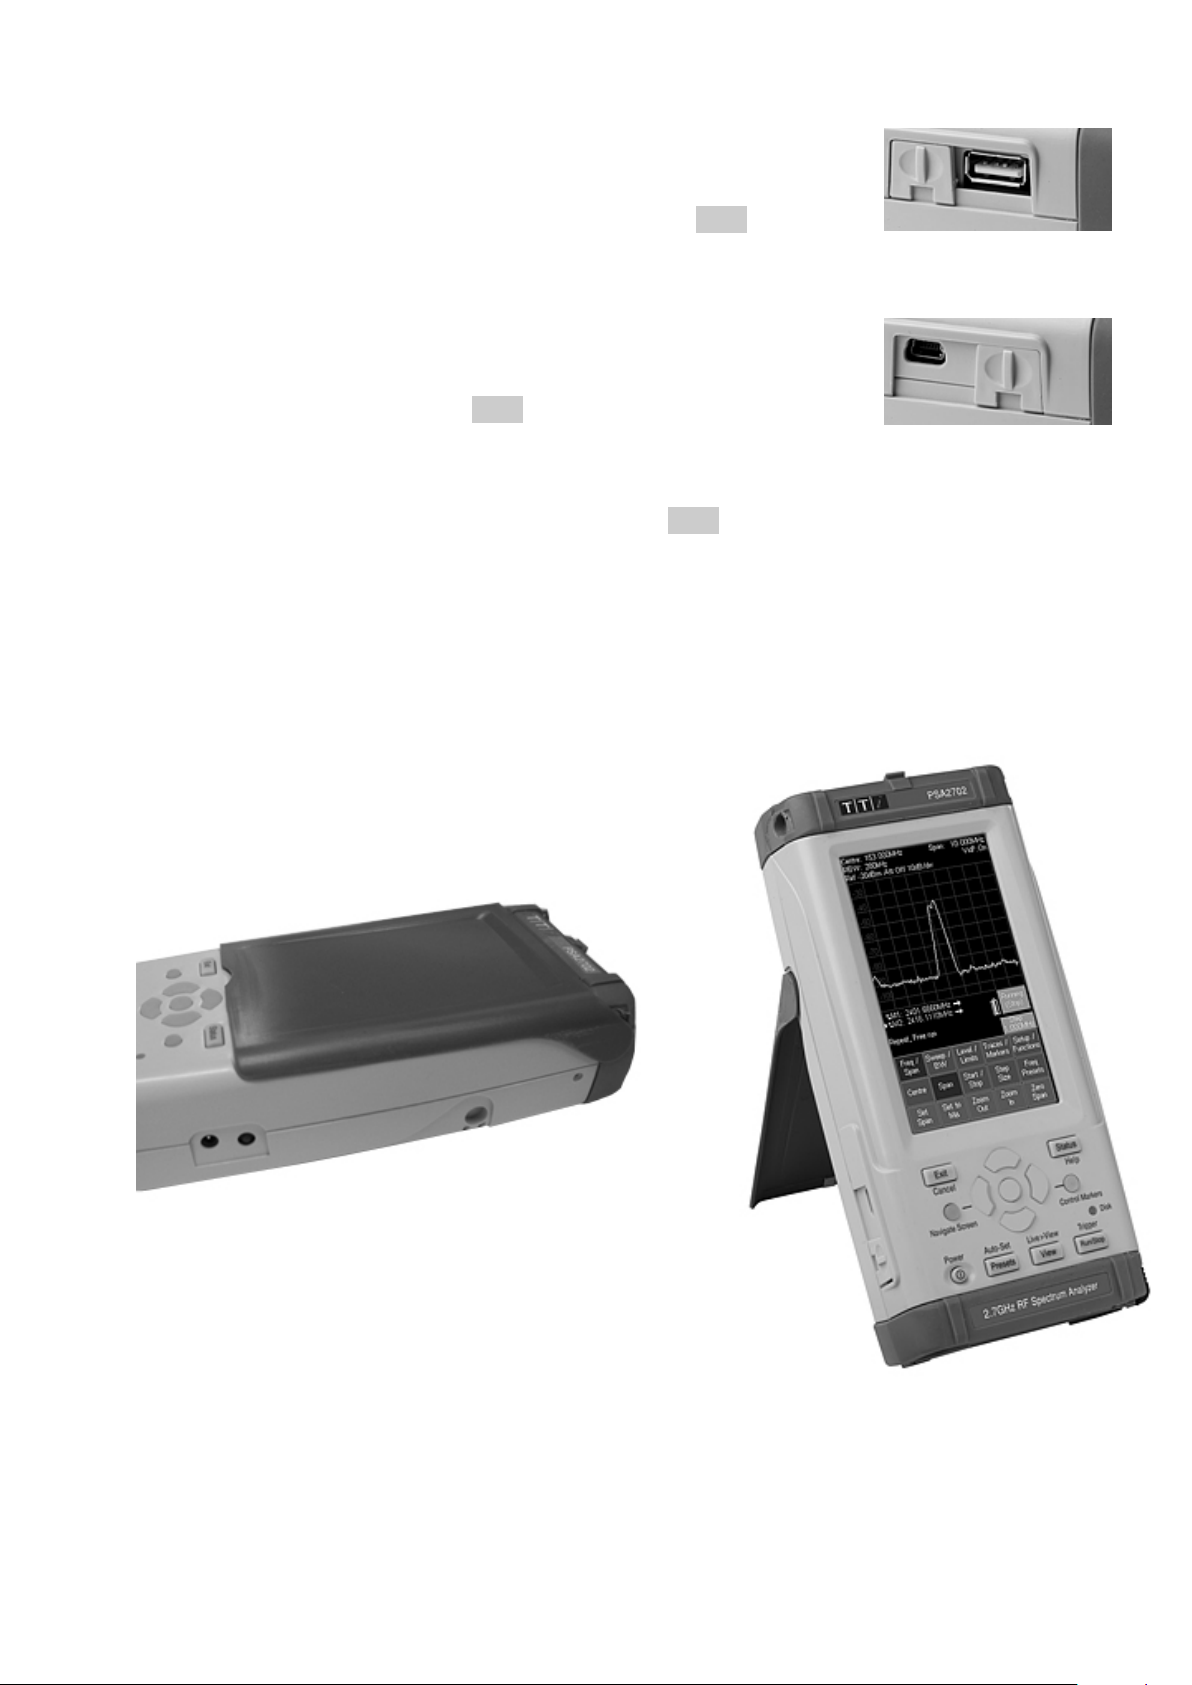
2.1.4 USB Host Connector (for USB Flash Memory)
A standard USB type A connector is provided on the left hand side of
the instrument which is revealed by moving the sliding cov er towards
the top of the instrum ent. This i s intended exclusively for the
connection of a USB Flash m em ory stick. See section 8.1.2 for full
information.
2.1.5 USB Device Connector (for connection to a PC)
A USB type mini-B connector is pr ov i ded on the left hand side of the
instrument which is rev eal ed by moving the sliding cover t owards the
base of the instrument. This is intended exclusively f or connection to a
personal computer. S ee section 8.1.3 for full information.
2.1.6 Trigger Input/Output
A 3.5mm mono jack socket is m ounted at the top of the instrum ent f or trigger signals. This has
no function unless option U01 is fitted - see section 6.1.2. An adaptor is provided that con verts
from the jack socket to a standard BNC connector.
2.2 Bench-top and Portable Use
The instrument is int ended for both hand-held and bench-top applications. It has rubber feet for
horizontal or vertical use, or can be angled using the tilt s tand.
2.2.1 Tilt Stand
The instrument is supplied with the tilt stand folded
away and magnetically l atched at the bottom of the
instrument. It can be hinged outwards to tilt the unit at
an angle of about 40 degrees.
2.2.2 Screen Protector and Sun Shield
To protect the screen when in transit, the tilt stand can
be detached from the bott om of the instrument and reattached on the top to act as a s c r een protector.
The stand is removed by f lexing it outwards at the
hinged end until the lugs dis engage from the sockets.
For outdoors use, the screen protector can be hinged upwards to form a sun shield which
improves the screen visibil ity in direct sunlight.
When not required, it can be detached and stowed away on the back of the instrument where it
functions as a tilt stand .
Page 8
Page 10

2.3 Batteries and AC Line Power
2.3.1 Battery Operation
The instruments operates from an internal Lithium-ion rechargeable batter y which can provide
more than 8 hours of continuous o per ation (screen brightness dependent).
The battery condition is indicated on the display via a multi-segment battery symbol. When it
changes colour to yellow, expected battery life has fallen below 1 hour. When it turns red,
expected battery lif e has fallen below 20 minutes, and the analyzer should be recharge d.
The approximate battery life remaining is also displayed in hours and minutes within t he S tatus
information screens.
The battery is charged from the supplied 5V/2A charger which can recharge a fully discharged
battery in under 3 hours.
When the battery is being charged, the red lamp next to the charging socket flashes. When
charging is complete, flashing ceases but the lamp remai ns il luminated while the charger is
connected.
It is also possible to slow charge the instrument fr om the USB port of a personal comput er
provided that the instrument is turned off. Charge tim e may be up to 10 hours. Connection to
the PC must be made from the mini USB “device” port of the instr ument using the supplied
cable. It is not possible to oper ate the instrument fr om U S B power.
2.3.2 AC Line Operation
For bench-top operation, the instrument can be operated continuously from the suppl ied ac-line
operated charger. The inter nal power management c ir cuitry ensures that the batt er y cannot be
overcharged.
2.3.3 Power Saving for Battery Operation
The battery life of the ins trument is affected by the screen brightness which can be adjusted
over a wide range (see sect ion 4.9.2). Setting the brightness to maximum, for exampl e, will
reduce battery life by up to 2 hours relative to the norm al setting (40%).
To conserve the battery t he i ns trument should be turned off when not in use. In addition, A utoOff mode can be selected whereby the unit turns off automatically after a defined period from
the last key press. The period can be set between 5 and 60 minutes - see section 4.10.3.2.
Auto-Off is automati c all y disabled when external power is connected, and when data-loggi ng is
enabled. All data is retaine d when the instrument is off .
A short beep is sounded when the inst r ument turns off.
Page 9
Page 11
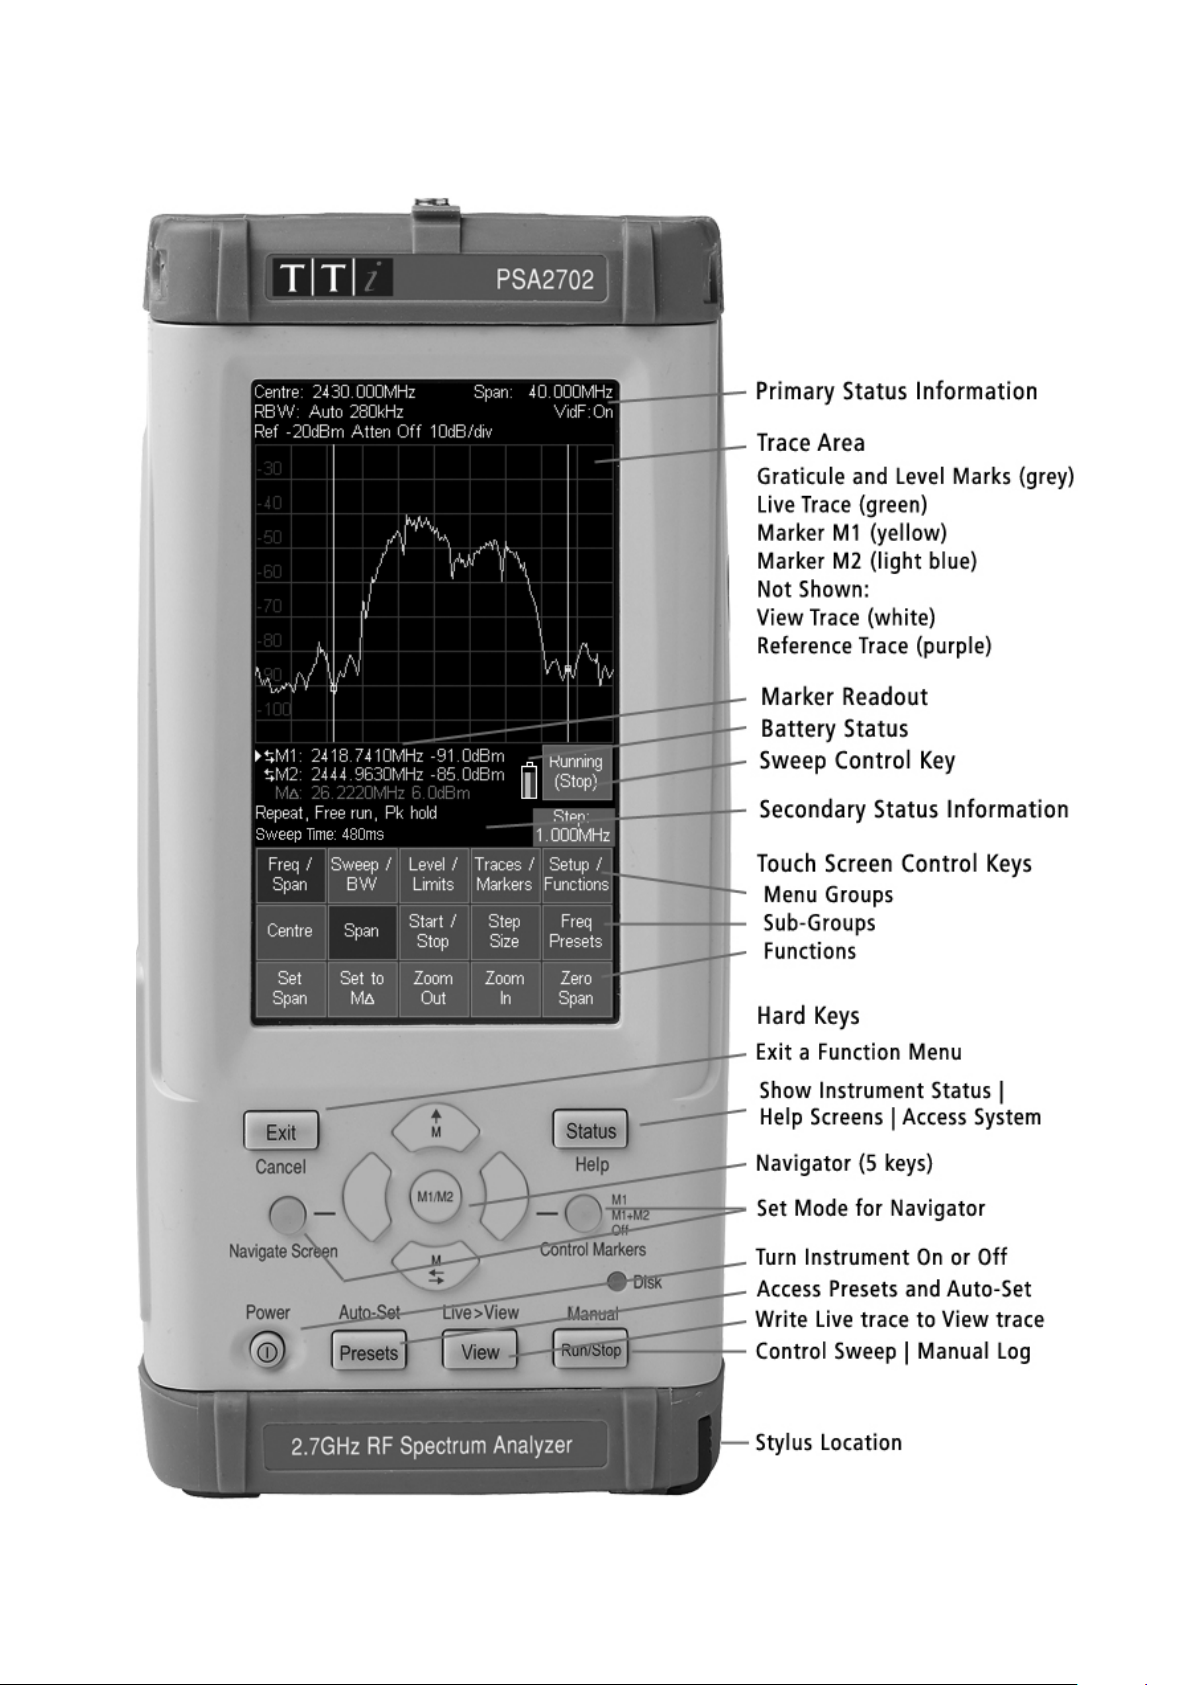
2.4 Display and Controls Layout
Fig. 1
Page 10
Page 12

2.5 Touch Screen Operation
The normal mode of operation of the spectrum analyzer is by using the touch-screen keys
within the display supplemented, when required, by the har d k eys below.
The touch screen keys are normally operated by pressing with the finger or thumb, but can
alternatively be operate d us i ng the supplied stylus.
2.5.1 Finger Tip Operation
The touch screen is a resistive single-touch type (rather than the capacitive multi-touch type used
on many smart phones).
It can be operated by pressing the key area firmly with the soft part of the finger or thumb.
However, for greater positional accuracy it can also be operated by pressing gently with the finger
nail.
When a key is depressed, its colour changes from blue to purple. The key action is performed when
the key is released.
2.5.2 Stylus Operation
Some users may prefer to use a s tylus to operate the touch scr een. The supplied stylus has a
soft point. Sharply pointed objects should never be used to operate the screen as they could
cause damage.
The stylus should be replaced into its mounting slot at the base of the instrument to prevent it
being mislaid. The st ylus des ign is compatible with those us ed with the Nintendo DS handheld
games console, and spares are widely available.
2.5.3 Operation using only the Hard Keys
It is also possible to use the spectrum analyzer without t ouc hi ng the screen at all, by using the
five “navigator” hard keys t o oper ate each of the touch screen functions. See section 7.2 for a
full explanation of thi s mode of operation.
2.5.4 Navigator Keys - Mode Selection
The five hard keys that mak e up the Navigator have two alternative modes of operation which
are selected by the small illuminated keys on either side.
The modes are:
Control Markers (default) - see section 4.7.2.1, and Navigate Screen - see section 7.2.
Whenever the navigator mode is changed, an information box appears explaining the c ur rent
action of the navigator keys. If preferred this can be turned of f - see section 4.10.3.3.
2.6 Instrument Status Information
The most important elements of the instrument status ar e di s played at the top of the screen
(see Fig. 1 in section 2.4). Further status information r el eva nt to the current menu functi on is
shown directly above the k ey area.
In addition, the full status of the instrument can be displayed at any time by pressing the hard
key marked Status/Help - see section 4.10.1.
2.7 On-screen Help
The instrument incorpor ates extensive help information to assist the user. Help is ac cessed by
pressing the hard key marked S tatus/Help - see secti on 4.10.2.
Page 11
Page 13

3 Quick Start Guide
It is recommended that all users, including those fully familiar with RF spectrum analyzers, take
a little time to read through t his i ns truction manual before us ing the instrument.
However, for users who wish to get started with hands-on operat i on as quickly as possible, t he
following may prove useful.
1. Press and hold the Power key until the screen backlight fl as hes. Wait a few seconds and
then check the battery condit ion indicator on the display. If it shows less than ¼ full the
instrument should be connected to its charger.
2. Connect the signal to be meas ur ed to the SMA connector at the top of the instrument. The
maximum all owable signal without damage is +20dBm (+127dBuV or 2.2V rms). The maximum
measurable signal is +0dBm (+ 107dBuV or 223mV rms). If ther e i s a possibility of the signal
exceeding these levels, add suitable in-line attenuation.
3. Ensure that the Navigator keys are set to Control Markers (ke y illuminated green). If not
press the round key marked Control Markers. This also selects touch-screen key control.
4. Press the hard key marked P r esets (Auto-Set). Select Auto Set and press Execute.
The instrument will perform a full span sweep (1MHz to 2699/1299MHz) at 0dBm reference
level and find the highest level within the sweep. It will then p erform further sweeps at nar r ower
spans and, where appropriat e, -20dBm reference level.
During this time a red backgr ound message of Status: SC A NN ING with be displayed. When
finished the message will become Status: COMPLETE.
When Auto Set has completed, the analyzer should be set with a fairly narrow span (typicall y
10MHz) centred on the signal with the M1 marker at the centre frequency and in Peak-find
mode (indicated by an upwards arrow prior to the M1 readout). RBW will be set to Auto.
5. Press Exit to return to the m ai n m enu.
The M2 marker can be turned on from the hard key marked Control Markers. Markers are
moved using the Navigator har d k eys – Left/Right moves the markers, Up sets peak-find mode
where the selected marker jumps to peaks within the trac e, Down sets scroll mode where the
marker moves across the screen in one pixel steps (1/270
under control is selected by the centre key (M1/M2) and indicat ed by an arrow before the
marker readout.
From the main menu adjustments can be made to centre frequenc y a nd span (or start and
stop), sweep mode, detector type, RBW and VBW, refer enc e l evel, displayed traces and
markers.
The menu system is hierarchical with each top-line ke y selec ting a set of five second-line
sub-menu keys. Each of these pr ovides access to a set of keys on the bot tom line that perform
the actual functions.
Context sensitive help for each sub-menu group can be accessed by pressing the hard key
marked “Status (Help)” f ol lowed, if not already selected, by Context Help. This provides
sufficient inform ation to understand the principle s of operation.
th
of the span). The marker currently
Page 12
Page 14
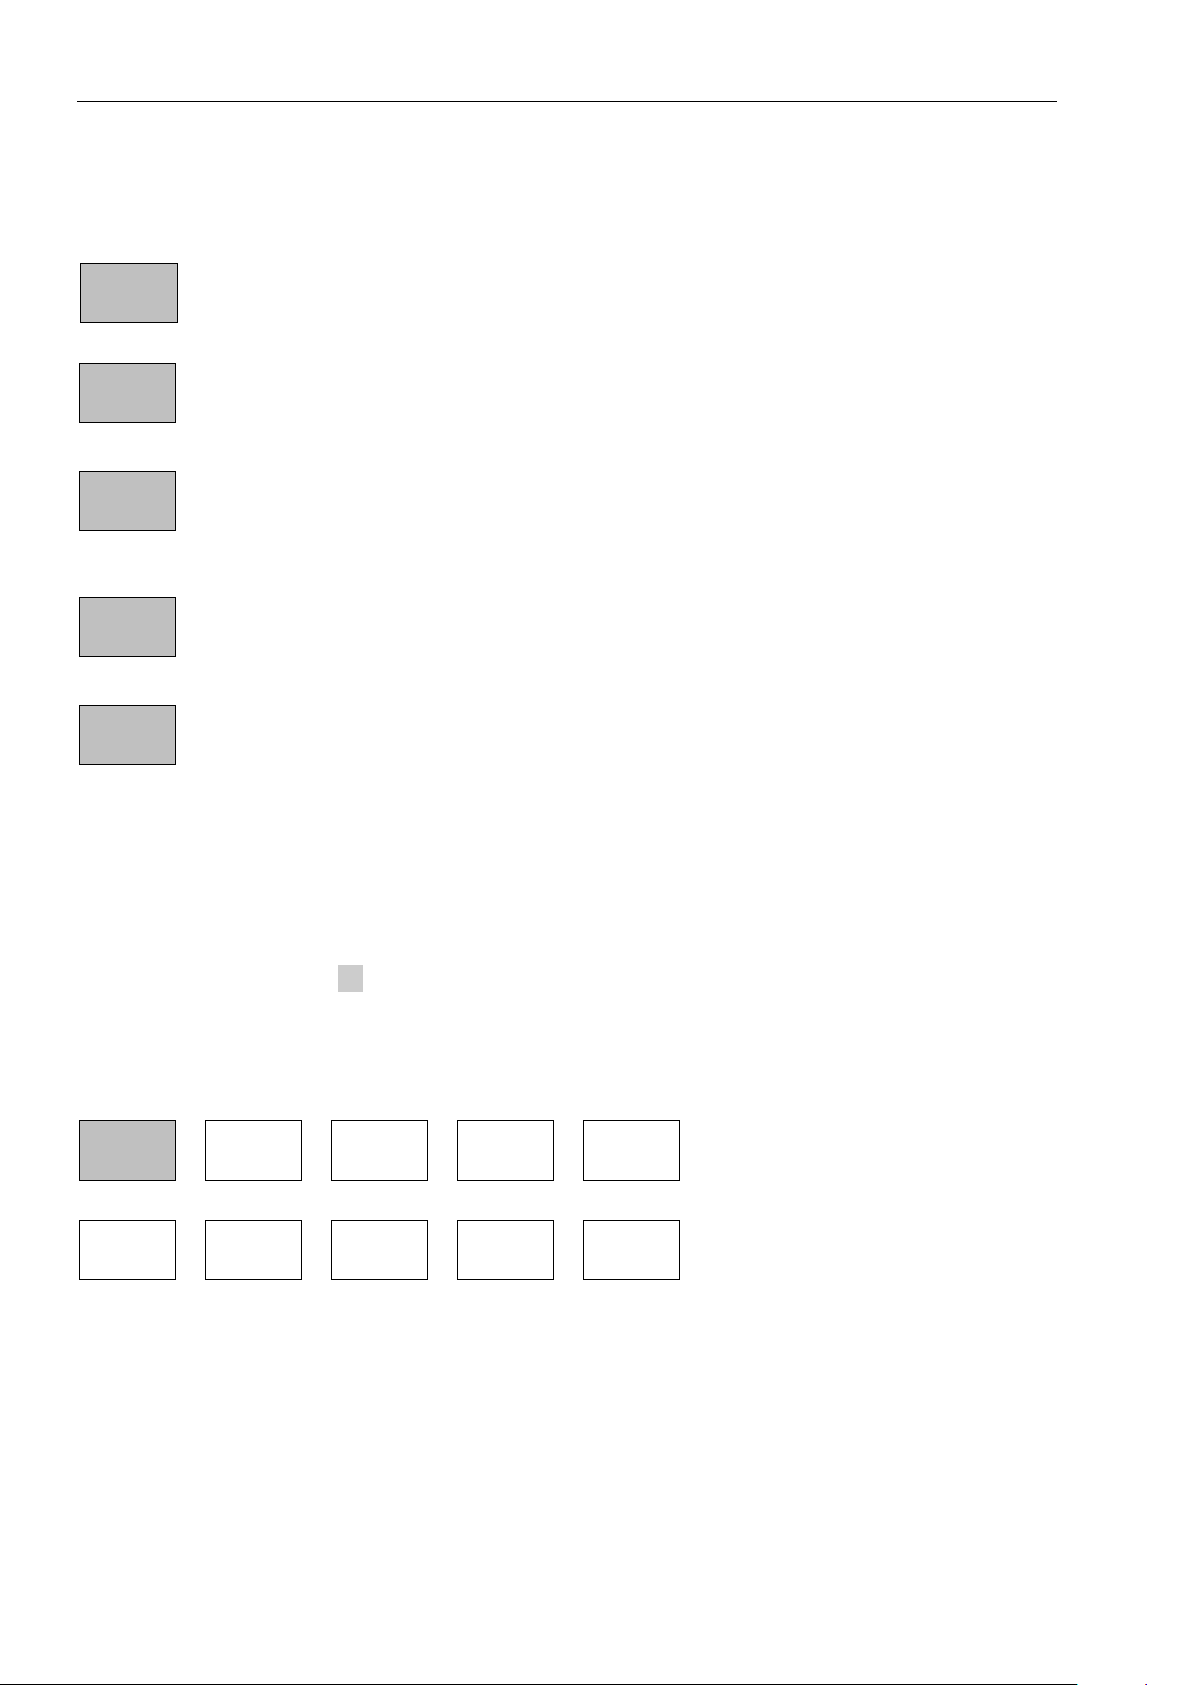
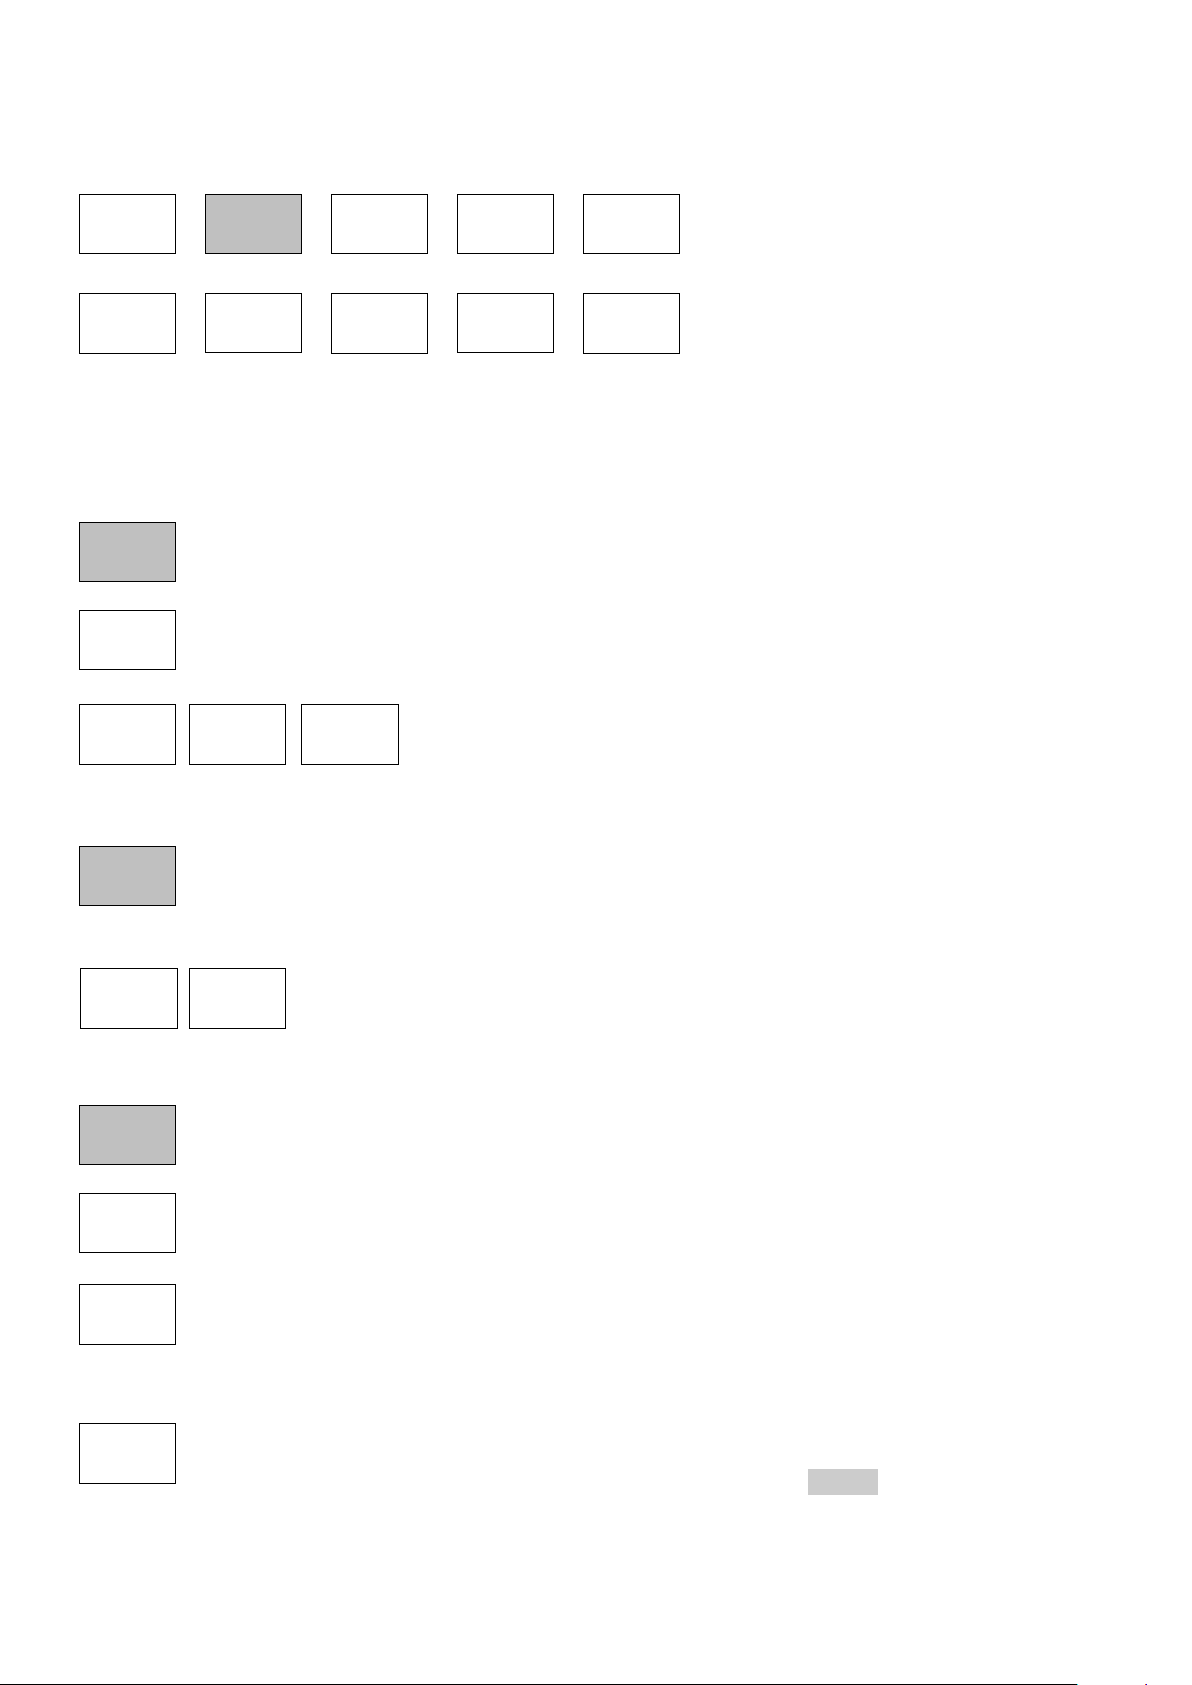
4 Operation using the Menu System
Freq/
Span
Sweep/
BW
Level/
Limits
Traces/
Markers
Setup/
Functions
Centre
Span
Start/
Stop
Step
Size
Freq
Presets
Freq/
Span
The default menu system for the spectrum analyzer consists of three rows of five keys. The
upper row represents the top level of the menu system and defines five “menu groups” as
follows:
enables the frequency range of sweep to be set in terms of start and stop
frequencies or centre frequency plus span, as well as zero span demodulation.
enables control of the sweep an d bandwidth filtering for the sweep. Controls are
provided for RBW and VBW settings , sweep mode, sweep time, sweep c ontrol and
detector type selection. When option U01 is fitted, it also controls sweep triggering.
enables the reference level to be changed, the amplitude unit s to be changed, and
the vertical scaling to be altered. When option U01 is fitted, it also enables the
setup and control of limit lines and patterns, and the application of external off s ets
and compensation tables.
provides control of the dis play traces including t r ac e processing modes, along with
the storage function f or both traces and screen images. Also provides setup and
control of the measurement markers.
provides access to the stor age of instrument setups and access to system utilities
and setting of the frequency counter gate time. When option U01 is fitted, it als o
provides access to automatic logging functions.
Each group has up to five “sub-groups” which appear on the middle row of keys. The currentl y
selected group and sub-group is s hown by the relevant key being dark blue.
The bottom row of keys represent the “functions” that can be performed for each of the many
sub-groups. These keys may perform an immediate action, or bring up a pop-up menu, or
create a special control sc r een for numeric entry or file operat i ons.
See Appendix D, section 18, for a graphical summary of the menu tree.
4.1 Setting the Frequency Range of the Sweep
This menu group controls t he frequency range for the curr ent sweep of the spectrum analy zer.
The range can be set in terms of eit her a centre frequency plus a span width, or in terms of a
start frequency and a stop frequency.
Pressing Centre or Span will cause the frequency range to be displ ayed at the top of the screen
in terms of a centre frequenc y and a span. Pressing Start/S top will cause it to be displayed in
terms of a start frequency and a stop frequency.
The lowest start frequenc y is 1MHz. The highest stop fr equenc y is 2700MHz or 1300MHz. The
minimum span width is 0.270MHz which results in minimum and maximum centre frequencies
of 1.270MHz and 2699.730MHz or 1299.730MHz respectively.
Page 13
Page 15
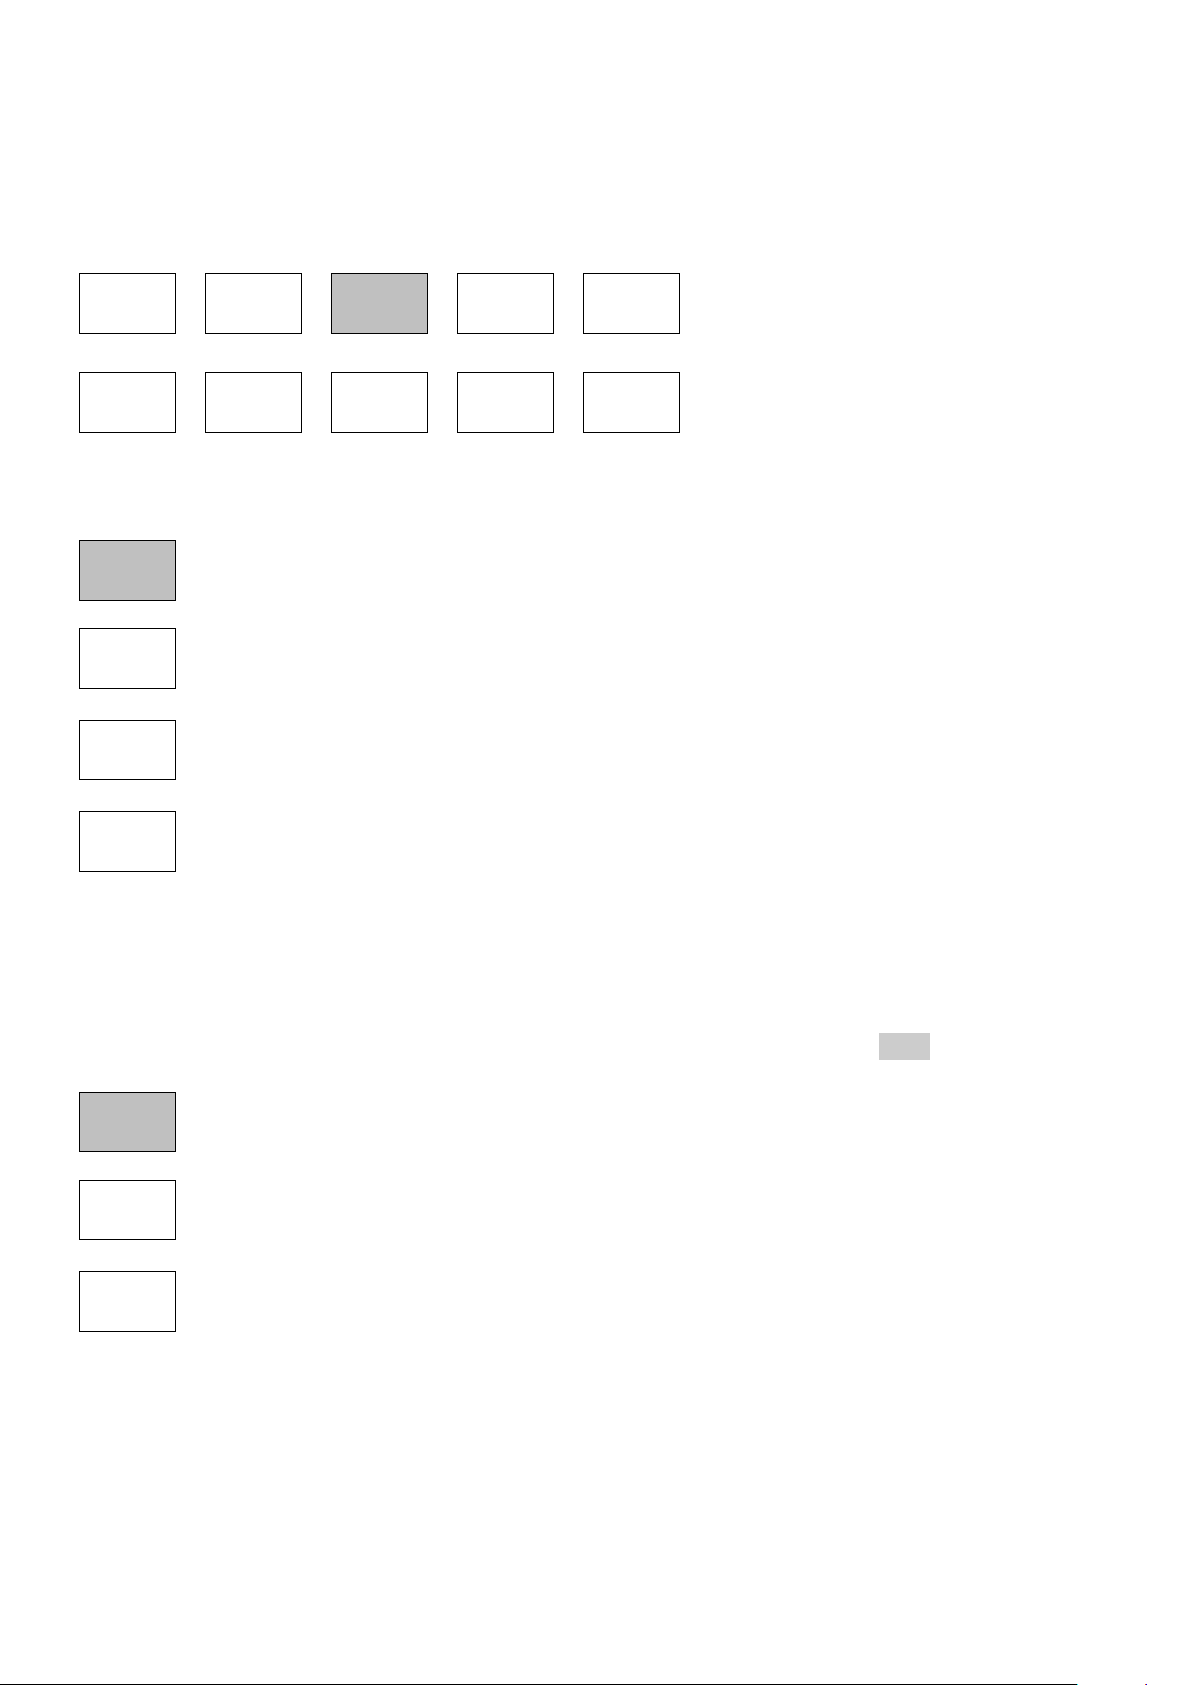
4.1.1 Centre
Centre
Set
Centre
Set
C=M1
Set
C=Pk
Step
Down
Step
Up
Span
Set
Span
Set to
Mdelta
Zoom
Out
Zoom
In
Zero
Span
controls the centre f requency for the sweep. Also sets t he annotation to
Centre/Span if it was previous ly Start/Stop. Creates a set of bottom-row function
keys as follows:
enables the centre fr equenc y t o be s et to a specific value. The menu keys are
replaced by a numeric keyboard from which a centre frequenc y can be entered in
MHz to a resolution of 0.001 (1kHz).
Press OK to activate the new frequency without leaving the screen or O K & Exit to
return to the Centre menu. Once a new frequency has been set from this screen,
the Previous key can be used to return to the previous frequency and then toggle
between the two.
Pressing Set by Tab/Jog selects an alter native setting screen in which frequencies
are set by “jogging” each digit up or down. Note that whiche ver method of setting
frequency is used becomes the default whenever Set Cent re is pressed. See
section 7.3 for an illus trated description of frequency setting.
sets the centre frequency to t he frequency value of the M1 mark er (when active).
sets the centre frequency to t he frequency value of the highest amplitude point in
the current sweep.
4.1.2 Span
controls the span for t he sweep. Also sets the annotation to Centre/Span if it was
previously Start/Stop. Creates a set of bottom-row function keys as follows:
enables the span to be set to a spec ific value. The method for setti ng the span is
similar to that for setting the Centre frequency - see sect i on 7.3 for an illustrated
description of frequency setting.
sets the span equal to the f r equency difference between the M1 and M2 markers (if
active).
changes the sweep mode of the spectrum analyser and opens the Zero Span sub
menu - see section 4.3.
changes the centre frequency by the value of the step size
- see section 4.1.4.
sets the span to a higher or lower value in a 1-2-5 sequence starting from
the existing span value. (Example: if the existing span is 1.7MHz, the first
press of Zoom Out will take it to 2MHz and the next press to 5MHz).
Page 14
Page 16

4.1.3 Start/Stop
Start
Stop
Set
Start
Set
Stop
Start=M1
Stop=M2
-more1 of 2
Fix
Start
Fix
Stop
Step
Down
Step
Up
-more2 of 2
Step
Size
Auto
Span/10
Set to
Mdelta
Set to
Centre
Set to
M1
Set
Step
Undo
controls the start and stop frequencies for the sweep. Als o s ets the annotation to
Start/Stop if it was previ ous ly Centre/Span. Creates a s et of bottom-row function
keys as follows:
enables the start or st op frequency to be set to a specific value. The
method for setting these is s imilar to that for setting the Centre frequency
- see section 7.3 for an illus trated description of frequency setting.
sets the start frequency to the frequency of the M1 mark er and the stop frequency to
the frequency of the M2 m arker. M1 and M2 must both be active and M2 m ust be at
a higher frequency than M1.
reverts to the start and st op frequencies that existed directly before the
Start=M1/Stop=M2 key was pressed.
opens a second set of actions k eys: Fix Start/Fix Stop and Step D own/Step Up.
changes the action of the Step Up/Down keys so that only the stop
frequency or start fr equenc y respectively is changed by the s tep value.
The fixed start or stop f reque ncy is preceded by the word Fix. Pr essing
the key again, or leaving this function-set (by pressing -more- 2 of 2 or any group or sub-group
key) will cancel the fixed s tart or stop frequency.
changes the start and/or s top frequencies by the value of the step size
(see next section). The action of the Fix Start/Fix Stop keys determines
whether both are stepped or onl y one is stepped.
Note that, if the start or stop f r equency is “fixed” and the step size is set to Auto, the step size
will change on each press of step up/down so that it is always equal to one graticule division.
returns to the alternative set of action keys for Start-Stop. Cancels the fixed start or
stop frequency if set.
4.1.4 Step Size
sets the size of frequency st epping using the Step Up/Down keys. When relevant,
the current step size is display ed within a green box above the ke ys. C r eates a set
of bottom-row function keys as follows:
enables the step size to be set to a specific value. The method for setting the step
size is similar to that f or set ting the Centre frequency - see section 7.1 for an
illustrated description of frequency setting.
causes the step size to be automatically linked to the width of the span. Thus
Step/Up down will cause t he c entre frequency to change in st eps of one graticule
division. Auto step size is indicated by the word Aut o above the step size value.
sets the step size equal t o the frequency difference between the M1 and M2
markers (if active).
sets the step size equal t o ei ther the centre frequenc y or t o the frequency
of the M1 marker (if active). This can be useful for observing the
harmonics of a fundamental frequency.
Page 15
Page 17
4.1.5 Frequency Presets
Freq
Presets
Full
Span
Recall
Preset
Toggle
Last
Store
Preset
Exit
Z-Span
Demod
Volume
-
Volume
+
enables up to six frequency ranges to be quickly stored and rec al led. Only the
centre and span (or equivalent start and stop frequencies ) are stored. This differs
from a Trace State or Set-up file for which more parameter s are stored (see sections
8.2.3 or 8.2.5 respectively). Frequency presets are retained when the instrument is off.
Creates a set of bottom-ro w func tion keys as follows:
sets the sweep to the full range of the instrument (1MHz to 1.3GHz or 2.7GHz).
brings up a menu of six preset numbers (1 to 6) into which the current value of the
sweep frequency range can be stored. Existing values are over-written.
brings up a menu of six preset numbers (1 to 6) which recall pre viously stored
frequency ranges. Empty positions are ignored.
switches between the cur r ent sweep frequency range and the last range to be
recalled from a preset (or f r om Full Span).
4.2 Sweep Time
The sweep time and update rate is automatically set fr om the S pan and the RBW and is
displayed within the lo wer annotation area. There is no indep endent adjustment of sweep time.
Narrower RBW settings create longer sweep times. For each RBW, the sweep time in broadly
proportional to the f r equency span. The approximate formula for calculating sweep update
times is given within the spec i fications – see section ????.
4.3 Zero Span Mode (Demodulation Mode)
Zero span is a special case of frequency range setting. It is set from the Span sub-menu - see
section 4.1.2. Pressing Zero Span changes the trace display to be a horizont al line at the
centre frequency am pli tude level, and brings up an alternative set of function keys as follows:
exits zero span mode and retur ns to a normal swept trace and the nor mal Span submenu key functions.
brings up a menu which enables the demodulation mode to be s et to AM or FM (or
Off) and the Audio Filter to be s et to On or Off.
adjusts the demodulated audio volume (0 to15). The value shown on a
grey bar graph.
The demodulated audio is routed to a built-in loudspeaker . Alternatively, the audi o c an be
outputted via a 3.5mm jack soc ket - see section 2.1.3.
Page 16
Page 18
4.4 Setting the Sweep Mode and Sweep Bandwidth (RBW)
Sweep
Repeat
Single
Sweep
Trigger
RBW
Video
Filter
Sweep
Sweep/
BW
RBW
Auto
15kHz
280kHz
1MHz
Video
Filter
On
Off
This menu group controls t he sweep and the resolution bandwidt h.
This enables the sweep to be c ontrolled in terms of the type of sweep (repeat or single) and the
resolution bandwidth of the sweep filter and the subsequ ent video filtering. If option U01 i s
fitted, sweep triggering can also be controlled.
4.4.1 RBW
controls the resolution bandwidth of the sweep filter . A narrower RBW provides
greater frequency resolution and lower noise, but inc r eases the sweep time.
Creates a set of bottom-ro w func tion keys as follows:
causes the RBW to be automat ic al ly c hanged to suit the frequency span. The RBW
value is displayed at the top of the screen and is preceded by the word Auto.
4.4.2 Video Filter
controls the video filt er . With the video filter On, displa ye d noise levels are lower,
but signals may be slight ly at tenuated at narrower RBW settings. Creates a set of
bottom-row function keys as follows:
4.4.3 Sweep
controls how and when the sweep runs. Creates a set of bottom-row function keys
as follows:
causes the sweep to be automatically restarted aft er the c ompletion of the previous
sweep unless halted by the Sweep Control key (or the Sweep Trigger settings).
manually selects a specific RBW value which is displayed at
the top of the screen
The status of the video filter i s s hown at the top of the screen prec eded
by the word VidF
.
enables single sweeps that are commenced by the S weep Contr ol key (or the
Sweep Trigger settings) .
Note that, whenever the sweep is stopped, whether in repeat or s ingle mode, changing the
frequency span or the reference level will re-run the sweep once.
Sweep Trigger is only availab le with the upgrade option U01 is fitted. It provides a
choice of how the sweep is star ted or stopped. The trigger sourc e c an be manual,
external, or internal f r om limit lines or patterns. See s ection 4.4.3.3 for an
explanation of trigger functions.
Page 17
Page 19

provides a choice of automatic or manual re-arming of the trigger when triggering is
Single
ReArm
Stopped
(Run)
Running
(Stop)
Stopped
(Single)
enabled and the sweep m ode is set to Single.
When the menu system is set to Sweep/BW the sweep status is displayed in the lower
annotation area directly above the keys.
4.4.3.1 Sweep Rate and the Sweep Progress Indicator Line
The sweep time and resultant update rate is a function of the span and the RBW and is shown
within the lower annotation area. It can be calculated f r om the formulae within section ???.
For sweep times longer than about 1 second, a yellow indicator line below the graticule
indicates the progress o f the sweep – see section 4.6.2.
4.4.3.2 Manually Controlling the Sweep
The sweep can be started or stopped using the touch screen S weep C ontrol key
directly under the gratic ule on the right hand side. This k ey changes colour to
indicate the current state of the sweep. The action of the k ey is duplicated by the
hard key marked Run/Stop.
When the sweep is running, the k ey is gr een and is marked Running ( S top). The word in
brackets indicates the action that will be performed by pressing the key.
When the sweep is stopped, and t he sweep mode is Repeat, the key is bl ue and is
marked Stopped (Run). Stopping the sweep freezes the curr ent sweep trace on the
display so that it can be obser v ed.
When the sweep is stopped, and t he sweep mode is Single, the key is blue and is
marked Stopped (Single) .
At other times, when the sweep is t emporarily halted by the system, the key
becomes red and is marked Paused. When sweep triggering is enable d (see next section) the
key can provide triggeri ng and ar ming functions which are indicated by other colours and
markings.
4.4.3.3 Triggered Sweep (when fitted)
When upgrade option U01 is fitted, it is possible to trigger the sweep using an external or
internal trigger signal. Triggered sweep has a different action dependent upon t he sweep mode
(Single or Repeat).
If the sweep mode is set to Single, the effect of the trigger is to start the sweep. When a trigger
event occurs a single sweep will be initiated. The trigger optio ns ar e None, Ext +ve (trigger
from a positive going edge on the external trigger input) or Ext -ve.
If Single ReArm is set to Aut o, a sweep will be initiated every t ime a trigger event occurs. If
Single ReArm is set to Manual, further trigger inputs ar e ignored after the fir s t sweep. The
Sweep Control key turns yellow and is labelled Stopped (Arm). Pressing the key changes the
labelling to Run on Trigger , and a further sweep will be initiated when a trigger event occurs .
If the sweep mode is set to Repeat, the effect of the trigger is to stop the sweep. The options
are Free Run (no triggering), E xt + ve (trigger from a posit ive goin g edge on the external trigger
input), Ext -ve, and Limit s ( trigger from the Limits comparator - see section 7.7.2). The key
marking becomes St op on Tri gger .
When a trigger occurs the curr ent sweep will be completed after which the sweep control key
will become blue and the sweep will remain stopped until it is restarted with the sweep control
key. There is no separate Arming function for repeat mode sweeps.
Sweep triggering is turn ed off whenever the sweep mode is changed between Single and
Repeat or vice versa.
Note that, when a Logging f ile i s ini tiated, triggered sweep is automatically cancelled a nd s et to
Repeat mode and Free Run.
Page 18
Page 20
4.5 Setting the Level Attenuator, Amplit ude Scale, and Limits
Units/
Graticule
Ref
Level
Scale/
Shift
Offset/
Tables
Limits
Level/
Limits
Ref
Level
Units/
Graticule
dBm
dBuV
Graticule
0dBm
-20dBm
This menu group controls t he input attenuator, thus chang ing the reference level, and co ntrols
the measurement units and s c aling of the amplitude display. When option U01 is f itted, it also
enables the sweep amplitude to be compared with limit lines or patterns and the use of l evel
offset and compensation tables.
4.5.1 Measurement Units and Graticule
sets the measurement units and controls the graticule display. Creat es a set of
bottom-row function keys as follows:
provides measurement in dBm (dB milliwatts into 50 Ohms, where 0dBm = 1mW)
and sets the graticule and graticule markings accordingly.
provides measurement in dBuV (dB micro volts across 50 O hms, where 0dBuV =
1uV) and sets the graticule and graticule markings acc or di ngly.
creates a pop-up menu enabling the Graticule to be dimmed, set to horizontal lines
only, or turned off completely.
Note that, when the measurement units are set to dBuV, the top graticule division is reduc ed to
7dB in order that subsequent graticule lines correspond to whole decade values.
4.5.2 Reference Level
The reference level represents the maximum signal that can be di splayed. The top line of t he
graticule is at the ref er enc e l evel unless Scale/Shift is being used (see section 4.5.3).
the reference level for amplitude measurement is c hanged by switching the
attenuators. Creates a set of bottom-row function keys as follows:
sets the reference level to 0dBm (or 107dBuV) by setting the attenuator to On. The
setting is shown within the upper area of the screen.
sets the reference level to -20dBm (or 87dBuV) by setting the attenuator to Off. The
setting is shown within the upper area of the screen.
Page 19
Page 21
4.5.3 Vertical Scaling
Scale/
Shift
Scale
Shift
Down
Shift
Down
Offset/
Tables
Clear
All
Set
Limits
Limit
Conditio
Set
Limits
Limit
Condition
enables the vertical amplitude scaling to be changed. C r eates a set of bottom-row
function keys as follows :
creates a pop-up menu enabling the vertical scaling to be set t o 10dB /div (the
default) through to 1dB/ div.
For scales below 10dB/div only a portion of the sweep amplitude will be
visible and the Shift Up/Shi ft down keys can be used to pan the trace
through the amplitude range of the graticule. These ke ys aut o-repeat.
4.5.4 Amplitude Offset and Compensation Tables (when fitted)
enables the amplitude scaling to be offset to match external attenuation or gain, or
to add frequency dependent amplitude compensation tables to match transducers or
antennae. These functions are only available when the upgrade option U01 is fitted
- see section 6. Creates a set of bottom-row function keys as follows:
cancels any offset or compensations that have been set and returns the amplitude
scaling to normal.
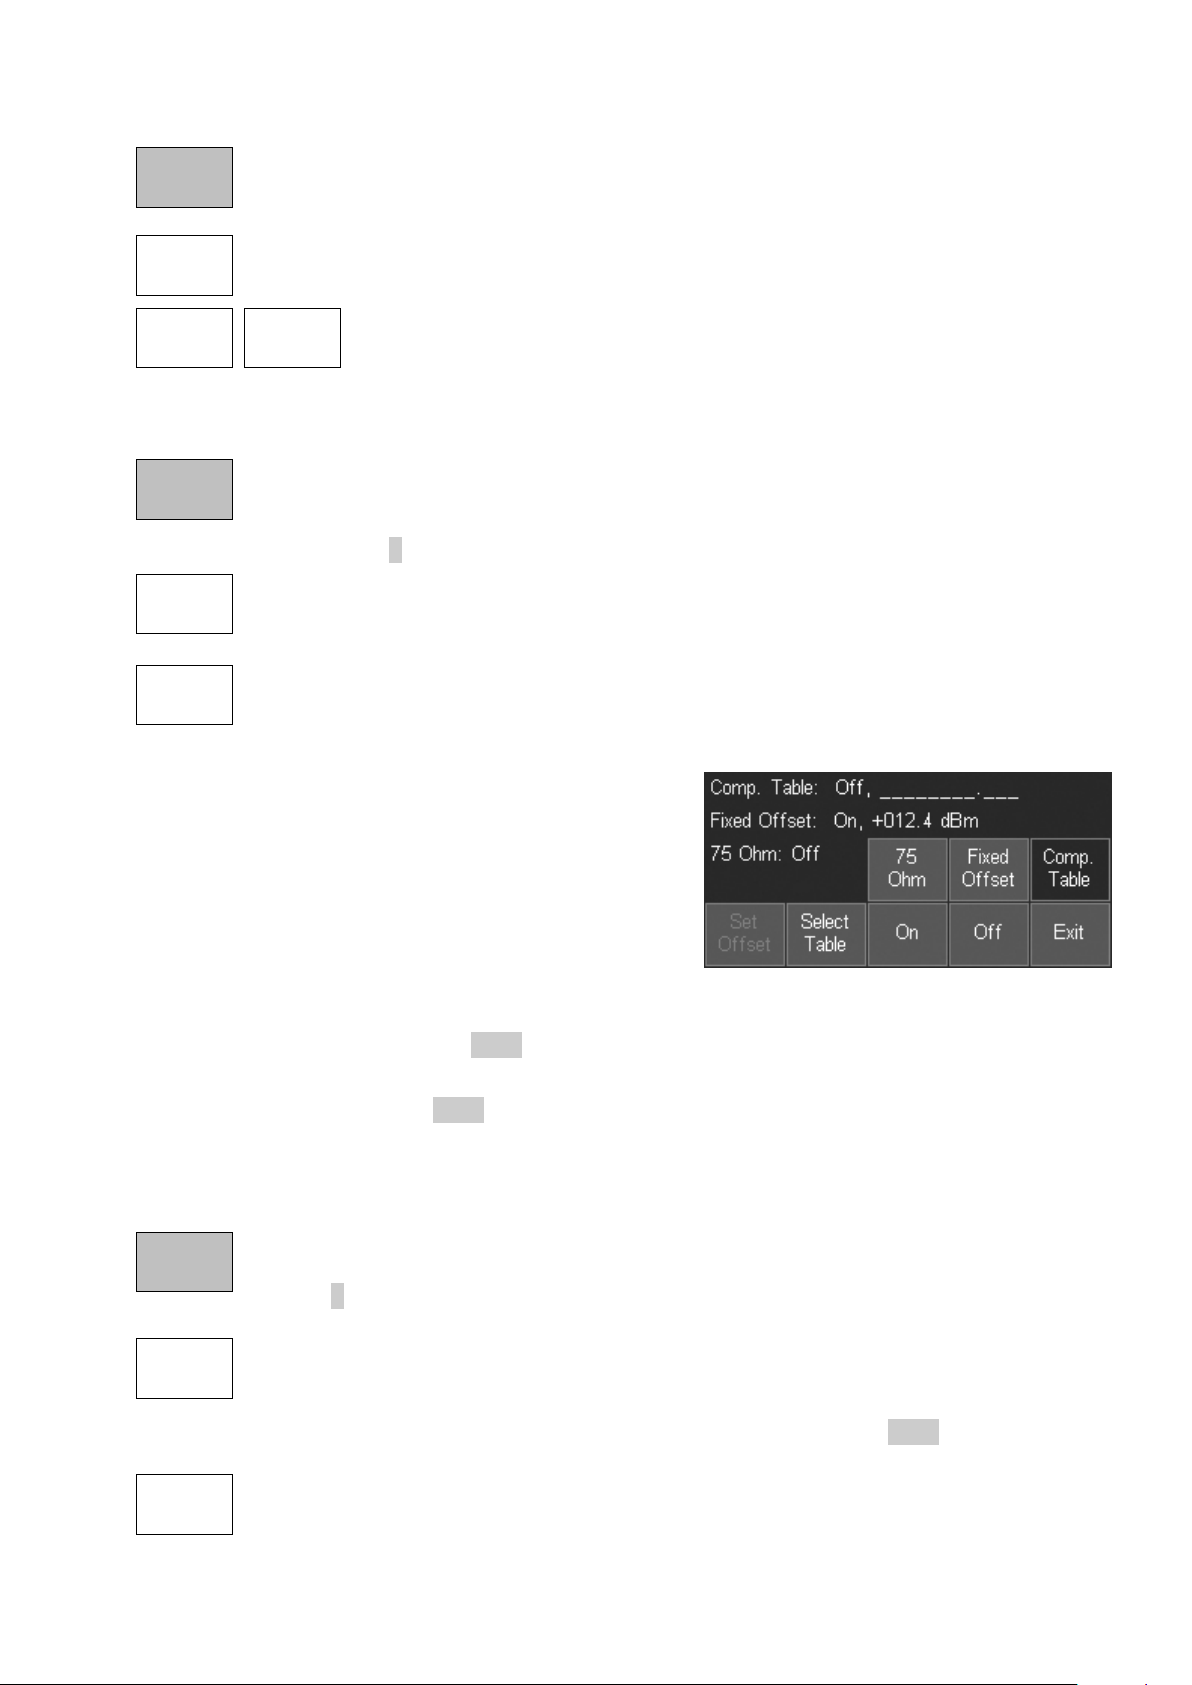
opens a control menu that enabl es compensation for a 75 Ohm s our c e impedance,
a fixed attenuation or gain, or a frequency dependent compensation table to be
used. The functions can be used individually or together.
The three keys on the upper line s elec t which function
is to be controlled.
For 75 Ohm source, the options are only on or off.
For Fixed Offset, the Set Offset key creates a
dialogue box by which an off set can be set between
-50.0dB and +50.0dB. The set figure is added to the
displayed reference level and to the graticule values
and marker readout.
For Compensation Table, the Select Table key opens a fi le li s t of stored compensation tables
that can be loaded. See section 7.6.2 for a full explanation.
Whenever offsets or com pens ations are active, a warning message is displayed at the top right
of the graticule. See sect ion 7.6.1 for safety warnings on the use of these function.
4.5.5 Amplitude Limits (when fitted)
sets one or two horizontal lines or complex patterns that can be compared with the
sweep. This function is only availa ble when the upgrade option U01 is fitted - see
section 6. Creates a set of bottom-row function keys as follows:
creates a control screen that enables the selection of lines and patterns, or allows
existing ones to be turned on or of f. When Set Line is pressed, the value c an be
entered numerically in dBm or dBuV. When Select Patt er n i s pr essed, a Recall File
screen is opened enabling a pattern to be loaded from a file. See section 7.7.1.
creates a pop-up menu that selects the criteria upon which a limit condit ion i s
created. The options are None, A bove, Below, Outside or Inside.
Page 20
Page 22

creates a pop-up menu that selects an action t hat will be performed when the limit
Limit
Action
Limit
Action
Limit
Offset
Limit
Fix/Unfix
condition occurs. The options are None, Beep, Pulse Out , or Beep + Pulse Out.
Note that other actions (sweep triggering or log file entry) can also be created f r om the limits
condition. Further information on the Limits f unc tion is given in section 7.7.
creates a control screen from which a limit can be offset from its initial values. This
is particularly useful for limit patterns which would otherwise have to be recreated.
See section 7.7.4 for more information.
enables a pattern that was created for a particular centr e frequency (e.g. a
modulation channel width limit pattern) to be applied t o a di fferent centre frequency.
Pressing the key fixes the patt ern relative to the screen and displ ays a message of
“Lim Fix” on the top RH side of the graticule. See section 7.7.5 for more information.
4.5.5.1 Channel Marker Files
A Channel Marker file is a special case of a Limit Pattern file which produces only vertical lines
at frequencies defined within the file. See section 7.7.6
4.5.6 Overload Indication
Signal levels that are gr eater than the reference level c an not be displayed and may caus e
errors in the measurement .
More information about signal overload and measurement error is provided in section 7.1.
Page 21
Page 23

4.6 Controlling and Storing Traces and Images
Traces
Control
Trace
Mode
Trace
Stores
Marker
Setup
Marker
Control
Traces/
Markers
Traces
Control
View
View
Off/On
Swap
Ref.
Off/On
Live
Off/On
This menu group controls t he traces that appear on the screen (as well as the markers that are
used for measurement).
There are three traces: Live (green) , View (white) and Referenc e (purple). Only the Live trace
is updated from the sweep. The View trace is a temporary copy of the live trace created
whenever the View key is pressed. The reference trace is recall ed from a trace file stored
within the instrument. Trace files can be saved from either the live trace or the view trace.
Complete images of t he screen can also be saved.
A further version of the Live tr ace is available when the Trace Mod e is set to Peak-hold or
Average – see section 4.6.3.1.
4.6.1 Displaying Traces; Controlling the View Trace
enables each of the three trac e types to be turned on or off, contr ols the View trace,
and enables traces and screen images to be stored and recal led. Creates a set of
bottom-row function keys as follows:
copies the current Live t r ac e to the View trace, and turns the View trace on if it was
off. The View trace sits behind the live trace and can therefore be partly obscured
. This key duplicates t he View hard key.
by it
halts the live trace and swaps the order of the traces on the screen. Thus the View
trace (white) sits in front of the halted live trace enabling it to be observed and
analyzed using the marker s . When the sweep is restarted with the Sweep Control
key, the traces are swapped back so t hat the Live trace sits in front again.
toggles the View trace off, or back on without creating a new View.
toggles the Reference trace on or off.
toggles the Live trace on or of f. If dual trace mode is selected both t r ac es will be
turned on or off.
4.6.1.1 Understanding the Live, View and Reference Traces
The instrument can display three traces - Live, View and Reference which can be turned on or
off individually using t he Show key. Only the Live trace is updated from the sweep.
Note that a further version of the live trace is available when the Trace Mode is set to Peak -hold
or Average, in which case up to four traces can be displayed – s ee section 4.6.3.1.
The Live trace is green and is normally on-top of the other traces. The Live trace can be
“frozen” at any time by pressing t he Sweep Control key direc tly under the graticule (see sec tion
2.4) or the hard key marked Run/S top. This also stops the sweep.
The Live trace can be duplicated to the View trace by pressing View. This enables an
“instance” of the sweep to be captured without stopping t he sweep. The View trace is white
and is normally located behind the Live trace. The Vie w trace is r etained when the instrument
is turned off.
Page 22
Page 24

The measurement markers normally operate on the Live trace. However, the Live and View
Trace
Mode
Normal
Peak
Hold
Average
Reset
-more1 of 2
Single
Trace
Dual
Trace
traces can be “swapped” by press i ng the Swap key. This stops the s weep and c auses the View
trace to be placed in front of the Live trace. When the traces are swapped, the measurement
markers operate on the View trace.
When the sweep is re-started (or the Swap key pressed again), the Vie w and Live traces are
swapped back.
Either the Live trace or the Vie w trace can be saved to a trace file (see section 5.1).
The Reference trace is purple a nd i s always underneath the other t r aces if they are on. The
reference trace is cr eated by recalling a trace file from the memory. Measurement markers
cannot be used on a Ref er enc e trace.
Note that the View and Reference traces relate to the frequenc y span, RBW and level settings
that existed when they were st or ed. Changing these parameters will result in the graticule
values and annotations no long er bei ng correct for these tr aces.
However, it is possible to recall a Reference trace along with its State. This restores the
frequency span, RBW and level set tings that existed when it was stored (see section 5.1).
4.6.2 Sweep Progress Indicator Line
There are two modes by which t he l ive trace is updated from t he s weep. For sweep times
below approximately 1 second, the trace is updated at the end of the sweep. For longer sweep
times, the trace is updated cont inuously while the sweep is t ak ing place.
In this latter mode a yello w line a ppear s at the bottom of the graticule indicating the progress of
the sweep through its span.
4.6.3 Setting the Trace Writing Mode
provides control of the way i n which the sweep is written to t he Li v e trace. Creates
a set of bottom-row function keys as follows:
each frequency point of the trace is written with the amplitude obtained from the
current sweep.
the trace is written with the highes t amplitude value found for each frequency point
since the sweep mode was selected and s weepi ng c ommenced.
the trace is written with the average amplitude value over a number of sweeps.
operates in both Average and P eak hold modes and re-starts the averaging or peak
hold process from zero.
opens a second set of action keys which are only active when either Peak Hold or
Average have been selected, as detailed below:
this is the default mode in which the “processed” trace (Peak Hold or A verage) is
displayed in place of the Normal trac e.
enables the Normal trace and the “ pr ocessed” trace (Peak Hold or Average) to be
displayed simult aneous ly – see section 4.6.3.1. T he default is for the Normal trac e
to be displayed in front of the “processed” trace.
Page 23
Page 25

swaps the traces so that t he “ processed” trace is in front of the Normal trace – see
Average
Number
Trace
Stores
Store
Recall
Swap
Traces
-more2 of 2
section 4.6.3.1.
creates a pop-up menu that enables t he number of sweeps averaged to be set
between 2 and 48
.
returns to the first set of actions keys as detailed above.
4.6.3.1 Dual Trace Mode
When the trace writing mode is set to Peak Hold or Average, a dual trace mode can be selected
whereby the processed and un-processed traces are displayed simultaneously.
When first selected, the processed trace (Peak Hold or Average) will be shown in yellow with
the un-processed (Normal) trace shown in green in fr ont of it. Pressing Swap Traces changes
this so that the processed t race is shown in green with the un-processed trace in yellow.
The green trace is always at the front and represents the true live trace. The yellow trace is
updated only at the end of each sweep which can result in it lagging the green trace.
Markers operate only on the green trace. Store functions (Store Trace and Log Trace) operate
only on the green trace.
4.6.4 Storing and Recalling Traces and Screen Images
Traces or complete Sc reen Images can be stored as files under automatically
incrementing names or user assigned names. Creates a set of bottom-row function
keys as follows:
enables the Live trace, the V i ew trace, or a complete screen image, to be saved as
a file. See section 5.1 for a full des c ription of the Store func tion.
enables a stored trace to be r ecalled to the Reference trace on the screen. The Ref
trace is purple and is always b ehind both the Live trace and the View trace. Recall
also enables stored scr een images to be viewed. See section 5.2 for a full
description of the Recall function.
Page 24
Page 26

4.7 Using Measurement Markers
Marker
Setup
Function
Fix /
Unfix M1
Move M2
Units
Select
Traces/
Markers
Traces
Control
Trace
Mode
Trace
Stores
Marker
Setup
Marker
Control
This menu group controls t he markers that are used for meas ur ement (as well as the traces
that appear on the screen).
There are two markers M1 and M2 whic h pr ovide a readout of amplitude at any frequency point
on the trace. M2 can only be on if M1 is on, and the frequency difference between the two is
also shown. Markers can be set t o automatically find peaks, or track the largest peak.
4.7.1 Setting-up Markers
controls the visibility of the markers, their function, and their measurement units.
Creates a set of bottom-ro w func tion keys as follows:
creates a pop-up menu that enables t he markers, M1 and M2, the be turned on or
off. Note that M2 can only be on if M1 is als o on.
creates a pop-up menu that enables t he marker measurem ent units to be set.
Graticule Units provides l ogar ithmic measurem ents i n dBm or dBuV (as set within
the Level/Limits > Units/Graticule menu). uW (micro watts) or mV (millivolts)
changes the marker measurement to the appropriate linear scaling.
creates a pop-up menu with a choice of Scroll, Peak Find, or Peak Track modes. In
Scroll mode a single press of the Move Left/Right keys cause the selected marker to
move in one pixel steps (i.e. a frequency step of span/270) , whilst holding a key
down auto-repeats in larger steps.
In Peak Find mode the Move Left/Right keys cause the selected marker to jump to the next
peak of the trace in that direc tion. In Peak Track mode, the marker will attempt to maintai n its
position on the highest peak of the trace even when the peak frequency is changing (see
section 4.7.2.2 for a fuller explanation of Peak Find/Track modes).
The current mode of a mar k er is shown on the left hand side of the marker r ead out. Two
horizontal arrows indicate scroll mode whereas an upwards vertical arrow indicates peak-find
mode. An upward arrow follo wed by a small T indicates peak-track mode.
fixes the amplitude reading of the M1 marker so that it no longer follows level
changes from the sweep. The marker readout is preceded with the word “Fix”.
Pressing it again, or pressing either marker “move” keys, restores normal operation.
moves the M2 marker to the frequency position of the M1 m ar k er (also turns M2 on
to M1
if it was off). This is intended for use with the Fix M1 function to enable amplitude
changes at a specific freque nc y t o be monitored.
Page 25
Page 27

4.7.2 Controlling Markers
Marker
Control
Move
Left
M1/M2
Active
Move
Right
Marker
>Centre
Manual
Set
controls the frequency pos i tion of the markers. Creates a set of bottom-row function
keys as follows:
selects which marker is controlled by the marker movement keys. The active
marker is indicated by an arrow (>) in front of its readout.
enables the frequency position of the active marker t o be s et numerically using
similar frequency entry screens as for Set Centre (see section 4.1.1). Note that the
marker position can be set outside of the current span and therefore off the screen.
moves the active mar k er to the sweep centre frequency (i.e. the c entre of the trace).
This is particularly useful if the active marker is off the screen.
moves the active mark er left or right either in frequency steps or from
peak to peak of the trace depending on the Marker Mode (Scroll or P eak
Find). In Scroll mode, a single press moves one pixel on the displa y and
holding the key down causes it to move continuously in steps of about ten pixels.
4.7.2.1 Controlling Markers with the Hard Keys
The normal function of the five “navigator” hard keys in the
centre of the instrument is to control the markers. This allows
control at all times witho ut the need to select the Marker Setup
or Marker Control sub-group menus.
When the navigator keys ar e in this mode, the round key
marked Control Markers i s il luminated. If not, pressing the
key will restore this mode. Pressing the key repeatedly cycles
through selection of the visible markers (Both Off > M1 Onl y >
M1 and M2 > Both Off).
Pressing the centre button on t he navigator toggles the active marker between M1 and M2, or
turns M2 on if it is off. Pressing the Up key selects Peak Find f unc tion, while pressing the Down
key select Scroll func tion. Whenever the Up key is pressed, the sel ec ted marker will jump to
the highest peak.
The Left and Right keys m ove the active marker left or right either in screen resolution steps or
from peak to peak of the trace depending on the function.
Whenever the navigator mode is changed, an information box appears. This alert can be
turned off if preferred - see section 4.10.3.3.
4.7.2.2 Further Notes on the Use of Markers
Function = Peak Find
Peak Find mode is selected f rom Marker Setup > Function or fr om the Navigate Up hard key,
and is indicated by an upwards arr ow on the left hand side of the marker readout. The mode is
selected for the mark er that i s c urrently active.
Pressing the Navigate Up hard key places the currently selec ted marker on the largest peak of
the trace.
Pressing the Move Left/Right keys will cause the instrument to attempt to position the marker
on the next peak of the trace in t hat direction. The peak-find algorithm may sometimes place
the marker on the rising or falling edge of a peak and its performance will depend upon signal
and noise levels.
Page 26
Page 28
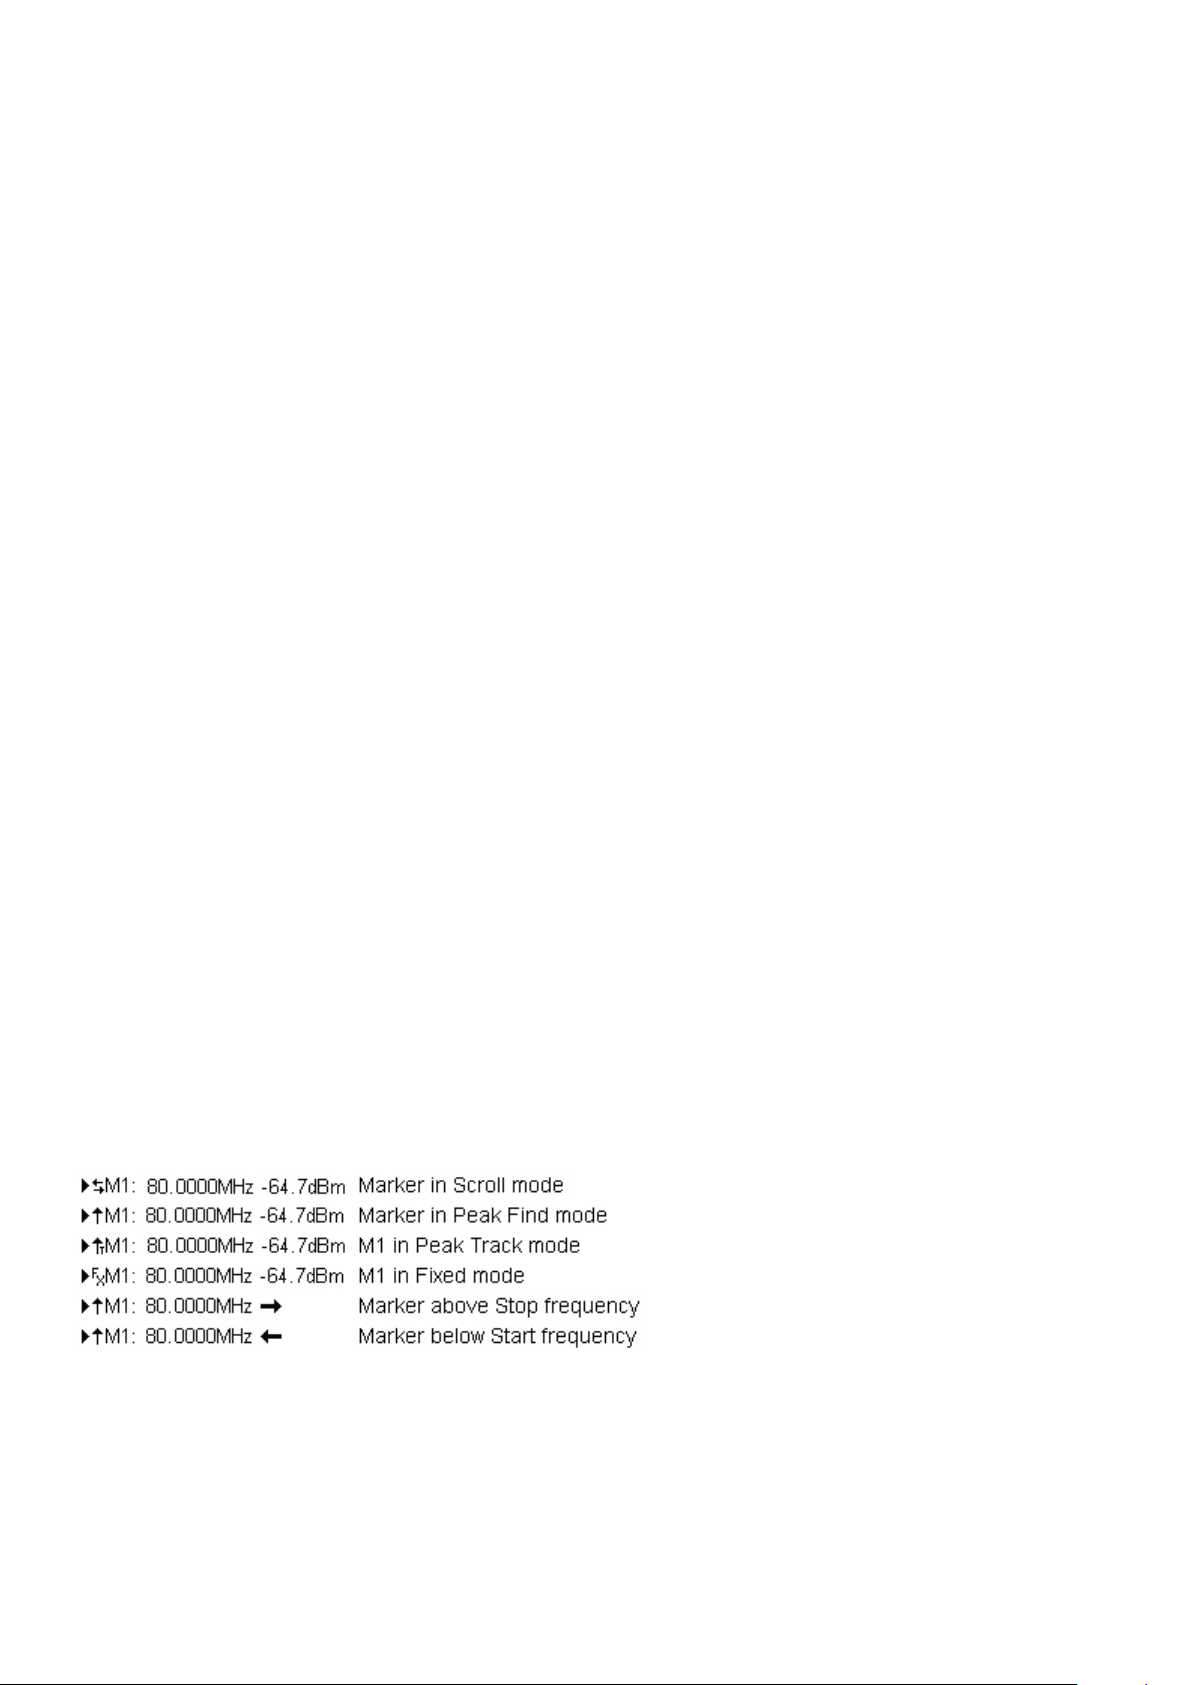
Function = Scroll
Scroll mode is selected from Marker Setup > Function or from the Navigate Down hard key, and
is indicated by two horizontal ar r ows on the left hand side of the marker readout. The mode is
selected for the mark er that i s c urrently active.
Function = Peak Track
Peak Track mode can only be selected for M1. It is selected from Mark er Setup > Function, and
is indicated by an upwards arr ow followed by a capital T on the left hand side of the marker
readout.
When selected the marker will attempt to track the highest peak of the live trace.
Marker Frequency Preci s i on
The frequency position of a marker is always shown to a resolution of 0.001MHz (1kHz) .
However, the actual position of the marker is a function of the span. If, for example, the span is
set to 50MHz, each frequency poi nt on the trace represents a “buck et” of frequencies 185kHz
wide (span/270).
If the marker is set using the Move Left/Right keys, it will give a frequency readout equ al to the
upper frequency of the bucket. If the marker is set num er ically to a specific frequenc y using
Manual Set, the marker posit ion on screen will jump to the upper frequency of the bucket that
contains that numerical value.
If the span is reduced, the accuracy of the marker frequenc y readout improves. However, i t is
only when the span is reduced to 270kHz that the marker frequency position becomes accurate
to 1kHz.
“Off Screen” Markers
Markers are positioned by absolute frequency. Consequent ly, when the frequency span of the
sweep is changed, the mark er may no longer appear within the trac e ar ea. This is indicated by
an arrow within the marker readout replacing the amplitude value.
The frequency position of the marker is retained, but no amplitude information is available. If
the frequency span is subsequently changed to include the marker frequency, it will reappear in
the correct position.
Pressing the Navigate Up hard key (Peak Find mode) will bring the marker on screen at the
highest level in the trace.
Re-positioning a marker using the Move Left/Right keys will cause it to reappear immediately
from the appropriate side of the graticule. Alternativ ely pressing Marker>Cent r e in the Marker
Control sub-group menu will cause it to appear in the centre of the screen.
Marker Mode Symbols
Marker Difference Readout
If both markers are tur ned on, t he difference in frequency and l evel is shown in grey underneath
as Mdelta. The readout represents the M2 values minus the M1 values (M2 - M1).
Page 27
Page 29

4.8 Data Logging Functions (when fitted)
Logging
Setups
System/
File Ops
Setup/
Functions
Logging
Timer
Setup
Log
Type
Log
Trigger
Logging
Control
This menu group controls logging functions when fitted (see section 6.1). It also controls
store/recall of instrument set-ups and access to system functions and file operations, which are
covered in the following section - section 4.9.
4.8.1 Setting-up the Logging Function
Logging is only availabl e when the upgrade option U01 is fitted. Logging enables
files containing mult i ple traces, screen im ages or peak val ues to be created in
response to trigger events or a timer. Creates a set of bottom-row function keys as
follows:
creates a pop-up menu that enables t he type of log file to be select ed. Centre
Amplitude logs only the amplitude at the centre frequency. Peak Value logs the
frequency and amplitude of the highest peak in every sweep. Trace logs the whole
trace. Screen Image logs the whole screen as a bit-map image.
creates a pop-up menu that enables selection of the trigger event that will cause
each logging entry. The options ar e Manual, Timer, Ext + ve, E xt -ve, Limits and
Continuous.
enables the time interva l between logging events to be s et. The timer value is only
used when the log trigger is s et to Timer.
opens a new control menu from which the logging function to be controlled
(see section 7.8.1).
For a more detailed descript i on of the Logging function see secti on 7.8 .
Page 28
Page 30

4.9 Storing and Reca lling Set-ups | System Settings
Logging
Setups
System/
File Ops
Setup/
Functions
Setups
Store
Setup
Recall
Setup
Load
Defaults
System/
File Ops
Display
Darker
Display
Brighter
System
Utilities
File Ops
Presets
This menu group controls storing and recalling complete instrument set-ups, and acces s to
system functions such as screen brightness and file operations (as well logging when fitted see section Error! Reference source not found.).
4.9.1 Storing and Recalling Instrument Setups
enables the complete set up of the instrument to be stored and rec alled via user
nameable files. See section 8.2.5 for an explanation of setup files. Creates a set of
bottom-row function keys as follows:
opens the Presets menu, dupli c ating the action of the P RESET hard key
(see section 4.11).
opens the store and recall control screens for setup fi les . See sections
5.3 for a description of the store screens, and section 5.4 for a
description of the recall s creen.
loads the factory defaul t setup, thus restoring the instrument status to its ori ginal exfactory settings – see section 17. No user-created files are modified or deleted.
4.9.2 System Settings, Screen Brightness, Filing System and USB Operations
provides access to some system and file management options, including screen
brightness and file t r ans fer via USB. Creates a set of bottom-row function keys as
follows:
opens the System Utilities special menu,
which is also available vi a the Status/Help
hard key (see section 4.10)
enables file management in terms of
renaming, deleting and copying of files to
or from a Flash Memory Drive or a PC
using the USB link (see section 5.6).
changes the screen bright nes s and provides a bar graph showing the
current brightness level.
Page 29
Page 31

4.10 Status Infor mation | On-screen Help | System Utilities
Context
Help
System
Utilities
Calibrate
Screen
Screen
Topics
List
View
On PC
This menu group is accessed usi ng the hard key marked STATUS/Help or by the soft key
Setup/Functions > System/File-Ops > System Utilities. When the key is pressed, the normal
key menu is replaced by a speci al menu as shown
opposite.
4.10.1 Status Display
When the Status/System key is selected, the top part
of the screen is replaced by a detailed listing of the
current instrument setup conditions.
The status inform ation is s pli t over four pages. Press
Status again to access the next page or press E xit to
return to normal operation and restore the menu
group and sub-group that were in place when the
Status hard key was pressed.
4.10.2 Help Screens
Help information is avail able from the same menu
system as is status, by pressing the Context Help or
Topic List keys.
brings up a help screen rele vant to the
menu sub-group that was in use prior to
the Status/Help key being pressed.
Context Help may cover several pages, these are
selected with the Next/Pr ev Page keys.
brings up a topics list from which all of the individual help screens can be selected.
Select the required menu sub-group using Move Up/Down and c onfirm with Select
Topic.
Pressing Exit when displa ying a Help screen returns the analyzer to normal operation.
4.10.3 System Utilities
Pressing Setup/Functions > System/File-Ops > System Utilities, or the Status hard
key followed by Status/Syst em brings up a sub-group menu as follows:
4.10.3.1 Screen Utilities
enables aspects of the T FT color screen to be adjusted. Creates a set of bottom-
row function keys as f ollows:
opens a calibration screen for the touch screen. (The t ouch screen is a resistive
layer which overlays the TFT screen. From time to time it may be necessary to re-
calibrate the positional ac c uracy of the system).
Calibration must be done using a stylus, and the centre of t he “ bull s ey e” must be touched
accurately in each of three positions. To abort the calibration, press the Exit hard key.
View on PC is only available with the upgrade option U01 is fitted. It places the
instrument into a special mode in which the graphics of the display are sent to a PC
via USB. See section 16 (Appendix A).
Page 30
Page 32

opens an information box exp laining where the screen brightness controls are
Bright
Level**
Pwr-On
State
Auto
Off
Power/
Clock
Set Date
& Time
Alerts
System
Update
Navig.
Prompt
Calibrate
Hardware
Install
Options
Beep
Prefs.
Trace
CSV
Update
Firmware
located (Setup/Functions > System/File Ops) . This is because screen brightness
should be adjusted with the trace and graticule displa yed rather than the status
screen.
4.10.3.2 Power Options, Power-on State, Clock Setting
enables aspects of the po wer on-off system to be set, along with t he r eal-time clock.
Creates a set of bottom-ro w func tion keys as follows:
opens a dialogue box from which t he date and time can be set for t he real-time
clock. Times are in 24 hour format and dates are day-month-year.
creates a pop-up menu that enables t he i ns trument to be automatically turned off
after a period of inactivity. Options are Never and 5 mins to 60 mins. Auto Off
ceases to operate when t he ins trument is externally power ed.
creates a pop-up menu that enables t he condition of the instr ument at switch-on to
be set. Options are Last Used (restore the settings that existed at switch off), or
User Preset (over-ride previous settings with those defined in the User Preset - see
section 4.11.1).
4.10.3.3 Alerts
enables certain elements of the user interface to be turned on or off. Creates a set
of bottom-row function keys as follows:
creates a pop-up menu that enables t he warning beep to be turned on or of f. Beeps
are created in response t o il legal operations such as setting an out-of-range value.
creates a pop-up menu that enables t he i nformation boxes that c onfirm and explain
the current mode of the navigat or k eys (control marker s or navigate touch screen) to
be turned on or off.
4.10.3.4 Preferences
enables some minor system preferences to be changed to meet specific
requirements of the user :
creates a pop-up menu that enables t he values stored within a trac e file to be either
absolute (default) or Relative to the selected reference level. The latter was the
default for earlier versions of the firmware, and could be requir ed for backwards
compatibility with custom written application software.
4.10.3.5 System Updating and Calibration
enables updating of t he instrument firmware or recalibration of the instrument.
Creates a set of bottom-ro w func tion keys as follows:
opens a dialogue box which enabl es the instrument to be recalibr ated.
Recalibration should only be performed by skilled personnel with access to prec i s ion
equipment and in conjunct i on with the Service Guide.
enables firmware-based options or firmware updates to be installed.
See section 10.1.
Page 31
Page 33

4.11 Using Instrume nt Presets | Automatic Se tting
Standard
Preset
User
Preset
Auto
Set
Recall
Setup
Restore
Previous
Standard
Preset
Auto
Set
Recall
Setup
Restore
Previous
Execute
User
Preset
Exit
Presets
Help
Custom
Presets
This special menu is access ed us i ng the hard key marked PRES E T (Presets/Auto). Its function
is to enable the overall setup of the instrument to be changed quickly to suit specific
requirements.
sets the frequency, level and sweep parameters back to k nown state and cancels
the more complex funct ions of the instrument (see section 9.2).
sets the frequency, level and sweep parameters back to defined state as set by the
user. It is initially identi c al to the Standard Preset, but c an be modified by the user
to match their specific preferences - see section 4.11.1.
performs a maximum-span sweep at the widest RBW and then sets the centre
frequency, span, RBW and Level to create a useful display of the highest amplitude
point found within the in itial sweep. The Auto Set function takes several seconds to
complete.
goes directly to the Recall S etup control screen f r om which any setup file can be
recalled.
restores the setup to its condit ion at the point that t he P r esets hard key was
pressed.
executes the operation selected by any of the above keys.
this is only available when the upgrade option U01 is fitted. Custom Presets
enables multiple presets to be saved/recalled just by entering a number.
creates a Help screen specific to the Presets function.
restores the menu and sub-group menu that were in place when the Presets hard
key was pressed.
4.11.1 The User Preset
The User Preset is a user-modified version of the Standard Preset. To change the action of the
user preset, set up the spectrum analyzer as required and select Save Current from the User
Preset function keys. The parameters as described in section 9.2 will be overwritten by their
current values.
If preferred, the User P reset can be loaded whenever the instrument is switched back on f r om
off - see section 4.10.3.2.
4.11.2 Custom Presets (when fitted)
Custom Presets is only available when Option U01 is fitted. It enables multiple presets to be
saved/recalled just by entering a number. See section 7.3.5.
Page 32
Page 34
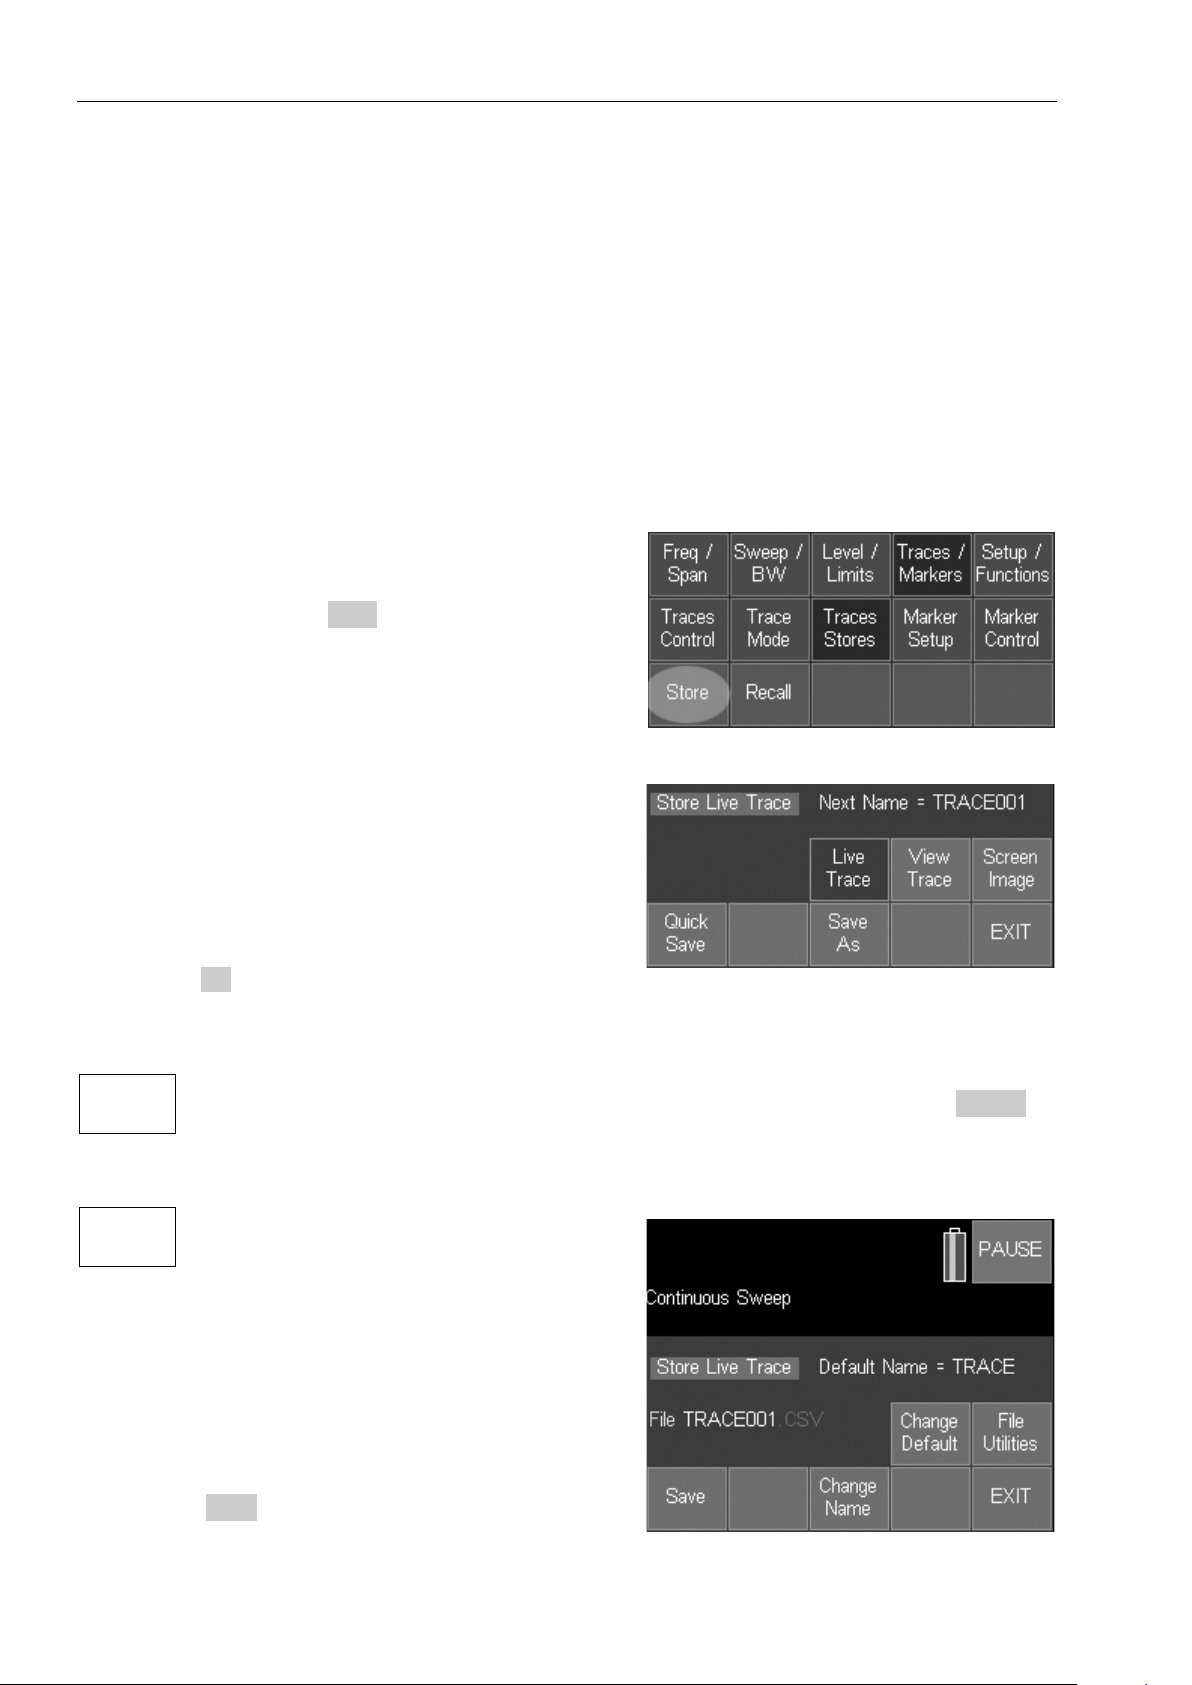
5 File Storage for Traces, Screen Images & Set-ups
Quick
Save
Save
As
The instrument incorpor ates a large Flash based disk drive for the storage of a variety of
different file types including Traces, Screen Images and Instrument Set-ups. When the
upgrade pack (U01) is fitt ed i t may also include Logging Files, Limit Pattern Tables and
Amplitude Compensation Tables.
The instrument filing system provides a consistent method for storing, recalling, renaming,
deleting and copying fil es . Files can be transferred to and from a personal computer f or
backup, analysis, print ing and documentation purposes .
Whenever files are being ac c essed, the front panel LED mar ked Disk flashes. Depending up on
the file operation in progr es s , there may be a significant del ay before further key operations are
possible.
5.1 Storing Traces or Screens
Storing of Traces or Screen Images is controlled from
the menu function:
Traces/Markers > Traces/Stores > Store.
(as described in section 4.6.4)
This function enables a tr ac e or screen image to be
stored as a file within the internal memory. (N.B.
external memory cannot be used to store files
directly, although files can be copied to external
memory later).
The menu keys are replaced b y a cont rol screen as
shown.
The top row of keys sets what will be s tored: the Live
Trace, the View Trace, or a Sc reen Image. The
currently selected f ile type is shown in the green box
above the keys.
See section 8.2 for an explanation of Trace files and
Screen Image files.
There are two methods f or savin g to a file: Quick Save and Save As.
stores the trace or screen under an automatically incrementing name (e.g.
TRACE001 etc.) as set by the Default name as described below in section 5.1.1.1.
The key can be pressed repeatedly to store traces/images as they appear. The next
name that will be used is shown in yellow within the area above the keys.
halts the trace update (causing the sweep
status key to go to Pause) and enters the
next screen as shown.
The auto-allocated fil e name is shown (based upon
the current default f i le name), and pressing Save will
store the file under that name. However, the option
also exist to change the name before saving.
Pressing Change Name brings up an alpha-numeric
keypad which can be used to enter any n ame of up to
eight characters that the us er may choose.
See section 5.6.1.
Page 33
Page 35
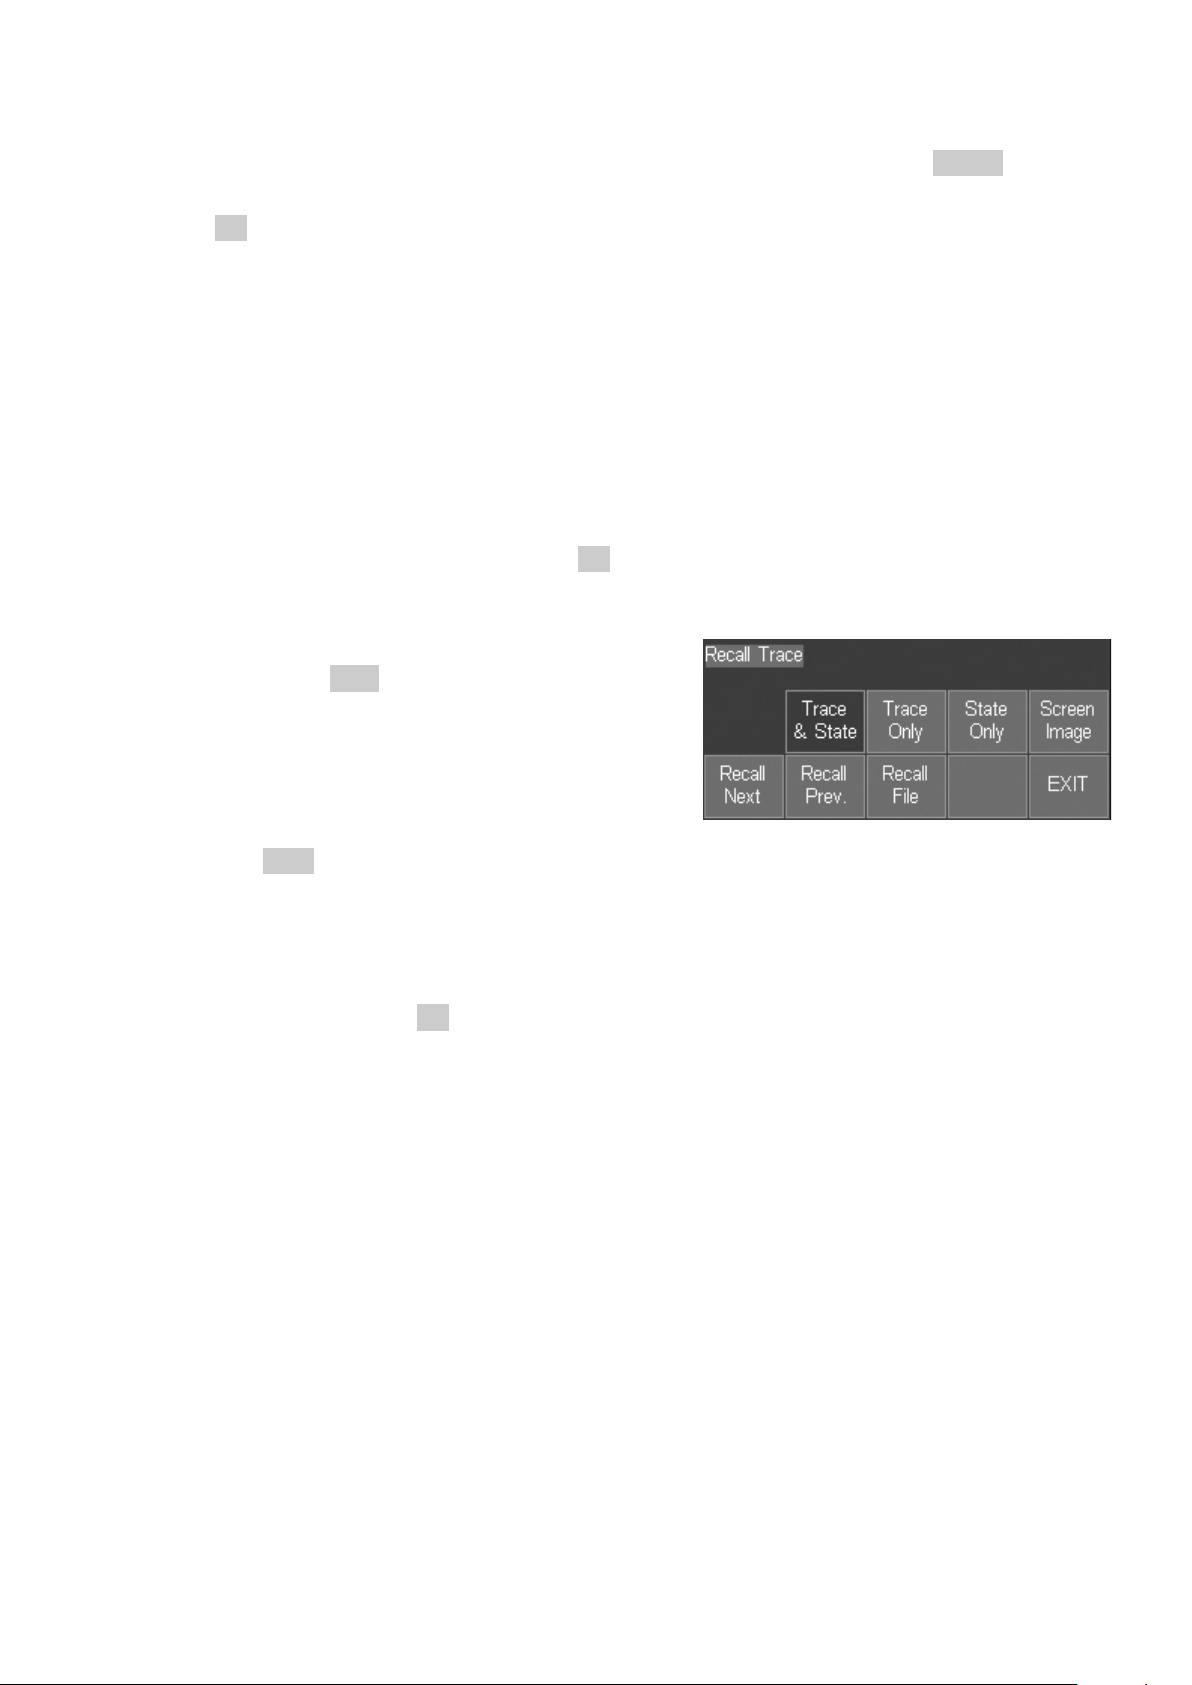
Pressing Save completes the storing of the file under the chos en name.
The default name can also be changed by pressing
Change Default. Any nam e of up to five characters can be used - s ee section 5.1.1.1 below.
It is also possible to delet e or rename files from this scr een by pressing File Utilities - see
section 5.5.
5.1.1.1 Default File Name Rules
Default names are always five characters long, but t he us er can choose to enter less than
five characters and the system will add the appropriate number of underscores at the end.
The five characters are followed by a three digit number that starts at 001 and autoincrements up to 999.
Deleting files will ha ve n o effect on the increment system so that, if the user had created
fifteen files and then deleted them all, the next file saved would still have the number 016.
Should the number reach 999, the auto increment will star t again at 001. If this file already
exists, the user will be prompted to delete or rename files or to change the default name.
If the user needs to check t he l is t of existing stored files, or to rename or delete files, t hi s c an be
done by pressing File Utilities - see section 5.5.
5.2 Recalling Traces and Images
The Recall function from the Traces/Stores sub-group
menu (see section 4.6.4) cr eates a control screen as
shown.
The top line of keys enable the s election of the type
of file to be recalled.
Trace files can be recalled in three different ways,
Trace & State, Trace Only, or S tate Only
See section 8.2.3 for an explanat ion.
Screen images can also be rec alled from this screen. A rec al led s creen image overwrites the
existing graticule and annotation area. Recalling an image takes around three seconds, with
the image building from the bottom upwards.
Pressing Recall File opens a file list which can show any of the currently stored files of the
selected type. See section 5.4 for an explanation of the File Recall screen.
Pressing Recall Next or Recall Prev. recalls the next or previous file in the list without the need
to re-enter the File Recall scr een. This is particularly useful when searching through stored
screen images.
5.2.1 Traces and States
A trace file represents the swept trace as it appears upon the scr een along with information that
defines the frequency span, RBW, VBW and reference level at the time that it was stored. T he
latter information is referred to as the State.
When a trace file is recalled, the user can choose to recall the whole file (Recall Trace & State),
the trace amplitude values only (Recall Trace) or t he S tate values only (Recall State).
Whenever the State is recalled, the spectrum analyser set-up is changed to match t he
parameters within the rec al led file.
Page 34
Page 36

5.3 Storing Instrument Set-up Files
Storing of Instrument Set-ups is controlled from t he
menu function:
Setup/Functions > Setups > Store Setup.
(as described in section 4.9.1)
This function enables a complete instrument set-up to
be stored as a file within the internal memory. (N.B.
external memory cannot be us ed to store files
directly, although files can be copied to external
memory later).
The menu keys are replaced by a control screen as
shown.
The auto-allocated fil e name is shown (based upon
the current default f i le name), and pressing Save will
store the file under that name. However, the option
also exist to change the name before saving.
Pressing Change Name brings up an alpha-n umeric keypad (see illustration in section 5.6.1)
which can be used to enter any nam e of up to eight characters that the us er may choose.
In the event that a file with that name already exists, a warning message will be displayed.
The default name can also be changed by pressing Change Defaul t. Any name of up to five
characters can be used - see s ection 5.1.1.1
It is also possible to delet e or rename files from this scr een by pressing File Utilities - see
section 5.5.
5.4 File Recall Screen
The recall screen for any file type uses the whole of
the display area in order to i nc lude a file list. The list
consists of the file name (without its extension) the
date of storage (in format dd/mm/yy) and the time of
storage (in 24 hour format hh:m m). A moveable
pointer operated by the Up and Down keys shows
which file is to be executed.
The keys that control the file selection are in a vertical
list on the right hand side.
One screen can show 20 fil es s imultaneously.
Pressing Page Up or Page Down scrolls t hr ough the
files in blocks of twenty.
By default, files appear within the list in date/time
order with the oldest files at the top.
Pressing All Files returns to this lis ting type at any
time.
Pressing Latest Files will show a screen of up to 20
files that represent the most recently stored or
recalled files.
Files can also be found f r om their starting character
using File A-Z.
Page 35
Page 37

Pressing Find A-Z brings up an alpha numeric keyboard. When a character i s pr essed the
keypad disappears and t he li s ting then shows only files that start with that character.
Pressing Recall executes the file operat i on.
It is also possible to delet e or rename files from this scr een by pressing File Utilities - see
section 5.5.
5.5 File Utilities Screen
Store and Recall screens inc l ude a File Utilities key
which enables files to be renamed or deleted.
The layout is similar to a File R ec all s c reen - see
section 5.4 .
Pressing Rename brings up the alpha-numeric keypad
from which the file name can be changed.
See section 5.6.1 for an explanation of file renaming.
Pressing Delete asks for confi rmation before
permanently deleting the s el ec ted file.
5.6 File Operations S creen
The File Operations screen is an extended version of
the File Utilities screen provided for Store and Recall.
It can be used for all types of file, supports external
Flash memory drives, and also pr ovides access for t he
“Link to PC” USB connection.
File Operations is selected from the Setup/Functions
menu:
Setup/Functions > System/FileOps > File Ops.
The upper row of keys enables the file type to be
selected (Traces, Im ages , Setups etc.).
The upper section of the screen s hows a file list for the
selected file type, and is s imilar to the File Utilities
screen except that the options of Latest Files and Find
A-Z are not available.
The lower row of keys provides further options and
actions.
Pressing Switch Drive enables the fi les present on an
external USB Flash drive to be listed in place of the
internal drive. If no exter nal dr ive is connected, the
key will have no effect.
Pressing the key repeatedly alternates between the
two drives. The currently selec ted drive is displayed
within the green box.
On the first occas i on that the external drive is
accessed there will be a delay and a warning
message will be displayed - see section 8.1.2.
Page 36
Page 38

Pressing Link to PC causes all spectrum analyzer operation to be suspended and enables a
connection to be made to a personal c omputer.
See section 8.1.3 for a detailed explanation.
Pressing File Actions changes the screen to provide
options of Rename, Delete or Copy.
Rename and Delete operate in a similar way as for the
File Utilities screen - see sect ion 5.5.
The Copy function copies a f i le from
selected drive. Files can therefore be copied from the
internal drive to the external drive or vice versa by
using Switch Drive on the previous screen.
It is also possible to copy all files of the selected file
type by using Copy All.
the currently
5.6.1 Editing File Names
Editing a file name (Store File screen) or renaming a
file (File Utilities or File Ops screens) uses an alpha
numeric key matrix. T he m atrix replaces the upper
screen area.
The whole of the required name must be ent er ed. It is
not possible to edit an existin g name character by
character.
The new name appears at the bottom of the screen
replacing the eight triangl es s hown in the illustration.
Names can be from one to eight c haracters long and
can include upper case letters, numbers, dash (-), and
underscore ( _ ).
Corrections can be made during e ntry using the backspace key.
In the event that a file with that name already exists, a
warning message will be dis played.
Pressing Save applies the new name and returns to
the previous screen.
Pressing Back returns to the previous screen wi thout
applying the new name.
Pressing Exit leaves the selected filing s yst em function
immediately.
5.6.2 File Names Created or Renamed Externally
Files may be created externally or created within the instr ument and renamed externally (e.g.
using Link to PC mode). Such files may have long file names and/or include lower case
characters and additional characters such as ?.
The instrument will correctly list all such files t hat conform with an 8.3 naming s yst em and which
have the correct extensi on for the relevant folder. Where the file name exceeds eight
characters, it will trunca te the file name using a ~1 conventi on.
Files with the wrong extension, or which have been placed in the wron g folder will not be visible
to the instrument filing system. See section 8.2 for a description of file types and their file
extensions.
Page 37
Page 39

6 Upgrade Option U01
The capabilities of the instrument can be enhanced by installing the upgrade option U01 which
adds additional firmware to the instrument.
Option U01 can be downloa ded from the Aim-TTi website and can be installed by the user
without any requirement to return the instrument to it s supplier. Activation of the upgrade is
achieved via an activati on c ode which can be purchased from Aim-TTi, or from our dis tributors
and agents across the world.
6.1 Additional Functions from Option U01
Installing Option U01 provides the additional functions listed below. Further functions may have
been added since this manual was written - see the Aim-TTi website for up to date information.
6.1.1 Logging of Values, Traces or Screens
The Logging function enabl es results to be saved into log files in response to a timer or to a
trigger event. Individual amplitude values, complete traces, or full screen images can be saved.
See section 4.8.1 for more information.
6.1.2 Triggering
The triggering function enables sweeps or logging to be tr i gger ed in response to an internal or
external trigger event. The internal trigger event can be generated by the Limits function.
See section 7.5 for more information.
6.1.3 Limit Lines, Limit Patterns & Channel Markers
Limit lines and patterns can be s hown on the display, and compared with the trace. They can
be used to trigger a logging event , generate an audible warnings or output a trigger pulse.
Limit lines are simple horizontal lines whereas limit patterns are freque nc y dependent amplitude
limits that are stored as files. Two limits can be used sim ultaneously. Channel markers ar e a
special version of a limit pattern that creates only vertic al l ines.
See section 7.7 for more information.
6.1.4 Level Offsets
The level offset funct ion enables the level values f or the graticule and markers to be corr ec ted
for external attenuation or gain. Compensation can als o be made for signals com ing from a
75Ω source.
6.1.5 Compensation Tables
Compensation tables are lists of amplitude versus fr equency which enable frequency related
amplitude variations from antennae or transducers to be compensated for within t he spectrum
analyzer. Compensatio n tables are stored as files. See section 7.6.2 for more information.
6.1.6 Custom Presets
Custom Presets enables multiple presets (set-ups) t o be s aved/ r ec alled just by entering a
number. See section 7.3.5.
6.1.7 View on PC
View on PC places the instrument into a special mode in which the graphics of the display are
sent to a PC via USB. The screen can then be viewed at any size using PSA -View PC
software. See section 16 (Appendix A) for more information.
Page 38
Page 40

6.1.8 PSA-Manager Software
PSA-Manager is a Windows based software application which is used in conjunction with t he
instrument. It provides t he c apability for displaying and printing Traces and Screen Images,
display and analysis of Log files, and creation of Limit Patterns and Compensati on Tables.
See section 16 (Appendix A) for more information.
PSA-Manager software is provided on the support CD supplied with t he pr oduct and the latest
version is free to download from the support section of the Aim-TTi website. It has limited
functionality for ins truments that do not have option U01 fitted but can be useful for displaying
and printing traces and screen images.
Page 39
Page 41

7 Further Notes on Operation
7.1 Signal Overload Levels and Indicati on
The maximum input level without damage is + 20dBm or +127dBuV of RF power
(approximately 2.2 volts RMS), or 50V DC. The maximum signal that can be measured is
0dBm with the Reference level s et to 0dBm.
Signals that would cause the trace to rise above the reference level are indicated by a red
arrow at the top of the graticule. However, no indication is gi ven if the trace is above (or belo w)
the graticule as a result of Scale/Shift, Offs et or Compensation Table, provided that it is below
the reference level.
Large signals outside of t he di s played span can cause measurement errors because of
overload in the analog mixers and amplifiers. Consequently a full-span sweep should be run to
check for any high levels s ignal s within the frequency range of the analyzer.
7.2 Operation using the Hard Keys Only
Although the instrum ent is des i gned to be operated via the touch
screen, it is also possible to operate it using only the hard keys.
This may be appropriate in part i c ular circumstances such as
when the user is wearing glo ves.
Hard-key-only operation is activated by pressing the circ ul ar
button marked Navigate Screen which then il luminates. This
changes the function of the five Navigator keys from controlling
the Markers to controlling the position of the on-screen key
highlight.
The highlight position is shown by a change in the key color t o pur ple. Pressing the centre
button operates the key.
Normal menu funct ions can be operated in this way. Pop-up menus and other special function
screens can be exited by pressi ng the EXIT hard key. An exception is the S et by Tab/Jog
function, described in sec tion 7.3.2 , where the horizontal and vertical navigator keys operate
the tab and jog functions respectively.
Note that, if a touch-screen key is pressed directly, t he " har d-key only" mode is cancelled and
the Navigate Screen button ceases to be illuminated. To re-enable the mode, the button must
be pressed again.
Whenever the navigator mode is changed, an information box appears similar t o that shown
above. If preferred, t his reminder can be turned off - see s ection 4.10.3.3.
Page 40
Page 42
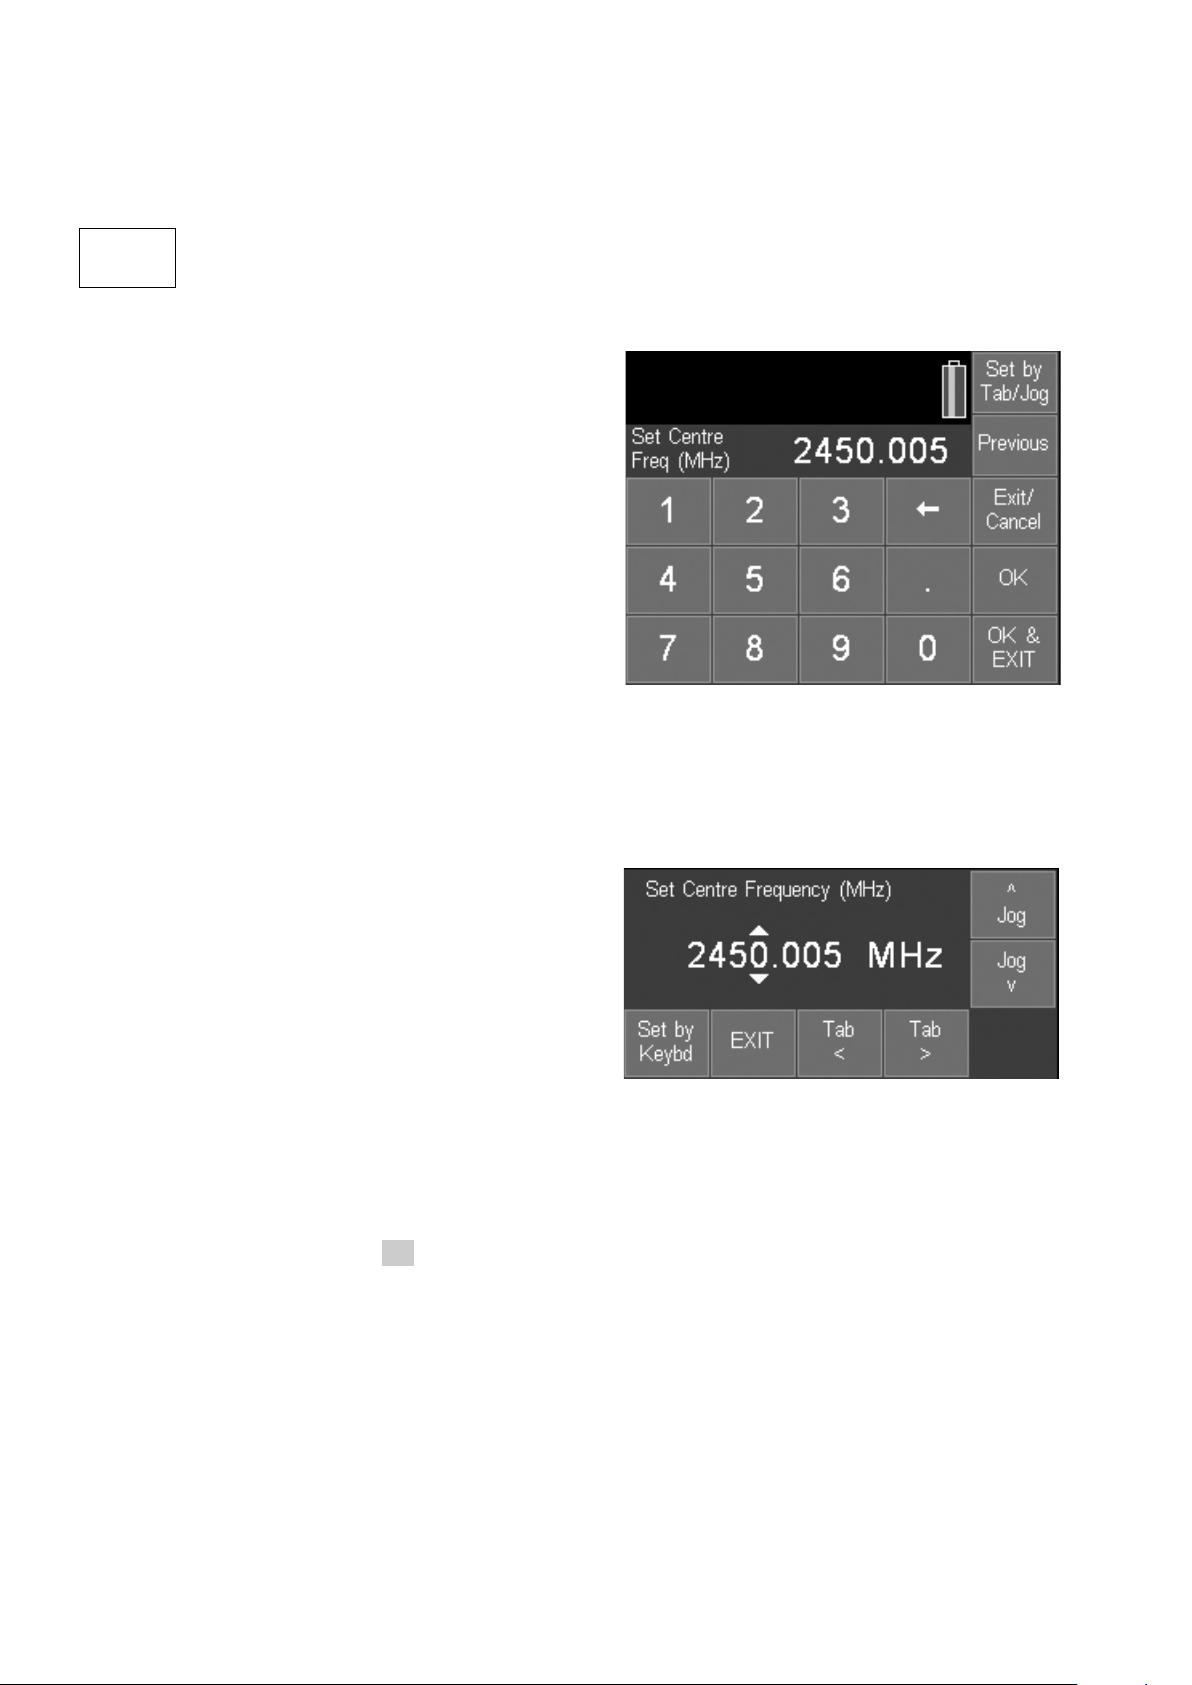
7.3 Setting Frequencies
Set
Centre
The control screens used for setting frequencies are common to Set Centre, Set Span, Set
Start, Set Stop, Set St ep and Mark er Manual Set. The following illustrated example is for Set
Centre but is similar for all other frequency setting functions.
pressing this key will bring up either the Set by Keypad screen or the Set by Tab/Jog
screen depending upon which one was last used for sett ing that frequency
parameter.
7.3.1 Set by Keypad
This control screen replac es the menu with a 0 to 9
keypad. The frequency is entered in MHz using the
decimal point if required (maximum resolution
0.001MHz). Frequencies can be entered just to the
resolution required – following digits become zeros.
Entry errors can be corrected with the back-space
key ().
Pressing OK sets the entered frequency withou t
leaving the control screen. The frequency value is
cleared ready for enter ing a new value.
Pressing OK & Exit sets the entered frequency and
returns to the menu.
Pressing Exit/Cancel returns to the menu without setting the entered frequency.
Pressing Toggle Last returns the frequency to the value directly prior to the last frequency entry.
Pressing Tab/Jog changes to the alternate control screen as detai led below.
7.3.2 Set by Tab/Jog
This control screen replac es the menu with a
display of the existing f r equency and enables it to
be changed.
Pressing either of the Tab keys moves the arrows
left or right along the digit s .
Pressing either of the Jog keys increments or
decrements the value of that digit.
The Jog keys auto-repeat, and the new frequency is accepted and executed after a delay of
around two seconds.
Pressing Exit returns to the menu. Pressing Set by Keypad changes to the alternat e control
screen as detailed above.
Note that when Navigate Scr een mode is selected, the navi gator keys perform the tab/jog
function directly - see section 7.1.
7.3.3 Shortcuts to setting a Specific Frequency Span
Narrower Span
Having set a frequency span in which the signals of int erest are visible, the user may wish to
examine a specific part of the span at greater resolution.
If the point of interest is the highest level within the current sweep, it can be moved to the centre
of the screen f r om the Centre sub-group menu (Fr eq/Span > Centre > Set C=Pk).
Alternatively, mar k er M1 can be plac ed at the point of interest and moved to the centre of the
screen from the Centre sub-group menu (Freq/Span > Centre > S et C=M1).
Page 41
Page 43

Once the point of interest i s in the centre of the screen, the resolution can be increased using
the Zoom In function fr om the S pan s ub-gr oup menu (Freq/Span > Span > Zoom In/Out).
An alternative method which enables a more precise span to be set is to place marker M1 at
the start of the area of interest and marker M2 at its end. The new span is then set from the
Start/Stop sub-group menu (Freq/Span > Start/Stop > S tart=M1,Stop=M2).
Wider Span
Having set a frequency span in which the signals of int erest are visible, the user may wish to
examine a wider span in order to s ee further signals not currently visible.
One method of doing this is to zoom out from the Span sub-group menu ( Freq/Span > Span >
Zoom) which shows frequencies both above and below the current span.
Alternatively, the user may wish to look only at frequencies above (or below) the current spa n.
This can be done from the Start/Stop sub-group menu (Fr eq/Span > Start/Stop > Fix Start or
Stop). Once the start or stop frequency is fixed, the word Fix is displayed next to its f requency
at the top of the screen. The Step Up and Step down keys can then be used t o inc rease or
decrease the opposite frequency only. Pressing the key again will cancel the condition. See
section 4.1.3.
7.3.4 Repetitive Operations
A common requirement for a spectrum analyzer user is to change repetitively between t wo or
more frequency ranges. The PSAxx02 provides several methods for doing this .
1. When setting the centre frequency using t he keyboard, the Previous k ey can be used to
toggle between two centr e frequencies - see section 7.3.1. The same facility is provided for Set
Span, Set Start and Set Stop.
2. Frequency Presets, selected via the Frequency/Span menu group, enable up to six
frequency spans to be stor ed and rapidly recalled - s ee s ec tion 4.1.5. Only Centre/Span or the
equivalent Start/Stop frequencies are stored. Other parameters such as RBW are not affected
(unless set to Auto).
3. Trace States are files which contain not only the fr equenc y span, but the RBW, the Level
setting and the graticule scale and units. Up to 999 trace files can be stored and are recalle d
from the Traces/Stores control screen - see section 4.6.1.
4. The hard key marked “Presets” brings up a menu of set-up states - see section 4.11. Note,
however, that these change many parameters of the instrument simultaneously.
7.3.5 Using Custom Presets (when fitted)
Custom Presets is only available when Option U01 is
fitted. It is accessed using the Presets hard key - see
section 4.11.
Pressing the Custom Preset s key brings up a menu
as shown.
Custom Presets is an extended version of the User Preset from which multiple presets can be
saved or recalled by enteri ng just a number. To save a new preset, s et up the instrument as
required and press the Save Preset key followed by a number.
Each Preset is a special t ype of Setup file stored in the SETU P S di r ec tor y with a file name of
the form $PST0001 where the $ is fixed and the next three characters (default PST) can be
changed to create mult iple groups of presets. The last four c haracters represent the num ber by
which the preset is saved or r ec all ed. Any number in the range 1 to 9999 c an be us ed, although
the number of presets simultaneously available is s et by the directory limit of 999 files.
Applications for which Custom Presets might be used include frequency select i on v ia channel
numbers, or repetitive st eps within a test environm ent.
Page 42
Page 44

7.3.6 Creating Channel Markers (when fitted)
Channel markers are only available when Option U01 is fitted and provide a convenient method
of showing multiple fixed frequency points on the display via vertical lines that overlay or
replace the graticule.
They are created via a special type of limit pattern f il e. See section 7.7.6 for details.
7.4 Measuring Rela tive Amplitude
When both measurement markers are turned on, a readout is provided of the difference
between them in terms of both frequency and level.
A common requirement is to measure the signal amplitude at a specific frequency under
different conditions. The PSAxx02 provides a convenient method of doing this.
Having measured the amplitude in the initial condition using marker M1, the value can b e fixed
from the Marker Setup sub-grou p menu (Traces/Markers > Marker Setup > Fix/Un fix M1). The
M1 readout shows Fx at the left hand s ide. With the new condition applied, the measurement
can be made again by moving M2 to the same frequency using the key Move M2 to M1. The
difference in amplit ude level can then be read directly.
To return M1 to normal operation, press Fix/Un f ix M1 ag ai n. See section 4.7.1.
Page 43
Page 45

7.5 Triggered Operation
Triggered operation is only available when the upgrade option U01 is fitted (see section 6).
Triggering is used either to start or stop the sweep, or to initiate logging of sweeps or screen
images. The trigger can be gener ated manually (by a key press), externally (from t he tri gger
input) or internally from the sweep in combination with a limit line or limit pattern.
For a description of Triggered Sweep see section 4.4.3.3. For a description of Trigger ed
Logging see section 7.8.
7.5.1 External Trigger Input
The external trigger inp ut is provided via the 3.5mm jack socket at the top of the inst rument.
This can be converted to a standard BNC socket using the adaptor provided. The selection
between positive or negative t r ans i tion triggering is made from the Sweep Trigger or Logging
Trigger functions. It has a T TL threshold and a high input impedance. Maximum input
voltage is limited t o +/-20V. V oltages above this level could damage the instrument.
7.5.2 Trigger Output
A trigger output pulse can be generated using the same socket as trigger input (see above).
The signal is generated by the Limits comparator function (see section 7.7.3) and is a positive
going TTL level pulse of appr oximately 10ms duration from a 1kΩ source impedance.
The trigger output is not available if either sweep trigger or l og trigger is set to external
triggering.
7.6 Level Offset and Compensation Tables
These functions are only avai lable when the upgrade option U01 is fitted - see section 6. T hey
enable the amplitude scaling t o be offset to match external attenuation or gain, or to add
frequency dependent amplitude compensation tables t o match transducers or antennae. A
description of the menu keys used to control the function is given in section 4.5.4.
7.6.1 Dynamic Range and Maximum Signal
Adding offset or compens ation can create confusion as t o the maximum and minimum
signal levels that can be vie wed.
This could result in the instrument being in amplitude overload even when the displ ay ed
amplitude value is appar ently within the instrument range. Where an offset is set to a l ar ge
negative value (to compensate for an external gain element) there is a danger that the absolute
maximum signal level could be exceeded resulting in damage to the instrum ent - see section
2.1.2.
Offset levels and compensation tables should therefore be used with care !
7.6.2 Creating and using Compensation Tables
Compensation tables are normalised files of amplitude versus frequency that are us ed to
compensate for frequency related non-linearity in antennae or transducers.
The files contain lists of up to 49 frequency/amplitude points. When a file is used by the
instrument, linear int er pol ation is employed between the po i nts.
Every point on the trace is t hen c hanged by the amount calculated from the interpolated
compensation table. Note that this could result in parts of the trace being outside of the
graticule area.
Compensation Tables must be created outside of the ins trument using PSA-Manager software see section 6.1.8.
Page 44
Page 46
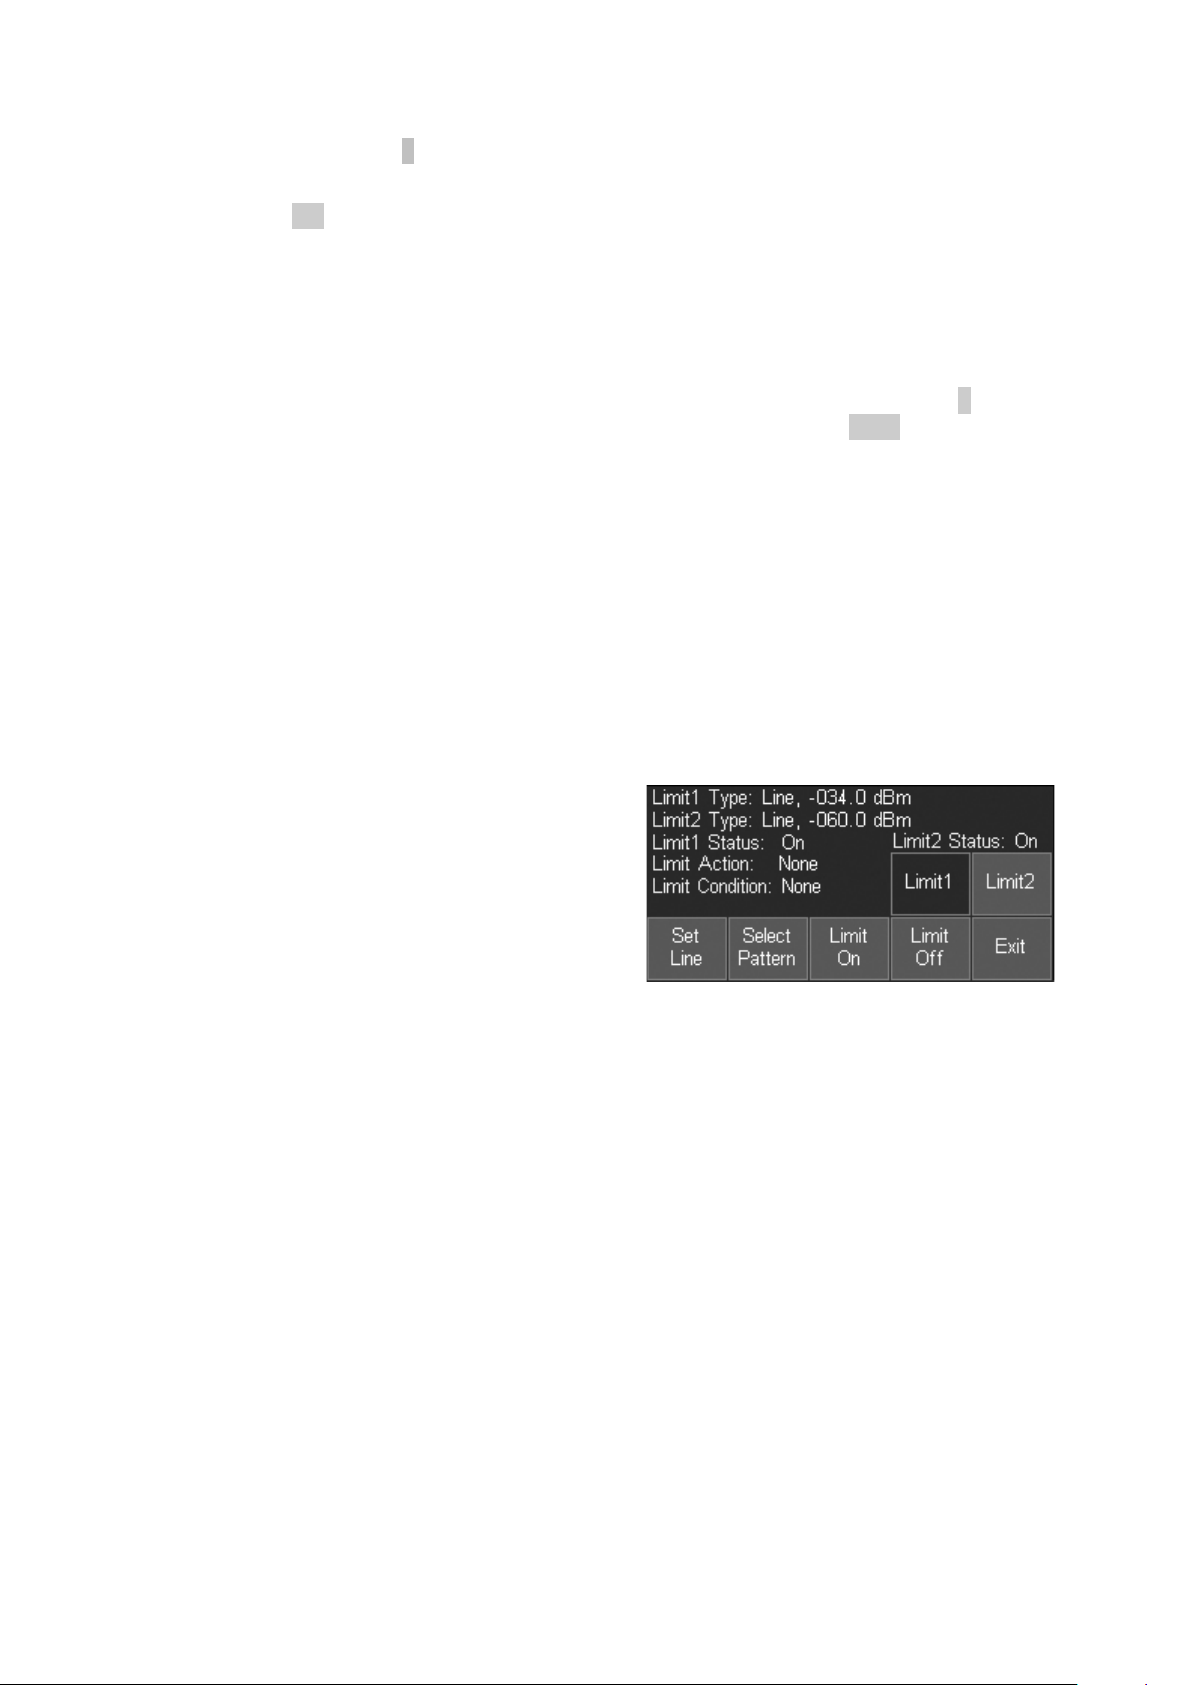
Compensation Table files have the extension .CMP and are l oc ated in the folder named
TABLES. Files can be transferred using either a USB Flas h dr ive, or by direct connection to the
USB port of a PC. See section 5 for an explanation of copying and tr ansferring files.
A compensation table file is loaded in a similar way to other types of file using a File Recall
screen - see section 5.4 .
Note that compensation t abl es and li mit patterns are both placed in a folder called Tables and
can therefore appear wit hi n the same File Utilities sc reen. It is possible to toggle between the
two file types by pressing the key marked Tables (toggle).
7.7 Limit Lines & the Limits Comparator | Creating Limit Patterns
These functions are only avai lable when the upgrade option U01 is fitted - see section 6. A
description of the menu keys used to control the function is given in section 4.5.5 .
Two types of limits are availa ble, Lines and Patterns. U p to two limits can be displayed, Limit 1
in red and Limit 2 in blue.
A Line is a simple horizontal lin e ( single amplitude level) that can be set to any value.
A Pattern can have multiple le vels and can include vertical s teps and angled lines. Patterns are
contained within files that are lists of up to 49 frequenc y/amplitude points. When a file is used
by the instrument, linear interpolation is employ ed between the points.
Lines or patterns may be used as s imple visual aids to determ ine whether a signal is within a
specific level range, or t hey may be used in conjunction with the Limits Comparator t o create an
automatic action.
7.7.1 Setting Limits
Pressing the Set Limit s key (Le v el/Limits > Limits >
Set Limits) brings up a control screen as shown.
The keys on the top line select which limit is to be
controlled by the bottom row keys. Where a limit line
or pattern has already been set, it can be turned on or
off using Limit On/Limit Off.
The status of the two lim its is displayed within the
area directly above the keys.
Pressing Set Line defin es the currently selected limit as a line (if it was previously a pattern)
and brings up a numeric entry keypad or tab/jog system by which the l evel of the line can be set
numerically in graticule uni ts.
Pressing Select Pattern brings up a list of files from which a limit pattern can be loaded. Limit
pattern files have the default prefix PTN and are placed in the Tables folder. Pressing Recall
from the Recall Limits files screen will load the patter n as the selected limit.
7.7.2 The Limit Comparator
The limits comparator enabl es automated actions to be selected in response to specifi ed limit
conditions. The actions inc l ude audible warning, pulse out put from the trigger socket, stopping
of the sweep, or entry into a logging file.
The limit condition is cr eated from the trace being either above or below the limit line/ pattern. If
the measurement markers are turned off , or if only M1 is turned on, any part of the swept trace
being above or below the line wi ll create the condition. If both M1 and M2 are turned on, the
limits comparison takes place only on the part of the trace between the markers.
The Limit Condition options are None, Above, Below, O utside or Inside. Where two limits are
being displayed, the limit conditions of Inside or Out s i de c an be us ed. Note that there is no
concept of an upper or lower limit line. Above means above the hi gher point of the two limit
Page 45
Page 47
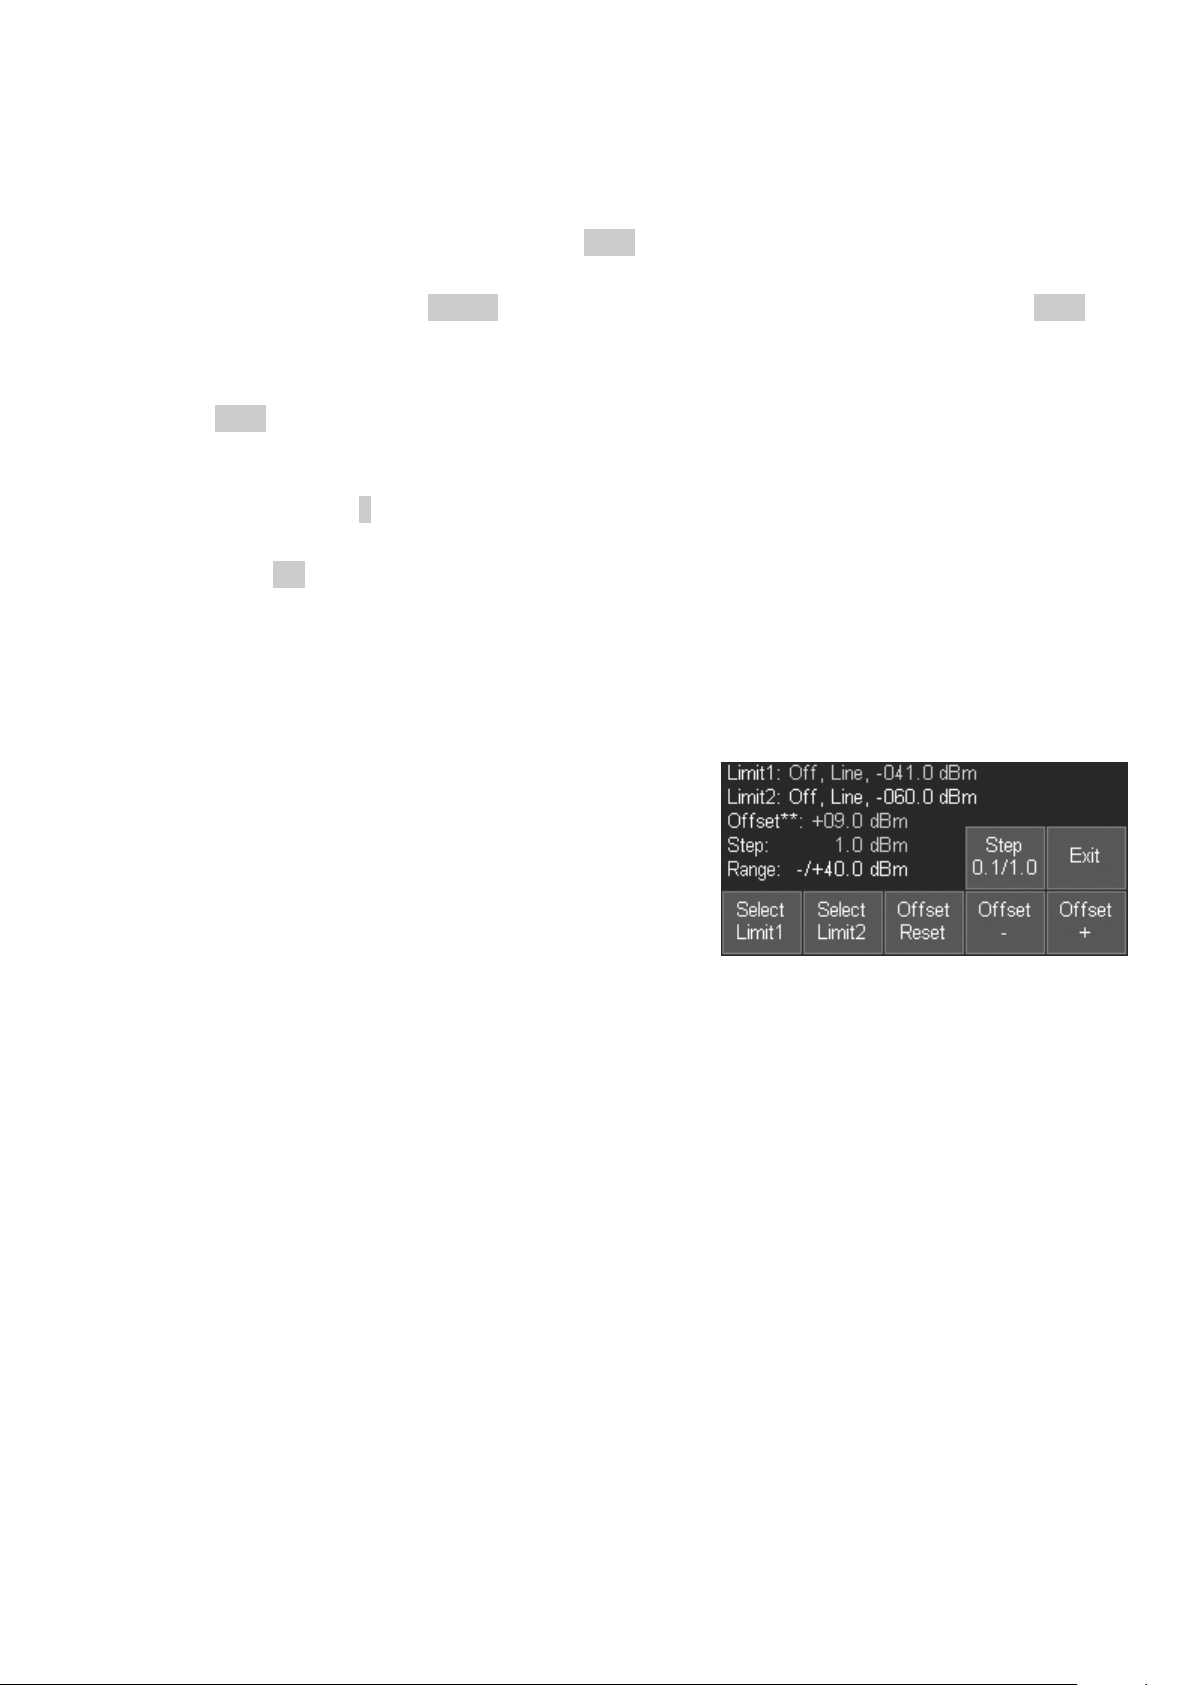
lines, Below means belo w the lower point of the two limit lines, Outside means either above the
higher point or below the lower point of the two limit lines, while Inside means between the
higher and lower points.
The Limit Action can be s et to None, Beep, Pulse Out, Beep and Pulse Out together, or
Message. The action only takes places when the sweep has com pleted. The Pulse Out is
provided at the Trigger soc k et - see section 7.5.2.
Regardless of the setti ng of the Trigger Action, it is also pos s ibl e to use the limit condit ion to
stop the sweep (see section 4.4.3.3) or to create an entry into a l ogging file (see section 7.8.5).
7.7.3 Creating and Loading Limit Patterns
Limit Patterns must be creat ed outside of the instrument using PSA-Manager software - see
section 6.1.8.
Limit Patterns files have the extension .CSV and are located in the folder named TABLE S.
Files can be transferr ed us i ng either a USB Flash drive, or by direc t connection to the USB port
of a PC. See section 5 for an explanation of copying and transferring files.
A limit pattern table file is loaded in a similar way to other types of file using a File Recall screen
- see section 5.4. Up to 999 patter n files can be held within the memory of the instrument.
Note that limit patterns and compensation tables are both pl ac ed in a folder called Tables and
can therefore appear wit hi n the same File Utilities sc reen. It is possible to toggle between the
two file types by pressing the key marked Tables (toggle).
7.7.4 Limit Offset
The Limit Offset function enables a limit to be offset
from its initial value. I t is intended primarily for lim it
patterns (which would otherwise have to be
regenerated) but can also be us ed with limit lines.
The Limit Offset control screen enables a limit to be
“nudged” up or down in steps of 1dB or 0.1dB.
Where a limit has had an offset applied to it, a **
symbol is displayed wit hin the Set Limits control
screen.
7.7.5 Limit Fix/Unfix
Limit patterns use absolute frequency points. Whenever the frequency range is changed, the
pattern on the screen is rec al c ulated to be correct for the new frequency range.
In some circumstances, however, it is useful to avoid this recalculation taking place. If, for
example, a limit patter n had been c reated for the modulation around a specific centre
frequency, it may be useful to be able to apply that same patt ern to a different centre frequency.
Pressing the Limit Fix/Unfix key fixes the pattern relative to the screen and displays a message
of “Lim Fix” on the top RH side of the graticule. Changes can now be made to centre frequency
without the pattern changing.
Note that the pattern is fixed on t he s creen and will become incorr ec t if the span or the
reference level is chang ed. Pressing the key again cancels the fix mode and recalculates the
limit pattern to be correct for the current centre frequenc y, span and reference level.
7.7.6 Creating and Loading Channel Markers
A special type of limit pattern file is available whi c h c onsists only of vertical lines at frequency
points defined within th e file. These can be displayed as an alternative to limit lines/patterns.
Up to two files can be displa yed simultaneously in differing colours. Each file can cont ain up to
49 frequency points.
Page 46
Page 48

Channel Marker files are c reated using PSA Manager software. This is described further in
Appendix A (section 16).
7.8 The Logging Function
The Logging function is only available when the upgrade option U01 is fitted (see section 6).
A description of the menu keys used to control the funct ion is given in section 4.8.1.
The logging function saves res ults into log files within the memory of the instrument. The type
of result saved can be selected as Centre Level (logs onl y the amplitude at the centre
frequency), Peak Level (logs the frequency and amplitude of the highest peak in every sweep) ,
Full Trace (logs the whole trace) or Screen Image (logs the whole screen as a bi t-map image).
The saving of an entry into the file can be after every
sweep (continuous) or in response to a Timer, a key
press (manual trigger), the external trigger input, or
the Limits function.
Each entry within the f ile i nc ludes the time of the entry
as read from the instrument’s real time clock. Up to
25,000 entries can be saved within a s ingle file with
the exception of Screen Image logging where the
entries are limited to 2,500. The saving of an entry
takes a finite length of time varying from 0.1 seconds (cent r e amplitude or peak value) up to 1.5
seconds (screen image) . Entries are only saved after the sweep has been completed, and t he
sweep cannot re-start unt il the entry has been saved.
Note that, when a logging f il e is “enabled”, the sweep mode is aut omatically set to Repeat and
the sweep trigger is set to Free Run. No changes can be made to t he set -up of the analyser
while logging is in progr es s.
7.8.1 The Logging Control Menu
Selecting Logging Control from the Logging sub-group menu (see section 4.8.1) opens a new
control screen as shown opposit e.
The type of data to be logged, the trigger type, and the timer int er val (if used) must be set prior
to entering Logging Cont r ol. This information is shown withi n the area above the keys.
Similarly the spectrum analyzer state (frequency span, level etc). must also have be en s et-up in
advance.
Once logging has commenced it is not possible to mak e any changes to the instrument’s set-up
without closing the logging file. It is also not possible to turn the instrument po wer to Off without
closing the file fir st.
Change Name: the name of t he l ogging file that will be created is displayed at the top of the
menu area. The file nam e is an auto-incrementing numeri c of t he default file name (shown in
green). Pressing Change Name opens an alpha-numeric keypad from which a user-chosen
name of up to 8 characters can be ent er ed.
Change Default: enable s the default file name that will be automatically allocated to the next
logging file to be changed. Standard default file name rules apply - see section 5.1.1.1
Enable Logging: commences the opening of a logging f il e under the currently displayed name.
An information mes s age is displ ayed and logging is actually enabled after confirming with the
Status hard key.
Pause/Enable: causes new entries into the current logging file to be suspended and re-started.
However it is not possible to exit from the logging control menu without closing the current file.
Close File: closes and saves the current logging file. O nce closed the file cannot be re-opened
(although it can be renamed or deleted). The Log File name c hanges to the next default name
ready for the next logging file to be enabled.
Page 47
Page 49

Cancel/Exit: exits the logging control menu provided t hat a logging file is not currently enabled
or paused, in which case a warning message is displayed telling the user that exiting will
disable logging and close and save the current file.
File Utilities: displays a list of logging files currently within the instrument. Oper ates similarly to
other file utilities screens – see section 5.5.
7.8.2 Manual Logging
The logging function can be s et via the Log Trigger key to save entries in response to a manual
key press. Both the Run/Stop har d k ey a nd the sweep control touch-screen key act as the
manual trigger.
The data that is logged will relate to the sweep that was in progres s when the key was pressed.
7.8.2.1 The Run/Stop ke y and Sweep Control key
When logging, the Run/S top hard key and sweep control touch-sc reen key have no function
unless the Log Trigger has been set to Manual, in which case both act as a manual trigger key.
In all other trigger modes ( timer, external, limits or cont i nuous ) the keys are inactive. However,
the touch-screen key does prov i de visual feedback of the s tages of the logging process. When
no trigger event has yet occurred the key is green and mar ked Awaiting Trigger. When a
trigger has occurred but t he sweep has yet to complete it becomes yellow and is marked
Triggered. When the sweep is completed and the log file ent r y is being made it becomes red
and is marked Writing File.
7.8.3 Logging from the Timer
The logging function can be s et via the Log Trigger key to save entries triggered at a fixed time
interval.
The Timer Setup key enables a time between trigger events to be s et between 5 seconds and
100 minutes. However, if the timer interval is set to a short period, the actual time between
logging entries may be considerably longer than the t rigger interval. This is because, for each
entry, a sweep must be complet ed and the data must be saved. If the sweep is set to a wide
span and/or narrow RBW, the sweep time could be several tens of seconds.
The timer is asynchronous with respect to the sweep. Consequent ly the time between logging
entries will be longer than t he timer interval by a variable amount which is a function of the
sweep time. The log entry time stamp represents the time at the end of the logged sweep.
To achieve the fastest pos s ibl e logging use Continuous t r i gger - see section 7.8.6.
7.8.4 Logging from External Trigger
The logging function can be s et via the Log Trigger key to save entries on either a positive or
negative going edge applied to the Trigger socket - see section 7.5.1.
The data that is logged will relate to the sweep that was in progres s when the trigger signal
occurred.
7.8.5 Logging from Amplitude Limits
The logging function can be s et via the Log Trigger key to save entries when a trigger is
generated by the Amplitude Limits Comparator. The dat a that is logged will relate to the sweep
that was in progress when the limit condition occurred.
The Limits function m ust be s et to have a potentially valid condition as set by Limit Condition,
however the logging trig ger i s independent of the Limit Action which can be set to any value
including none. See section 7.7 for an explanation of the Limits function.
Page 48
Page 50

7.8.6 Logging Every Sweep (Continuous)
The logging function can be s et via the Log Trigger key to save entries continuously, i.e. after
every sweep. The actual speed wi ll depend upon the sweep rate and the type of data being
logged. The fastest possible logging rate is about two per sec ond.
7.8.7 File Sizes and Maximum Logging Times
Logging files can vary in si ze from a few kB to more than 100MB depe ndi ng upon the number
of entries and the type of data being logged.
Although the filing syste m allows up to 999 .LOG files to be s tored, the practical number m ay be
limited by the internal memory size (approximatel y 1.8GB). Where large files are being created,
care must be taken not to overflow the memory. Memory space can be restored by copying
files to a Flash drive or directly to a PC, and then deleting them on the instrument.
The instrument has the potential to log over very long periods . Where it is required to log for a
period close to or exceeding the battery life, the inst r ument must be operated from external AC
power.
In the event of the memory becoming full or the power being lost, the current logging file will be
automatically closed.
7.8.8 Viewing and Analyzing Logging Files
The instrument has no capability for viewing the content s of a logging file. Instead, the file must
be copied to a Windows based PC where the file can be viewed and analyzed using the PSA
Manager software - see section 6.1.8.
Log files have the extension . LOG and are located in the folder named LOGS. Up to 999
logging files can be stored within the memory of the instrument. Files can be transfer r ed using
either a USB Flash drive, or by direc t connection to the USB por t of a PC.
See section 5 for an explanation of copying and transferring files.
Page 49
Page 51

8 USB Connections | File System & Files Types
8.1.1 Understanding USB Connections
The instrument has two USB ports only one of which may be used at a time. The required port
is accessed by a sliding shutter which ensures that only the ex pos ed port can be used.
The Type A port presents a US B hos t interface which will accept flash drives conforming to the
USB Mass Storage Class (MSC). D r ives with capacities from 32MB to 32GB are supported.
USB Hard Disk Drives are not s upported and this port is not com patible with any other class of
device including the HUB c l as s .
If any unsupported device t ype is c onnected a message will be disp layed to alert the user.
NOTE: Certain small capac ity USB flash drives have been s een that try to connect as a hub
before exposing the MSC devic e. This type of flash drive is not c ompatible and cannot be used
with this instrument .
When a compatible flash driv e is connected to the instrument there will be no activity until t he
Setup/Functions > System/File Ops > File Ops control screen i s called up, then the Disk light
will flash and the Switch Drive key will become active. This key will allow access to the files
stored on the flash drive. The Copy key in the File Actions cont r ol s c reen will also become
available. See section 8.1.2 “Using an External Flash Drive” for more information on reading
and writing the flash dri ve.
The Mini B port is for connection t o a P C and has two possible uses, each will cause the
instrument to expose a different device type to the PC. When the instrument is powered on the
Mini B port is inoperative and t he PC, if connected, will not be ab le to 'see' the instrument. The
correct device type will be ex pos ed when the user performs an appropriate action. The two
types of device that the instr ument can expose are Mass Storage C l as s (MSC) and
Communications Device C las s (CDC). These classes and their us es are discussed in the
following paragraphs.
The PSA will expose the MSC when the user executes Setup/Functions > System/File Ops >
File Ops and then chooses the Li nk to PC option from the File Ops cont r ol screen. See section
8.1.3 “Linking to a PC via US B” for more information.
The instrument will expose the CDC when the user executes Setup/Functions > System/File
Ops > System Utilities follo wed by Status/System > Screen > View on PC. This functi on is onl y
available with Option U01 enabled. For more information see 16 Appendix A “View on PC”.
It should be noted that CDC is used only for screen data exchange when V iew on PC is
selected. It is not possi ble to transfer file data while in this mode. To exchange files between
instrument and PC requires MSC and in this mode View on PC is not avai lable.
The user can, however, switch freely between these m odes by e xecuting the key sequences
above but connection to t he View on PC application will be los t when Link to PC is selected.
8.1.2 Using an External Flash Drive
The USB Type A connector on t he left hand side of the instrument is arranged as USB Host
and is intended exclusively for the connection of a USB Flash Drive. This enables files to be
copied to and from the inter nal memory of the instrument. Note that files cannot be loaded from
or saved to external memory directly.
Copy operations are performed using the File Ops (File Operations) function - see section 5.6.
The instrument pre-def ines a folder system for the USB F lash Drive whereby differ ent file types
are placed in specific f ol der s . These folders are automatically created when the File Ops
function is selected with a Flash Drive plugged in.
A master folder is created called PSA within which are sub-folders named TRACES, IMAGES,
SETUPS, LOGS, and TABLES. Files copied from the instrum ent onto the external drive are
Page 50
Page 52

automatically placed into the correct folder. However, where files are being placed onto t he
external drive from a pers onal c omputer, they must be put int o the correct folder or it will not b e
possible to copy them onto the instrument.
Note that, whenever the File Ops function is first used after a USB Flash Drive has been
plugged in or the instrument has been switched off, the fil es on the Flash Drive will be
interrogated and an information message will appear asking the user to wait for this to take
place.
If the Flash Drive is of large capacity and/or contains a large number of files, t he interrogation
could take a long time. If t he us er wishes to abort this procedure, t hey may do so by simply
unplugging the Flash Dr iv e. To avoid long delays, it is r ec ommended that Flash Drives
containing large numbers of un-related files are not used.
Note that it is not possible t o c onnect a USB Flash Drive if the US B Li nk to PC connection is in
place.
8.1.3 Linking to a PC via USB
The USB Type Mini B connector on the left hand side of the instrument is arranged as USB
“device” and is intended exclusively for connect ion to the USB port of a personal computer for
the transfer of files to or from the internal memory of the instrument.
The connection should be made using the cable supplied, which is a standard USB Mini B plug
to USB Standard A plug. Note that it is not possible to use the USB Link to PC when a USB
Flash Drive is connected.
“Link to PC” mode is selected v ia S etup/Functions > System/FileOps > File Ops > Link to PC
see section 5.6. When the key is press ed all spectrum analyzer activity is suspended and the
instrument waits f or the PC to r ec ogni s e its Flash based disc drive and “log it on”.
When the link is enabled, the internal drive of the instrument appears on the PC as a removable
disc drive. When in this condit ion, the PC is in control of the link and file operations are
performed on the PC using Windows Explorer or a sim il ar file system manager.
When in this mode, all of t he user area of the internal drive becomes accessible. It is
therefore possible to rename files and directories, delete directories or to add invalid
files. Care must be taken NOT to do this.
The internal drive contains a master folder named PSA within which are five folders: TRACES,
IMAGES, SETUPS, LOGS, and TABLES. Only the correct file types must be placed into these
folders, no files should be plac ed in the Root folder and no additional folders created.
Note that it is possible to place files with long filenames into the folders provided that the
extension is correct and the files themselves are valid - s ee s ection 5.6.2.
The link can be closed by pressing the EXIT hard key. When this happens, the instrument r echecks its filing system in order to ensure that changes have not been made that would cause
system problems. This m ay t ak e s everal s econds.
When this has been completed, normal spectrum analyzer operation resumes.
8.2 File System a nd File Types
8.2.1 Internal Filing System Organisation
The organisation of t he inst r ument filing system is not visible to the user from within the
instrument. Although a folder system exists, fi les are automatically placed into, or r etrieved
from, the correct folder whenever a particular type of file is being used.
Similarly, when an external flash drive is connected, the instrument will automatically select the
correct external folder f or the current file type.
The folder structure of the int ernal drive is only visible when linked to a PC - see section 8.1.3.
Page 51
Page 53

8.2.2 File Types
The basic instrument uses t hree file types: Traces, Im ages and Setups. If option U01 is
installed, several further file types become available.
8.2.3 Trace Files
A trace file represents the swept trace as appears upon the screen. A trace file can be recalled
to the screen as a reference trace (purple).
The file consists of a set of 271 values representing the trace amplitude from left to right ac ross
the screen in CSV (comma separated variable) format, plus additional inf ormation that defines
the frequency span, RBW, VBW and reference level. Values ar e always in dBm.
The latter information is referred to as the State. When a tr ac e file is recalled, the user can
choose to recall the whole file (Recall Trace & State), the trace amplitude values only (Rec all
Trace) or the State values onl y (Rec all State). Whenever the St ate is recalled, the spectrum
analyser set-up is changed to match the parameters within the recalled file.
Trace files are small being a few kilobytes each. Within the instrument they use an 8.3 naming
format with the extension .CSV. A maximum of 999 files can be s tored within the internal
memory of the instrument. Trace files can be copied to a PC and imported into graphing
programs such as Excel, MathCad etc.
Trace files can also be displayed using PSA-Manager software which is supplied on t he
accompanying disk or f reely available to download from the web site.
8.2.4 Screen Image Files
A screen image file represent s a "snapshot" of the whole of the screen excluding the key area.
A screen file can be recalled in a similar way to an image on a digital camera, whilst sweeping
of the spectrum analys er is suspended (Paused). It can also be exported to a PC and printed
for documentation purp oses.
Screen files are indexed c olour bitmaps of about 50 kilobytes in size. Within the instrument
they use an 8.3 naming format with the extension .BMP A maximum of 999 files can be stored
within the internal memory of the instrument. Screen files c an be c opi ed to a PC and imported
into photo viewing and editing programs such as Windows Picture and Fax Viewer, Paint,
Photoshop etc.
Image files c an al s o be displayed using PSA-Manager software which is supplied on the
accompanying disk or f reely available to download from the web site.
8.2.5 Setup Files
A setup file records the complete state of the instrument at the point that it was saved, inclu di ng
marker positions, the vie w trace and the reference trace.
When option U01 is installed, additional files such as Limit Patterns and Compensat i on Tables
are also included.
A setup file contains all of the parameters listed within the Factory Default Setup listing (see
Appendix B section 17) with the e xception of screen brightness and Auto power-off t imer
settings.
Setup files are small being a few kilobytes each. W ithin the instrument they use an 8.3 naming
format with the extension .SET. A maximum of 999 files can be stored within the internal
memory of the instrument. Setup files can be copied to a m emory stick or onto a PC for backup
purposes, but have no funct ion outside of the instrument.
Page 52
Page 54

8.2.6 Other File Types
When Option U01 is fitted (see s ec tion 6) four other file types can ex ist. These are
Compensation Table files, Limit Pattern files, Channel Marker files, and Loggin g files. Details of
the functions are provided within section 6 of the manual.
8.2.6.1 Compensation Tables
Compensation tables are normalised files of amplitude versus frequency which must be created
outside of the instrument using PSA-Manager software. They are a few kilobytes in si ze.
They files have the extension . C MP and are located in the folder named TABLES. Files can be
transferred using either a US B Flash drive, or by direct connec tion to the USB port of a PC.
8.2.6.2 Limit Pattern and Channel Marker Files
Limit pattern tables are normalised files of ampl itude versus frequency which must be created
outside of the instrument using PSA-Manager software. They are a few kilobytes in si ze.
They have the extension .CSV and are located in the folder named TABLES. Files can be
transferred using either a US B Flash drive, or by direct conn ection to the USB port of a PC.
A channel marker file is a special version of a lim it pat tern file designed to create only vertical
lines. Channel marker file names start with a $ symbol.
8.2.6.3 Logging Files
Logging Files record multiple entries of sweep data in response to a variety of trigger signals.
They can contain several t ypes of data and are variable in size up to tens of megabytes. T hey
have the extension .LOG and ar e located in the folder named LO GS.
Amplitude values contai ned within a logging file are always in dBm.
The files are created within t he ins trument and must be transferred to a PC for analysis using
PSA-Manager software. Files can be transferred using either a USB Flash drive, or by direct
connection to the USB port of a PC.
Page 53
Page 55
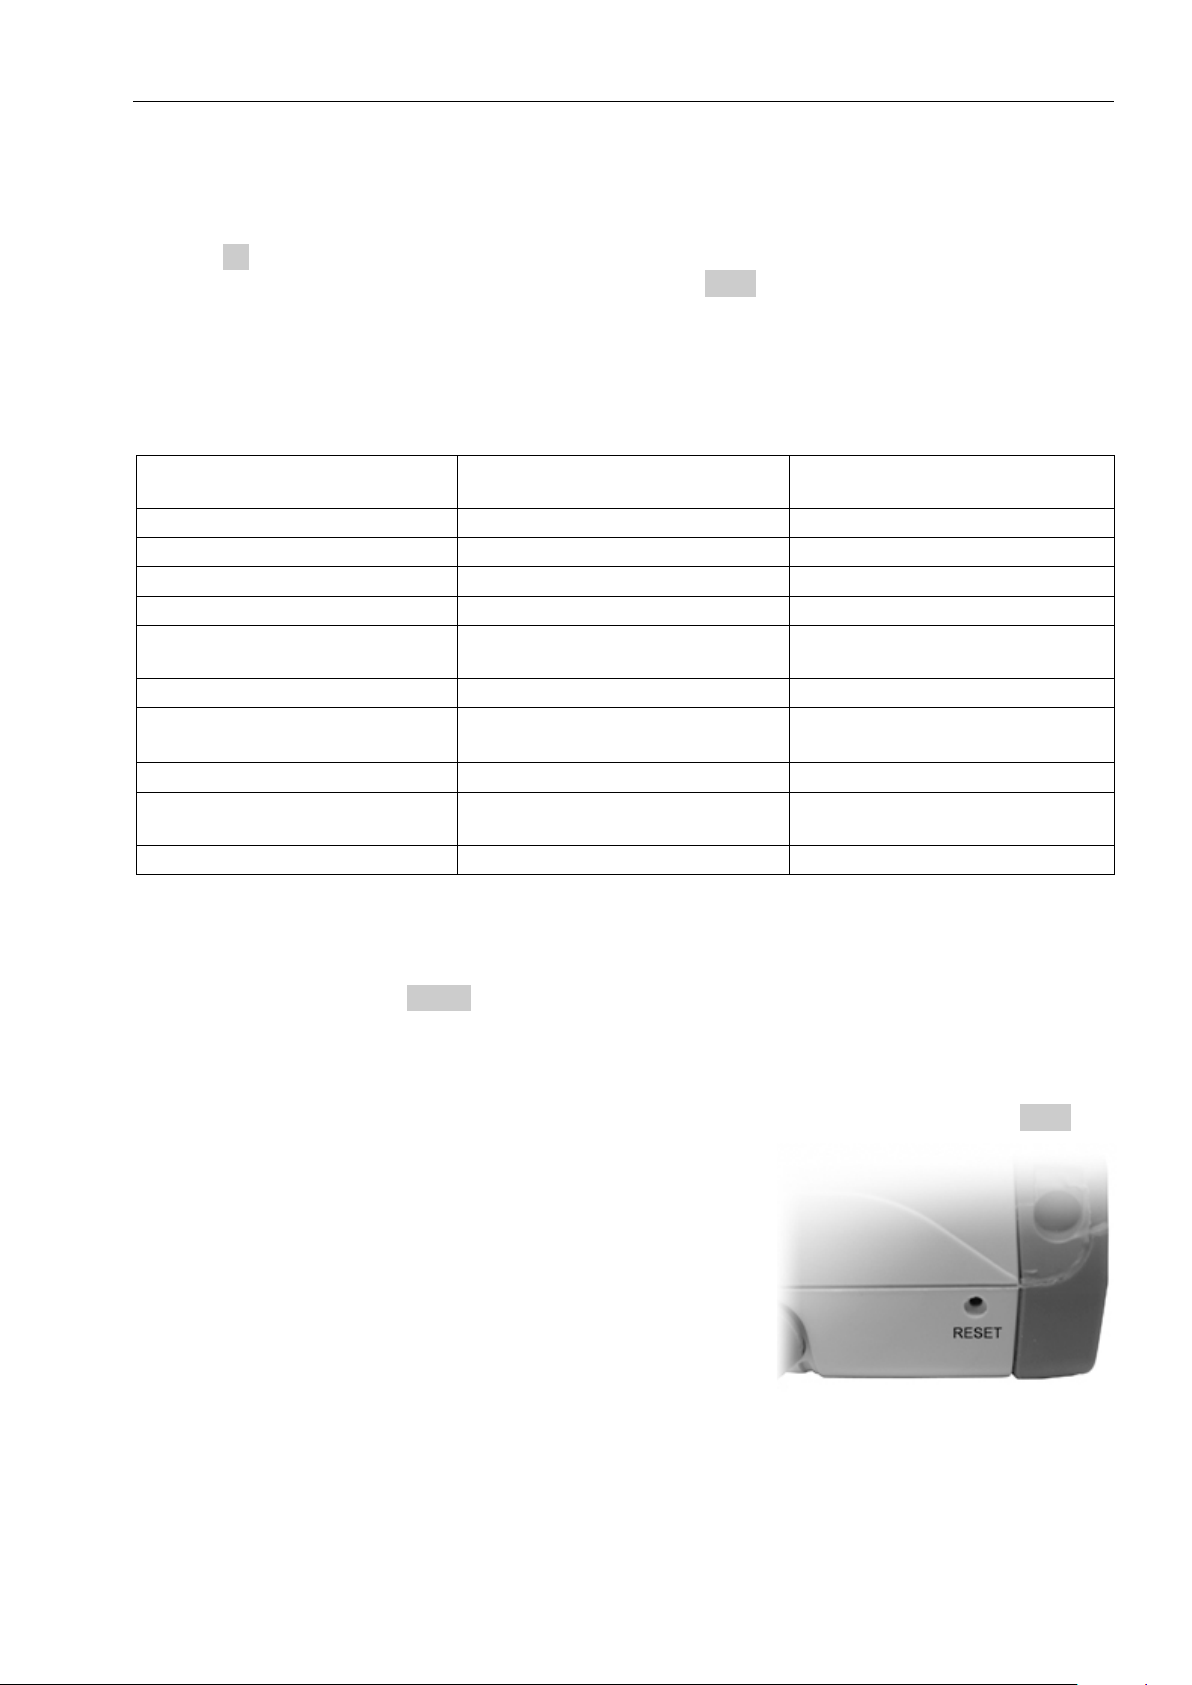
9 Default Settings | Power On State | Hard Reset
Frequency/Span
(Mode = Centre/Span)
Centre = 1350.5MHz/650.5MHz
Span = 2699MHz/1299MHz
Sweep/Bandwidth
RBW = Auto (1MHz)
Vid Filter = On,
Sweep Control = Repeat
Trigger = Free Run, Auto Rear m
Level/Limits
Ref Level = 0dBm
Units = dBm, Graticule = Normal
Scale = Normal (10db/div )
75Ohm Compensation = Off
Fixed Offset = Off
Compensation Table = O ff
Limit 1 = Off, Limit 2 = Off
Traces/Markers
Live Trace = On,
Reference Trace = Off
Mode = Normal
Display = Single Trace
Marker 1 = On, Marker 2 = Off
M1 = 1350.5MHz / 650.5MHz
Markers Function = Scroll
M1 Fix = Off
Setup/Functions
Logging = Disabled
Auto Measure = Disabled
9.1 Restoring to Factory Defaults
When shipped from the factory, the set-up of the instrument is as described within Appendix B
(section 17). The instr ument can be returned to its factory defaults condition f r om
Setup/Functions > Setups > Load D efaults (see section 4.9.1).
9.2 Standard Prese t
The standard preset is access ed by pressing the hard key mar k ed Preset. It returns the
instrument to a set of kno wn cond itions as below:
(Note that some parameters ar e relevant only if option U01 is fitted)
View Trace = Off
Parameters not included within the listing above ar e left unchanged.
The User Preset is a customisable version of the Standard Pres et whereby any of the
parameter values of the s tandard preset can be changed to match the requirements of the
current user – see section 4.11.1.
9.3 Unrecoverable Fault Condition - Hard Reset
If the spectrum analyzer gets into a condition in which normal operation is not possible, it can
be returned to normal operation by reloading the Factory Default settings - see section 4.9.1.
However, if it “locks up” ( i.e. will not respond to key presses )
or cannot be recovered by using Lo ad D efaults, it can be put
through a Hard Reset.
The reset button is access ed through a small hole at the top
right hand side of the case. It can be operated using the
stylus (or other thin rigid object). Press and hold f or longer
than 1 second.
Hard Reset will re-load the operating system, return all
parameters to their factory defaults, and clear all of the nonvolatile buffers. Us er data and s ettings that have been saved as f i les wi ll not be affected.
Page 54
Page 56

9.4 Power-On State
The set-up of the instrument each time that it is turned on (from off) is normally set to “Last
Used”. This results in no change occurr i ng when the instrument is powered off and then back
on.
Alternatively, the user can choose to load the User Preset which overwrites the major sett ings
with ones chosen by the user (see section 4.11.1). This choic e is made from:
STATUS >System Utils > Power/Cl ock > P wr-On Stat e - see s ection 4.10.3.2.
10 Firmware Updates | Upgrades | Maintenance
10.1 Updating the Firmware
From time to time Aim-TTi may make updated versions of the instr ument firmware available in
order to add new features or t o c orrect “bugs”. These will be download abl e from the Aim-TTi
website without charge. The current version is display ed within the Status displa y screens.
The method of updating requires the use of a USB Flash drive. Full inf ormation on how to
perform the update will be provided with the firm ware f ile.
10.2 Upgrading the Firmware (Opti on U01)
Installing option U01 is done in a similar way to a firmware update, but an additional st ep of
entering an activation c ode will be needed (see section 6). Full details are provided with t he
option.
10.3 Maintenance, Re-calibration & Cleaning
To ensure that the accuracy of the instrument remains within specification, the c alibration
should be checked (and if necessary adjusted) annually. Aim-TTi or their agents overseas will
provide a calibration service for any PSA1302/2702 and will repair any PSA developing a fault.
Where owners wish to undertak e their own recalibration, this should only be done by skilled
personnel in conjunction with the Service Guide which may be obtained directly from Aim-TTi or
their agents overseas. Recalibration requires the us e of a precision signal generator as
specified in the Service G ui de
Cleaning: If the unit requires cleaning, use a cloth that i s only lightly dampened with water or a
mild detergent. Take partic ul ar c are in cleaning the touch s c r een area.
10.4 Battery Replacement
The instrument is f itt ed with a rechargeable Lithium i on polymer battery which should on ly be
recharged using the charger s upplied.
The battery requires no maintenance but capacity will reduce over time and it may eventually
require replacement . The battery is a custom design and replac ements are only available from
Aim-TTi or from our authorised distributor s or agents.
Refer to the Service Guide for detailed inform ation on battery replacement and disp osal.
Page 55
Page 57

11 Safety Information
Spectrum Analyzer
This instrument is S afety Class III according to IEC class i fication and has been designed t o
meet the requirements of EN61010-1 (Safety Requirements for Electrical Equipment for
Measurement, Control and Laboratory Use).
This instrument has been tested in accordance with EN61010-1 and has been supplied in a
safe condition. This ins truction manual contains some information and warnings which have to
be followed by the user to ensure s afe operation and to retain the instrument in a safe
condition.
This instrument has been des igned for indoor use in a Pollution Degree 2 environm ent in the
temperature range 5°C to 40°C, 20% - 80% RH (non-condensing). It may occasionally be
subjected to temper atures between +5° and -10°C without degradat ion of its safety. Do not
operate while condensat ion i s pr esent.
This instrument is fitted with a rechargeable Lithium ion polymer battery; do not expose the
instrument to heat sources or high-temperature environments such as an unattended vehicle in
the sun. Only recharge the battery, in the instrument, using the charger supplied.
Do not incinerate the ins trument and/or battery; refer to the Service Guide for information on
battery replacement and disposal.
Use of this instrument in a manner not specified by these instructions may impair the safety
protection provided.
WARNING!
All accessible parts will be at the same voltage as the outer body of the N-Type signal input
connector. In particular, note that the shells of both US B connectors are galvanically connected
to the body of the signal input and will therefore be at ear th ground potential when either US B
port is connected to a desktop PC . To maintain user safety under al l other circumstances it i s
essential that the input is not connected to a voltage above 30V dc or 30Vrms with respect to
earth ground which is the limit of Safe Extra Low Voltage (SELV) by IEC definition.
The instrument shall be disconnected from all voltage sour c es before it is opened f or any
adjustment, replacement, maintenance or repair . Any adjustment, maintenance and r epai r of
the opened instrument shall be carried out only by a skilled pers on in conjunction with the
Service Guide, see Maintenance section 10.3
Do not wet the instrument when cleaning it; see Maintenance sec tion 10.3 for further details.
The following symbols are used on the instrument and in this manual.
Direct Current
CAUTION – refer to accompanying documentation.
Damage to the instrument may occur if these precautions are ignored.
Adaptor/Charger
The adaptor/charger supplied has a universal input volt age r ating of 100-240VAC, 50/60Hz. It is
a Class II (double insulated) device, fully approved t o E N 60950-1 and UL 60950-1 (UL listing
E245390).
Page 56
Page 58

12 Specification
Frequency Range:
1 MHz to 2700 MHz [1 MHz to 1300 MHz] in one range
Setting Modes:
Centre frequency plus Span, or S tart frequency plus Stop fr equency
Maximum Span:
2699 MHz [1299 MHz] for Normal s weep mode
Minimum Span:
270 kHz, or Zero Span with demodulation
Setting Accuracy:
Reference Frequency Acc ur acy for Start, Stop and Centre frequencies.
Initial Accuracy:
Better than ± 10 ppm at 20oC
Stability/Ageing:
Better than ± 10 ppm over 10oC to 30oC / Better than ± 3 ppm per year
Phase Noise:
Typically -90dBc/Hz at 100kH z offset at 500MHz
RBW:
Selectable as 1 MHz, 280 kHz or 15 kHz
Video Filtering:
Selectable On or Off
Number of Markers:
One, Two, or None
Marker Resolution:
0.1 kHz at all frequencies
Marker Accuracy:
1/270th of Frequency Span ± 0.1kHz + Reference Frequency Accuracy
Frequency Readout:
Display of absolute and dif ference frequencies for bot h markers
Channel markers are vertical lines on the screen based upon frequency
values within a file. They are a spec ial case of Limit Patter ns .
Demod. Modes:
AM or FM
Internal Audio:
Internal loudspeaker with adjustable volume and mute
Audio Out:
30 mW into 32 Ohms mono or stereo hea dphones, adjustable volume,
Audio Filter
Selectable low-pass filter to attenuate high frequency interference.
Display Range:
85 dB
Measurement Units
dBm or dBµV (dB milliwatts or dB micro volts)
Reference Level:
Selectable as -20 dBm or 0dBm (87 dBµV or 107 dBµV)
Ref. Level Accuracy:
Better than ± 1 dB at 50MHz at 10dB bel ow ref. level (20oC ± 5oC)
Level Flatness:
Better than ± 1.5 dB relative to 50 MHz over 1MHz to 2700MHz
Amplitude Linearity:
Better than ± 1 dB over 50dB range down from reference level
PSA1302 limits, where different, are shown in square br ac kets [ ] after the PSA2702 limits.
12.1.1 Frequency Measurement
Frequency Span
Setting Resolution: 1 kHz at any frequency
Reference Frequency Accuracy
Phase Noise
Resoluti on Bandwidth
Frequency Markers
Channel Markers (only with Option U01)
Number of Markers: Up t o 49 markers per file. Two fil es c an be di s played in differing colors.
Zero Span Audio Demodulation
3.5mm jack socket (auto disconnect of internal loudspeaker)
2 pole filter with turnover poi nt at approximately 3 kHz.
12.1.2 Amplitude Measurement (Level)
Amplitude Range
Amplitude Accuracy
Page 57
Page 59

Noise Floor
Noise Floor:
3rd Order Intermod.:
< –60dBc for two signals(500MHz and 502MHz) at 10dB below
reference level
Harmonic:
< –60dBc at 10dB below reference le vel (100MHz)
1st & 2nd Image:
<– 55dBc, typically <– 60dBc
Residual Spurii:
<3dB above noise floor
Number of Markers:
One, Two, or None
Marker Resolution:
0.1 dB
Amplitude Readout:
Display of absolute and dif ference amplitudes for both markers in
Number of Limits :
One or two limits on screen. Up to 999 pat terns can be stored
Limits Comparator :
Conditions of Above, Below, Inside or Outside creat ing ac tions of
Offset:
Amplitude can be offs et by up to +/-50dB to compensate for external
75Ω Compensation
Compensation can be made for inputs from a 75Ω source impedance.
Compensation
Linearly interpolated tables of up to 49 frequency/amplitude. Up to 999
Sweep Method:
Peak detection for 270 points per sweep. The amplitude of the peak
level found within each sub-span i s s tored (sub-span = span/270).
Sweep Modes:
Normal (repeat) or Singl e
Sweep Trigger
(Only with Option U01), External or Limits Comparat or
Graticule:
8.5 x 10 divisions light gr ey grat i c ule. Selectable as normal, dim, or off.
Displayed Points:
271 points per sweep.
Live Trace:
Dot-joined trace from current or held sweep. Selectable on or off.
View Trace
Additional trace created from the live trace. Select able on or off.
Reference Trace:
Trace recalled from a file. Selectable on or off.
Trace Modes:
Normal, Peak Hold, or Average (2 to 48 sweeps)
Dual Trace Option:
In Peak Hold or Average trac e modes, the Normal trace c an be
Better than -95 dBm average displayed noise floor for F > 3MHz
(reference level = –20 dBm, RBW = 15 kHz, video filter On)
Distortion and Spurii
Amplitude Markers
graticule units (dBm or dBuV) or linear units (mV or uW).
Amplitude Limits (only with Option U01)
Limit Types: Limit Lines from num eric values, or Limit Patterns from Files. Pattern
files are created using PSA-Manager software.
beep, stop sweep, log sweep and puls e out
Amplitude Compensation (only with Option U01)
attenuation or gain.
Tables:
can be stored. Table files ar e created with PSA-Manager software.
12.1.3 Sweep and Traces
Sweep
Sweep Time: Set automatically by Sp an and RBW.
Typically 150ms + 2.3ms/MHz of span for RBW = 1MHz
Typically 150ms + 7ms/MHz of span for RBW = 280kHz
Typically 180ms + 77ms/MHz of span for RBW = 15kHz
Traces
Number of Traces: Up to 3 – Live, View and Reference (up to 4 when in Dual Trace m ode)
displayed simult aneous ly with the processed trac e.
Page 58
Page 60

12.1.4 Memory Storage and Data Logging
Memory Type:
Internal non volatile Flash memory (1.8GB nominal).
Store Trace:
Up to 999 traces can be stored under ei ther default file names or user
Recall Trace:
Recalls any stored trace to the reference trace of the dis play. The State
Store Screen:
This function copies the whole screen area (excluding ke y area) to
Recall Screen:
Recalls any stored screen image to the display.
Store Set-up:
Up to 999 instrument set -ups can be stored under either def ault file
Recall Set-up:
Recalls any stored set-up, overwriting the existing settings of the
Recall Limits Pattern:
Only with Option U01. Up to 999 limit pattern files produced within
Recall Compensation
Only with Option U01. Up to 999 com pens ation tables produced within
Store Logging File:
Only with Option U01. Up to 999 logging files can be stored for
Log Files
Files of up to 25,000 data entries can be created. Up to 999 files can
Logged Data:
Log files can be created from Peak Value, Centre Frequency Level,
Log Trigger:
Log entry can be triggered by Key Press, Continuous (every sweep),
Timer Interval
Adjustable between 2 seconds and 100 minutes per entry
Time Stamp
Each entry is time stamped from the real-time clock
Input Connector:
SMA connector, 50 Ohms
VSWR:
1.5:1 typical
Maximum
Absolute Maximum Input Leve l:
Power Connector:
1.3mm dc power socket for A C power adaptor/charger as supplied.
USB link to PC
interface:
Mini USB connector (5 pin mini B) which acts as a USB “device” for
connection to a personal computer.
Audio Connector:
3.5 mm jack socket for demodulated audio out (mono/stereo plugs).
Trigger connector:
3.5mm mono jack socket for connection of BNC adaptor (suppl ied) .
Memory Storage
entered file names. Tr aces ar e s tored as tables of amplitude versus
frequency and can be im ported into other programs, as well as be ing
recalled to the screen. Trac es can be stored from either the live trac e
or the view trace and include St ate information.
can be recalled independently from the Trace
memory as a bit-map image. U p to 999 sc reens can be stored under
either default file names or user entered file names..
names or user entered file names. All settings of the instrument are
saved.
instrument.
PSA-Manager software can be stored within the instrument.
Table:
Data Logging (only with Option U01)
PSA-Manager software can be stored within the instrument.
download and analysis by PSA-Manager software.
be stored. Files are read using PSA-Manager Software.
Complete Sweep, or Screen Image
External Input, Inter nal Timer, or Limits Comparator
12.1.5 Connectors and Display
Signal Input
Input Level:
Other Connectors
USB Flash Drive
interface:
+ 20 dBm or +127 dBµV (2.2V rms) or 50V dc
USB standard A connector (USB Host) for connection of U S B Flas h
memory d rive
Page 59
Page 61

Display
Display Type:
4.3 inch (10.9 cm) transflective backlit TFT LCD, 480 x 272 pi xels total,
Graticule:
8.5 x 10 divisions light gr ey grat i c ule. Selectable as normal, dim, levels
Battery Type:
Li-ion 3.7V, 3Ahr nominal
Battery Life:
> 8 hours continuous operation
Recharge Time:
< 3 hours from fully discharged
Auto-Sleep Mode:
To conserve battery life, the system can be set to automatically switch
The PSAxx02 can be operated continuous ly from mains power using the
Input Voltage Range:
100V to 240V nominal 50Hz/60Hz. Interchangeable plus for UK, Euro,
USA and Australia are suppli ed.
Size:
192 x 92 x 49mm (7.5 x 3.6 x 1.9”) plus 12mm projection of N-Type
Weight:
560 grms (1lb 4oz).
Tilt Stand:
Built-in tilt stand for bench use which angles the unit at appr oximately
Screen Protector
For portable use, the tilt s tand can be moved from the rear of t he
Operating Range:
+5oC to + 40oC, 20% to 80% RH.
Storage Range:
-10oC to +50oC
Environmental:
Indoor use at altitudes to 2000m, Pollution Degree 2.
Safety & EMC:
Complies with EN60950-1 & EN61326-1.
16 colours, resistive touch screen.
only, or off.
12.1.6 Power Requirements
Battery Operation
The PSAxx02 operates from inter nal rechargeable batteries. The
batteries are recharged using the AC power adaptor supplied.
into sleep mode after a defined time from the last key press. This can
be set between 5 mins and 60 mins (or never).
AC Line Operation
AC power adaptor provided b y Aim-TTi. This als o recharges the
internal battery.
12.1.7 Mechanical, Environmental and Safety
Mechanical
signal connector
40 degrees to the horizontal.
instrument to the front where it acts as a screen protector/sun shield.
Environmental and Safety
For details, request the E U Declaration of Conformi ty for this instrument
http://www.aimtti.com/support (serial no. needed).
via
Page 60
Page 62

13 Appendix A: Optional Accessories
Firmware Upgrade (PSA-U01) – provides increased capabilities - see section 6 .
Fitted Soft Case (PSA-SC2) – protective carrying case with space for accessories
Telescopic Antenna (PSA-ANT2) – wideband telescopic antenna with adaptor for N-type
connection direct to the PSA.
Vehicle Charger (PSA-VC) – charger operating from 12V or 24V.
NOTE: All of the above items are included within the PSA1302USC and PSA2702USC
products.
Connection Kit (PSA-CK) – high quality SMA connection cable along with adaptors to and
from N-Type connectors, plus N to BNC adaptor for lower frequency cable connections.
14 Appendix B: PSA-Manager and PSA-View Software
PSA-Manager is a Windows* PC application for the creation, editing, analysis and management
of PSAxx02 files. It is compatible with versions of Windows from XP onwards (inclu ding 32 and
64 bit versions).
PSA-Manager is supplied on the CD accompanying the instrument, or may be freely
downloaded from the web sit e which may have an updated versi on. A secondary application
called PSA-View is similarly available.
An explanation of how to use PSA -Manager is provided within the pr ogram’s own Help funct ion.
PSA-Manager Functions
Trace File Display
Trace files do wnloaded from the instrum ent c an be viewed on the PC.
Limit Patterns Creation
Limit pattern files c an be us ed within the Limits f unc tion of the instrument when option U01 is
installed. Limit patt er ns are tables of amplitude agains t frequency that are created within PSAManager and uploaded to the ins trument.
Limit pattern table files can be created from s cratch or imported and edited f rom CSV files.
Editing tools include bot h numeric entry and graphical edit i ng.
Channel Marker List Creation
Channel Marker List files are a spec ial type of limit pattern file that contain only vertical lines .
They can be particularly useful for showing channel posit ion frequencies. PSA-Manager
provides an editor that enab les them to be created by entering a l i s t of frequencies. They have
the same extension as a limit pattern file (.CSV) but the file name commences with $ symbol.
Compensation Tables Creation
Compensation tables f iles can be used within the Offs et/Tables function of the inst r ument when
option U01 is installed. Compensation tables are normalised tables of ampl itude against
frequency that are created within PSA-Manager and uploaded to the instrument.
Compensation table files can be created from scratc h or imported and edited from CS V files.
Editing tools include both numeric entry and graphical editi ng.
Log File Analysis
Logging files downloaded from the instrument can be viewed and analysed. (The logging
function requires Opti on U01)
Page 61
Page 63

PSA-View
PSA-View is an additional PC applic ation which can be used with the View-on-PC function of
the instrument when option U01 is installed. It enables t he screen of the instrument to be
duplicated on the PC at any desired s ize.
The View on PC function places the instrument into a special mode in which the graphics of the
display are sent to a PC via USB. The screen can then be viewed at an y size using the
PSA-View application which may be supplied on the CD accompanying the instrument or is
freely available from Aim-TTi website.
To communicate with PSA-View, the USB interface functions as a virtual COM port which can
be controlled by a PC as if it was an RS232 device. The instrum ent is supplied with a CD
containing a .inf file for the standard Mic r osoft drivers availabl e in Windows 2000, XP, Vista and
Windows 7 and 8; the installation wizard will install the dr iver (32-bit or 64-bit) appropriate to the
PC’s operating system. Any updates are available via the Ai m-TTi website.
Installation of the interface driver is achieved by c onnecting the instrument t o a P C via the USB
cable supplied and selec ting Setup/Functions > System/file Ops > System Utilities followed by
Status/System > Scr een > View on PC. The Windows’ plug and play f unc tions should
automatically recognise the addition of new hard ware at tached to the USB interface and, if this
is the first time the connect i on has been made, prompt for the location of a suitable driver. (If
this does not happen, it will be necessary to open Device Manager on the PC and force a
manual installation of the driver).
On installing the driver, Windows will establish a virtual COM port within the PC. The number of
the new COM port will depend upon the number of co-existing COM ports. The driver will
remain installed on the PC so that the establishment of a virt ual C OM port is done automatically
each time the instrument is connected to the PC via USB in the future. The instrument is
assigned a new virtual COM port when it is first connected and t he s ame COM port will be
assigned each time that instrument is subsequently connec ted.
Once the driver is loaded, and with the instrument stil l c onnected to the PC, open the PSA -View
application on the PC. PSA-V iew will load with two windows open, the graphics windo w which
will initially contain t he message "No Communication Link " and a control window. On the control
window COM Port dropdown sel ec t the COM port which is connected to the instrument.
To discover which COM port this is the user can look in Device Manage r where the virtual COM
ports are displayed with the name of the device that they are connected to. e.g PSAxx02
Spectrum Analyser (COM8). Once the COM port is select ed c li c k on the Connect button and,
after a short delay, the ins trument screen data should appe ar in the graphics window.
Thereafter changes on the instrument screen will also be seen in the graphics window.
Operation of the instr ument will slow down a little due to t he lar ge volume of data now flowing to
the PC.
To stop viewing on the PC do any of the following:
Close the PSA-View application and disconnect the USB cable | or | Select View on PC again
and press Status in response to the information box | or |Power off the instrument | or | Set the
instrument into Link t o PC mode.
Before using PSA-View and the V iew on PC function, it is advisab le to read section 8.1.1 which
explains USB connections in more detail.
* Windows is a trademark of Microsoft, inc.
Page 62
Page 64

15 Appendix C: Factory Default Settings
Frequency/Span
(Mode = Centre/Span)
Centre = 1350.5MHz/650.5MHz
(Start = 1MHz)
Span = 2699MHz/1299MHz
(Stop = 2700MHz/1300MHz)
Fix Start/Fix Stop = Off
Freq. Presets = Empty
Step Size = 1.0000MHz
Auto Step Size = Off
Zero Span Demodulation
Setup
Demod = Off
Audio Volume = 10
Sweep/Bandwidth
RBW = Auto (1MHz)
Vid Filter = On
Sweep Control = Repeat
Trigger = Free Run, Auto Rear m
Level/Limits
Ref Level = 0dBm
Units = dBm, Graticule = Normal
Scale = Normal (10db/div )
Offset/Tables
75Ohm Compensation = Off
Fixed Offset = Off (set to -10dB)
Compensation Table = O ff
Compensation File = None
Limit 1 = Off (set to -50dBm)
Pattern Files = None
Limit Condition = None
Limit Offsets = 0, Step = 1dB
Traces/Markers
Live Trace = On
Reference Trace = Off
Ref. Trace File = None
Trace Mode
Mode = Normal
Average Number = 16
Display = Single Trace
Trace Stores
Store Type = Live Trace
Recall Type = Trace Only
Default File Names = TRACE
and IMAGE
Marker Setup
Marker 1 = On, Marker 2 = Off
Marker Units = As Graticu le
M1 Fix = Off
Setup/Functions
Status = Disabled
Default File Name = LOG_
Trigger =Timer
Setups
Default File Name = SETUP
System/File Ops
Selected Folder = TRACES
Brightness = 40%
System Utilities
View on PC = Disabled
Auto Power Off = Never
Power-On State = Last Used
When shipped from the factory, or following a reset to factory defaults, or operation of the hard
reset button, the instr ument will be set up as follows:
(note that some parameters are relevant only if Option U01 is fitted)
Limits
Limit 2 = Off (set to -60dBm)
Limit Action = None
Trace Control
Logging
View Trace = Off
M1 = 1350.5MHz /650.5MHz
Type = Centre Level
Markers Function = Scroll
Timer Interval = 1 sec.
The operation to reset to Factory Defaults is described in s ec tion 4.9.1.
Page 63
Page 65

16 Appendix D: Menu Tree Diagram
Page 64
Page 66
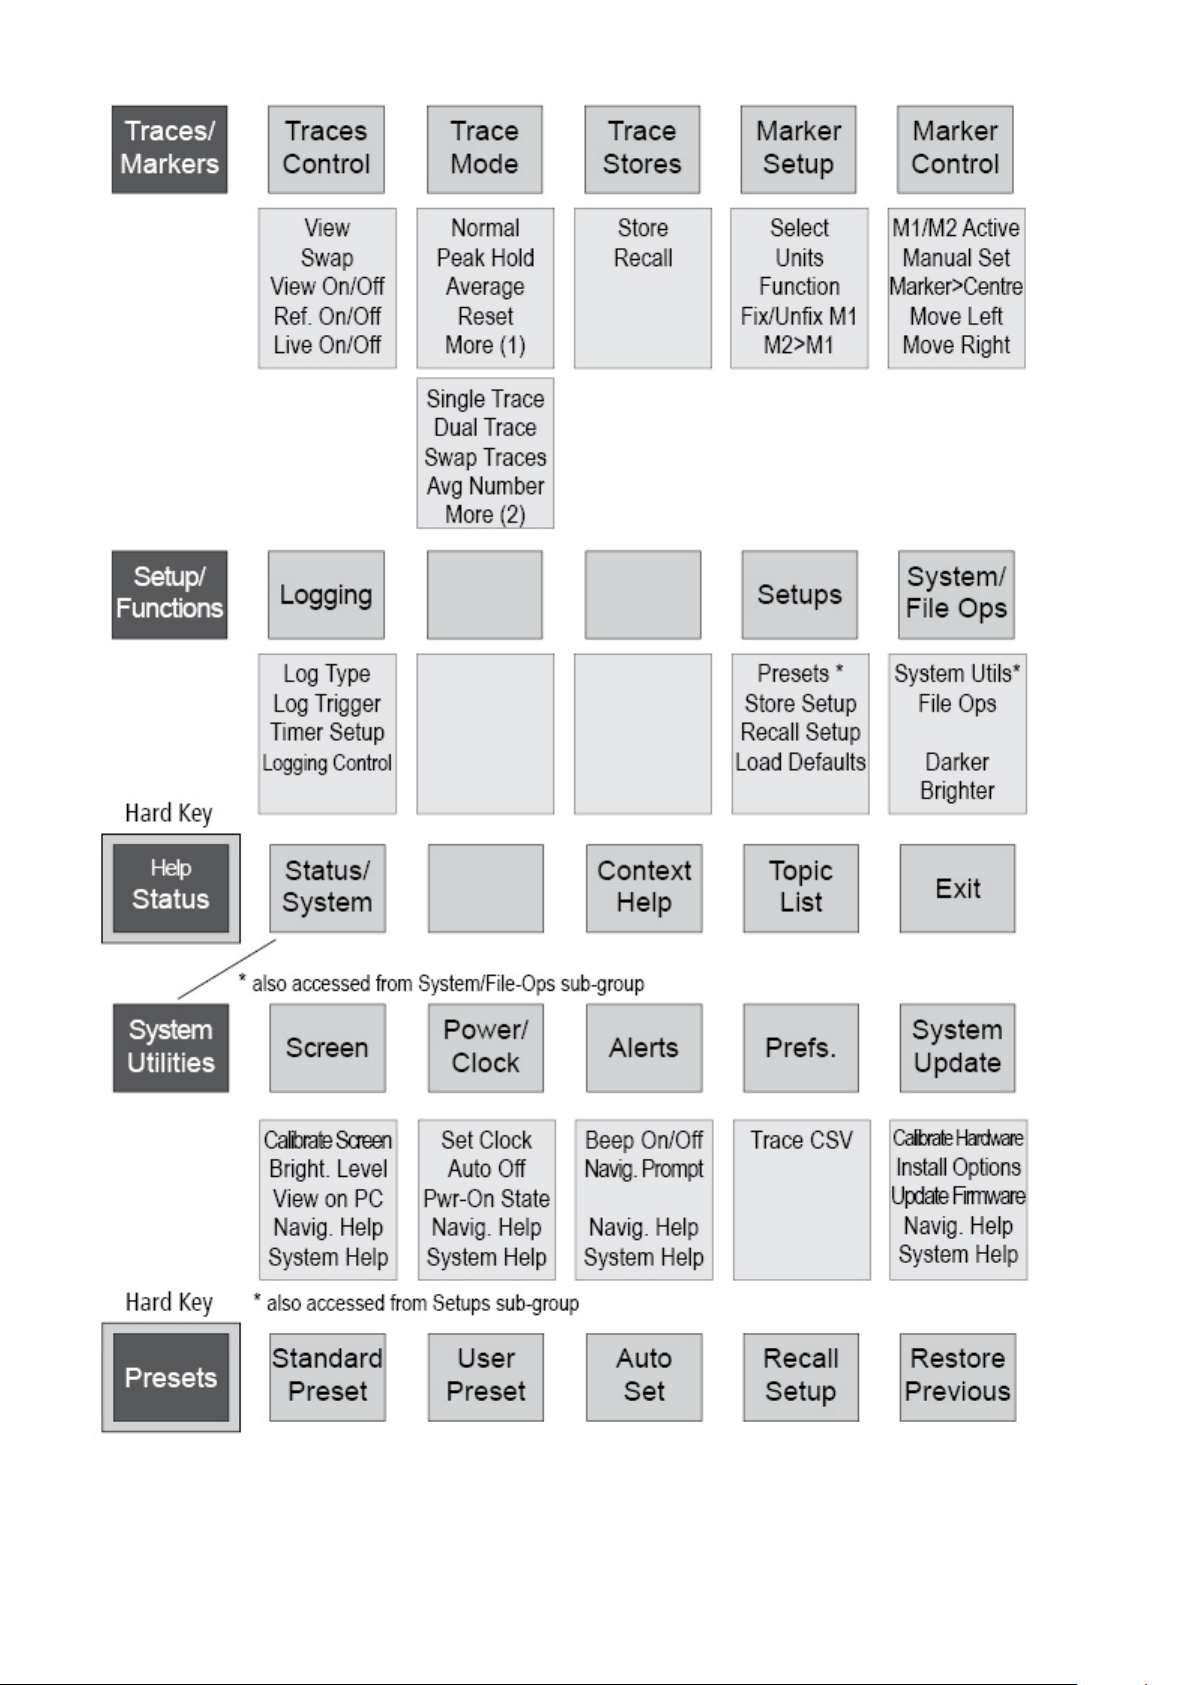
Page 65
Page 67

Book Part No. 48511-1580 Issue 12
 Loading...