

Page 1

OPERATION AND SERVICE MANU AL
----------
7310
73 20
SYSTEM N O I SE M 0N I T0RS
> 4I UECH
DIVISION CUTLER-HAMMER
Page 2

WARRANTY
Except for tubes, fuses, and batteries which carry no warranty,
Cutler-Hammer, in connection with equipment sold, agrees to correct any
defect in workmanship or material which may develop during the period of
one year from the date of shipment under proper or normal use and not in
excess of the original manufacturer’s life expectancy ratings, by its option
to repair or replace, FOB point of shipment, the defective part or parts,
and such correction shall constitute a fulfillment of all Cutler-Hammer
liabilities in respect to said apparatus.
July 1978
Page 3

Chapter I-General Information
1-1. Introduction 1-1
1-3. General Description 1-1
1-7. Safety Precautions 1-1
1-10. Technical Specifications • 1-1
1-12. Functional Description 1-5
1-13. General 1-5
1-15. The Noise Monitor in a Typical Application 1-5
1-17. Auxiliary Outputs 1-6
1-19. Options 1-6
1-21. Accessories 1-7
1-22. Noise Generators 1-7
1-23. Precision Attenuation 1-9
1-24. Test Equipment 1-10
Chapter II--Installation
TABLE OF CONTENTS
Page
2-1. Introduction 2-1
2-3. Unpacking, Inspection and Damage Claims 2-1
2-5. Ancillary Items 2-1
2-7. Rack Mounting 2-1
2-9. Preparation for Use 2-1
2-11. Initial Checkout 2-2
2-14. General 2-2
2-16. Checkout Procedures 2-2
Chapter Ill-Operating Instructions
3-1. General 3-1
3-3. Description of Operating Controls, Indicators and Connectors 3-1
3-5. Set-up Procedures 3-1
3-8. Interconnections " ' 3-1
3-17. Excess Noise Ratio Setting 3-5
3-21. Establishing the Correct Signal Levels 3-5
3-27. Operation 3-7
i
Page 4

3-31. Use of Auxiliary Outputs 3-9
3-33. Signal Monitor, Jl, Pin 4 3-9
3-35. External Meter, Jl, Pins 6 and 7 3-9
3-37. Recorder Output, Jl, Pin 8 3-10
3-39. Manual Noise Figure (Temperature) Measurements . 3-10
Chapter IV-Theory of Operation
4-1. Introduction 4-1
4-3. General Theory 4-1
4-4. Noise Figure Theory 4-1
4-6. Noise Figure Measurement 4-2
4-8. Operating Noise Figure and Temperature Measurement 4-4
4-11. Functional Description (Automatic Noise Measurement) 4-5
4-15. Circuit Descriptions 4-8
4-17. IF Amplifier 4-9
4-22. Square Law Detector 4-9
4-24. Variable Gain Amplifier 4-9
4-25. Synchronous Integrator and Meter Amplifier 4-9
4-26. AGC Amplifier 4-9
4-31. Timing Signal Generator 4-10
4-39. Power Supply Board . 4-13
4-41. +12 Volt Regulator 4-14
4-42. -12 Volt Regulator 4-14
4-43> +28 Volt Noise Source Supply: 4-14
Page
Chapter V-Maintenance and Adjustments
5-1. General 5-1
5-3. Performance Verification 5-1
5-6. Minimum Operating Level 5-1
5-7. Noise Generator Power 5-2
5-8. Accuracy 5-2
5-10. Checks and Adjustments 5-3
5-13. Power Supply Adjustments 5-5
5-14. IF Adjustments 5-5
. 5-16. Preliminary 5-5
5-17. Procedure ' 5-6
ii
Page 5

Page
5-18. Meter Adjustments 5-6
5-20. Auxiliary Output Adjustments 5-6
5-22. Signal Monitor 5-6
5-23. Recorder Output 5-7
5-24. Troubleshooting 5-7
5-26. General Information 5-7
5-27. Tools 5-7
5-28. Transistors 5-7
5-29. Integrated Circuits 5-8
5-30. Logic Family 5-8
5-31. Logic Circuits 5-8
5-32. Analog Gates 5-8
5-33. Operational Amplifiers 5-8
5-34. Printed Circuit Boards 5-8
5-37. Printed Circuit Board Connectors 5-8
5-38. Front Panel Lamps 5-13
5-39. ENR Thumbwheel Switch 5-14
5-40. Troubleshooting Procedures 5-14
5-44. Factory Service 5-14
Chapter VI--Spare Parts
6-1. General 6-1
6-2. Recommended Spare Parts 6-1
6-3. Replaceable Spare Parts 6-1
iii
Page 6

LIST OF ILLUSTRATIONS
Figure
Frontis
piece
1-1
1-2 SNM, Models 7310 and Outline Dimensions
1-3 SNM, Models 7320 Outline Dimensions
1-4
1-5
1-6
1-7
1-8
3-1 7310/7320 SNM Control, Indicator, Connector Locations
3-2 Bench Measurement Set-ups
3-3
3-4 Illustration of Sensitivity and Signal Level Range
3-5 Location of the Manual-Auto Controls
3-6 AILTECH Noise Figure Slide Rule
3-7
System Noise Monitors 1-2
Typical Noise Figure Measurement Set-up Using the AILTECH
7300 System Noise Monitors
Layout of J1 1-6
Typical Noise Sources Used with the 7300 SNM’S
Maximum ENR vs Frequency 1-9
AILTECH 32 Precision Attenuator (Cased Version)
Typical “ Operating” Measurement Set-up
Nomograph for Determining Noise Figure or Temperature
Page
1-3
1-3
1-5
1-8
1-10
3-3
3-4
3-4
3-6
3-8
3-10
3-11
4-1 Equivalent Noise Representation of a Noisy Network 4-3
4-2
4-3 Equivalent Representation of an Operating Noise Measurement
4-4 Functional Block Diagram
4-5 Timing Signal Generator Simplified Schematic and Timing Diagram
5-1
5-2 Adjustment Locations 5-4
5-3 Plastic-Case Transistors 5-7
5-4
5-5 Integrated Circuits Functional Illustrations 5-11
5-6 3-Input NOR Gate Operation
5-7 Operation of the COS/MOS Bilateral Switch
5-8 Typical Applications of Operational Amplifiers
5-9
5-10 General Troubleshooting/Repair Flow Chart
5-11
5-12
Equivalent Representation of Noise Figure Measurement Set-up 4-3
4-4
4-5
4-11
Set-up for Checking SNM Accuracy
Integrated Circuit Case Styles
Pin Numbering Layout of a Typical AMP 87133 Connector
IF Troubleshooting Chart
AGC Troubleshooting Chart
5-3
5-9
5-12
5-12
5-13
5-13
5-15
5-17
5-18
iv
Page 7

Figure
5-13 Video-DC Troubleshooting Chart 5-19
5-14 Timing Generator Troubleshooting Chart 5-20
5-15 Power Supply Troubleshooting Chart 5-21
5-16 Power Supply, Parts Location and Schematic Diagrams 5-22
5-17 IF-Video Parts Location and Schematic Diagrams 5-25
5-18 Wiring Diagram 5-27
LIST OF TABLES
Table Page
1-1 Technical Specifications 1-4
1-2 Applicable Noise Sources 1-7
1-3 Recommended Test Equipment 1-10
3-1 AILTECH 7310/7320 System Noise Monitors Controls,
Indicators and Connectors 3-2
4-1 Functional Illustration — Timing and Gating 4-8
4-2 3-Input NOR Circuit Truth Table 4-13
5-1 Test Equipment Required for Performance Verification 5-1
5-2 Power Supply Checks and Adjustments 5-5
v/ vi
Page 8

Page 9

CHAPTER I
GENERAL
1-1. INTRODUCTION
1-2. This Instruction Manual is for the AILTECH 7310 and AILTECH 7320 System Noise Mon
itors (SNM), figure 1-1, and contains physical and functional descriptions, installation and inspec
tion procedures, operating and maintenance instructions, and a parts list for each model. All
schematics, electrical and assembly drawings are included, as are appendices for the available option
al features. Unless otherwise stated, the information provided herein applies to both models.
1-3. GENERAL DESCRIPTION
1-4. The System Noise Monitors described in this Instruction Manual (7310 and 7320) are
functionally identical. Each provides a readout of the Noise Figure of a unit under test (UUT)
when connected in a valid measurement setup. The minimum test setup consists of a SNM, the
UUT, and a solid state noise source of the AILTECH 7600 series. The 7310 and 7320 have op
tional meter scales which provide an Operating Noise Temperature readout in lieu of Noise Figure.
1-5. The 7310 and 7320 SNM’s are referred to as analog units because the readout is by a meter
with two ranges. Range selection is made by means of a front panel switch. AILTECH also manu
factures the 7360 and 7370 which indicate Noise Figure by means of a three-digit LED display
and are generally referred to as digital units.
1-6. The 7310 (Figure 1-2) is 7V& inches wide and is intended for bench-top use while the 7320
(Figure 1-3) is approximately 17 inches wide and is intended for rack mounting. The optional
Rack Mount Angle Brackets (Option 11) must be attached for mounting in a standard 19 inch
rack.
1-7. SAFETY PRECAUTIONS
1-8. The SNM’s are a low power instrument but when the unit is opened for service, there is the
possibility of contacting the A.C. line. The potential hazard is reduced by covering all exposed >
contact points with insulating material. These instruments should be serviced by technically quali
fied personnel only.
1-9. A standard three-wire, polarized line cord is supplied with the instrument and mates with
an internationally accepted EMI/RFI line filter. The connector complies with all current and
proposed domestic and international requirements for commercial test equipment.
1-10. TECHNICAL SPECIFICATIONS
1-11. A listing of technical specifications is provided in Table 1-1. Outline illustrations for both
models are presented in Figure 1-2 and 1-3.
1- 1
Page 10

a) AILTECH 7320
1- 2
b) AILTECH 7310
Figure 1-1 . System Noise Mon itor s'
Page 11

T
5 V4'
Jl
I
13 1/4 '
14 7/8'
SIDE
-iJ-
Figure 1-2. SNM, Models 7310 and Outline Dimensions
17"
T
5 1/4"
Jl
Figure 1-3. SNM, Models 7320 Outline Dimensions
Page 12

TABLE 1-1. TECHNICAL SPECIFICATIONS
Input Frequency ,
Bandwidth
Minimum Operating Level
(Note 1)
Signal Level Range (Note 2)
Input Impedance
Accuracy (Note 3)
Meter Ranges
10.7, 21.4, 30, |36,¡45, 60 or 70 MHz
(to be specified at time of order)
10% of center frequency (nominal)
Less than -70 dBm
40 dB (minimum)
50 ohms (nominal); 75 ohms, optional if
specified at time of order.
Full scale to half scale:
±0.25 dB (Noise Figure)
±5% (Noise Temperature)
Half scale to quarter scale:
±0.5 dB (Noise Figure)
±8% (Noise Temperature)
0 and 6 dB full scale (Noise Figure),
60 and 240 kelvins full scale (Noise
Temperature). Extension to infinity
on all scales. »
Excess Noise Ratio
Calibration Range
Noise Generator Power
Recorder Output
Auxiliary Output Connector
(Recorder, Signal Monitor
and All Options)
Input Power
Dimensions
7310
7320
6 to 15.9 dB
Sufficient to drive all AILTECH Series 76
Solid-State Noise Sources
1 volt across IK ohms nominal for full
scale meter deflection.
Amphenol 57-20240-1, mates with
Amphenol 57-30240 supplied with unit
(see para. 1-17).
115/230 VAC ±15%, 50-400 Hz, 10 Watts
5 1/4”H x 7 7/16”W x 13 1/4”D (less
handles)(13.3 x 18.9 x 34.3 cm)
5 1/4”H x 17”W x 13 1/4”D (less handles)
(13.3 x 43.2 x 34.3 cm)
See Figures 1-2 and 1-3.
Page 13

TABLE 1-1. TECHNICAL SPECIFICATIONS (continued)
Weight
7310 10 lbs. Net (4.5 kg)
7320 15 lbs. Net (6.8 kg)
NOTES:
1. Lowest noise input level (noise source off), at which valid automatic measurements
may be performed.
2. Range of noise levels (including Y-factor) over which valid measurements may be
performed.
3. Accuracy in the automatic mode is defined as the maximum permissible deviation from
a manual measurement made under the same conditions.
1-12. FUNCTIONAL DESCRIPTION
1-13. General
14 lbs. Shipped (6.3 kg)
19 lbs. Shipped (8.6 kg)
1-14. The System Noise Monitors are designed for both field and production applications where
simplicity and high accuracy instrumentation are required. The SNM’s are capable of providing fully
automatic testing via a continuous indication of noise performance for a variety of components,
assemblies and receivers. Simplified functional operation of the SNM’s is described in the typical
applications presented in the following paragraphs; a detailed functional description is provided in
Section IV. All AILTECH solid state noise sources from 10 MHz to 18 GHz are usable with the
SNM’s described herein (see paragraph 1-23).
1-15. The System Noise Monitor in a Typical Application
1-16. In a typical measurement set-up for transistors, amplifiers, mixers, receivers, etc. such as
that shown in Figure 1-4, the SNM furnishes modulated low level DC power to the noise source,
which in turn provides alternating noise-on and noise-off periods to the unit under test (UUT).
Figure 1-4. Typical Noise Figure Measurement Set-up Using
the AILTECH 7300 System Noise Monitors
1 - 5
Page 14

An intermediate frequency (IF) is derived either internal to the UUT in the case of a complete
transceiver or externally by means of added downconverters. This signal, which consists of periods
of IF noise from the UUT alone, alternating with periods of UUT noise plus that added by the
noise source, is applied to the SNM input. The difference between the two detected levels derived
from the IF signal is related to the noise performance of the UUT. This difference is synchro
nously detected and displayed directly as noise figure or noise temperature by the SNM.
1-17. AUXILIARY OUTPUTS
1-18. Several auxiliary outputs for remote monitoring or record keeping are available at Jl, a
multipin connector on the rear panel. The layout of Jl is shown in Figure 1-5. The outputs
available are as follows:
a. Alarm Relay. An optional (Option 03) variable threshold alarm relay, applicable to
all models.
b. Signal Monitor. A DC signal that varies from 0 to 6 volts (nominal) as the input IF
level increases from the sensitivity limit to 50 dB above that limit. This is a non
linear output intended only to indicate signal level.
c. External Meter. A meter with 100 microamps full-scale sensitivity connected across
pins 6 and 7 of Jl will track the excursion of the SNM front-panel meter. When
Option 12, 10 volt recorder output, is installed the External Meter Function is not
available.
d. Recorder Output. One volt into 1 K ohm for full scale deflection of the front panel
meter.
J1
O O
o o
O 0
o o
o o
o o
O 0
O 0
o o
o o
O 0
13 ^
......
►
— b
— ►
1— ►
— »
— ^
24
• I
>
NOT USED
OPTIONAL
ALARM RELAY
SIGNAL MONITOR
SIGNAL GND
EXT. METER (-)
EXT. METER (+)
RECORDER OUTPUT
NOT USED
1
SW
NO
« - O 0
NC
4 —
•4—
< #-
4 —
12
Figure 1-5. Layout of Jl
1-19. OPTIONS
1-20. The following options are available for the 7300 System Noise Monitors and are listed here
for reference and identification purposes. See the referenced appendices or documents for com
plete option descriptions. .
1- 6
a. Option 02, Radar Noise Monitor. Applicable to the 7320 SNM only. Provides for
continuous, on-line, noise performance monitoring of an operating radar without
interfering with the radar operation. Option 02 is covered in a separate manual.
Page 15

b. Option 03, Alarm Indication. Applicable to both models. SPDT relay deenergizes
when the measured noise figure degrades beyond a preset limit. The threshold is
continuously variable from inside the unit. The relay contacts are available at J1
(see Figure 1-5). Refer to Appendix B.
c. Option 06, Special Paint. Applicable to both models. Front panels can be painted in
accordance to customer’s specifications (with customer supplied paint).
d. Option 07, High Sensitivity. Applicable to the 7320 SNM only. Improves the sensi
tivity to -100 dBm. Refer to Appendix C.
e. Option 09, Broadband Mixer Input. Available on 7320 SNM only. Addition of a
broadband, mixer with all ports (RF, LO, IF) available at the rear panel. The mixer
cover 10 to 1,000 MHz. Refer to Appendix D.
f. Option 10, Front Panel Controls for Manual Operation. Applicable to both models.
The controls required for manual Y-factor measurement are moved to the front panel.
Refer to Appendix E.
g. Option 11, Rack Adaptor Brackets. Applicable to the 7320 SNM only. Permits
mating the front panel with a standard 19 inch rack. See Appendix F.
1-21. ACCESSORIES
1-22. Noise Generators. A complete measurement setup requires a noise generator in addition to
the SNM. All 7300 SNM’s are designed to operate with solid-state noise sources of the 7600 series.
Table 1-2 lists the applicable sources and Figure 1-6 illustrates some typical noise generators.
TABLE 1-2. APPLICABLE NOISE SOURCES
Part Number 07615 07616
Frequency Range
(GHz)
Excess Noise Ratio
(dB)
Calibration Freq.
(GHz)
ENR Accuracy (3) (dB)
VSWR (maximum) 1.2 1.2
0.01-1.5 1-12.4 12.4-18
15.5±0.5
0.03, 0.3,
1.0,1.5
±0.3 ±0.3 ±0.25
15.5±0.5 15.5±1
1,2,3.95,
8.2, 12.4
07617
12.4,15,18,
1.3
7650-X (1) 7660-X (1)
(2) (2)
see
figure 1-7
3 points specified at
time of order
±0.5(4)
4:1
see
figure 1-7
±0.5(4)
4:1
Output Connector
N male
N male
Table continued on page 1-8
OSM female Type N-male
OSM-female
1 -7
Page 16

TABLE 1-2. APPLICABLE NOISE SOURCES (Continued)
Part Number
Input Connector BNC female
Input Requirements 28 volts at
07615 07616 07617
less than
30 mA
BNC female
28 volts at
less than
30 mA
BNC female
28 volts at
less than
30 mA
7650-X (1) 7660-X (1)
BNC female BNC female
28.0 V at
30 mA
maximum
28.0 V at
30 mA
maximum
NOTES:
1. Last digit assigned to each specific noise source at time of order.
2. Up to 15% of the center frequency from 10 MHz to 18 GHz — wider bandwidths available.
3. Accuracy of the ENR data supplied at the calibration frequencies.
4. Higher accuracy available.
a) 07615 10 to 1500 MHz
b) 07616 1 to 12.4 GHz
. S/M 2 0 9 ,
BIAS 28.00 VDC
’u r n NOISE GENÉ51Ï * *
c) 07617 12.4 to 18 GHz
d) 07660 Typical High Level System Noise Source
Figure 1-6. Typical Noise Sources Used With the 7300 SNM’s
1- 8
Page 17

40
Figure 1-7. Maximum ENR vs Frequency
1-23. Precision Attenuation. The AILTECH 32 Series Precision Attenuators are tuned, contin
uously variable attenuators which provide an accurate means of measuring Y -factor. These instru
ments are necessary for routine, periodic recalibration of the 7300 System Noise Monitors. How
ever, for critical applications where it is desired to improve precision by recalibrating on-line on a
short term basis, the Precision Attenuator becomes a valuable adjunct to the measurement setup.
These attentuators (see Figure 1-8) are available at common intermediate frequencies in rack mount,
cased, and unmounted configurations.
1- 9
Page 18

Figure 1-8. AILTECH 32 Precision Attenuator (Cased Version)
1-24. TEST EQUIPMENT
1-25. Table 1-3 lists the test equipment recommended for use in testing, adjusting and servicing
SNM’s.
TABLE 1-3. RECOMMENDED TEST EQUIPMENT
Description
Precision Attenuator
Signal Generator
Digital Multimeter
Vector Voltmeter
Oscilloscope
Noise Generator
Amplifier
1-10
Specification
IF equal to 7 300
Calibrated output from
-100 to -30 dBm at 7300 IF
4V2 digits
10 to 100 MHz
200 MHz 3 dB BW
Compatible with UUT and SNM
Compatible with Noise Generator
and SNM
Recommended Model
AILTECH 32 Series
Boonton 512
Systron-Donner 7004A
PRD 2020
Tektronix 475
AILTECH 76 Series
(Simulates UUT).
Page 19

CHAPTER II
INSTALLATION
2-1. INTRODUCTION
2-2. This chapter describes unpacking, inspection, preparation for use and initial checkout of
the AILTECH 7300 Series System Noise Monitors.
2-3. UNPACKING, INSPECTION AND DAMAGE CLAIMS
2-4. No special instructions or precautions are necessary for unpacking the SNM; the instrument
is ready for use immediately upon receipt. The following checks should be made to assure that no
damage has occurred during shipment.
a. Inspect the shipping container prior to acceptance from the carrier. Note any damage
to the shipping container on the carrier’s receipt.
b. Inspect the instrument for damage. Check for dents, scratches, broken switches, con
nectors, etc.
c. Remove the top and bottom covers and inspect for broken components or loose
hardware.
d. If damage is not apparent until after the instrument has been accepted, file a claim for
concealed damage with the carrier within 15 days after receipt. All packaging material
must be kept for inspection by the carrier’s agent. A copy of the claim must be for
warded to AILTECH.
2-5. ANCILLARY ITEMS
2-6. Each SNM is accompanied by a mating line cord, a mating plug for the auxiliary output con
nector, and one instruction manual. Before discarding the shipping container, make certain these
items are removed.
2-7. RACK MOUNTING
2-8. Rack Mounting Adapter Kit, Option 11 is required to secure the AILTECH 7320 in a
standard 19 inch rack. The kit consists of two right angle brackets which bolt to the side of the
unit. Complete assembly instructions are provided with the kit.
2-9. PREPARATION FOR USE
2-10. Prior to shipment from the factory, the internal mode switches of the System Noise Monitor
are set for normal automatic noise figure (or temperature) measurements, and the line voltage
switch on the rear panel is set to the value appropriate for the shipping destination. However, it is
good practice to check these settings prior to operating the instrument as follows:
. a. Note the setting of the rear panel line voltage switch. Set it to 115 or 230 volts AC
as required (see Figure 3-1).
2 -1
Page 20

b. Check both line fuses, F I and F2, and make certain they are the correct value for the
line voltage selected:
230 VAC: FI, F2 = 1/8 Amp.
115 VAC: FI, F2 = 1/4 Amp.
c. Remove the single Phillips-head screw holding the top cover in place, and remove the
top cover.
d. See Figure 3-5 for the location of the IF-Video board and for the locations of the MAN-
AUTO and noise generator ON-OFF switches on the IF-Video board.
e. Make certain that the MAN-AUTO switch is in the AUTO position and the noise
generator ON-OFF switch is in the OFF position.
2-11. INITIAL CHECKOUT
2-12. This operational checkout is a preliminary test and is not intended to validate performance
standards. (For complete Validation Procedure, refer to Chapter V.) Figure 3-1 and Table 3-1
locate and describe the function of the controls, indicators and connectors referenced below.
2-13. The equipment required for initial operational checkout is as follows:
a. Oscilloscope — Tektronix 475 (or equivalent).
b. Signal Generator — Boonton Model 102A (or equivalent).
c. Digital Multimeter — SystonDonner 7004A.
2-14. General
2-15. Perform the procedures detailed under paragraph 2-10. Connect the line cord to the appro
priate AC power source. '
CAUTION
The 7300 System Noise Monitors are low power instruments, but routine
precautions should be observed due to the possibility of contact with the
applied AC line.
2-16. Checkout procedures
a. With the power ON-OFF switch in the OFF position and the instrument in its normal
operating orientation, note the reading of the front panel meter. If it indicates
infinity (°°) proceed to step (b). If it does not indicate infinity, adjust the meter as
follows:
2- 2
1. Locate the zero adjustment screw at the rear of the meter case, between and just
below the terminals.
2. Rotate the screw until the meter reads up-scale (lower noise figures).
Page 21

3. Continue rotating the screw in the same direction until the needle again indicates
infinity.
b. Set the power ON-OFF switch to the ON position, allow a few minutes for stabiliza
tion, and note that:
1. The red power indicator is illuminated.
2. The green SIGNAL LEVEL indicator is not illuminated.
c. Set the RANGE switch on the front panel to the HIGH position. Note that the meter
still indicates infinity.
d. Connect the output of the signal generator to the IF input. Set the output frequency
to the center frequency of the SNM. Set the output level to rated sensitivity of the
SNM:
-70 dBm for standard units
-100 dBm for units equipped with Option -07, High Sensitivity.
Note that the green SIGNAL LEVEL lamp is illuminated.
e. Locate the MAN-AUTO switch on the IF-Video board and set it to the MAN position.
Note that the green SIGNAL LEVEL lamp extinguishes.
f. Set the front panel RANGE switch to the LOW position. Adjust the signal generator
output level for full-scale indication (0 dB or 60K). Adjust the internal MAN GAIN *
control counterclockwise for a quarter-scale indication (6 dB or 240K).
g. Set the front panel RANGE switch to the HIGH position. Note that the indication
rises to approximately full-scale (± 2 dB).
h. Connect the multimeter, set up to read +28 volts DC, to the BNC connector on the
rear panel marked NOISE SOURCE. Note that the multimeter reads 0 ± 0.5 volts.
i. Set the noise generator ON-OFF^witch on the IF video board to ON. Note that the
multimeter reads +28.00 ±0.05 volts.
j. Disconnect the multimeter. Set the noise generator ON-OFF and MAN-AUTO
switches on the IF-Video board to OFF and AUTO respectively. Connect the oscil
loscope to the NOISE SOURCE BNC connector on the rear panel. Note that the
output is a rectangular, positive pulse, alternating between 0 and +28 volts, at about
a 285 Hz rate).
k. Disconnect the oscilloscope, and replace the top cover.
* These controls are on the front panel of those units equipped with Option 10.
NOTE
If the instrument fails any portion of the checkout procedure, it requires
adjustment or repair. Refer to Chapter V for adjustment and troubleshooting
instructions. If the unit is still under warranty, contact your local AILTECH
representative. .
2- 3 /2 - 4
Page 22

Page 23

CHAPTER III
OPERATING INSTRUCTIONS
3-1. GENERAL
3-2. This chapter provides a description of the SNM operating controls, indicators and connectors
and typical SNM operating procedures.
3-3. DESCRIPTION OF OPERATING CONTROLS, INDICATORS AND CONNECTORS.
3-4. The front and rear panel controls, indicators and connectors for SNM Models 7310/7320
are listed in Table 3-1 and illustrated in Figure 3-1. The functions of the controls, indicators and
connectors for Models 7310 and 7320 are identical.
3-5. SET-UP PROCEDURES
3-6. The AILTECH 7300 System Noise Monitors are normally applied to the continuous or peri
odic measurement of a single receiving system, or repeated measurements of similar types o f.
devices (as on a production line test station). Therefore, some care should be exercised in setting
up the measurement system to insure the validity of the indicated results.
3-7. There are three major factors to be considered in setting up the measurement system:
a. Interconnections.
b. Establishment of the correct Excess Noise Ratio (ENR) setting for the front panel
thumbwheel switch on the SNM.
c. Establishment of signal levels within the measurement range of the SNM.
3-8. Interconnections
3-9. In general, there are two types of set-ups for noise parameter measurements. For purposes
of identification these will be referred to as “ bench” and “ operating” noise measurements.
3-10. Most true noise figure measurement are of the bench type. In this case, the setup will be as
indicated in Figure 3-2.
3-11. If the noise source is a typical laboratory noise generator with an excess noise ratio (ENR)
less than 16 dB — such as the AILTECH 7615, 7616, and 7617 Noise Generators — it can be con
nected directly to the input of the unit-under-test (UUT). .
3-12. If the noise source is a high-level unit with an ENR greater than 16 dB — such as most units
in the 7650, 7660 series — a calibrated attenuator sufficient to reduce the ENR to a value between
6 and 15.9 dB must be inserted between the noise source and the input of the UUT (effective ENR
is the noise source ENR less the attenuation in dB).
3-13. Operating measurements are those made with the receiver connected in its normal operating
environment. In most cases, this means the input connected to an antenna. Noise is injected into
the system by means of a directional coupler (see Figure 3-3). This setup usually requires a high
level noise source, such as the AILTECH 7650 or 7660.
3- 1
Page 24

TABLE 3-1. AILTECH 7310/7320 SYSTEM NOISE MONITORS CONTROLS, INDICATORS
AND CONNECTORS
Key
(Figure 3-1)
1
2
3
4
5
5a
6
7
Reference
Title
ON OFF
SYSTEM ENR (dB)
SIGNAL LEVEL
NOISE FIGURE (dB)
NOISE TEMPERA
TURE—Kelvins
RANGE LOW/HIGH S2
Fuse
Designation
DL1
SI
S3
DL2 Green indicator is illuminated when the
MI Indicates Noise Figure.
MI Alternate meter scale indicates
FI Line fuse.
Function
Red indicator is illuminated when AC
power is applied.
Lever switch controls application of AC
power.
Thumbwheel switch calibrates SNM for
selected excess noise ratio.
input IF level exceeds some arbitrary
minimum.
Operating Noise Temperature.
Rocker switch selects meter range.
10
11
12
13
8
9
Fuse
LINE
AC INPUT
Connector
IF INPUT
NOISE SOURCE J9
F2 Line fuse.
S ll
—.
J1
J8
Slide switch selects primary AC input
line voltage.
Recessed plug for application of
primary AC input.
Multipin connector (Amphenol 57
20240-1, mate supplied) for auxiliary
outputs (see paragraph 1-17).
BNC female connector for application
of IF signal from unit under test.
BNC female connector provides exci
tation for the AILTECH Series 7600
Noise Source.
3-2
Page 25

11
3-3
Page 26

RF
NOISE*
GENERATOR
*TYPICAL MODELS - 7615, 7616, 7617
INPUT
]
(a) Set-up for Bench Measurements Using Noise Sources
With ENR’s Between 6.0 and 15.9 dB
DEVICE
UNDER
TEST
IF
OUTPUT
IF
INPUT
(J8-REAR
PANEL)
(J7-REAR
PAN ELI
NOISE
SOURCE
(b) Set-up for Bench Measurements Using High-Level Noise Sources
Figure 3-2. Bench Measurement Set-ups
Figure 3-3. Typical “ Operating” Measurement Set-up
3 -4
Page 27

3-14. The measurement performed by a setup such as that illustrated in Figure 3-3 is often
called Operating Noise Figure. This is a noise figure measurement in which the cold noise tempera
ture is that of the actual operating termination, but the results are displayed as though the termina
tion was at the standard reference temperature, 290 kelvins. In general, this measurement will yield
lower noise figure readings than a true noise figure measurement (assuming a quality antenna with
an effective noise temperature less than 290K). This type of measurement is quite commonly made
on radar receivers, and is sometimes called radar noise figure.
3-15. If the SNM readout is in noise temperature, then the measured parameter is Operating Noise
Temperature. This parameter is often measured on high-sensitivity, long range receivers, such as
satellite earth stations.
3-16. Other factors to be considered are:
a. Frequency compatibility between the noise source and the RF input of the UUT (a
matter of proper noise source selection).
b. Frequency compatibility between the IF output of the UUT and the System Noise
Monitor. This may require frequency conversion (see paragraph 1-19 for options
which provide this feature).
3-17. Excess Noise Ratio Setting
3-18. The accuracy of the 7300 SNM depends upon accurate setting of the front panel ENR
thumbwheel switch. Any error in this switch setting is translated directly — dB for dB — to the
noise figure indication.
3-19. Laboratory or bench-type noise generators such as the AILTECH 7615, 7616, and 7617 (see
Figure 1-6) have an ENR vs. frequency calibration chart attached or printed on the generator body
and are accompanied by a record of calibration. System noise sources, such as the 7650 and 7660
are also accompanied by calibration records.
3-20. To determine the ENR thumbwheel settings:
a. Locate the two frequencies on the noise source calibration record (or calibration
chart) that straddle the RF input frequency of the UUT (assuming the input frequency
does not coincide with a calibration point).
b. Use straight line interpolation to determine the basic noise source ENR.
c. If the set-up is as shown in Figure 3-2(a), adjust the ENR thumbwheel to the result in
(b) to the nearest 0.1 dB.
d. If the set-up is as shown in Figure 3-2(b), subtract the attenuation (in dB) from the
ENR determined in (b). Adjust the ENR thumbwheel to the resulting difference to
the nearest 0.1 dB.
3-21. Establishing the Correct Signal Levels
3-22. The basic sensitivity (low point of the valid signal level range) of the 7300 System Noise
Monitors is better than -7 0 dBm. This is not the point at which the green Signal Level light comes
on. This light is meant only as a gross indication that some signal is available from the UUT.
3-5
Page 28

3-23. To determine sensitivity or low end of the signal level range a signal generator to provide
low level signals at the SNM center frequency is required (a typical unit is the Boonton 102A).
a. Make certain the SNM is in the AUTO mode (S101).
b. Connect a signal generator tuned to the center frequency of the SNM to the IF Input.
c. Gradually increase the signal generator output level from about -85 dBm until the
green Signal Level light illuminates. Note the generator output level.
d. Increase the generator output 5 dB above the point where the Signal Level light comes
on. This is the sensitivity or lower end of the valid signal level range. Note that this
level is less than -70 dBm, and record it for future reference.
NOTE
If a continuous indication of signal level is desired, see Paragraph 3-33.
3-24. The upper end of the valid signal level range will be 40 dB above the sensitivity as deter
mined from paragraph 3-23 (d). All signals — both with the noise source on and the noise source
off — must remain within this range. Figure 3-4 illustrates this range using typical levels.
UPPER L IM IT -3 3 dBm*
LU'
>
LU
_ l
_l
<
z
C/3
-40 dBm —
-50 dBm —
-60 dBm
-70 dBm
-80 dBm
Y
FACTOR
SENSITIVITY -73 dBm*
SIGNAL LEVEL LIGHT -78 dBm*
*Typical Values
3- 6
Figure 34. Illustration of Sensitivity and Signal Level Range
Page 29

3-25. To insure that the UUT output is within the valid range, proceed as follows:
a. Remove the top cover of the SNM and locate the following controls on the IF-Video
board (see Figure 3-5). These controls are on the front panel of those units equipped
with Option 10, Manual Front Panel Controls:
MAN-AUTO switch, S101
MANUAL GAIN control, R140
Noise Generator ON-OFF Switch, S102 .
b. Connect a signal generator tuned to the SNM center frequency and set the output level
as described in paragraph 3-23 (d).
c. Set the following controls as indicated:
1. Front panel RANGE switch to LOW
2. MAN-AUTO switch S101 to MAN
3. Noise Generator switch S102 to OFF
d. Adjust manual GAIN control, R140, for a convenient on-scale reading at the upper
50% of the scale. Record the setting.
e. Without disturbing the preceding settings, disconnect the signal generator and set up
the measurement system in accordance with Figure 3-2 or 3-3 as required.
f. If the noise figure indication with the control settings as above is higher (down-scale)
than (d), additional gain is required between the UUT and the SNM input. Add gain
as required (or see paragraph 1-19 for an option to provide better sensitivity) to bring
the reading lower in noise figure or temperature than (d) and proceed to (h).
. g. If the indication is a lower noise figure than (d), or off-scale to the right, set Noise
Generator switch S I02 to ON.
h. Add attenuation at the SNM input until the indication returns to (d). If the total
attenuation required is greater than 40 dB, there is too much gain in the UUT, and
fixed attenuation must be provided at the SNM input as part of the set-up.
3-26. After establishing the correct input levels, set MAN-AUTO switch S101 to AUTO and Noise
generator switch S102 to OFF. Replace the top cover.
3-27. OPERATION
3-28. Once set-up is accomplished, the ENR switch correctly set, and the correct signal levels
established, the System Noise Monitor will automatically indicate noise figure or noise temperature.
No further operator activity is required other than setting the RANGE switch for optimum resolu
tion as noted below.
3-29. The AILTECH 7310 and 7320 Analog System Noise Monitors have two noise figure ranges
with 0 and 6 dB at full scale. Increasing noise figure causes the meter to read down-scale. If the
UUT noise figure is less than 6 dB, set the front panel RANGE switch to the LOW position and
read noise figure. If the noise figure is greater than 6 dB set the switch to the HIGH position and
read the noise figure.
Page 30

5101
MAN-AUTO
SWITCH
5102
MANUAL
ON-ÓFF
SWITCH
O' Uif
1 = 3 0 1 = 1
POWER SUPPLY
PC BOARD ASSEMBLY
298021-1
IF-VIDEO PC
BOARD ASSEMBLY
298020
-1 10 TO 40 MHz
-2 40 TO 70 MHz
3- 8
R140
MANUAL
GAIN
m&\p
ENR PC BOARD
ASSEMBLY
298172
S3
ENR SWITCH
Figure 3-5. Location of the Manual-Auto Controls
Page 31
3-30. Those System Noise Monitors with the symbol (T) in their part numbers are equipped with
operating noise temperature scales. These also have two ranges, and the full-scale values are 60
and 240 kelvins.
3-31. USE OF AUXILIARY OUTPUTS
3-32. Paragraph 1-17 briefly described several auxiliary outputs available at J1 on the rear panel.
These outputs may be used for monitoring signal level, for permanent records of noise figure (or
temperature) variations with time, and for providing a readout at a remote location.
3-33. Signal Monitor, Jl, Pin 4 (see Figure 1-5 for layout of Jl). This output provides a DC
signal that varies from near zero to approximately 6 volts as the input signal level increases by
about 40 dB from the sensitivity limit. It is a non-linear, uncalibrated output; however, it can be
very useful for insuring that the UUT output level remains in the valid range as established by
paragraph 3-25. This can be accomplished as follows:
a. Connect a voltmeter, 0 to +10 volts DC capability between Jl-4(+) and Jl-5 (-, GND).
b. Proceed as indicated in Paragraph 3-23.
c. Record the voltmeter indication upon completion of paragraph 3-23 (d). This indica
tion corresponds to signal level at the low-limit of the valid range.
d. Increase the signal level by 40 dB, less the expected Y-factor (see paragraph 3-34).
Record the voltmeter indication which will represent the maximum permissible signal
level.
3-34. When operating the SNM in the AUTO mode, the signal levels are valid as long as the volt
meter remains within the limits established in paragraph 3-33 (c) and (d).
NOTE
The expected Y -factor is a function of the noise figure of the UUT and
the effective ENR. For noise figures less than 6 dB and ENR’s greater
than 14 dB, the expected Y-factor can be approximated by subtracting
noise figure from ENR (both quantities in dB). For other situations it
may be calculated from:
(3-1)
where ENR and F are expressed as power ratios.
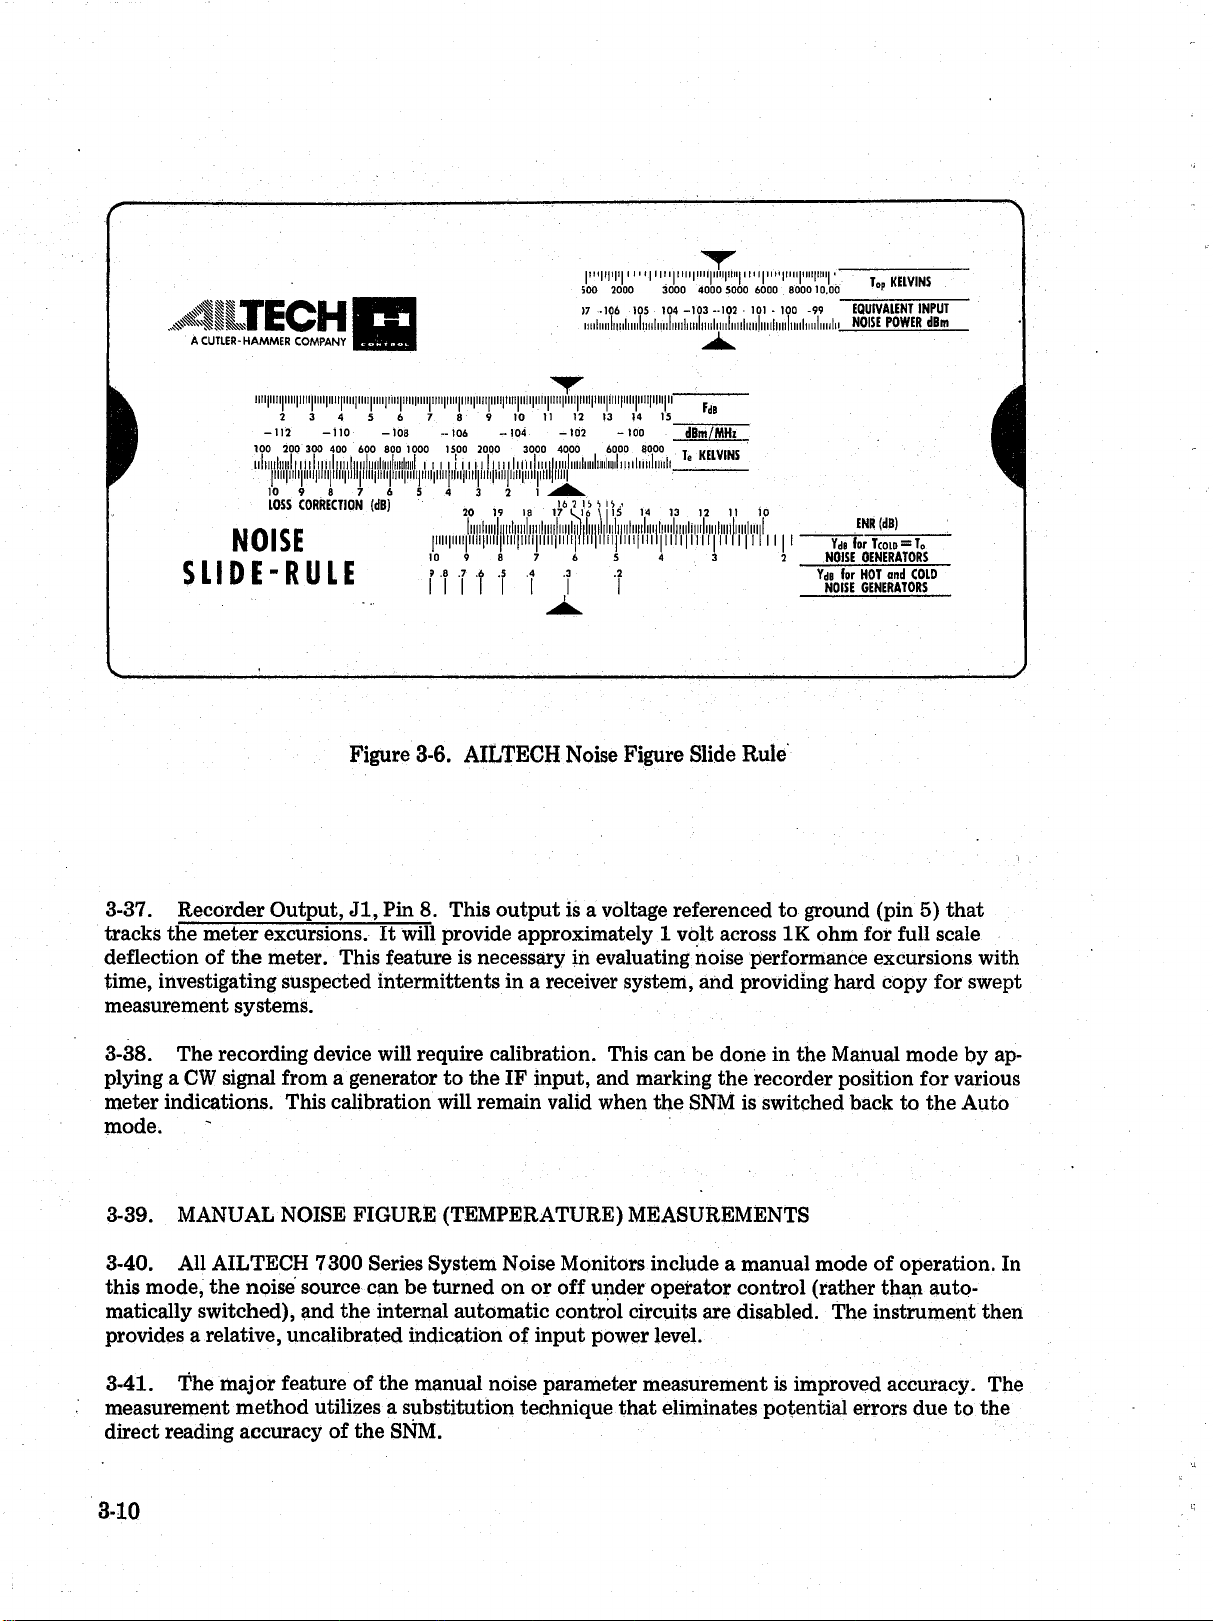
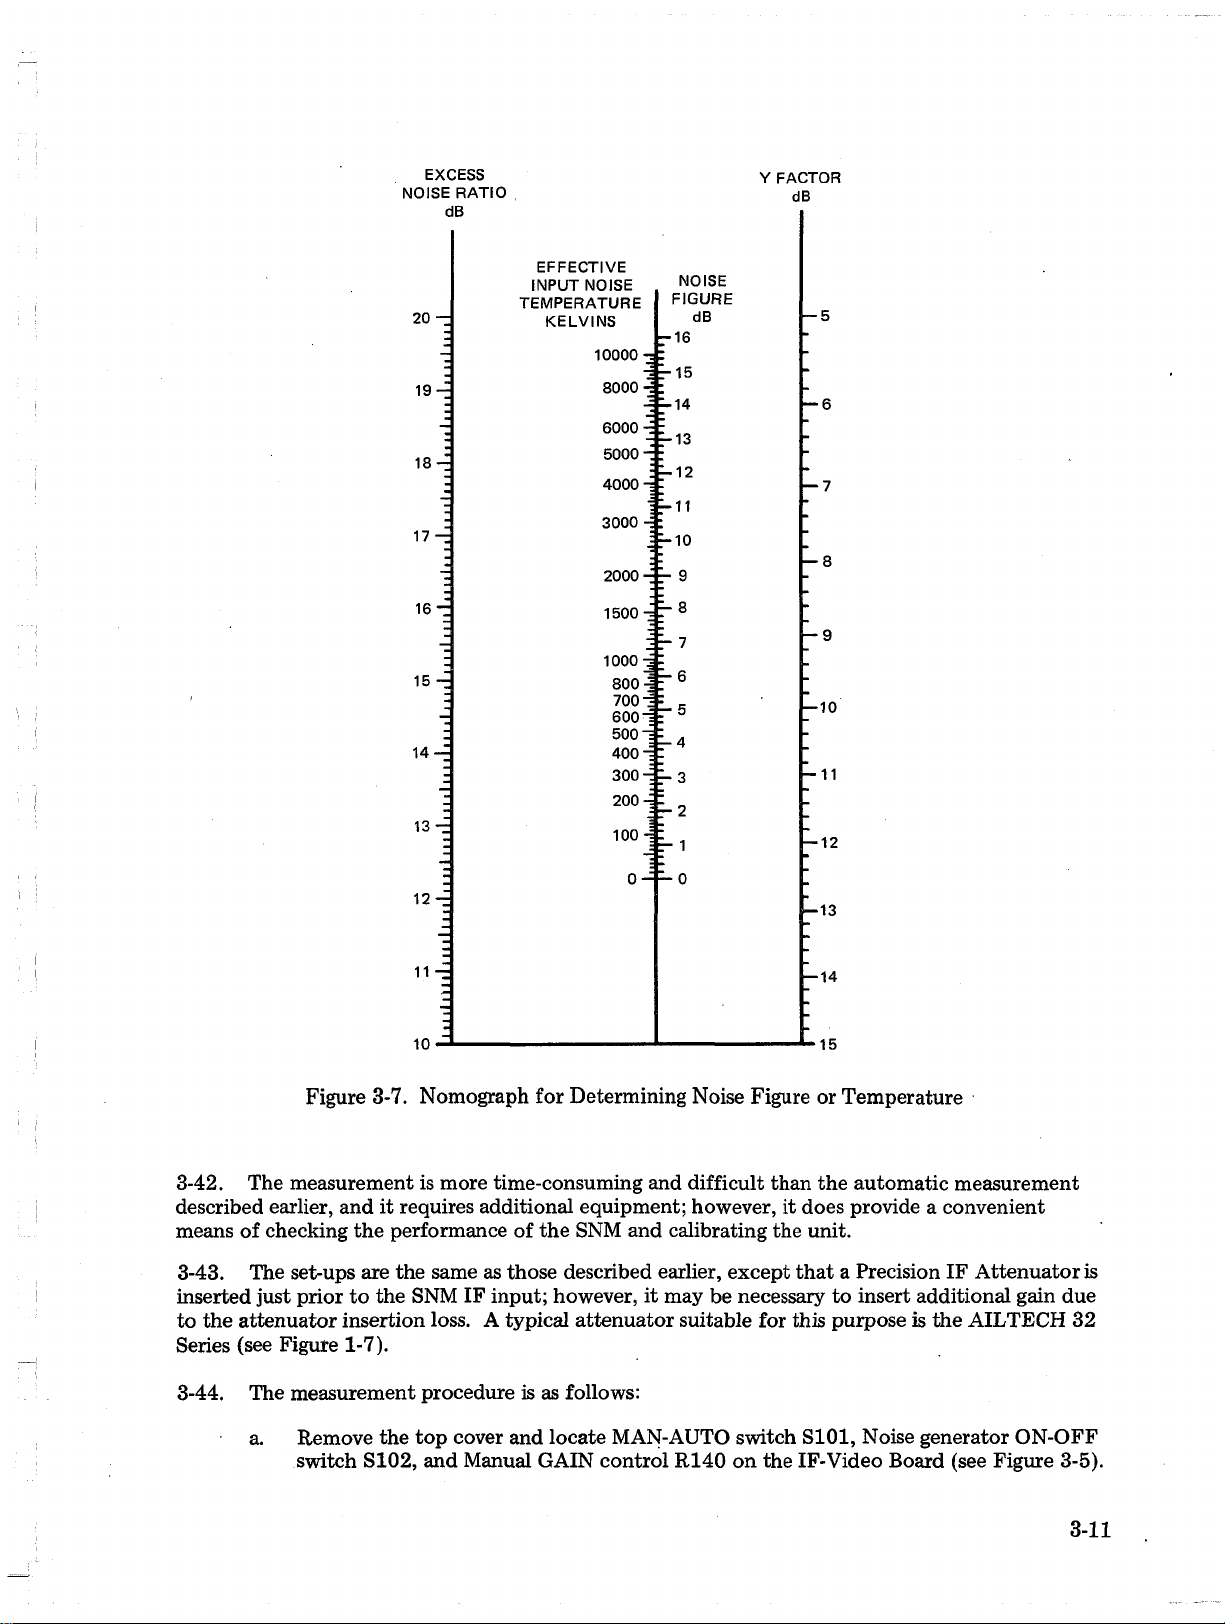
It may also be determined from the AILTECH Noise Figure Slide Rule,
Figure 3-6, or the nomograph of Figure 3-7.
3-35. External Meter, Jl, Pins 6 and 7. This feature provides for a readout of noise figure at a
remote location. Any 100 microamp, IK ohm full scale meter connected across the referenced
pins (+ to pin 7; - to pin 6) will track the excursions of the front panel meter. A duplicate of the
front panel meter complete with scaling is available for this purpose.
3-36. The external meter leads are ungrounded and should be twisted and shielded for runs of
more than one foot.
3 - 9
Page 32
r
| T ! i | f j i | i | 1 1 1 1 1 1 i ) i | i i i i | i i i i | i i i i | ! i i i j 1 1 1 1 1 1 1 >1 1 r 111 |i ii i[ ii ii | •
TECH
A CUTLER-HAMMER COMPANY
500 2000 3000 4000 500 0 6000 800 01 0.00
)7 -106 105 104 - 1 0 3 -1 0 2 • 101 - 100
99 EQU IV ALENT INPUT
iilimlii NOISE POWER dBm
'S
2 3 4 5 6 7 8 9 10 11 12
-1 1 2 - 1 1 0 -1 0 8 - 106 -1 0 4 - 1 0 2
100 200 300 400 600 800 1000 1500 2000 3000 4000
ii!iiit!ii!iliM i!i|iilMiili!iiliiiil¡iiiliii[liiiiE 1111 ¡i 11 il m il i r ii l i m l i i
i!l!l|lli!|llll|ll!l|[ill|lill|iill|llll|l|ll|llll...............................
10 9 8 7 6
LOSS CORRECTION (dB)
NOISE
SLIDE-RULE
ijim
5
4 3 2
20 19 la
10 9 8
? .8 .? .6 .5 .4
11 I I I I
13 14
- 10 0
60.00 8000
.....
........
Ü>
14 13 12 11 10
FdB
15
dBm /M Hi
Te KELVINS
llllllllllllllllillllllllllllijllllllllll
iil|iiii|iiii|iiii|i h 111
4 3 2
ENR (dB)
Yds for Tco id = T0
NOISE OENER ATORS
Yds (or HOT and COLD
NOISE GENERATORS
(
Figure 3-6. AILTEGH Noise Figure Slide Rule
3-37. Recorder Output, Jl, Pin 8. This output is a voltage referenced to ground (pin 5) that
tracks the meter excursions. It will provide approximately 1 volt across IK ohm for full scale
deflection of the meter. This feature is necessary in evaluating noise performance excursions with
time, investigating suspected intermittents in a receiver system, and providing hard copy for swept
measurement systems.
3-38. The recording device will require calibration. This can be done in the Manual mode by ap
plying a CW signal from a generator to the IF input, and marking the recorder position for various
meter indications. This calibration will remain valid when the SNM is switched back to the Auto
mode. '
3-39. MANUAL NOISE FIGURE (TEMPERATURE) MEASUREMENTS
3-40. All AILTECH 7300 Series System Noise Monitors include a manual mode of operation. In
this mode, the noise source can be turned on or off under operator control (rather than auto
matically switched), and the internal automatic control circuits are disabled. The instrument then
provides a relative, uncalibrated indication of input power level.
3-41. The major feature of the manual noise parameter measurement is improved accuracy. The
measurement method utilizes a substitution technique that eliminates potential errors due to the
direct reading accuracy of the SNM.
3-1 0
Page 33
EXCESS
NOISE RATIO
dB
Y FACTOR
dB
20-
1 9 -
18-
17 —
1 6 -
15 -
14-
1 3 -
12 -
EFFECTIVE
INPUT NOISE
TEMPERATURE
KELVINS
10000:
8000
6000
5000
4000
3000 - i :
2000
1500
1000
800
700
600'
500
400
300
200
100 -I E
NOISE
FIGURE
b-16
15
14
13
E- 12
11
10
9
r 8
7
6
5
4
E- 3
2
1
0
dB
— 6
— 7
— 8
- 9
— 10
-11
— 12
-1 3
11 -
10'
-1 4
■15
Figure 3-7. Nomograph for Determining Noise Figure or Temperature
3-42. The measurement is more time-consuming and difficult than the automatic measurement
described earlier, and it requires additional equipment; however, it does provide a convenient
means of checking the performance of the SNM and calibrating the unit.
3-43. The set-ups are the same as those described earlier, except that a Precision IF Attenuator is
inserted just prior to the SNM IF input; however, it may be necessary to insert additional gain due
to the attenuator insertion loss. A typical attenuator suitable for this purpose is the AILTECH 32
Series (see Figure 1-7).
3-44. The measurement procedure is as follows:
a. Remove the top cover and locate MAN-AUTO switch S101, Noise generator ON-OFF
switch S102, and Manual GAIN control R140 on the IF-Video Board (see Figure 3-5).
3- 1 1
Page 34
b. Set MAN-AUTO switch S101 to MAN, and Noise Generator switch S102 to OFF.
c. Set the Precision Attenuator to 0 dB, and adjust manual GAIN control R140 for a
convenient reference indication on the upper 50% of the meter scale (preferably
with the RANGE switch in LOW). If the signal level is too low to achieve this
condition, the ENR thumbwheel switch may be set to a lower number. If the signal
is still too low, switch to the HIGH range. Note the meter indication.
d. Set Noise Generator ON-OFF switch S102 to ON. Note that the meter indication goes
to the right.
e. Increase the setting of the Precision Attenuator until the meter indication returns to
the reference noted in (c).. Record the attenuation change which is the Y-factor in
dB.
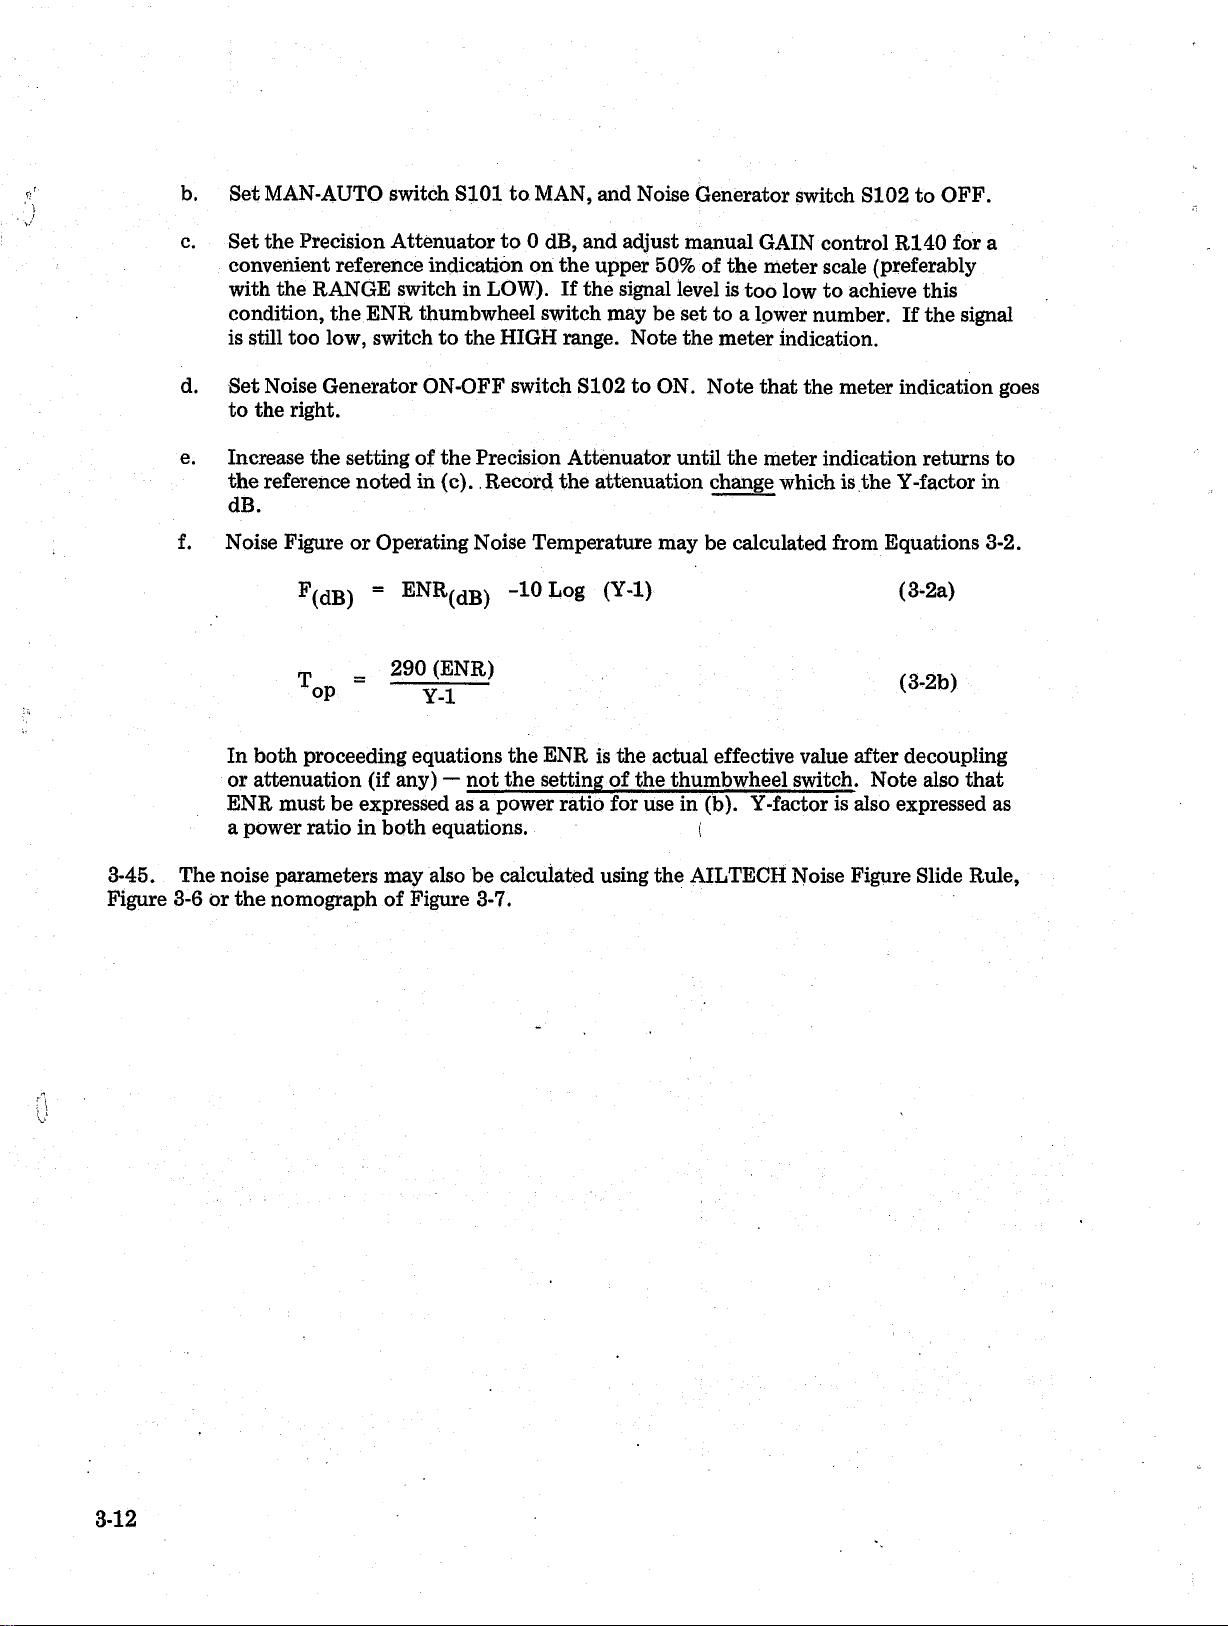
f. Noise Figure or Operating Noise Temperature may be calculated from Equations 3-2.
P(dB) = ENR(dB) -10 Log (Y -l) (3-2a)
290 (ENR)
op
In both proceeding equations the ENR is the actual effective value after decoupling
or attenuation (if any) — not the setting of the thumbwheel switch. Note also that
ENR must be expressed as a power ratio for use in'(b). Y-factor is also expressed as
a power ratio in both equations. (
3-45. The noise parameters may also be calculated using the AILTECH Noise Figure Slide Rule,
Figure 3-6 or the nomograph of Figure 3-7.
Y-l
(3-2b)
3-12
Page 35
CHAPTER IV
THEORY OF OPERATION
4-1. INTRODUCTION
4-2. This chapter contains noise figure measurement general theory and associated mathematics,
and an overall functional block diagram description of the SNM. Also included are detailed, in
dividual circuit descriptions.
4-3. GENERAL THEORY
4-4. Noise Figure Theory
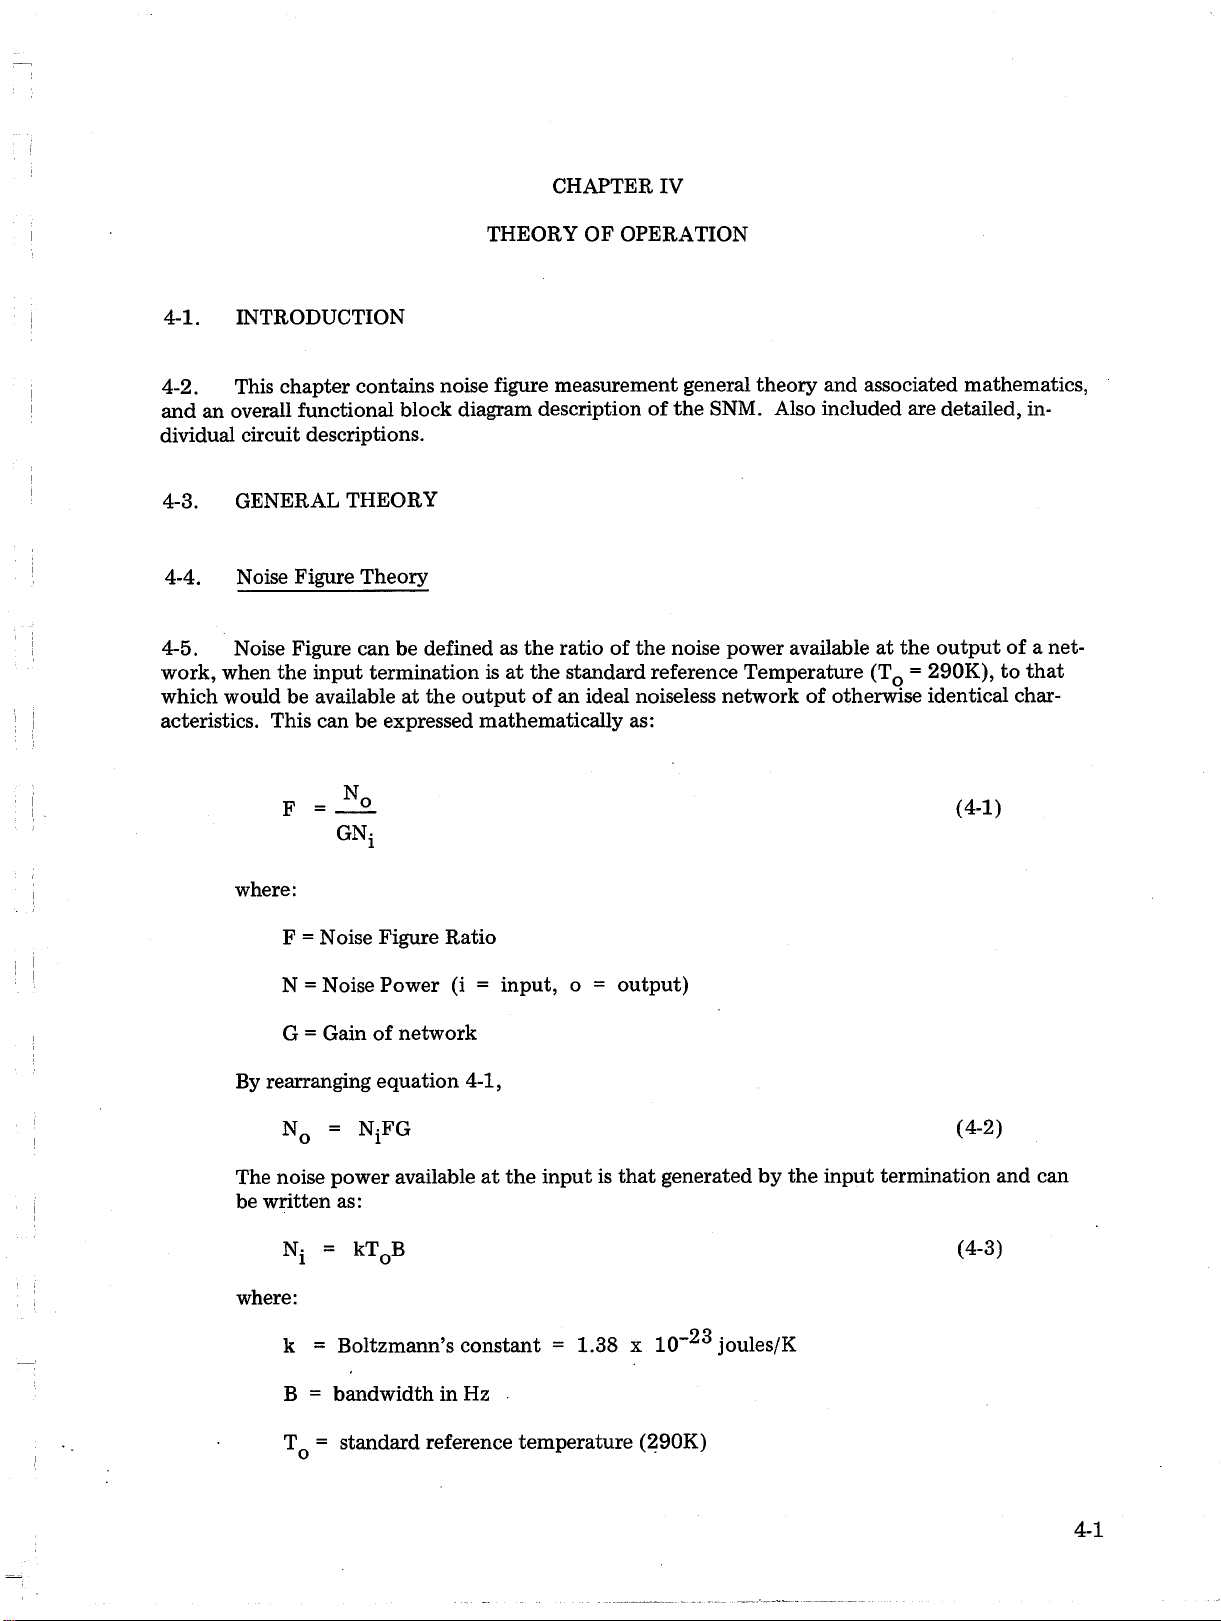
4-5. Noise Figure can be defined as the ratio of the noise power available at the output of a net
work, when the input termination is at the standard reference Temperature (TQ = 290K), to that
which would be available at the output of an ideal noiseless network of otherwise identical char
acteristics. This can be expressed mathematically as:
N
__
F =
where:
F = Noise Figure Ratio
N = Noise Power (i = input, o = output)
G = Gain of network
By rearranging equation 4-1,
Nq = NjFG (4-2)
The noise power available at the input is that generated by the input termination and can
be written as:
Nj = kT0B (4-3)
where:
k = Boltzmann’s constant = 1.38 x 10 joules/K
2. (4-1)
GNj
OO
B = bandwidth in Hz
Tq = standard reference temperature (290K)
4- 1
Page 36
NOTE
All temperatures in these equations are expressed as absolute temperatures
(Kelvins) and are related to the Centigrade (Celsius) scale as follows:
K = °C + 273
Substituting in Equation 4-2,
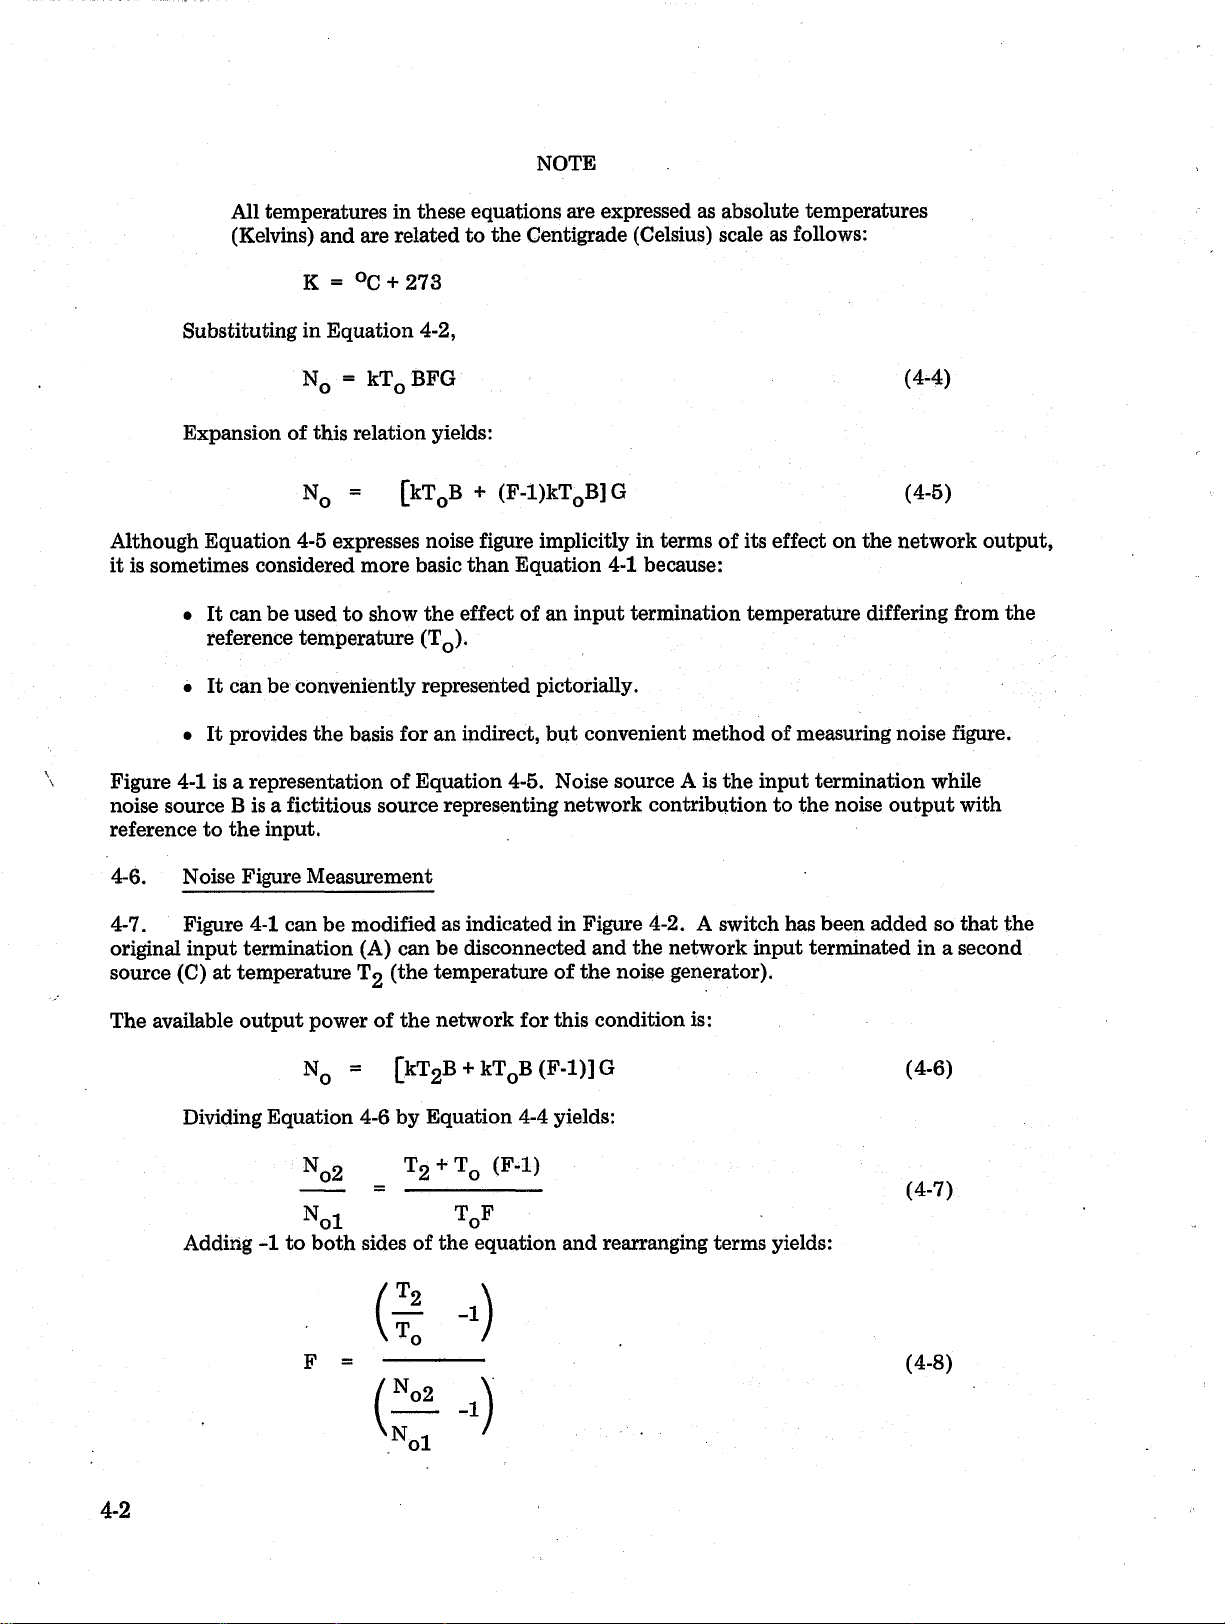
N0 = kT0 BFG
(4-4)
Expansion of this relation yields:
N,
o
[kT0B + (F -l)kT0B]G
(4-5)
Although Equation 4-5 expresses noise figure implicitly in terms of its effect on the network output,
it is sometimes considered more basic than Equation 4-1 because:
• It can be used to show the effect of an input termination temperature differing from the
reference temperature (TQ).
• It can be conveniently represented pictorially.
• It provides the basis for an indirect, but convenient method of measuring noise figure.
Figure 4-1 is a representation of Equation 4-5. Noise source A is the input termination while
noise source B is a fictitious source representing network contribution to the noise output with
reference to the input.
4-6. Noise Figure Measurement
4-7. Figure 4-1 can be modified as indicated in Figure 4-2. A switch has been added so that the
original input termination (A) can be disconnected and the network input terminated in a second
source (C) at temperature T2 (the temperature of the noise generator).
The available output power of the network for this condition is:
No = CkT2B + kToB G
Dividing Equation 4-6 by Equation 4-4 yields:
N o 2 T 2 + To (F-D
F
4-2
(4-6)
(4-7)
(4-8)
Page 37
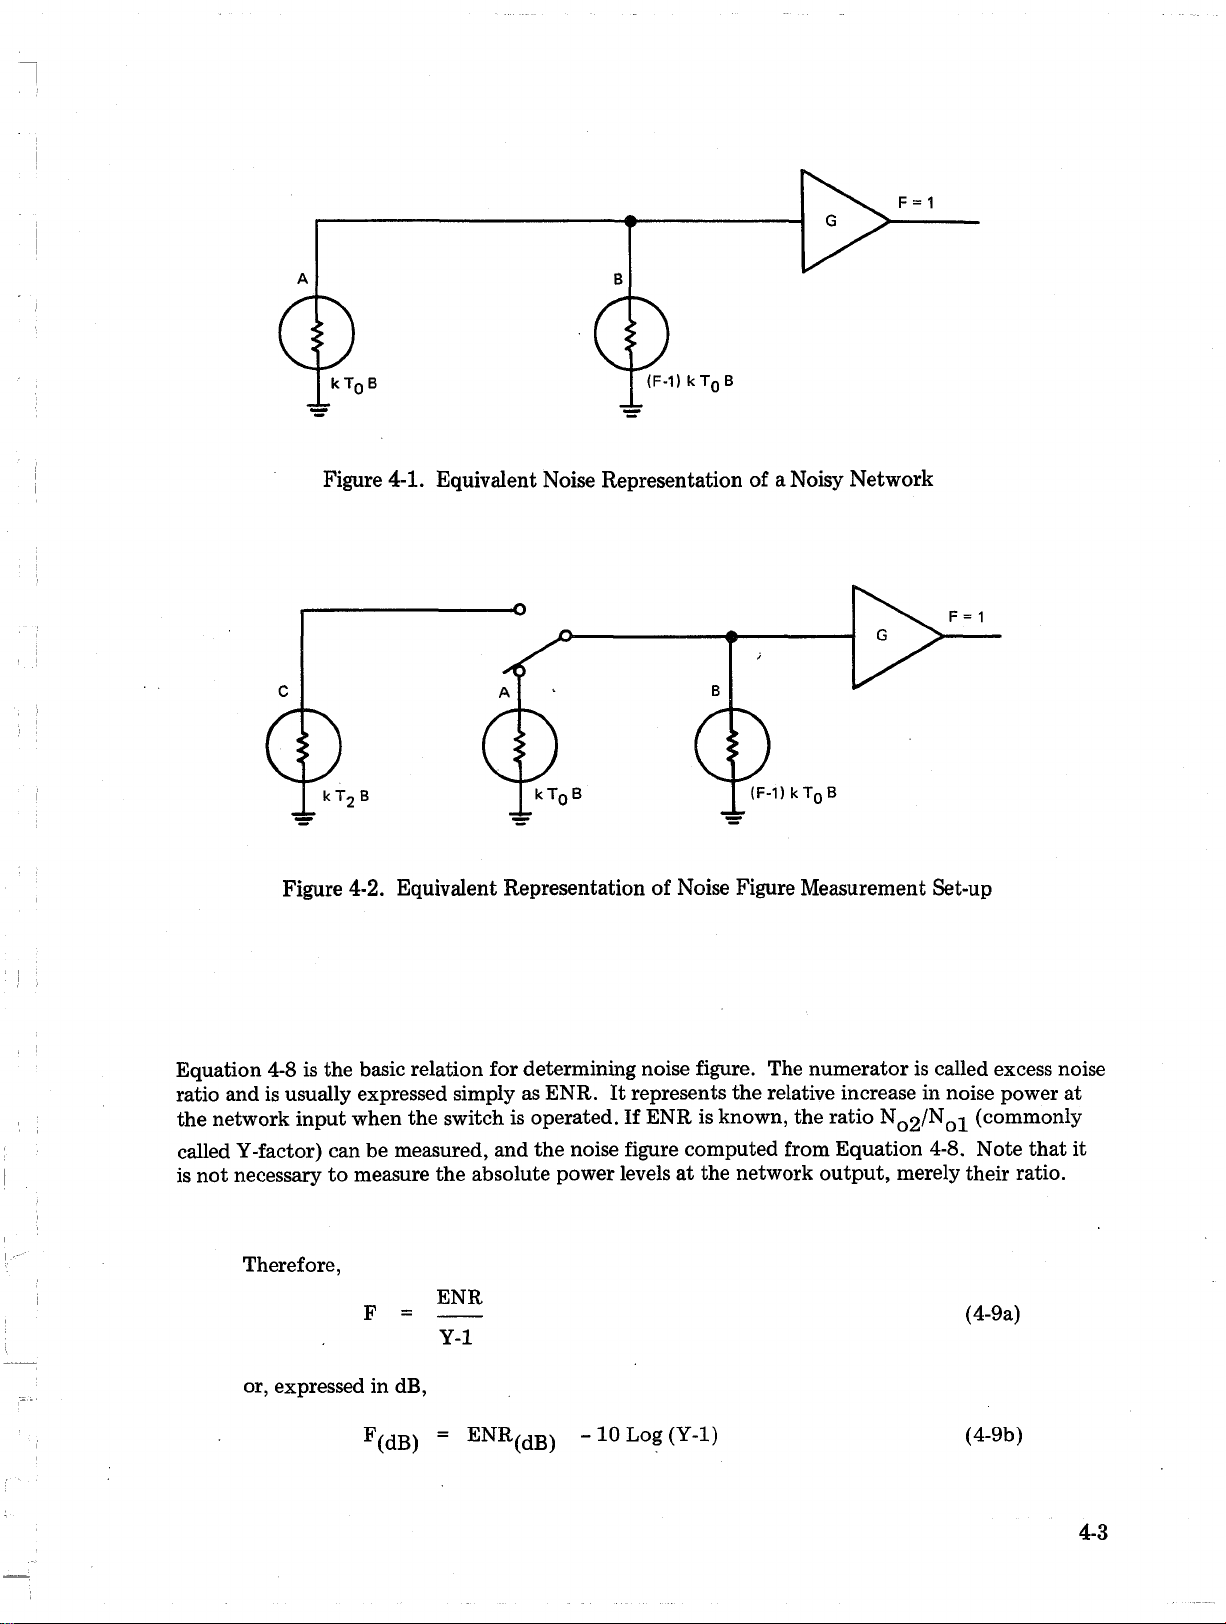
Figure 4-1. Equivalent Noise Representation of a Noisy Network
Equation 4-8 is the basic relation for determining noise figure. The numerator is called excess noise
ratio and is usually expressed simply as ENR. It represents the relative increase in noise power at
the network input when the switch is operated. If ENR is known, the ratio N ^ / N ^ (commonly
called Y-factor) can be measured, and the noise figure computed from Equation 4-8. Note that it
is not necessary to measure the absolute power levels at the network output, merely their ratio.
Therefore,
F =
or, expressed in dB,
F(dB) = ENR(dB) -10 Log (Y -l) (4-9b)
ENR
------ (4-9a)
Y-l
4- 3
Page 38
4-8.
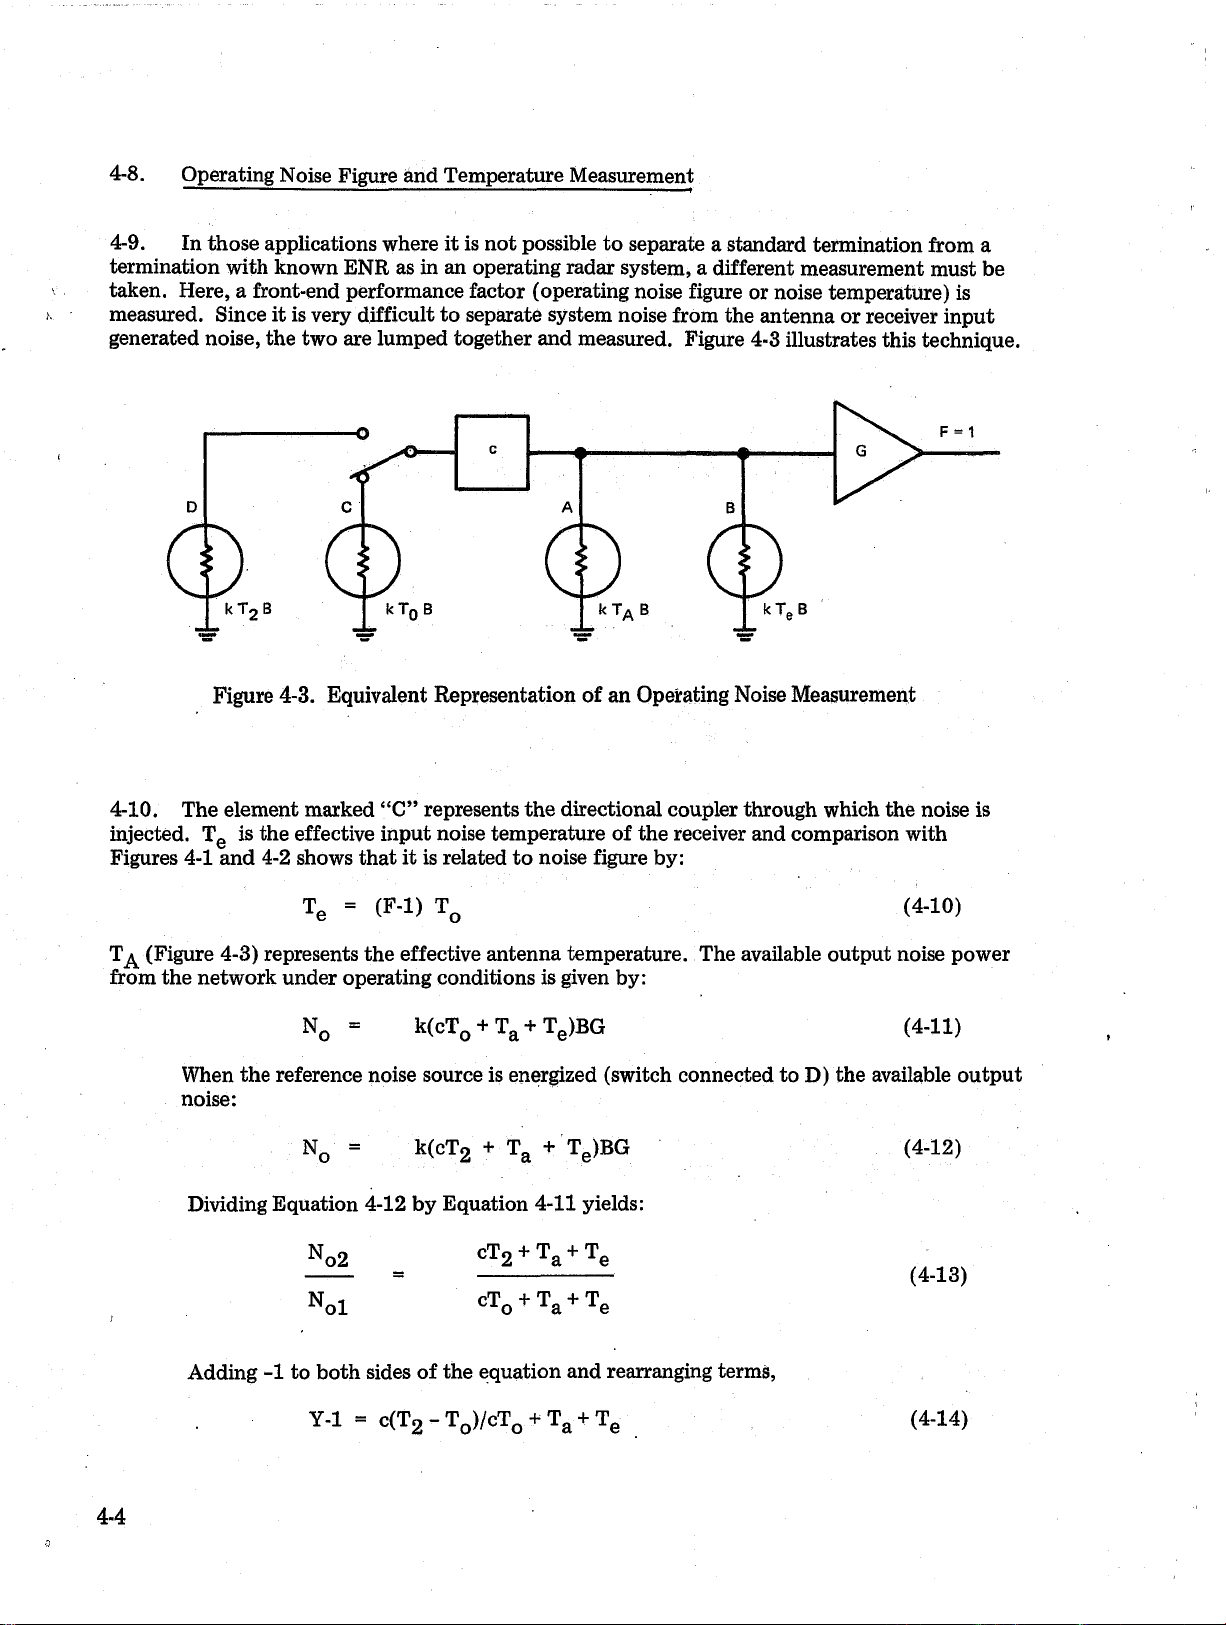
4-9. In those applications where it is not possible to separate a standard termination from a
termination with known ENR as in an operating radar system, a different measurement must be
taken. Here, a front-end performance factor (operating noise figure or noise temperature) is
measured. Since it is very difficult to separate system noise from the antenna or receiver input
generated noise, the two are lumped together and measured. Figure 4-3 illustrates this technique.
Operating Noise Figure ¿nd Temperature Measurement
Figure 4-3. Equivalent Representation of an Operating Noise Measurement
4-10. The element marked “ C” represents the directional coupler through which the noise is
injected. Te is the effective input noise temperature of the receiver and comparison with
Figures 4-1 and 4-2 shows that it is related to noise figure by:
TP = (F-l) T
T^ (Figure 4-3) represents the effective antenna temperature. The available output noise power
from the network under operating conditions is given by:
k(cTn + Ta + Te)BG (4-11)
When the reference noise source is energized (switch connected to D) the available output
noise:
k(cT2 + Ta + Te)BG
Dividing Equation 4-12 by Equation 4-11 yields:
N
o2
N
ol
Adding -1 to both sides of the equation and rearranging terms,
cT2 + Ta + Te
cTo + Ta + Te
(4-10)
(4-12)
(4-13)
. Y -l = c(T2 - T 0)/cT0 + Ta + Te
(4-14)
4- 4
0
Page 39
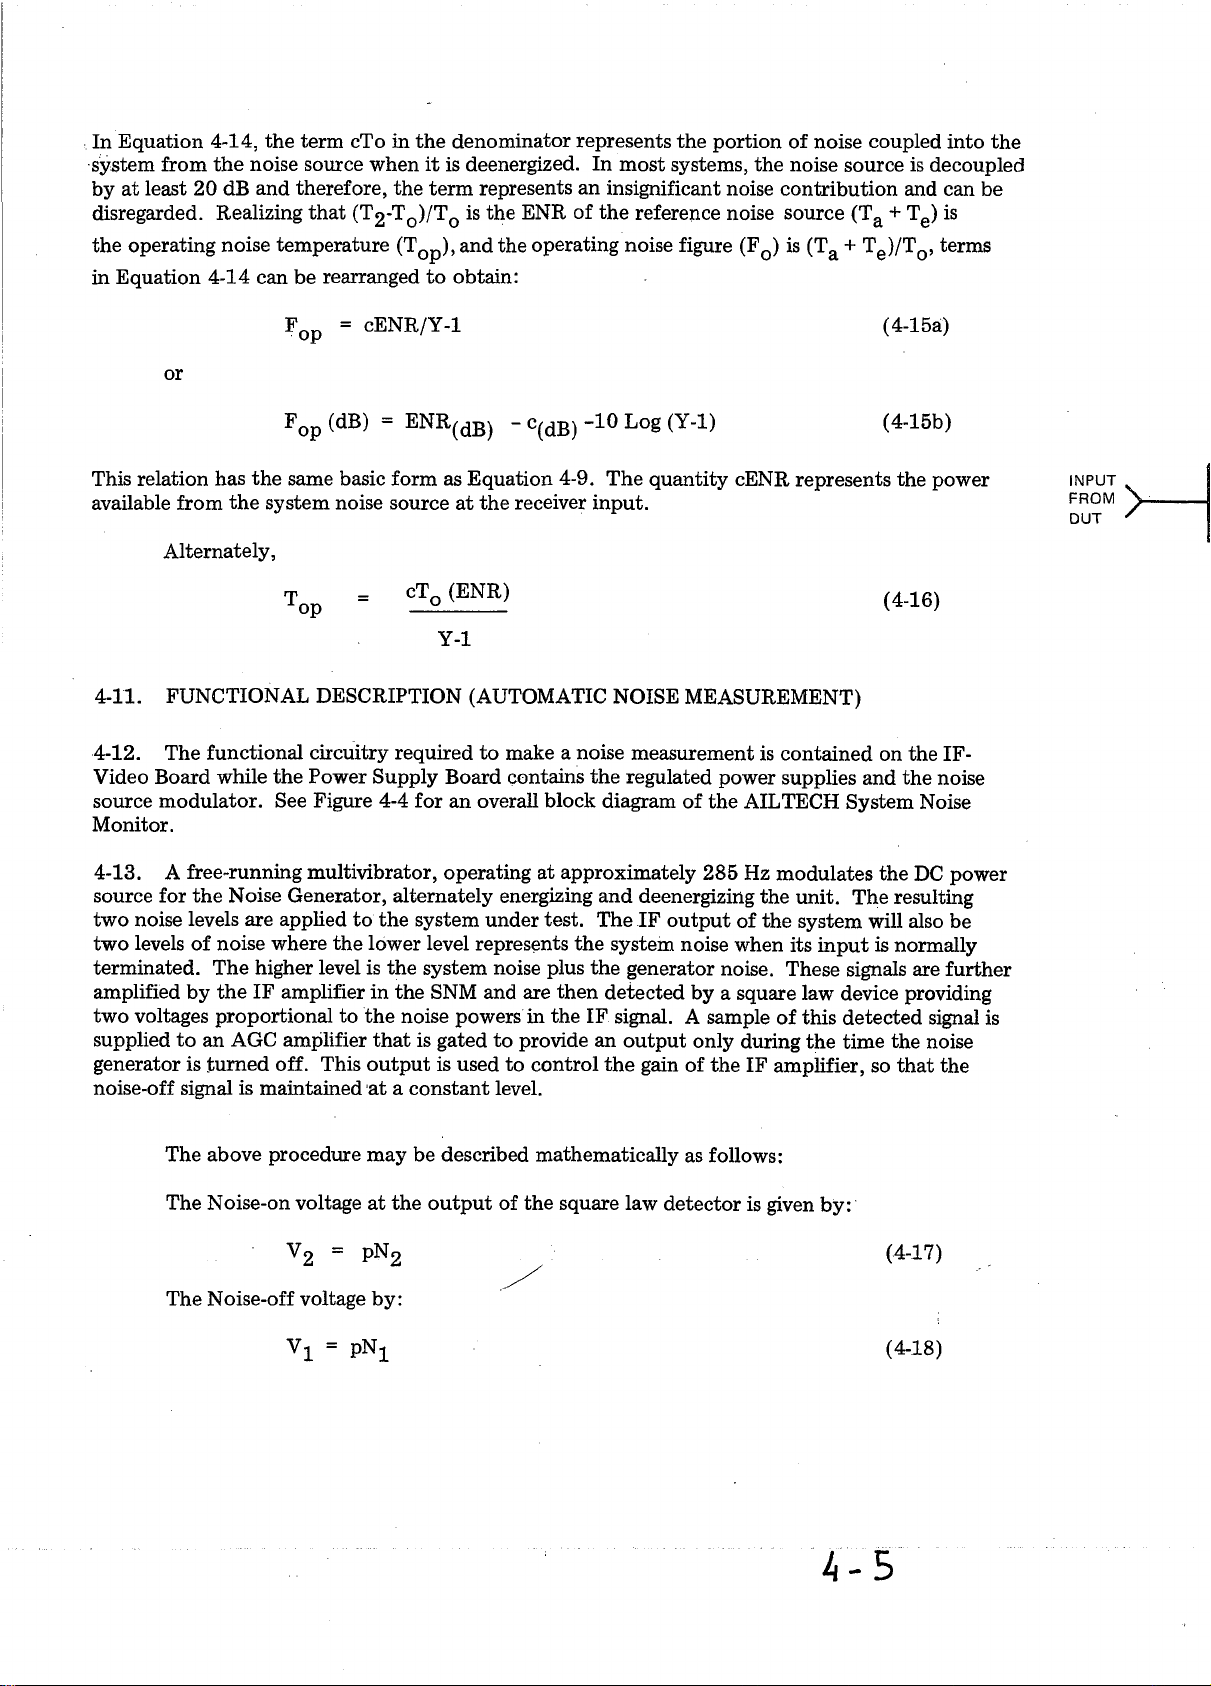
In Equation 4-14, the term cTo in the denominator represents the portion of noise coupled into the
system from the noise source when it is deenergized. In most systems, the noise source is decoupled
by at least 20 dB and therefore, the term represents an insignificant noise contribution and can be
disregarded. Realizing that (T2 -T0)/TQ is the ENR of the reference noise source (Ta + Tg) is
the operating noise temperature (TQp), and the operating noise figure (FQ) is (Ta + Te)/TQ, terms
in Equation 4-14 can be rearranged to obtain:
Fop = cENR/Y-1 (4-15a)
or
Fop (dB) = ENR(dB) - c(dB) -10 Log (Y -l) (4-15b)
This relation has the same basic form as Equation 4-9. The quantity cENR represents the power
available from the system noise source at the receiver input.
Alternately,
Top = cTq (ENR) (4-16)
Y-l
4-11. FUNCTIONAL DESCRIPTION (AUTOMATIC NOISE MEASUREMENT)
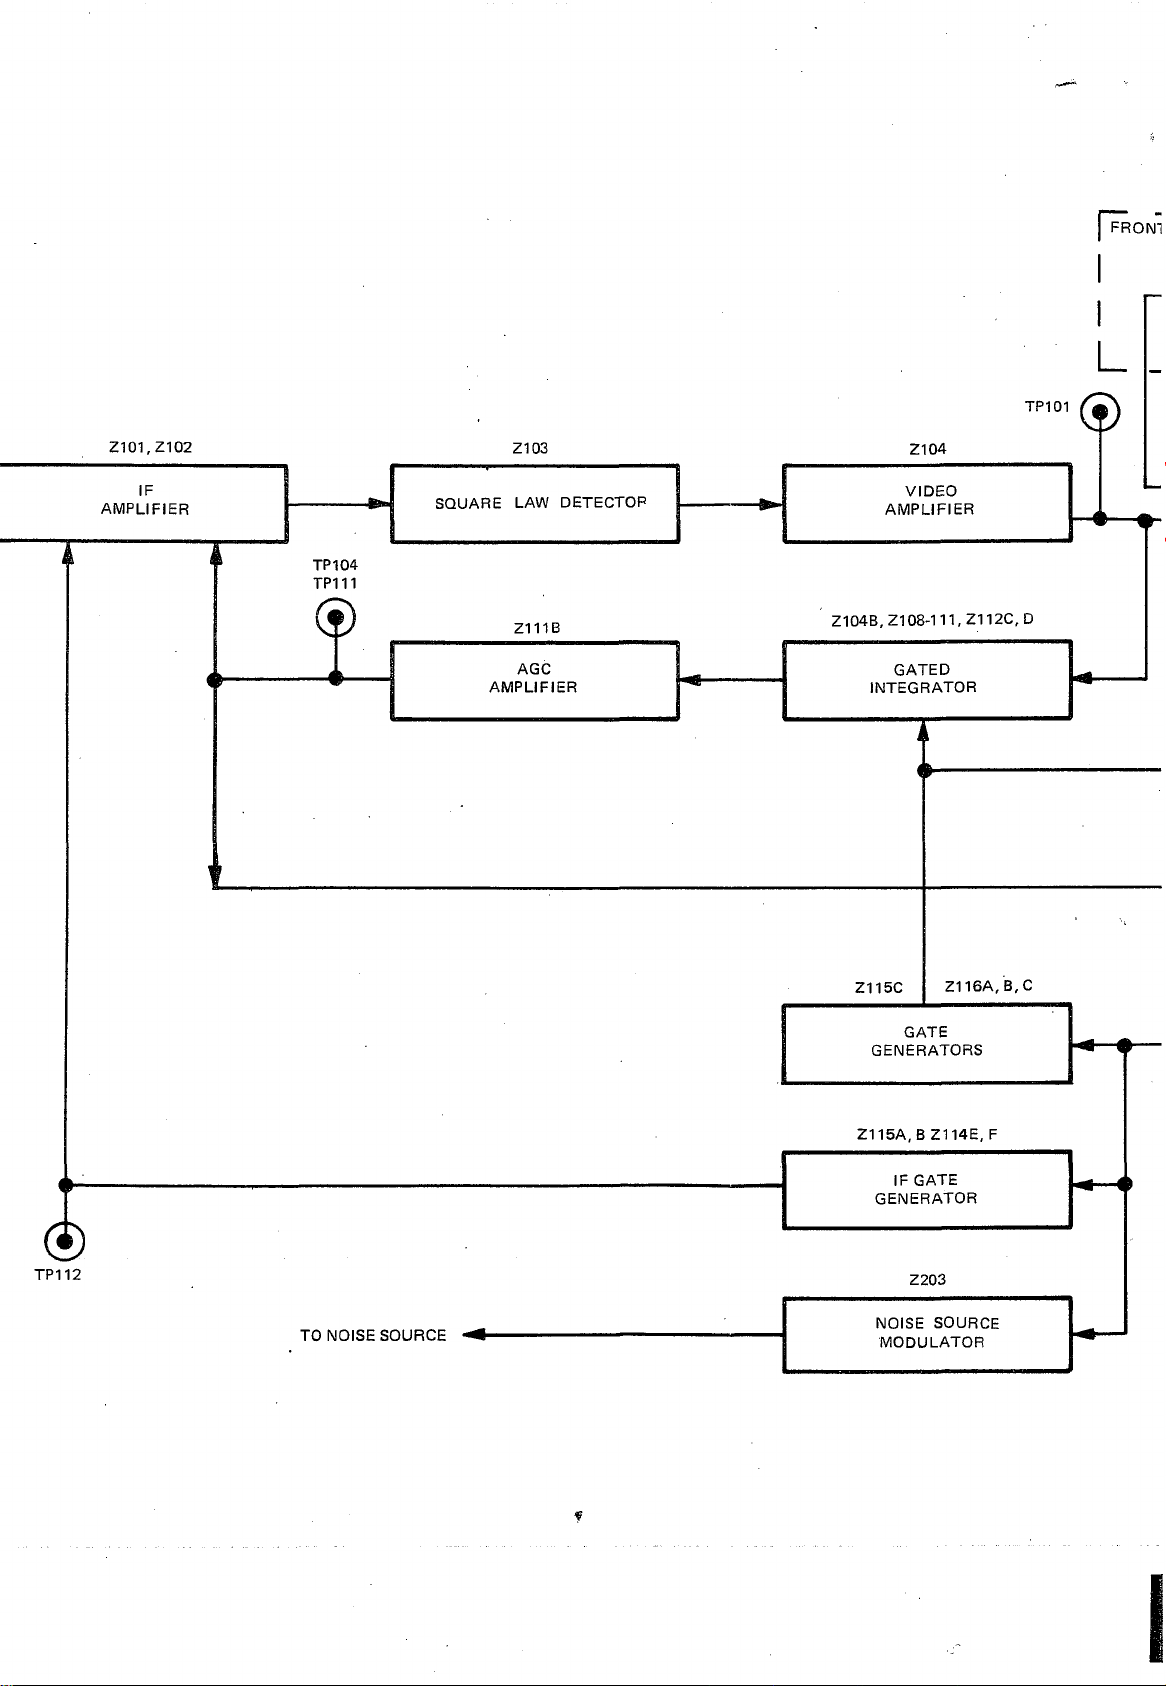
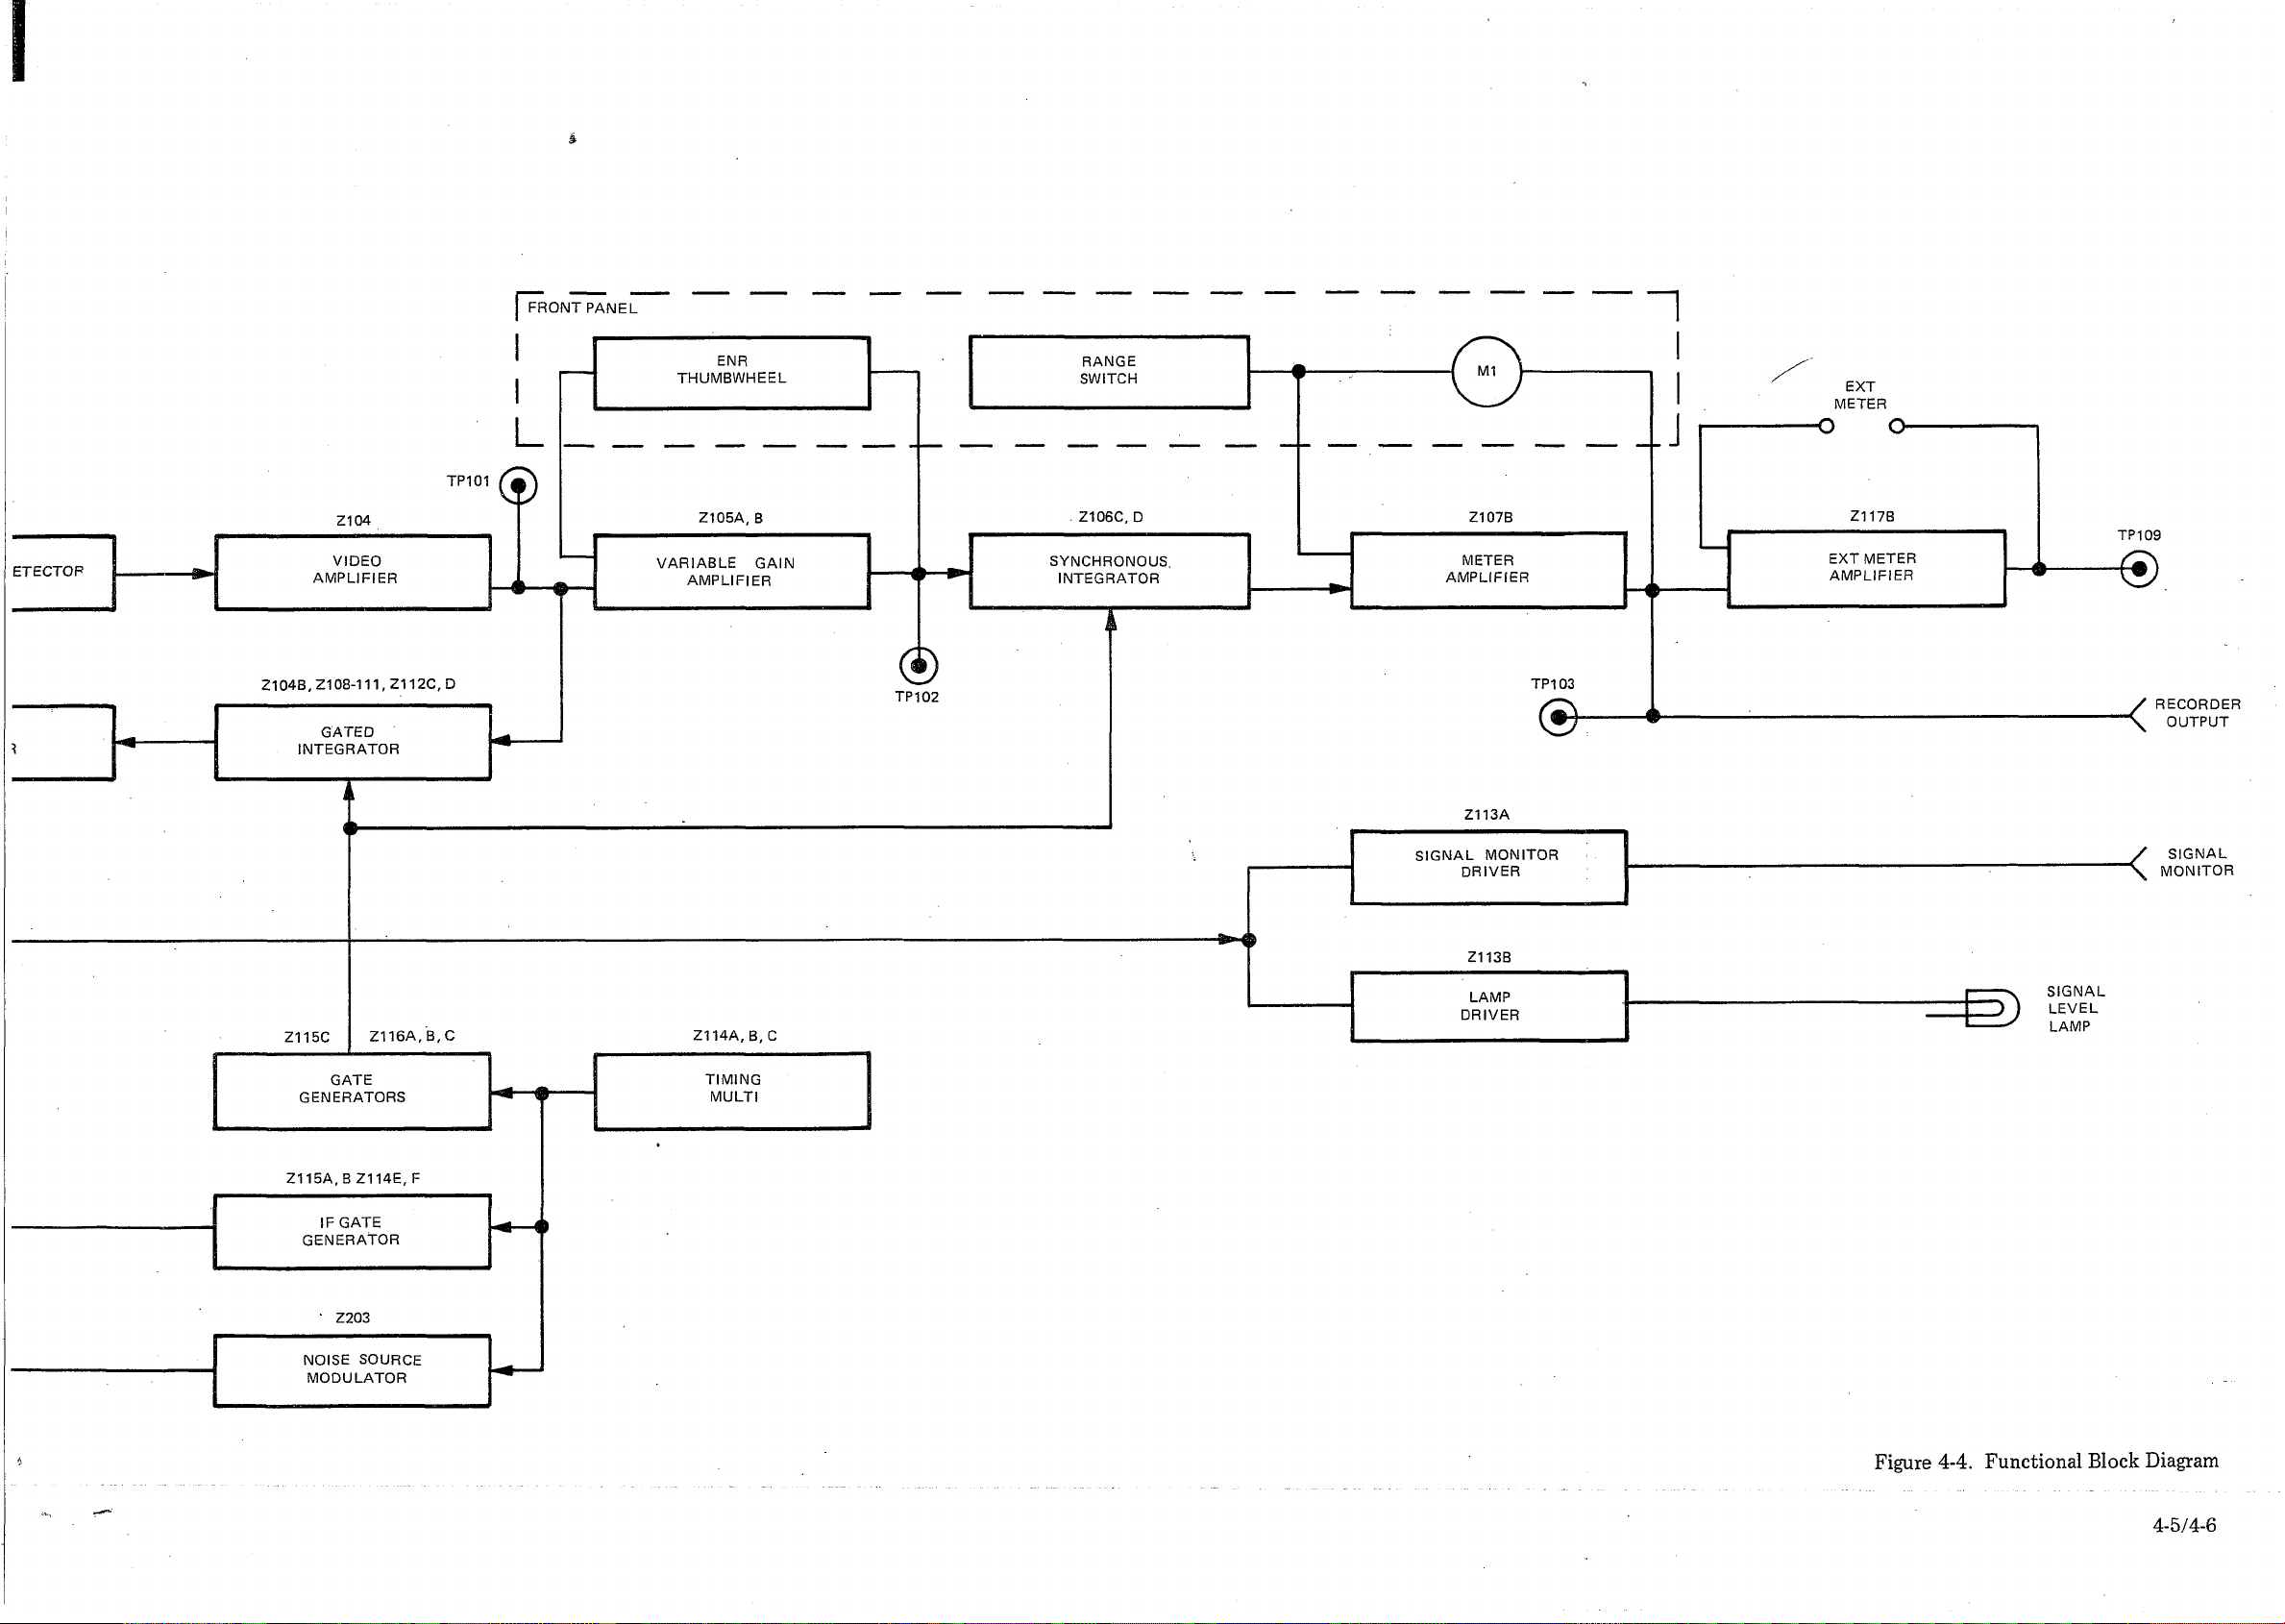
4-12. The functional circuitry required to make a noise measurement is contained on the IF-
Video Board while the Power Supply Board contains the regulated power supplies and the noise
source modulator. See Figure 4-4 for an overall block diagram of the AIL TECH System Noise
Monitor.
4-13. A free-running multivibrator, operating at approximately 285 Hz modulates the DC power
source for the Noise Generator, alternately energizing and deenergizing the unit. The resultin g
two noise levels are applied to the system under test. The IF output of the system will also be
two levels of noise where the lower level represents the system noise when its input is normally
terminated. The higher level is the system noise plus the generator noise. These signals are further
amplified by the IF amplifier in the SNM and are then detected by a square law device providing
two voltages proportional to the noise powers in the IF signal. A sample of this detected signal is
supplied to an AGC amplifier that is gated to provide an output only during the time the noise
generator is turned off. This output is used to control the gain of the IF amplifier, so that the
noise-off signal is maintained at a constant level.
INPUT
FROM
DUT
The above procedure may be described mathematically as follows:
The Noise-on voltage at the output of the square law detector is given by:
v 2 = PN2 (4-17)
The Noise-off voltage by:
v x = pNi (4-18)
Page 40
TP101
FRONT
F
L
T
Z101, Z102
IF
AMPLIFIER
Z103
SQUARE LAW DETECTOP
TP 104
TP111
Z111B
o
AGC
AMPLIFIER
Z104B, Z108-111, Z112C, D
Z104
VIDEO
AMPLIFIER
Z115C Z116A,B,C
(?)
TP112
TO NOISE SOURCE
Z115A, B Z114E, F
Z203
NOISE SOURCE
MODULATOR
f
Page 41
(" fro n t p a n e l
Figure 4-4. Functional Block Diagram
4-5/4-6
Page 42
s
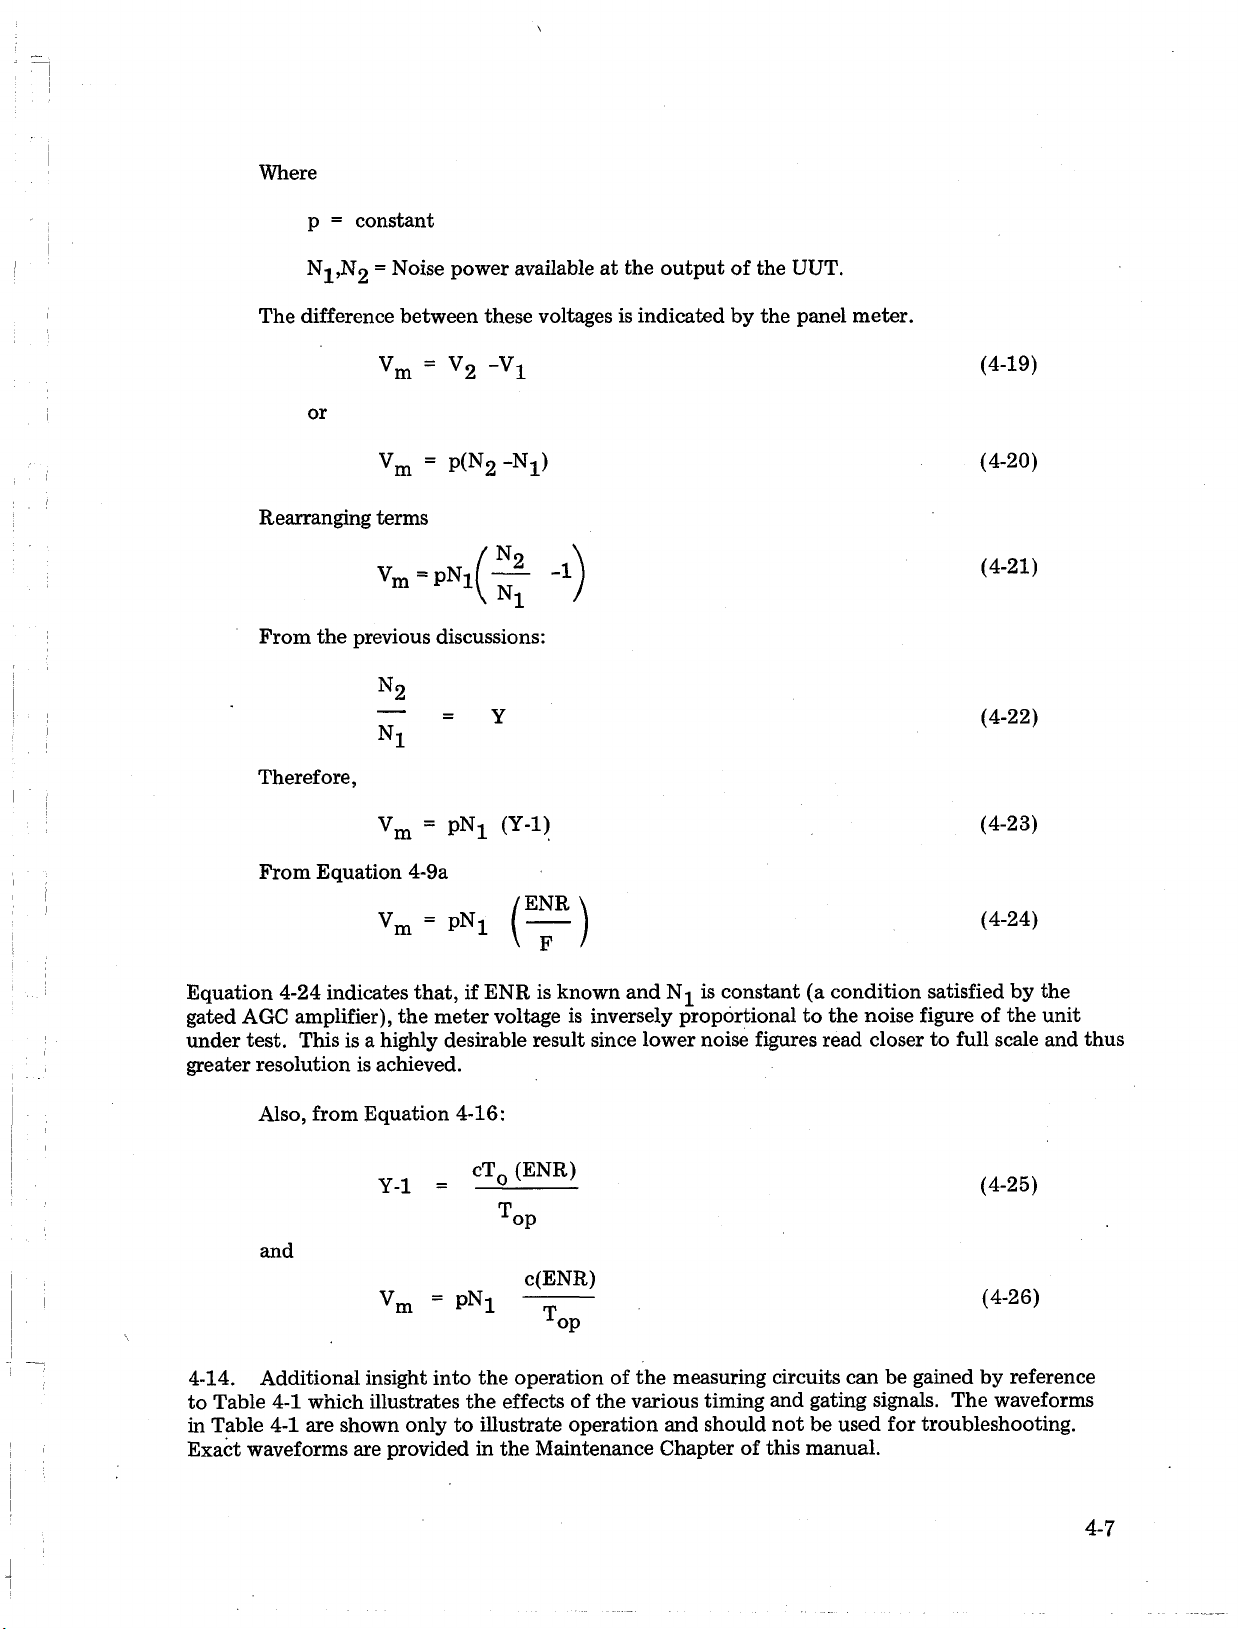
Where
p = constant
N i = Noise power available at the output of the UUT.
The difference between these voltages is indicated by the panel meter.
V = V 0 -Vi
v m v 2 v 1
or
Vm = P(N2 -N x)
Rearranging terms
N
Vm - pNi
2
N
1
From the previous discussions:
N2
— = Y
N i
Therefore,
Vm = PN1 (Y-1)
From Equation 4-9a
/ENR \
v m = PN ! —
-1
(4-19)
(4-20)
(4-21)
(4-22)
(4-23)
(4-24)
Equation 4-24 indicates that, if ENR is known and Nj_ is constant (a condition satisfied by the
gated AGC amplifier), the meter voltage is inversely proportional to the noise figure of the unit
under test. This is a highly desirable result since lower noise figures read closer to full scale and thus
greater resolution is achieved.
Also, from Equation 4-16:
Y-l = —
cT_ (ENR)
T,
------
op
!
(4-25)
and
c(ENR)
Vm = PN 1
op
(4-26)
4-14. Additional insight into the operation of the measuring circuits can be gained by reference
to Table 4-1 which illustrates the effects of the various timing and gating signals. The waveforms
in Table 4-1 are shown only to illustrate operation and should not be used for troubleshooting.
Exact waveforms are provided in the Maintenance Chapter of this manual.
4-7
Page 43
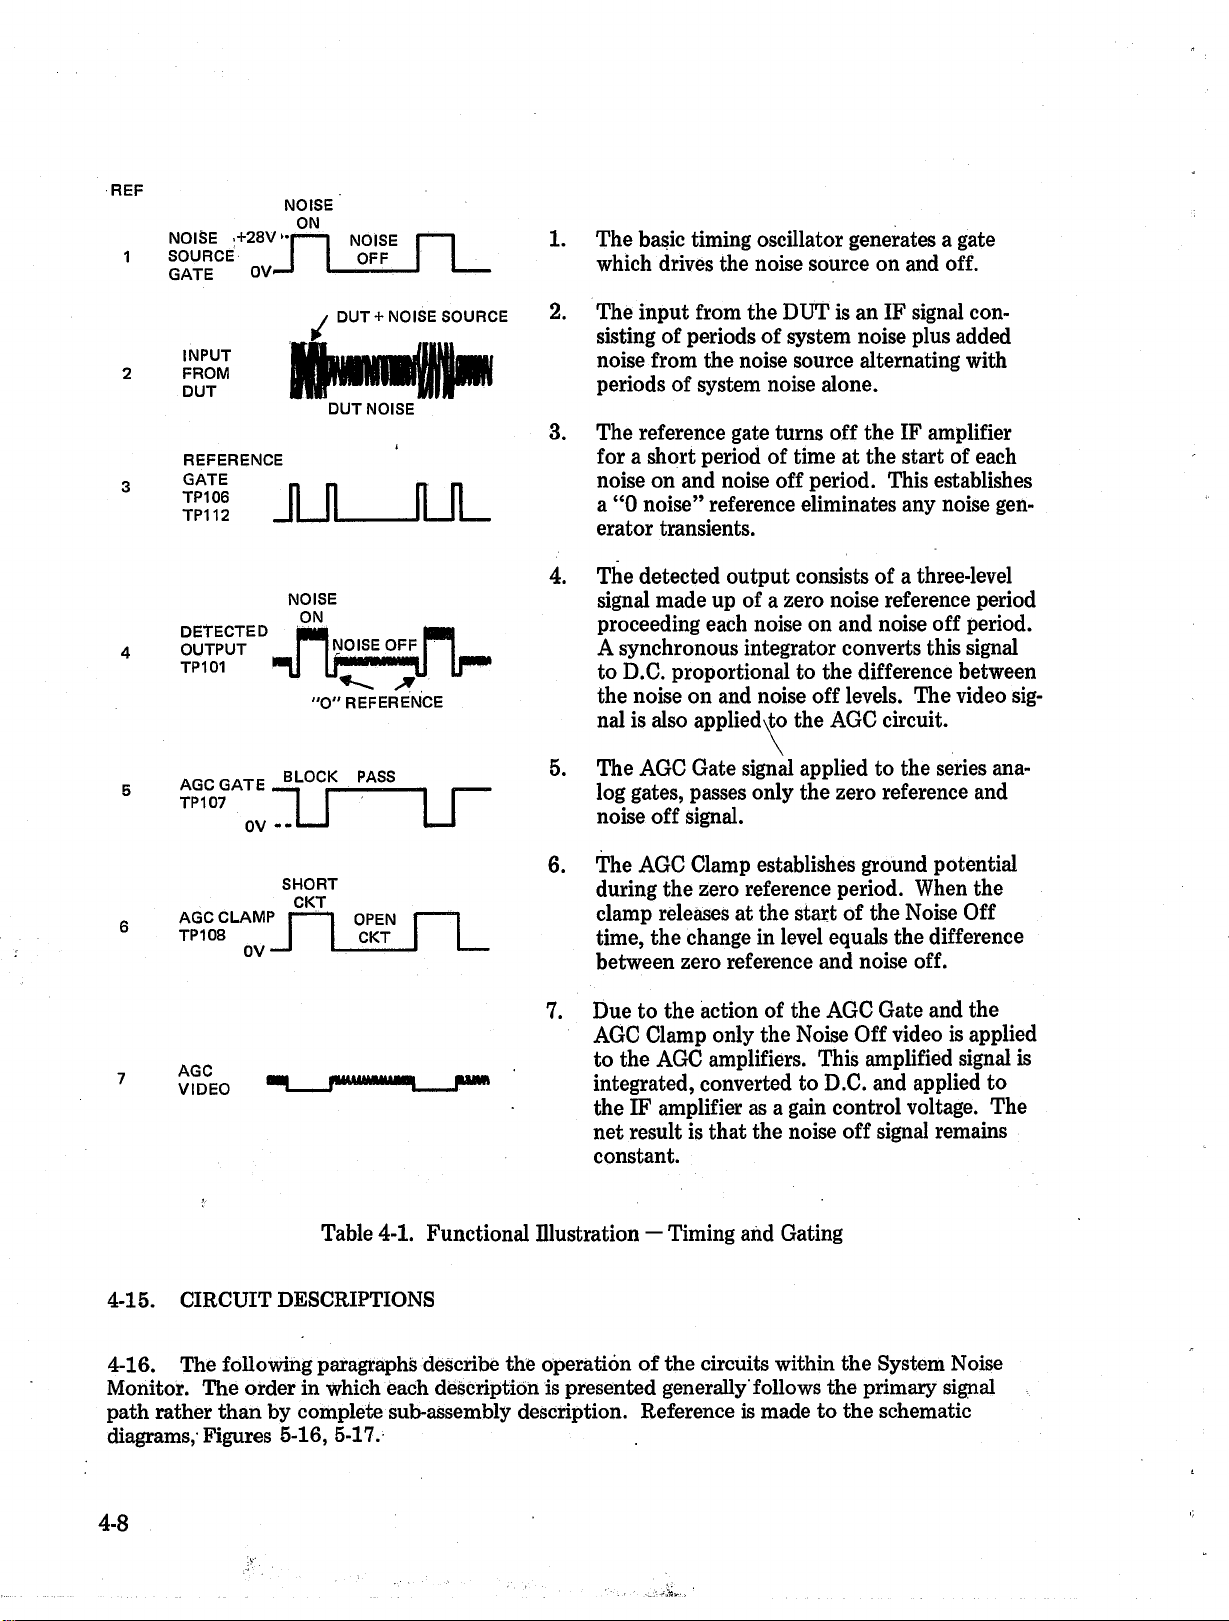
REF .
NOISE +28V —1 NOISE
1 SOURCE OFF
GATE 0V-
NOISE
ON
V j
-----
j NOISE p— I
1. The basic timing oscillator generates a gate
which drives the noise source on and off.
2 FROM
INPUT
DUT
REFERENCE
GATE
TP106
TP112 _
DETECTED
OUTPUT
TP 101
AGC GATE
TP 107
0V
AGC CLAMP I" 1 I OPEN
TP108 CKT
ip OPEN I— 1
0V-
DUT + NOISE SOURCE
DUT NOISE
ILJl
_ _
NOISE
ON
NOISE OFF
"O " REFERENCE
BLOCK PASS
L fl
*
i r “ L r
SHORT
CKT
I CKT I L _
2. The input from the DUT is an IF signal con
sisting of periods of system noise plus added
noise from the noise source alternating with
periods of system noise alone.
3. The reference gate turns off the IF amplifier
for a short period of time at the start of each
noise on and noise off period. This establishes
a “0 noise” reference eliminates any noise gen
erator transients.
4. The detected output consists of a three-level
signal made up of a zero noise reference period
proceeding each noise on and noise off period.
A synchronous integrator converts this signal
to D.C. proportional to the difference between
the noise on and noise off levels. The video sig
nal is also applied\to the AGC circuit.
5. The AGC Gate signal applied to the series ana
log gates, passes only the zero reference and
noise off signal.
6. The AGC Clamp establishes ground potential
during the zero reference period. When the
clamp releases at the start of the Noise Off
time, the change in level equals the difference
between zero reference and noise off.
7. Due to the action of the AGC Gate and the
AGC Clamp only the Noise Off video is applied
AGC
VIDEO
Table 4-1. Functional Illustration — Timing and Gating
4-15. CIRCUIT DESCRIPTIONS
4-16. The following paragraphs describe the operation of the circuits within the System Noise
Monitor. The order in which each description is presented generally follows the primary signal
path rather than by complete sub-assembly description. Reference is made to the schematic
diagrams, Figures 5-16, 5-17. .
to the AGC amplifiers. This amplified signal is
integrated, converted to D.C. and applied to
the IF amplifier as a gain control voltage. The
net result is that the noise off signal remains
constant.
4-8
Page 44
4-17. IF Amplifier. Signals applied to the IF input are transformer coupled via T101 to the
first IF amplifier, Z101. C154 is adjusted for best input match, and the center frequency of
the input stage is set by C102. T101 also provides a 2:1 voltage step-up.
4-18. The gain of the entire IF amplifier is controlled by application of the AGC signal to Z101.
In the manual mode of operation, the AGC signal is replaced by a DC voltage set by R140. The AGC
input will typically be between +5 volts at threshold and +7 volts at the high input level limit.
4-19. Additional IF gain is provided by Z102. The gain control input is driven by the IF gate
(Ref. 3, Table 4-1) to establish the zero noise reference. The IF gain of Z102 goes to zero when J
the gate signal goes positive. When MAN-AUTO switch S101 is set to the Manual mode, the
narrow pulse pair is replaced by the output of the timing generator.
4-20. The output of Z102 is transformer coupled in a balanced configuration to the square-law
detector. Cl 14 tunes the output circuit to the SNM center frequency.
4-21. In a typical unit operating at the sensitivity limit, the overall IF gain will be about 35 dB.
This will vary somewhat from unit to unit and at the various intermediate frequencies.
4-22. Square Law Detector. The detector, Z103, is a monolithic balanced modulator whose
output contains a term proportional to the product of its two inputs. If the inputs are in
parallel, then the output voltage is proportional to the square of the input voltage or the input
power.
4-23. Since the input signal has three amplitudes — noise on, noise off, and zero reference — the
detected output will be a three level signal with some low frequency noise on the noise on and
noise off levels (see Table 4-1, Ref. 4).
4-24. Variable Gain Amplifier. From equations 4-24 and 4-26 it can be seen that the cali
bration of the SNM for various noise generators with different ENR’s can be maintained by
changing the gain (proportionality constant) by the differences in dB. In the SNM, the calibra
tion for a specific ENR is established by the gain of the two-stage video amplifier cascade, made
up of Z105A and B. Each stage consists of an operational amplifier, operating in the inverting
feedback mode; thus, the gains are determined by the feedback resistor values. These resistor
networks are contained in 14 lead DIP’s and are selected by the front panel thumbwheel switch.
4-25. Synchronous Integrator and Meter Amplifier The three-level video signal is applied
to the series-shunt switch combination made up of Z106C and D. Z106C is driven by the
inverse of the AGC Clamp signal (Table 4-1, Ref. 6) clamping the output side of C140 to ground
during the Noise-Off period. Z106D is a series switch driven by the inverse of the AGC Gate
(Table 4-1, Ref. 5), and passes signals only during the Noise-on period. The clamping action of
Z106C causes the amplitude of the video pulse at R122 to be equal to the difference between the
Noise-On and Noise-Off signals. R122 and C131, in combination with Z107B form a non
inverting integrator with the meter in the feedback loop. R124 and R161 are calibration adjust
ments for the Low and High ranges respectively. R125 sets the voltage of the Recorder Output.
Z117B is used in a similar manner to drive an external meter. A 100 microamp, IK meter inserted
between R166 and R165 will track the excursions of the front panel indicator.
4-26. AGC Amplifier. The video output of Z104, the Video Driver (TP101) is also applied
to the AGC Amplifier. This circuit is comprised of a series of gates, clamps, and amplifiers
designed to provide a DC output proportional to the Noise-Off detector level. The high-gain
requirements of the circuitry are fulfilled by AC amplification to reduce DC drift problems.
4-9
Page 45
4-27. Z108A is a series switch that permits only the Zero Noise Reference and Noise Off
detector level to be applied to the first amplifier Z104B. Z108B clamps the input of Z104B to
ground except during the Noise O ff period. Z108C, Z108D, R131 and C134 make up a syn
chronous integrator similar to that described in 4-25 except that the DC level developed is pro
portional only to the Noise Off detector level.
4-28. The DC signal is chopped (converted to AC) by Z110A and B, amplified by Z109A, and
compared to a similarly chopped reference signal in differential amplifier Z111A. The reference
signal is developed by zener diode CR101 and the voltage divider made up of R129 and R130.
Z110C and Z110D convert the reference to AC in synchronism with the AGC signal. Z109B
provides equivalent amplification.
4-29. The output of Z111A is synchronously integrated by Z112C, Z112D, R137 and C137.
CR102 protects the analog gates from excessive reverse voltage when the input IF is below the AGC
threshold. Z111B provides additional DC amplification. The output at TP104 will vary from about
5 volts at threshold to about 7 volts at the upper signal level limit. The timing of the various gates
and clamps is shown on the simplified schematic. The video signal is out of proportion and is
shown for reference only.
4-30. Z113A provides the Signal Monitor output. Z113B drives the front panel Signal Level lamp
via Q101.
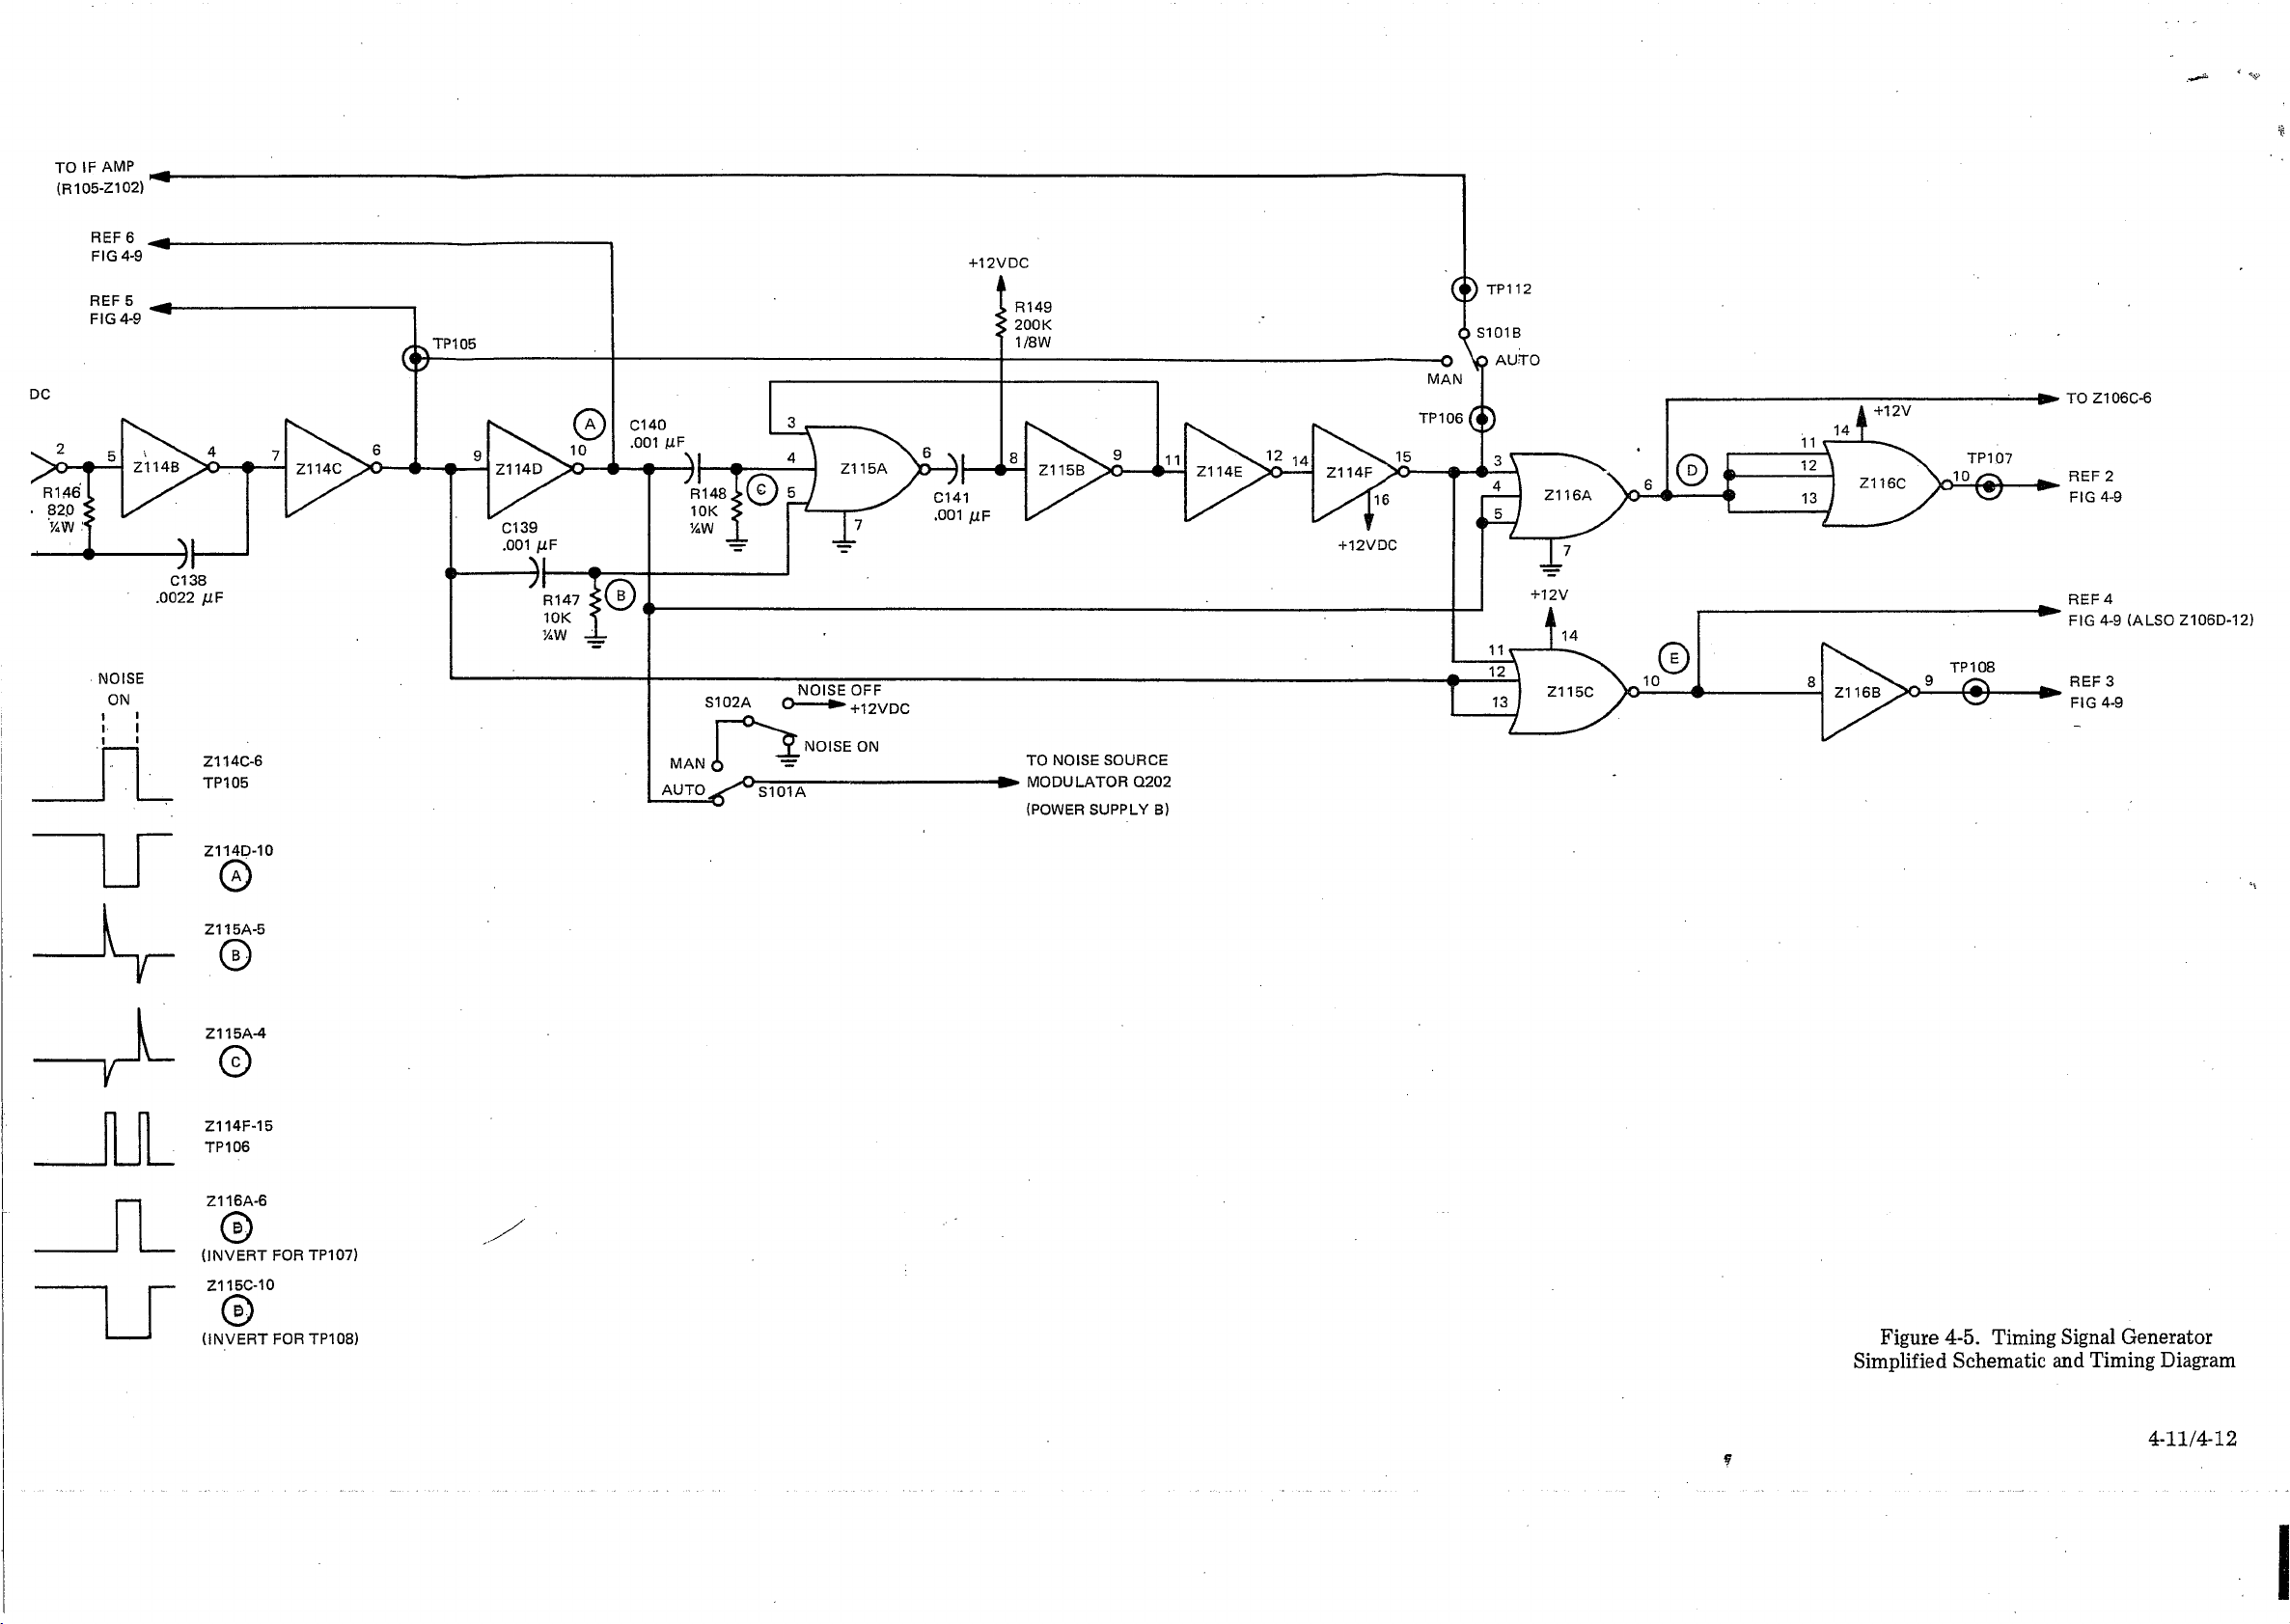
4-31. Timing Signal Generator (Figure 4-5). This circuit, consisting of three integrated circuit
packages, provides the timing signals for the various analog gates and switches and the modulation
gate for the noise source. Waveforms are shown on the simplified schematic, Figure 4-5, for ref
erence.
4-32. Z114A, Z114B, R146 and C138 make up a free-running oscillator which provides an
asymetrical rectangular signal at about 285 Hz. This signal is inverted by Z114C and is used to
drive the series switches of the AGC and AGC reference DC to AC converters and the final AGC
synchronous integrator (Z110B, Z110C and Z112D).
4-33. The output of Z114C is again inverted by Z114D. The signal is the gating input for the
noise source modulator and is also used to drive the shunt clamps in the AGC and AGC reference
DC to AC converters and the final AGC synchronous integrator (Z110A, Z110D and Z112C).
4-34. Z115A and Z115B make up a one-shot multivibrator driven alternately by the differentiated
outputs of Z114C and Z114D. Z115A is a three-input NOR gate; therefore, its output is low at all
times except when all three inputs are simultaneously low. This is illustrated by Table 4-2.
4-35. In the quiescent condition, the output of inverter Z115B is LOW because its input is re
turned through R149 to +12 volts. Thus, all three inputs of NOR-gate Z115A are LOW (R147 and
R148 returned to ground), and its output is HIGH. When the positive going edge of the signal at
Z114C output occurs, the input of Z115A is momentarily driven HIGH, causing its output to go
LOW. This drop in voltage appears at the input to Z115B and the inverter output goes HIGH.
Feedback to Z115A input causes the action to be regenerative, resulting in the output of Z115B
being driven rapidly to +12 volts where it remains until C141 is charged to a sufficiently positive
voltage for Z115B to start conducting. The regenerative action then reverses, and the output of
Z115B is rapidly driven to zero. The time constant is such that the resulting pulse is about 100 mi
croseconds wide. The entire sequence repeats on the positive going edge of the output from Z114D.
4-36. The overall result, after two inversions through Z114E and Z114F, is a positive pulse at the
start of each Noise On and Noise Off period. This signal is used to gate the second IF amplifier
(Z102) off, establishing the zero noise reference. .
4-10
0
Page 46
Z114D-10
Z115A-4
Z114F-15
TP 106
Z116A-6
©
(INVERT FOR TP107)
Z115C-10
©
(INVERT FOR TP108)
Figure 4-5. Timing Signal Generator
Simplified Schematic and Timing Diagram
4- 1 1/ 4 - 1 2
Page 47
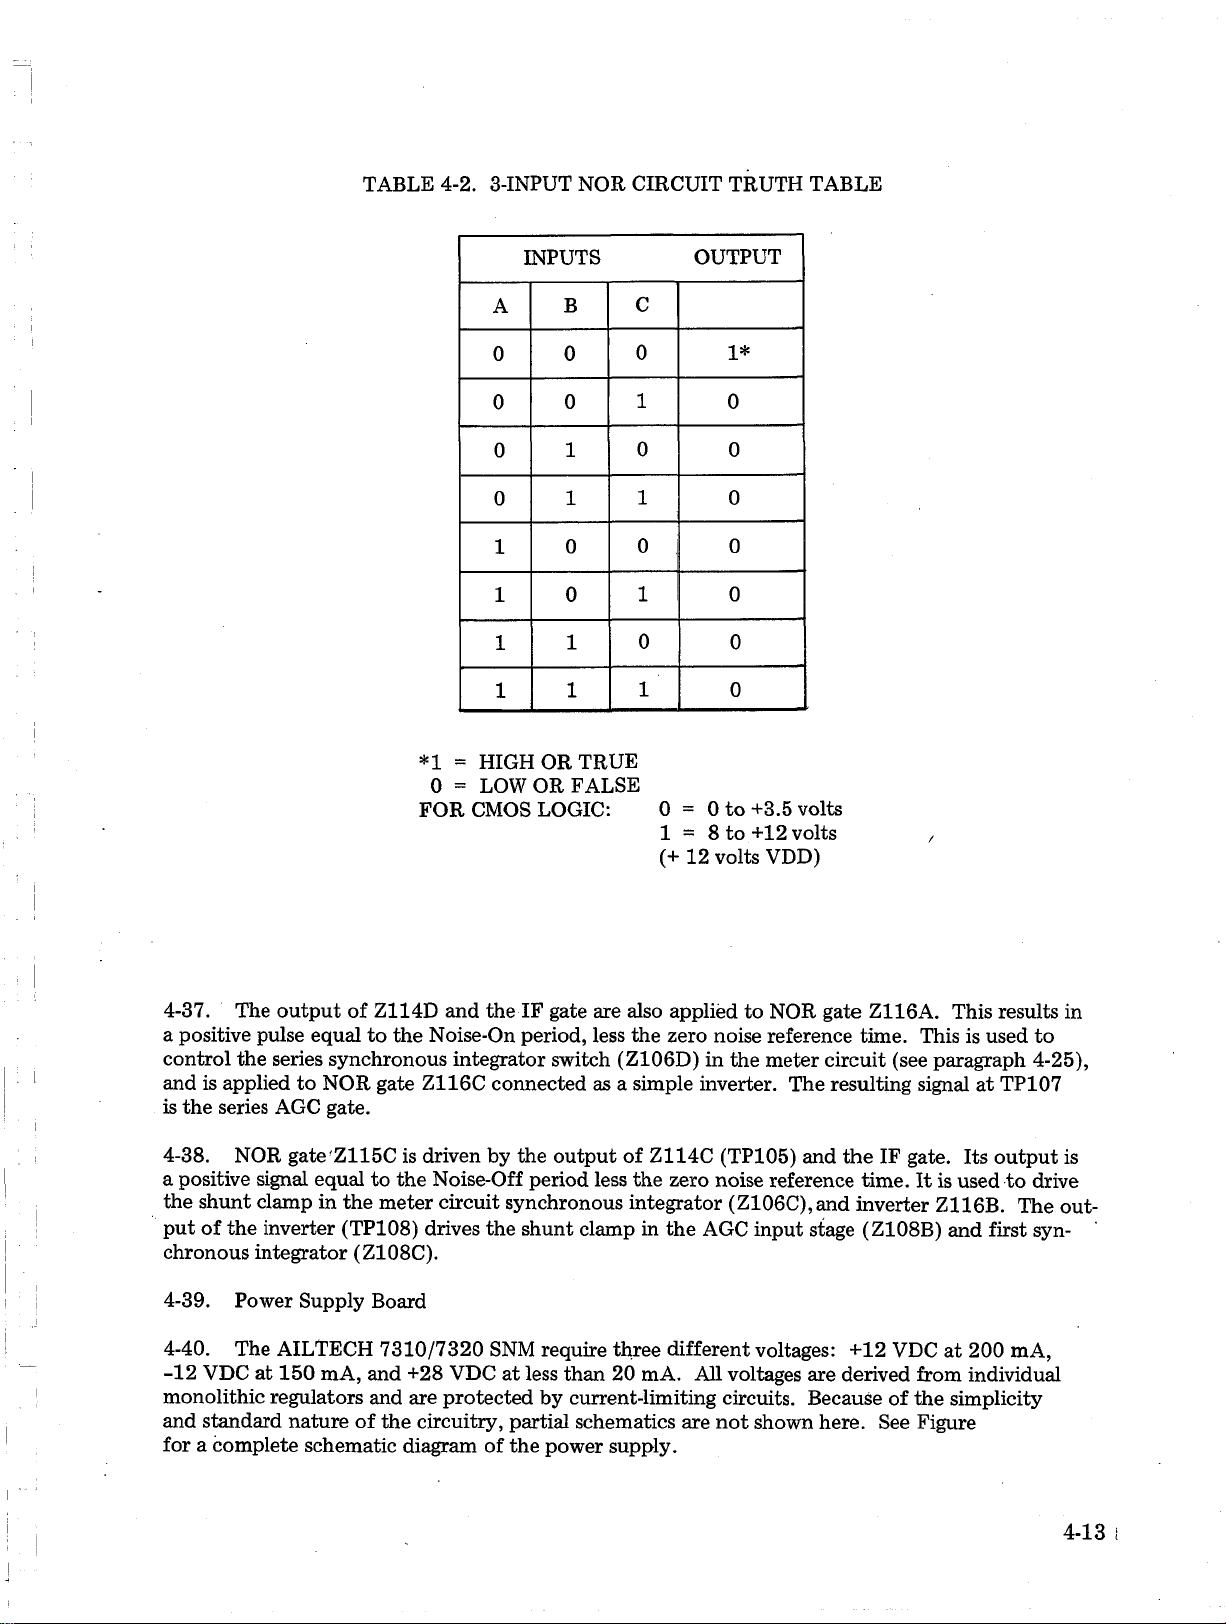
TABLE 4-2. 3-INPUT NOR CIRCUIT TRUTH TABLE
INPUTS OUTPUT
A
0 0
0
0
0
1
1 0
1
1
*1 = HIGH OR TRUE
0 = LOW OR FALSE
FOR CMOS LOGIC: 0 = 0 to +3.5 volts
B
0
1
1
0
1
1
c
0 1*
1
0
1
0 0
1 0
0
1
1 = 8 to +12 volts
(+ 12 volts VDD)
0
0
0
0
0
4-37. The output of Z114D and the IF gate are also applied to NOR gate Z116A. This results in
a positive pulse equal to the Noise-On period, less the zero noise reference time. This is used to
control the series synchronous integrator switch (Z106D) in the meter circuit (see paragraph 4-25),
and is applied to NOR gate Z116C connected as a simple inverter. The resulting signal at TP107
is the series AGC gate.
4-38. NOR gate'Z115C is driven by the output of Z114C (TP105) and the IF gate. Its output is
a positive signal equal to the Noise-Off period less the zero noise reference time. It is used to drive
the shunt clamp in the meter circuit synchronous integrator (Z106C),and inverter Z116B. The out
put of the inverter (TP108) drives the shunt clamp in the AGC input stage (Z108B) and first syn
chronous integrator (Z108C).
4-39. Power Supply Board
4-40. The AILTECH 7310/7320 SNM require three different voltages: +12 VDC at 200 mA,
-12 VDC at 150 mA, and +28 VDC at less than 20 mA. All voltages are derived from individual
monolithic regulators and are protected by current-limiting circuits. Because of the simplicity
and standard nature of the circuitry, partial schematics are not shown here. See Figure
for a complete schematic diagram of the power supply.
Page 48
\
4-41. +12 Volt Regulator. The +12 volt output from Z201 is set by resistors R204, R205, and
R206. Resistor R205 adjusts the +12 volt supply used to set certain threshold levels on the IF
Video Board. The short circuit current of the +12 volt supply is determined by resistor R201.
Capacitor C203 is a compensation capacitor while capacitor C204 acts as a noise filter.
4-42. -12 Volt Regulator. The -12 volt supply is regulated by Z202. Resistor R207 and R208
determine the exact value of the regulated output, which may vary from -11.8 VDC to -12.2 VDC.
The short circuit current for the -12 volt supply is determined by resistor R209. Capacitor C208 is
the compensation capacitor, while capacitor C207 filters noise.
4-43. +28 Volt Noise Source Supply. The +28 VDC supply is regulated by Z203. A remote shut
down feature is designed into this supply to permit modulation by the 285 Hz clock on the IF
Video Board. Transistor Q202 provides this capability. The 28-volt output can be precisely set
by variable resistor R215. Resistor R212 provides short circuit protection. This supply is used
exclusively to power the noise source.
4-14
Page 49
CHAPTER V
MAINTENANCE AND ADJUSTMENTS
5-1. GENERAL
5-2. This Chapter contains Performance Verification, Adjustments, and Troubleshooting.
Schematics, printed circuit board component locations, and wiring diagrams will be found in the
Troubleshooting section. Spares and replaceable parts are in Chapter VI.
5-3. PERFORMANCE VERIFICATION
5-4. The following procedures (recommended at 90 day intervals) are designed to insure the user
that his AILTECH 7310 or 7320 is operating within specifications. Only those specifications critical
to performance are checked. In some cases, more than one specification is verified by the same pro
cedure. Where a specification is a function of adjustment, reference is made to the paragraph
describing that adjustment.
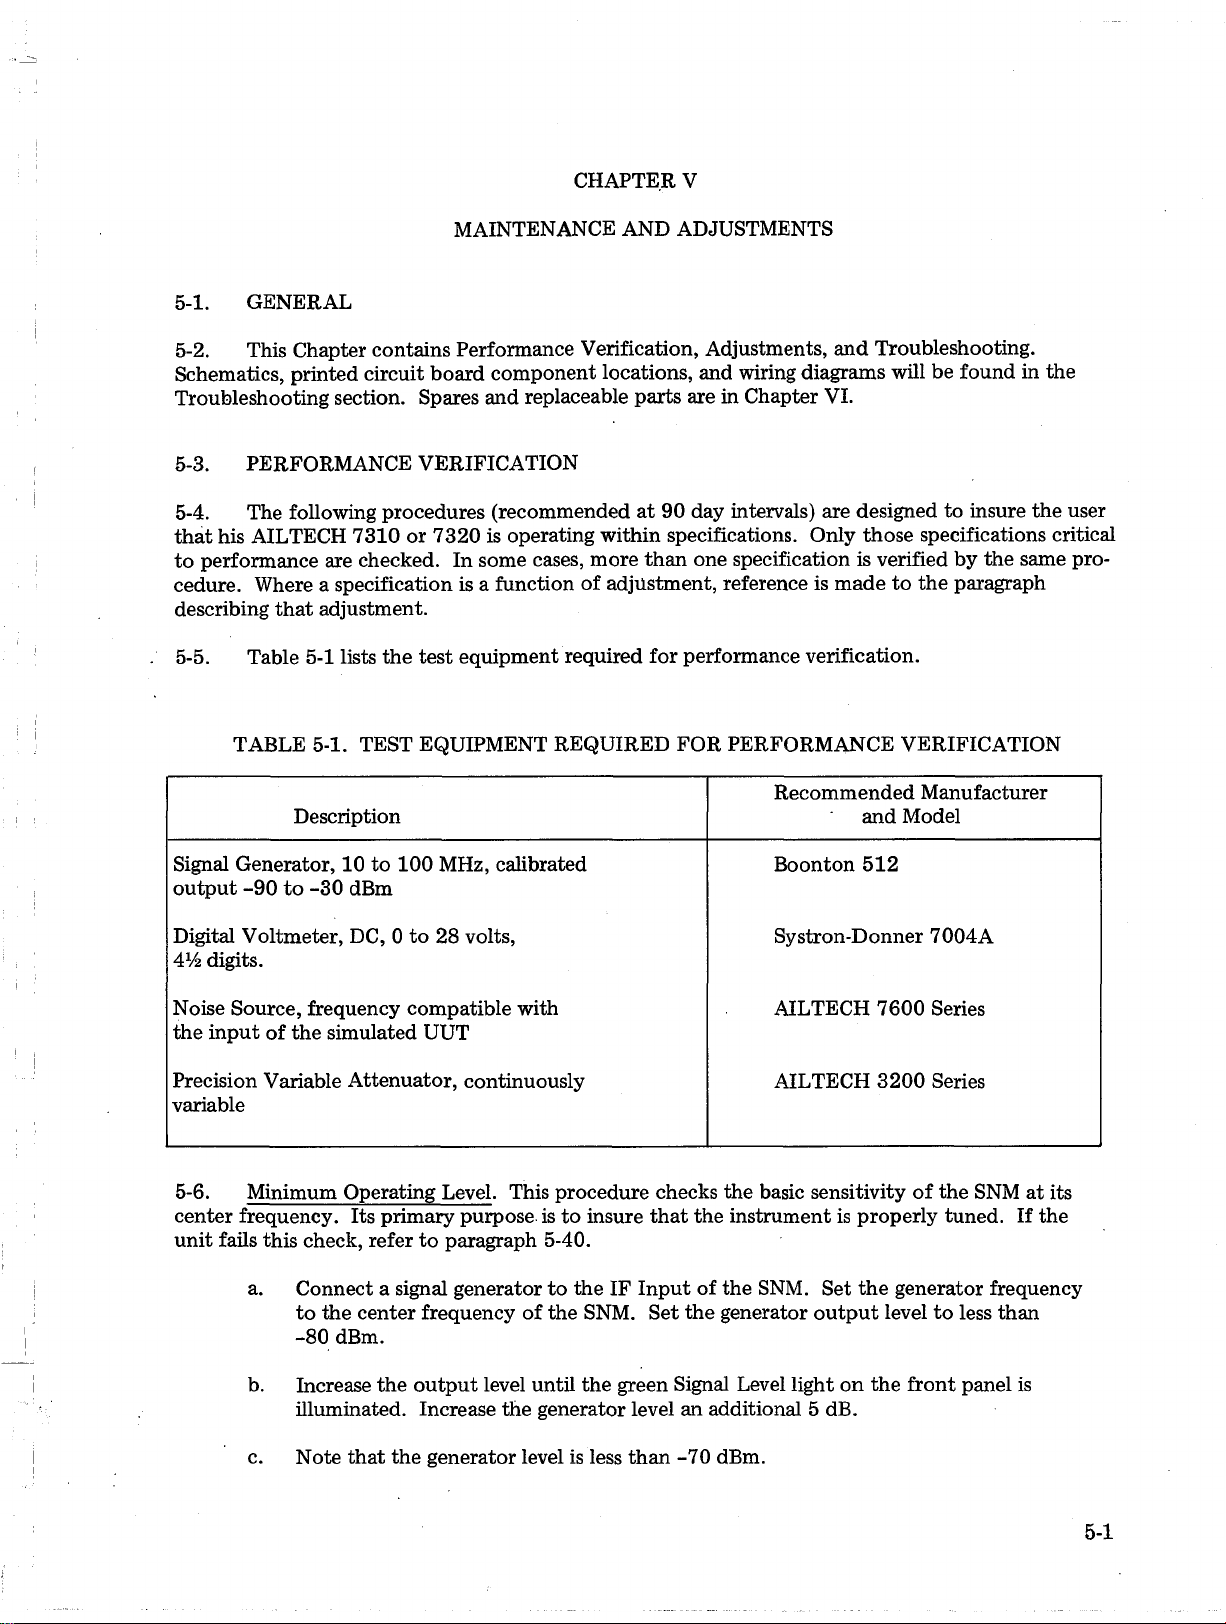
5-5. Table 5-1 lists the test equipment required for performance verification.
TABLE 5-1. TEST EQUIPMENT REQUIRED FOR PERFORMANCE VERIFICATION
Recommended Manufacturer
Description
Signal Generator, 10 to 100 MHz, calibrated
output -90 to -30 dBm
Digital Voltmeter, DC, 0 to 28 volts,
AlA digits.
Noise Source, frequency compatible with
the input of the simulated UUT
Precision Variable Attenuator, continuously
variable
5-6. Minimum Operating Level. This procedure checks the basic sensitivity of the SNM at its
center frequency. Its primary purpose is to insure that the instrument is properly tuned. If the
unit fails this check, refer to paragraph 5-40.
a. Connect a signal generator to the IF Input of the SNM. Set the generator frequency
to the center frequency of the SNM. Set the generator output level to less than
-80 dBm.
Boonton 512
Systron-Donner 7004A
AILTECH 7600 Series
AILTECH 3200 Series
and Model
b. Increase the output level until the green Signal Level light on the front panel is
illuminated. Increase the generator level an additional 5 dB.
c. Note that the generator level is less than -70 dBm.
5 -1
Page 50
5-7. Noise Generator Power. The purpose of this check is to insure that the voltage applied to
the solid state noise generators is within specified limits. This voltage determines the excess noise
ratio of the noise generator and the subsequent overall accuracy of the noise figure or temperature
measurement. If the unit fails this check, refer to paragraph 5-40.
a. Connect a DVM to The Noise Source Output Connector.
b. Set AUTO-MAN switch S101 to MAN. Set Noise Generator ON-OFF switch S102 to
OFF. Note that the DVM indicates less than 0.3 volts.
c. Set Noise Generator ON-OFF switch S102 to ON. Note that the DVM indicates 28.00
+0.05 volts.
d. Disconnect the DVM. Connect an oscilloscope to the Noise Source output. Set
AUTO-MAN switch S101 to AUTO, Noise Generator ON-OFF switch S102 to OFF.
Note that the waveform is an asymmetrical rectangular waveshape with a positive level
of +28 volts and a low level of zero.
5-8. Accuracy. This specification is defined as the maximum permissible deviation of the SNM
indication (operating in the normal, automatic mode) from a manual Y-factor measurement on the
same unit-under-test (UUT). The accuracy is checked by making a manual Y-factor measurement,
calculating noise figure or temperature, and comparing the result to the automatic indication. In
general, it is good practice to make several manual measurements and average the results. The man
ual measurement procedure was detailed in paragraph 3-44 and is repeated here for convenience.
a. Set up the equipment as shown in Figure 5-1. See paragraph 5-9 for UUT require
ments.
b. Remove the top cover and locate MAN-AUTO switch S101, Noise Generator switch
S102, and Manual Gain Control R140 on the IF-Video Board. (See Figure 3-5.)
c. Set MAN-AUTO switch S101 to MAN and Noise Generator switch S102 to OFF.
d. Set The Precision Attenuator to 0 dB, and adjust Manual GAIN control R140 for a
convenient reference indication on the upper 50% of the meter scale (preferably with
the RANGE switch in LOW). If the signal level is too low to achieve this condition,
the ENR thumbwheel switch may be set to a lower number. If the signal is still too
low, switch to the HIGH range. Note the meter indication.
e. Set Noise Generator switch S102 to ON. Note that the meter indication goes to the
right.
f. Increase the setting of the Precision Attenuator until the meter indication returns to
the reference noted in (d). Record the attenuation change. This is the Y-factor in
dB.
g. Set Noise Generator ON-OFF switch S102 to OFF. Return the Precision Attenuator
to its original setting. If the meter is not within +0.05 dB of the original reference,
repeat the measurement.
5-2
h. Calculate Noise Figure or Operating Noise Temperature, as required, from Equations
3-2, the AILTECH Noise Figure Slide Rule, or Figure 3-7.
Page 51
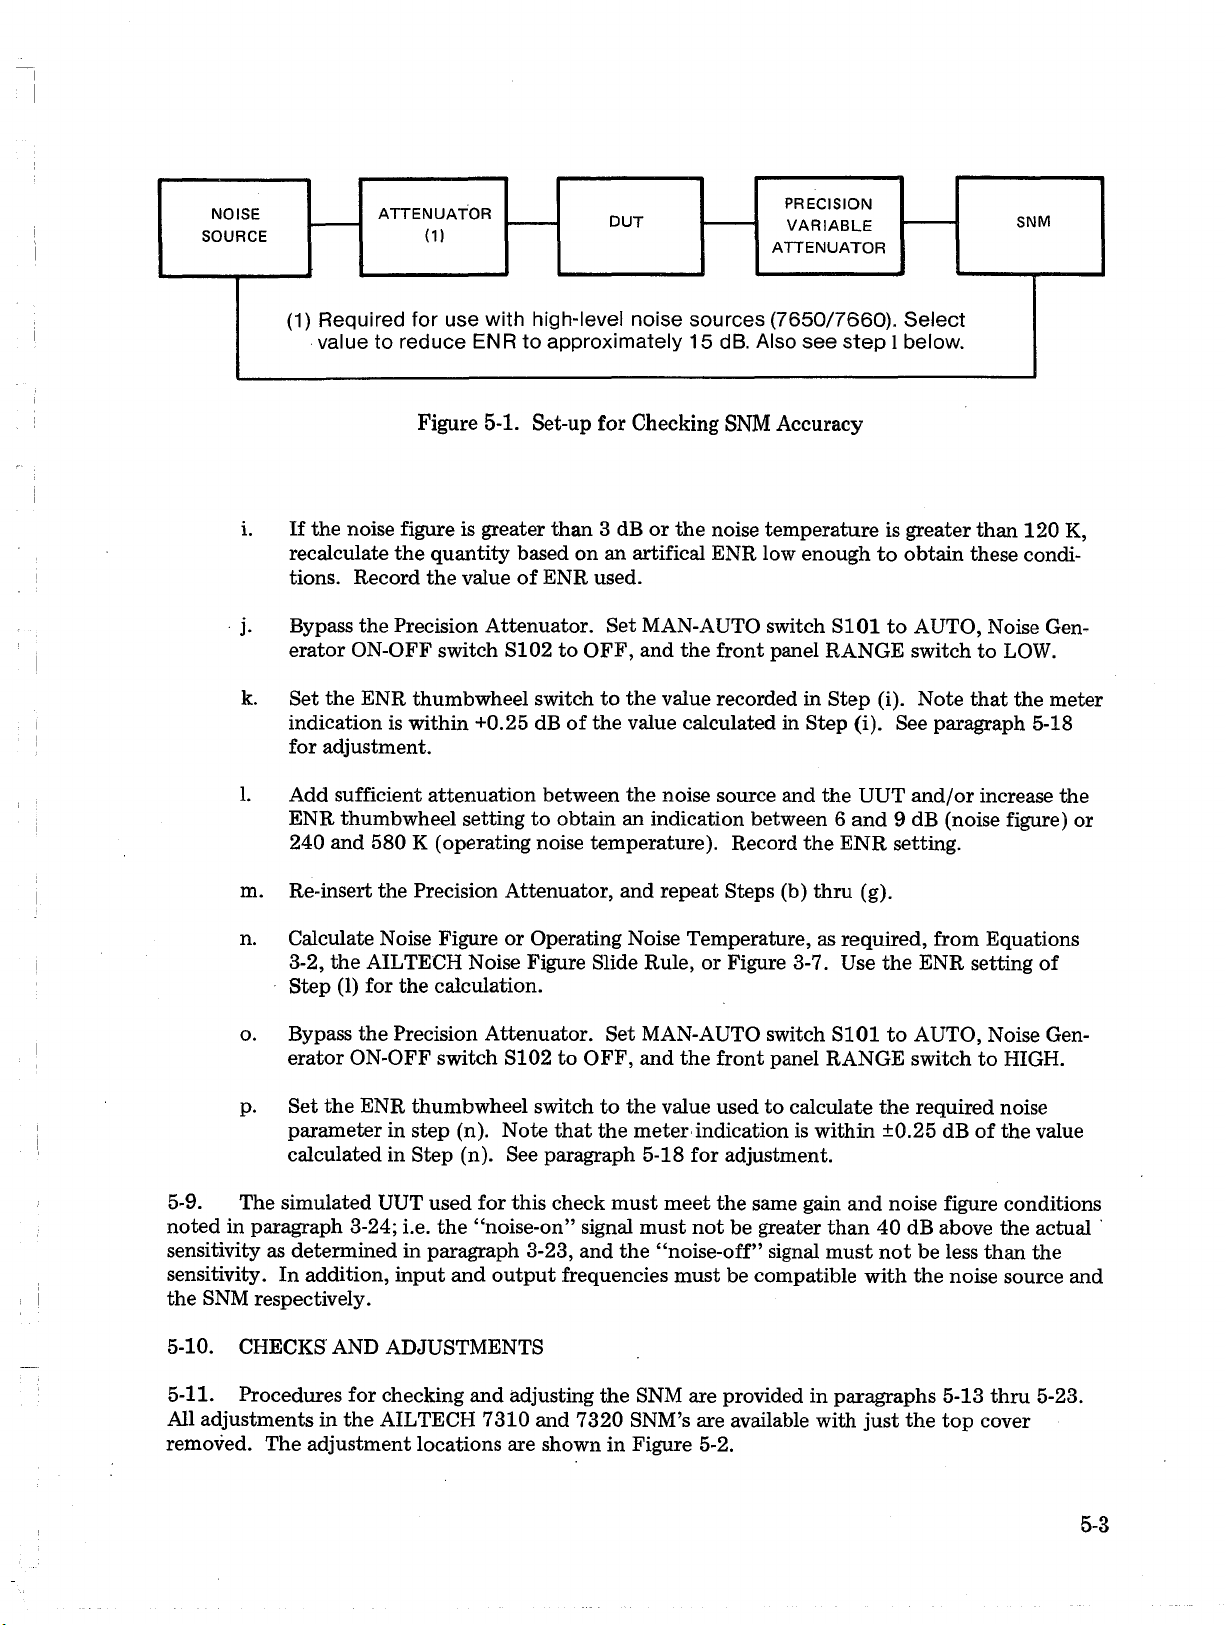
Figure 5-1. Set-up for Checking SNM Accuracy
i. If the noise figure is greater than 3 dB or the noise temperature is greater than 120 K,
recalculate the quantity based on an artifical ENR low enough to obtain these condi
tions. Record the value of ENR used.
j. Bypass the Precision Attenuator. Set MAN-AUTO switch S I01 to AUTO, Noise Gen
erator ON-OFF switch S102 to OFF, and the front panel RANGE switch to LOW.
k. Set the ENR thumbwheel switch to the value recorded in Step (i). Note that the meter
indication is within +0.25 dB of the value calculated in Step (i). See paragraph 5-18
for adjustment.
1. Add sufficient attenuation between the noise source and the UUT and/or increase the
ENR thumbwheel setting to obtain an indication between 6 and 9 dB (noise figure) or
240 and 580 K (operating noise temperature). Record the ENR setting.
m. Re-insert the Precision Attenuator, and repeat Steps (b) thru (g).
n. Calculate Noise Figure or Operating Noise Temperature, as required, from Equations
3-2, the AILTECH Noise Figure Slide Rule, or Figure 3-7. Use the ENR setting of
Step (1) for the calculation.
o. Bypass the Precision Attenuator. Set MAN-AUTO switch S101 to AUTO, Noise Gen
erator ON-OFF switch S102 to OFF, and the front panel RANGE switch to HIGH.
p. Set the ENR thumbwheel switch to the value used to calculate the required noise
parameter in step (n). Note that the meter indication is within ±0.25 dB of the value
calculated in Step (n). See paragraph 5-18 for adjustment.
5-9. The simulated UUT used for this check must meet the same gain and noise figure conditions
noted in paragraph 3-24; i.e. the “ noise-on” signal must not be greater than 40 dB above the actual
sensitivity as determined in paragraph 3-23, and the “ noise-off” signal must not be less than the
sensitivity. In addition, input and output frequencies must be compatible with the noise source and
the SNM respectively.
5-10. CHECKS AND ADJUSTMENTS .
5-11. Procedures for checking and adjusting the SNM are provided in paragraphs 5-13 thru 5-23.
All adjustments in the AILTECH 7310 and 7320 SNM’s are available with just the top cover
removed. The adjustment locations are shown in Figure 5-2.
5-3
Page 52
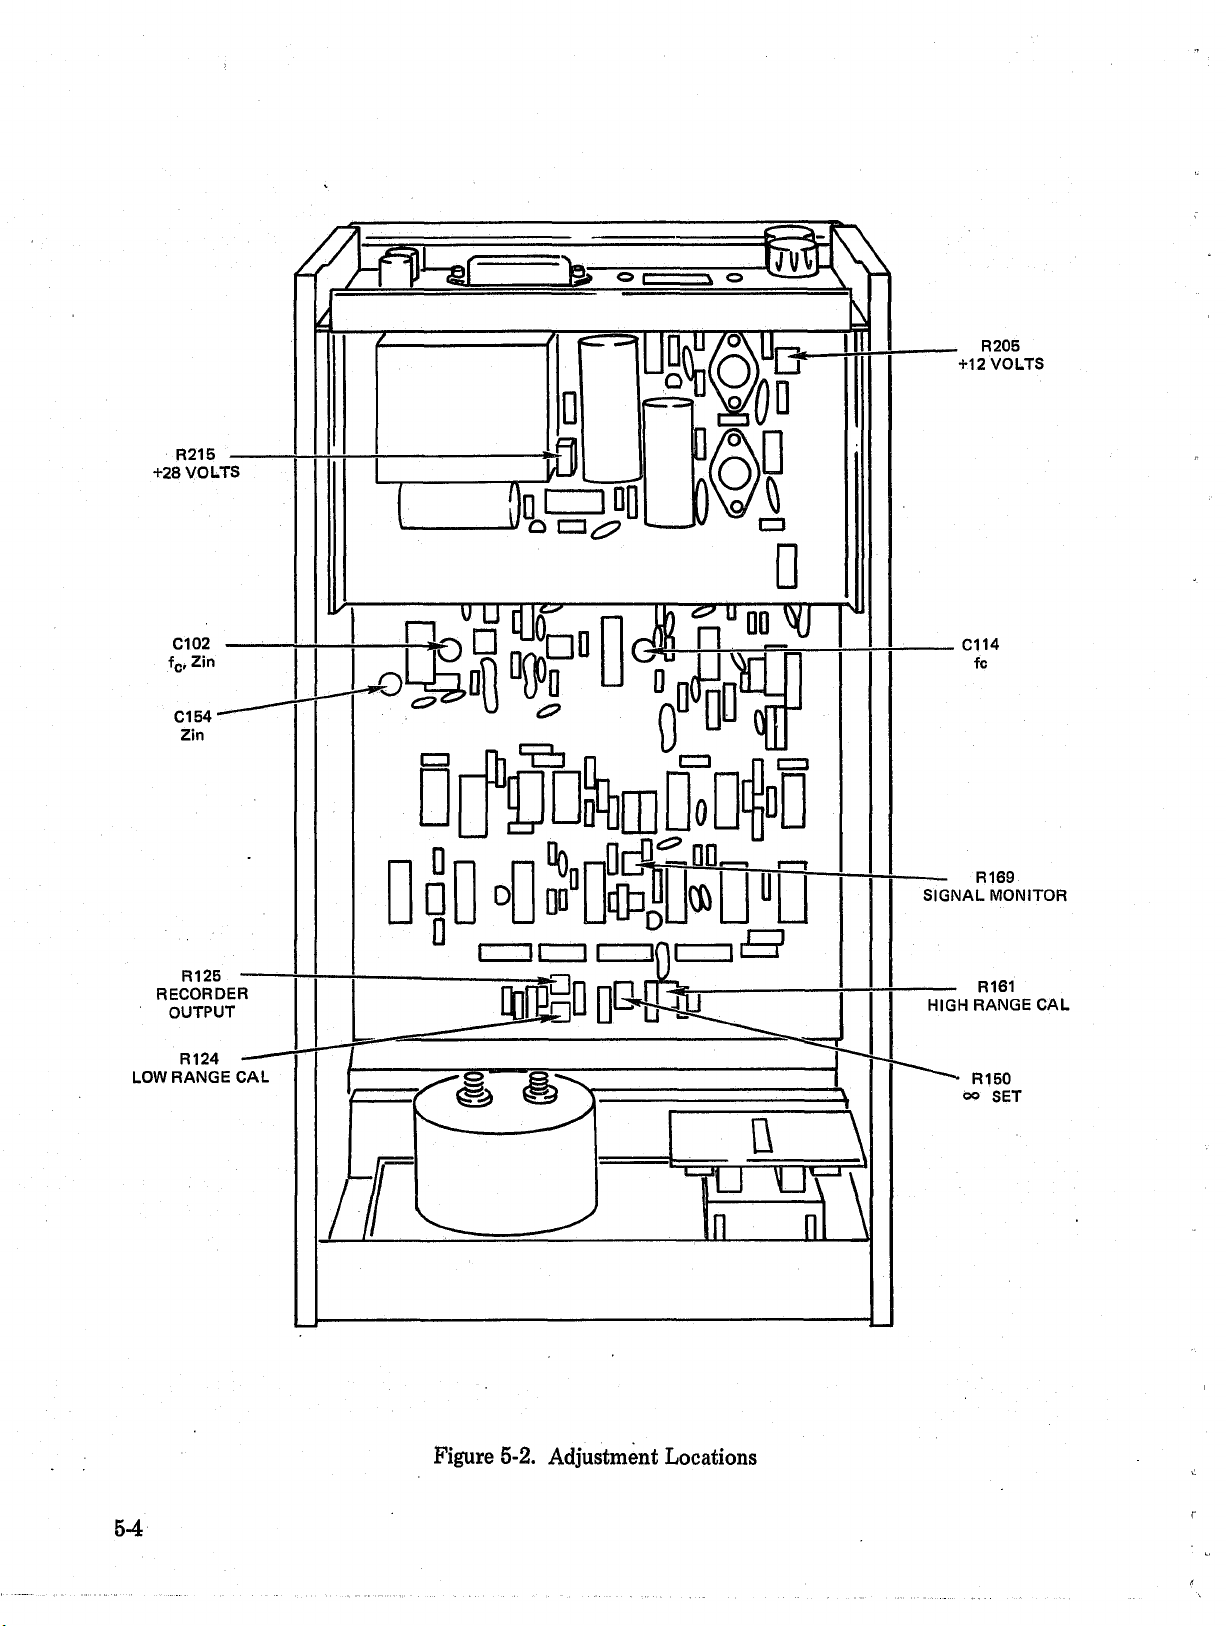
Lfer
D
. R205
+12 VOLTS
R215 —
+28 VOLTS
C102
fc> Zi"
C154 '
Zin
R125
RECORDER
OUTPUT
'V
oy^DQ
g
]ÜQ
~ z m
"UTJ
n
ö — jv n=
oa KÍM
o
f l
D —---------------------— s
G
00 yj
C114
fc
- — R169
SIGNAL MONITOR
R161
HIGH RANGE CAL
R124
LOW RANGE CAL
R150
oo SET
Figure 5-2. Adjustment Locations
Page 53
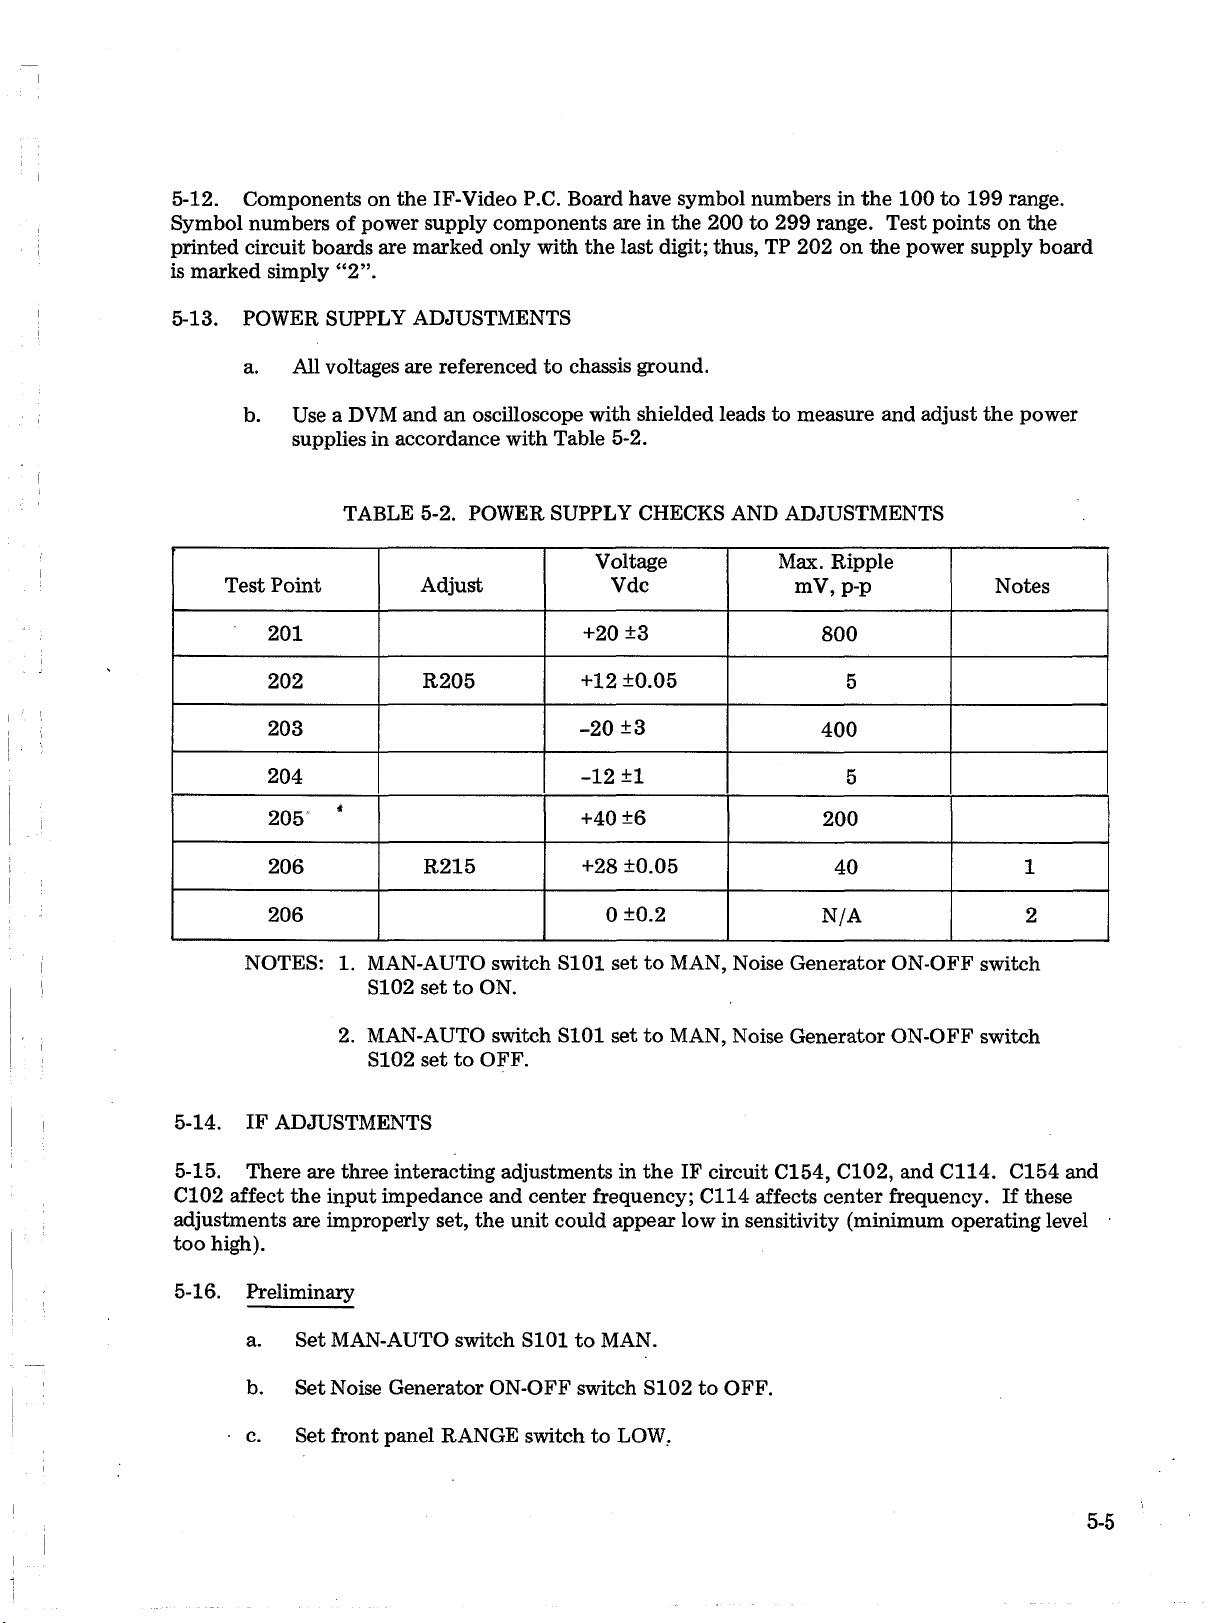
5-12. Components on the IF-Video P.C. Board have symbol numbers in the 100 to 199 range.
Symbol numbers of power supply components are in the 200 to 299 range. Test points on the
printed circuit boards are marked only with the last digit; thus, TP 202 on the power supply board
is marked simply “2 ” .
5-13. POWER SUPPLY ADJUSTMENTS
a. All voltages are referenced to chassis ground.
b. Use a DVM and an oscilloscope with shielded leads to measure and adjust the power
supplies in accordance with Table 5-2.
TABLE 5-2. POWER SUPPLY CHECKS AND ADJUSTMENTS
Test Point Adjust
2 0 1 +20 ±3
2 0 2 R205
203
204 - 1 2 ± 1
205 *
206
206
NOTES: 1. MAN-AUTO switch S101 set to MAN, Noise Generator ON-OFF switch
S102 set to ON.
2. MAN-AUTO switch S101 set to MAN, Noise Generator ON-OFF switch
S102 set to OFF.
5-14. IF ADJUSTMENTS
Voltage
Vdc
+12 ±0.05
-20 ±3
+40 ± 6
R215 +28 ±0.05
0 ±0 .2
Max. Ripple
mV, p-p
800
5
400
5
2 0 0
40
N/A 2
Notes
1
5-15. There are three interacting adjustments in the IF circuit C154, C102, and C114. C154 and
C102 affect the input impedance and center frequency; C114 affects center frequency. If these
adjustments are improperly set, the unit could appear low in sensitivity (minimum operating level
too high).
5-16. Preliminary
a. Set MAN-AUTO switch S101 to MAN.
b. Set Noise Generator ON-OFF switch S102 to OFF.
c. Set front panel RANGE switch to LOW.
5-5
Page 54
d. Connect a signal generator set to the center frequency to the IF Input. Adjust the
output level for a mid-scale reading.
5-17. Procedure
a. Adjust C102, C114 and C154 for maximum, up-scale indication (minimum noise fig
ure) on the meter (C154 will have the least effect).
b. Connect the vector voltmeter to the IF input and adjust C102 and C154 for a re
flection coefficient of less than 0 .1 .
c. Connect the signal generator to the input and readjust C114 for a peak indication.
d. Check Minimum Operating Level as described in paragraph 5-6.
5-18. METER ADJUSTMENTS
5-19. These adjustments insure the basic accuracy of the instrument. They should be varied only
if the Performance Verification Check of paragraph 5-8 so indicates. ''
a. Set MAN-AUTO switch S101 to AUTO, Noise Generator ON-OFF switch S102 to OFF.
With no signal connected to the IF Input, adjust R150 until the meter indicates
' infinity.
b. Perform the low range calibration check described in paragraph 5-8. If necessary, ad
just R124 u n til the AUTO indication agrees w ith the manual measurement
result.
c. Perform the high range calibration check described in paragraph 5-8. If necessary, ad
just R161 u ntil the AUTO indication agrees with thé manual measurement ;
result.
5-20. AUXILIARY OUTPUT ADJUSTMENTS
5-21. These adjustments are not critical to instrument performance, and need be set only if the
user requires these auxiliary outputs.
5-22. Signal Monitor
a. With MAN-AUTO switch S101 in AUTO, apply an input signal at the center frequency
to the IF Input. Increase the level until the front panel SIGNAL LEVEL light just
comes on. “
b. Connect a DVM between pin 4 of J1 (rear panel) and ground (pin 5 of Jl).
c. Adjust R169 until the meter indicates 0.0 ±0.5 volts.
5-6
d. Increase the signal generator output level by 50 dB. Note that the DVM indication
increases to about +5 volts.
Page 55
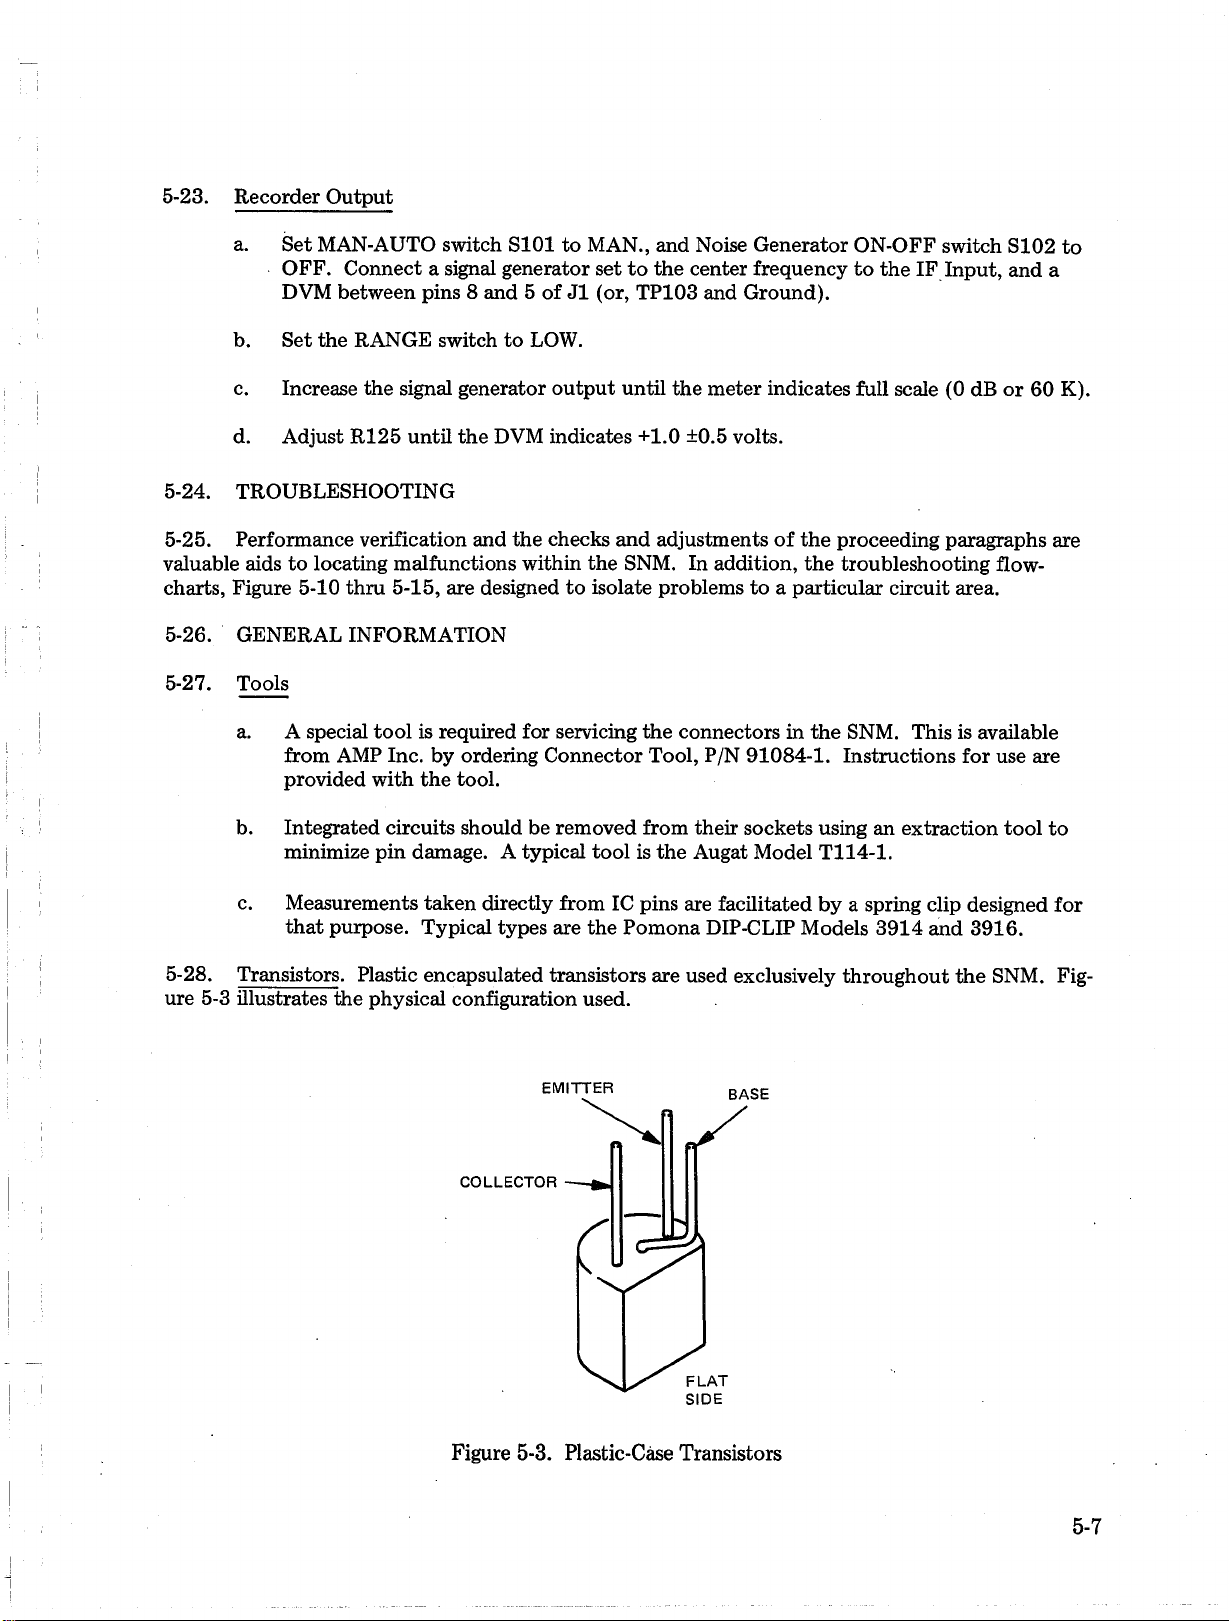
5-23. Recorder Output
a. Set MAN-AUTO switch S101 to MAN., and Noise Generator ON-OFF switch S102 to
OFF. Connect a signal generator set to the center frequency to the IF Input, and a
DVM between pins 8 and 5 of J1 (or, TP103 and Ground).
b. Set the RANGE switch to LOW.
c. Increase the signal generator output until the meter indicates full scale (0 dB or 60 K).
d. Adjust R125 until the DVM indicates +1.0 ±0.5 volts.
5-24. TROUBLESHOOTING
5-25. Performance verification and the checks and adjustments of the proceeding paragraphs are
valuable aids to locating malfunctions within the SNM. In addition, the troubleshooting flow
charts, Figure 5-10 thru 5-15, are designed to isolate problems to a particular circuit area.
5-26. GENERAL INFORMATION
5-27. Tools
a. A special tool is required for servicing the connectors in the SNM. This is available
from AMP Inc. by ordering Connector Tool, P/N 91084-1. Instructions for use are
provided with the tool.
b. Integrated circuits should be removed from their sockets using an extraction tool to
minimize pin damage. A typical tool is the Augat Model T114-1.
c. Measurements taken directly from IC pins are facilitated by a spring clip designed for
that purpose. Typical types are the Pomona DIP-CLIP Models 3914 and 3916.
5-28. Transistors. Plastic encapsulated transistors are used exclusively throughout the SNM. Fig
ure 5-3 illustrates the physical configuration used. .
Figure 5-3. Plastic-Càse Transistors
5-7
Page 56
5-29. Integrated Circuits. Both linear and digital IC’s are used in the 7310 and 7320 SNM’s. Fig
ure 5-4 illustrates the physical configurations used, and Figure 5-5 provides functional descriptions.
5-30. Logic Family. All digital integrated circuits in the SNM are cos/mos devices. This family
provides high noise immunity and good temperature stability. Positive logic is used throughout, so
a “True” condition is high, and a “ False” condition is low. High and low voltage values are the sup
ply voltage (+12 volts) and 0 volts respectively. In practice:
True (High or logical “ 1” ) = + 8 to +12 volts
False (Low or logical “ 0” ) = 0 to +3.5 volts
These values are nominal for a positive supply voltage (V ^ ) of +12.0 volts.
5-31. Logic Circuits. Only one type of true digital logic circuit (IC) is used in the 7310 and 7320.
This is the NOR gate or inverted OR. The NOR gate is characterized by the fact that its output is
always LOW except when all its inputs are simultaneously LOW. For the 3- input gates used in the
7310 and 7320, this is illustrated by Figure 5-6.
5-32. Analog Gates. Several gates, which pass or block analog signals depending upon the condi
tion of a control signal, are used in the 7300 System Noise Monitors. These gates are generally used
in series-shunt pairs to form DC to AC converters (choppers) or the inverse function, AC to DC
converters (synchronous integrators). Although the gates are complex cos/mos IC bilateral switches,
they are, for simplicty, shown as N-channel FET’s on the schematic (e.g.,: Z108). The operation
of the gates is illustrated by Figure 5-7.
5-33. Operational Amplifiers. Operational amplifiers are used to implement many functions, such
as summers, buffers, differential and offset amplifier. Figure 5-8 illustrates some typical circuits.
5-34. Printed Circuit Boards. The printed circuit boards (PCB’s) used in the AILTECH 7300
SNM’s are double-sided with platedrthrough holes; that is, there are conductor patterns on both
sides of the boards, and connections from top to bottom are via metallic plating of through holes.
5-35. The PCB’s are susceptible to damage from excess soldering heat. Use a soldering iron of
less than 60 watts rating when working on the 7300 PCB’s, and use a suction device to remove
excess solder from component mounting holes. If possible, when replacing a component, clip the
leads of the device to be replaced close to its body; thus, the old leads can be used as wrap-around
terminals for soldering the new component in place. When soldering on the PCB’s use a solder with
a non-corrosive flux core, and clean the excess flux off the board after all soldering is complete.
5-36. Damaged sections of the printed wiring can be repaired by soldering a length of bare, tinned
copper wire across the damaged area.
5-37. Printed Circuit Board Connectors. Connections to the printed circuit boards are made via
AMP type 87133-X. Connector tool, AMP P/N 91084-1 is required to service these connectors.
Pin number layouts, as they appear on the boards are shown on the overall wiring diagram. In gen
eral, the pins are numbered consecutively with the numbers increasing in the same direction in each
row (as contrasted to the continuous system used with IC’s). This is illustrated by Figure 5-9 which
is the layout of a 1 0 pin connector.
5-8
Page 57
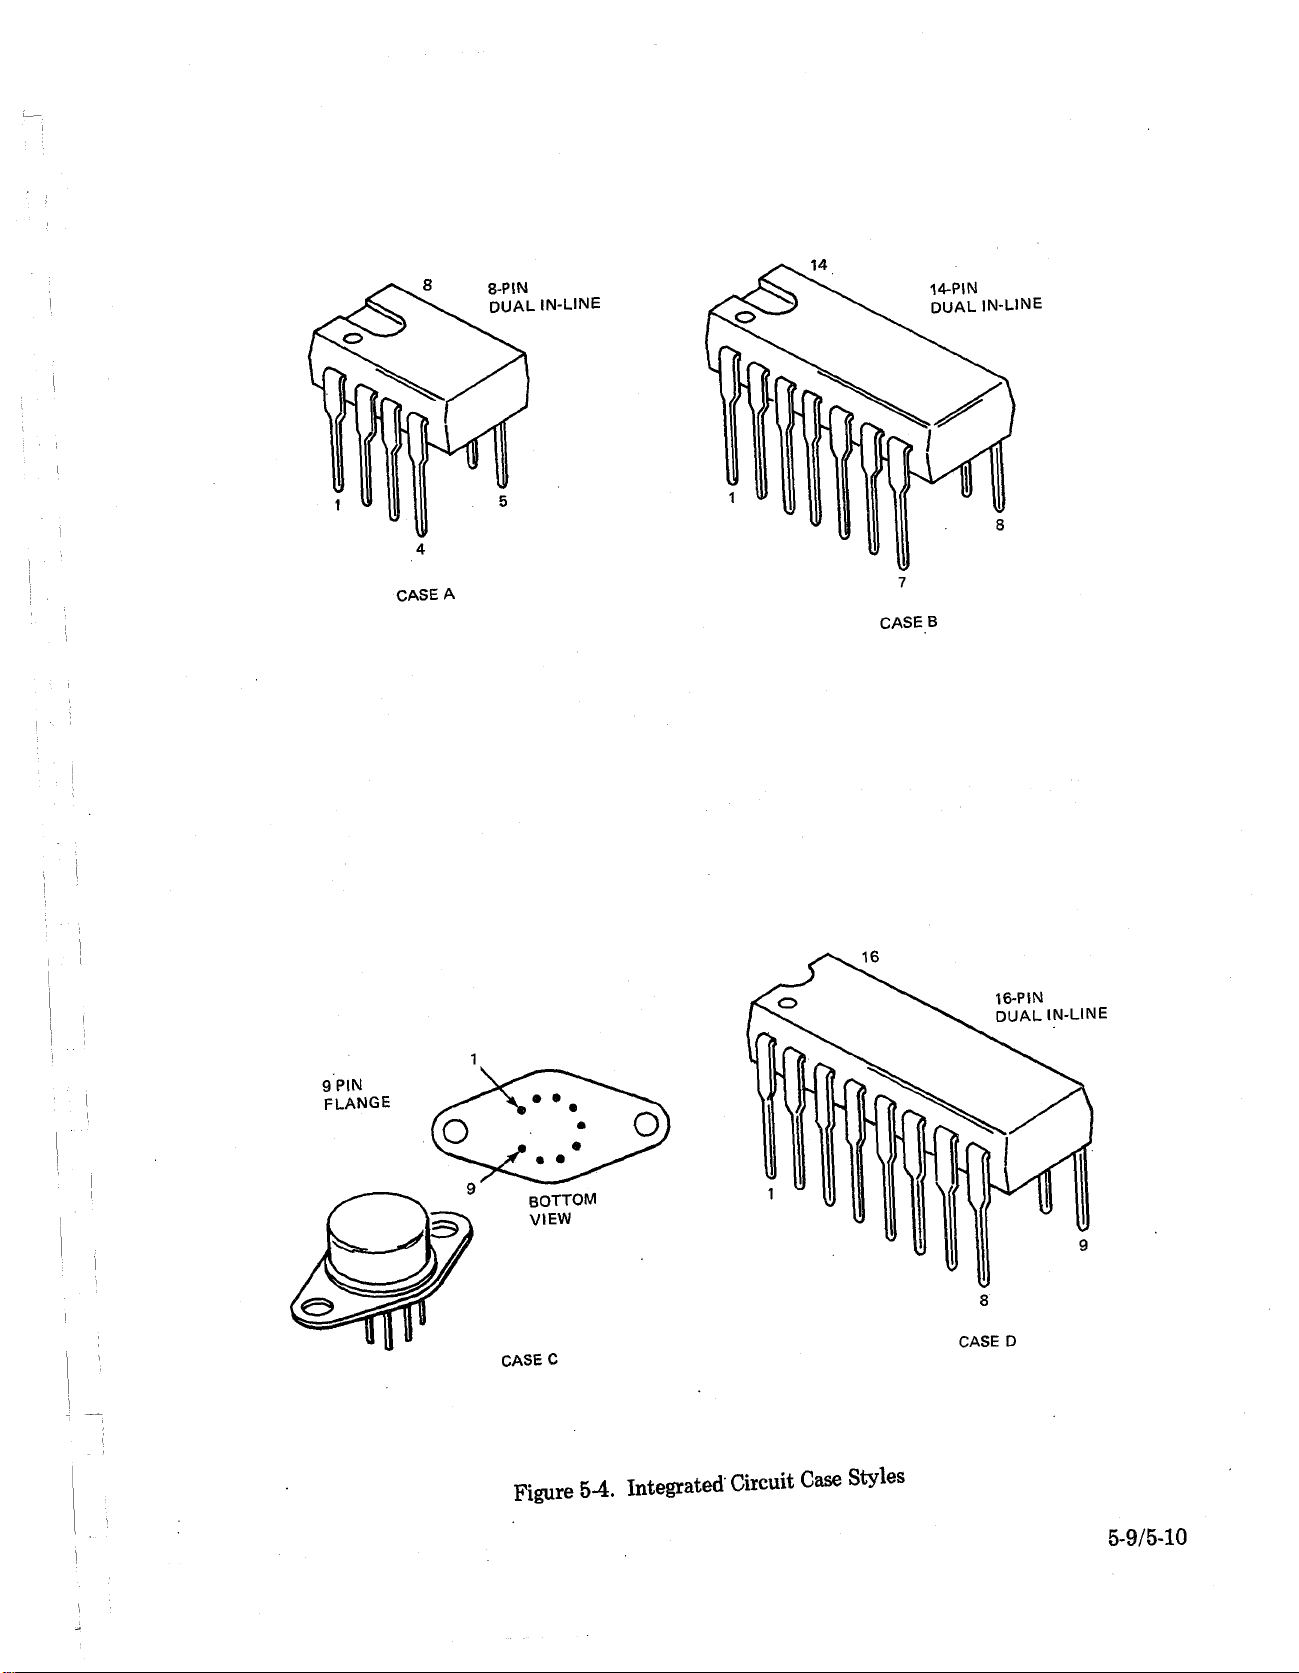
CASE A
CASE B
Figure 54. Integrated Circuit Case Styles
D
CASE D
5-9/5-10
Page 58
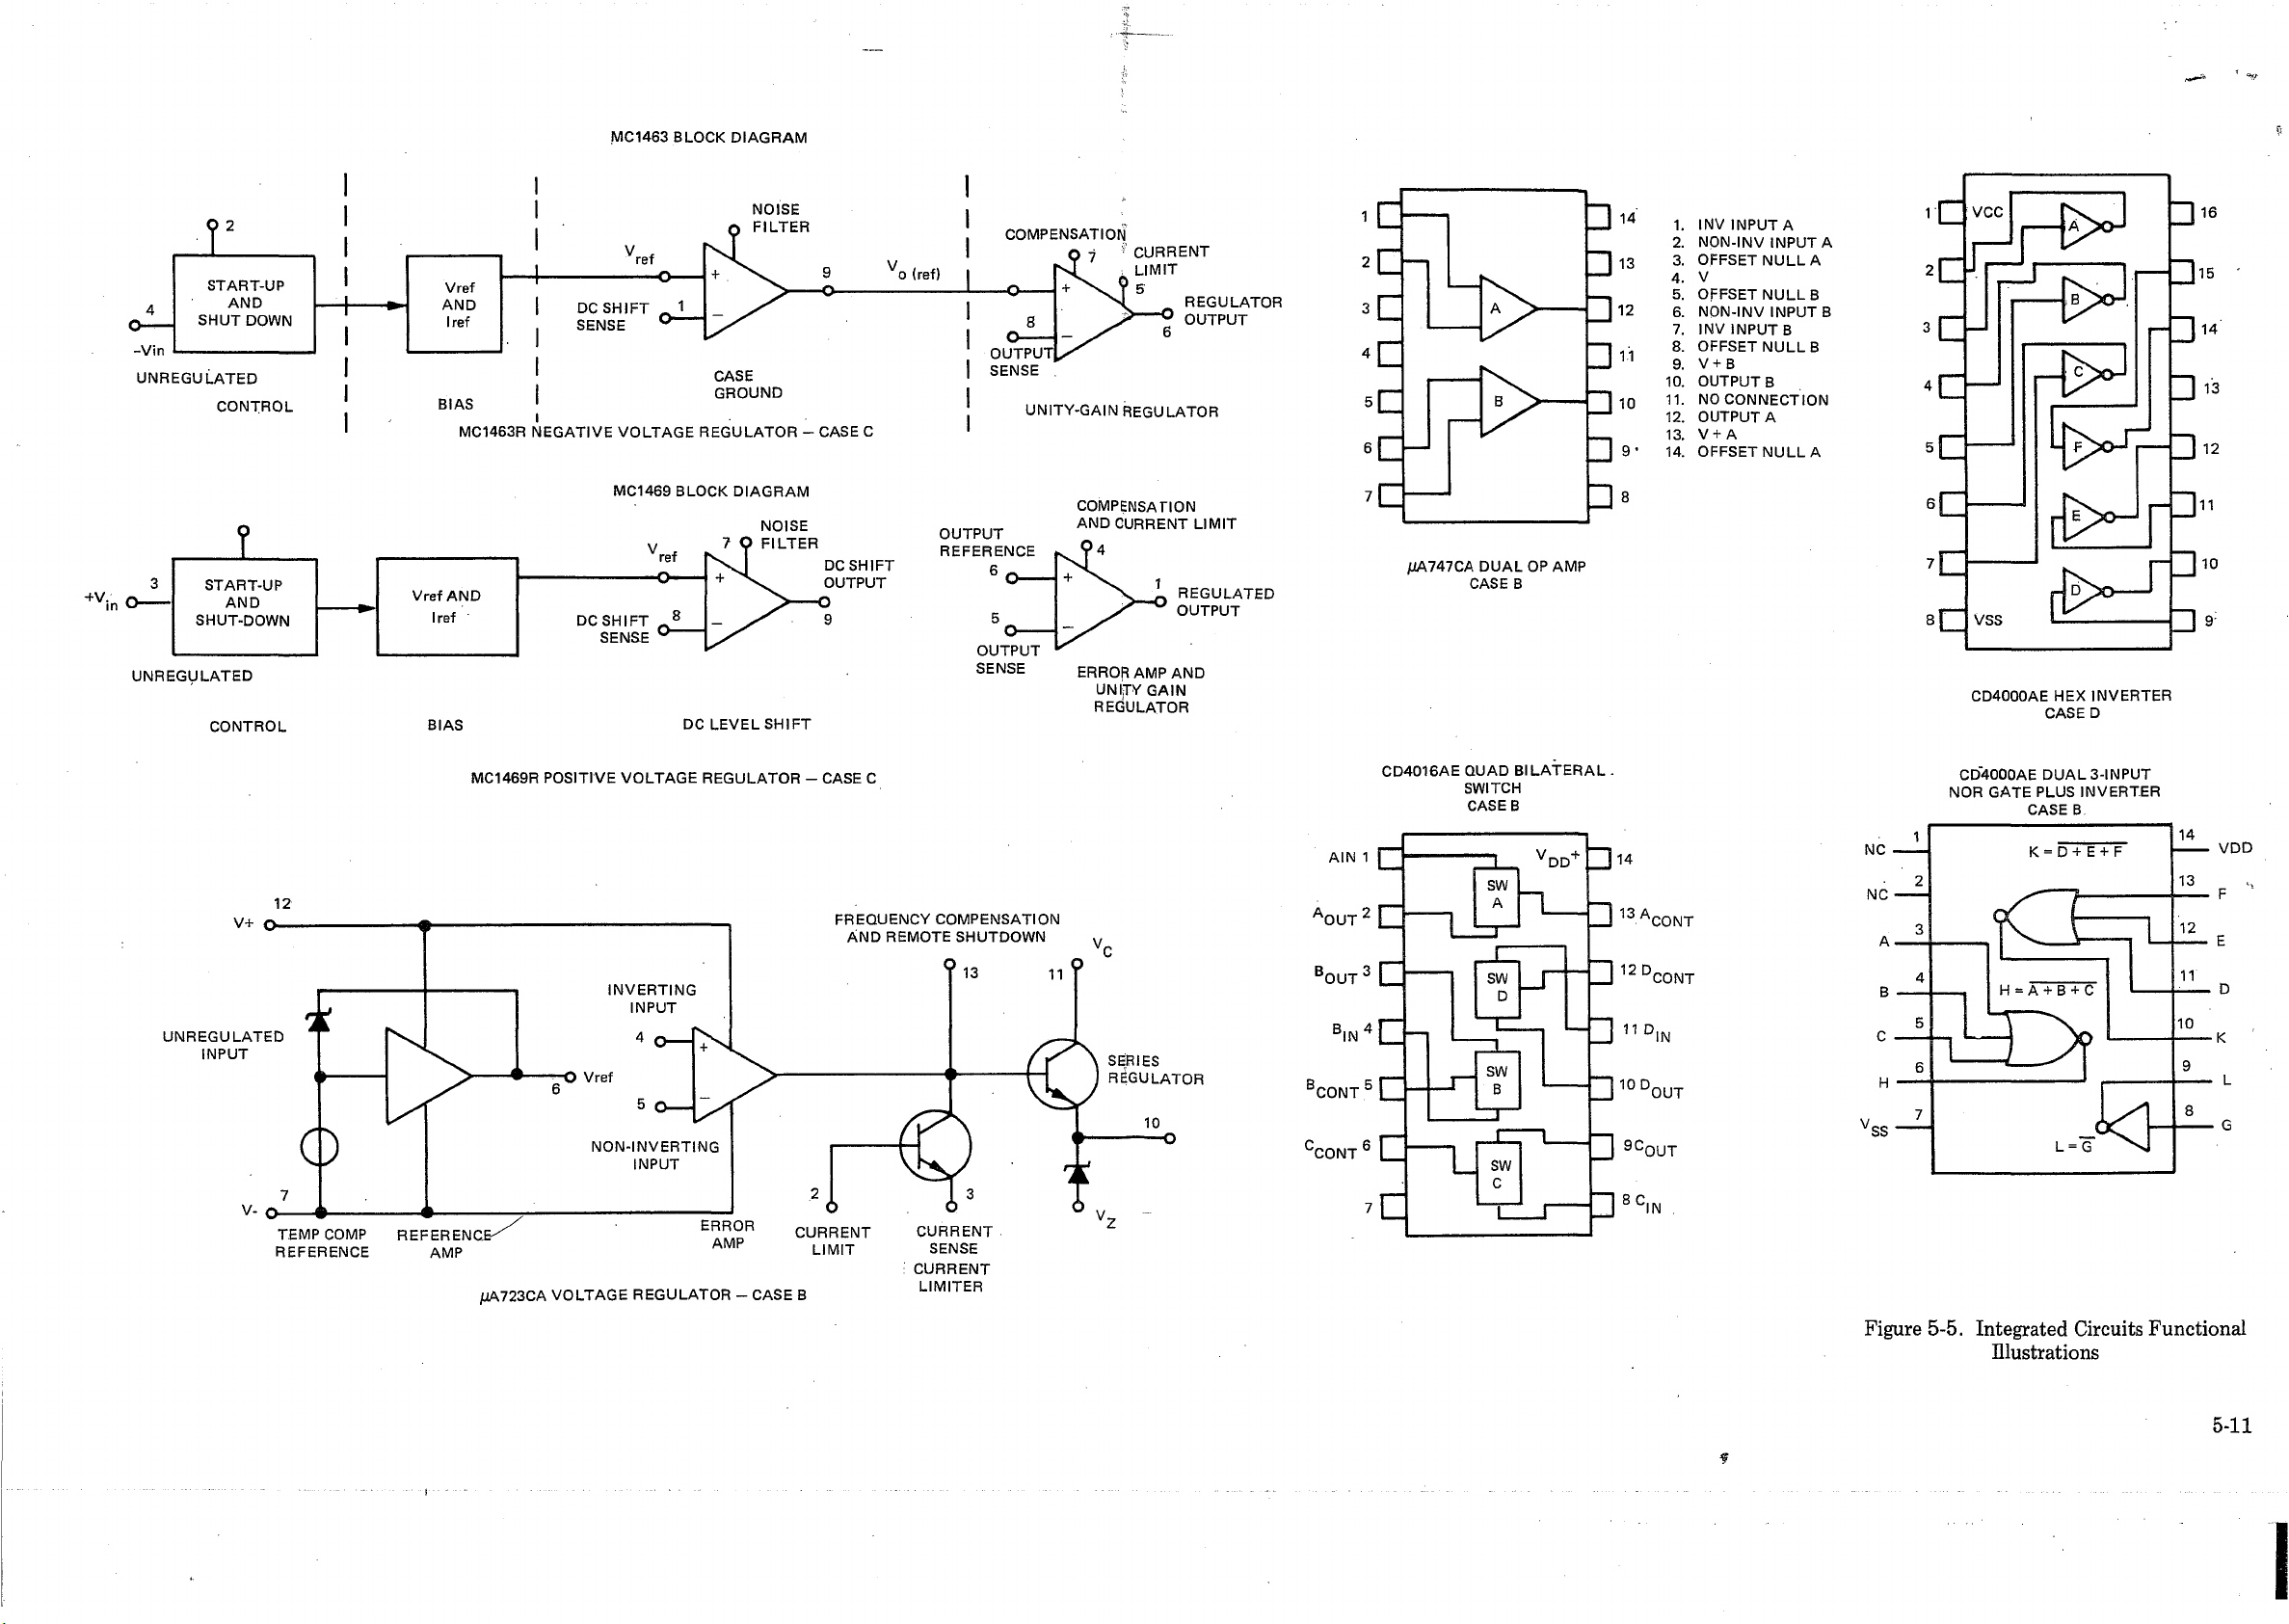
NIC1463 BLOCK DIAGRAM
INV INPUT A
NQN-INV INPUT A
OFFSET NULLA
V
OFFSET NULL B
NON-INV INPUT B
INV INPUT B
OFFSET NULL B
V + B
OUTPUT B
NO CONNECTION
OUTPUT A
V + A
OFFSET NULL A
+V.
UNREGULATED
i
START-UP
AND
SHUT-DOWN
CONTROL
MC1469 BLOCK DIAGRAM
NOISE
7 P FILTER
DC SHIFT
Vref AND
Iref
BIAS DC LEVEL SHIFT
MC1469R POSITIVE VOLTAGE REGULATOR - CASE C
12
DC SHIFT 8
SENSE
OUTPUT
OUTPUT
REFERENCE
6 ~
__
OUTPUT
SENSE ERROR AMP AND
COMPENSATION
AND CURRENT LIMIT
REGULATED
OUTPUT
UNITY GAIN
REGULATOR
AIN 1
Aai it 2
'O U T “ E
B„, 3
JOUT ° d
B,m 4
/JA747CA DUAL OP AMP
CASE B
CD4016AE QUAD BILATERAL .
SWITCH
CASE B
CD4000AE HEX INVERTER
CASE D
CD4000AE DUAL 3-INPUT
NOR GATE PLUS INVERTER
CASE B
ßA723CA VOLTAGE REGULATOR - CASE B
3CONT 5 C l
:CONT 6 d
LIMITER
Figure 5-5. Integrated Circuits Functional
Illustrations
5-11
f
Page 59
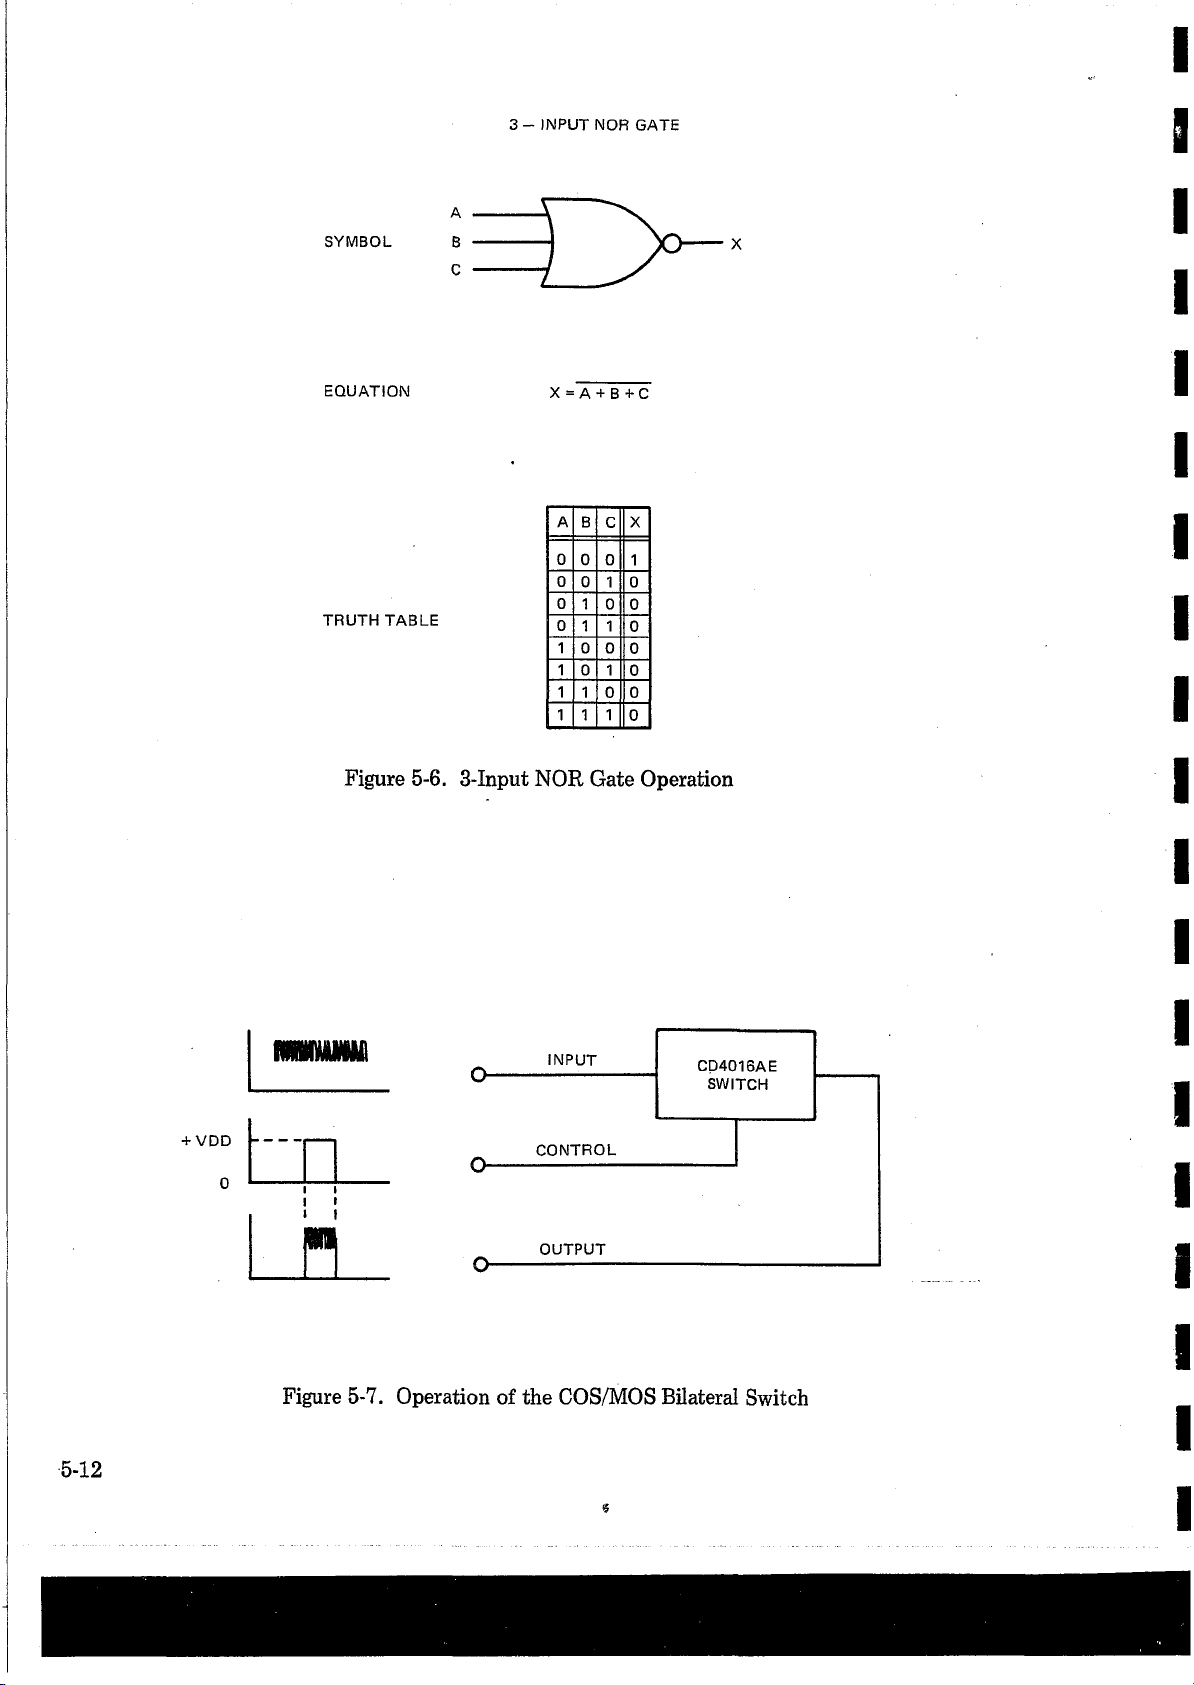
TRUTH TABLE
3 - INPUT NOR GATE
A BCX
0
0 0
1
0
0 1 0
0
1 0
0
0
1 1
0
1 0 0
1 0 1
1 1
1 1 1
0
0
0 0
0
+ V D D
««wan t»!'
IV W n V M H Vn H
-------
i i
i I
f l
Figure 5-6. 3-Input NOR Gate Operation
INPUT
CONTROL
OUTPUT
CD4016AE
SWITCH
5-12
Figure 5-7. Operation of the COS/MOS Bilateral Switch
*
Page 60
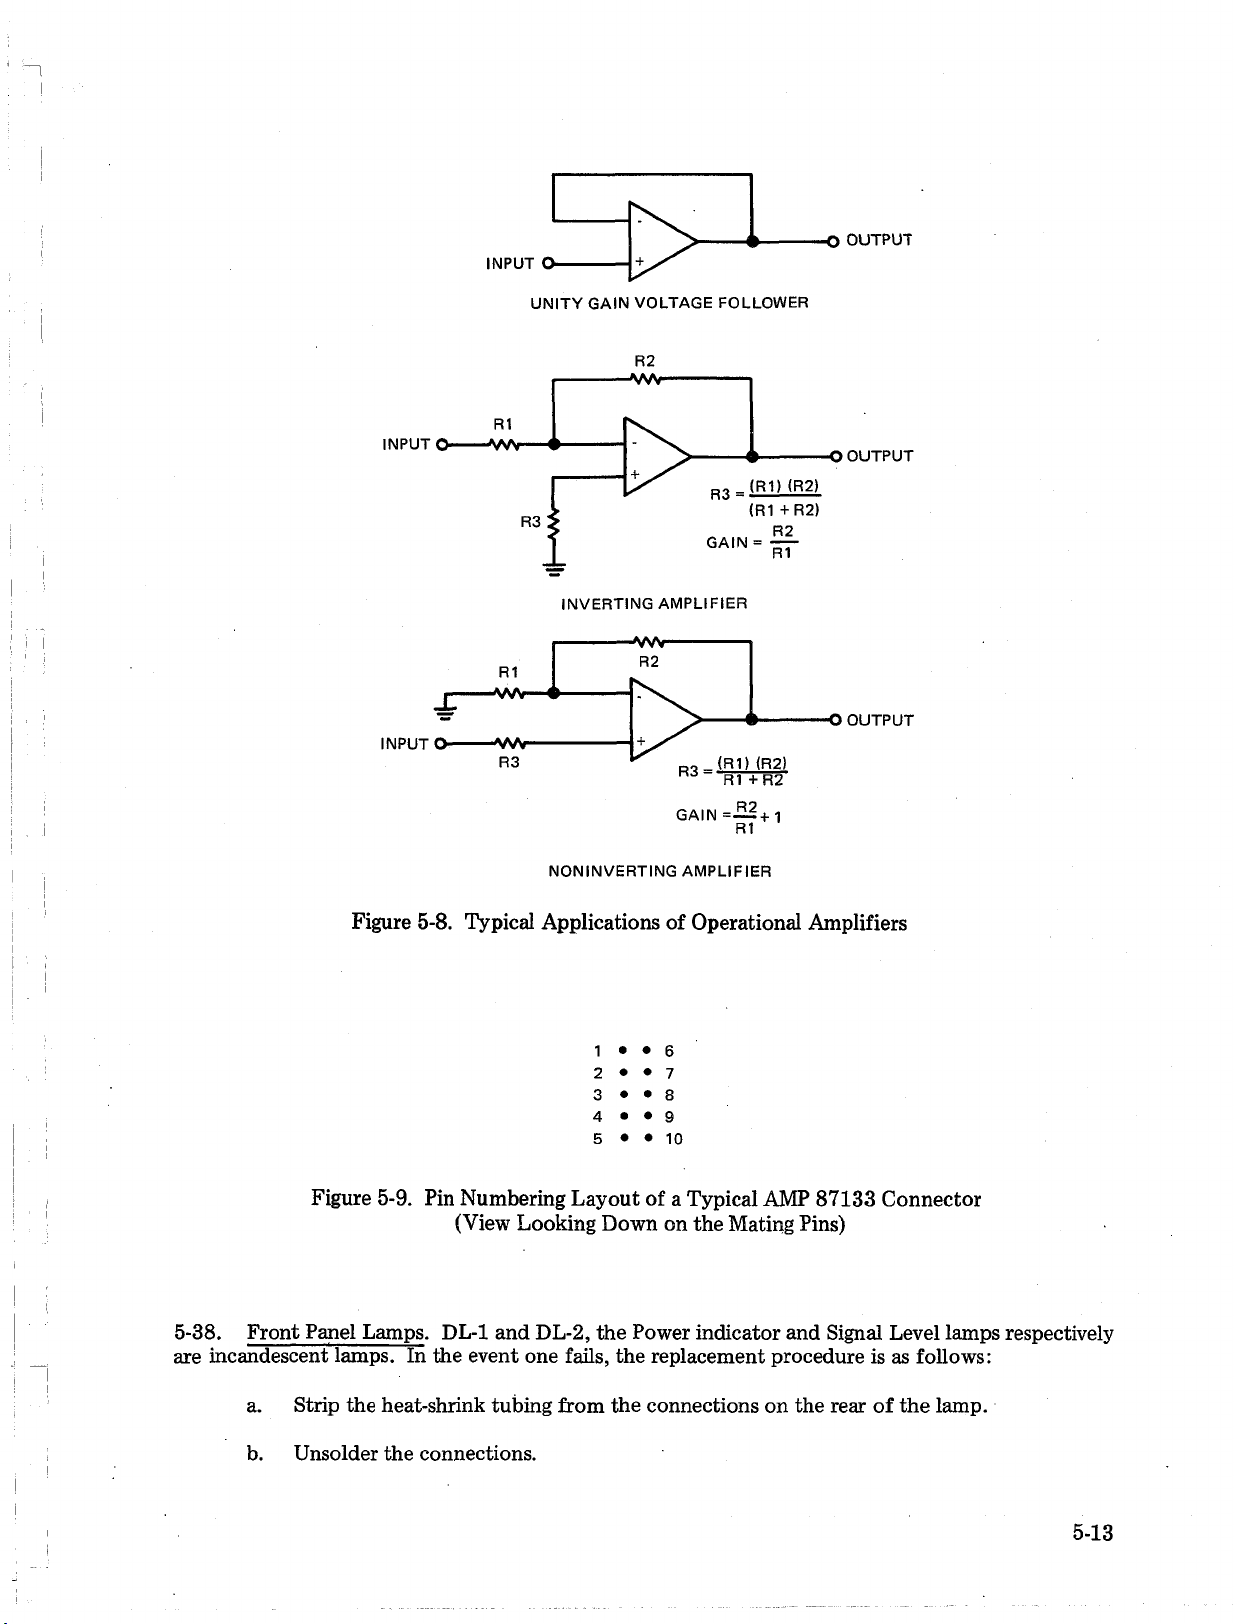
R2
NONINVERTING AMPLIFIER
Figure 5-8. Typical Applications of Operational Amplifiers
1 • • 6
2 • • 7
3 • • 8
4 • • 9
5 • • 10
Figure 5-9. Pin Numbering Layout of a Typical AMP 87133 Connector
(View Looking Down on the Mating Pins)
5-38. Front Panel Lamps. DL-1 and DL-2, the Power indicator and Signal Level lamps respectively
are incandescent lamps. In the event one fails, the replacement procedure is as follows:
a. Strip the heat-shrink tubing from the connections on the rear of the lamp.
b. Unsolder the connections.
5-13
Page 61
c. Using a pair of long-nose pliers, squeeze the three projections on the retainer clip
together. Maintain pressure and slide the clip back off the lamp.
d. Remove the lamp from the front.
e. Reverse the removal procedure to mount the new lamp. Use insulated tubing over the
solder connections.
5-39. ENR Thumbwheel Switch. This switch is held in place by spring loaded clips at the top and
bottom and is removed from the front of the panel. To replace the switch simply remove the
entire ENR Gain board by disconnecting the board edge connectors on the switch, depress the clips,
and free the switch by rocking it back and forth in the vertical plane. The new switch may then be
simply snapped into place,
5-40. TROUBLESHOOTING PROCEDURES
5-41. This paragraph provides troubleshooting procedures in the form of flow charts. These
charts, Figures 5-10 through 5-15 provide step-by-step procedures for fault isolation down to active
components and critical passive components. In general, these charts are meant as guidelines to
logical signal tracing techniques.
5-42. Waveforms keyed to conditions set up by the Troubleshooting charts are also provided;
however, as a further aid, waveforms typical of a functioning unit in its normal operating mode are
provided on the schematic diagrams which follow the charts.
5-43. Recommended spares and replaceable parts lists are located in Chapter VI.
5-44. FACTORY SERVICE
5-45. In the event a difficult service problem occurs, contact your nearest AILTECH Regional
Office or Sales Representative by letter, TWX or phone. Please indicate the model number, serial
number and specific details of the difficulty involved with as much additional information as you
consider necessary to aid in pin-pointing the cure to the problem.
5-46. Should it be necessary to return the equipment to the factory for repair or recalibation,
please contact AILTECH or an authorized sales representative in your area before shipping a unit.
In your communication arranging for a return, please be sure to include model number, serial num
ber, date of purchase and specific details concerning the problem (in the event of failure) or service
desired (in the event of recalibration).
5-47. When an instrument is returned for service, we will proceed to work on the instrument until
the charges reach $100. If the total charges exceed $100., an estimate of such charges will be sub
mitted for approval.
5-48. When spare parts are ordered, please indicate a description of the part as well as its part
number and also include the model number and serial number of the instrument being repaired.
5-14
Page 62
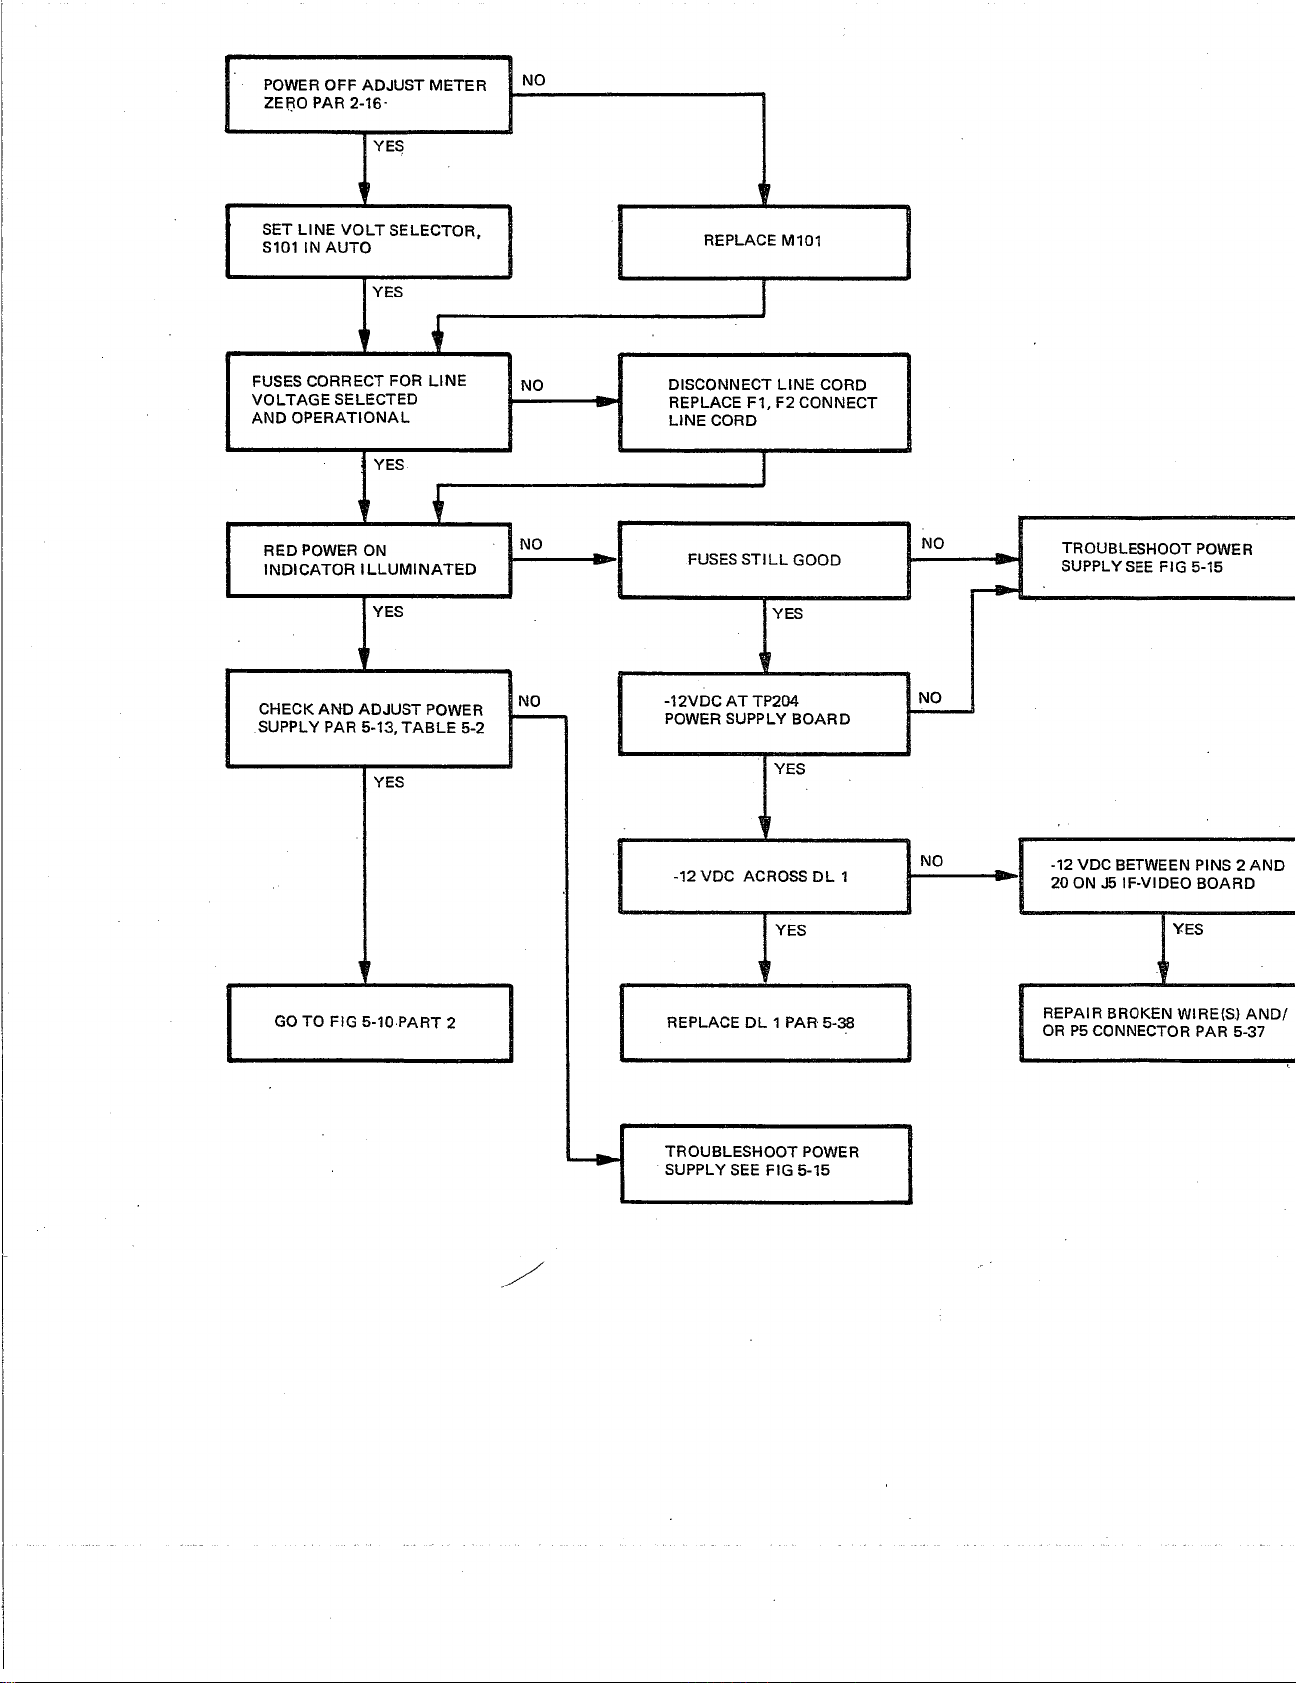
.
.........................
POWER OFF ADJUST METER
ZEFiO PAR 2-16-
r
NO
1
'
SET LINE VOLT SELECTOR,
S101 IN AUTO
I YES
FUSES CORRECT FOR LINE
VOLTAGE SELECTED
AND OPERATIONAL
YES
RED POWER ON
INDICATOR ILLUMINATED
YES
1
CHECK AND ADJUST POWER
SUPPLY PAR 5-13, TABLE 5-2
YES
NO
NO
REPLACE M101
DISCONNECT LINE CORD
REPLACE F1, F2 CONNECT
LINE CORD
YES
1
f
-12VDC AT TP204
POWER SUPPLY BOARD
YES
TROUBLESHOOT POWER
SUPPLY SEE FIG 5-15
I
NO
TROUBLESHOOT POWER
SUPPLY SEE FIG 5-15
-12 VDC BETWEEN PINS 2 AND
* 20 ON J5 IF-VIDEO BOARD
YES
t
REPAIR BROKEN WIRE(S) AND/
OR P5 CONNECTOR PAR 5-37
Page 63
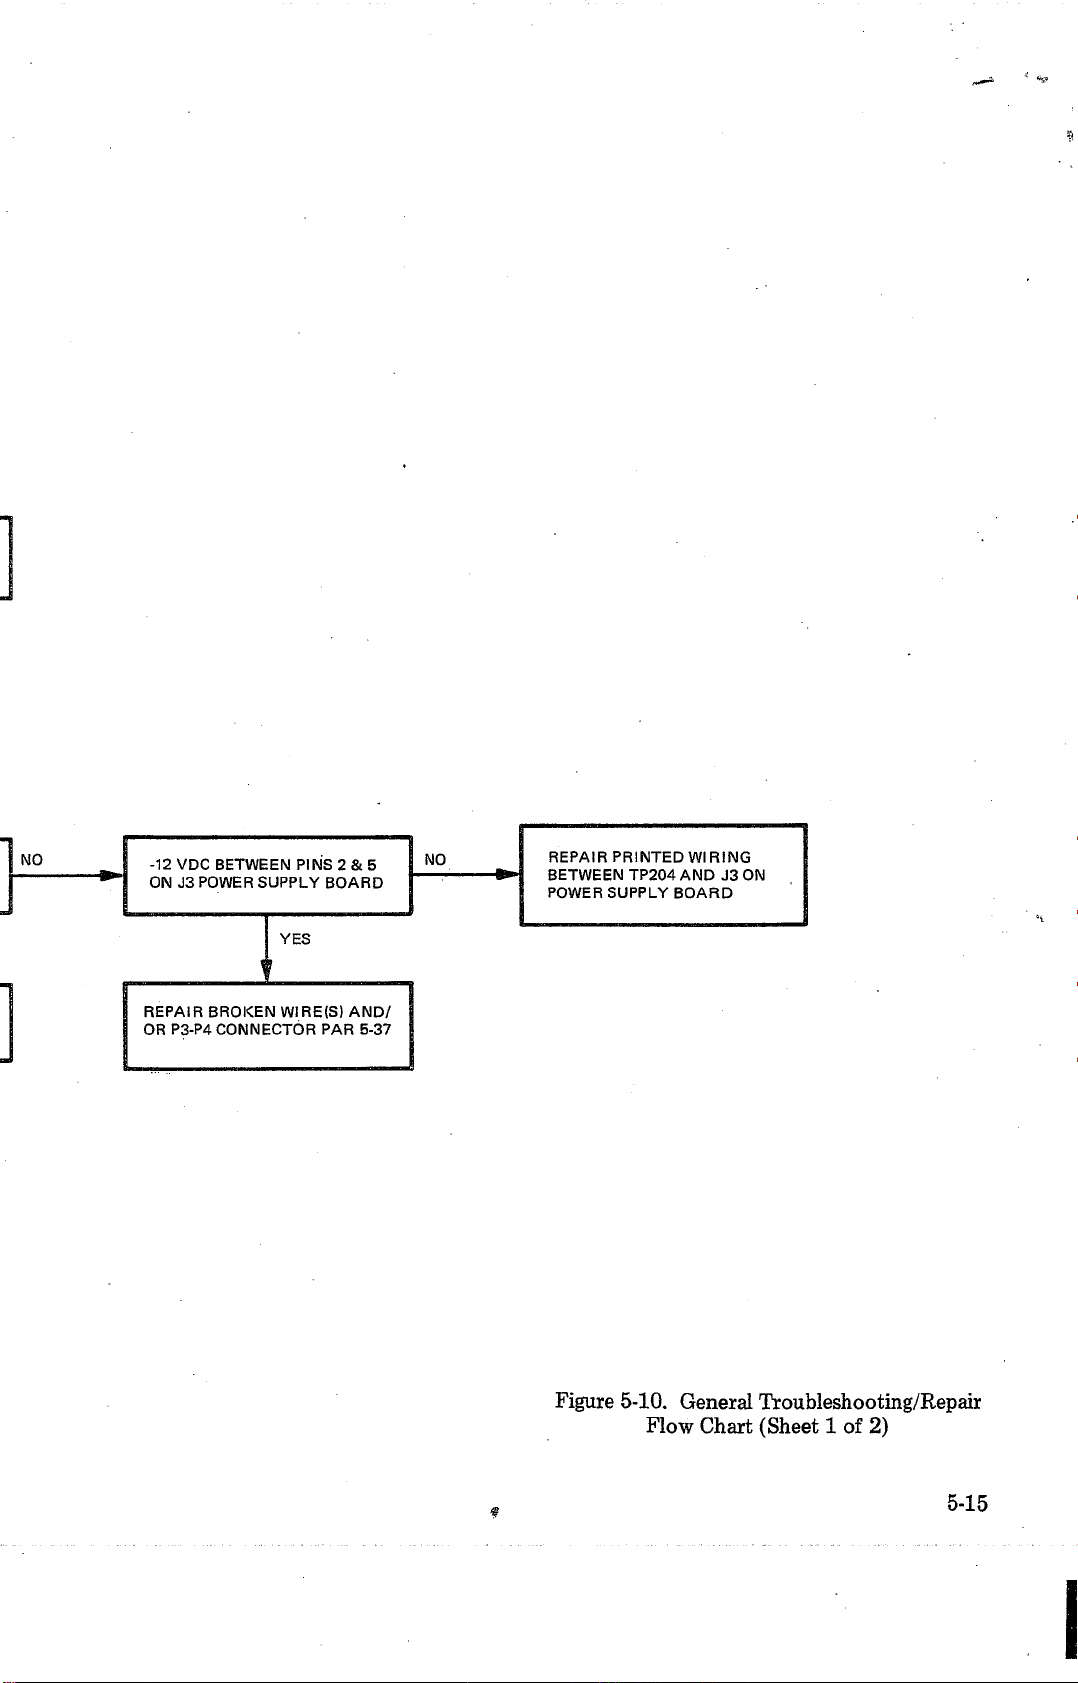
-12 VDC BETWEEN PINS 2 & 5
ON J3 POWER SUPPLY BOARD
r
| REPAIR BROKEN WIRE(S) AND/
S OR P3-P4 CONNECTOR PAR 5-37
NO
REPAIR PRINTED WIRING
BETWEEN TP204 AND J3 ON
POWER SUPPLY BOARD
Figure 5-10. General Troubleshooting/Repair
Flow Chart (Sheet 1 of 2)
Page 64
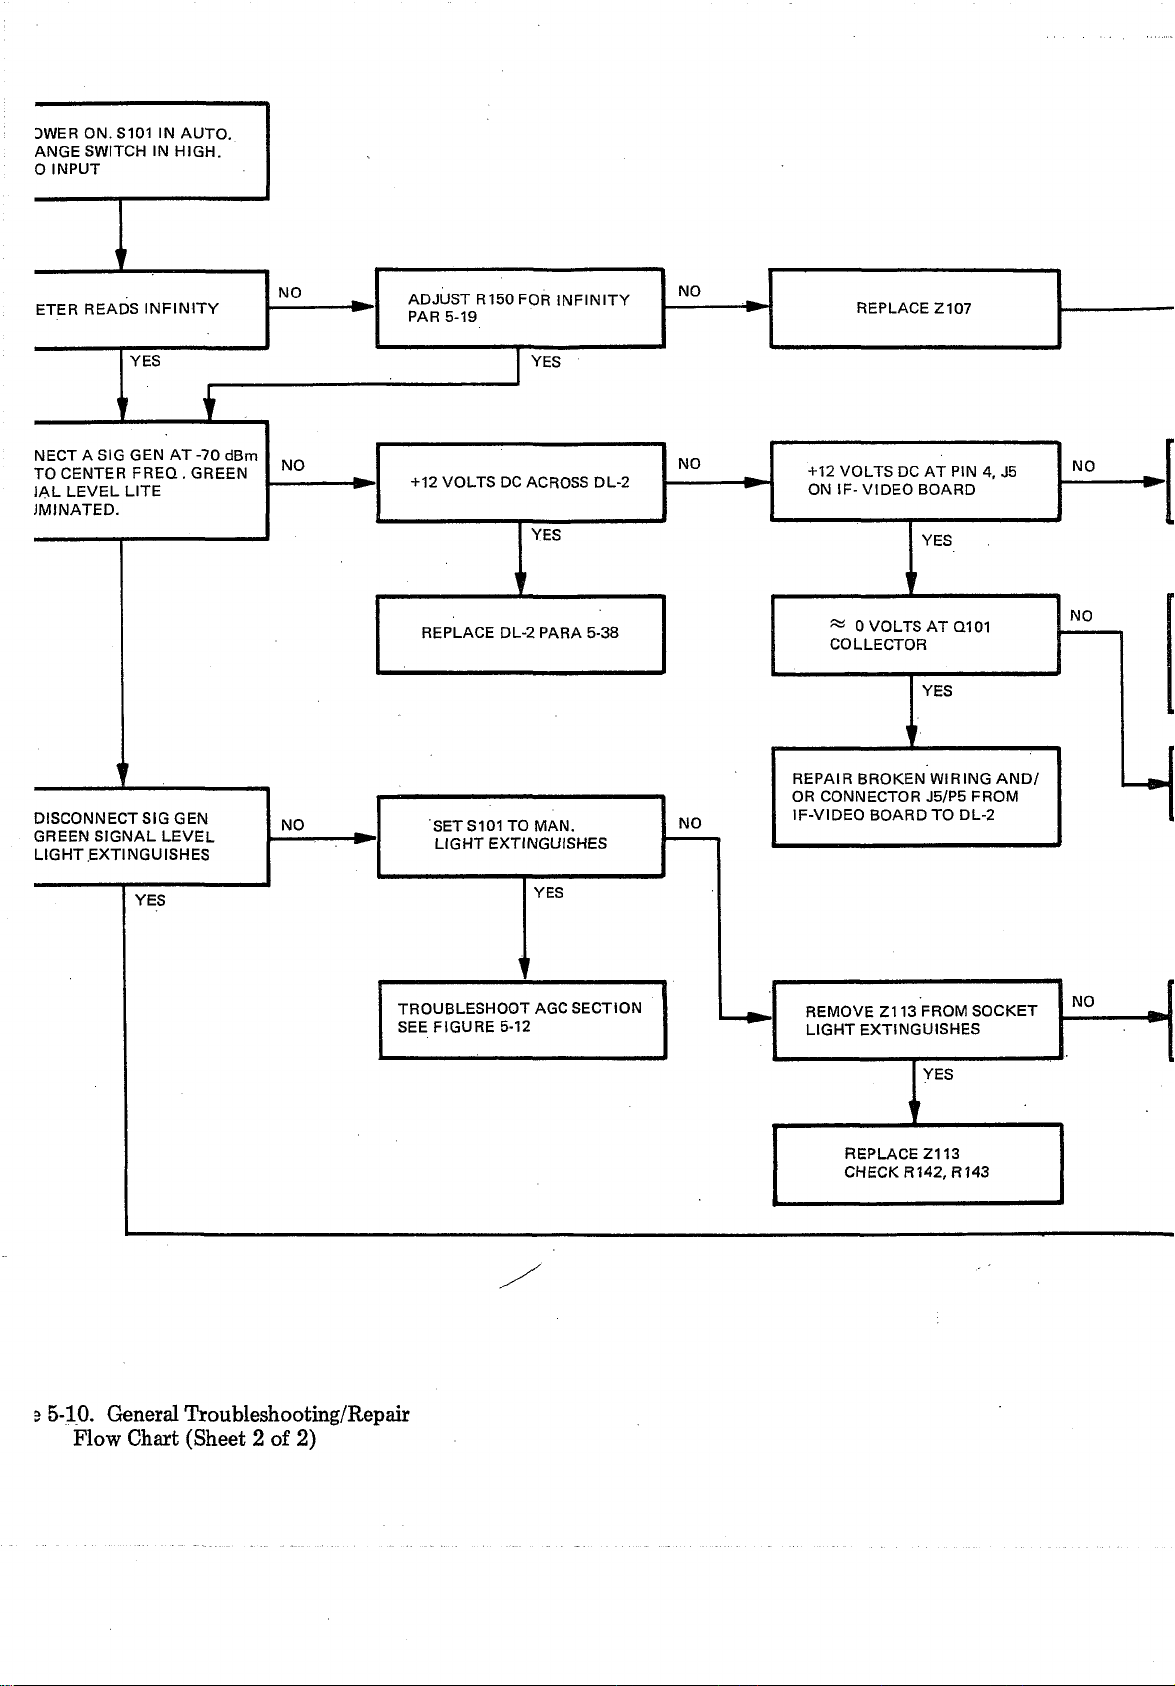
DWER ON.S101 IN AUTO.
ANGE SWITCH IN HIGH.
O INPUT
3 5-10. General Troubleshooting/Repair
Flow Chart (Sheet 2 of 2)
Page 65
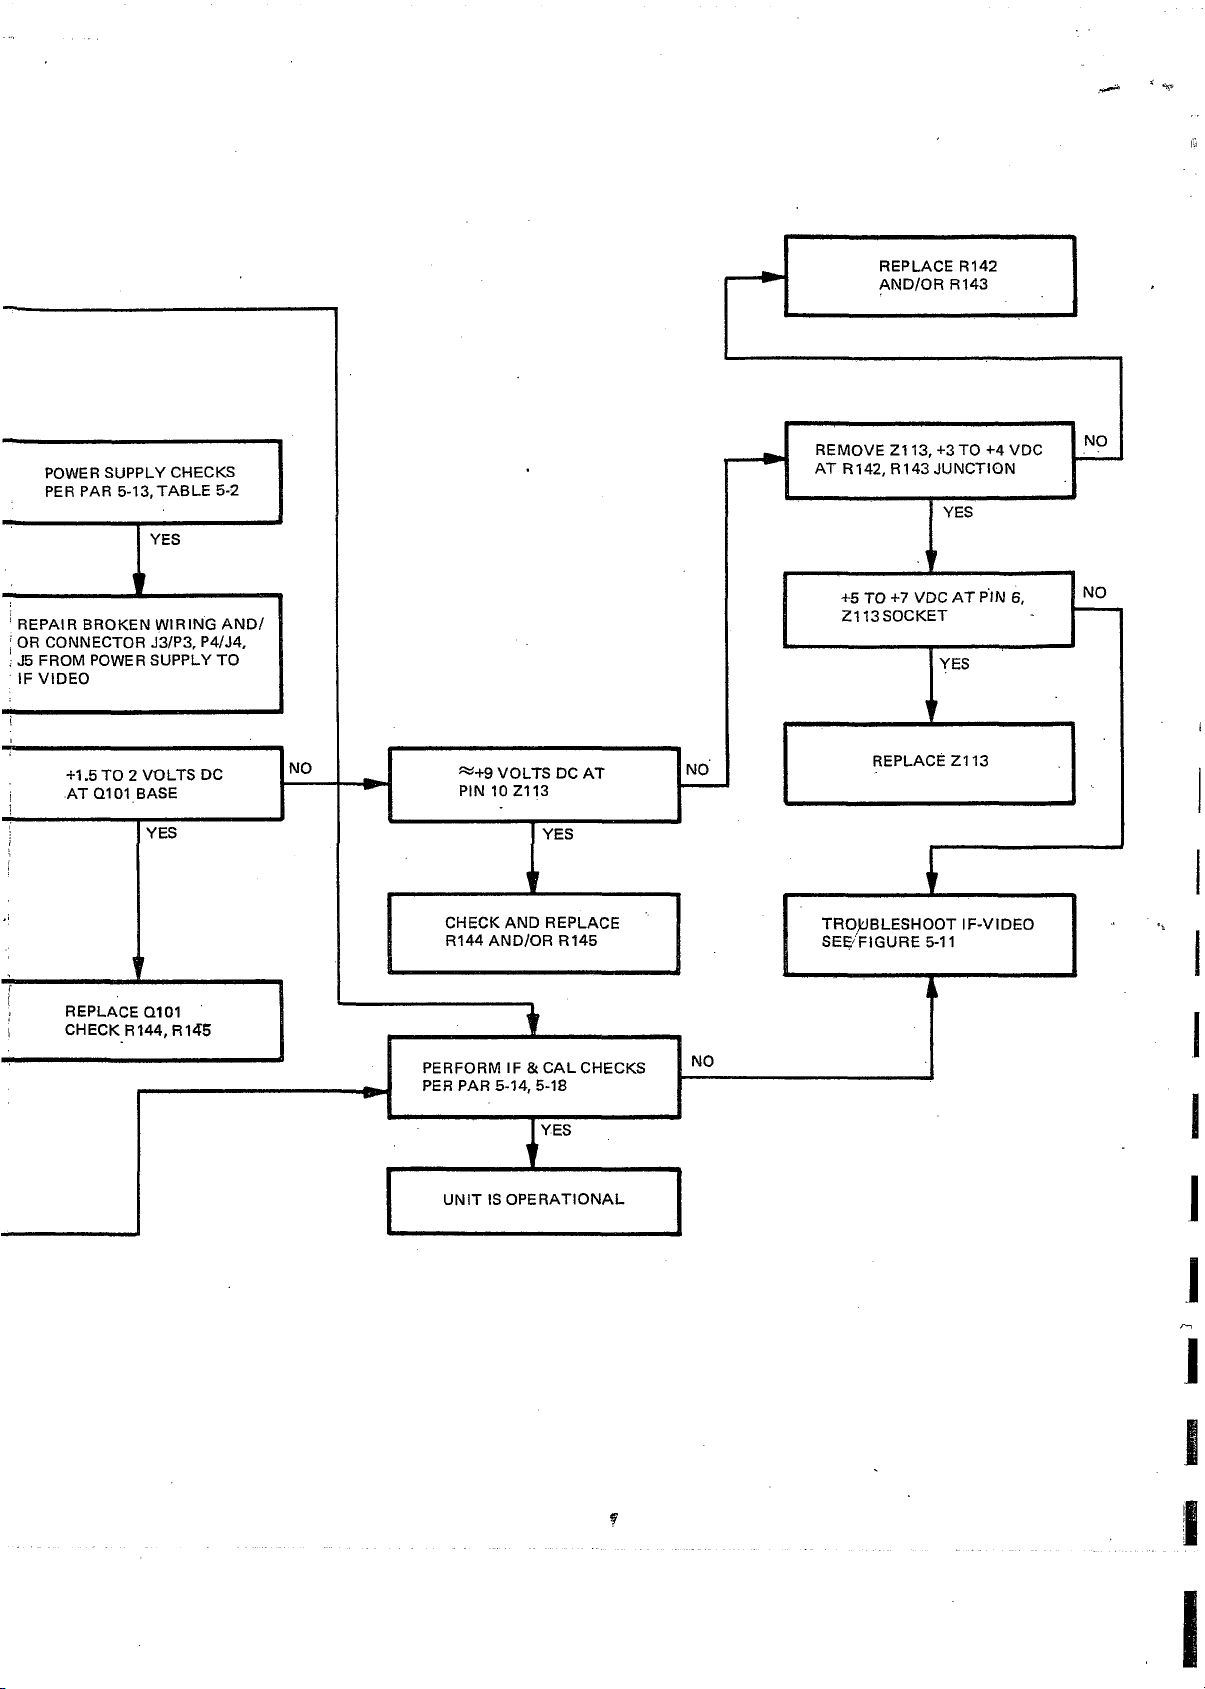
Page 66
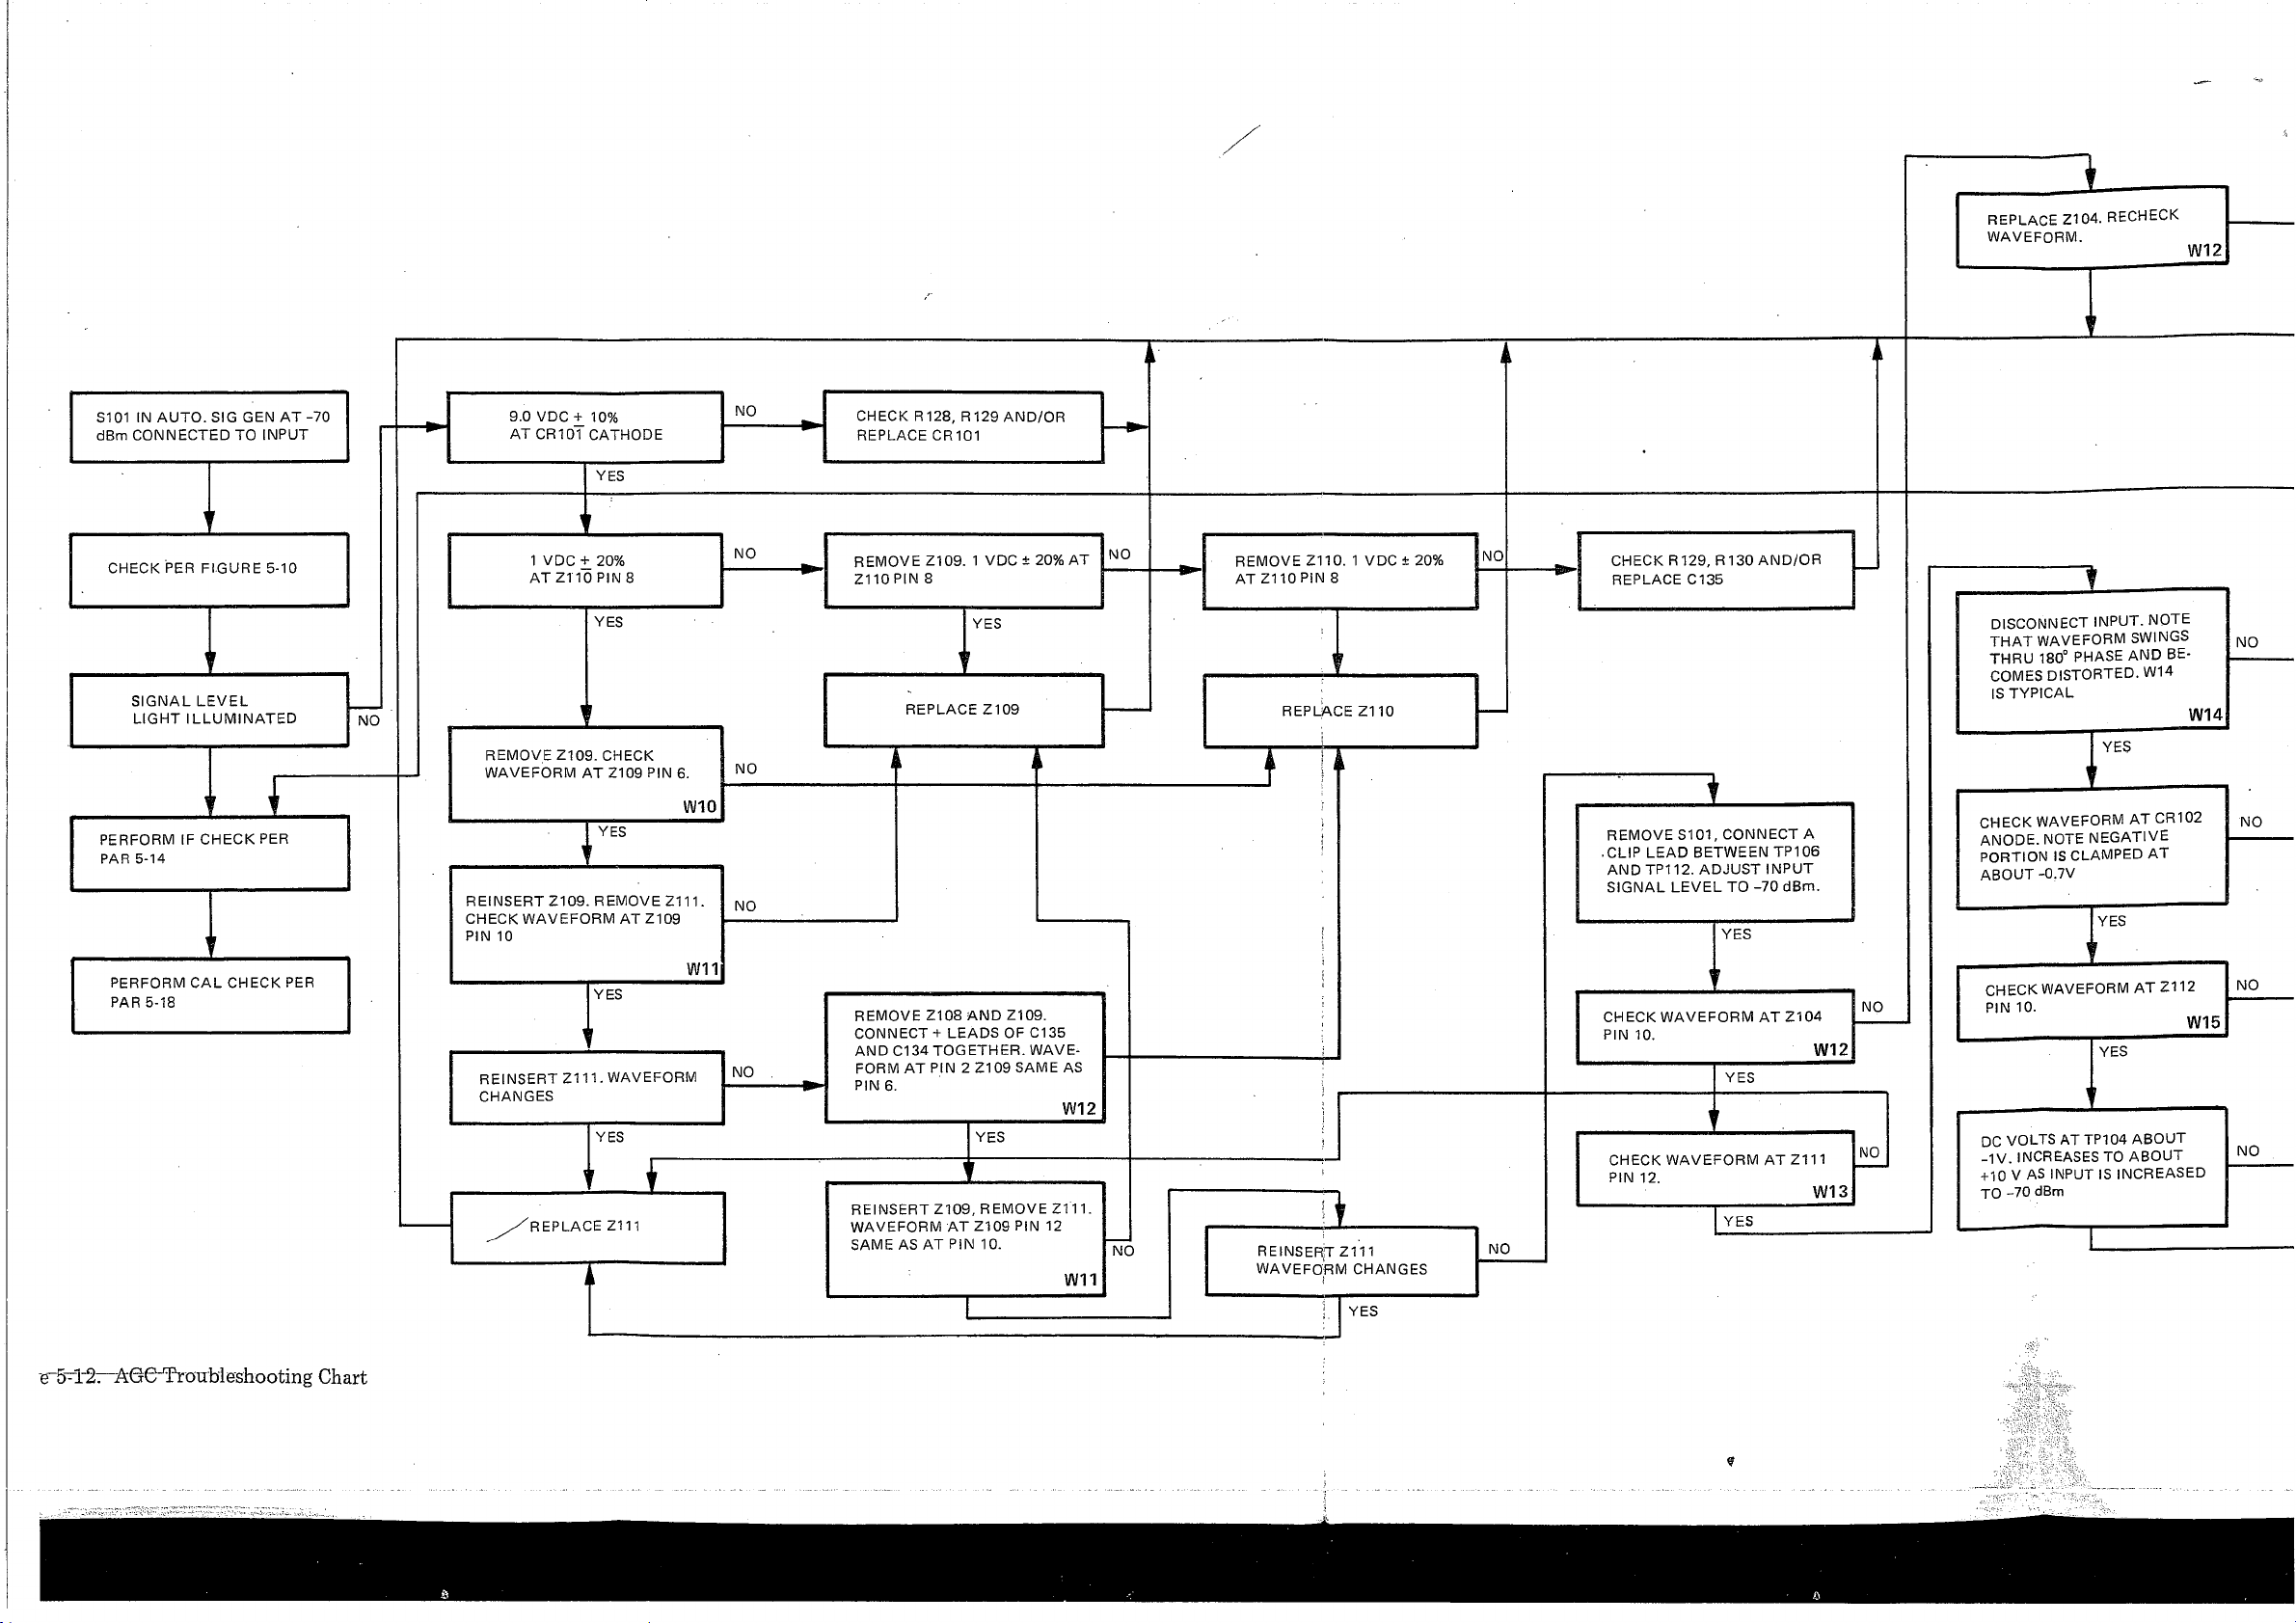
SI01 IN AUTO. SIG GEN AT -70
dBm CONNECTED TO INPUT
ï
REPLACE Z104. RECHECK
WAVEFORM.
W12
SIGNAL LEVEL
LIGHT ILLUMINATED
1 VDC + 20%
AT ZT10 PIN 8
YES
NO
REMOVE Z110. 1 VDC ± 20%
AT Z110 PIN 8
REP LAC
:e Z110
NO
CHECK R129, R130 AND/OR
REPLACE C135
1
REMOVE S101, CONNECT A
• CLIP LEAD BETWEEN TP106
AND TP112. ADJUST INPUT
SIGNAL LEVEL TO -70 dBm.
YES
' -
CHECK WAVEFORM AT Z104
PIN 10.
YES
1
' ■ _
CHECK WAVE
PIN 12.
FORM AT 2111
YES
W12
W13
NO
NO
1
DISCONNECT INPUT. NOTE
THAT WAVEFORM SWINGS
THRU 180° PHASE AND BE
COMES DISTORTED. W14
IS TYPICAL
W14
| VES
CHECK WAVEFORM A T CR102
ANODE. NOTE NEGATIVE
PORTION IS CLAMPED AT
ABOUT -0.7V
I ”
CHECK WAVEFORM AT Z112
PIN 10.
YES
1
' -
DC VOLTS AT TP104 ABOUT
_1 V. INCREASES TO ABOUT
+10 V AS INPUT IS INCREASED
TO -70 dBm
W15
NO
NO
NO
NO
e_5~r2r~AGG~Troubleshooting Chart
Page 67
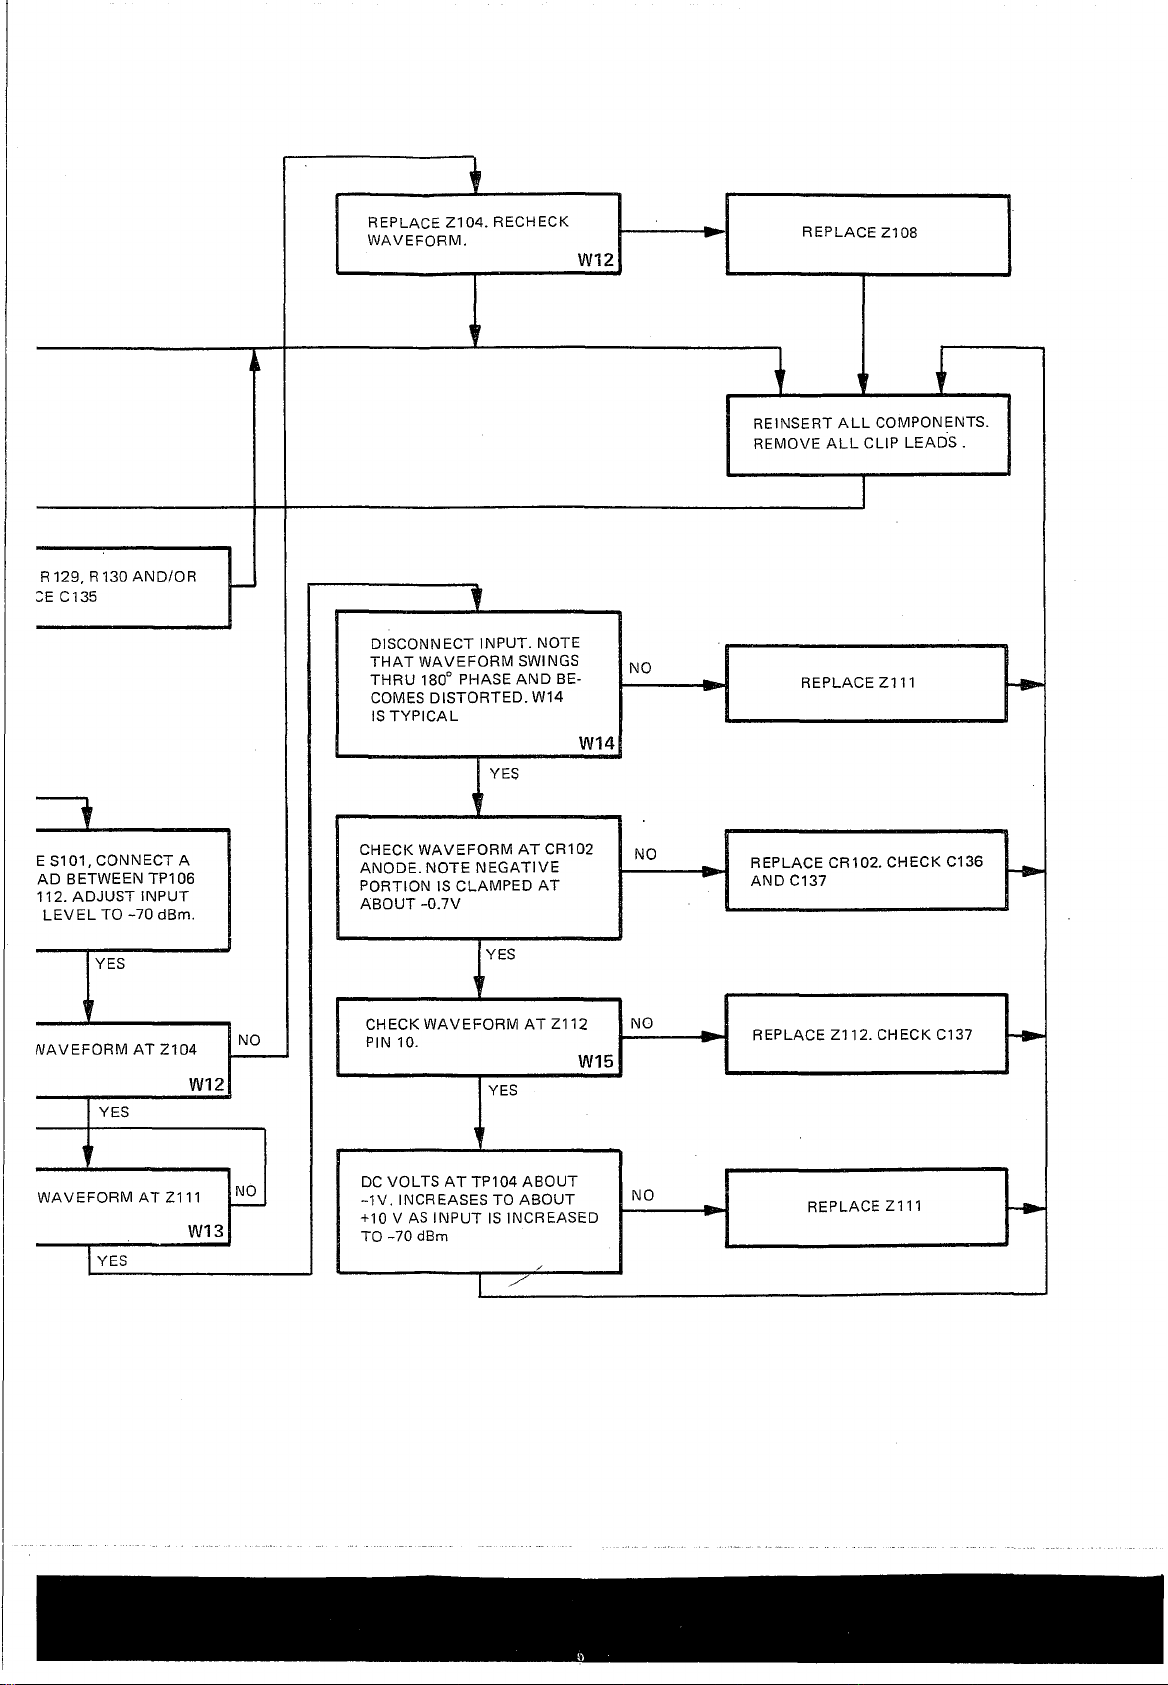
Page 68
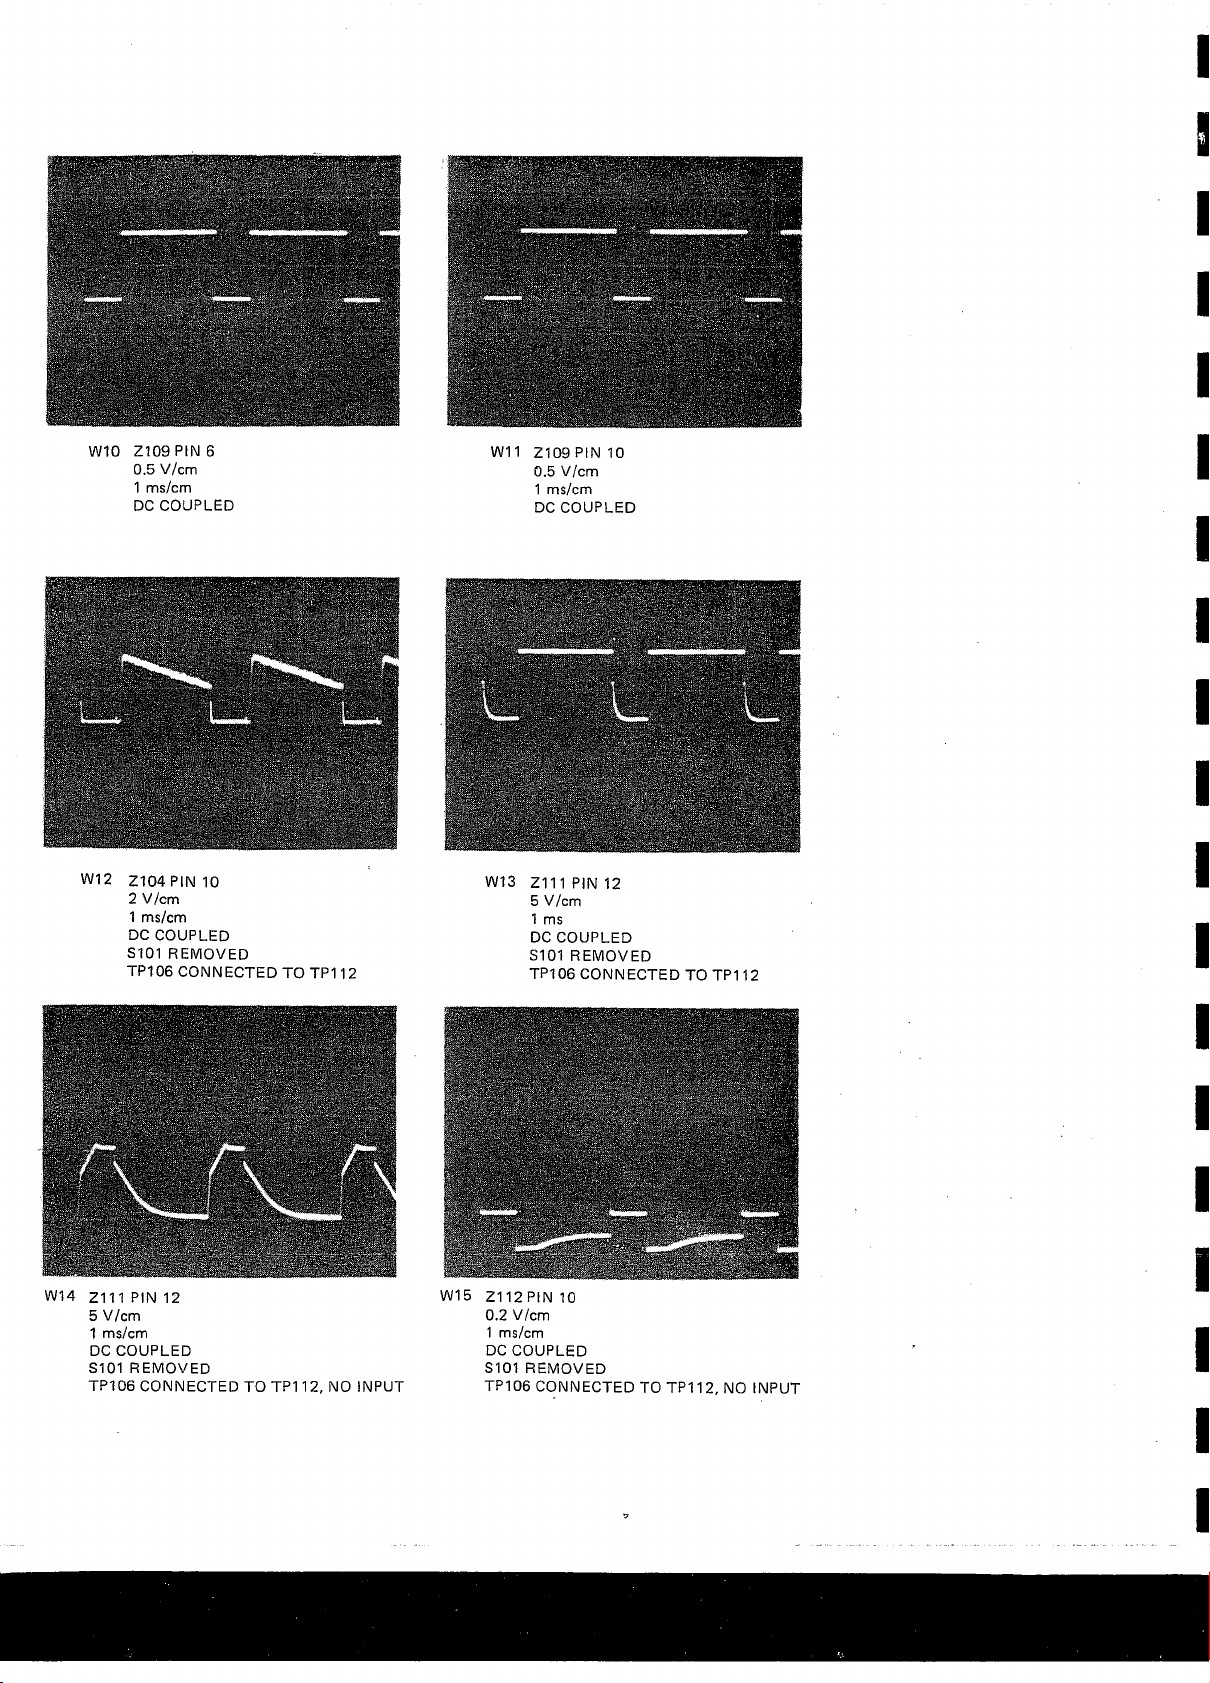
W10 Z109 PIN 6
0.5 V/cm
1 ms/cm
DC COUPLED
W11 Z109 PIN 10
0.5 V/cm
1 ms/cm
DC COUPLED
W12 Z104 PIN 10
2 V/cm
1 ms/cm
DC COUPLED
S101 REMOVED
TP 106 CONNECTED TO TP112
W14 Z111 PIN 12
5 V/cm
1 ms/cm
DC COUPLED
S101 REMOVED
TP 106 CONNECTED TO TP112, NO INPUT
W13 Z111 PIN 12
5 V/cm
1 ms
DC COUPLED
S101 REMOVED
TP 106 CONNECTED TO TP112
W15 Z112 PIN 10
0.2 V/cm
1 ms/cm
DC COUPLED
S101 REMOVED
TP106 CONNECTED TO TP112, NO INPUT
Page 69
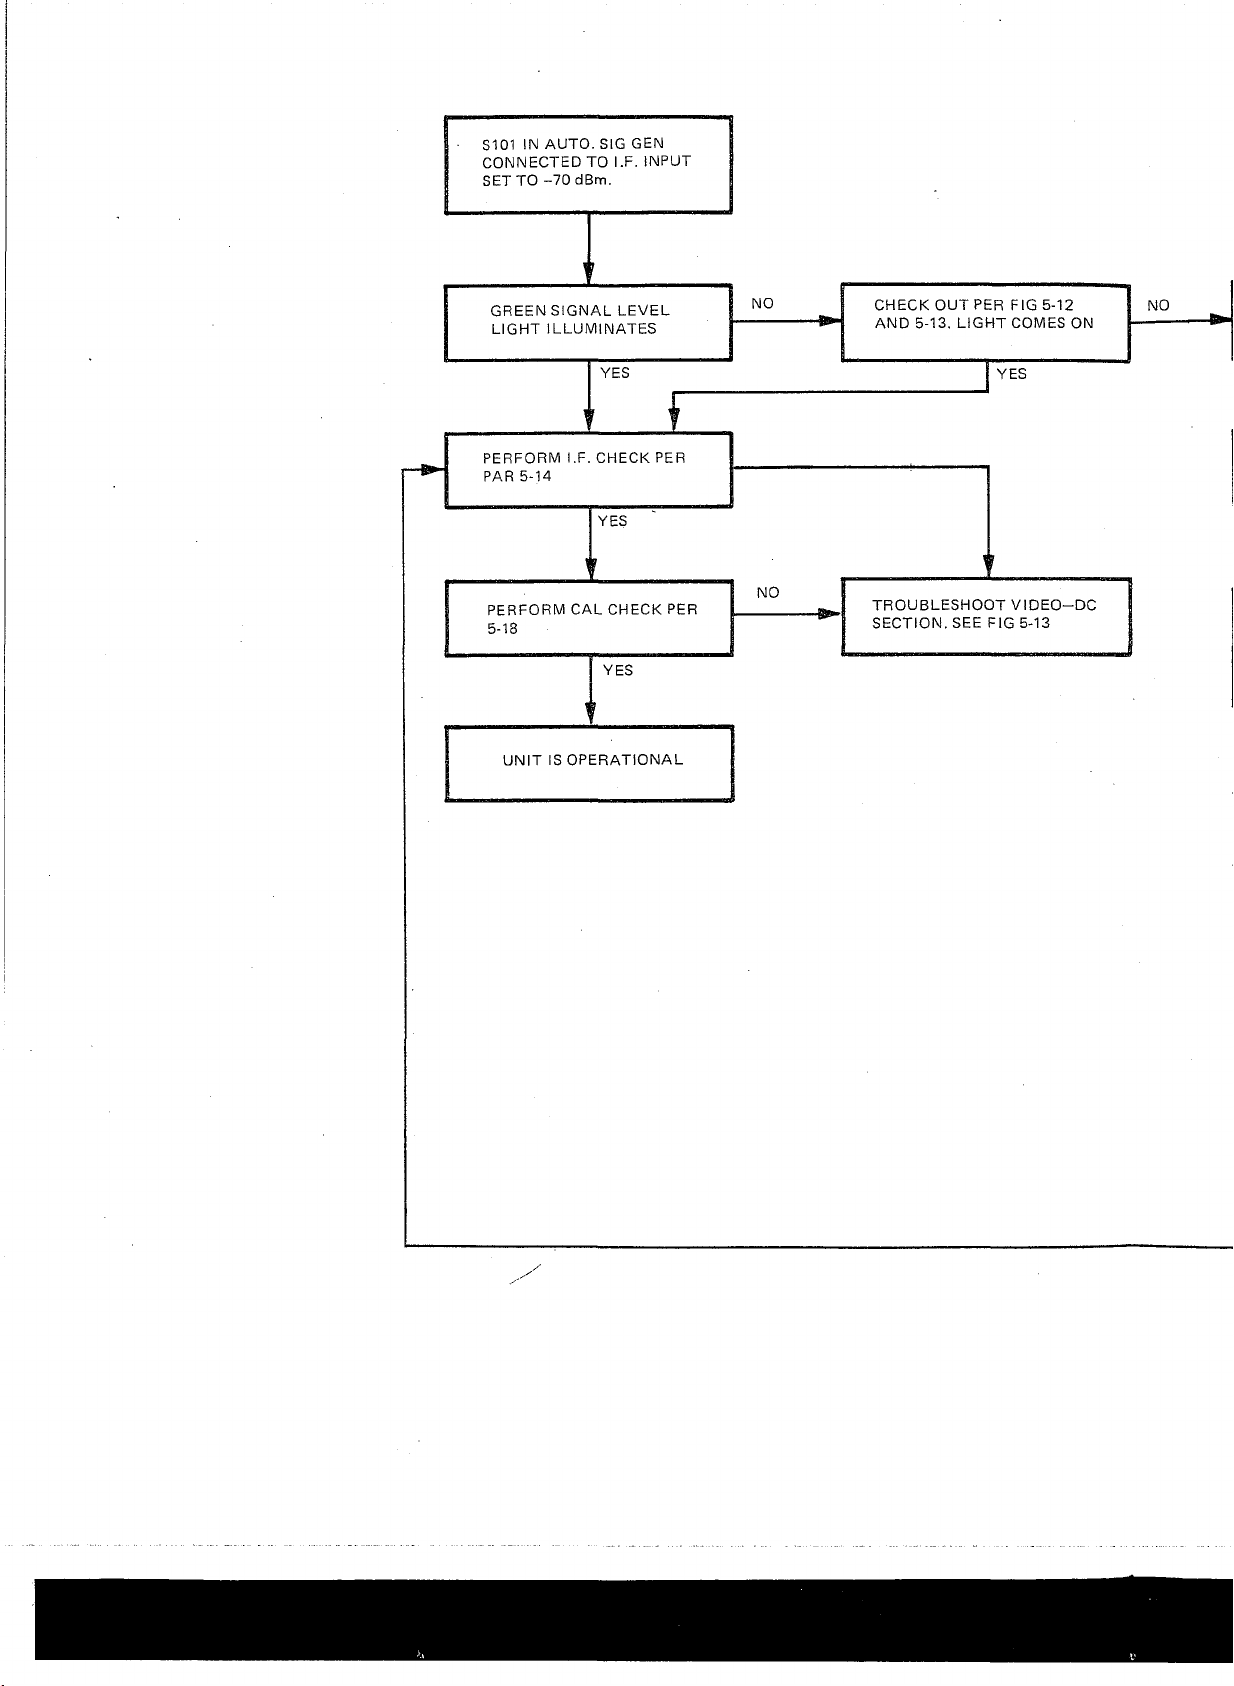
S101 IN AUTO. SIG GEN
CONNECTED TO I.F. INPUT
SET TO -70 dBm.
Page 70
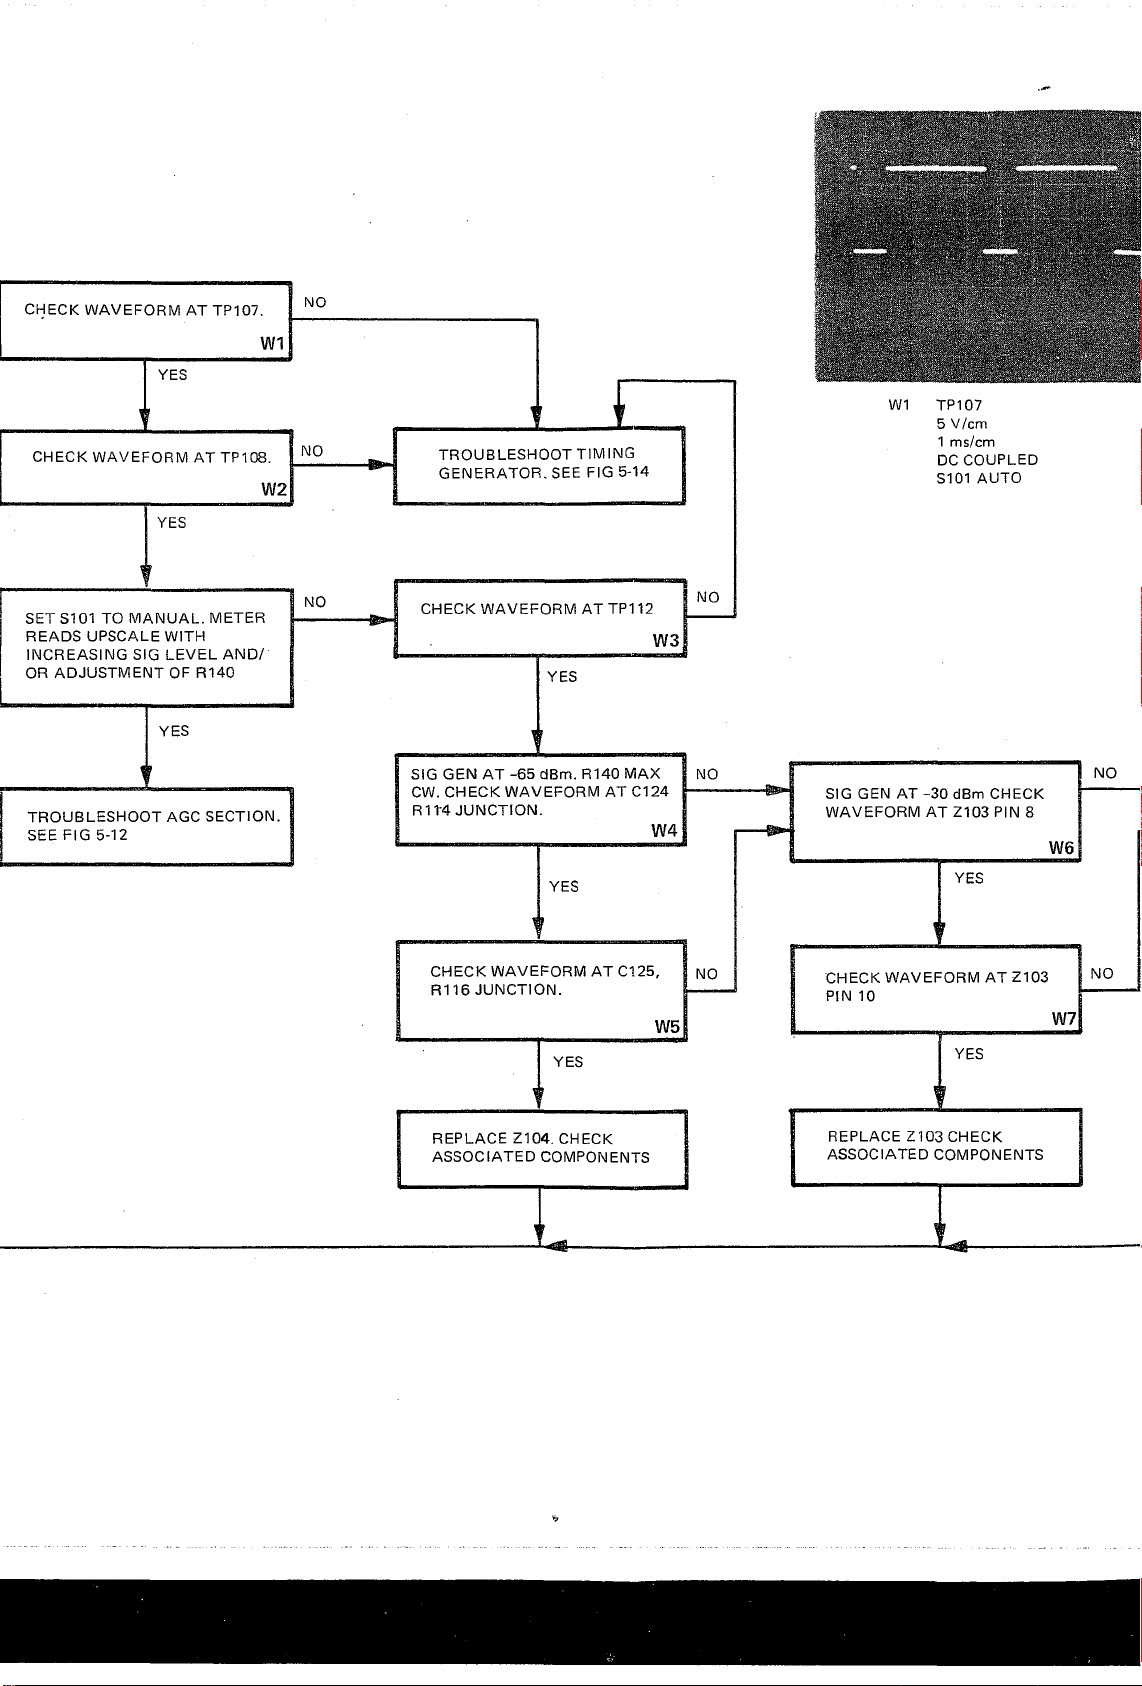
Page 71
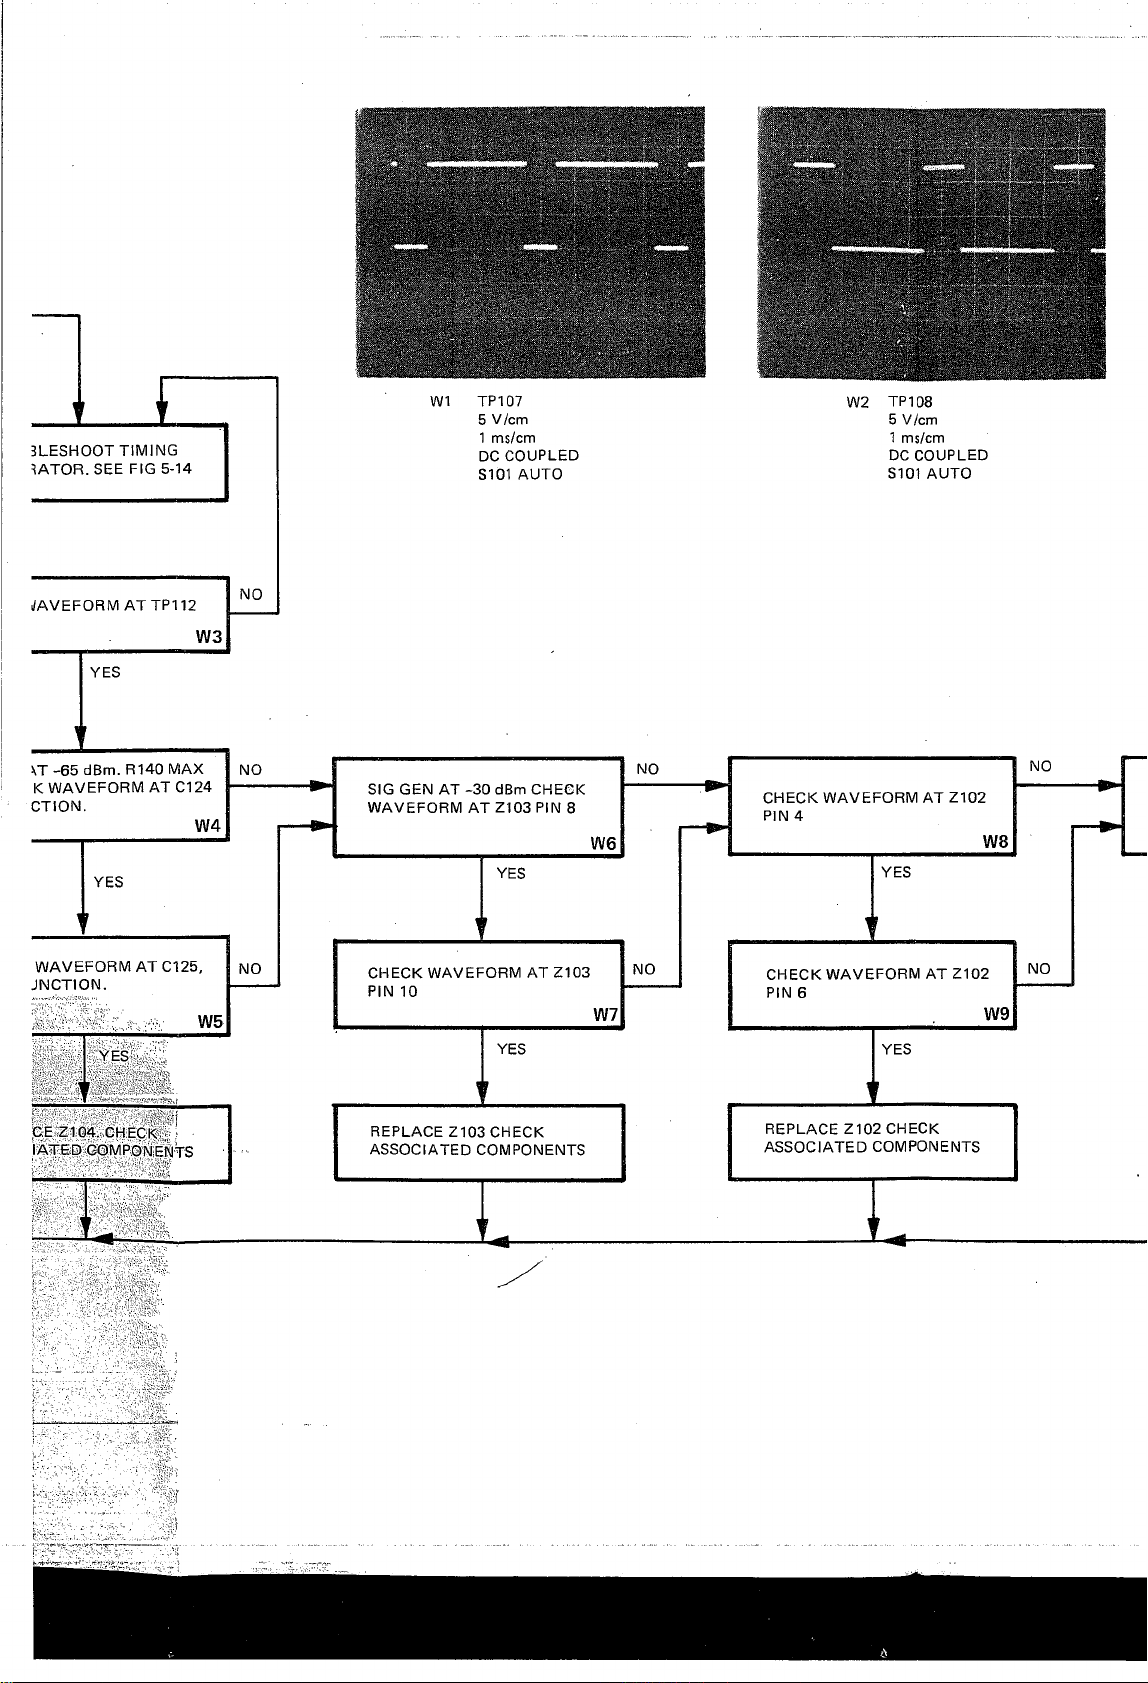
3L E S H 0 0 T TIMIN G
^ATO R. SEE FIG 5-14
W1
TP107
5 V/cm
1 ms/cm
DC COUPLED
SI 01 AUTO
Jggjraj
IBl
w m « » - - - - - - - - - - - - - - - - - - - - - - - - - -
mms rnt
SSI
W2
TP108
5 V/cm
SI 01 A U TO
1 ms/cm
DC C OUPLED
i/AVEF O RM AT TP 1 12
YES
\T -65 dBm. R140 MAX
K WAVEFORM AT C124
CTION.
YES
r
1
WAVEFORM AT C125,
• W5
YES
1
CE Z104 CHECK
IATED COMPONENTS
W3
NO
NO
NO
blU üfcN AT -30 dBm CHtCK
WAVEFORM AT Z103 PIN 8
YES
1
1 1
CHECK WAVEFORM AT Z103
PIN 10
YES
1
REPLACE Z103CHECK
ASSOCIATED COMPONENTS
W6
W7
NO
NO
CHECK WAVEFORM AT Z102
PIN 4
ipu-
CHECK WAVEFORM AT Z102
PIN 6
REPLACE Z102CHECK
ASSOCIATED COMPONENTS
NO
W8
YES
NO
. W9
YES
1
r
I
I [
Page 72
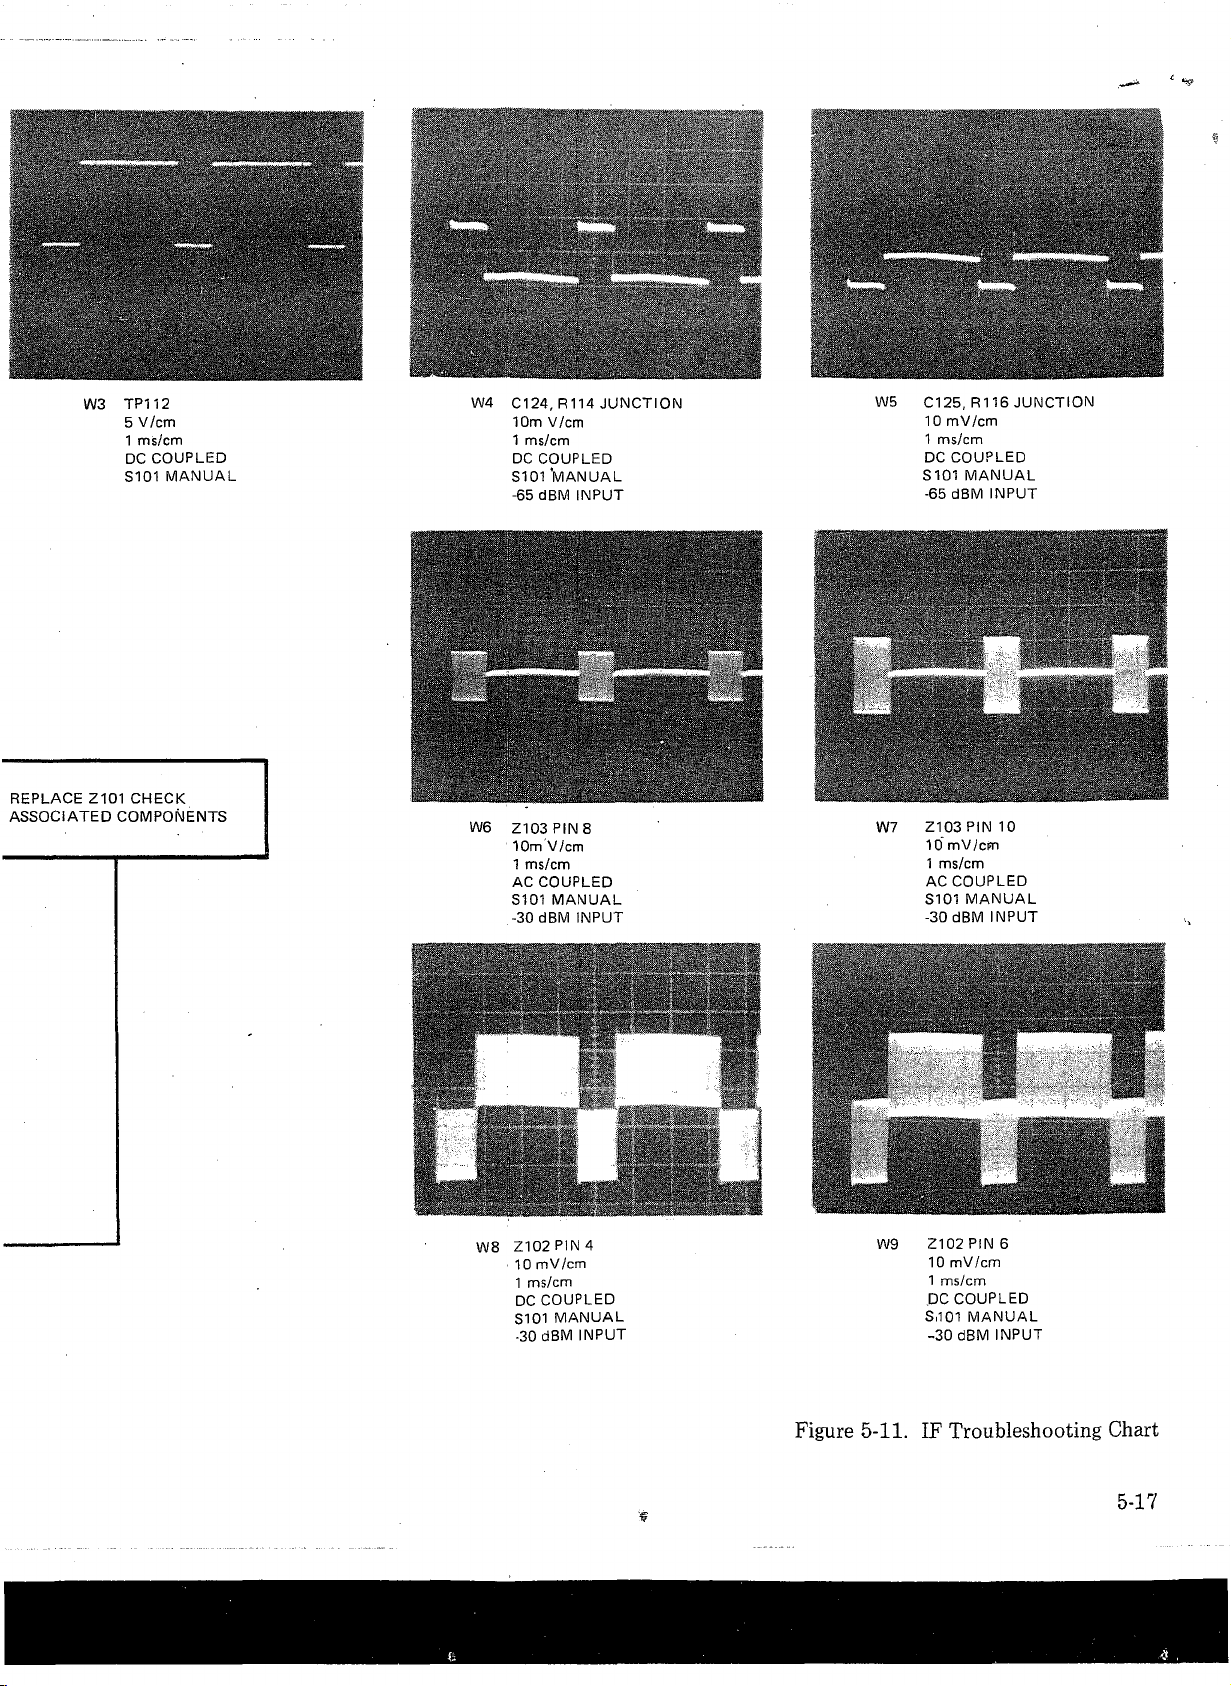
TP112
W3
5 V/cm
1 ms/cm
DC COUPLED
S101 MANUAL
REPLACE Z101 CHECK
ASSOCIATED COMPONENTS
W4 C124, R114 JUNCTION
10m V/cm
1 ms/cm
DC COUPLED
S101 'MANUAL
-65 dBM INPUT
W6 Z103 PIN 8
10m V/cm
1 ms/cm
AC COUPLED
S101 MANUAL
-30 dBM INPUT
W5 C125, R116 JUNCTION
10 mV/cm
1 ms/cm
DC COUPLED
S101 MANUAL
-65 dBM INPUT
W7 Z103 PIN 10
10 mV/cPn
1 ms/cm
AC COUPLED
S101 MANUAL
-30 dBM INPUT
W8 Z102PIN4
10 mV/cm
1 ms/cm
DC COUPLED
S101 MANUAL
-30 dBM INPUT
W9 Z102 PIN 6
10 mV/cm
1 ms/cm
DC COUPLED
S.101 MANUAL
-30 dBM INPUT
Figure 5-11. IF Troubleshooting Chart
5-17
Page 73
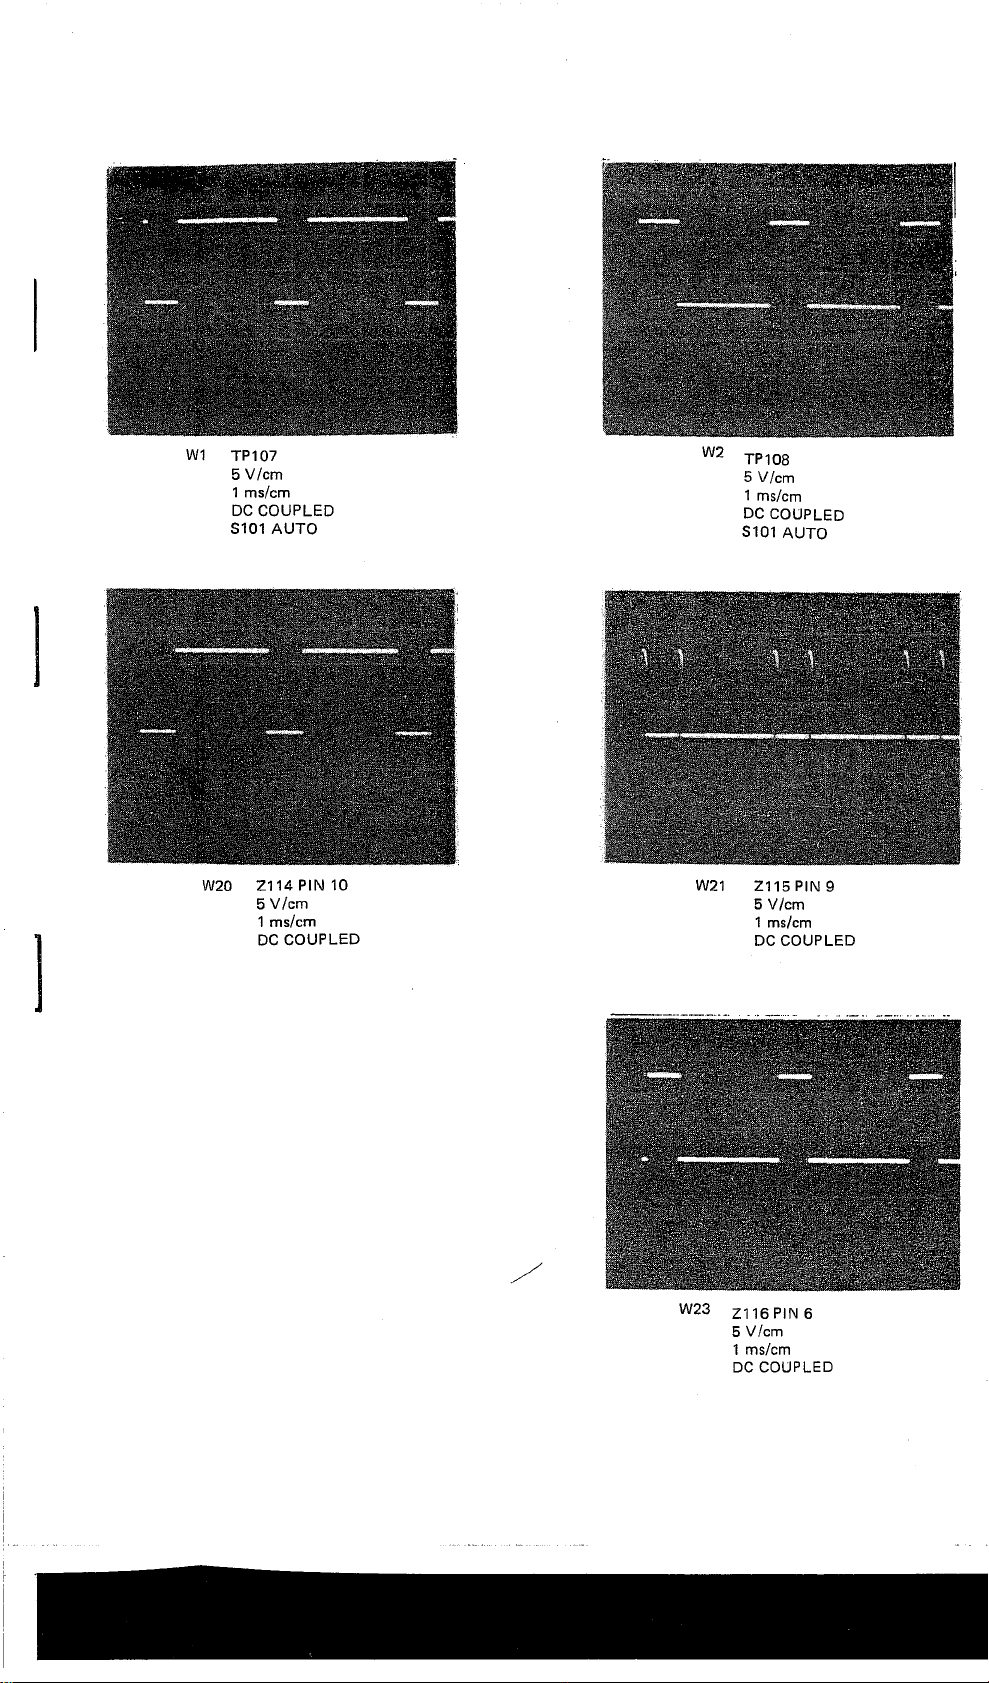
iMaMlwmm
wsmt
TP 107
5 V/cm
1 ms/cm
DC COUPLED
S101 AUTO
W20 Z114 PIN 10 W21 Z115 PIN 9
5 V/cm 5 V/cm
1 ms/cm 1 ms/cm
DC COUPLED DC COUPLED
W2
TP 108
5 V/cm
1 ms/cm
DC COUPLED
S101 AUTO
u
" ■ "" T r
,JW*l
?3r£
W23 Z116 PIN 6
5 V/cm
1 ms/cm
DC COUPLED
i
I
Page 74
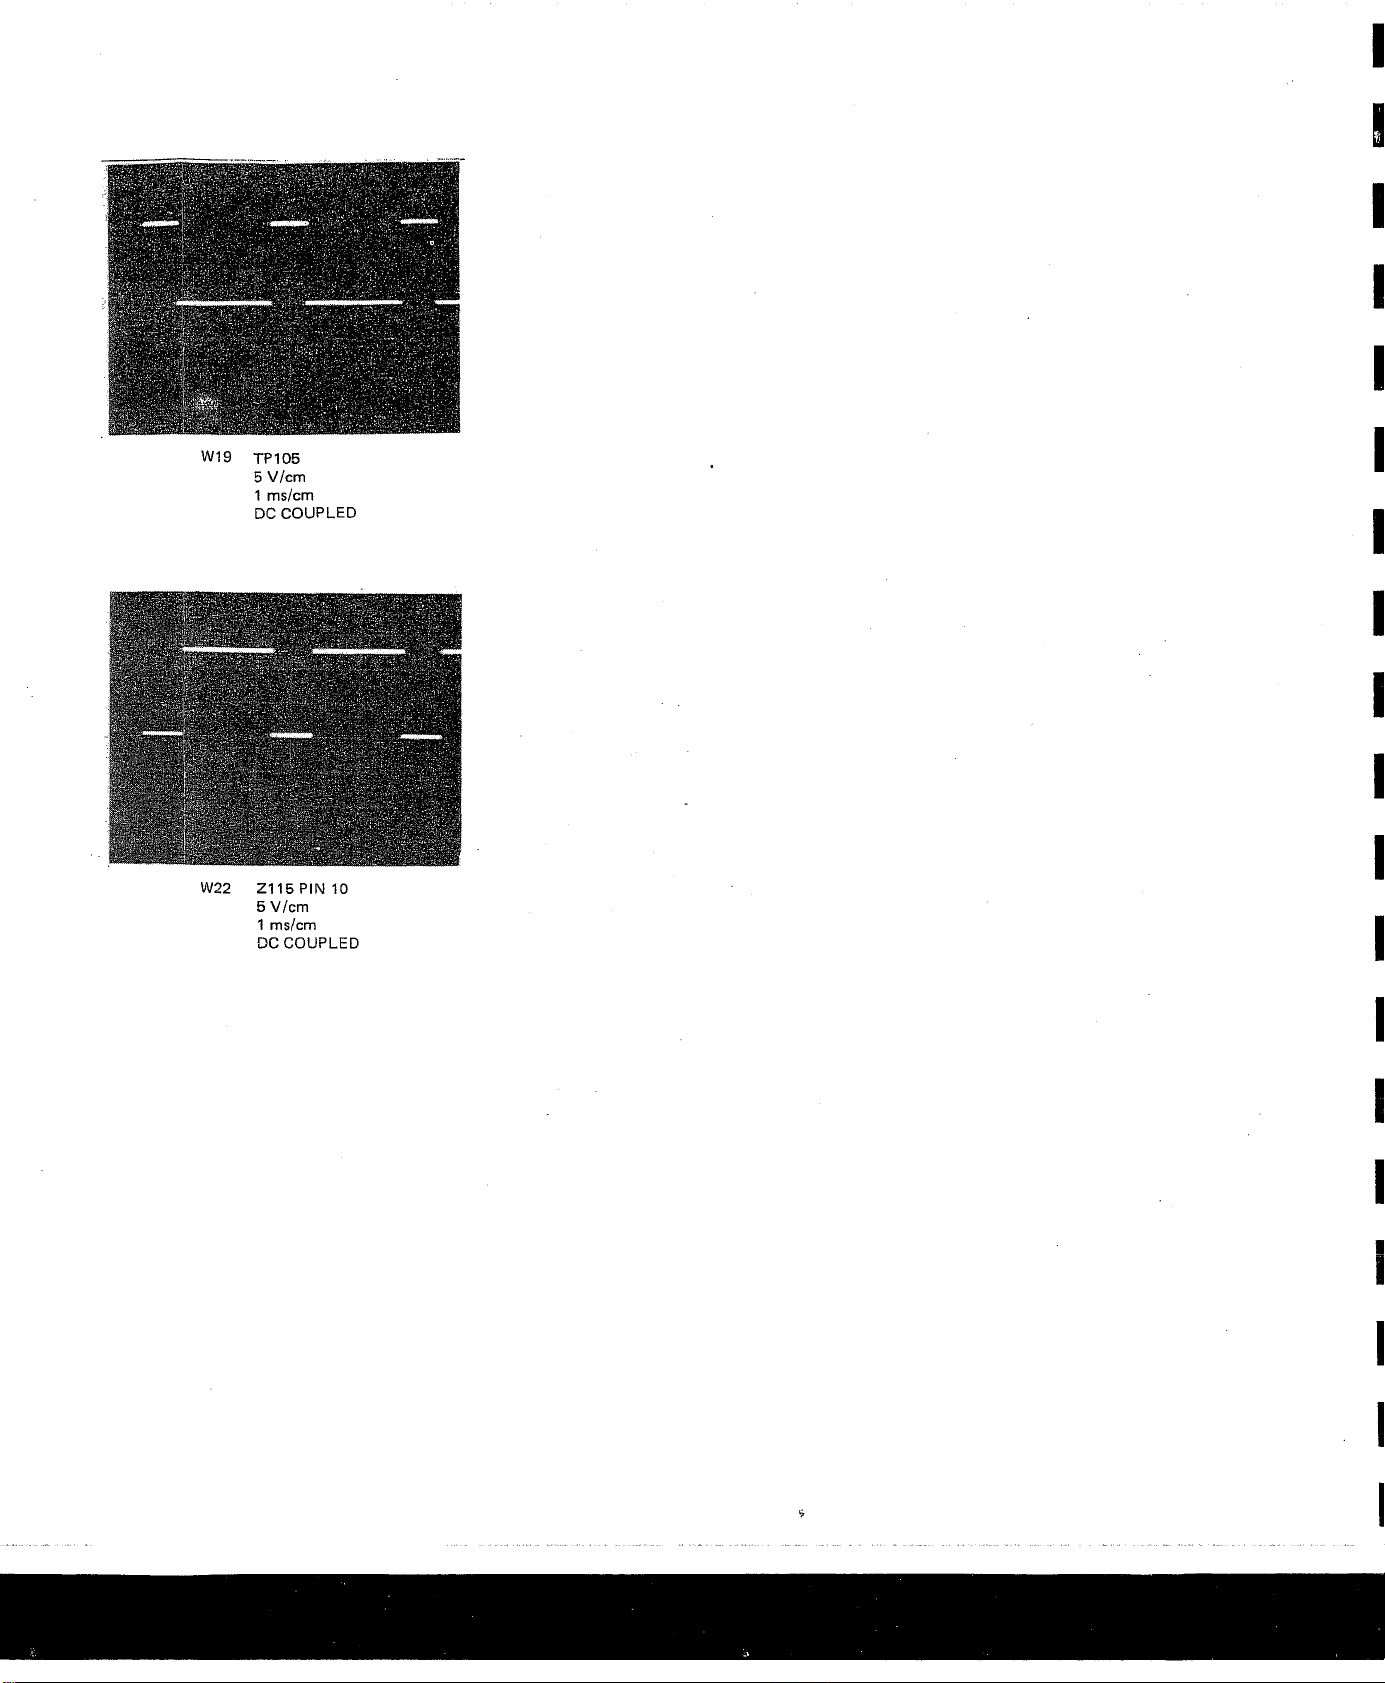
W19
TP 105
5 V/cm
1 ms/cm
DC COUPLED
W22 Z115 PIN 10
5 V/cm
1 ms/cm
DC COUPLED
Page 75
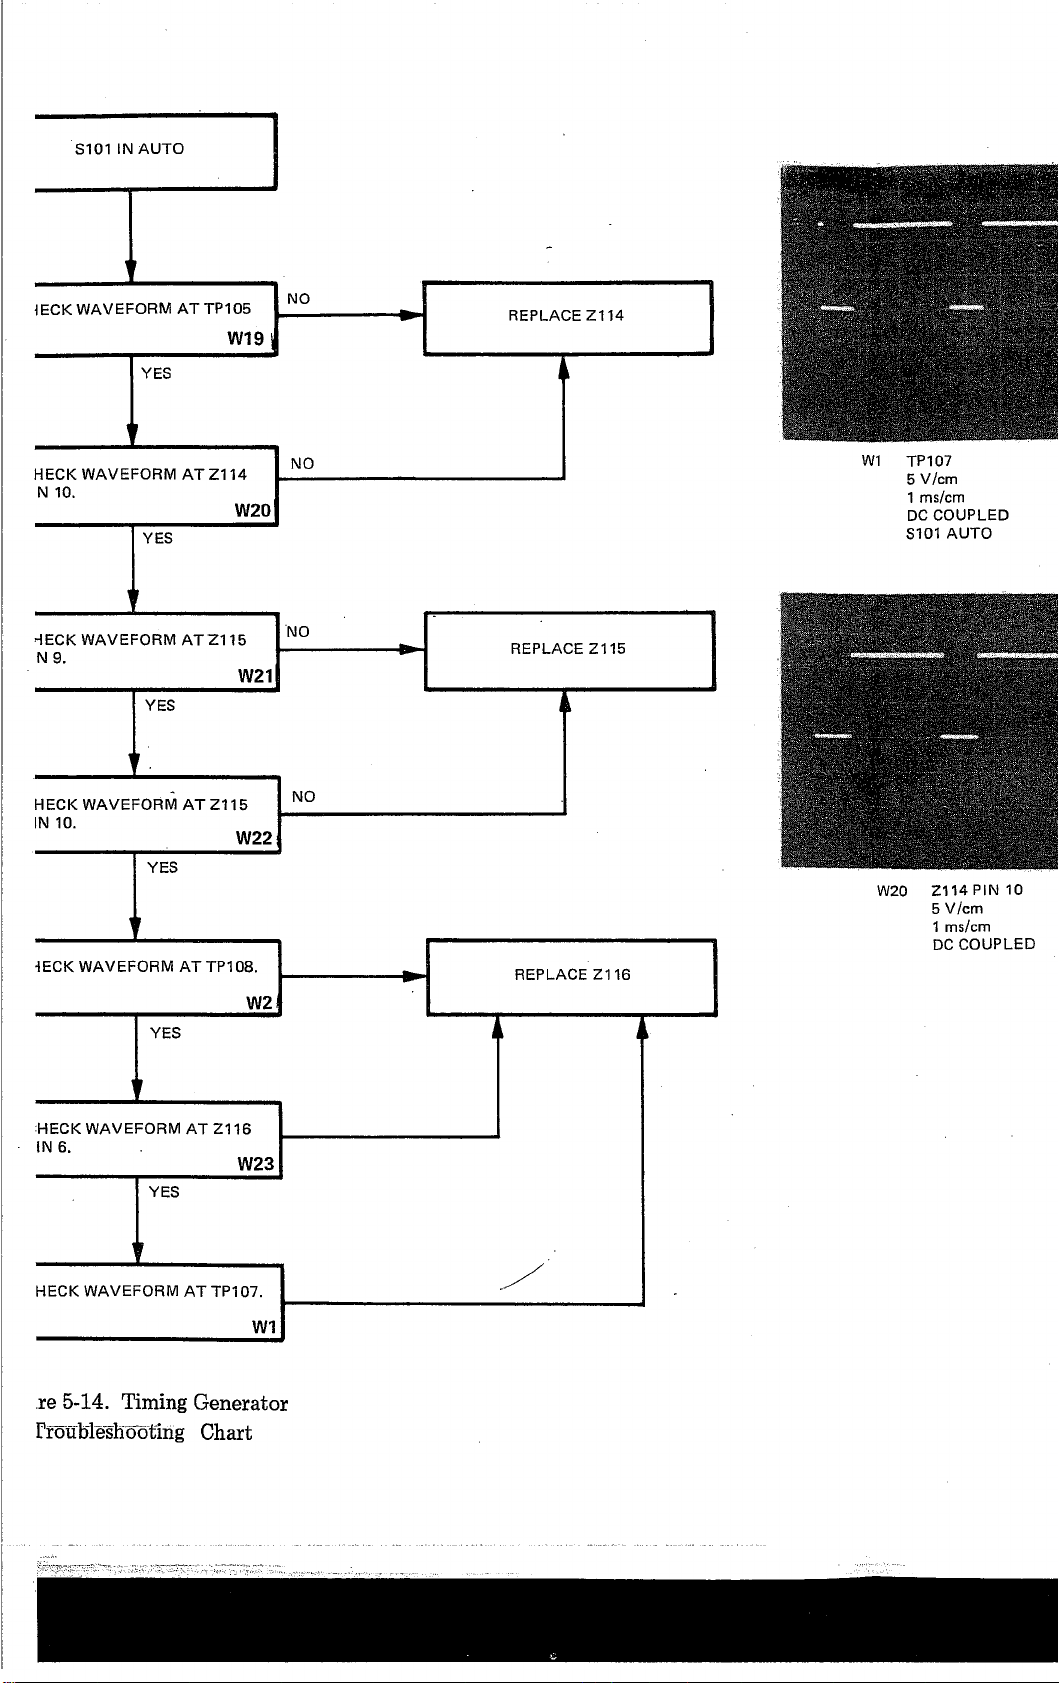
S101 IN AUTO
W1 TP 107
5 V/cm
1 ms/cm
DC COUPLED
S101 AUTO
re 5-14. Timing Generator
Troubleshooting Chart
W20 Z114 PIN 10
5 V/cm
1 ms/cm
DC COUPLED
Page 76
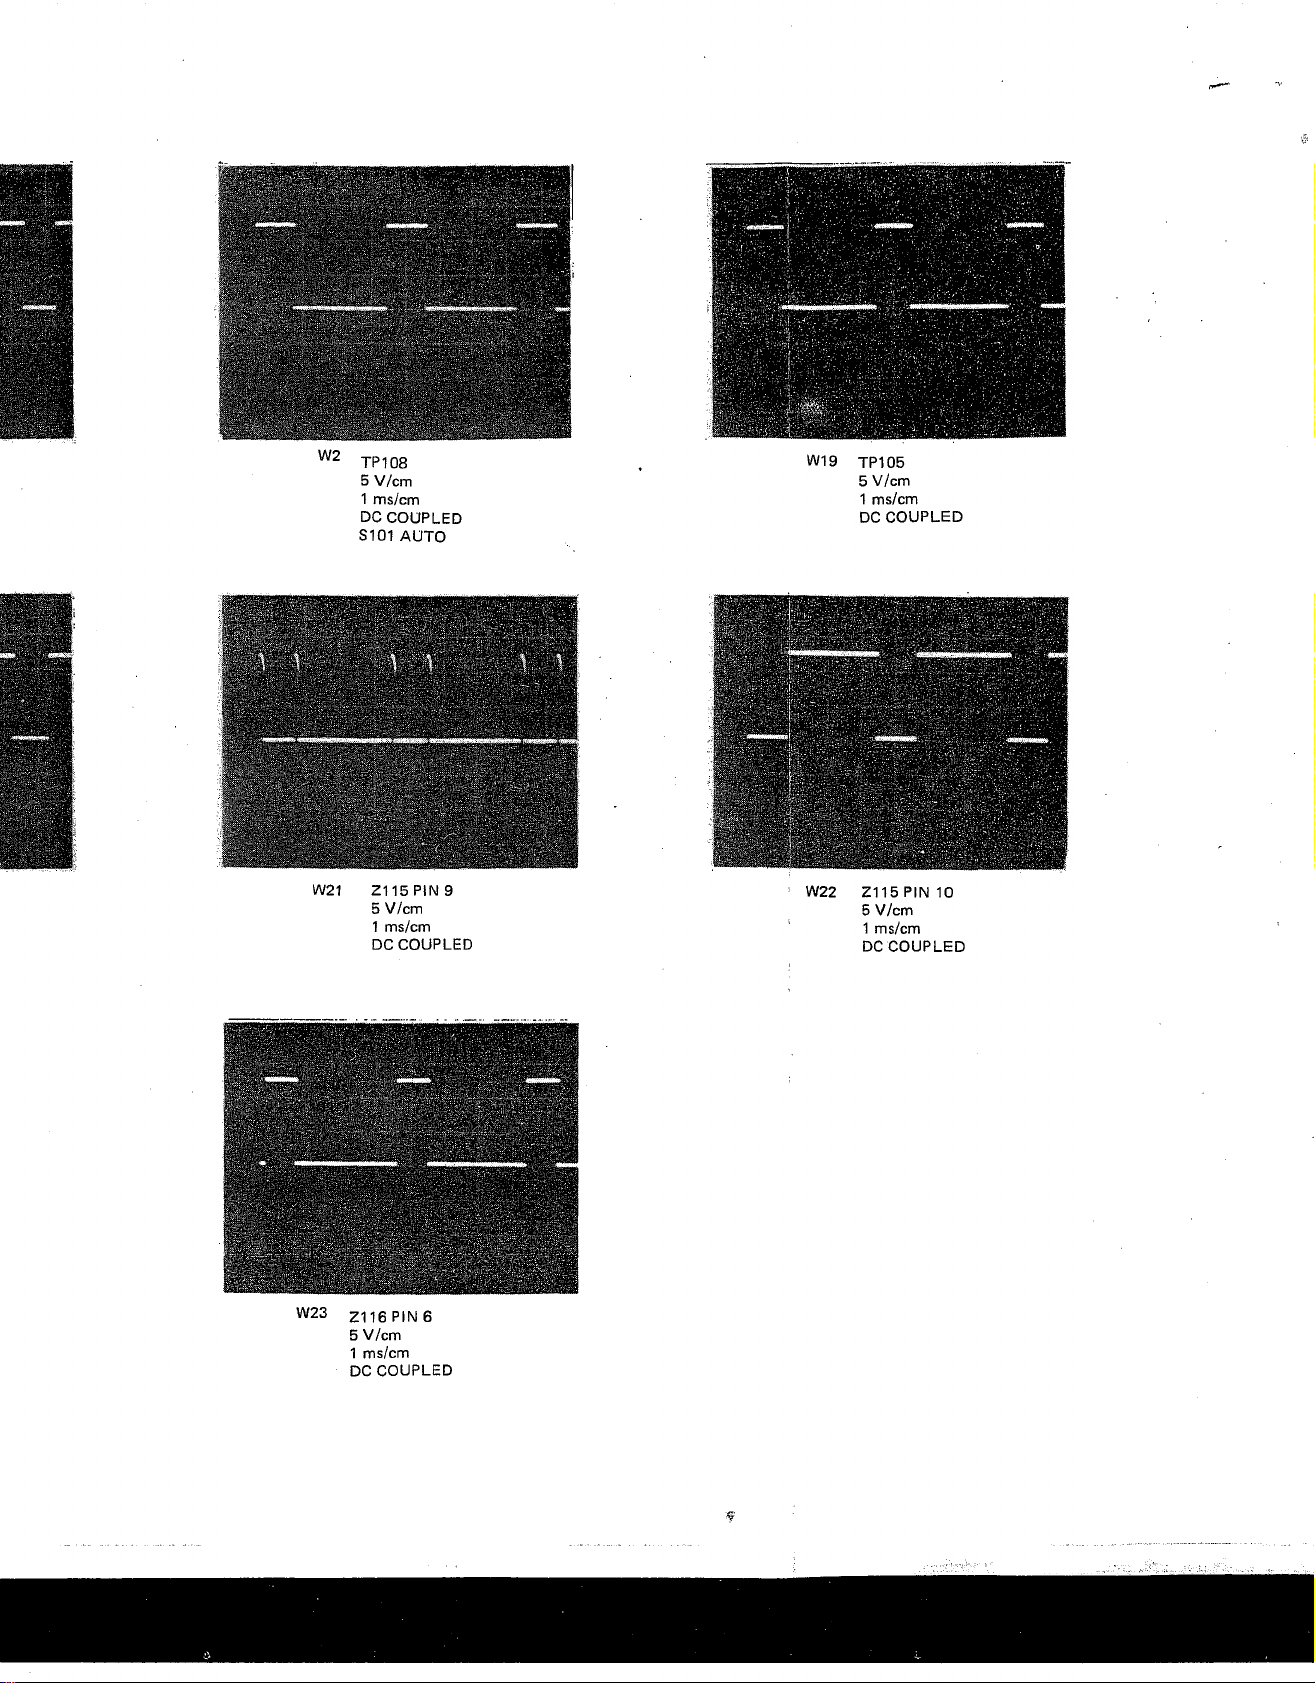
W2
TP 108
5 V/cm
1 ms/cm
DC COUPLED
S101 AUTO
W19
TP105
5 V/cm
1 ms/cm
DC COUPLED
W21 Z115 PIN 9
5 V/cm
1 ms/cm
DC COUPLED
W23 Z116 PIN 6
5 V/cm
1 ms/cm
DC COUPLED
W22 Z115 PIN 10
5 V/cm
1 ms/cm
DC COUPLED
Page 77
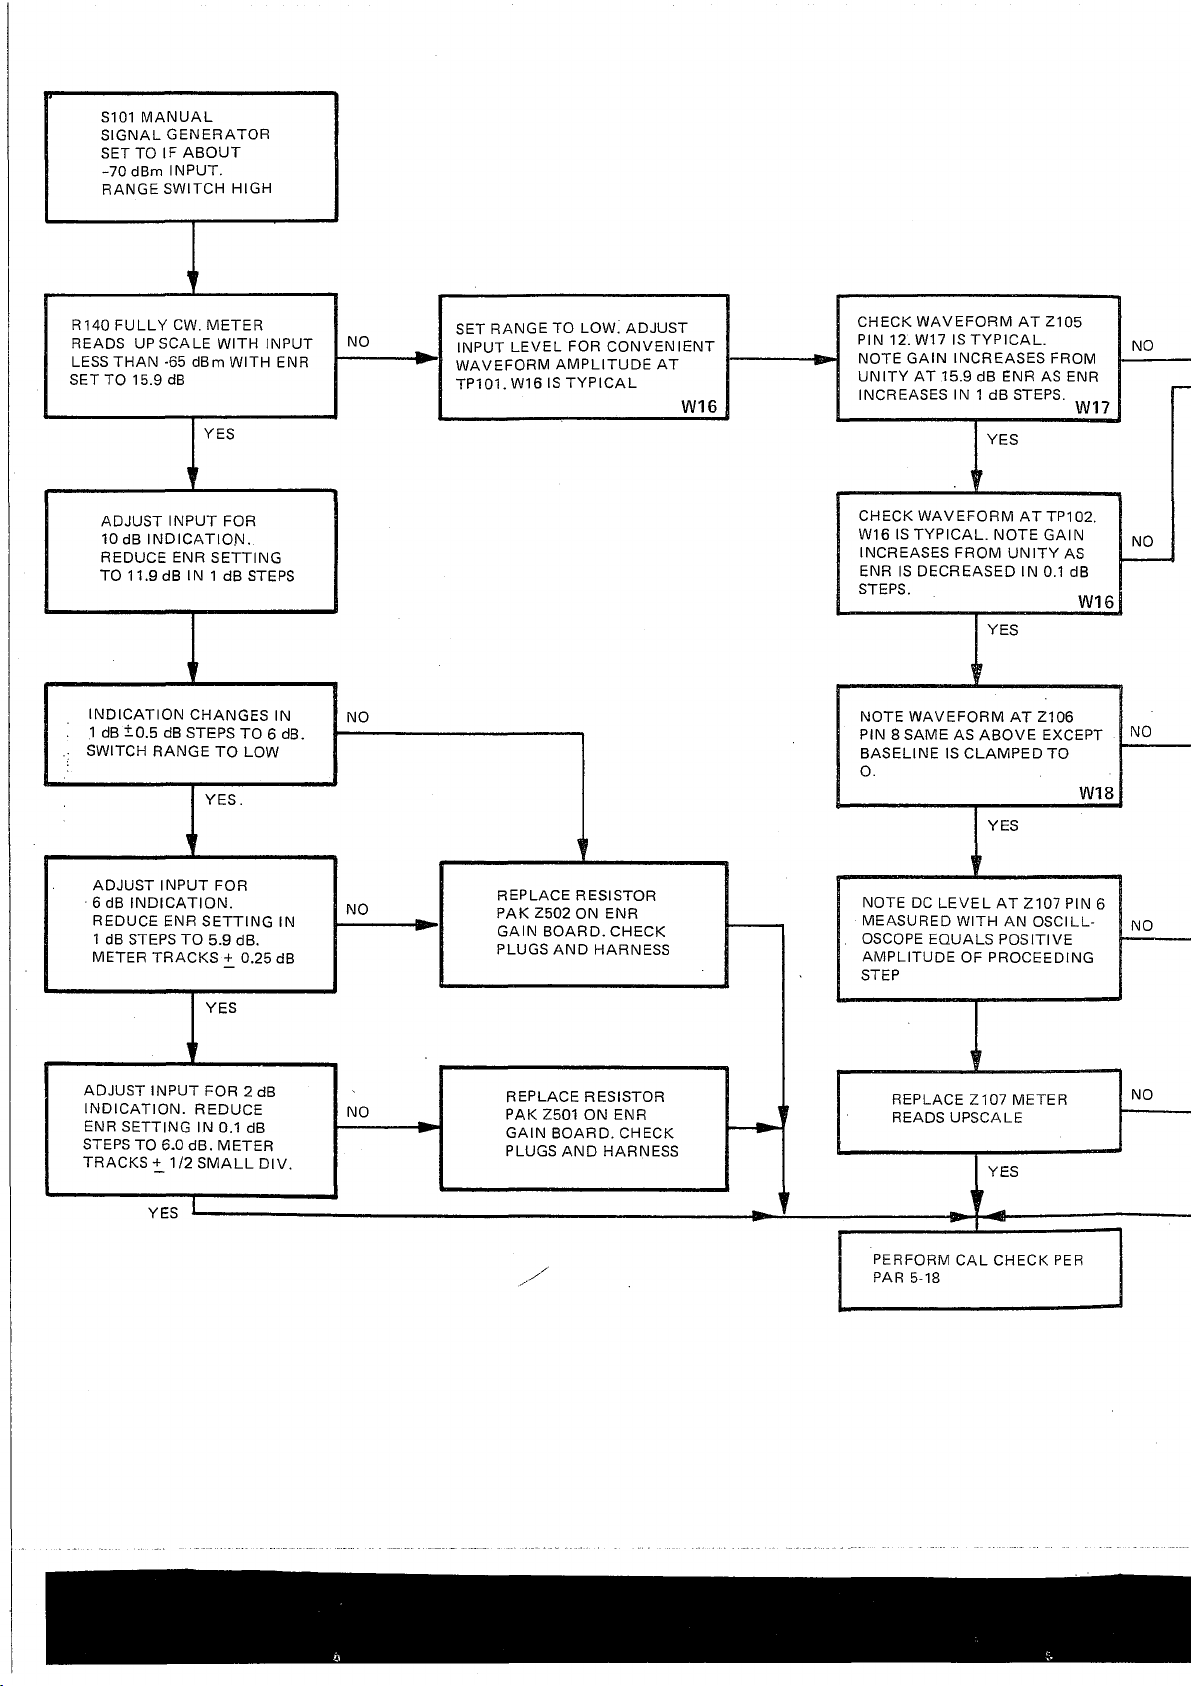
S101 MANUAL
SIGNAL GENERATOR
SET TO IF ABOUT
-70 dBm INPUT.
RANGE SWITCH HIGH
R140 FULLY CW. METER
READS UPSCALE WITH INPUT
LESS THAN -65 dBm WITH ENR
SET TO 15.9 dB
YES
NO
SET RANGE TO LOW! ADJUST
INPUT LEVEL FOR CONVENIENT
WAVEFORM AMPLITUDE AT
TP101.W16 IS TYPICAL
W16
CHECK WAVEFORM AT Z105
PIN 12. W17 IS TYPICAL.
NOTE GAIN INCREASES FROM
UNITY AT 15.9 dB ENR AS ENR
INCREASES IN 1 dB STEPS.
YES
W17
X
CHECK WAVEFORM ATTP102.
W16 IS TYPICAL. NOTE GAIN
INCREASES FROM UNITY AS
ENR IS DECREASED IN 0.1 dB
STEPS. .
YES
?
NOTE WAVEFORM AT Z106
PIN 8 SAME AS ABOVE EXCEPT
BASELINE IS CLAMPED TO
0. .
YES
W16|
W18
NO
NO
NO
ADJUST INPUT FOR 2 dB
INDICATION. REDUCE
ENR SETTING IN 0.1 dB
STEPS TO 6.0 dB. METER
TRACKS + 1/2 SMALL DIV.
YES
NO
--------------
NOTE DC LEVEL AT Z107 PIN 6
MEASURED WITH AN OSCILL
OSCOPE EQUALS POSITIVE
AMPLITUDE OF PROCEEDING
STEP
REPLACE RESISTOR
►
PAK Z501 ON ENR
GAIN BOARD. CHECK
PLUGS AND HARNESS
PERFORM CAL CHECK PER
PAR 5-18
NO
Page 78
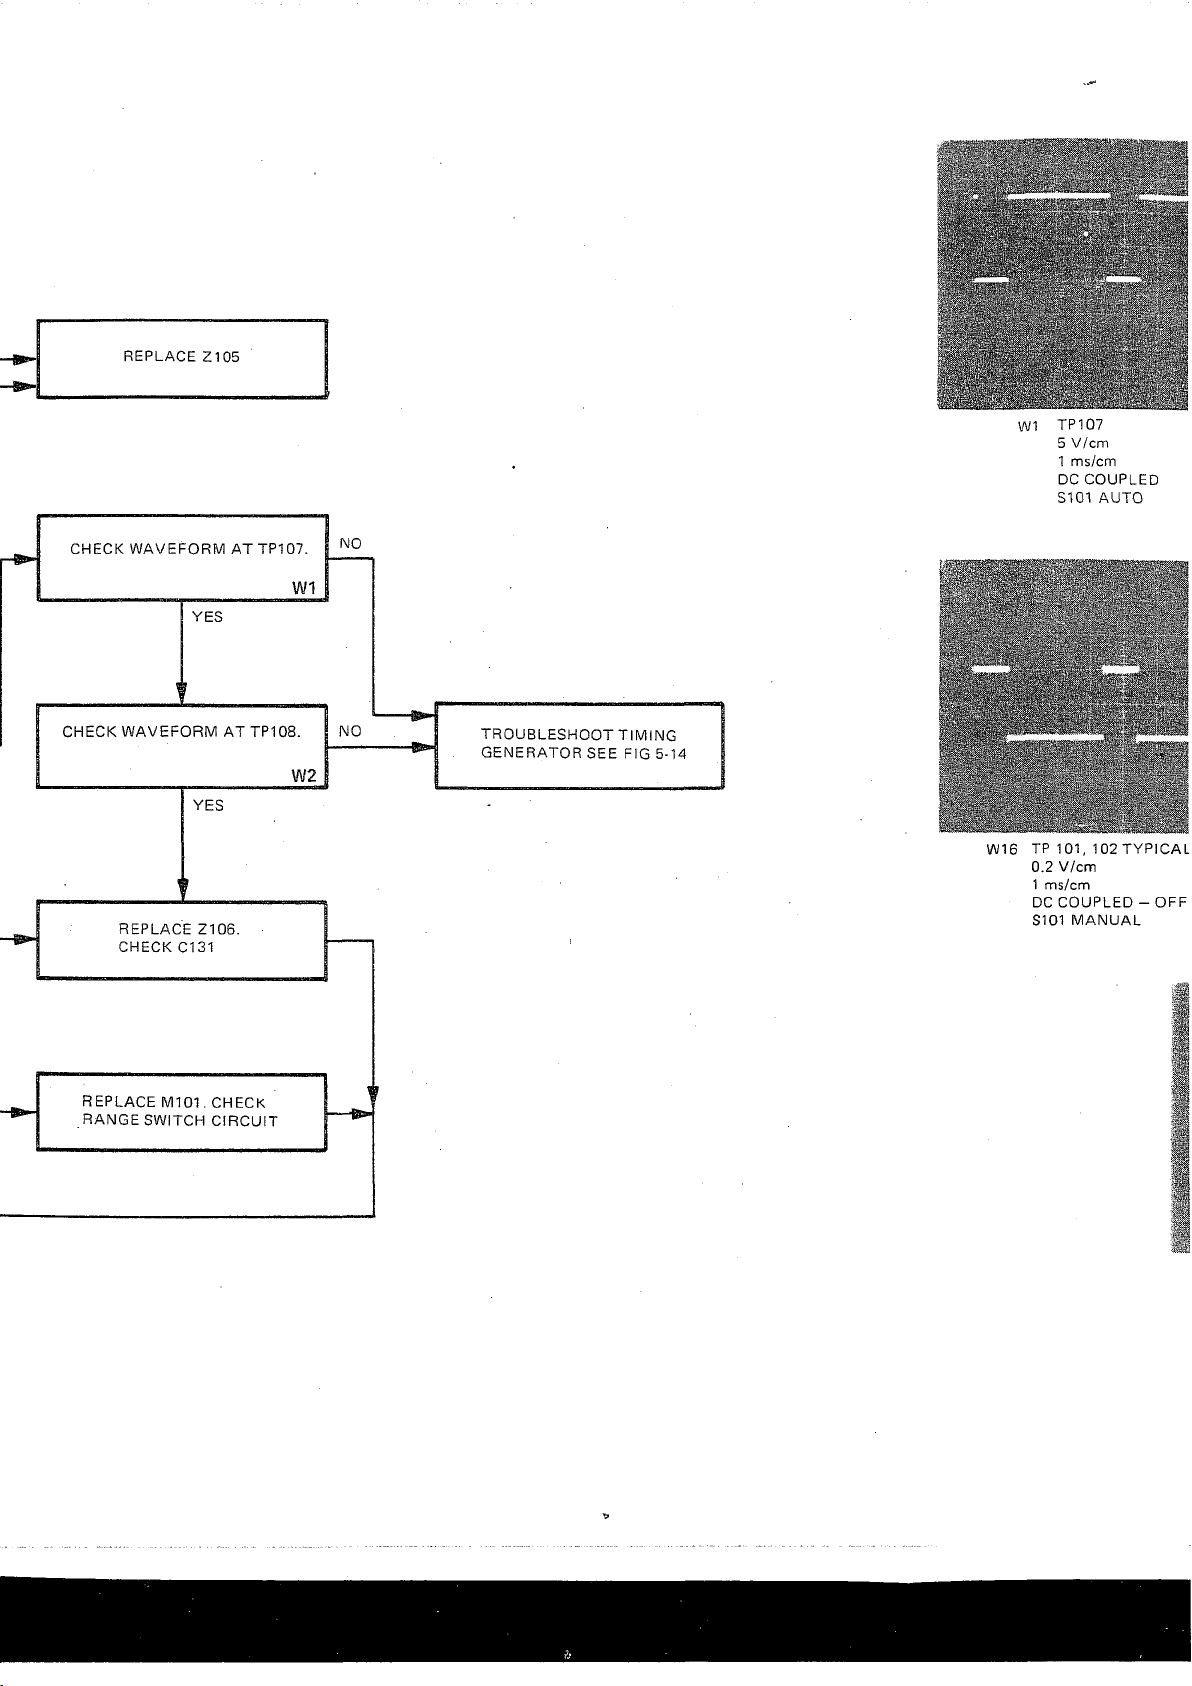
REPLACE Z105
W1 TP107
5 V/cm
1 ms/cm
DC COUPLED
S101 AUTO
W16 TP 101, 102 TYPICAL
0.2 V/cm
1 ms/cm
DC COUPLED - OFF
S101 MANUAL
REPLACE M101. CHECK
RANGE SWITCH CIRCUIT
Page 79
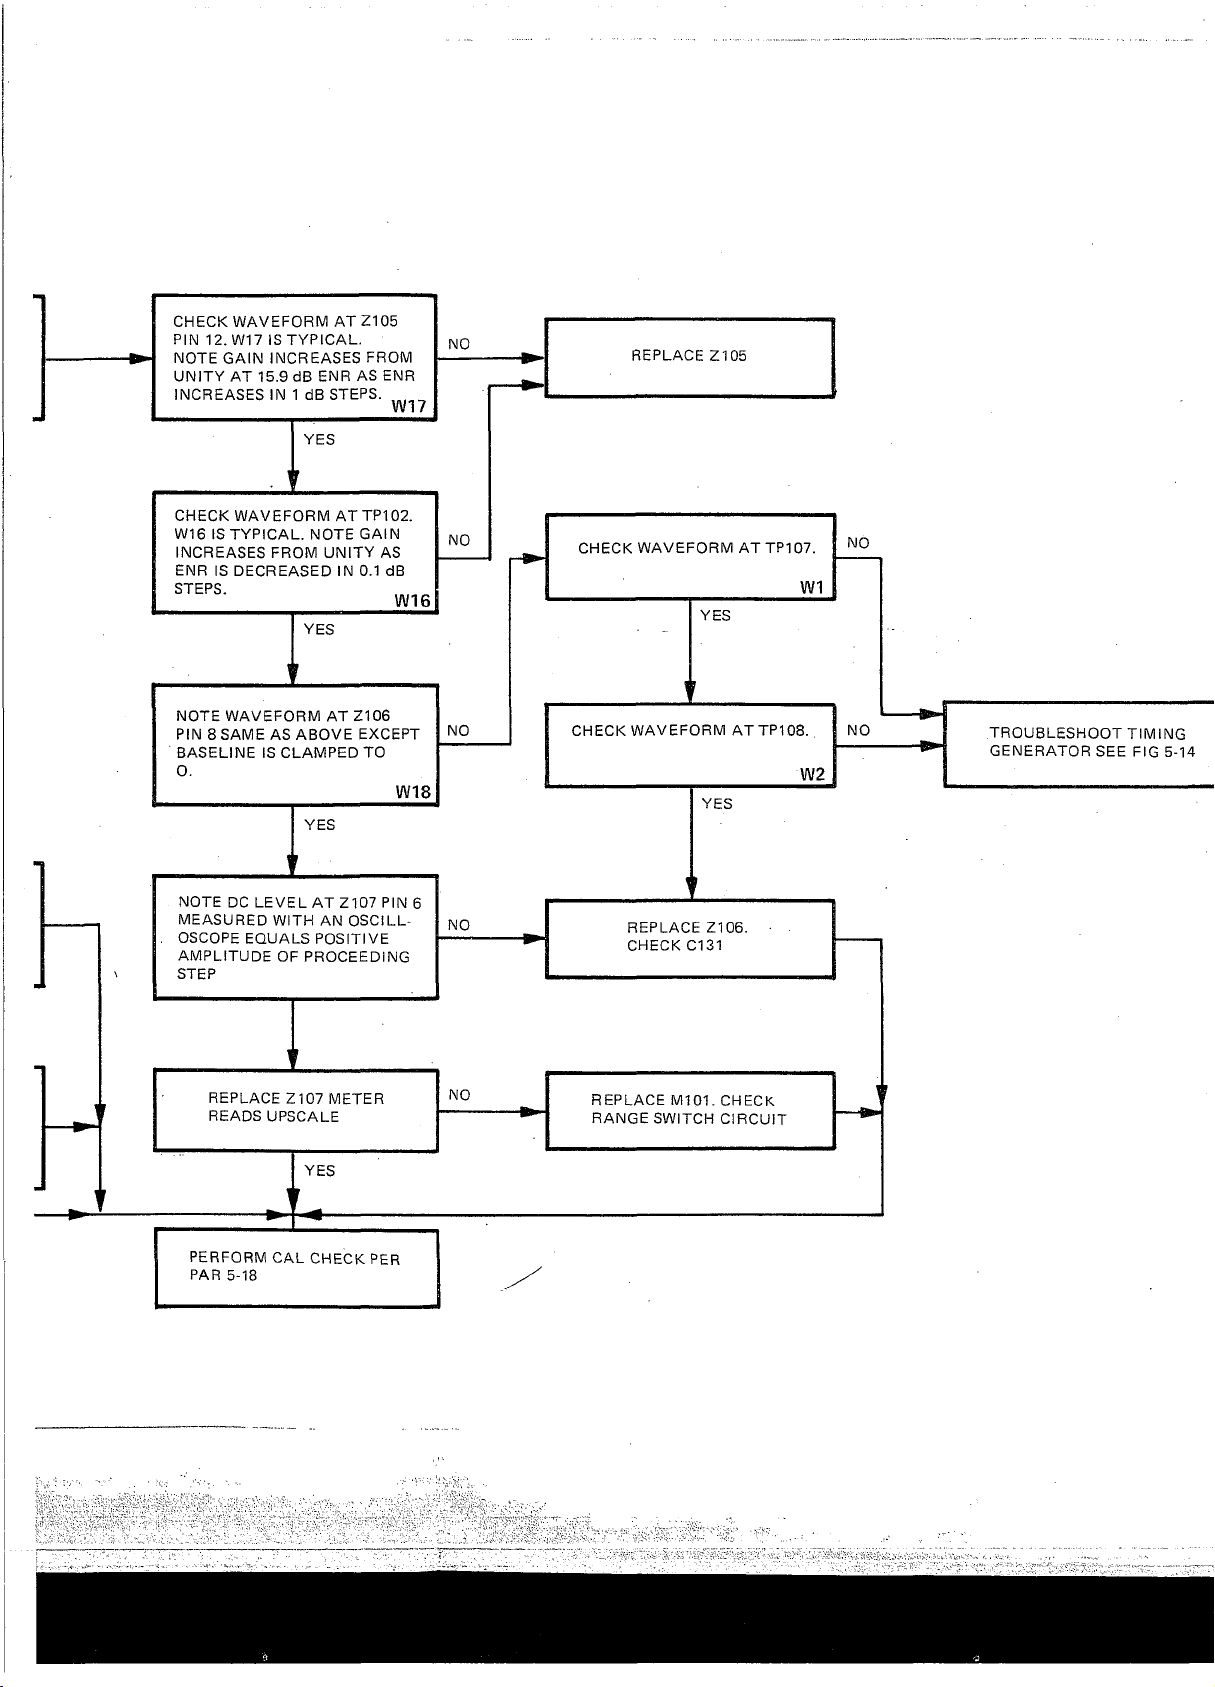
PERFORM GAL CHECK PER
PAR 5-18
Page 80
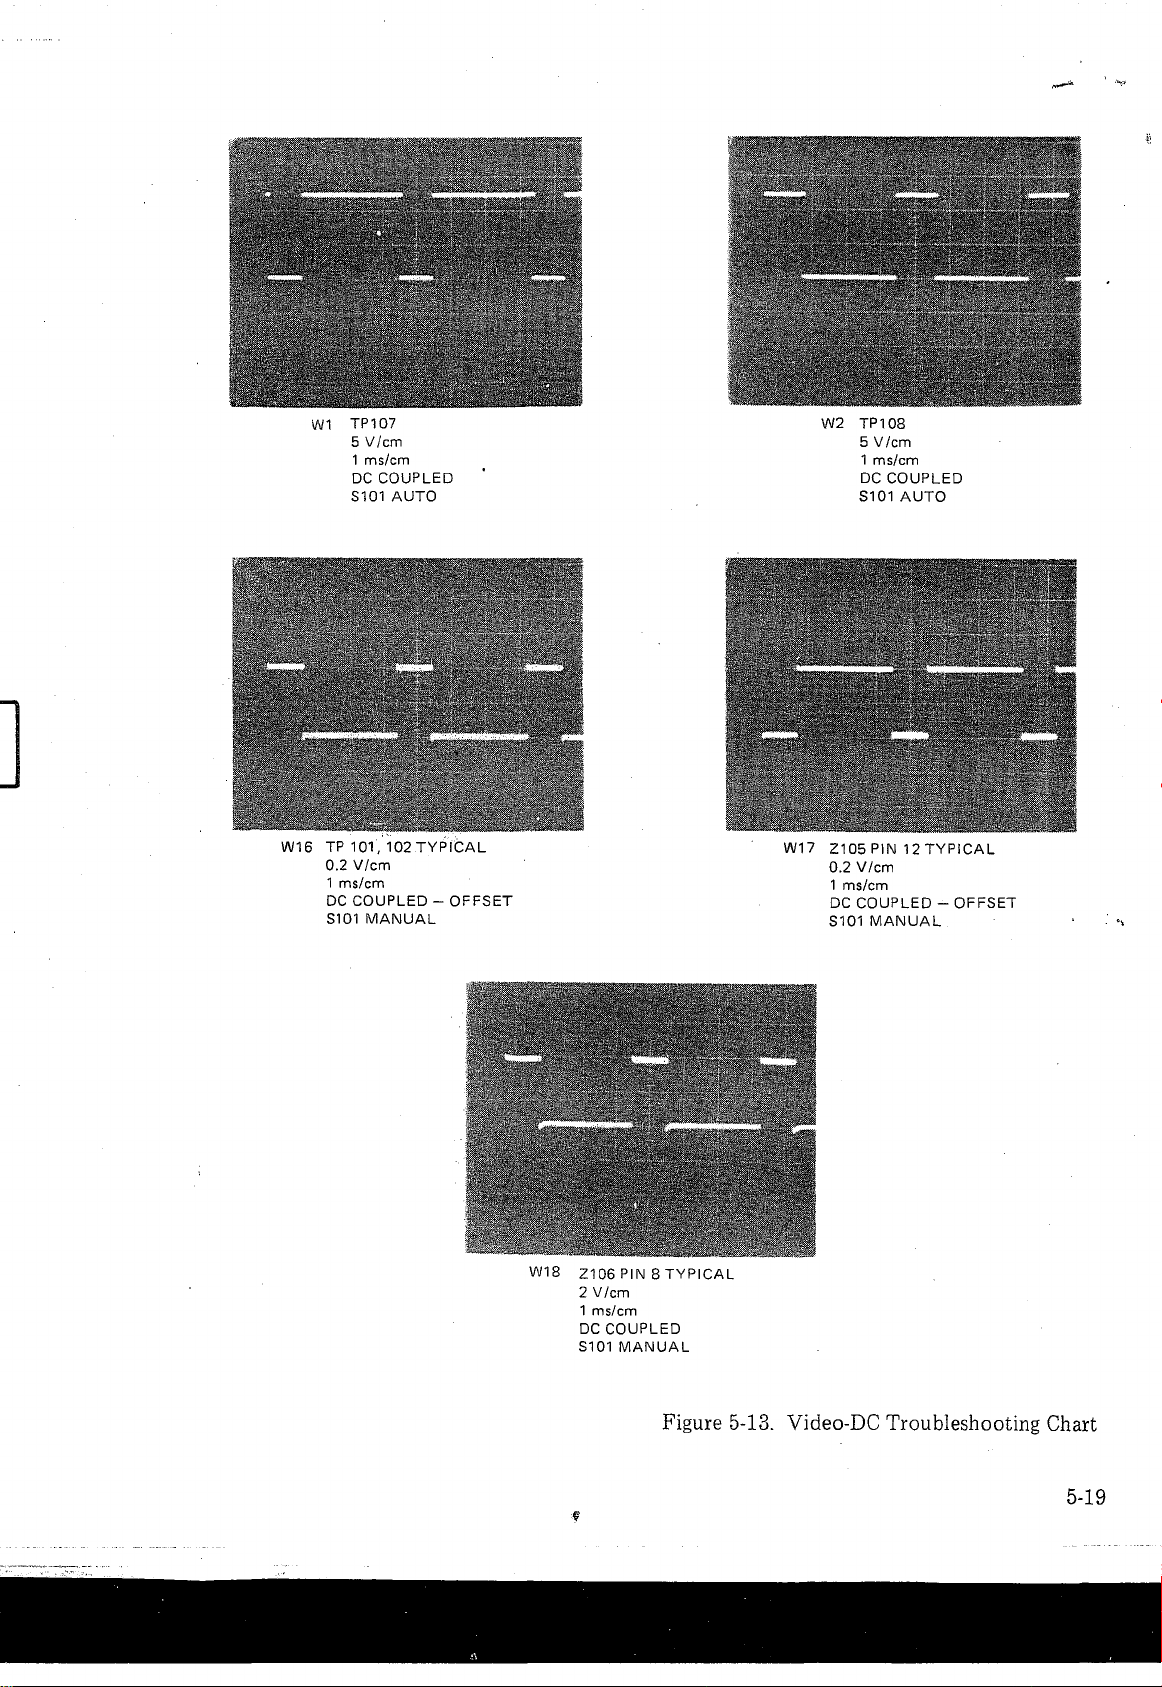
TP 107
W1
5 V/cm
1 ms/cm
DC COUPLED
S101 AUTO
W2 TP 108
5 V/cm
1 ms/cm
DC COUPLED
S101 AUTO
W16 TP 101, 102TYPICAL
0.2 V/cm
1 ms/cm
DC COUPLED - OFFSET
S101 MANUAL
W17 Z105 PIN 12 TYPICAL
0.2 V/cm
1 ms/cm
DC COUPLED - OFFSET
S101 MANUAL
W18 Z106 PIN 8 TYPICAL
2 V/cm
1 ms/cm
DC COUPLED
S101 MANUAL
Figure 5-13. Video-DC Troubleshooting Chart
5-19
Page 81
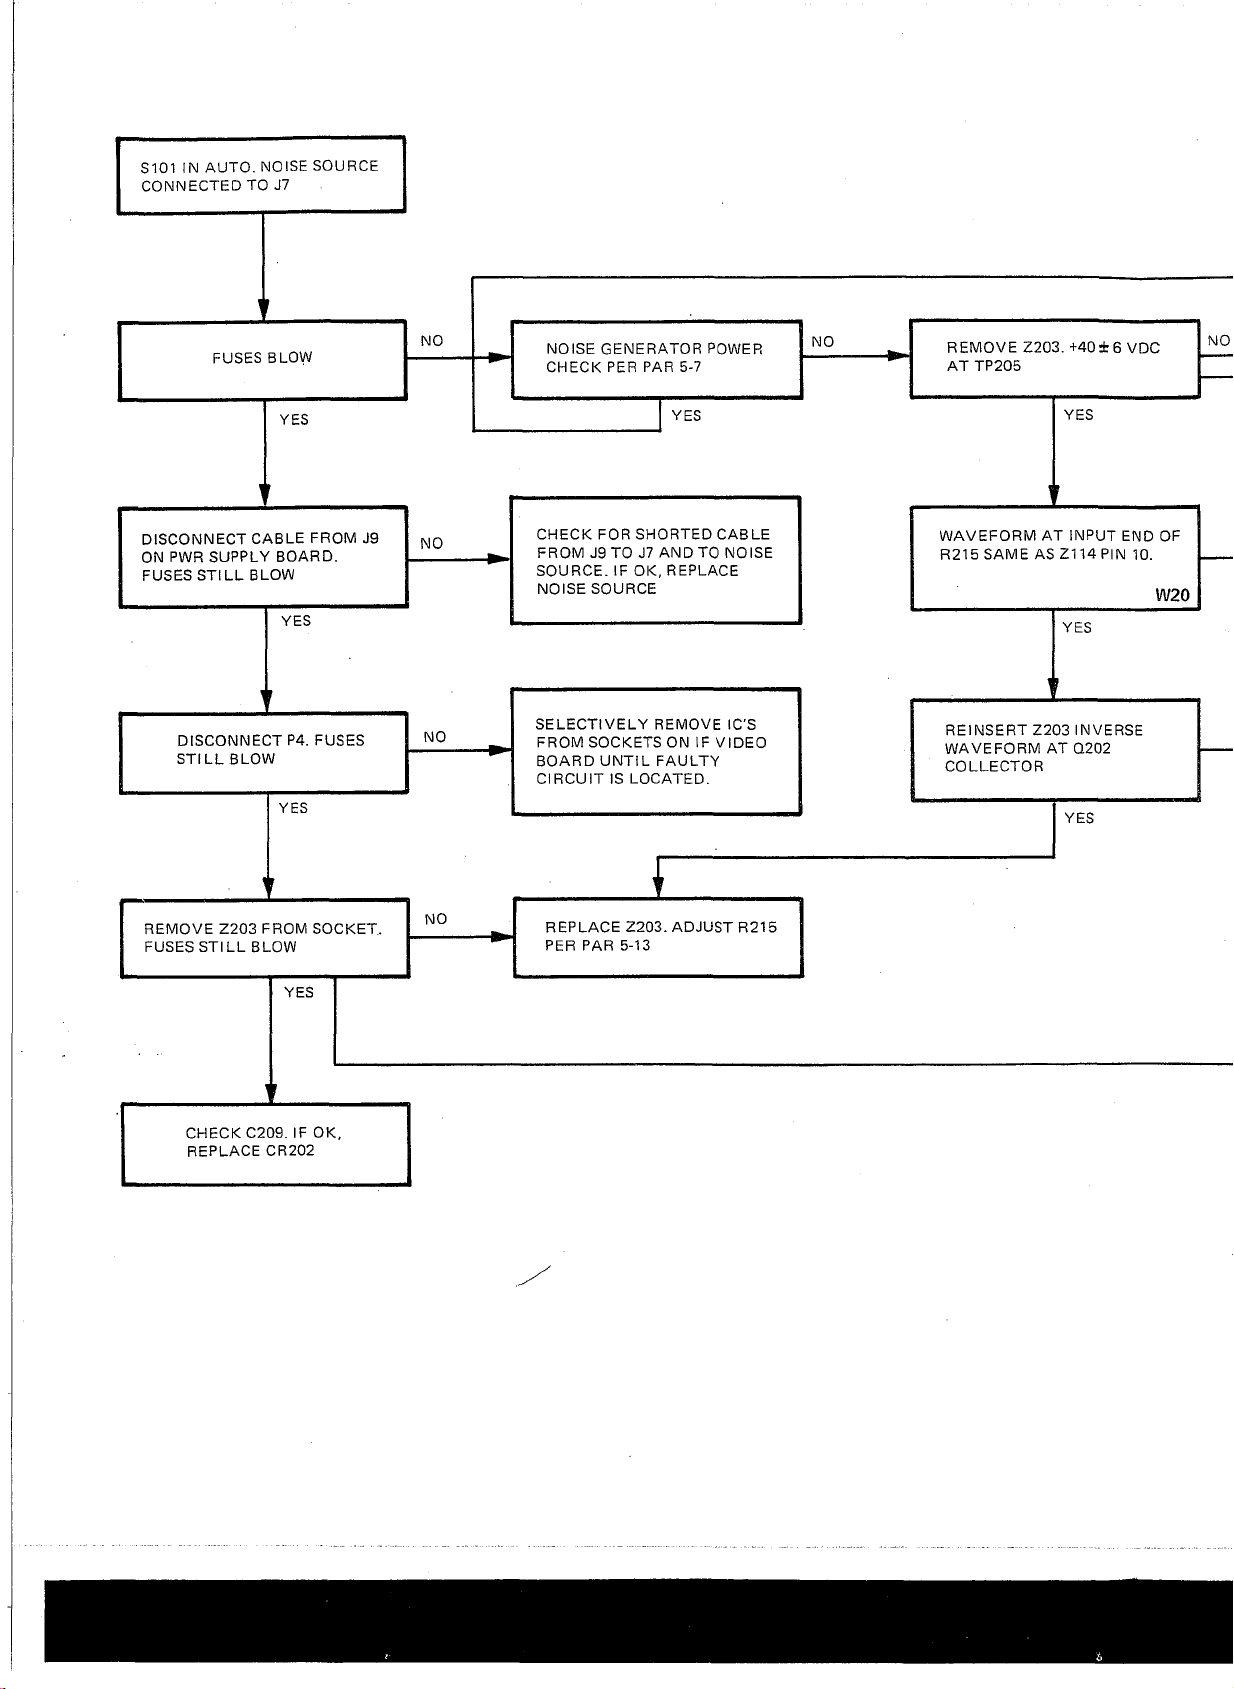
Page 82
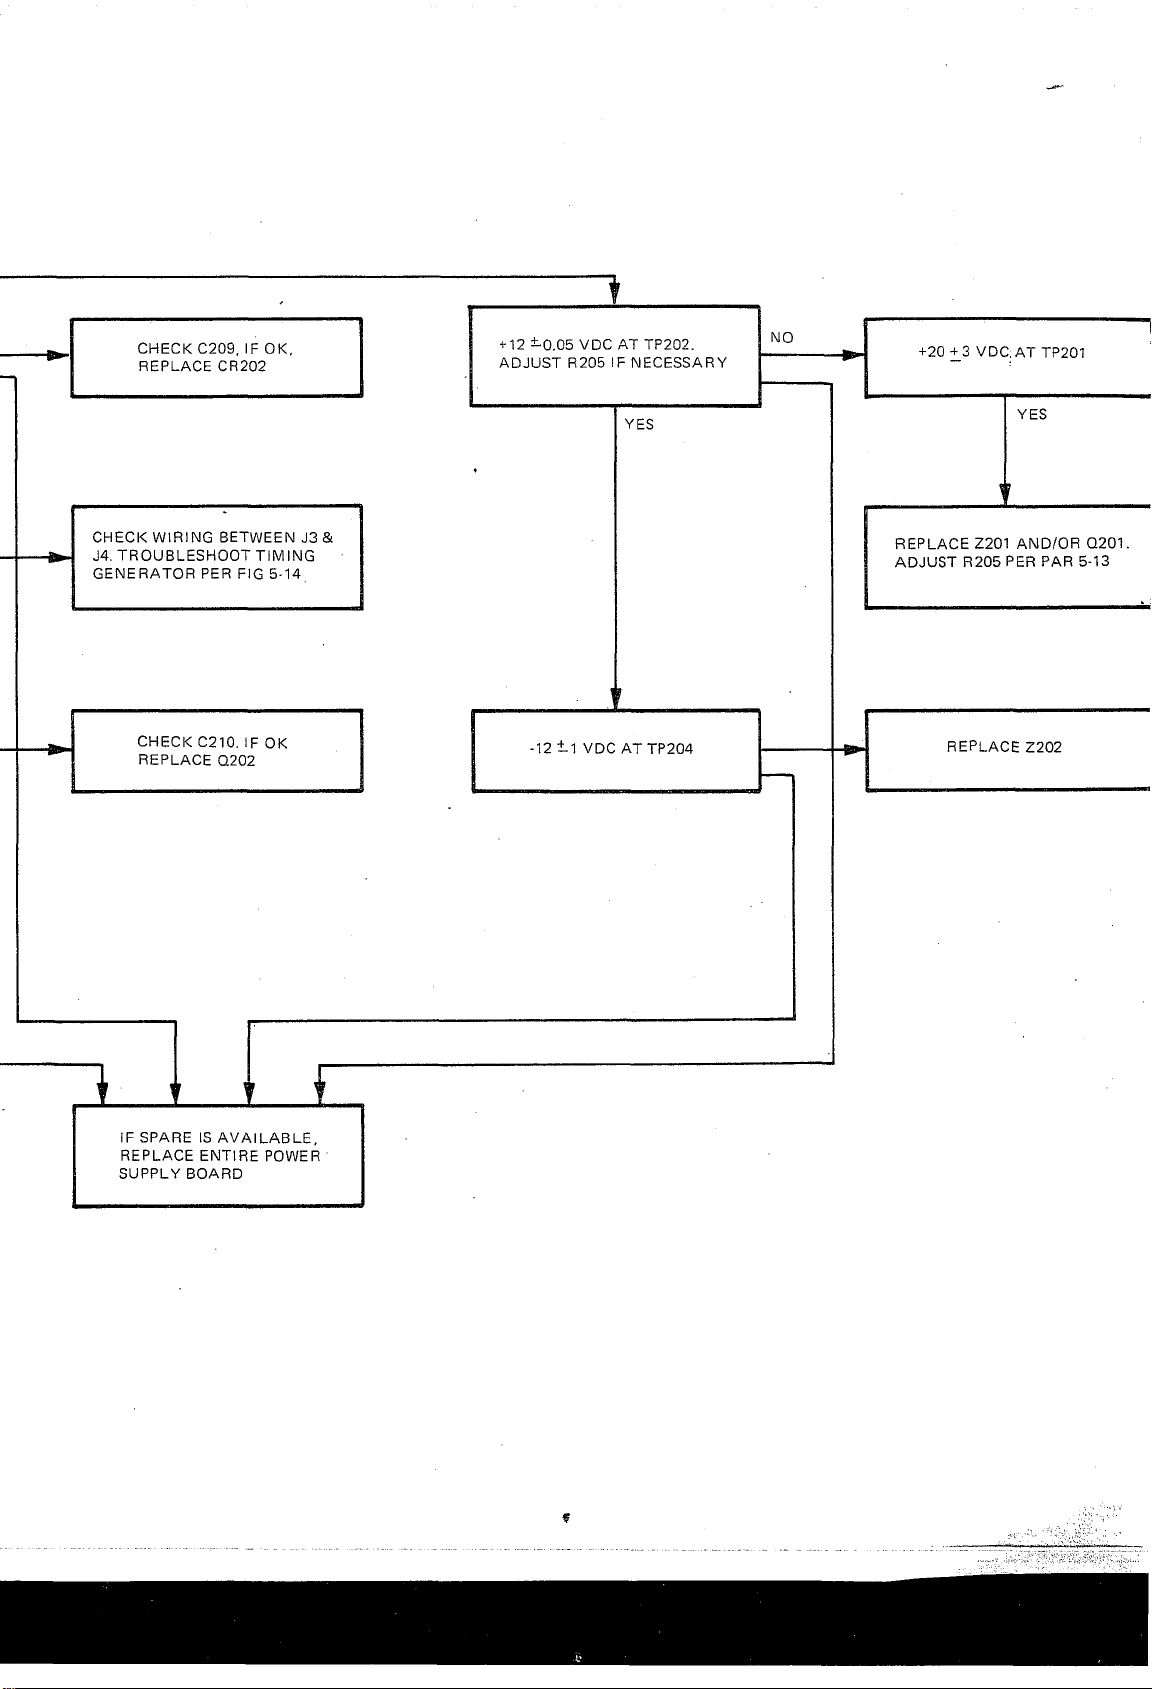
Page 83
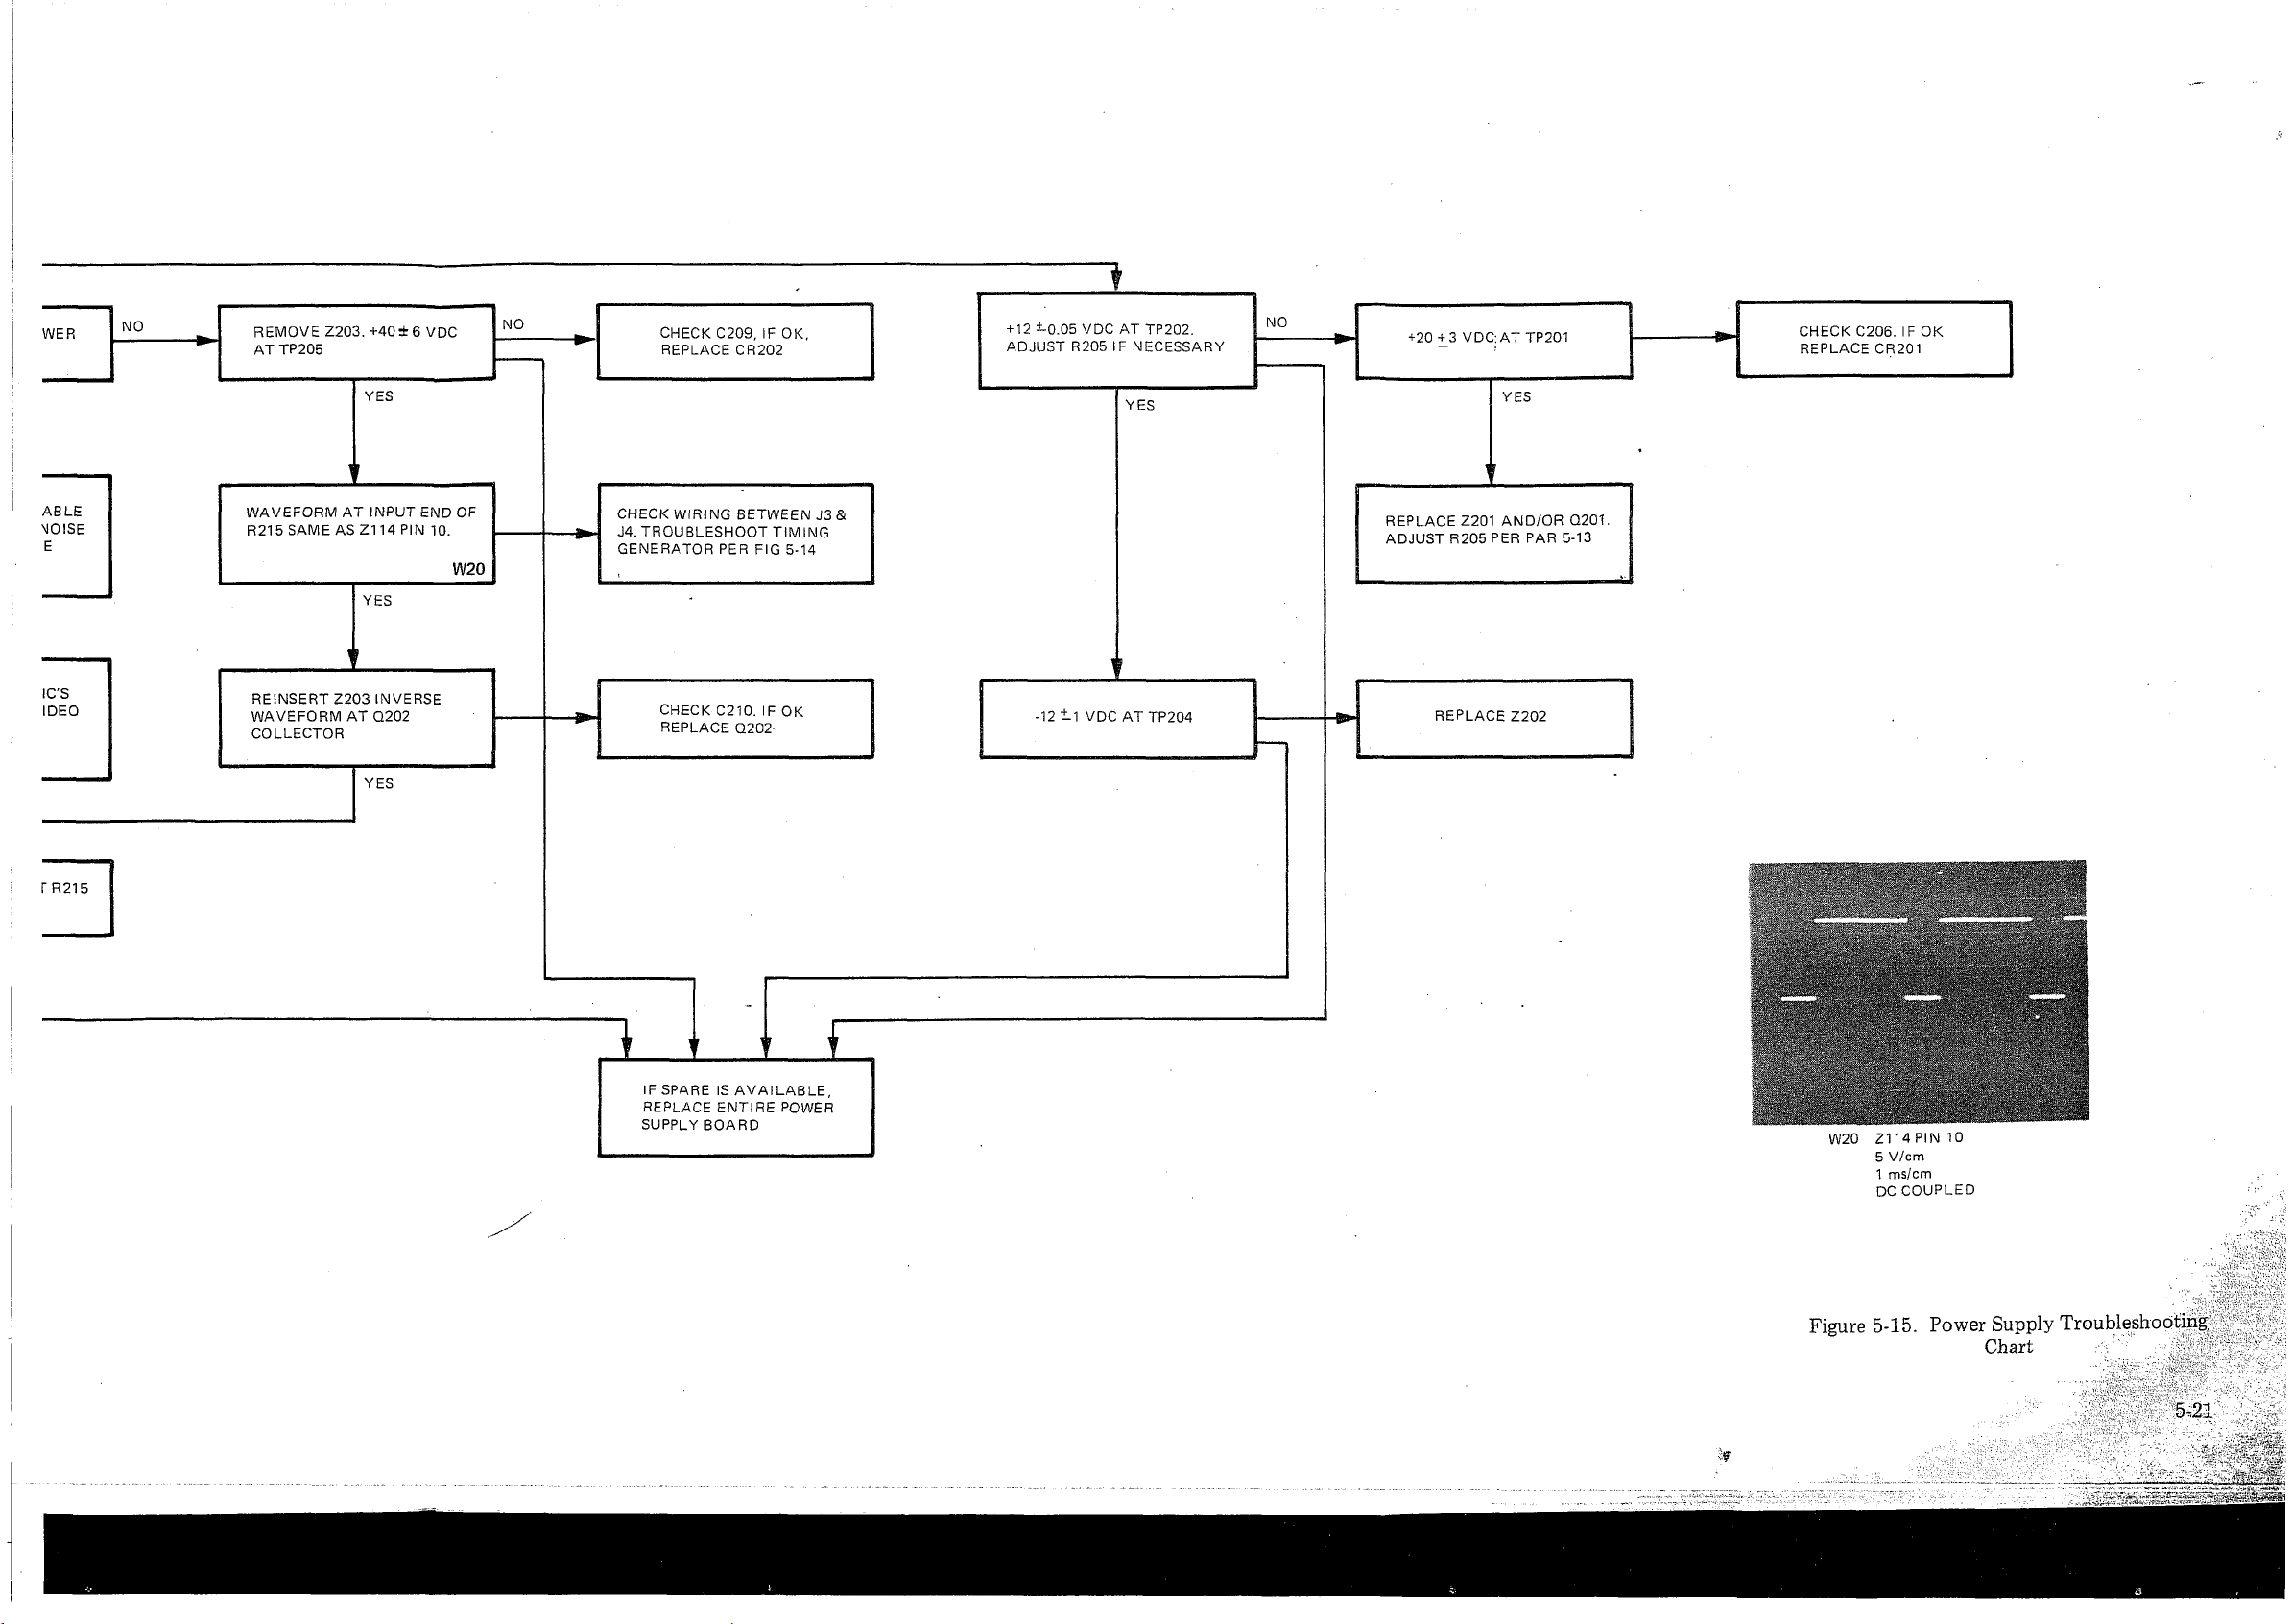
1 ms/cm
DC COUPLED
Figure 5-15. Power Supply Troubleshooting.
Chart
Page 84
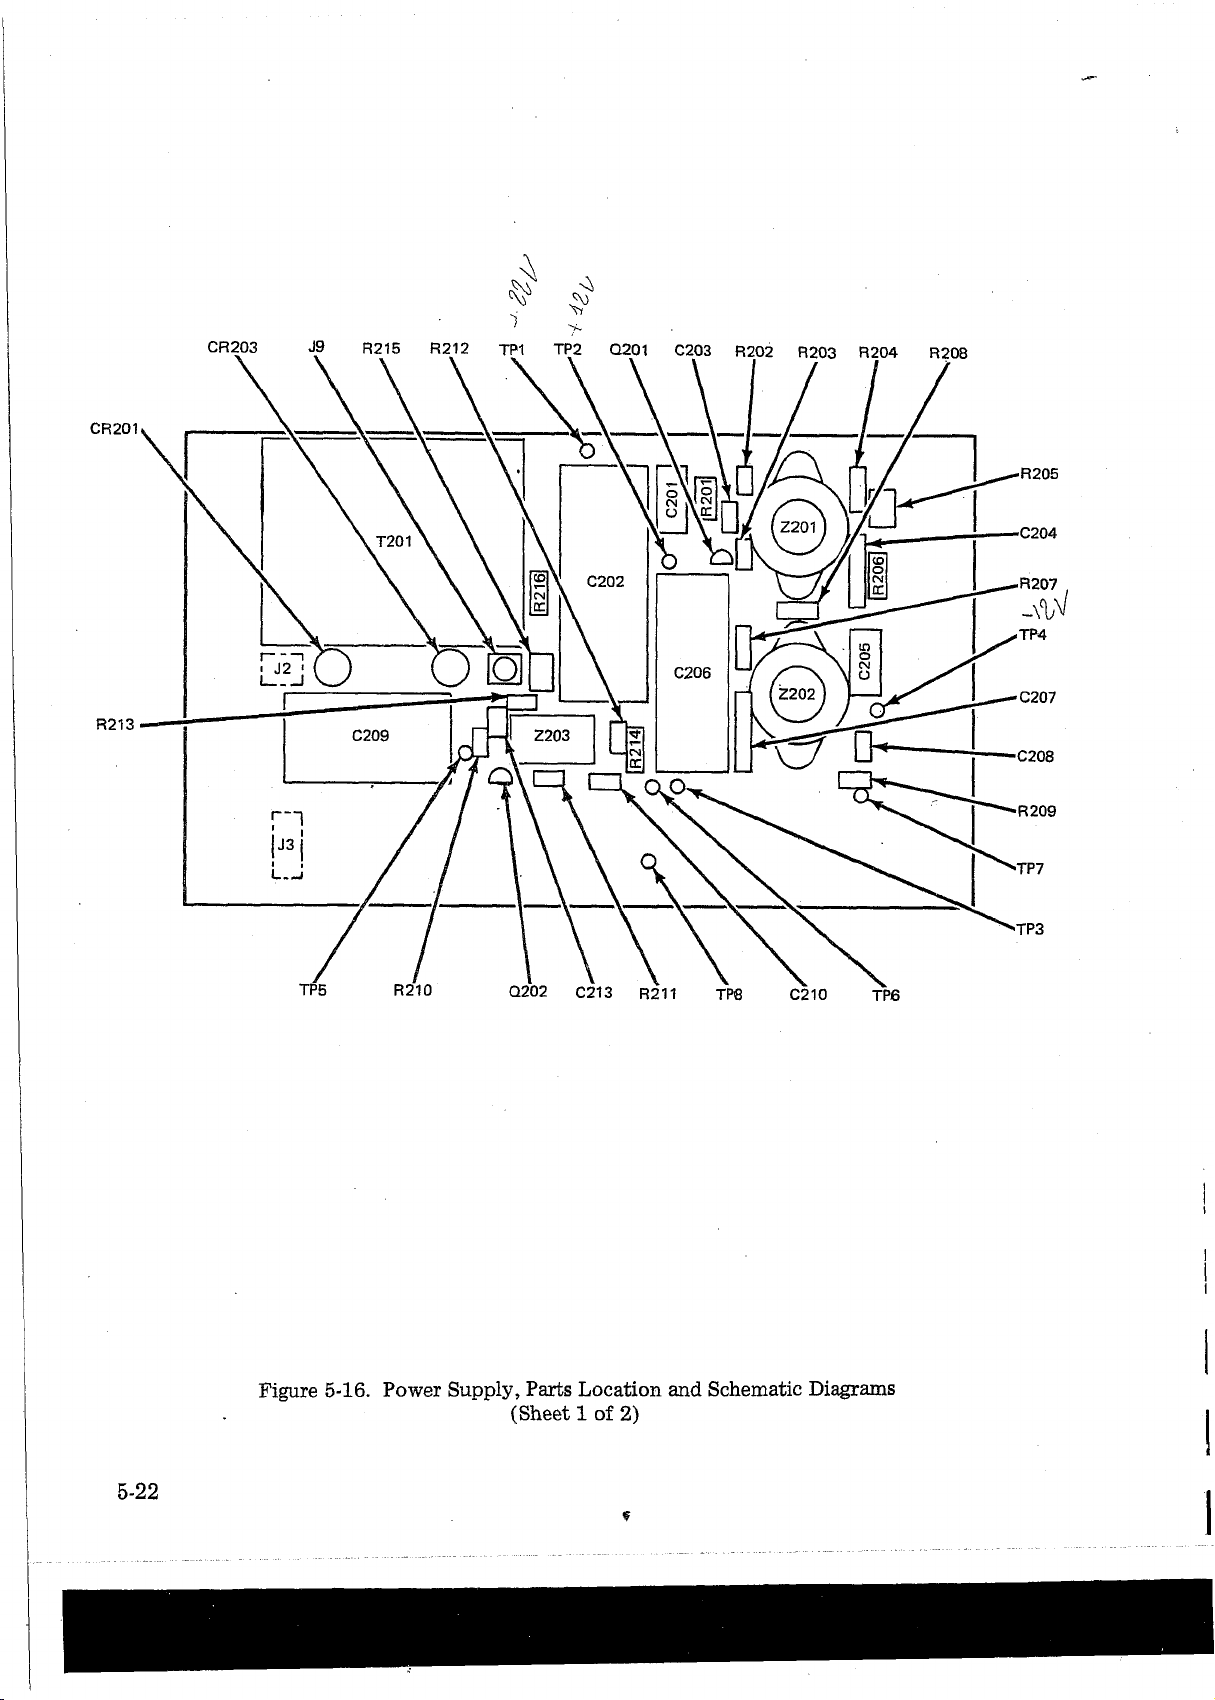
5-22
Figure 5-16. Power Supply, Parts Location and Schematic Diagrams
(Sheet 1 of 2)
Page 85
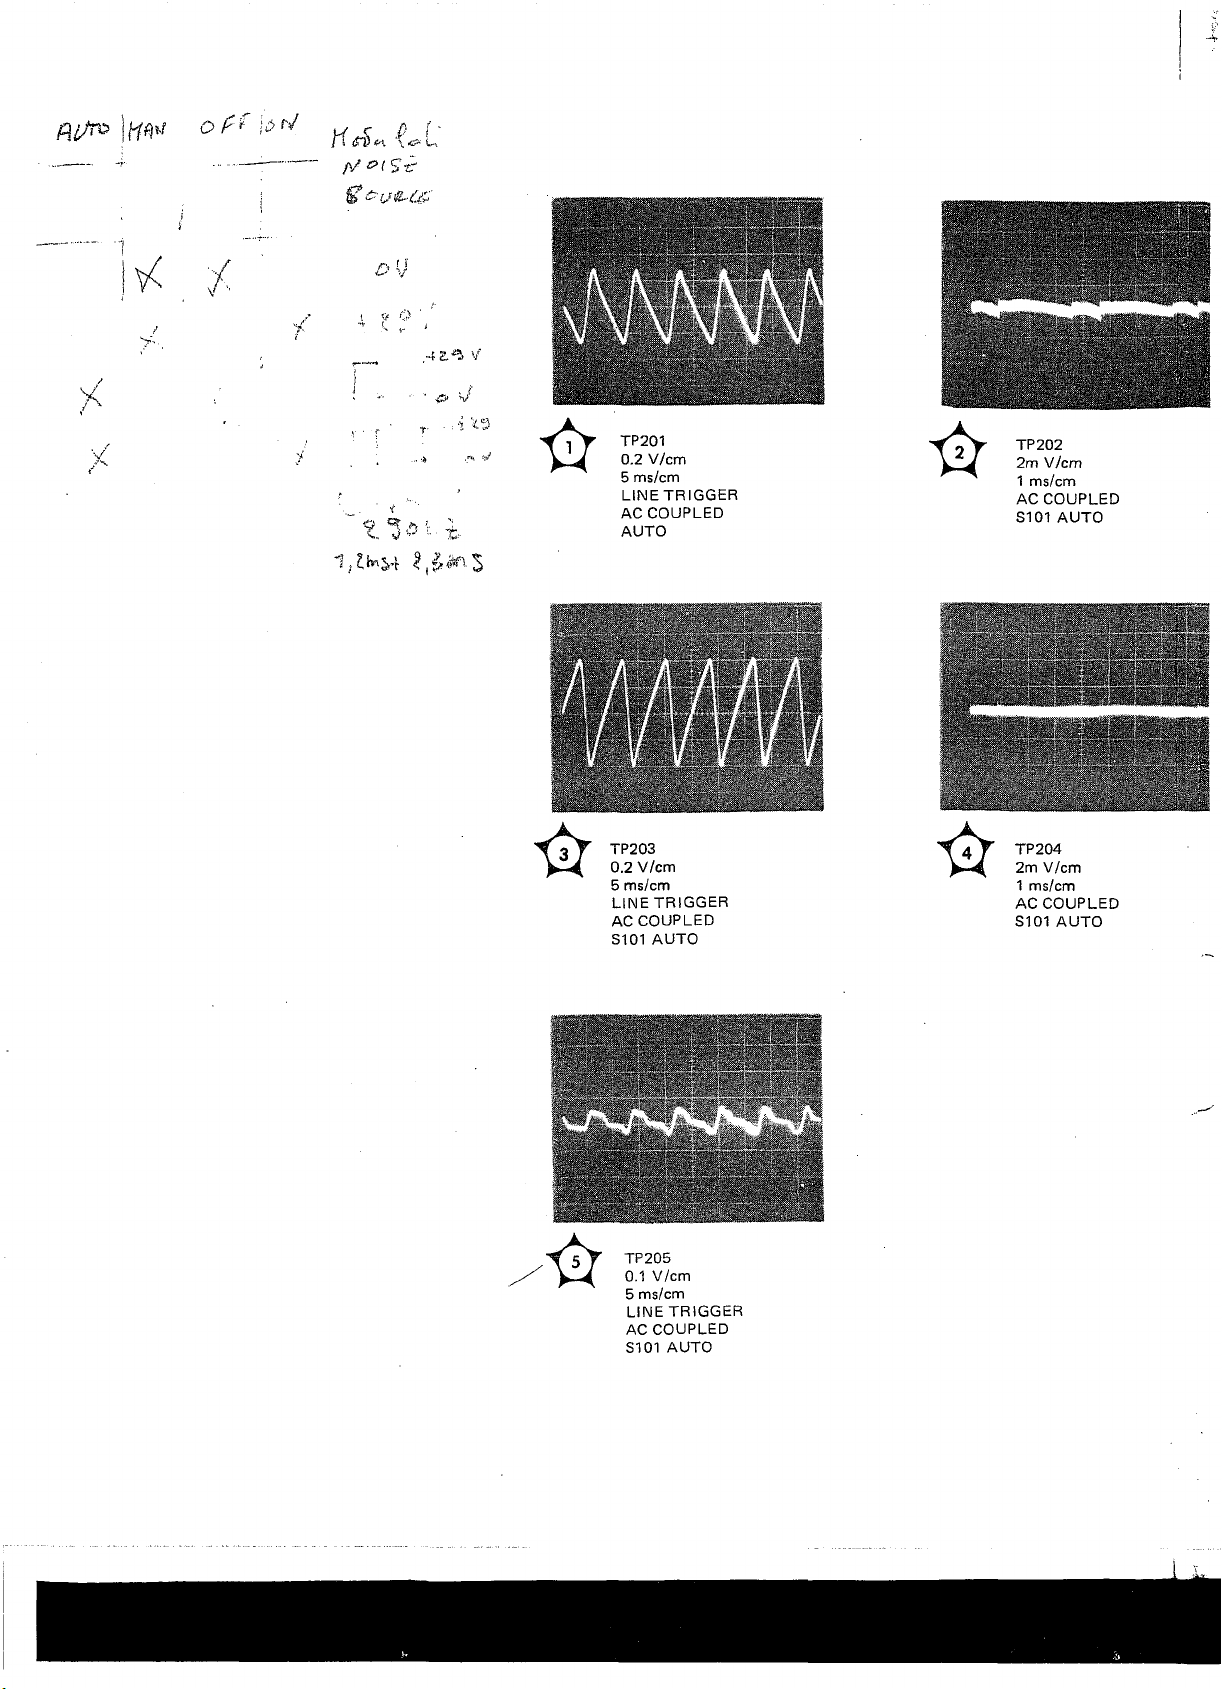
n i/n * \ h w
i
V ''
H A «
/)/&(*£ -¿r
Ê? £'U®~££
V
. •> ‘¿“0
t.
■WHt kW
TP201
☆
0.2 V/cm
5 ms/cm
LINETRIGGER
AC COUPLED
AUTO
TP202
2m V/cm
1 ms/cm
AC COUPLED
S101 AUTO
TP203
0.2 V/cm
5 ms/cm
LINETRIGGER
AC COUPLED
S101 AUTO
TP205
0.1 V/cm
5 ms/cm
LINETRIGGER
AC COUPLED
S101 AUTO
TP204
2m V/cm
1 ms/cm
AC COUPLED
S101 AUTO
Page 86
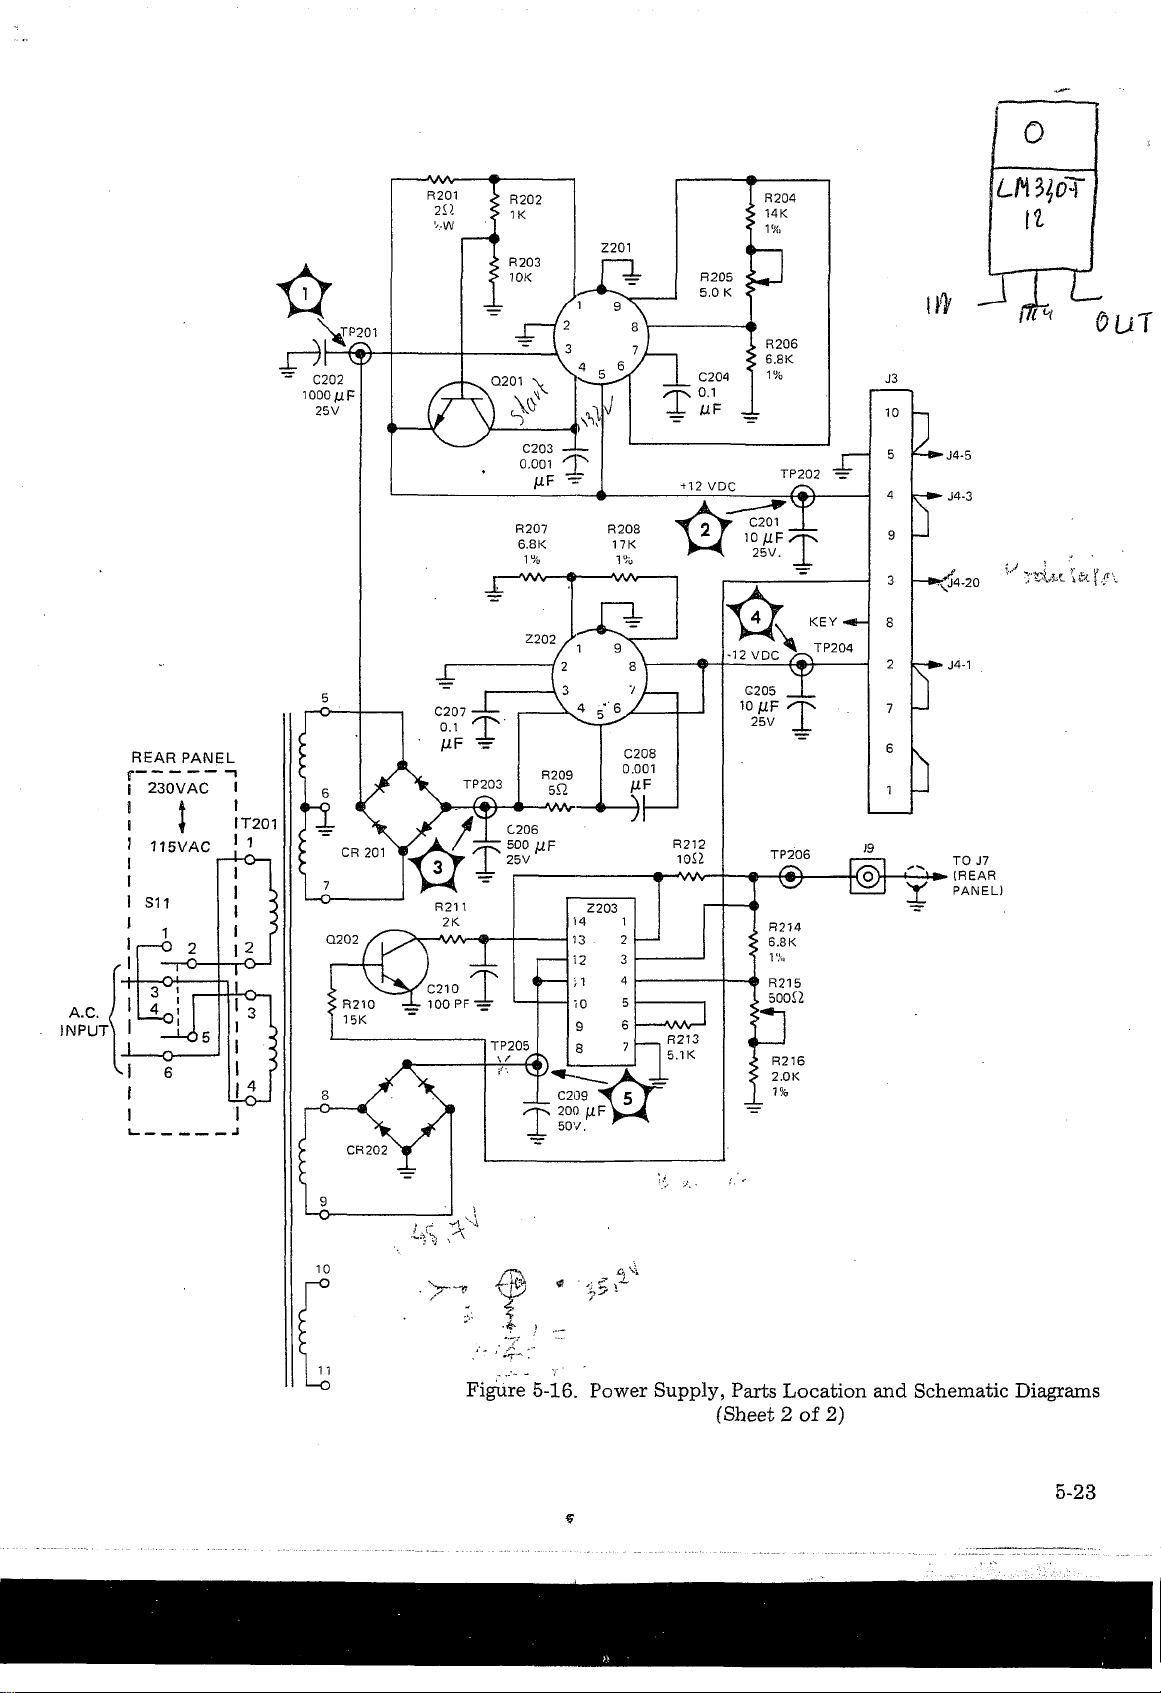
(Sheet 2 of 2)
5-23
ç
>}
Page 87
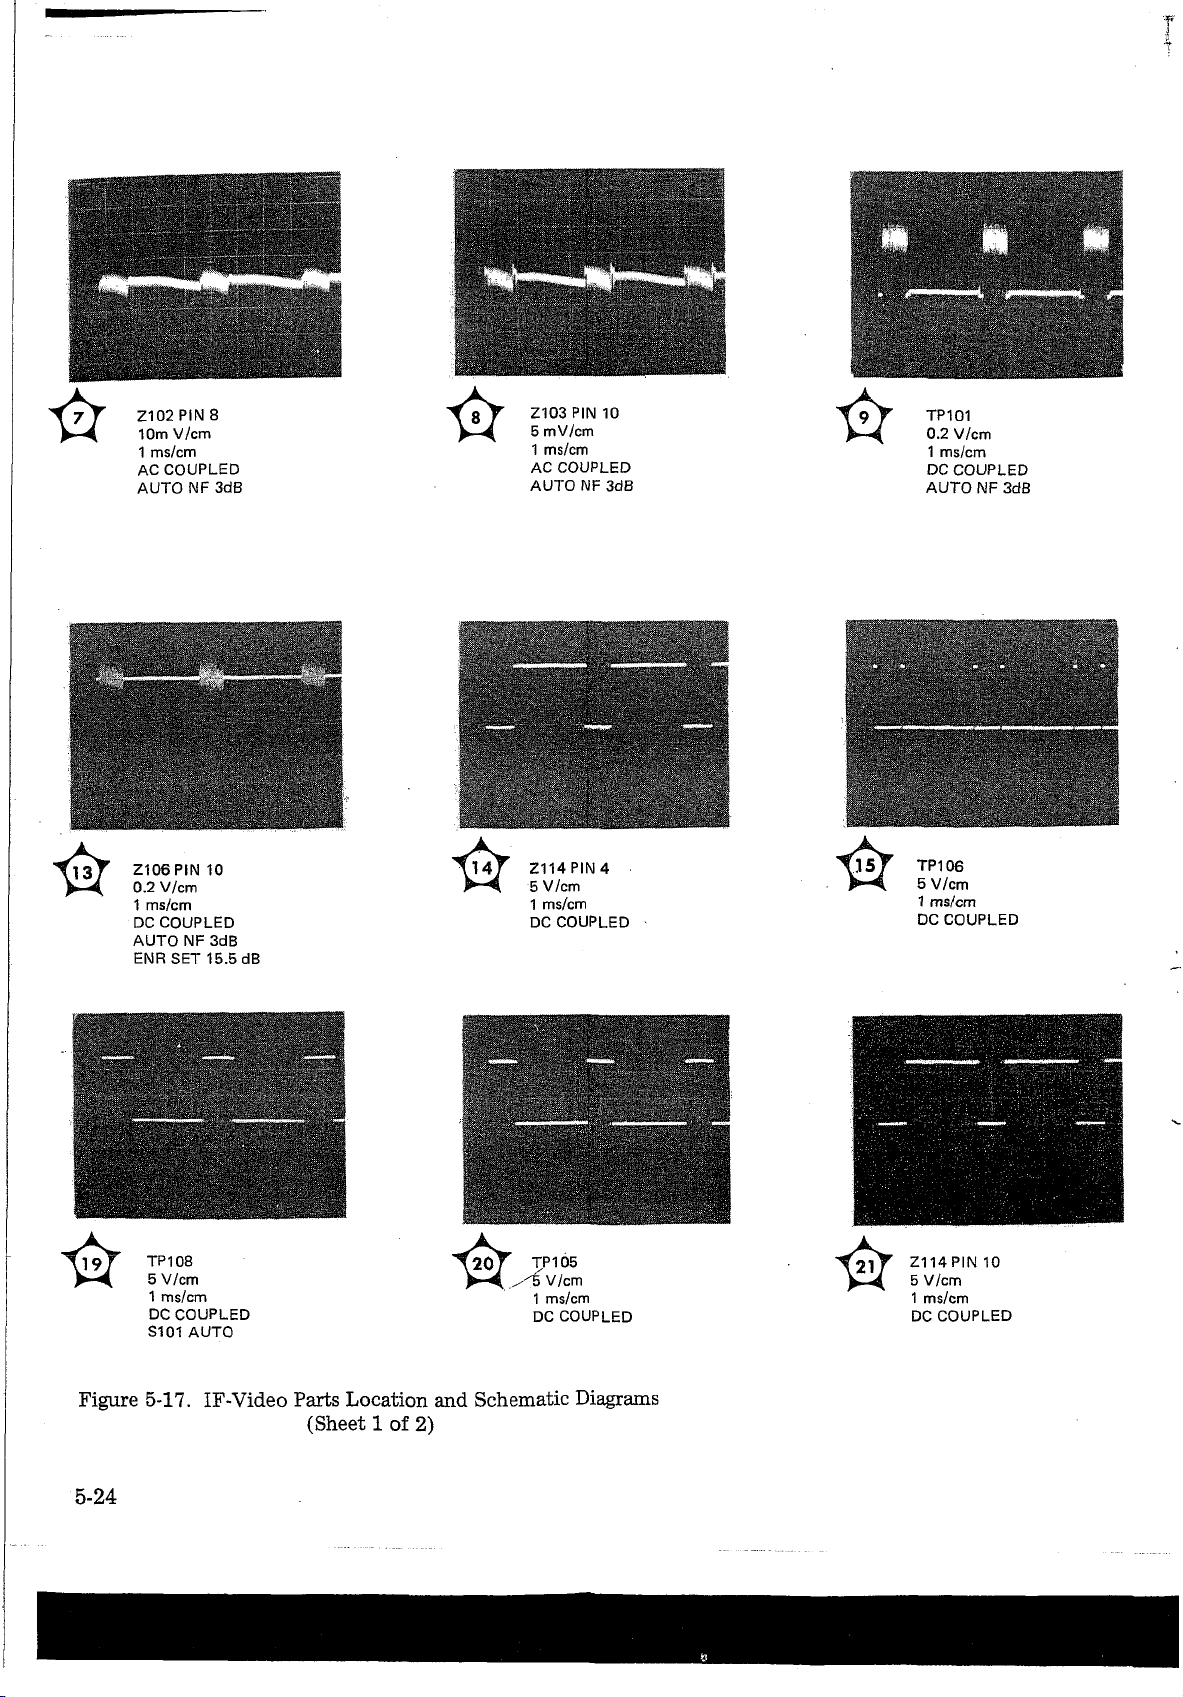
¿ M M M
" a
■f- -V- ■
• ! •
&
&
Z102 PIN 8
10m V/cm
1 ms/cm
AC COUPLED
AUTO NF 3dB
Z106 PIN 10
0.2 V/cm
1 ms/cm
DC COUPLED
AUTO NF 3dB
ENR SET 15.5 dB
8 T Z103 PIN 10
5 mV/cm
1 ms/cm
AC COUPLED
AUTO NF 3dB
Z114 PIN 4
5 V/cm
1 ms/cm
DC COUPLED
TP101
0.2 V/cm
1 ms/cm
DC COUPLED
AUTO NF 3dB
TP106
5 V/cm
1 m s/cm
DC COUPLED
TP 108
5 V/cm
1 ms/cm
DC COUPLED
S101 AUTO
20 T xp 105
V/cm
1 ms/cm
DC COUPLED
Figure 5-17. IF-Video Parts Location and Schematic Diagrams
(Sheet 1 of 2)
Z114 PIN 10
5 V/cm
1 ms/cm
DC COUPLED
Page 88
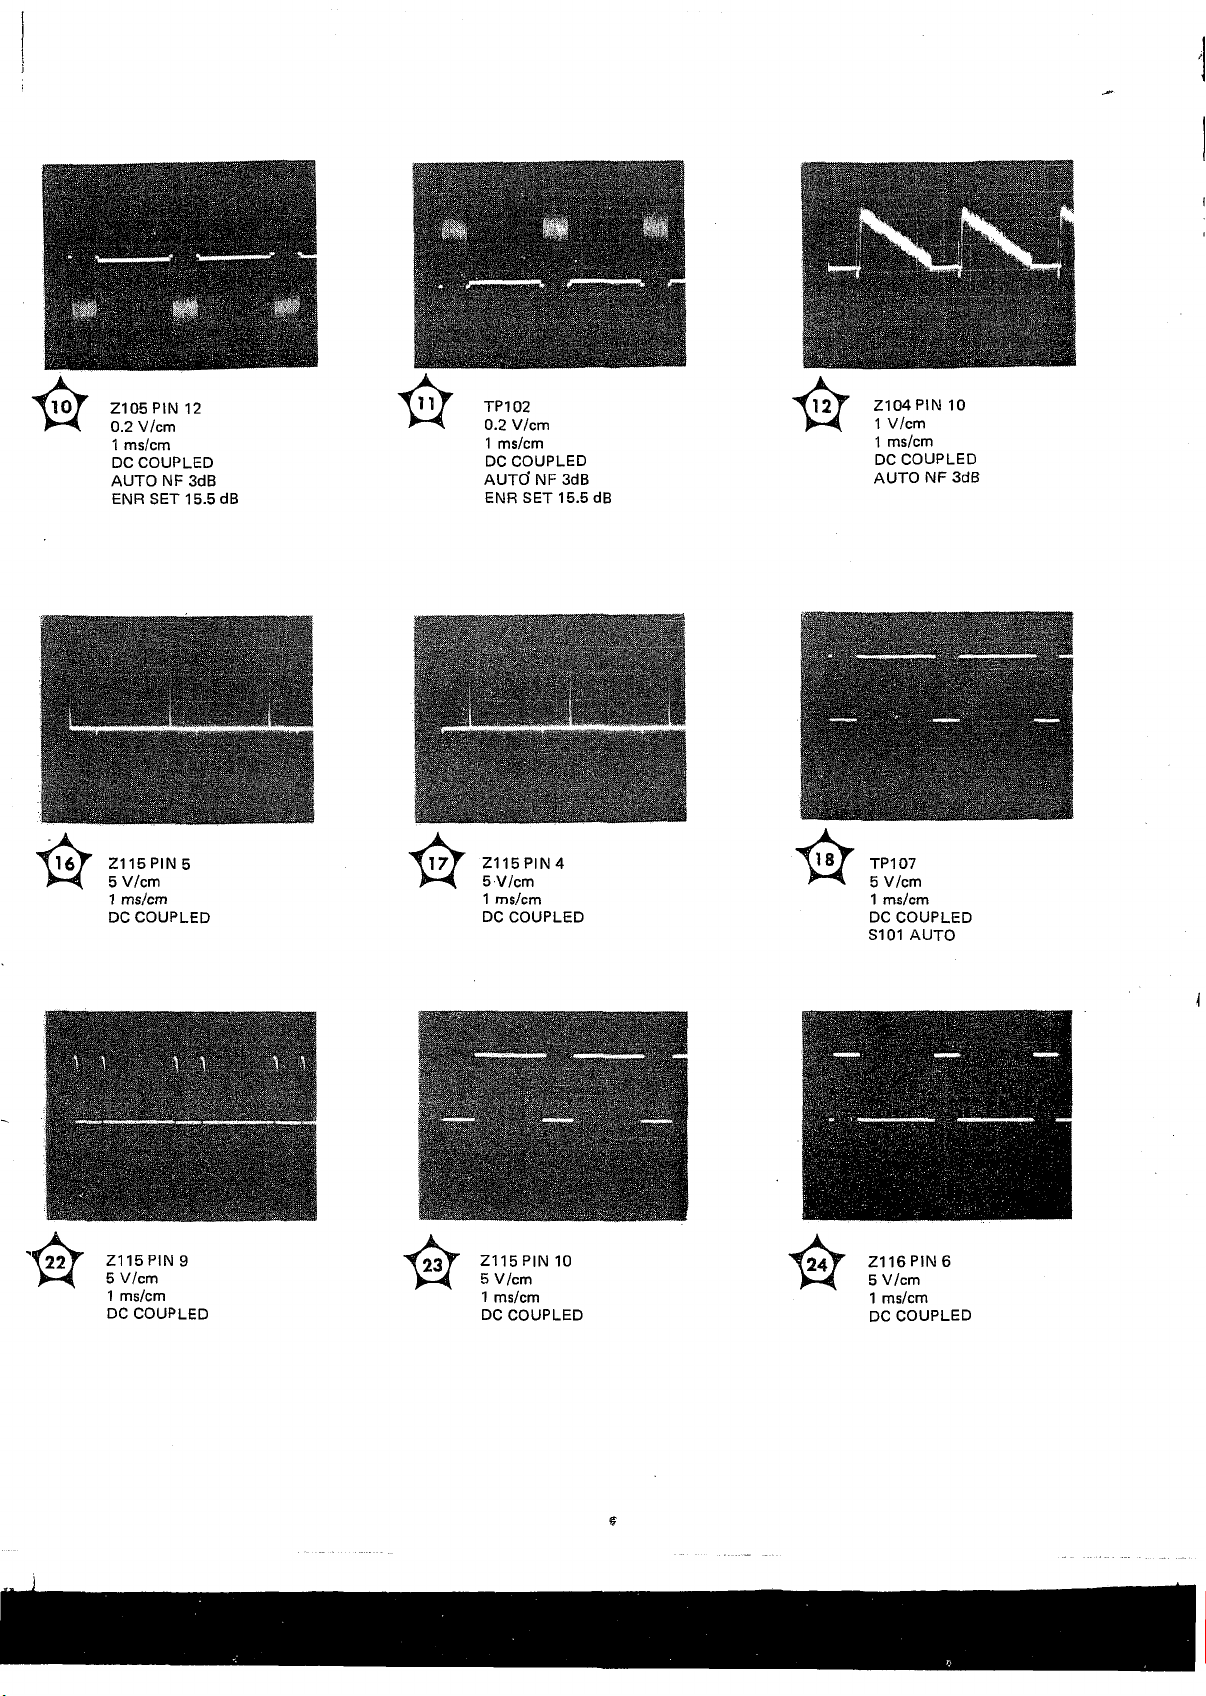
Z105 PIN 12
0.2 V/cm
1 ms/cm
DC COUPLED
AUTO NF 3dB
ENR SET 15.5 dB
TP 102
0.2 V/cm
1 ms/cm
DC COUPLED
AUTO' NF 3dB
ENR SET 15.5 dB
Z104 PIN 10
1 V/cm
1 ms/cm
DC COUPLED
AUTO IMF 3dB
a— aw
> — — A .
H i
---
Z115 PIN 5
5 V/cm
1 ms/cm
DC COUPLED
Z115 PIN 9
5 V/cm
1 ms/cm
DC COUPLED
17J Z115 PIN 4
5 V/cm
1 ms/cm
DC COUPLED
23T Z115 PIN 10
5 V/cm
1 ms/cm
DC COUPLED
TP107
5 V/cm
1 ms/cm
DC COUPLED
S101 AUTO
Z116 PIN 6
5 V/cm
1 ms/cm
DC COUPLED
Page 89
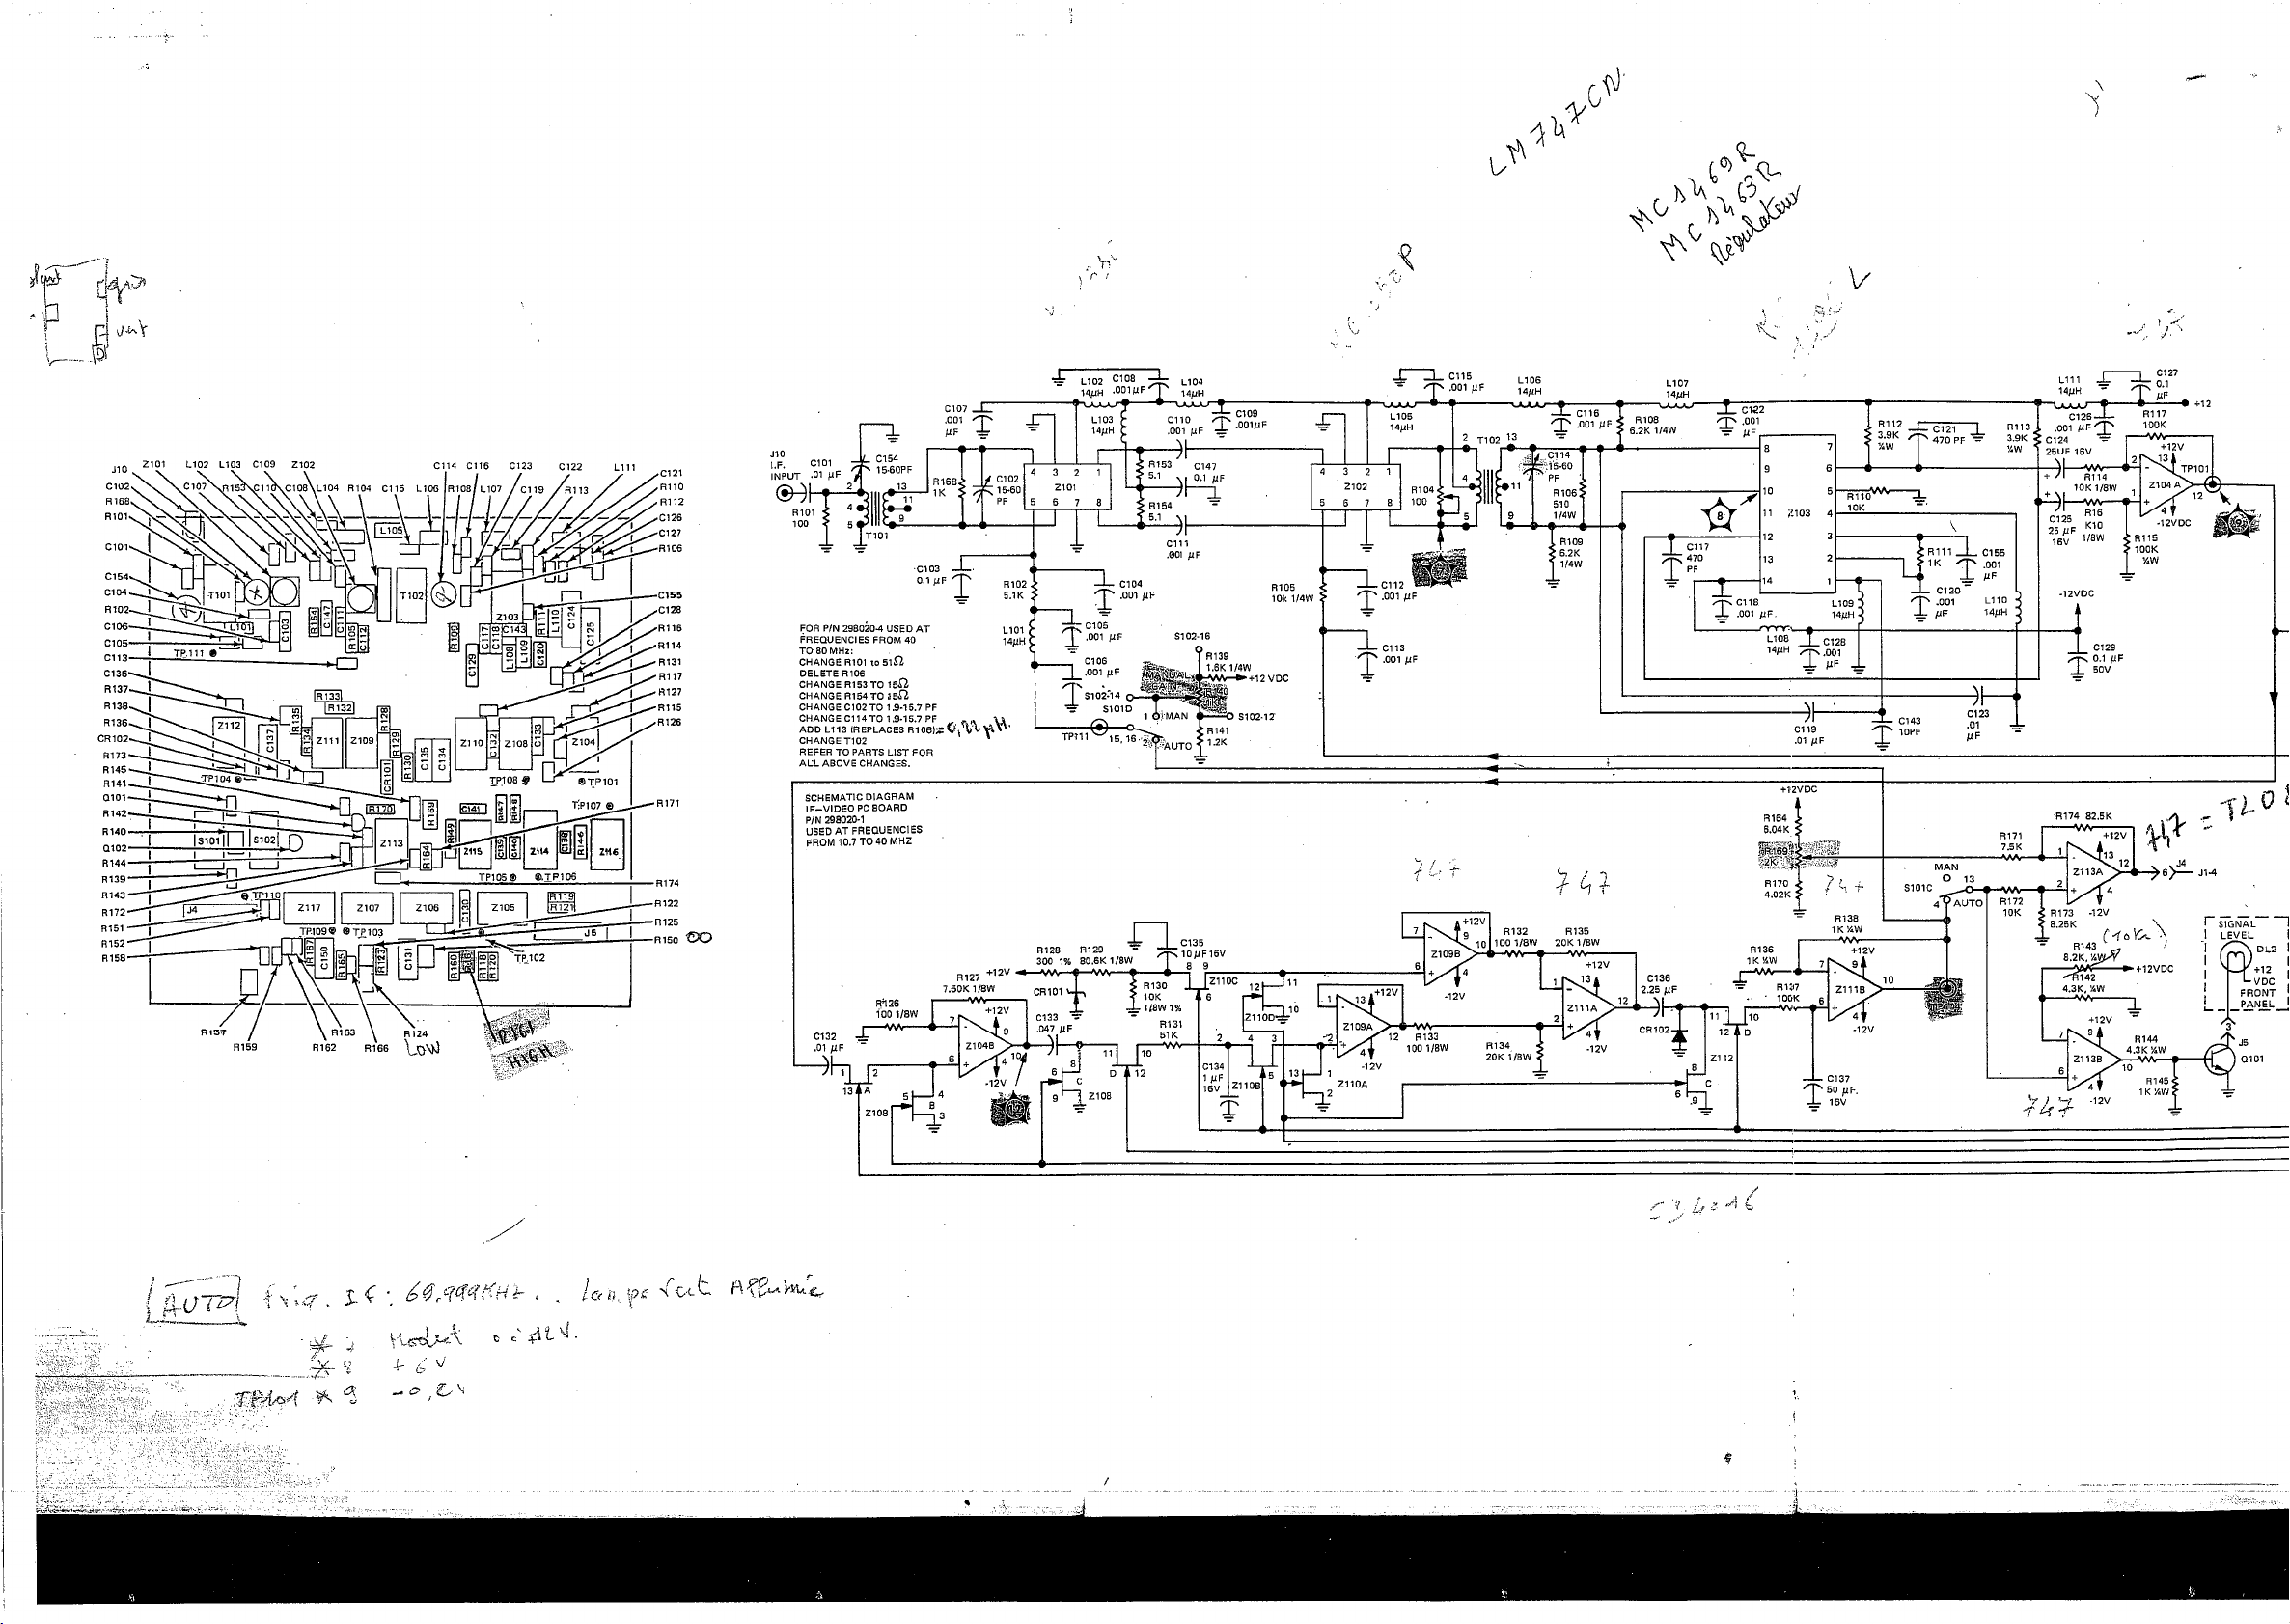
2101 L102 L103 C109 Z102
... n
r :
1/
y
0 '
$
ohV V
*
V
* 3
á 0 M £ít<H b
C c 'íit ’J
't.ü -
. .
Page 90
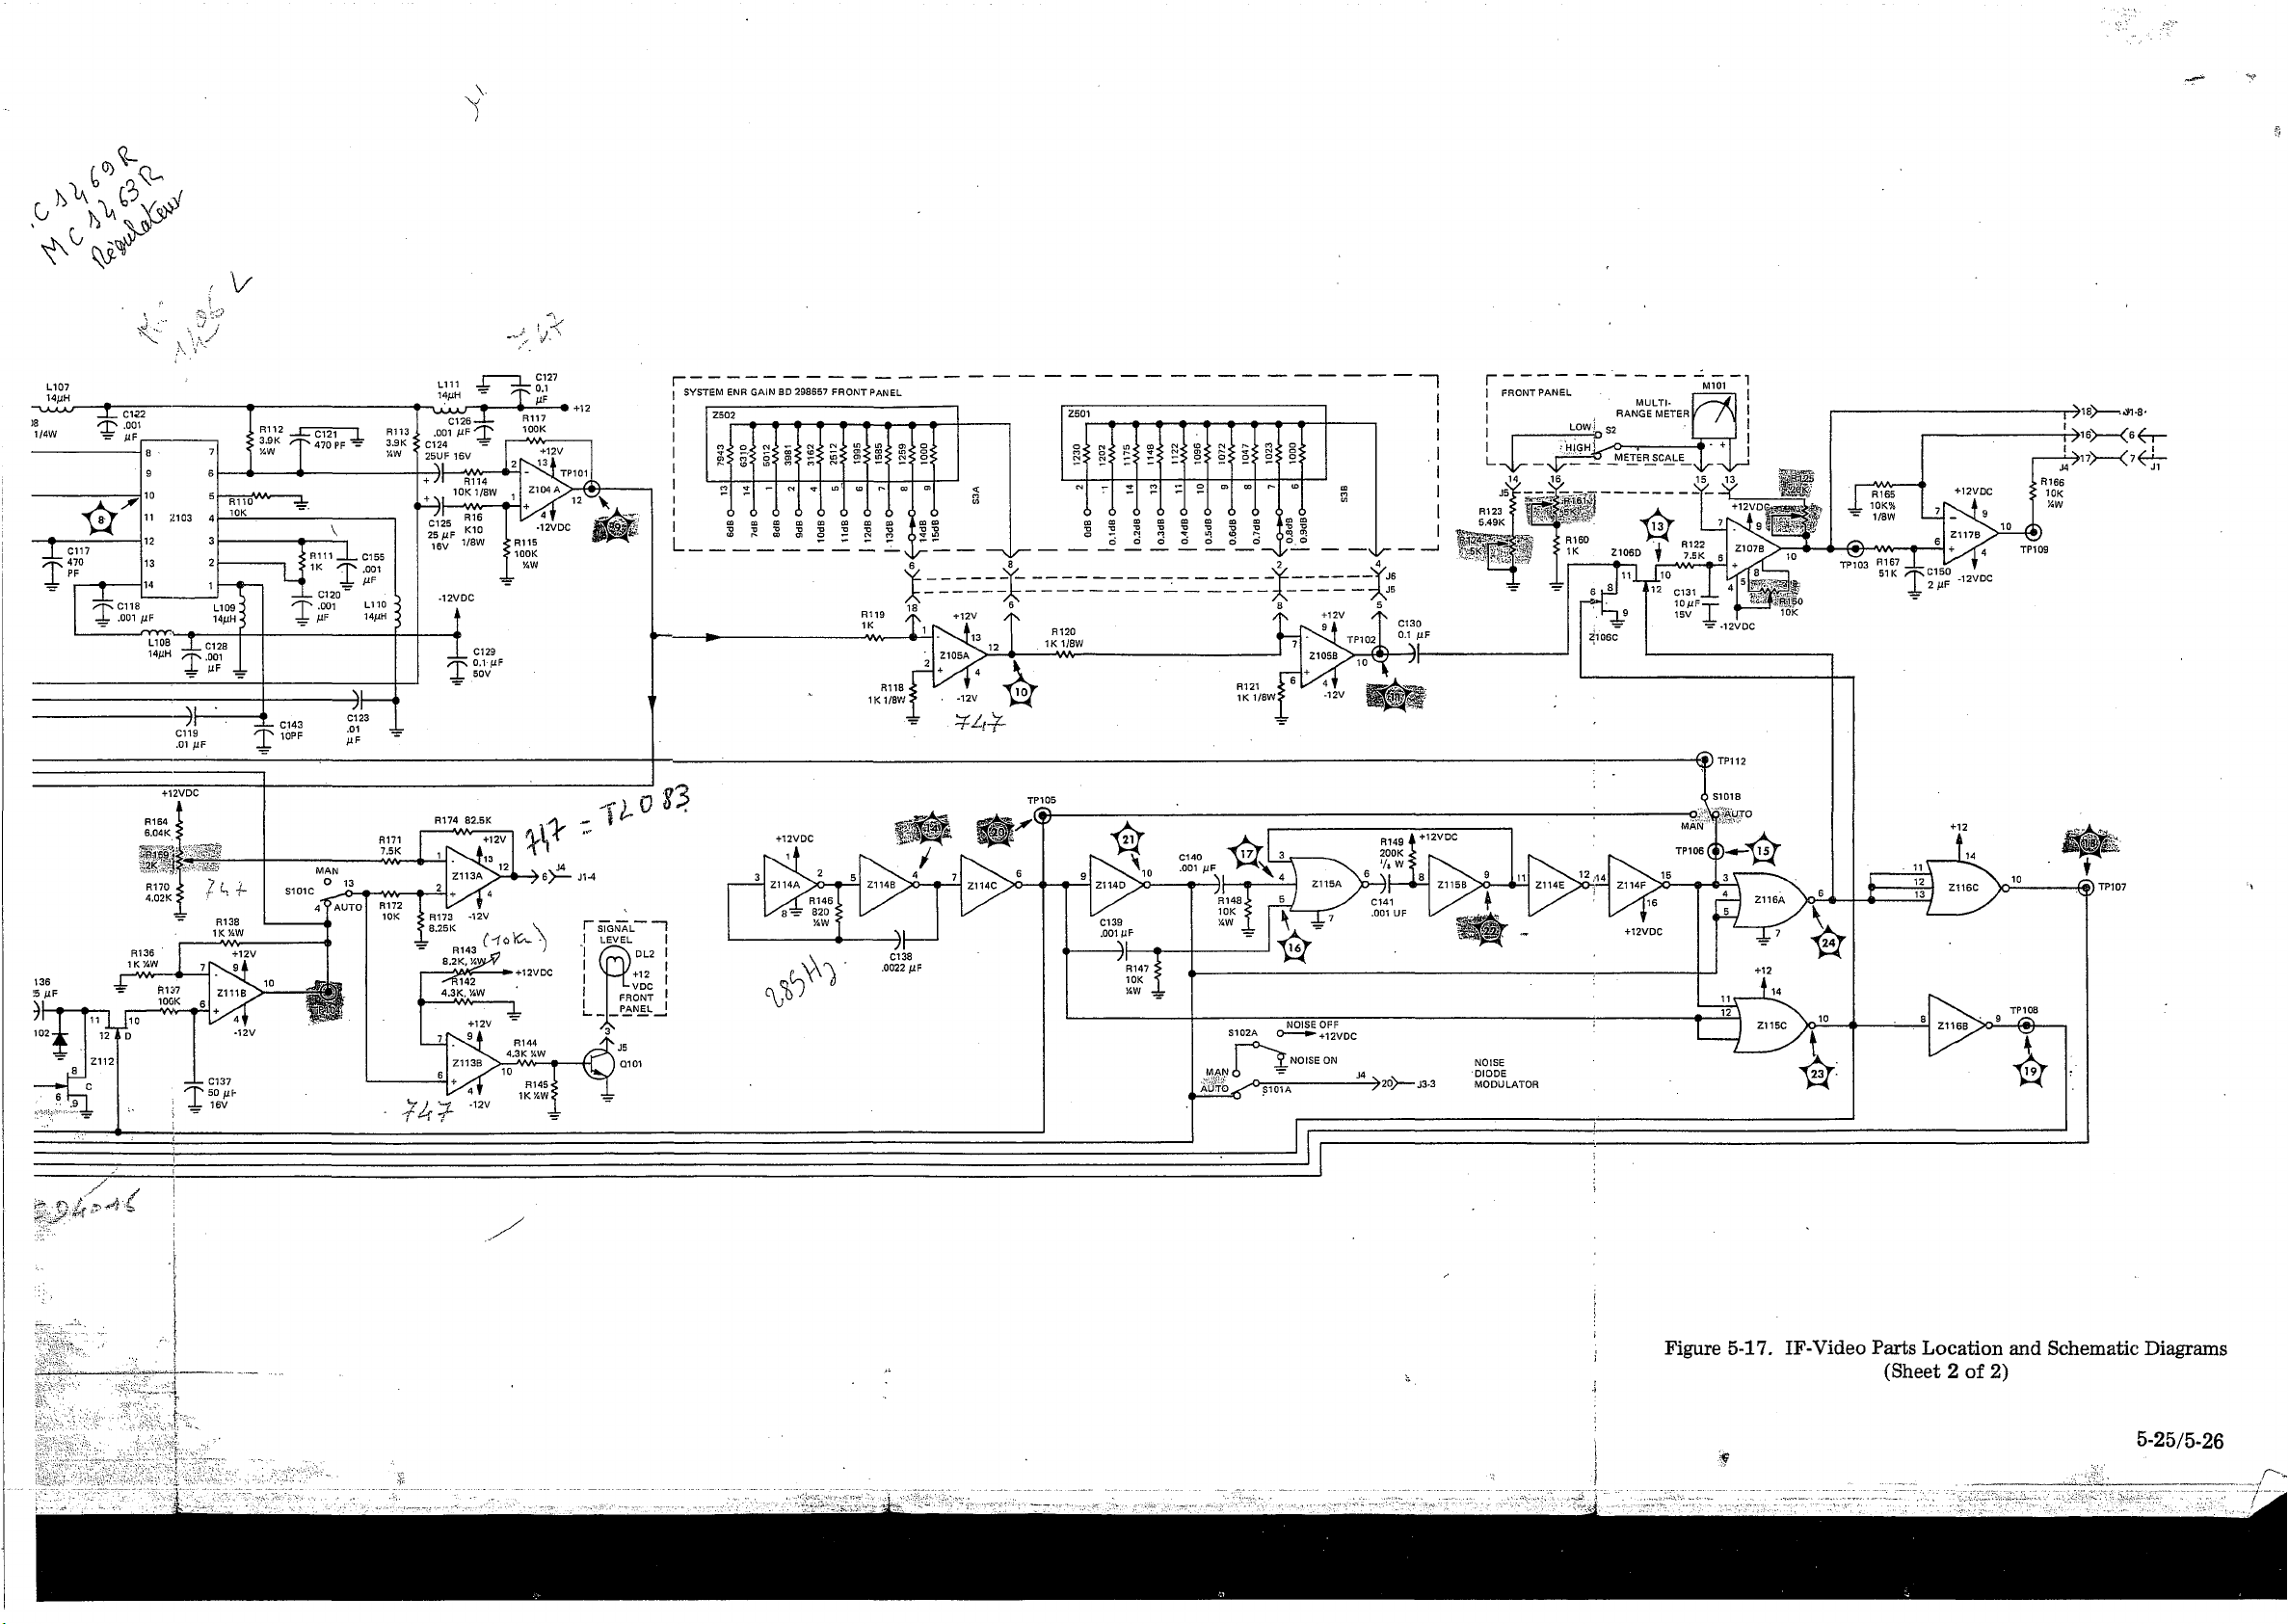
>16>— (6<rr~
•,7> -< 7^ r
Figure 5-17. IF-Video Parts Location and Schematic Diagrams
(Sheet 2 of 2)
5-25/5-26
Page 91
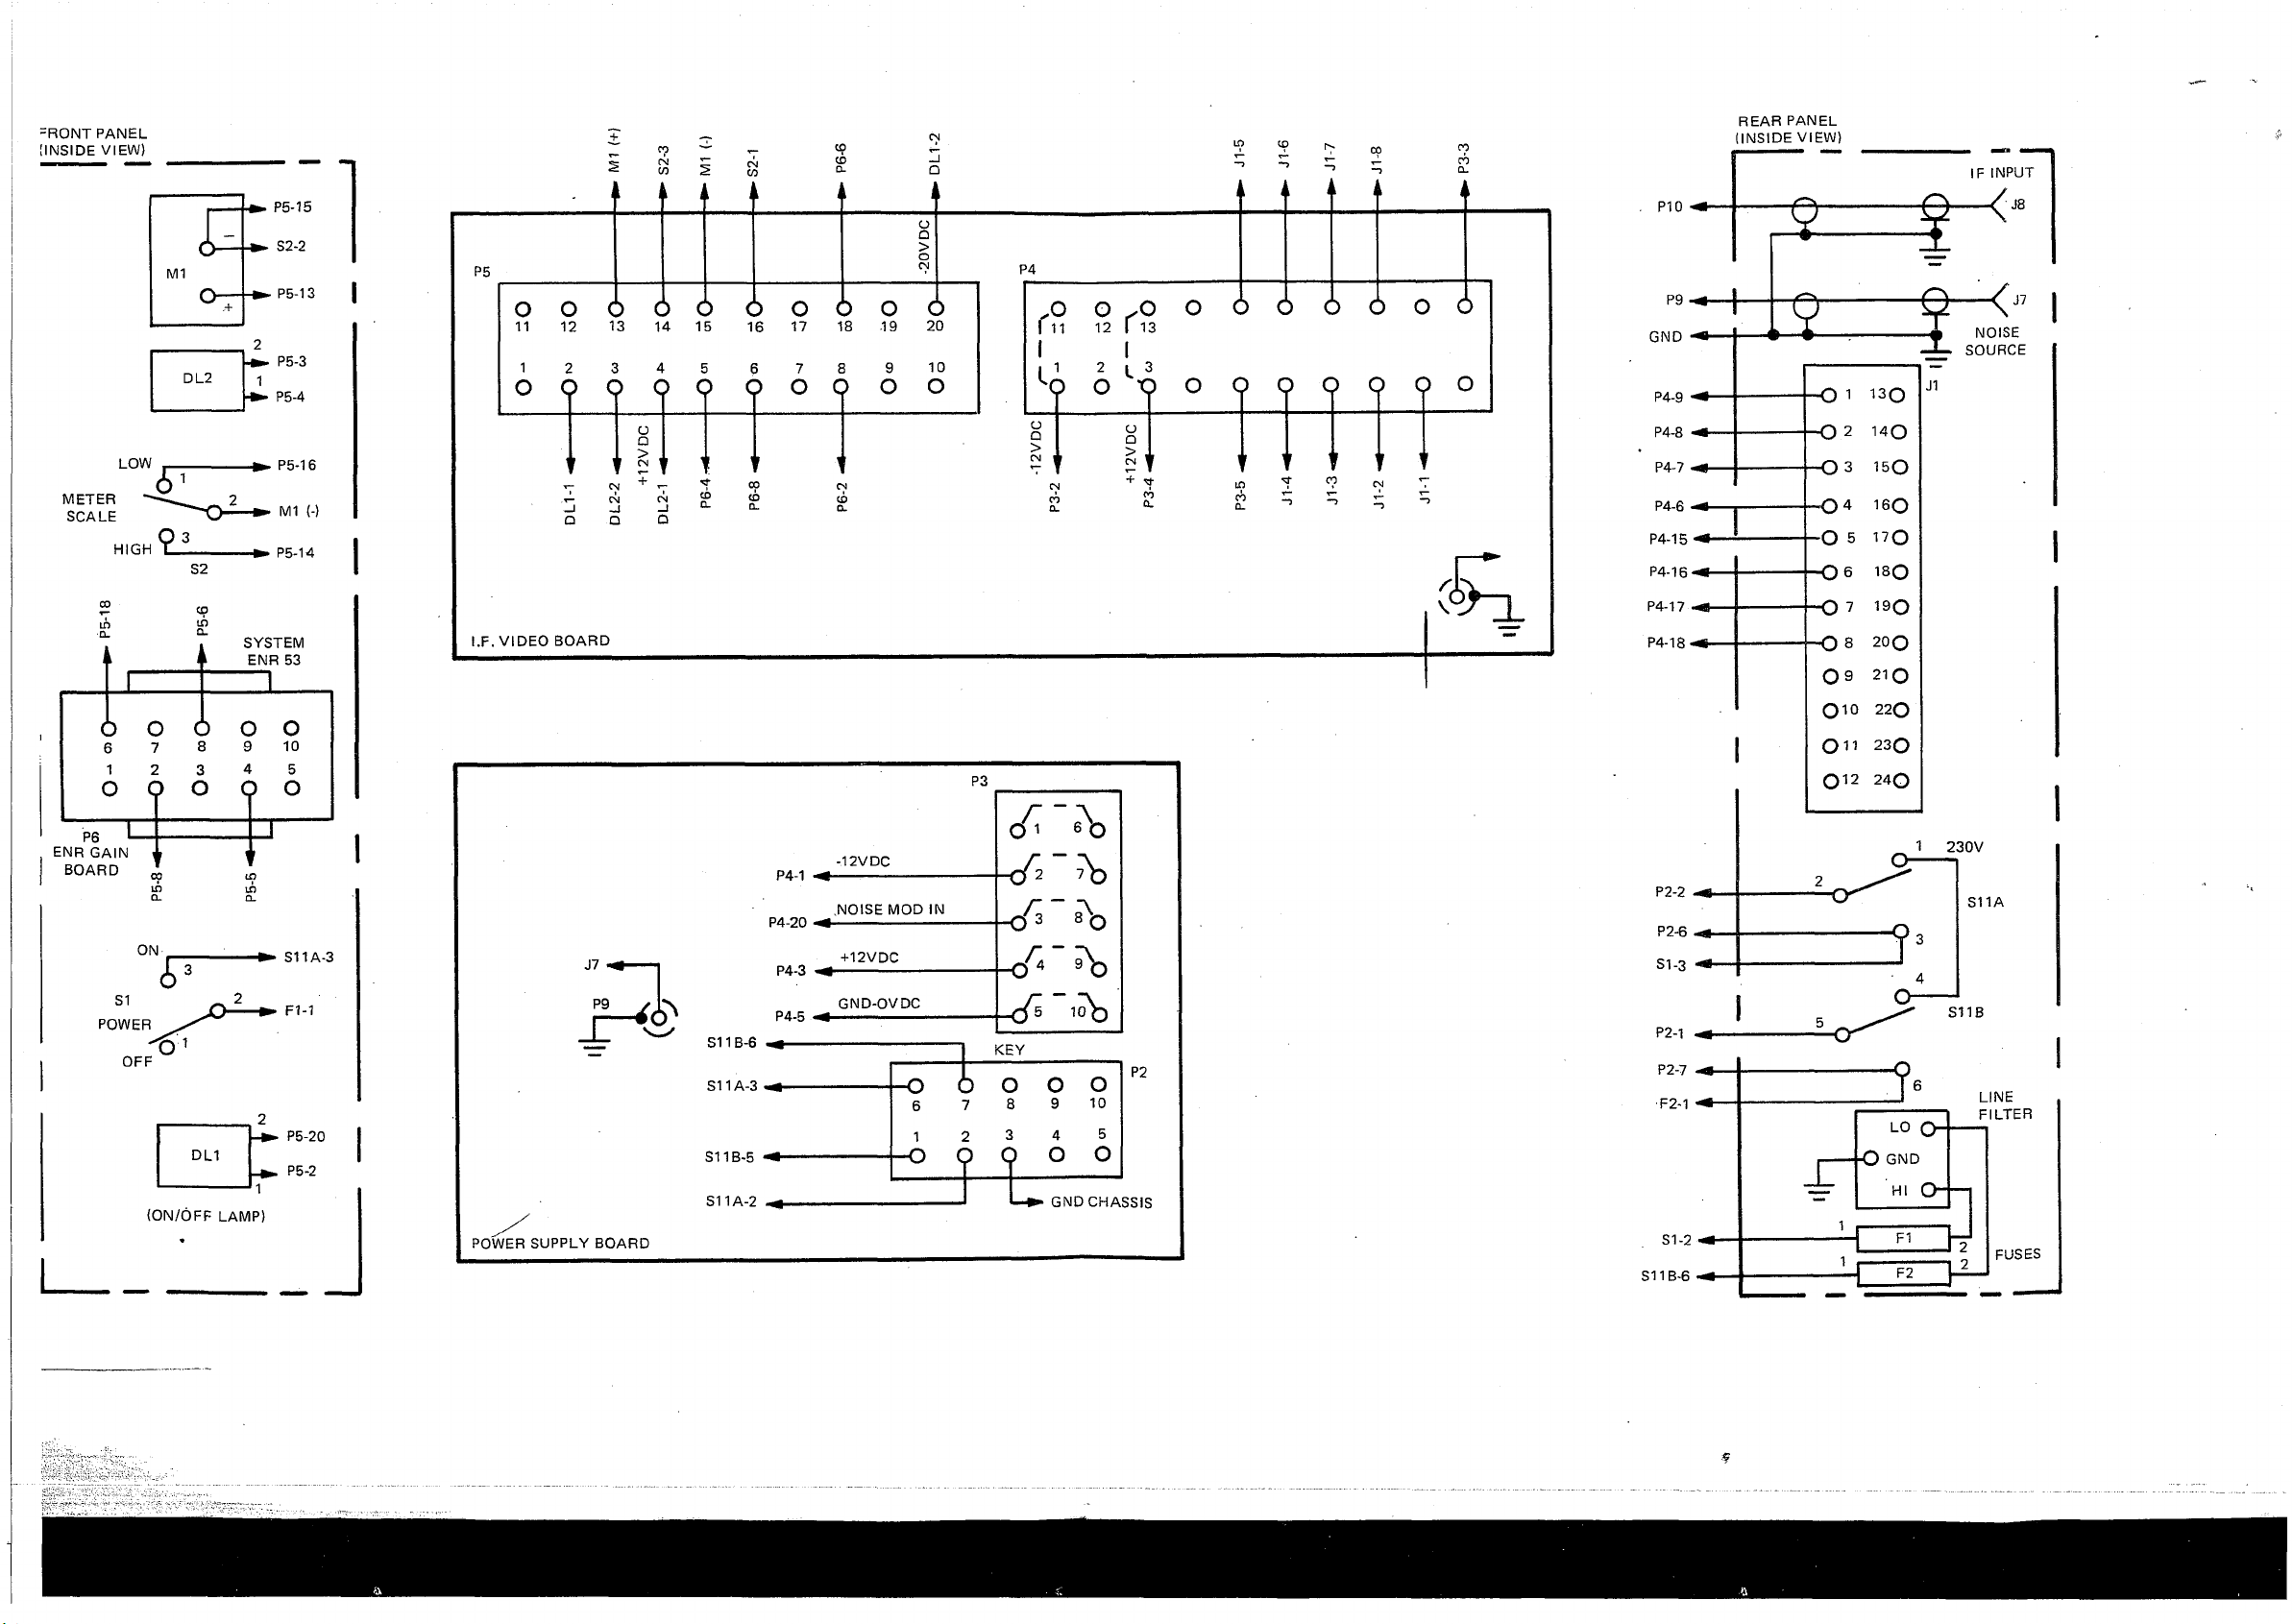
=RONT PANEL
¡INSIDE VIEW)
LOW
METER
SCALE
HIGH
n .
11
CD
in
SYSTEM
ENR 53
co
(N
c/j
REAR PANEL
CD
CD
CO
CO
(INSIDE VIEW)
ö o
6
1
o
P6 L
ENR GAIN
BOARD
Ô
8 9
7
2
3
P
o o
°?
in
ON
OFF
DL1
(ON/ÖFF LAMP)
o
o
10
4
5
P3
e'b
-12 V DC
.NOISE MOD IN
+12VDC
GND-OVDC
----------------------
-o
6
1 2
-o
KEY
3
p
c
< f ■
/— -\
<5 3 8 o
c/» '° o
O o
9
8
3
4
o
?
GND CHASSIS
o
10
P2
5
o
S11A-3
F1-1
P5-20
P5-2
J7
P9ry
__
_ C T ^
POWER SUPPLY BOARD
P4-1
P4-20
P4-3
/•
S11B-6
S11A-3
S11B-5 -----------------------
S11A-2
P4-5
Page 92
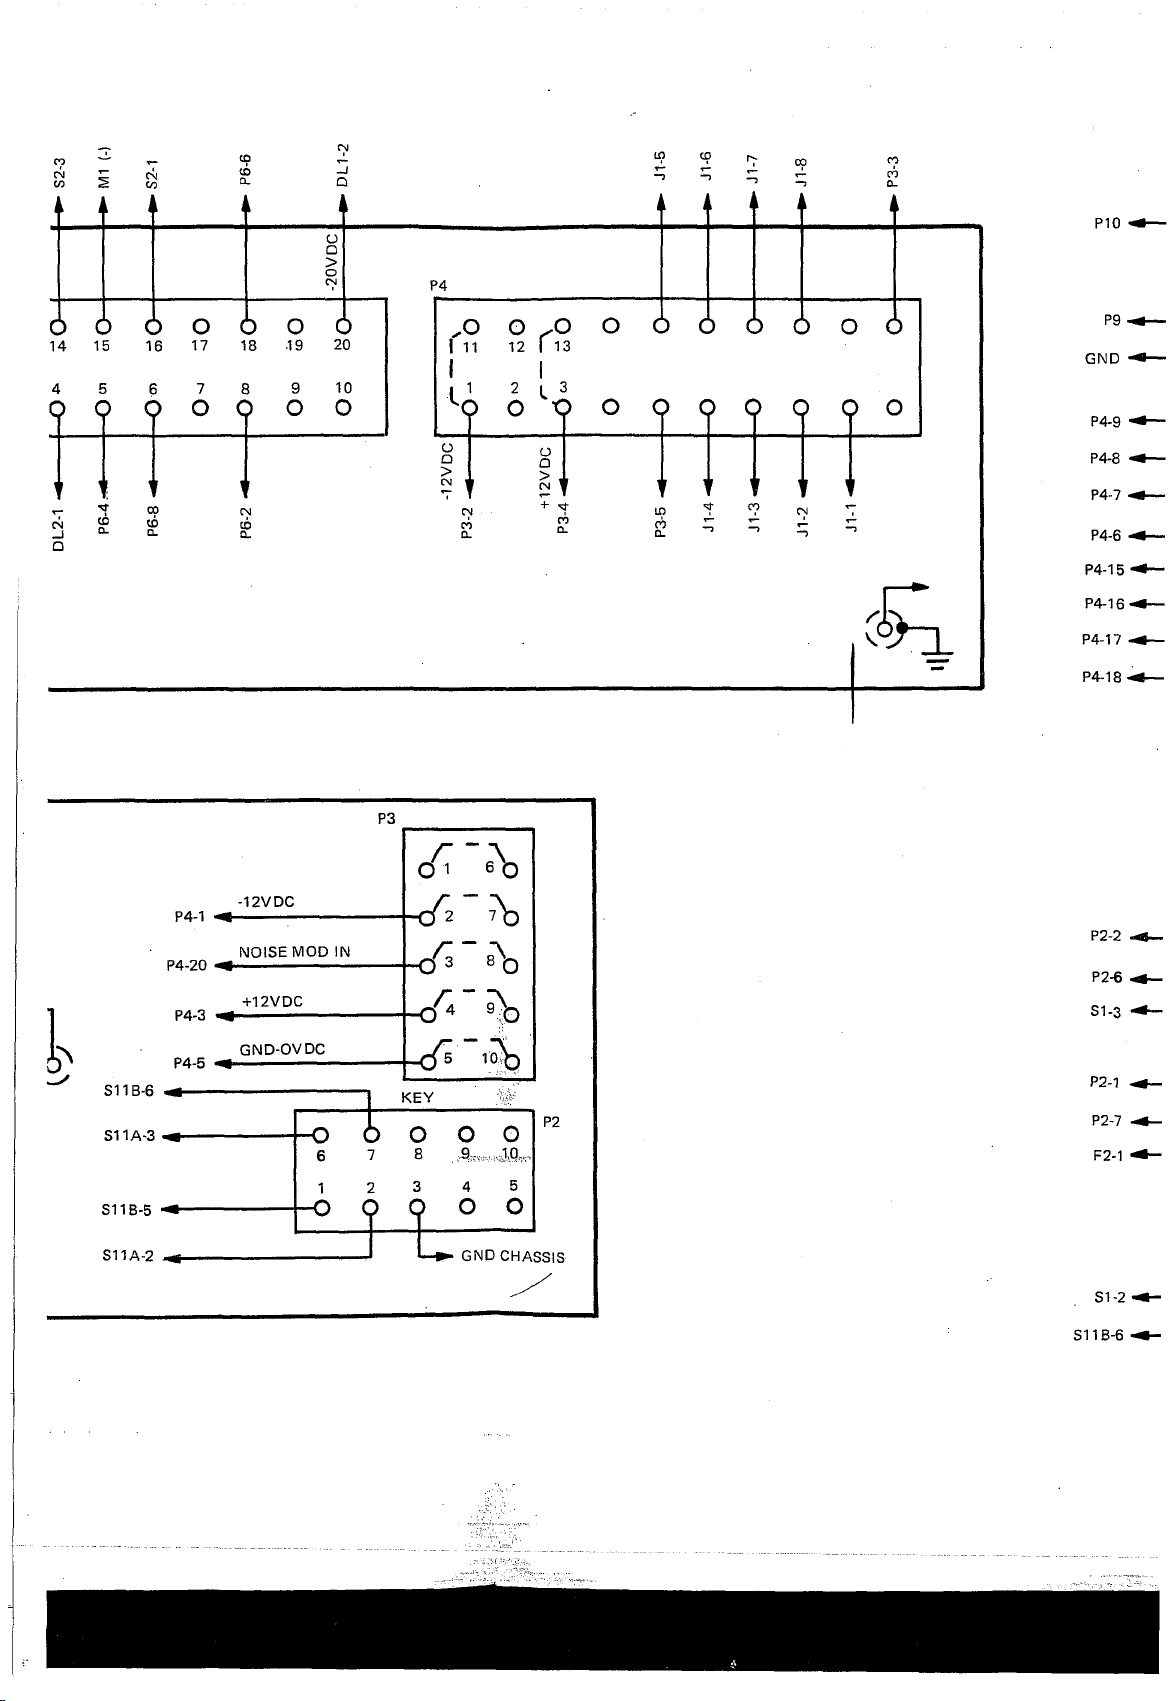
*9
CM
GO
CD
rsi
Zi
Q
CO
CO
D -
P10 ^ —
P9 -+—
GND —
P4-9 —
P4-8 -m—
P4-7 —
P4-6 —
P4-15 • * —
P4-16 —
P4-17
P4-18 -rt—
I
s u b -6 --------------------------
S11A-3 --------------------------
S11B-5 -«
S11A-2
P4-1
P4-20
P4-3
P4-5
-12V DC
NOISE MOD IN
+12VDC
GND-O V DC
--------------------------
- O
- O
6
1 2
P3
< f \ e \ )
—{J * ' { J
— u u
_ c f e , 9V
- 0 5 tO ih
KEY
I
O O
8
7
3 4
A J
O 0
5
O O
GND CHASSIS
P2-2
P2-6
S1-3
P2-1
P2
P2-7
F2-1
S1-2 ■
S11B-6 ■
A
Page 93
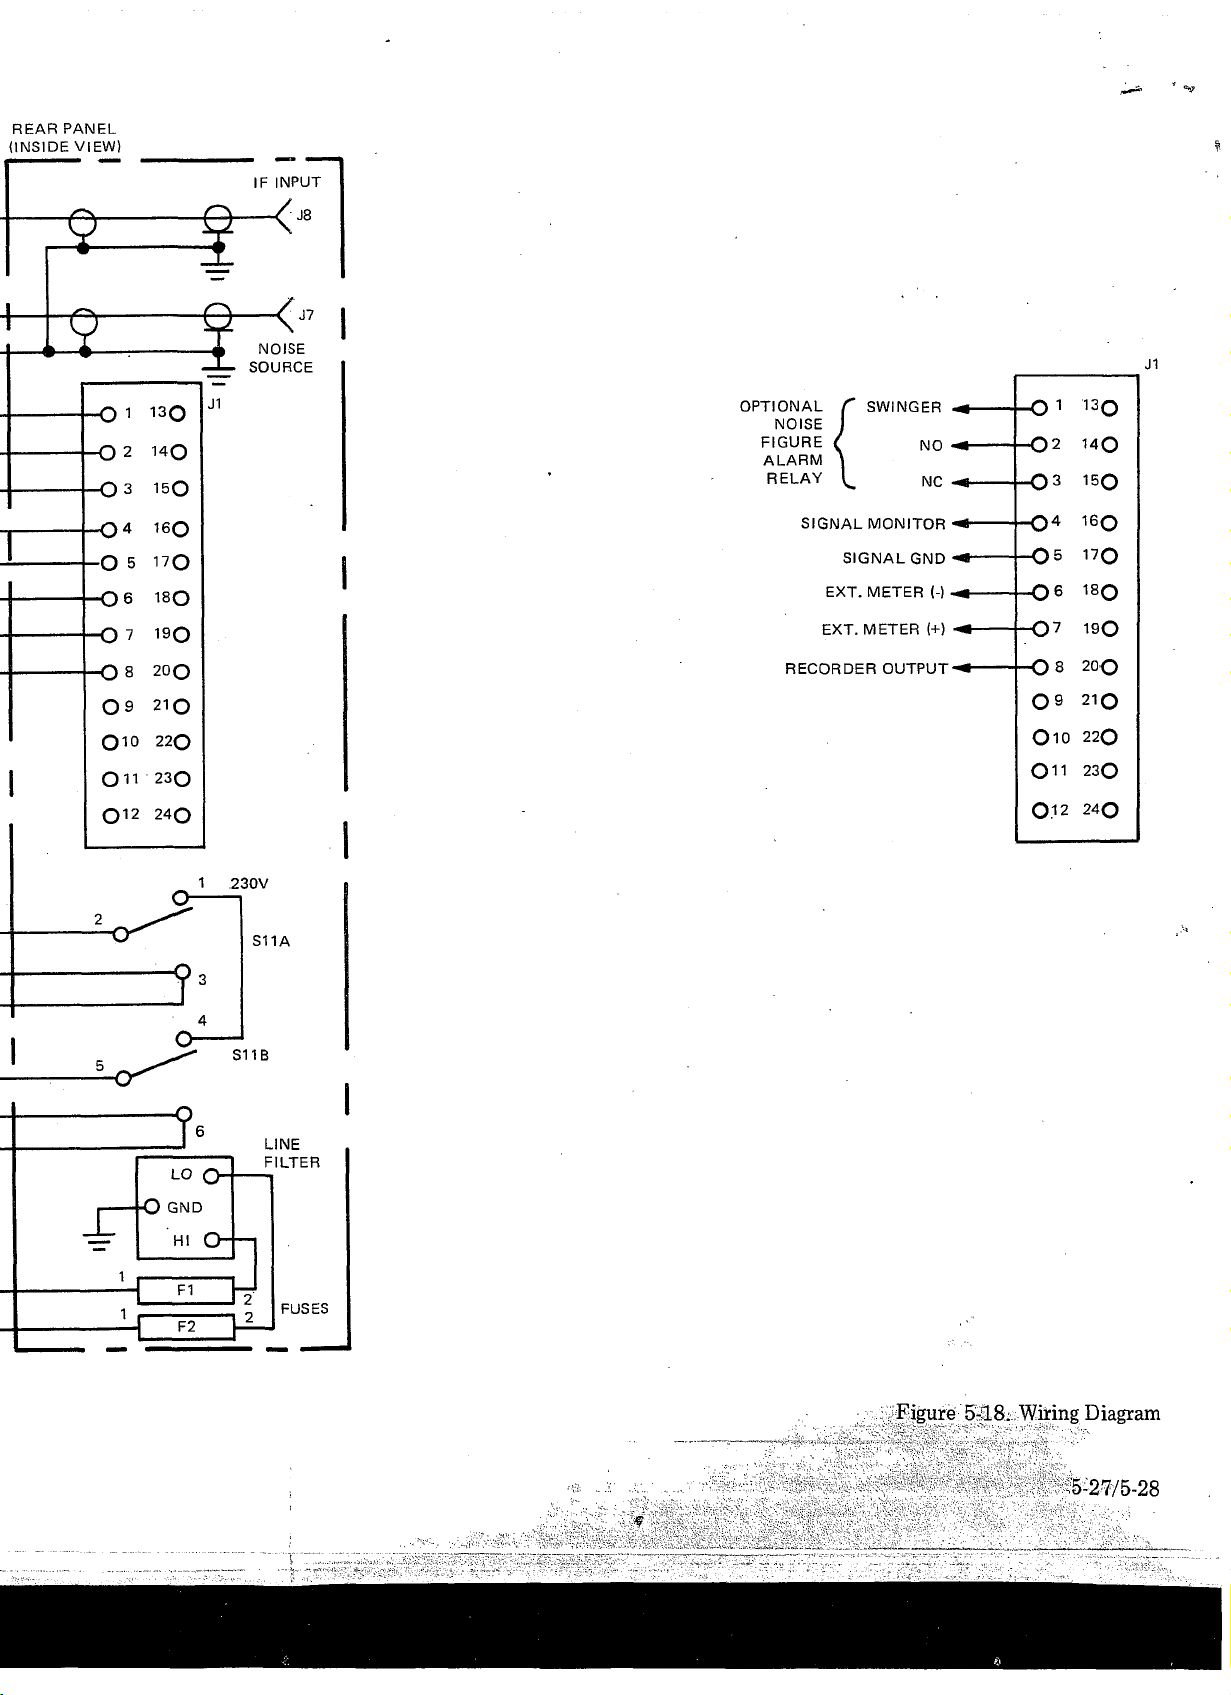
t ~ r
IF IN PUT
J8
<
NOISE
SOURCE
O 1
O 2
03
04
O 5
06
O 7
O 8
09
Oio
On
012
130
140
150
160
170
180
190
200
210
220
2 3 Q
CM
0
1 2 3 0 V
S11A
NOISE J
FIG UR E / mo ^
AL AR M ^
R E LA Y ^ NC
SIG NA L M ON ITO R
SIG N A L G N D -----
EXT. M E T ER (-)
EXT. ME T E R (+)
RECO R DER O U T P U T-* -----
----------
----------
-----
----------
----
O 1 130
-02
-O3
-O4
-05
-06
140
150
160
170
180
-O? 190
-08
2 0 0
0 9 21Q
to
to
o
o
230
0 1 1
0.12 24Q
o
LINE
FILTE R
FUSES
Figure 5-18. Wiring Diagram
,5-27/5-28
?
Page 94
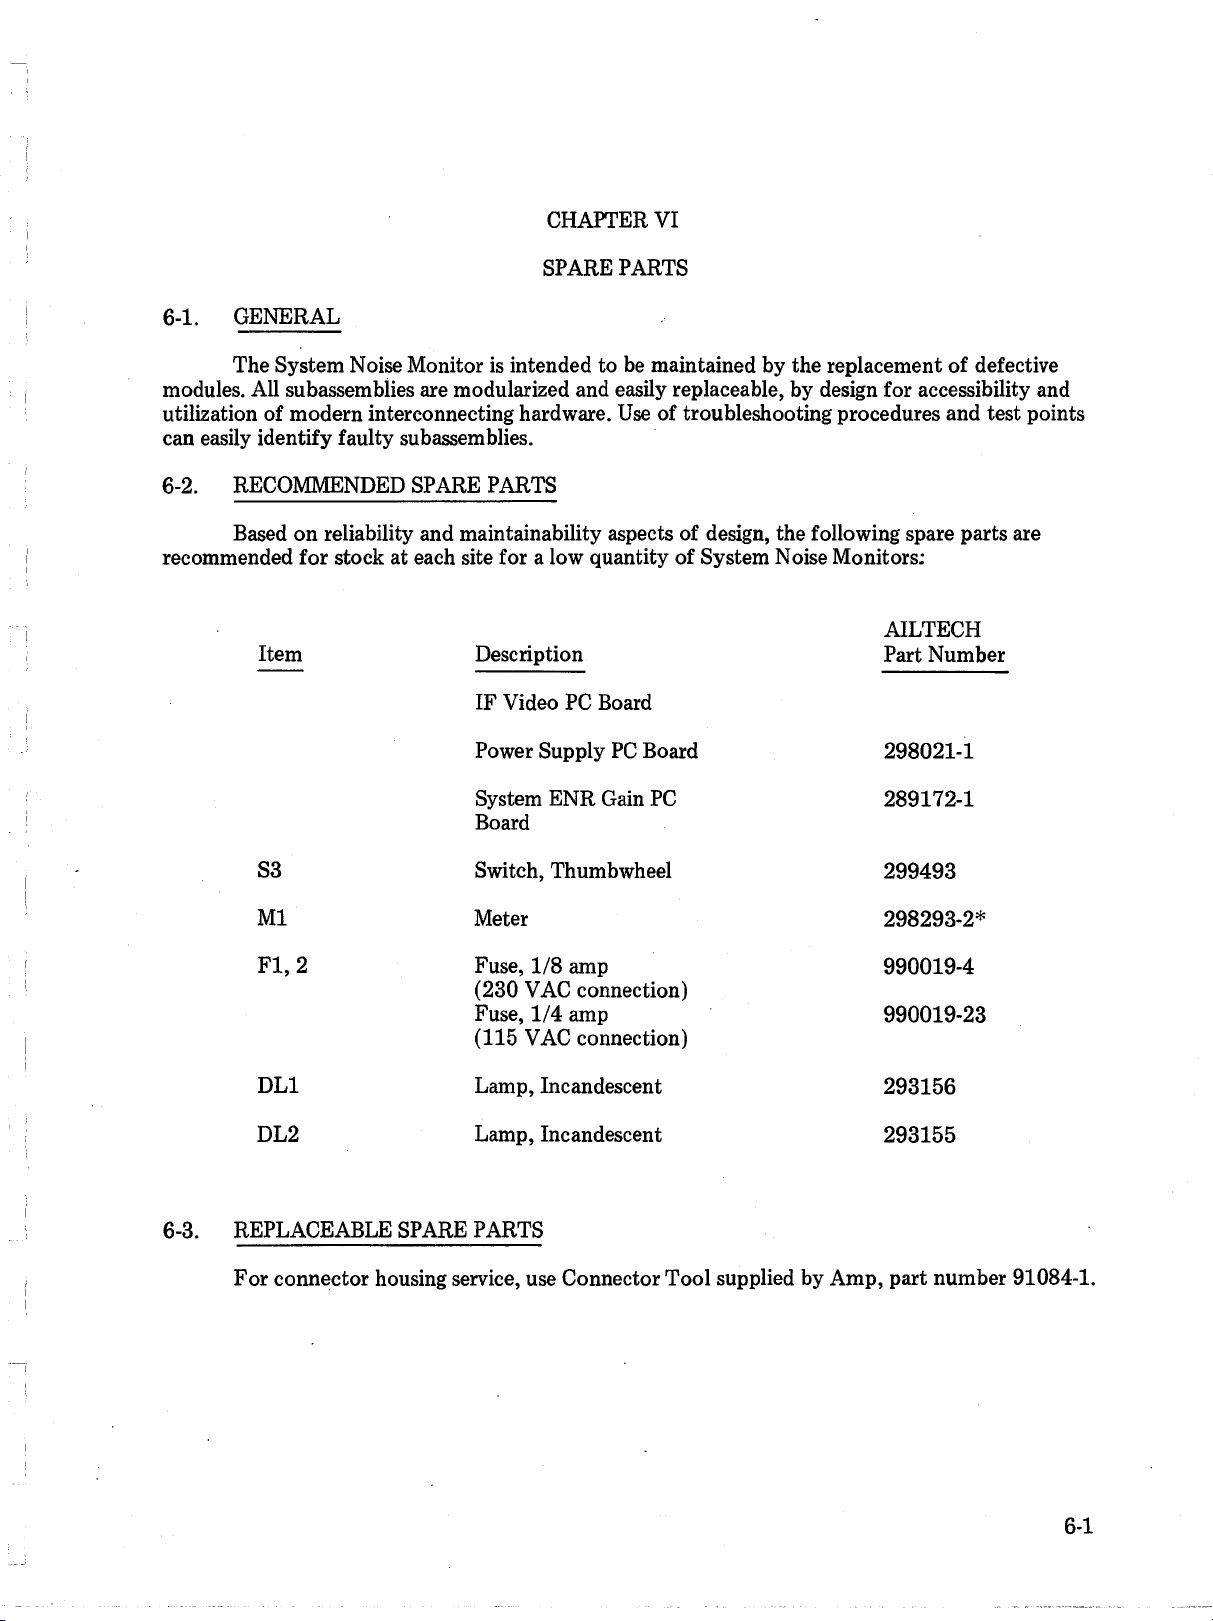
CHAPTER VI
SPARE PARTS
6-1. GENERAL
The System Noise Monitor is intended to be maintained by the replacement of defective
modules. All subassemblies are modularized and easily replaceable, by design for accessibility and
utilization of modern interconnecting hardware. Use of troubleshooting procedures and test points
can easily identify faulty subassemblies.
6-2. RECOMMENDED SPARE PARTS
Based on reliability and maintainability aspects of design, the following spare parts are
recommended for stock at each site for a low quantity of System Noise Monitors;
AILTECH
Item Description
IF Video PC Board
Power Supply PC Board 298021-1
Part Number
System ENR Gain PC
Board
S3
M l
FI, 2
DL1
DL2 Lamp, Incandescent
6-3. REPLACEABLE SPARE PARTS
For connector housing service, use Connector Tool supplied by Amp, part number 91084-1.
Switch, Thumbwheel
Meter
Fuse, 1/8 amp
(230 VAC connection)
Fuse, 1/4 amp
(115 VAC connection)
Lamp, Incandescent
289172-1
299493
298293-2*
990019-4
990019-23
293156
293155
6-1
Page 95
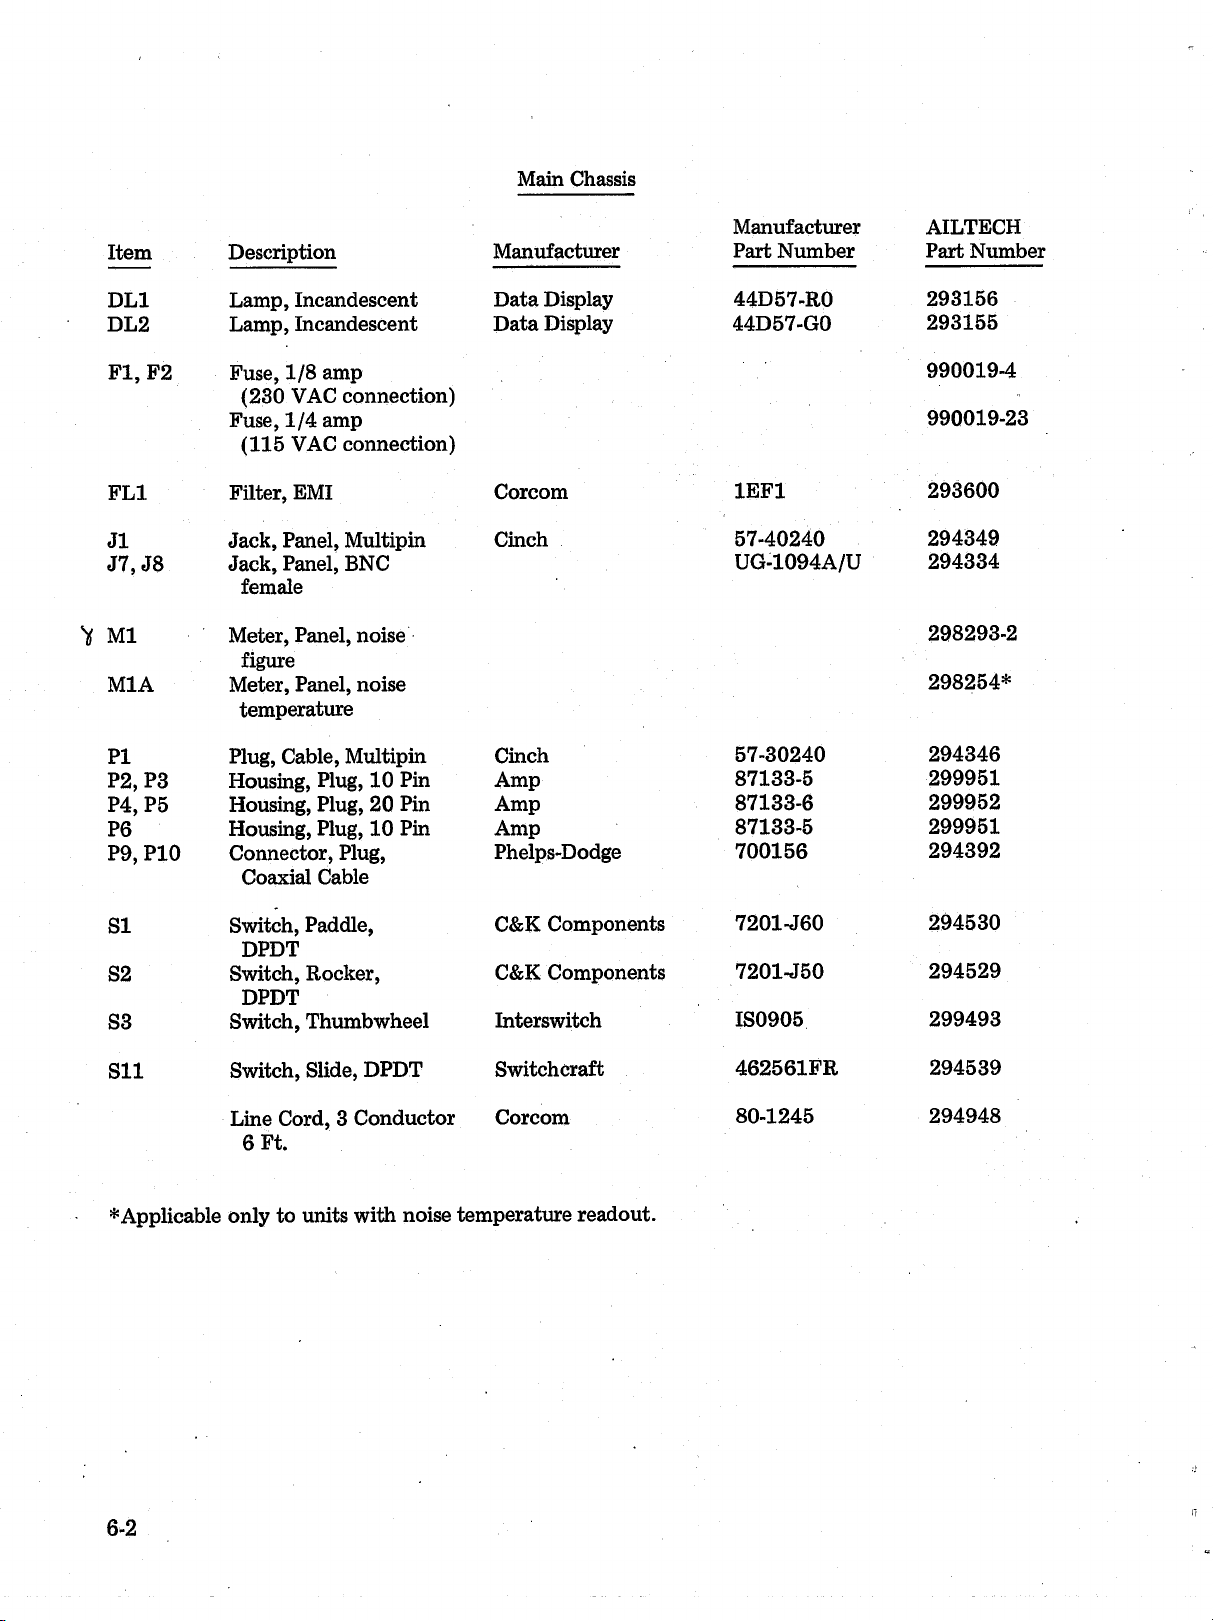
Main Chassis
Item
DL1
DL2
F1,F2
FL1
J1
J7, J8
M l
M IA
PI
P2, P3
P4, P5
P6
P9, P10
Description
Lamp, Incandescent
Lamp, Incandescent
Fuse, 1/8 amp
(230 VAC connection)
Fuse, 1/4 amp
(115 VAC connection)
Filter, EMI
Jack, Panel, Multipin
Jack, Panel, BNC
female
Meter, Panel, noise
figure
Meter, Panel, noise
temperature
Plug, Cable, Multipin
Housing, Plug, 10 Pin
Housing, Plug, 20 Pin
Housing, Plug, 10 Pin
Connector, Plug,
Coaxial Cable
Manufacturer
Manufacturer Part Number
Data Display
Data Display
Corcom
Cinch 57-40240
Cinch
Amp
Amp
Amp
Phelps-Dodge
44D57-R0
44D57-G0
1EF1
UG-1094A/U
57-30240
87133-5
87133-6
87133-5
700156
AILTECH
Part Number
293156
293155
990019-4
990019-23
293600
294349
294334
298293-2
298254*
294346
299951
299952
299951
294392
51
52
53
S ll
* Applicable only to units with noise temperature readout.
Switch, Paddle,
DPDT
Switch, Rocker,
DPDT
Switch, Thumbwheel
Switch, Slide, DPDT
Line Cord, 3 Conductor
6 Ft.
C&K Components
C&K Components
Interswitch
Switchcraft
Corcom
7201-J60
7201-J50
IS0905
462561FR
80-1245
294530
294529
299493
294539
294948
6-2
Page 96
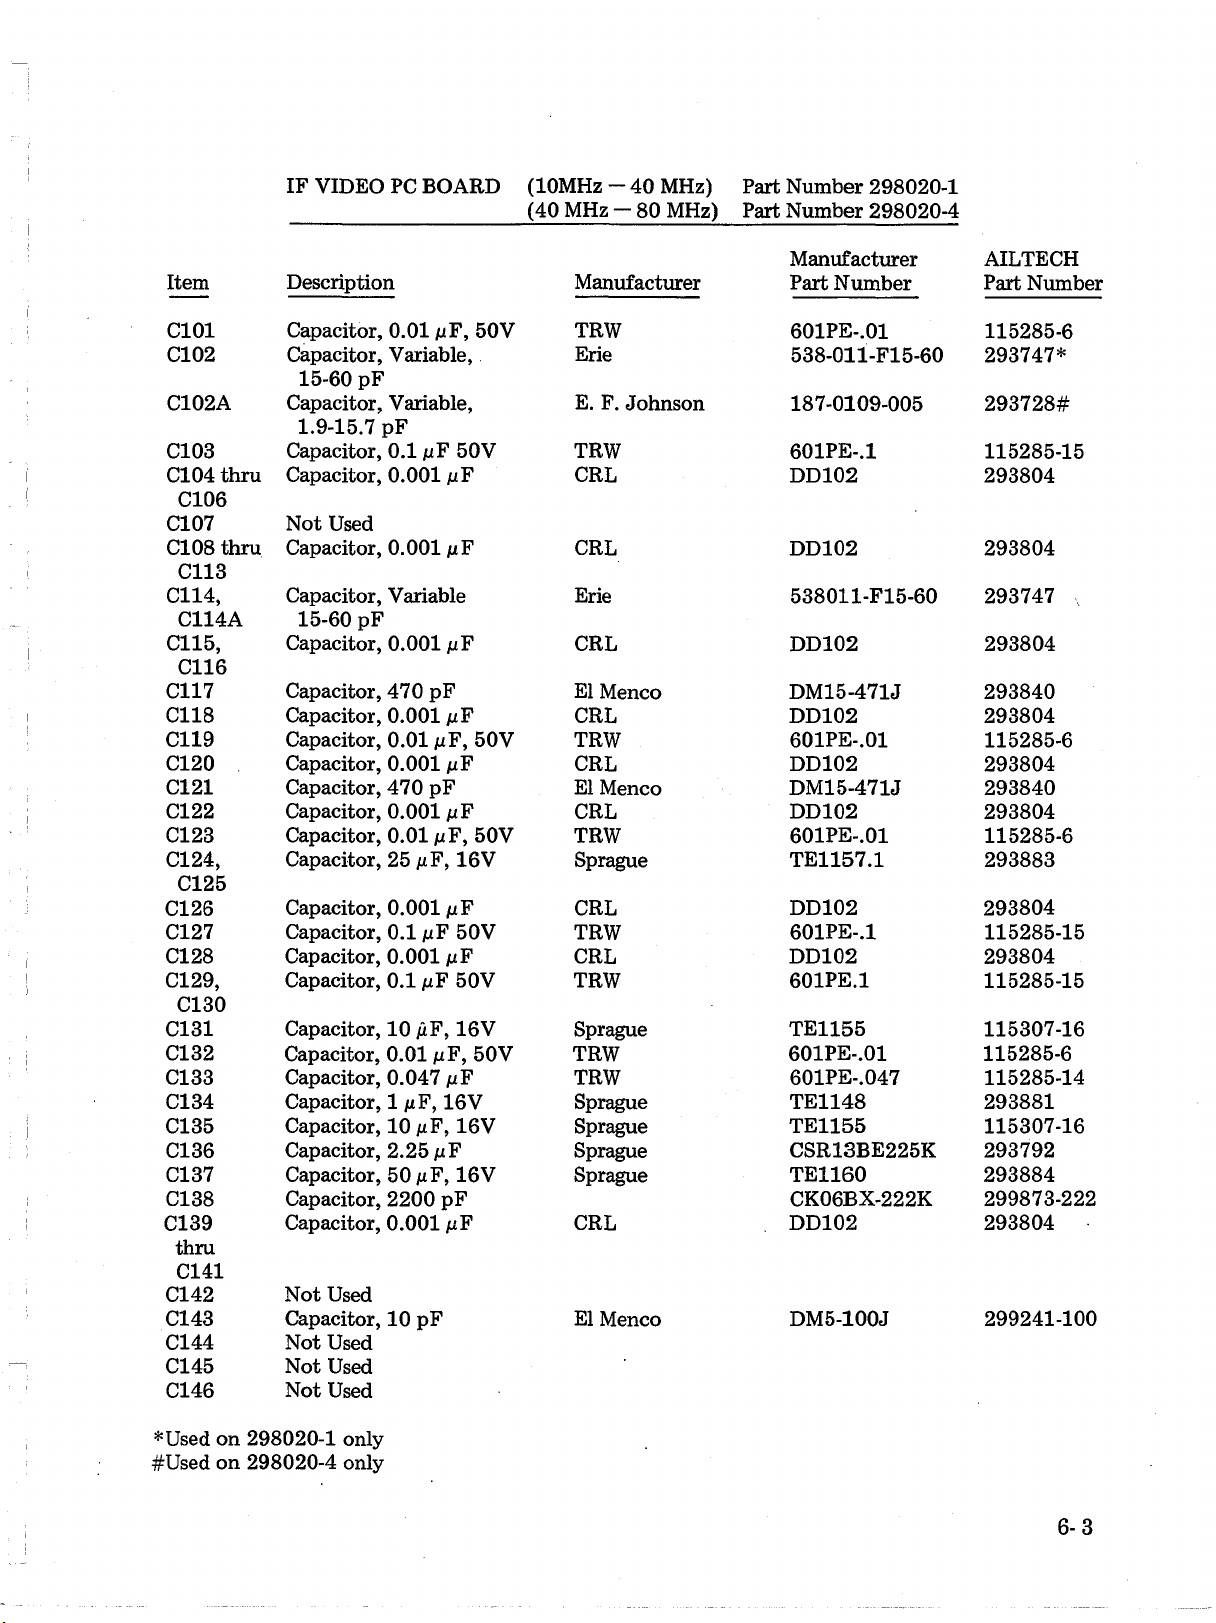
IF VIDEO PC BOARD (10MHz - 40 MHz) Part Number 298020-1
___
_____________________(40 MHz — 80 MHz) Part Number 298020-4
Item Description
C101 Capacitor, 0.01 nF, 50V TRW
C102 Capacitor, Variable, Erie
15-60 pF
C102A
C103
Cl 04 thru Capacitor, 0.001 ¡xF CRL DD102
C106
Cl 07 Not Used
Cl 08 thru Capacitor, 0.001 fiF
C113
C114,
C114A
C115, Capacitor, 0.001 /xF
C116
C117 Capacitor, 470 pF
( C118 Capacitor, 0.001 juF
C119 Capacitor, 0.01 juF, 50V
C120
Cl 21 Capacitor, 470 pF
C122 Capacitor, 0.001 fi F
C123
C124,
; C125
C126
C127 Capacitor, 0.1 juF 50V
Cl 28 Capacitor, 0.001 juF
C129, Capacitor, 0.1 ai F 50V
C130
C131
C132
C133
Cl 34 Capacitor, 1 fxF, 16 V Sprague TE1148 293881
| C135 Capacitor, 10 juF, 16V Sprague
C136
C137 Capacitor, 50 ju F, 16V Sprague TE1160 293884
C138 Capacitor, 2200 pF
! C139
thru
C141
Cl 42 Not Used
Cl 43 Capacitor, 10 pF El Meneo
C144
- C145
C146 Not Used
Capacitor, Variable,
1.9-15.7 pF
Capacitor, 0.1 juF 50V
Capacitor, Variable
15-60 pF
Capacitor, 0.001 ¡xF
Capacitor, 0.01 juF, 50V
Capacitor, 25 ¡jlF, 16V
Capacitor, 0.001 nF
Capacitor, 10 p.F, 16V
Capacitor, 0.01 nF, 50V TRW
Capacitor, 0.047 fiF
Capacitor, 2.25 /i F
Capacitor, 0.001 ¡jlF
Not Used
Not Used
Manufacturer
E. F. Johnson
TRW
CRL DD102 293804
Erie 538011-F15-60
CRL
El Meneo DM15-471J 293840
CRL
TRW
CRL
El Meneo DM15-471J 293840
CRL
TRW
Sprague
CRL
TRW
CRL
TRW
Sprague
TRW 601PE-.047
Sprague
CRL
Manufacturer
Part Number Part Number
601PE-.01
538-011-F15-60 293747*
187-0109-005
601PE-.1
DD102 293804
DD102 293804
601PE-.01
DD102 293804
DD102
601PE-.01
TE1157.1
DD102
601PE-.1
DD102 293804
601PE.1
TE1155
601PE-.01
TE1155
CSR13BE225K 293792
CK06BX-222K 299873-222
DD102 293804
DM5-100J
AILTECH
115285-6
293728#
115285-15
293804
293747 ,
115285-6
293804
115285-6
293883
293804
115285-15
115285-15
115307-16
115285-6
115285-14
115307-16
299241-100
*Used on 298020-1 only
#Used on 298020-4 only
6-3
Page 97
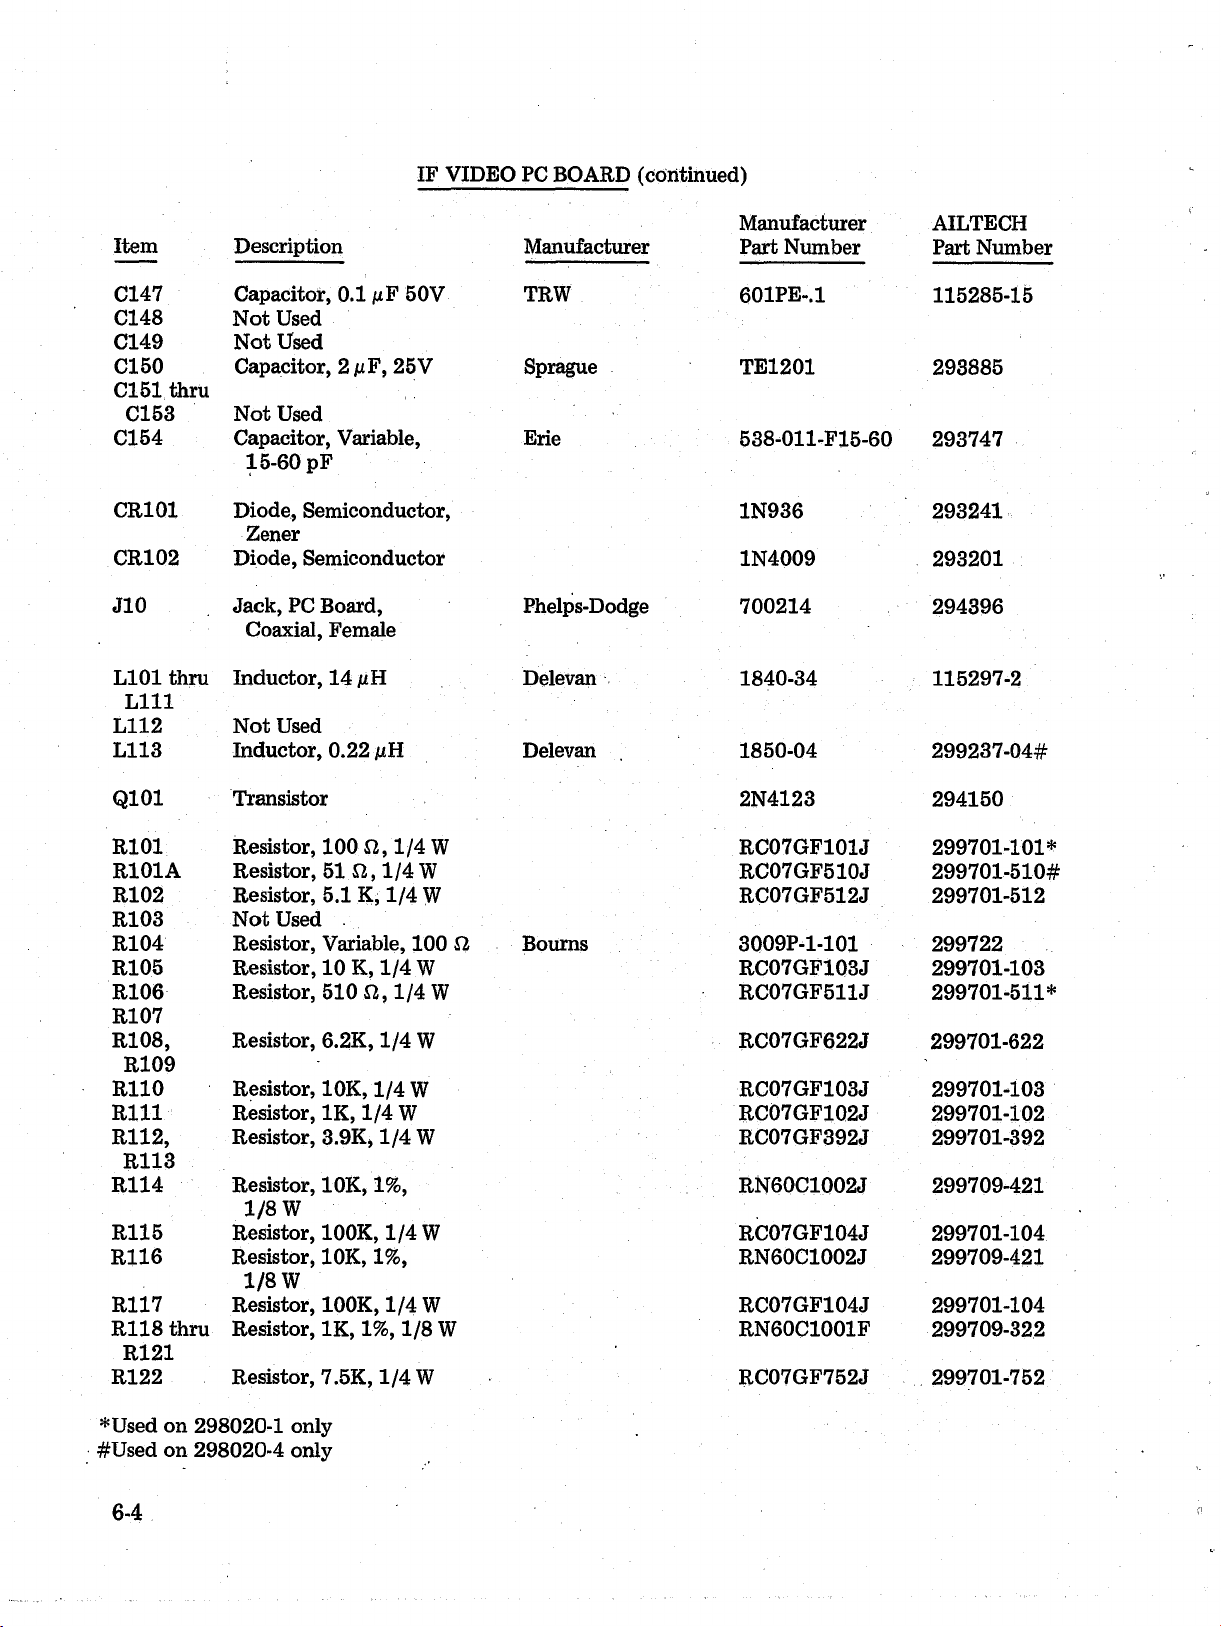
Item
Description
IF VIDEO PC BOARD (continued)
Manufacturer
Manufacturer AILTECH
Part Number
Part Number
C147 Capacitor, 0.1 /uF 50V TRW 601PE-.1
C148
C149
Cl 50
Cl 51 thru
C153
Cl 54
CR101
CR102
J10 Jack, PC Board,
L101 thru
L l ll
L112
L113
Q1 0 1
R101 Resistor, 100 S2,1/4 W
R101A
R102 Resistor, 5.1 K, 1/4 W
R103
R104
R105 Resistor, 10 K, 1/4 W
R106 Resistor, 510 Î2,1/4 W RC07GF511J
R107
R108, Resistor, 6.2K, 1/4 W
R109
R110
R ill
R112,
R113
R114
R115
R116 Resistor, 10K, 1%,
R117
R118 thru
R121
R122
NotUsed
NotUsed
Capacitor, 2 nF, 25V Sprague
Not Used
Capacitor, Variable,
15-60 pF
Diode, Semiconductor,
Zener
Diode, Semiconductor
Coaxial, Female
Inductor, 14 juH Delevan
Not Used
Inductor, 0.22 ßH
Transistor
Resistor, 51 Î2,1/4 W
NotUsed ...
Resistor, Variable, 100 £2
Resistor, 10K, 1/4 W RC07GF103J
Resistor, IK, 1/4 W
Resistor, 3.9K, 1/4 W
Resistor, 10K, 1%,
1 / 8 W
Resistor, 100K, 1/4 W
1/8 W
Resistor, 100K, 1/4 W
Resistor, IK, 1%, 1/8 W
Resistor, 7.5K, 1/4 W RC07GF752J
Erie
Phelps-Dodge 700214
Delevan , 1850-04
Bourns
TE1201
538-011-F15-60 293747
1N936
1N4009 293201
1840-34
2N4123 294150
RC07GF101J 299701-101*
RC07GF510J 299701-510#
RÇ07GF512J 299701-512
3009P-1-101 299722
RC07GF103J 299701-103
RC07GF622J
RC07GF102J 299701-102
RC07GF392J 299701-392
RN60C1002J 299709-421
RC07GF104J 299701-104
RN60C1002J
RC07GF104J 299701-104
RN60C1001F
115285-15
293885
293241
294396
115297-2
299237-04#
299701-511*
299701-622
299701-103
299709-421
299709-322
299701-752
*Used on 298020-1 only
#Used on 298020-4 only
6-4
Page 98
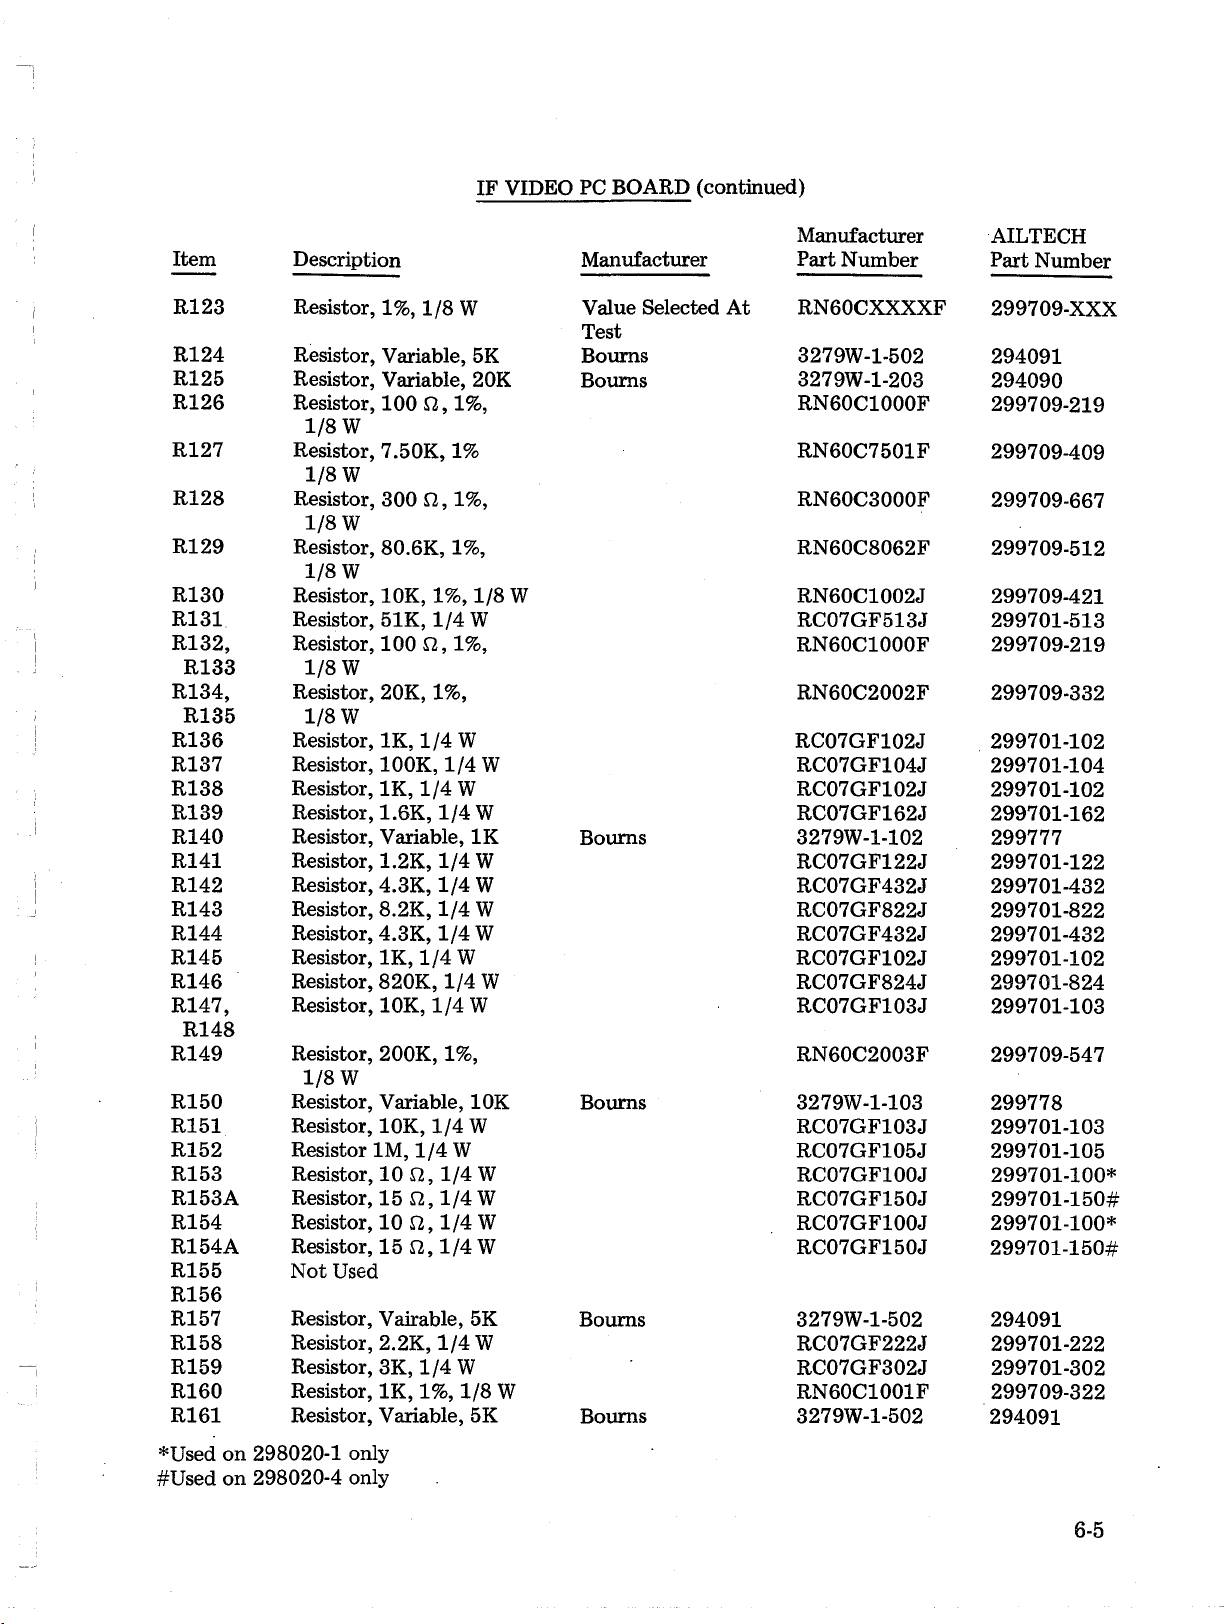
IF VIDEO PC BOARD (continued)
Manufacturer
Item
R123
R124
R125
R126
R127
R128
R129
R130
R131
R132,
R133
R134,
R135
R136 Resistor, 1K, 1/4 W
R137
R138
R139 Resistor, 1.6K, 1/4 W
R140 Resistor, Variable, 1K
R141 Resistor, 1.2K, 1/4 W
R142
R143 Resistor, 8.2K, 1/4 W
R144 Resistor, 4.3K, 1/4 W
R145
R146
R147, Resistor, 10K, 1/4 W
R148
R149 Resistor, 200K, 1%,
R150 Resistor, Variable, 10K
R151 Resistor, 10K, 1/4 W
R152 Resistor 1M, 1/4 W
R153 Resistor, 10 £2, 1/4 W
R153A Resistor, 15 £2,1/4 W
R154 Resistor, 10 £2 ,1/4 W
R154A
R155
R156
R157 Resistor, Vairable, 5K
R158
R159
R160 Resistor, 1K, 1%, 1/8 W RN60C1001F
R161
Description
Resistor, 1%, 1/8 W
Resistor, Variable, 5K
Resistor, Variable, 20K
Resistor, 100 £2 ,1%,
1/8 W
Resistor, 7.50K, 1%
1/8 W
Resistor, 300 £2 ,1%,
1/8 W
Resistor, 80.6K, 1%,
1/8 W
Resistor, 10K, 1%, 1/8 W
Resistor, 51K, 1/4 W
Resistor, 100 £2 ,1%,
1/8 W
Resistor, 20K, 1%,
1/8 W
Resistor, 100K, 1/4 W
Resistor, 1K, 1/4 W
Resistor, 4.3K, 1/4 W
Resistor, 1K, 1/4 W
Resistor, 820K, 1/4 W
1/8 W
Resistor, 15 £2,1/4 W
Not Used
Resistor, 2.2K,1/4W
Resistor, 3K, 1/4 W
Resistor, Variable, 5K
Manufacturer
Value Selected At
Test
Boums
Boums 3279W-1-203
Boums
Boums
Boums 3279W-1-502 294091
Boums
Part Number
RN60CXXXXF
3279W-1-502
RN60C1000F
RN60C7501F
RN60C3000F
RN60C8062F
RN60C1002J
RC07GF513J
RN60C1000F
RN60C2002F
RC07GF102J
RC07GF104J
RC07GF102J
RC07GF162J
3279W-1-102 299777
RC07GF122J 299701-122
RC07GF432J 299701-432
RC07GF822J
RC07GF432J
RC07GF102J
RC07GF824J
RC07GF103J
RN60C2003F
3279W-1-103
RC07GF103J
RC07GF105J
RC07GF100J
RC07GF150J 299701-150#
RC07GF100J
RC07GF150J
RC07GF222J
RC07GF302J
3279W-1-502
AILTECH
Part Number
299709-XXX
294091
294090
299709-219
299709-409
299709-667
299709-512
299709-421
299701-513
299709-219
299709-332
299701-102
299701-104
299701-102
299701-162
299701-822
299701-432
299701-102
299701-824
299701-103
299709-547
299778
299701-103
299701-105
299701-100*
299701-100*
299701-150#
299701-222
299701-302
299709-322
294091
*Used on 298020-1 only
#Used on 298020-4 only
6-5
Page 99
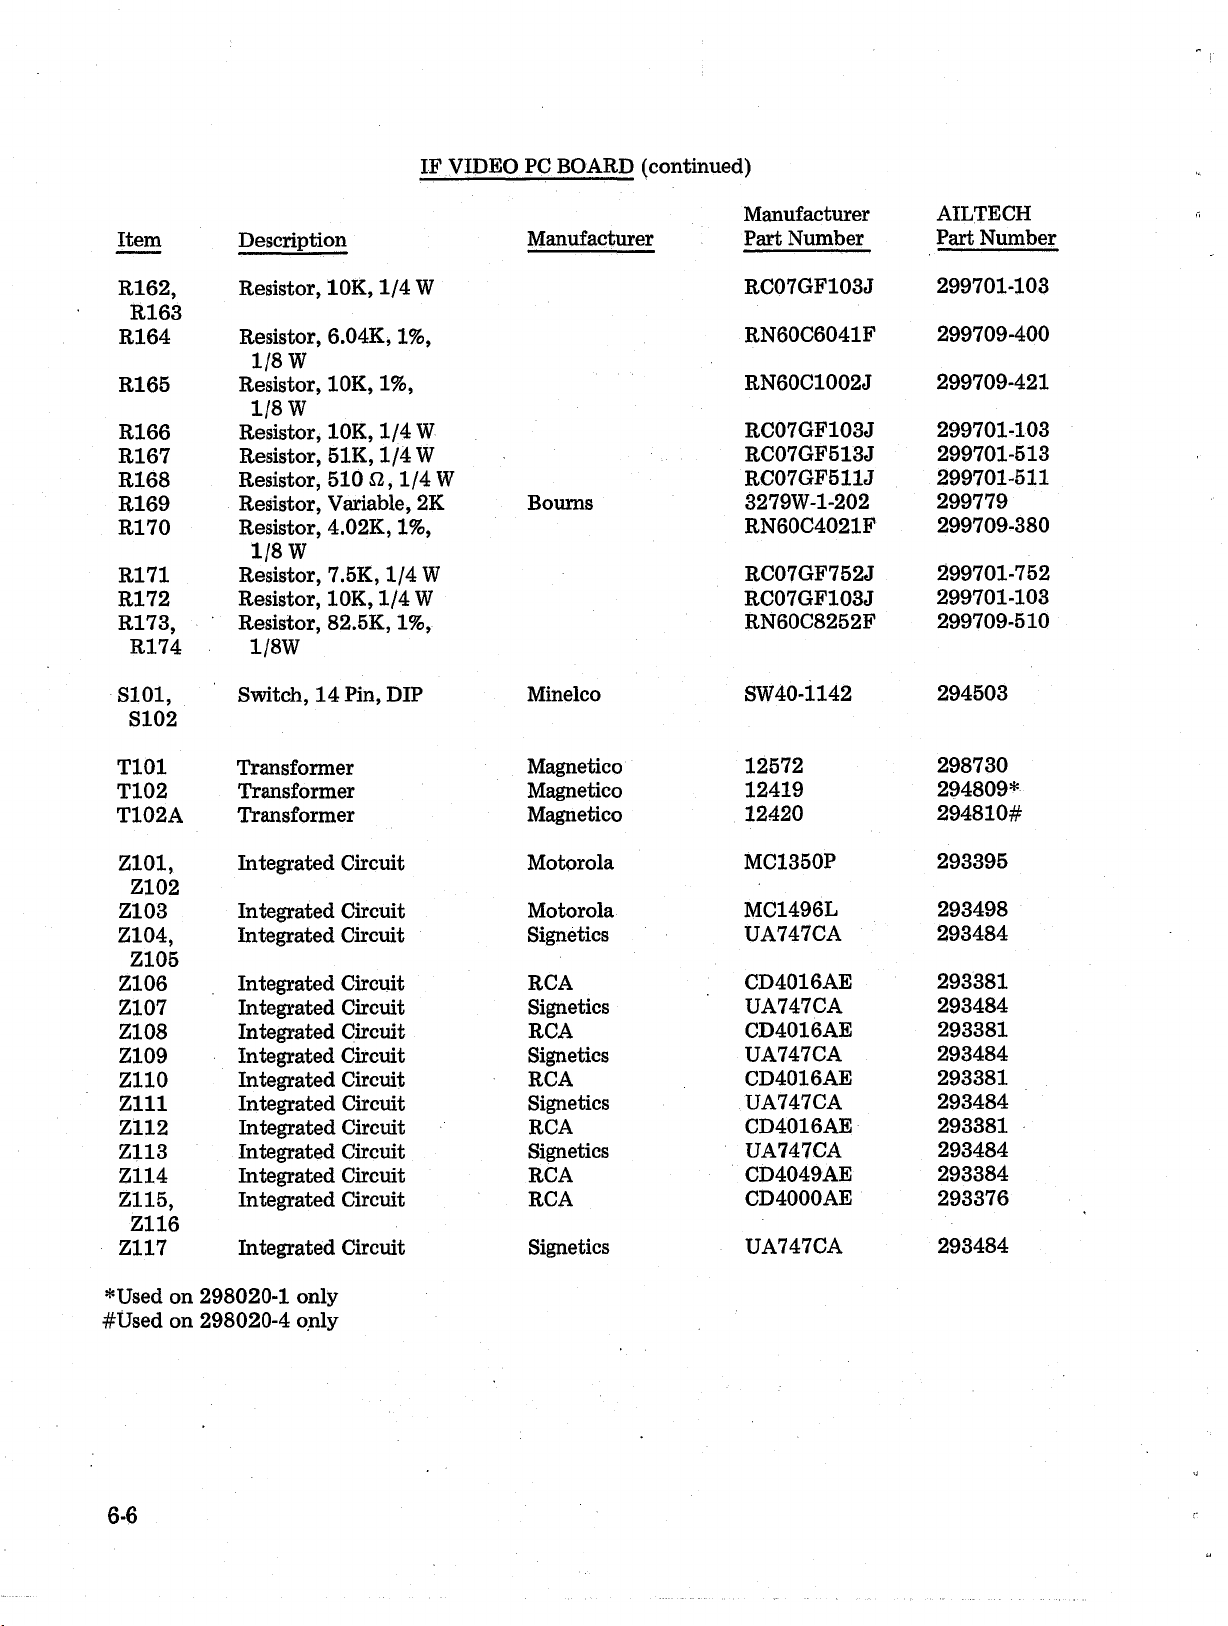
IF VIDEO PC BOARD (continued)
Item
R162, Resistor, 10K, 1/4 W
R163
R164
R165
R166
R167
R168
R169
R170
R171
R172
R173,
R174
S101, Switch, 14 Pin, DIP
S102
T101
T102
T102A
Description
Resistor, 6.04K, 1%,
1/8 W
Resistor, 10K, 1%,
1/8 W
Resistor, 10K, 1/4 W
Resistor, 51K, 1/4 W
Resistor, 510 £2,1/4 W
Resistor, Variable, 2K
Resistor, 4.02K, 1%,
1/8 W
Resistor, 7.5K, 1/4 W
Resistor, 10K, 1/4 W RC07GF103J
Resistor, 82.5K, 1%,
1/8W
Transformer
Transformer Magnético
Transformer Magnético
Manufacturer
Bourns
Minelco
Magnético
Manufacturer
Part Number
RC07GF103J
RN60C6041F 299709-400
RN60C1002J
RC07GF103J
RC07GF513J
RC07GF511J
3279W-1-202 299779
RN60C4021F
RC07GF752J
RN60C8252F
SW40-1142
12572
12419
12420
AILTECH
Part Number
299701-103
299709-421
299701-103
299701-513
299701-511
299709-380
299701-752
299701-103
299709-510
294503
298730
294809*
294810#
Z101,
Z102
Z103
Z104, Integrated Circuit
Z105
Z106
Z107 Integrated Circuit
Z108
Z109
Z110
Z l l l
ZÍ12
Z113
Z114
Z115,
Z116
Z117 Integrated Circuit
sUsed on 298020-1 only
^Used on 298020-4 only
Integrated Circuit
Integrated Circuit
Integrated Circuit
Integrated Circuit
Integrated Circuit
Integrated Circuit
Integrated Circuit
Integrated Circuit
Integrated Circuit
Integrated Circuit
Integrated Circuit
Motorola
Motorola
Signetics
RCA
Signetics
RCA
Signetics
RCA
Signetics
RCA
Signetics
RCA
RCA
Signetics UA747CA
MC1350P
MC1496L 293498
UA747CA
CD4016AE 293381
' UA747CA
CD4016AE 293381
UA747CA
CD4016AE 293381
UA747CA
CD4016AE 293381
UA747CA
CD4049AE
CD4000AE
293395
293484
293484
293484
293484
293484
293384
293376
293484
6-6
Page 100
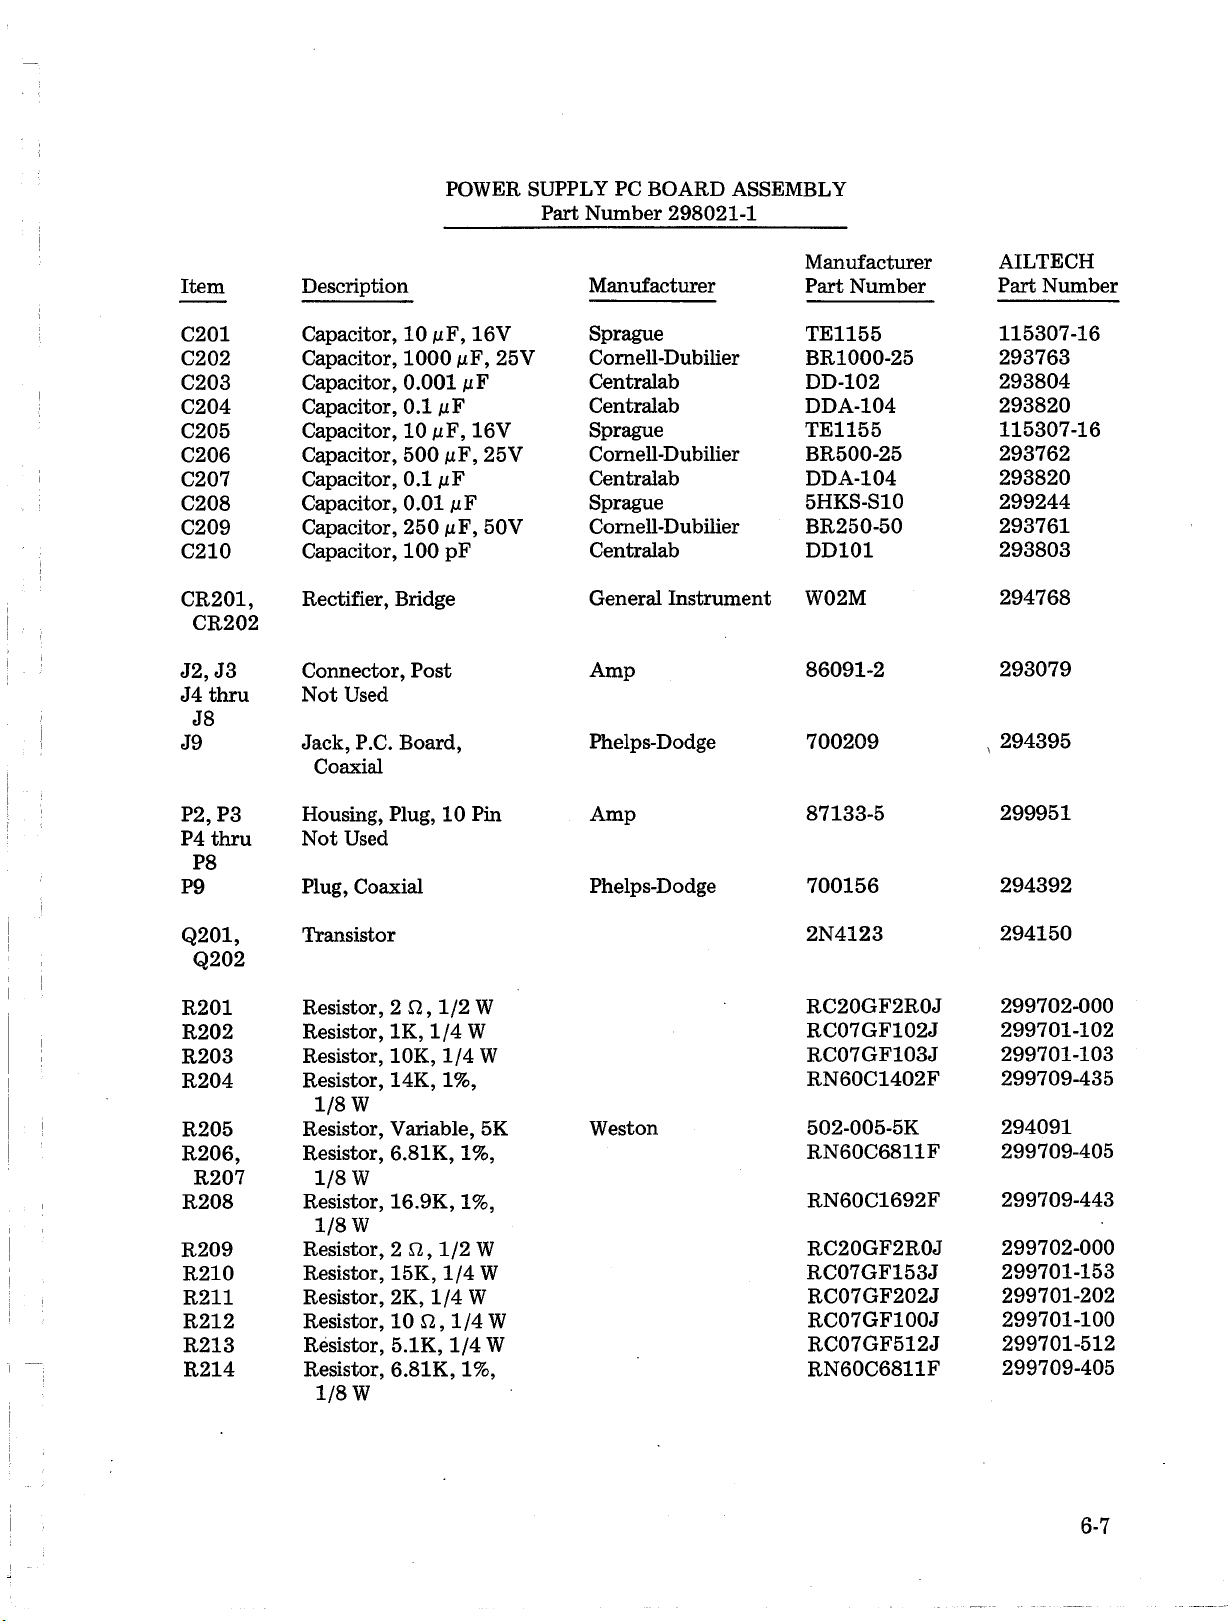
POWER SUPPLY PC BOARD ASSEMBLY
Part Number 298021-1
Item
C201
C202 Capacitor, 1000 /xF, 25V
C203
C204
C205
C206
C207
C208
C209
C210
CR201,
CR202
J2, J3
J4 thru
J8
J9
P2,P3
P4 thru
P8
P9
Description
Capacitor, 10 /uF, 16V
Capacitor, 0.001 nF
Capacitor, 0.1 juF
Capacitor, 10 /xF, 16 V
Capacitor, 500 /xF, 25V
Capacitor, 0.1 juF
Capacitor, 0.01 /xF
Capacitor, 250 nF , 50V
Capacitor, 100 pF
Rectifier, Bridge
Connector, Post
Not Used
Jack, P.C. Board,
Coaxial
Housing, Plug, 10 Pin
Not Used
Plug, Coaxial
Manufacturer
Manufacturer
Sprague
Comell-Dubilier BR1000-25
Centralab
Centralab DDA-104
Sprague
Comell-Dubilier BR500-25
Centralab DDA-104
Sprague
Comell-Dubilier BR250-50
Centralab DD101
General Instrument
Amp
Phelps-Dodge 700209
Amp
Phelps-Dodge 700156
Part Number
TE1155
DD-102
TE1155
5HKS-S10
W02M
86091-2
87133-5
AILTECH
Part Number
115307-16
293763
293804
293820
115307-16
293762
293820
299244
293761
293803
294768
293079
294395
299951
294392
Q201,
Q2 0 2
R201
R202
R203
R204
R205
R206,
R207
R208
R209
R210
R211
R212 Resistor, 10 £2,1/4 W
R213
R214 Resistor, 6.81K, 1%,
Transistor
Resistor, 2 £2,1/2 W
Resistor, IK, 1/4 W
Resistor, 10K, 1/4 W
Resistor, 14K, 1%,
1/8 W
Resistor, Variable, 5K
Resistor, 6.81K, 1%,
1/8 W
Resistor, 16.9K,
1/8 W
Resistor, 2 £2,1/2 W
Resistor, 15K, 1/4 W
Resistor, 2K, 1/4 W
Résistor, 5.IK, 1/4 W
1/8 W
1%,
2N4123
RC20GF2R0J
RC07GF102J
RC07GF103J
RN60C1402F
Weston
502-005-5K
RN60C6811F
RN60C1692F
RC20GF2R0J
RC07GF153J
RC07GF202J
RC07GF100J
RC07GF512J
RN60C6811F
294150
299702-000
299701-102
299701-103
299709-435
294091
299709-405
299709-443
299702-000
299701-153
299701-202
299701-100
299701-512
299709-405
6-7
 Loading...