

Page 1

Progra mme r’s Gui d e
Agilent Technologies EMC Series
Spectrum Analyzers
This guide documents firmware revision A.08.xx
This manual provides documentation for the following instru ments:
E7401A (9 kHz - 1.5 GHz)
E7402A (9 kHz - 3.0 GHz)
E7403A (9 kHz - 6.7 GHz)
E7404A (9 kHz - 13.2 GHz)
E7405A (9 kHz - 26.5 GHz)
Manufa cturing Part Number: E7401-90053
Supersedes: E7401-90028
Printed in USA
December 2001
© Copyright 1999 - 2001 Agilent Technologies, Inc.
Page 2

Notice
The information contained in this document is subject to change without notice.
Agilent Technologies makes no warranty of any kind with regard to this material,
including but not limited to, the implied warranties of merchantability and fitness
for a particular purpose. Agilent Technologies shall not be liable for errors
contained herein or for incidental or consequential damages in connection with the
furnishing, performance, or use of this material.
Safety Information
The following safety symbols are used throughout this manual. Familiarize
yourself with the symbols and their meaning before operating this instrument.
WARNIN G Warning denotes a hazard. It calls attention to a procedure which, if not
correctly performed or adhered to, could result in injury or loss of life. Do not
proceed beyond a warning note until the indicated conditions are fully
understood and met.
CAUTION Caution denotes a hazard. It calls attention to a procedure that, if not correctly
performed or adhered to, could result in damage to or destruction of the
instrument. Do not proceed beyond a caution sign until the indicated conditions are
fully understood and met.
NOTE Note calls out special information for the user’s attention. It provides operational
information or additional instructions of which the user should be aware.
The instruction documentation symbol. The product is marked
with this symbol when it is necessary for the user to refer to the
instructions in the documentation.
This symbol is used to mark the on position of the power line
switch.
This symbol is used to mark the standby position of the power
line switch.
This symbol indicates that the input power required is AC.
2
Page 3

WARNING This is a Safety Class 1 Product (provided with a protective earth ground
incorporated in the power cord). The mains plug shall be inserted only in a
socket outlet provided with a protected earth contact. Any interruption of the
protective conductor inside or outside of the product is likely to make the
product dangerous. Intentional interruption is prohibited.
WARNING No operator serviceable parts inside. Refer servicing to qualified personnel.
To prevent electrical shock do not remove covers.
WARNING If this product is not used as specified, the protection provided by the
equipment could be impaired. This product must be used in a normal
condition (in which all means for protection are intact) only.
CAUTION Always use the three-prong AC power cord supplied with this product. Failure to
ensure adequate grounding may cause product damage.
Warranty
This Agilent Technologies instrument product is warranted against defects in
material and workmanship for a period of three years from date of shipment.
During the warranty period, Agilent Technologies will, at its option, either repair
or replace products which prove to be defective.
For warranty service or repair, this product must be returned to a service facility
designated by Agilent Technologies. Buyer shall prepay shipping charges to
Agilent Technologies and Agilent Technologies shall pay shipping charges to
return the product to Buyer. However, Buyer shall pay all shipping charges, duties,
and taxes for products returned to Agilent Technologies from another country.
Agilent Technologies warrants that its software and firmware designated by
Agilent Technologies for use with an instrument will execute its programming
instructions when properly installed on that instrument. Agilent Technologies does
not warrant that the operation of the instrument, or software, or firmware will be
uninterrupted or error-free.
3
Page 4

LIMITATION OF WARRANTY
The foregoing warranty shall not apply to defects resulting from improper or
inadequate maintenance by Buyer, Buyer-supplied software or interfacing,
unauthorized modification or misuse, operation outside of the environmental
specifications for the product, or improper site preparation or maintenance.
NO OTHER WARRANTY IS EXPRESSED OR IMPLIED. AGILENT
TECHNOLOGIES SPECIFICALLY DISCLAIMS THE IMPLIED
WARRANTIES OF MERCHANTABILITY AND FITNESS FOR A
PARTICULAR PURPOSE.
Should Agilent have a negotiated contract with the User and should any of the
contract terms conflict with these terms, the contract terms shall control.
EXCLUSIVE REMEDIES
THE REMEDIES PROVIDED HEREIN ARE BUYER’S SOLE AND
EXCLUSIVE REMEDIES. AGILENT TECHNOLOGIES SHALL NOT BE
LIABLE FOR ANY DIRECT, INDIRECT, SPECIAL, INCIDENTAL, OR
CONSEQUENTIAL DAMAGES, WHETHER BASED ON CONTRACT, TORT,
OR ANY OTHER LEGAL THEORY.
Where to Find the Latest Information
Documentation is updated periodically. For the latest information about Agilent
Technologies EMC Analyzers, including firmware upgrades and application
information, please visit the following Internet URL:
http://www.agilent.com/find/emc
4
Page 5

Contents
1. Programming Fundamentals
Creating Valid Commands . . . . . . . . . . . . . . . . . . . . . . . . . . . . . . . . . . . . . . . . . . . . . . . . . . 39
Command Notation Syntax . . . . . . . . . . . . . . . . . . . . . . . . . . . . . . . . . . . . . . . . . . . . . . . . . . 40
Special Characters in Commands . . . . . . . . . . . . . . . . . . . . . . . . . . . . . . . . . . . . . . . . . . . . . 41
Parameters in Commands . . . . . . . . . . . . . . . . . . . . . . . . . . . . . . . . . . . . . . . . . . . . . . . . . . . 42
Improving Measurement Speed . . . . . . . . . . . . . . . . . . . . . . . . . . . . . . . . . . . . . . . . . . . . . . 45
Turn off the display updates . . . . . . . . . . . . . . . . . . . . . . . . . . . . . . . . . . . . . . . . . . . . . . . 45
Disable auto alignment . . . . . . . . . . . . . . . . . . . . . . . . . . . . . . . . . . . . . . . . . . . . . . . . . . . 45
Use a fixed IF Gain range . . . . . . . . . . . . . . . . . . . . . . . . . . . . . . . . . . . . . . . . . . . . . . . . . 45
Disable the IF/Video/Sweep output ports . . . . . . . . . . . . . . . . . . . . . . . . . . . . . . . . . . . . . 45
Select phase noise performance . . . . . . . . . . . . . . . . . . . . . . . . . . . . . . . . . . . . . . . . . . . . 46
Use binary data format instead of ASCII . . . . . . . . . . . . . . . . . . . . . . . . . . . . . . . . . . . . . 46
Minimize the number of GPIB transactions. . . . . . . . . . . . . . . . . . . . . . . . . . . . . . . . . . . 46
Avoid unnecessary use of *RST. . . . . . . . . . . . . . . . . . . . . . . . . . . . . . . . . . . . . . . . . . . . 47
Minimize DUT/instrument setup changes. . . . . . . . . . . . . . . . . . . . . . . . . . . . . . . . . . . . . 47
Putting Multiple Commands on the Same Line . . . . . . . . . . . . . . . . . . . . . . . . . . . . . . . . . . 48
SCPI Termination and Separator Syntax . . . . . . . . . . . . . . . . . . . . . . . . . . . . . . . . . . . . . 48
Overview of GPIB (Option A4H) . . . . . . . . . . . . . . . . . . . . . . . . . . . . . . . . . . . . . . . . . . . . . 50
GPIB Instrument Nomenclature . . . . . . . . . . . . . . . . . . . . . . . . . . . . . . . . . . . . . . . . . . . . 50
GPIB Command Statements . . . . . . . . . . . . . . . . . . . . . . . . . . . . . . . . . . . . . . . . . . . . . . . 50
Overview of RS-232 (Option 1AX) . . . . . . . . . . . . . . . . . . . . . . . . . . . . . . . . . . . . . . . . . . . 52
Settings for the Serial Interface . . . . . . . . . . . . . . . . . . . . . . . . . . . . . . . . . . . . . . . . . . . . 52
Handshake and Baud Rate . . . . . . . . . . . . . . . . . . . . . . . . . . . . . . . . . . . . . . . . . . . . . . . . 52
Character Format Parameters . . . . . . . . . . . . . . . . . . . . . . . . . . . . . . . . . . . . . . . . . . . . . . 52
Modem Line Handshaking . . . . . . . . . . . . . . . . . . . . . . . . . . . . . . . . . . . . . . . . . . . . . . . . 53
Data Transfer Errors . . . . . . . . . . . . . . . . . . . . . . . . . . . . . . . . . . . . . . . . . . . . . . . . . . . . . 53
Printer Setup and Operation . . . . . . . . . . . . . . . . . . . . . . . . . . . . . . . . . . . . . . . . . . . . . . . . . 54
Equipment . . . . . . . . . . . . . . . . . . . . . . . . . . . . . . . . . . . . . . . . . . . . . . . . . . . . . . . . . . . . . 54
Interconnection and Setup . . . . . . . . . . . . . . . . . . . . . . . . . . . . . . . . . . . . . . . . . . . . . . . . 54
Testing Printer Operation . . . . . . . . . . . . . . . . . . . . . . . . . . . . . . . . . . . . . . . . . . . . . . . . . 56
2. Status Registers
Use Status Registers to Determine the State of Analyzer Events and Conditions . . . . . . . . 58
What are the Status Registers? . . . . . . . . . . . . . . . . . . . . . . . . . . . . . . . . . . . . . . . . . . . . . 59
How Do You Access the Status Registers? . . . . . . . . . . . . . . . . . . . . . . . . . . . . . . . . . . . 61
Using the Service Request (SRQ) Method . . . . . . . . . . . . . . . . . . . . . . . . . . . . . . . . . . . . 63
Generating a Service Request . . . . . . . . . . . . . . . . . . . . . . . . . . . . . . . . . . . . . . . . . . . . . . 63
Setting and Querying the Status Register . . . . . . . . . . . . . . . . . . . . . . . . . . . . . . . . . . . . . 65
Details of Bits in All Registers . . . . . . . . . . . . . . . . . . . . . . . . . . . . . . . . . . . . . . . . . . . . . 65
Status Byte Register . . . . . . . . . . . . . . . . . . . . . . . . . . . . . . . . . . . . . . . . . . . . . . . . . . . . . 66
Service Request Enable Register . . . . . . . . . . . . . . . . . . . . . . . . . . . . . . . . . . . . . . . . . . . 67
Standard Event Status Register . . . . . . . . . . . . . . . . . . . . . . . . . . . . . . . . . . . . . . . . . . . . . 68
5
Page 6

Contents
Standard Event Status Event Enable Register . . . . . . . . . . . . . . . . . . . . . . . . . . . . . . . . . .70
STATus:OPERation Register . . . . . . . . . . . . . . . . . . . . . . . . . . . . . . . . . . . . . . . . . . . . . .70
STATus:OPERation Condition and Event Enable Registers . . . . . . . . . . . . . . . . . . . . . .73
STATus:QUEStionable Registers . . . . . . . . . . . . . . . . . . . . . . . . . . . . . . . . . . . . . . . . . . .73
STATus:QUEStionable:POWer Register . . . . . . . . . . . . . . . . . . . . . . . . . . . . . . . . . . . . .76
Questionable Status Event Enable Register . . . . . . . . . . . . . . . . . . . . . . . . . . . . . . . . . . . .77
Questionable Status Power Condition and Event Registers . . . . . . . . . . . . . . . . . . . . . . .79
STATus:QUEStionable:FREQuency Register . . . . . . . . . . . . . . . . . . . . . . . . . . . . . . . . .80
Questionable Status Frequency Condition and Event Enable Registers . . . . . . . . . . . . . .82
STATus:QUEStionable:CALibration Register . . . . . . . . . . . . . . . . . . . . . . . . . . . . . . . . .83
STATus:QUEStionable:INTegrity:UNCalibrated Register . . . . . . . . . . . . . . . . . . . . . . .86
Questionable Status Calibration Condition and Event Enable Registers . . . . . . . . . . . . .87
Questionable Status Integrity Uncalibrated Condition and Event Enable Registers . . . . .88
STATus:QUEStionable:INTegrity Register . . . . . . . . . . . . . . . . . . . . . . . . . . . . . . . . . . .89
Questionable Status Integrity Event Condition and Enable Registers . . . . . . . . . . . . . . . .91
3. Programming Examples
List of Programming Examples . . . . . . . . . . . . . . . . . . . . . . . . . . . . . . . . . . . . . . . . . . . . . . .94
Programming Examples System Requirements . . . . . . . . . . . . . . . . . . . . . . . . . . . . . . . . . . .95
C Programming Examples using VTL . . . . . . . . . . . . . . . . . . . . . . . . . . . . . . . . . . . . . . . . . .96
Typical Example Program Contents . . . . . . . . . . . . . . . . . . . . . . . . . . . . . . . . . . . . . . . . .96
Linking to VTL Libraries . . . . . . . . . . . . . . . . . . . . . . . . . . . . . . . . . . . . . . . . . . . . . . . . .97
Compiling and Linking a VTL Program . . . . . . . . . . . . . . . . . . . . . . . . . . . . . . . . . . . . . .97
Example Program . . . . . . . . . . . . . . . . . . . . . . . . . . . . . . . . . . . . . . . . . . . . . . . . . . . . . . .99
Including the VISA Declarations File . . . . . . . . . . . . . . . . . . . . . . . . . . . . . . . . . . . . . . . .99
Opening a Session . . . . . . . . . . . . . . . . . . . . . . . . . . . . . . . . . . . . . . . . . . . . . . . . . . . . . .100
Device Sessions . . . . . . . . . . . . . . . . . . . . . . . . . . . . . . . . . . . . . . . . . . . . . . . . . . . . . . . .100
Addressing a Session . . . . . . . . . . . . . . . . . . . . . . . . . . . . . . . . . . . . . . . . . . . . . . . . . . . .102
Closing a Session . . . . . . . . . . . . . . . . . . . . . . . . . . . . . . . . . . . . . . . . . . . . . . . . . . . . . . .103
Using Marker Peak Search and Peak Excursion . . . . . . . . . . . . . . . . . . . . . . . . . . . . . . . . .104
Example: . . . . . . . . . . . . . . . . . . . . . . . . . . . . . . . . . . . . . . . . . . . . . . . . . . . . . . . . . . . . .104
Using Marker Delta Mode and Marker Minimum Search . . . . . . . . . . . . . . . . . . . . . . . . . .108
Performing Internal Self-alignment . . . . . . . . . . . . . . . . . . . . . . . . . . . . . . . . . . . . . . . . . . .112
Reading Trace Data using ASCII Format (GPIB) . . . . . . . . . . . . . . . . . . . . . . . . . . . . . . . .116
Reading Trace Data Using 32-bit
Real Format (GPIB) . . . . . . . . . . . . . . . . . . . . . . . . . . . . . . . . . . . . . . . . . . . . . . . . . . . . . . .120
Reading Trace Data Using ASCII Format (RS-232) . . . . . . . . . . . . . . . . . . . . . . . . . . . . . .125
Reading Trace Data Using 32-bit Real Format (RS-232) . . . . . . . . . . . . . . . . . . . . . . . . . .130
Using Limit Lines . . . . . . . . . . . . . . . . . . . . . . . . . . . . . . . . . . . . . . . . . . . . . . . . . . . . . . . .135
Measuring Noise . . . . . . . . . . . . . . . . . . . . . . . . . . . . . . . . . . . . . . . . . . . . . . . . . . . . . . . . .141
Entering Amplitude Correction Data . . . . . . . . . . . . . . . . . . . . . . . . . . . . . . . . . . . . . . . . . .145
Status Register–Determine When a Measurement is Done . . . . . . . . . . . . . . . . . . . . . . . . .149
6
Page 7

Contents
Determine if an Error has Occurred . . . . . . . . . . . . . . . . . . . . . . . . . . . . . . . . . . . . . . . . . . 155
Measuring Harmonic Distortion (GPIB) . . . . . . . . . . . . . . . . . . . . . . . . . . . . . . . . . . . . . . 161
Measuring Harmonic Distortion (RS-232) . . . . . . . . . . . . . . . . . . . . . . . . . . . . . . . . . . . . . 169
Making Faster Measurements (multiple measurements) . . . . . . . . . . . . . . . . . . . . . . . . . . 177
4. Programming Command Cross-References
Functional Index to SCPI Subsection . . . . . . . . . . . . . . . . . . . . . . . . . . . . . . . . . . . . . . . . . 186
5. Language Reference
SCPI Sections and Subsections . . . . . . . . . . . . . . . . . . . . . . . . . . . . . . . . . . . . . . . . . . . . . . 191
IEEE Common Commands . . . . . . . . . . . . . . . . . . . . . . . . . . . . . . . . . . . . . . . . . . . . . . . . . 193
Calibration Query . . . . . . . . . . . . . . . . . . . . . . . . . . . . . . . . . . . . . . . . . . . . . . . . . . . . . . 193
Clear Status . . . . . . . . . . . . . . . . . . . . . . . . . . . . . . . . . . . . . . . . . . . . . . . . . . . . . . . . . . . 193
Standard Event Status Enable . . . . . . . . . . . . . . . . . . . . . . . . . . . . . . . . . . . . . . . . . . . . . 193
Standard Event Status Register Query . . . . . . . . . . . . . . . . . . . . . . . . . . . . . . . . . . . . . . 194
Identification Query . . . . . . . . . . . . . . . . . . . . . . . . . . . . . . . . . . . . . . . . . . . . . . . . . . . . 194
Instrument State Query . . . . . . . . . . . . . . . . . . . . . . . . . . . . . . . . . . . . . . . . . . . . . . . . . . 194
Operation Complete . . . . . . . . . . . . . . . . . . . . . . . . . . . . . . . . . . . . . . . . . . . . . . . . . . . . 195
Query Instrument Options . . . . . . . . . . . . . . . . . . . . . . . . . . . . . . . . . . . . . . . . . . . . . . . 195
Recall . . . . . . . . . . . . . . . . . . . . . . . . . . . . . . . . . . . . . . . . . . . . . . . . . . . . . . . . . . . . . . . 195
Reset . . . . . . . . . . . . . . . . . . . . . . . . . . . . . . . . . . . . . . . . . . . . . . . . . . . . . . . . . . . . . . . . 196
Save . . . . . . . . . . . . . . . . . . . . . . . . . . . . . . . . . . . . . . . . . . . . . . . . . . . . . . . . . . . . . . . . . 196
Service Request Enable . . . . . . . . . . . . . . . . . . . . . . . . . . . . . . . . . . . . . . . . . . . . . . . . . 196
Read Status Byte Query . . . . . . . . . . . . . . . . . . . . . . . . . . . . . . . . . . . . . . . . . . . . . . . . . 196
Trigger . . . . . . . . . . . . . . . . . . . . . . . . . . . . . . . . . . . . . . . . . . . . . . . . . . . . . . . . . . . . . . 197
Self Test Query . . . . . . . . . . . . . . . . . . . . . . . . . . . . . . . . . . . . . . . . . . . . . . . . . . . . . . . . 197
Wait-to-Continue . . . . . . . . . . . . . . . . . . . . . . . . . . . . . . . . . . . . . . . . . . . . . . . . . . . . . . 197
ABORt Subsystem . . . . . . . . . . . . . . . . . . . . . . . . . . . . . . . . . . . . . . . . . . . . . . . . . . . . . . . 198
Abort . . . . . . . . . . . . . . . . . . . . . . . . . . . . . . . . . . . . . . . . . . . . . . . . . . . . . . . . . . . . . . . . 198
CALCulate Subsystem . . . . . . . . . . . . . . . . . . . . . . . . . . . . . . . . . . . . . . . . . . . . . . . . . . . . 199
NdBpoints . . . . . . . . . . . . . . . . . . . . . . . . . . . . . . . . . . . . . . . . . . . . . . . . . . . . . . . . . . . . 199
NdBresults . . . . . . . . . . . . . . . . . . . . . . . . . . . . . . . . . . . . . . . . . . . . . . . . . . . . . . . . . . . 199
NdBstate . . . . . . . . . . . . . . . . . . . . . . . . . . . . . . . . . . . . . . . . . . . . . . . . . . . . . . . . . . . . . 200
Calculate Correction at Frequency . . . . . . . . . . . . . . . . . . . . . . . . . . . . . . . . . . . . . . . . . 200
Test Current Trace Data Against all Limit Lines . . . . . . . . . . . . . . . . . . . . . . . . . . . . . . 200
CALCulate:EMI:SLISt Subsection . . . . . . . . . . . . . . . . . . . . . . . . . . . . . . . . . . . . . . . . . . . 201
Add Measure to List . . . . . . . . . . . . . . . . . . . . . . . . . . . . . . . . . . . . . . . . . . . . . . . . . . . . 201
Add Marker to List . . . . . . . . . . . . . . . . . . . . . . . . . . . . . . . . . . . . . . . . . . . . . . . . . . . . . 201
Append Signal Data to List . . . . . . . . . . . . . . . . . . . . . . . . . . . . . . . . . . . . . . . . . . . . . . . 201
Clear Marks . . . . . . . . . . . . . . . . . . . . . . . . . . . . . . . . . . . . . . . . . . . . . . . . . . . . . . . . . . . 204
Set Comment for Signals . . . . . . . . . . . . . . . . . . . . . . . . . . . . . . . . . . . . . . . . . . . . . . . . 205
Set Comment for Current Signal . . . . . . . . . . . . . . . . . . . . . . . . . . . . . . . . . . . . . . . . . . 205
7
Page 8

Contents
Set Comment for Marked Signals . . . . . . . . . . . . . . . . . . . . . . . . . . . . . . . . . . . . . . . . . .205
Delete Signal . . . . . . . . . . . . . . . . . . . . . . . . . . . . . . . . . . . . . . . . . . . . . . . . . . . . . . . . . .205
Turn Signal List On or Off . . . . . . . . . . . . . . . . . . . . . . . . . . . . . . . . . . . . . . . . . . . . . . .206
Retrieve Signal as a String . . . . . . . . . . . . . . . . . . . . . . . . . . . . . . . . . . . . . . . . . . . . . . . .206
Retrieve Signals in List . . . . . . . . . . . . . . . . . . . . . . . . . . . . . . . . . . . . . . . . . . . . . . . . . .206
Mark Selected Signals . . . . . . . . . . . . . . . . . . . . . . . . . . . . . . . . . . . . . . . . . . . . . . . . . . .206
Position Cursor to Signal List . . . . . . . . . . . . . . . . . . . . . . . . . . . . . . . . . . . . . . . . . . . . .207
Specify Sort Key . . . . . . . . . . . . . . . . . . . . . . . . . . . . . . . . . . . . . . . . . . . . . . . . . . . . . . .207
Specify Signal List Display Parameters . . . . . . . . . . . . . . . . . . . . . . . . . . . . . . . . . . . . . .208
CALCulate:LLINe Subsection . . . . . . . . . . . . . . . . . . . . . . . . . . . . . . . . . . . . . . . . . . . . . .209
Delete All Correction Sets in Memory . . . . . . . . . . . . . . . . . . . . . . . . . . . . . . . . . . . . . .209
Control Limit Line Amplitude Interpolation . . . . . . . . . . . . . . . . . . . . . . . . . . . . . . . . . .209
Set Fixed or Relative Limit Lines . . . . . . . . . . . . . . . . . . . . . . . . . . . . . . . . . . . . . . . . . .209
Set Limit Line X-axis Units . . . . . . . . . . . . . . . . . . . . . . . . . . . . . . . . . . . . . . . . . . . . . . .210
Control Limit Line Frequency Interpolation . . . . . . . . . . . . . . . . . . . . . . . . . . . . . . . . . .211
Define Limit Line Values . . . . . . . . . . . . . . . . . . . . . . . . . . . . . . . . . . . . . . . . . . . . . . . .211
Merge Additional Values into the Existing Limit Line . . . . . . . . . . . . . . . . . . . . . . . . . .213
Delete Limit Line . . . . . . . . . . . . . . . . . . . . . . . . . . . . . . . . . . . . . . . . . . . . . . . . . . . . . . .213
Display the Limit Line . . . . . . . . . . . . . . . . . . . . . . . . . . . . . . . . . . . . . . . . . . . . . . . . . . .213
Test the Data Against the Limit Line . . . . . . . . . . . . . . . . . . . . . . . . . . . . . . . . . . . . . . . .214
Set the Margin Size . . . . . . . . . . . . . . . . . . . . . . . . . . . . . . . . . . . . . . . . . . . . . . . . . . . . .214
Display the Limit Margin . . . . . . . . . . . . . . . . . . . . . . . . . . . . . . . . . . . . . . . . . . . . . . . .214
Control Limit Line Testing . . . . . . . . . . . . . . . . . . . . . . . . . . . . . . . . . . . . . . . . . . . . . . .215
Select the Type of Limit Line . . . . . . . . . . . . . . . . . . . . . . . . . . . . . . . . . . . . . . . . . . . . .215
CALCulate:MARKer Subsection . . . . . . . . . . . . . . . . . . . . . . . . . . . . . . . . . . . . . . . . . . . .216
Markers All Off on All Traces . . . . . . . . . . . . . . . . . . . . . . . . . . . . . . . . . . . . . . . . . . . . .216
Continuous Peaking Marker Function . . . . . . . . . . . . . . . . . . . . . . . . . . . . . . . . . . . . . . .216
Frequency Counter Marker Resolution . . . . . . . . . . . . . . . . . . . . . . . . . . . . . . . . . . . . . .216
Frequency Counter Marker Automatic Resolution . . . . . . . . . . . . . . . . . . . . . . . . . . . . .217
Frequency Counter Marker . . . . . . . . . . . . . . . . . . . . . . . . . . . . . . . . . . . . . . . . . . . . . . .217
Frequency Counter Marker Query . . . . . . . . . . . . . . . . . . . . . . . . . . . . . . . . . . . . . . . . . .217
Marker Function . . . . . . . . . . . . . . . . . . . . . . . . . . . . . . . . . . . . . . . . . . . . . . . . . . . . . . .217
Marker Peak (Maximum) Search . . . . . . . . . . . . . . . . . . . . . . . . . . . . . . . . . . . . . . . . . . .218
Marker Peak (Maximum) Left Search . . . . . . . . . . . . . . . . . . . . . . . . . . . . . . . . . . . . . . .218
Marker Next Peak (Maximum) Search . . . . . . . . . . . . . . . . . . . . . . . . . . . . . . . . . . . . . .218
Marker Peak (Maximum) Right Search . . . . . . . . . . . . . . . . . . . . . . . . . . . . . . . . . . . . . .219
Marker Peak (Minimum) Search . . . . . . . . . . . . . . . . . . . . . . . . . . . . . . . . . . . . . . . . . . .219
Marker Mode . . . . . . . . . . . . . . . . . . . . . . . . . . . . . . . . . . . . . . . . . . . . . . . . . . . . . . . . . .219
Define Peak Excursion . . . . . . . . . . . . . . . . . . . . . . . . . . . . . . . . . . . . . . . . . . . . . . . . . . .220
Define Peak Search . . . . . . . . . . . . . . . . . . . . . . . . . . . . . . . . . . . . . . . . . . . . . . . . . . . . .220
Define Peak Threshold . . . . . . . . . . . . . . . . . . . . . . . . . . . . . . . . . . . . . . . . . . . . . . . . . . .221
Peak to Peak Delta Markers . . . . . . . . . . . . . . . . . . . . . . . . . . . . . . . . . . . . . . . . . . . . . . .221
8
Page 9

Contents
Set Center Frequency to the Marker Value . . . . . . . . . . . . . . . . . . . . . . . . . . . . . . . . . . 221
Set Reference Level to the Marker Value . . . . . . . . . . . . . . . . . . . . . . . . . . . . . . . . . . . . 221
Set Span to the Marker Value . . . . . . . . . . . . . . . . . . . . . . . . . . . . . . . . . . . . . . . . . . . . . 222
Set Start Frequency to the Marker Value . . . . . . . . . . . . . . . . . . . . . . . . . . . . . . . . . . . . 222
Set Center Frequency Step Size to the Marker Value . . . . . . . . . . . . . . . . . . . . . . . . . . 222
Set Stop Frequency to the Marker Value . . . . . . . . . . . . . . . . . . . . . . . . . . . . . . . . . . . . 222
Marker On/Off . . . . . . . . . . . . . . . . . . . . . . . . . . . . . . . . . . . . . . . . . . . . . . . . . . . . . . . . 222
Marker Table On/Off . . . . . . . . . . . . . . . . . . . . . . . . . . . . . . . . . . . . . . . . . . . . . . . . . . . 223
Marker to Trace . . . . . . . . . . . . . . . . . . . . . . . . . . . . . . . . . . . . . . . . . . . . . . . . . . . . . . . 223
Marker to Trace Auto . . . . . . . . . . . . . . . . . . . . . . . . . . . . . . . . . . . . . . . . . . . . . . . . . . . 223
Continuous Signal Tracking Function . . . . . . . . . . . . . . . . . . . . . . . . . . . . . . . . . . . . . . 223
Marker X Value . . . . . . . . . . . . . . . . . . . . . . . . . . . . . . . . . . . . . . . . . . . . . . . . . . . . . . . 224
Span Markers Center Frequency X Value . . . . . . . . . . . . . . . . . . . . . . . . . . . . . . . . . . . 224
Marker X Position . . . . . . . . . . . . . . . . . . . . . . . . . . . . . . . . . . . . . . . . . . . . . . . . . . . . . . 224
Span Markers Center Frequency X Position . . . . . . . . . . . . . . . . . . . . . . . . . . . . . . . . . . 225
Span Markers Span X Position . . . . . . . . . . . . . . . . . . . . . . . . . . . . . . . . . . . . . . . . . . . . 225
Delta Pair Markers Start Frequency X Position . . . . . . . . . . . . . . . . . . . . . . . . . . . . . . . 225
Delta Pair Markers Stop Frequency X Position . . . . . . . . . . . . . . . . . . . . . . . . . . . . . . . 226
Marker X-Axis Readout . . . . . . . . . . . . . . . . . . . . . . . . . . . . . . . . . . . . . . . . . . . . . . . . . 226
Span Markers Span X Value . . . . . . . . . . . . . . . . . . . . . . . . . . . . . . . . . . . . . . . . . . . . . . 226
Delta Pair Markers Start Frequency X Value . . . . . . . . . . . . . . . . . . . . . . . . . . . . . . . . . 227
Delta Pair Markers Stop Frequency X Value . . . . . . . . . . . . . . . . . . . . . . . . . . . . . . . . . 227
Marker Read Y Value . . . . . . . . . . . . . . . . . . . . . . . . . . . . . . . . . . . . . . . . . . . . . . . . . . . 227
CALCulate:NTData Subsection . . . . . . . . . . . . . . . . . . . . . . . . . . . . . . . . . . . . . . . . . . . . . 228
Normalize the Trace Data . . . . . . . . . . . . . . . . . . . . . . . . . . . . . . . . . . . . . . . . . . . . . . . . 228
CALibration Subsystem . . . . . . . . . . . . . . . . . . . . . . . . . . . . . . . . . . . . . . . . . . . . . . . . . . . 229
Align All Instrument Assemblies . . . . . . . . . . . . . . . . . . . . . . . . . . . . . . . . . . . . . . . . . . 229
Set Auto Align Mode All or Not RF . . . . . . . . . . . . . . . . . . . . . . . . . . . . . . . . . . . . . . . . 229
Automatic Alignment . . . . . . . . . . . . . . . . . . . . . . . . . . . . . . . . . . . . . . . . . . . . . . . . . . . 230
Return to the Default Alignment Data . . . . . . . . . . . . . . . . . . . . . . . . . . . . . . . . . . . . . . 230
Align FM Demodulation . . . . . . . . . . . . . . . . . . . . . . . . . . . . . . . . . . . . . . . . . . . . . . . . . 230
Query the Internal or External Frequency Reference . . . . . . . . . . . . . . . . . . . . . . . . . . . 230
Coarse Adjust the Frequency Reference . . . . . . . . . . . . . . . . . . . . . . . . . . . . . . . . . . . . . 231
Fine Adjust the Frequency Reference . . . . . . . . . . . . . . . . . . . . . . . . . . . . . . . . . . . . . . . 231
Select the Frequency Corrections . . . . . . . . . . . . . . . . . . . . . . . . . . . . . . . . . . . . . . . . . . 231
Align the RF Circuitry . . . . . . . . . . . . . . . . . . . . . . . . . . . . . . . . . . . . . . . . . . . . . . . . . . 231
Select the Source State for Calibration . . . . . . . . . . . . . . . . . . . . . . . . . . . . . . . . . . . . . . 232
Calibrate the Tracking Generator . . . . . . . . . . . . . . . . . . . . . . . . . . . . . . . . . . . . . . . . . . 232
COUPle Subsystem . . . . . . . . . . . . . . . . . . . . . . . . . . . . . . . . . . . . . . . . . . . . . . . . . . . . . . . 233
COUPle the Function to Other Settings . . . . . . . . . . . . . . . . . . . . . . . . . . . . . . . . . . . . . 233
DISPlay Subsystem . . . . . . . . . . . . . . . . . . . . . . . . . . . . . . . . . . . . . . . . . . . . . . . . . . . . . . . 235
Display Viewing Angle . . . . . . . . . . . . . . . . . . . . . . . . . . . . . . . . . . . . . . . . . . . . . . . . . 235
9
Page 10

Contents
Date and Time Display Format . . . . . . . . . . . . . . . . . . . . . . . . . . . . . . . . . . . . . . . . . . . .235
Date and Time Display . . . . . . . . . . . . . . . . . . . . . . . . . . . . . . . . . . . . . . . . . . . . . . . . . .235
Display Annotation Title Data . . . . . . . . . . . . . . . . . . . . . . . . . . . . . . . . . . . . . . . . . . . . .236
Turn the Entire Display On/Off . . . . . . . . . . . . . . . . . . . . . . . . . . . . . . . . . . . . . . . . . . . .236
Turn the Full Screen Display On/Off . . . . . . . . . . . . . . . . . . . . . . . . . . . . . . . . . . . . . . .236
Window Annotation . . . . . . . . . . . . . . . . . . . . . . . . . . . . . . . . . . . . . . . . . . . . . . . . . . . . .237
Trace Graticule Display . . . . . . . . . . . . . . . . . . . . . . . . . . . . . . . . . . . . . . . . . . . . . . . . . .237
Trace X-Axis Scale Offset . . . . . . . . . . . . . . . . . . . . . . . . . . . . . . . . . . . . . . . . . . . . . . . .237
Display Line Amplitude . . . . . . . . . . . . . . . . . . . . . . . . . . . . . . . . . . . . . . . . . . . . . . . . . .238
Display Line On/Off . . . . . . . . . . . . . . . . . . . . . . . . . . . . . . . . . . . . . . . . . . . . . . . . . . . .238
IF Gain Auto/Reference Level Auto Ranging . . . . . . . . . . . . . . . . . . . . . . . . . . . . . . . . .238
Normalized Reference Level . . . . . . . . . . . . . . . . . . . . . . . . . . . . . . . . . . . . . . . . . . . . . .239
Normalized Reference Level Position . . . . . . . . . . . . . . . . . . . . . . . . . . . . . . . . . . . . . . .239
Trace Y-Axis Amplitude Scaling . . . . . . . . . . . . . . . . . . . . . . . . . . . . . . . . . . . . . . . . . .240
Trace Y-Axis Frequency Scaling . . . . . . . . . . . . . . . . . . . . . . . . . . . . . . . . . . . . . . . . . . .240
Trace Y-Axis Reference Level . . . . . . . . . . . . . . . . . . . . . . . . . . . . . . . . . . . . . . . . . . . .240
Trace Y-Axis Reference Level Offset . . . . . . . . . . . . . . . . . . . . . . . . . . . . . . . . . . . . . . .241
Vertical Axis Scaling . . . . . . . . . . . . . . . . . . . . . . . . . . . . . . . . . . . . . . . . . . . . . . . . . . . .242
FORMat Subsystem . . . . . . . . . . . . . . . . . . . . . . . . . . . . . . . . . . . . . . . . . . . . . . . . . . . . . . .243
Byte Order . . . . . . . . . . . . . . . . . . . . . . . . . . . . . . . . . . . . . . . . . . . . . . . . . . . . . . . . . . . .243
Numeric Data format . . . . . . . . . . . . . . . . . . . . . . . . . . . . . . . . . . . . . . . . . . . . . . . . . . . .243
HCOPy Subsystem . . . . . . . . . . . . . . . . . . . . . . . . . . . . . . . . . . . . . . . . . . . . . . . . . . . . . . .245
Abort the Print . . . . . . . . . . . . . . . . . . . . . . . . . . . . . . . . . . . . . . . . . . . . . . . . . . . . . . . . .245
Printer Type . . . . . . . . . . . . . . . . . . . . . . . . . . . . . . . . . . . . . . . . . . . . . . . . . . . . . . . . . . .245
Select Report Content . . . . . . . . . . . . . . . . . . . . . . . . . . . . . . . . . . . . . . . . . . . . . . . . . . .245
Print Report . . . . . . . . . . . . . . . . . . . . . . . . . . . . . . . . . . . . . . . . . . . . . . . . . . . . . . . . . . .245
Select a Signal List to Include in a Report . . . . . . . . . . . . . . . . . . . . . . . . . . . . . . . . . . . .246
Select a Signal List to Include in a Report (Delta) . . . . . . . . . . . . . . . . . . . . . . . . . . . . .246
Color Hard Copy . . . . . . . . . . . . . . . . . . . . . . . . . . . . . . . . . . . . . . . . . . . . . . . . . . . . . . .246
Print a Hard Copy . . . . . . . . . . . . . . . . . . . . . . . . . . . . . . . . . . . . . . . . . . . . . . . . . . . . . .247
Form Feed the Print Item . . . . . . . . . . . . . . . . . . . . . . . . . . . . . . . . . . . . . . . . . . . . . . . . .247
Page Orientation . . . . . . . . . . . . . . . . . . . . . . . . . . . . . . . . . . . . . . . . . . . . . . . . . . . . . . .247
Number of Items Printed on a Page . . . . . . . . . . . . . . . . . . . . . . . . . . . . . . . . . . . . . . . . .247
Printed Page Size . . . . . . . . . . . . . . . . . . . . . . . . . . . . . . . . . . . . . . . . . . . . . . . . . . . . . . .248
Select Report Type . . . . . . . . . . . . . . . . . . . . . . . . . . . . . . . . . . . . . . . . . . . . . . . . . . . . . .248
INITiate Subsystem . . . . . . . . . . . . . . . . . . . . . . . . . . . . . . . . . . . . . . . . . . . . . . . . . . . . . . .249
Continuous or Single Measurements . . . . . . . . . . . . . . . . . . . . . . . . . . . . . . . . . . . . . . . .249
Take New Data Acquisitions . . . . . . . . . . . . . . . . . . . . . . . . . . . . . . . . . . . . . . . . . . . . . .250
Abort Measurement . . . . . . . . . . . . . . . . . . . . . . . . . . . . . . . . . . . . . . . . . . . . . . . . . . . . .250
Pause the Measurement . . . . . . . . . . . . . . . . . . . . . . . . . . . . . . . . . . . . . . . . . . . . . . . . . .250
Restart the Measurement . . . . . . . . . . . . . . . . . . . . . . . . . . . . . . . . . . . . . . . . . . . . . . . . .251
Resume the Measurement . . . . . . . . . . . . . . . . . . . . . . . . . . . . . . . . . . . . . . . . . . . . . . . .251
10
Page 11

Contents
INPut Subsystem . . . . . . . . . . . . . . . . . . . . . . . . . . . . . . . . . . . . . . . . . . . . . . . . . . . . . . . . . 252
Input Port Coupling . . . . . . . . . . . . . . . . . . . . . . . . . . . . . . . . . . . . . . . . . . . . . . . . . . . . 252
Clear the Input Overload . . . . . . . . . . . . . . . . . . . . . . . . . . . . . . . . . . . . . . . . . . . . . . . . . 253
MEASure Group of Commands . . . . . . . . . . . . . . . . . . . . . . . . . . . . . . . . . . . . . . . . . . . . . 254
Configure Commands . . . . . . . . . . . . . . . . . . . . . . . . . . . . . . . . . . . . . . . . . . . . . . . . . . . 254
Fetch Commands . . . . . . . . . . . . . . . . . . . . . . . . . . . . . . . . . . . . . . . . . . . . . . . . . . . . . . 255
Measure Commands . . . . . . . . . . . . . . . . . . . . . . . . . . . . . . . . . . . . . . . . . . . . . . . . . . . . 255
Read Commands . . . . . . . . . . . . . . . . . . . . . . . . . . . . . . . . . . . . . . . . . . . . . . . . . . . . . . . 256
Get Measurement Results . . . . . . . . . . . . . . . . . . . . . . . . . . . . . . . . . . . . . . . . . . . . . . . . 257
Read Command . . . . . . . . . . . . . . . . . . . . . . . . . . . . . . . . . . . . . . . . . . . . . . . . . . . . . . . . 257
Configure for Measuring Frequency . . . . . . . . . . . . . . . . . . . . . . . . . . . . . . . . . . . . . . . . 257
Measure at Marker . . . . . . . . . . . . . . . . . . . . . . . . . . . . . . . . . . . . . . . . . . . . . . . . . . . . . 258
Measure at Marker and Add to List . . . . . . . . . . . . . . . . . . . . . . . . . . . . . . . . . . . . . . . . 258
Setting Max/Min On or Off . . . . . . . . . . . . . . . . . . . . . . . . . . . . . . . . . . . . . . . . . . . . . . 258
Max/Min View ->Max . . . . . . . . . . . . . . . . . . . . . . . . . . . . . . . . . . . . . . . . . . . . . . . . . . 258
Measure Peaks . . . . . . . . . . . . . . . . . . . . . . . . . . . . . . . . . . . . . . . . . . . . . . . . . . . . . . . . 259
Remeasure Current Signal . . . . . . . . . . . . . . . . . . . . . . . . . . . . . . . . . . . . . . . . . . . . . . . 259
MMEMory Subsystem . . . . . . . . . . . . . . . . . . . . . . . . . . . . . . . . . . . . . . . . . . . . . . . . . . . . 260
Catalog the Selected Memory Location . . . . . . . . . . . . . . . . . . . . . . . . . . . . . . . . . . . . . 260
Copy a File . . . . . . . . . . . . . . . . . . . . . . . . . . . . . . . . . . . . . . . . . . . . . . . . . . . . . . . . . . . 260
Move Data to File . . . . . . . . . . . . . . . . . . . . . . . . . . . . . . . . . . . . . . . . . . . . . . . . . . . . . . 261
Delete a File . . . . . . . . . . . . . . . . . . . . . . . . . . . . . . . . . . . . . . . . . . . . . . . . . . . . . . . . . . 261
Load a Corrections Table from a File . . . . . . . . . . . . . . . . . . . . . . . . . . . . . . . . . . . . . . . 261
Load a Limit Line from Memory to the Instrument . . . . . . . . . . . . . . . . . . . . . . . . . . . . 261
Load an Instrument State from a File . . . . . . . . . . . . . . . . . . . . . . . . . . . . . . . . . . . . . . . 262
Load a Trace From a File to the Instrument . . . . . . . . . . . . . . . . . . . . . . . . . . . . . . . . . . 262
Make a Directory . . . . . . . . . . . . . . . . . . . . . . . . . . . . . . . . . . . . . . . . . . . . . . . . . . . . . . 263
Store (Load/Save) a Signal List . . . . . . . . . . . . . . . . . . . . . . . . . . . . . . . . . . . . . . . . . . . 263
Delete a Directory . . . . . . . . . . . . . . . . . . . . . . . . . . . . . . . . . . . . . . . . . . . . . . . . . . . . . . 264
Store a Corrections Table to a File . . . . . . . . . . . . . . . . . . . . . . . . . . . . . . . . . . . . . . . . . 264
Store a Limit Line in a File . . . . . . . . . . . . . . . . . . . . . . . . . . . . . . . . . . . . . . . . . . . . . . . 265
Store Measurement Results in a File . . . . . . . . . . . . . . . . . . . . . . . . . . . . . . . . . . . . . . . 265
Store a Screen Image in a Graphic File . . . . . . . . . . . . . . . . . . . . . . . . . . . . . . . . . . . . . 265
Store an Instrument State in a File . . . . . . . . . . . . . . . . . . . . . . . . . . . . . . . . . . . . . . . . . 265
Store a Trace in a File . . . . . . . . . . . . . . . . . . . . . . . . . . . . . . . . . . . . . . . . . . . . . . . . . . . 266
OUTPut Subsystem . . . . . . . . . . . . . . . . . . . . . . . . . . . . . . . . . . . . . . . . . . . . . . . . . . . . . . . 267
Turn Output On/Off . . . . . . . . . . . . . . . . . . . . . . . . . . . . . . . . . . . . . . . . . . . . . . . . . . . . 267
SENSe Subsystem . . . . . . . . . . . . . . . . . . . . . . . . . . . . . . . . . . . . . . . . . . . . . . . . . . . . . . . . 268
[:SENSe]:AVERage Subsection . . . . . . . . . . . . . . . . . . . . . . . . . . . . . . . . . . . . . . . . . . . . . 269
Clear the Current Average . . . . . . . . . . . . . . . . . . . . . . . . . . . . . . . . . . . . . . . . . . . . . . . 269
Set the Average Count . . . . . . . . . . . . . . . . . . . . . . . . . . . . . . . . . . . . . . . . . . . . . . . . . . 269
Turn Averaging On/Off . . . . . . . . . . . . . . . . . . . . . . . . . . . . . . . . . . . . . . . . . . . . . . . . . 269
11
Page 12

Contents
Turn Automatic Averaging On/Off . . . . . . . . . . . . . . . . . . . . . . . . . . . . . . . . . . . . . . . . .270
Type of Averaging for Measurements . . . . . . . . . . . . . . . . . . . . . . . . . . . . . . . . . . . . . . .271
[:SENSe]:BANDwidth Subsection . . . . . . . . . . . . . . . . . . . . . . . . . . . . . . . . . . . . . . . . . . .272
Resolution Bandwidth . . . . . . . . . . . . . . . . . . . . . . . . . . . . . . . . . . . . . . . . . . . . . . . . . . .272
Resolution Bandwidth Automatic . . . . . . . . . . . . . . . . . . . . . . . . . . . . . . . . . . . . . . . . . .272
Resolution Bandwidth Mode . . . . . . . . . . . . . . . . . . . . . . . . . . . . . . . . . . . . . . . . . . . . . .272
Video Bandwidth . . . . . . . . . . . . . . . . . . . . . . . . . . . . . . . . . . . . . . . . . . . . . . . . . . . . . . .273
Video Bandwidth Automatic . . . . . . . . . . . . . . . . . . . . . . . . . . . . . . . . . . . . . . . . . . . . . .273
Video to Resolution Bandwidth Ratio . . . . . . . . . . . . . . . . . . . . . . . . . . . . . . . . . . . . . . .273
Video to Resolution Bandwidth Ratio Mode Select . . . . . . . . . . . . . . . . . . . . . . . . . . . .273
Resolution Bandwidth Type . . . . . . . . . . . . . . . . . . . . . . . . . . . . . . . . . . . . . . . . . . . . . .275
[:SENSe]:CORRection Subsection . . . . . . . . . . . . . . . . . . . . . . . . . . . . . . . . . . . . . . . . . . .276
Delete All Corrections . . . . . . . . . . . . . . . . . . . . . . . . . . . . . . . . . . . . . . . . . . . . . . . . . . .276
Perform Amplitude Correction . . . . . . . . . . . . . . . . . . . . . . . . . . . . . . . . . . . . . . . . . . . .276
Set Amplitude Correction Data . . . . . . . . . . . . . . . . . . . . . . . . . . . . . . . . . . . . . . . . . . . .276
Merge Additional Values into the Existing Amplitude Correction Data . . . . . . . . . . . . .277
Delete Amplitude Correction . . . . . . . . . . . . . . . . . . . . . . . . . . . . . . . . . . . . . . . . . . . . . .278
Set Amplitude Correction Frequency Interpolation . . . . . . . . . . . . . . . . . . . . . . . . . . . . .278
Perform Amplitude Correction . . . . . . . . . . . . . . . . . . . . . . . . . . . . . . . . . . . . . . . . . . . .278
Input Impedance Correction . . . . . . . . . . . . . . . . . . . . . . . . . . . . . . . . . . . . . . . . . . . . . .279
External Amplifier Correction . . . . . . . . . . . . . . . . . . . . . . . . . . . . . . . . . . . . . . . . . . . . .279
[:SENSe]:DEMod Subsection . . . . . . . . . . . . . . . . . . . . . . . . . . . . . . . . . . . . . . . . . . . . . . .280
Type of Demodulation . . . . . . . . . . . . . . . . . . . . . . . . . . . . . . . . . . . . . . . . . . . . . . . . . . .280
FM Deviation . . . . . . . . . . . . . . . . . . . . . . . . . . . . . . . . . . . . . . . . . . . . . . . . . . . . . . . . . .280
Squelch . . . . . . . . . . . . . . . . . . . . . . . . . . . . . . . . . . . . . . . . . . . . . . . . . . . . . . . . . . . . . . .280
Demodulation Control . . . . . . . . . . . . . . . . . . . . . . . . . . . . . . . . . . . . . . . . . . . . . . . . . . .281
Demod Time . . . . . . . . . . . . . . . . . . . . . . . . . . . . . . . . . . . . . . . . . . . . . . . . . . . . . . . . . .281
Demod View . . . . . . . . . . . . . . . . . . . . . . . . . . . . . . . . . . . . . . . . . . . . . . . . . . . . . . . . . .281
[:SENSe]:DETector Subsection . . . . . . . . . . . . . . . . . . . . . . . . . . . . . . . . . . . . . . . . . . . . . .282
Automatic Detection Type Selected . . . . . . . . . . . . . . . . . . . . . . . . . . . . . . . . . . . . . . . .282
Type of Detection . . . . . . . . . . . . . . . . . . . . . . . . . . . . . . . . . . . . . . . . . . . . . . . . . . . . . .284
Type of EMI Detector . . . . . . . . . . . . . . . . . . . . . . . . . . . . . . . . . . . . . . . . . . . . . . . . . . .285
EMI View . . . . . . . . . . . . . . . . . . . . . . . . . . . . . . . . . . . . . . . . . . . . . . . . . . . . . . . . . . . .286
Range Immediate . . . . . . . . . . . . . . . . . . . . . . . . . . . . . . . . . . . . . . . . . . . . . . . . . . . . . . .286
Unrange . . . . . . . . . . . . . . . . . . . . . . . . . . . . . . . . . . . . . . . . . . . . . . . . . . . . . . . . . . . . . .286
[:SENSe]:EMI Subsection . . . . . . . . . . . . . . . . . . . . . . . . . . . . . . . . . . . . . . . . . . . . . . . . . .287
Auto Measure Average On or Off . . . . . . . . . . . . . . . . . . . . . . . . . . . . . . . . . . . . . . . . . .287
Auto Measure Peak On or Off . . . . . . . . . . . . . . . . . . . . . . . . . . . . . . . . . . . . . . . . . . . . .287
Auto Measure Quasi Peak On or Off . . . . . . . . . . . . . . . . . . . . . . . . . . . . . . . . . . . . . . . .287
Setting the Dwell Time for Peak . . . . . . . . . . . . . . . . . . . . . . . . . . . . . . . . . . . . . . . . . . .288
Setting the Dwell Time for Quasi Peak . . . . . . . . . . . . . . . . . . . . . . . . . . . . . . . . . . . . . .288
Setting the Dwell Time for Average Peak . . . . . . . . . . . . . . . . . . . . . . . . . . . . . . . . . . . .288
12
Page 13

Contents
Preselector Centering On or Off (E7403A, E7404A, E7405A only) . . . . . . . . . . . . . . . 288
Setting the Dwell Time for Range . . . . . . . . . . . . . . . . . . . . . . . . . . . . . . . . . . . . . . . . . 289
Auto Measure Margin On or Off . . . . . . . . . . . . . . . . . . . . . . . . . . . . . . . . . . . . . . . . . . 289
[:SENSe]:FREQuency Subsection . . . . . . . . . . . . . . . . . . . . . . . . . . . . . . . . . . . . . . . . . . . 290
Center Frequency . . . . . . . . . . . . . . . . . . . . . . . . . . . . . . . . . . . . . . . . . . . . . . . . . . . . . . 290
Center Frequency Step Size Automatic . . . . . . . . . . . . . . . . . . . . . . . . . . . . . . . . . . . . . 290
Center Frequency Step Size . . . . . . . . . . . . . . . . . . . . . . . . . . . . . . . . . . . . . . . . . . . . . . 291
Frequency Span . . . . . . . . . . . . . . . . . . . . . . . . . . . . . . . . . . . . . . . . . . . . . . . . . . . . . . . . 291
Full Frequency Span . . . . . . . . . . . . . . . . . . . . . . . . . . . . . . . . . . . . . . . . . . . . . . . . . . . . 292
Last Frequency Span . . . . . . . . . . . . . . . . . . . . . . . . . . . . . . . . . . . . . . . . . . . . . . . . . . . . 292
Start Frequency . . . . . . . . . . . . . . . . . . . . . . . . . . . . . . . . . . . . . . . . . . . . . . . . . . . . . . . . 292
Stop Frequency . . . . . . . . . . . . . . . . . . . . . . . . . . . . . . . . . . . . . . . . . . . . . . . . . . . . . . . . 293
Frequency Synthesis Mode . . . . . . . . . . . . . . . . . . . . . . . . . . . . . . . . . . . . . . . . . . . . . . . 293
Frequency Synthesis State . . . . . . . . . . . . . . . . . . . . . . . . . . . . . . . . . . . . . . . . . . . . . . . 294
[:SENSe]:POWer Subsection . . . . . . . . . . . . . . . . . . . . . . . . . . . . . . . . . . . . . . . . . . . . . . . 295
Enable/Disable QPD X10 Gain . . . . . . . . . . . . . . . . . . . . . . . . . . . . . . . . . . . . . . . . . . . 295
Input Attenuation . . . . . . . . . . . . . . . . . . . . . . . . . . . . . . . . . . . . . . . . . . . . . . . . . . . . . . 295
Input Port Attenuator Auto . . . . . . . . . . . . . . . . . . . . . . . . . . . . . . . . . . . . . . . . . . . . . . . 295
Input Port Power Gain . . . . . . . . . . . . . . . . . . . . . . . . . . . . . . . . . . . . . . . . . . . . . . . . . . 296
Input Port Maximum Mixer Power . . . . . . . . . . . . . . . . . . . . . . . . . . . . . . . . . . . . . . . . . 296
Optimize Preselector Frequency . . . . . . . . . . . . . . . . . . . . . . . . . . . . . . . . . . . . . . . . . . . 296
Preselector Center . . . . . . . . . . . . . . . . . . . . . . . . . . . . . . . . . . . . . . . . . . . . . . . . . . . . . . 297
[:SENSe]:SWEep Subsection . . . . . . . . . . . . . . . . . . . . . . . . . . . . . . . . . . . . . . . . . . . . . . . 298
Sweep Points . . . . . . . . . . . . . . . . . . . . . . . . . . . . . . . . . . . . . . . . . . . . . . . . . . . . . . . . . . 298
Set Frequency Domain Scale Type . . . . . . . . . . . . . . . . . . . . . . . . . . . . . . . . . . . . . . . . . 298
Sweep Time . . . . . . . . . . . . . . . . . . . . . . . . . . . . . . . . . . . . . . . . . . . . . . . . . . . . . . . . . . 299
Automatic Sweep Time . . . . . . . . . . . . . . . . . . . . . . . . . . . . . . . . . . . . . . . . . . . . . . . . . 299
Sweep Time Mode . . . . . . . . . . . . . . . . . . . . . . . . . . . . . . . . . . . . . . . . . . . . . . . . . . . . . 300
Time Gating Delay (Option 1D6 Only) . . . . . . . . . . . . . . . . . . . . . . . . . . . . . . . . . . . . . 300
Time Gate Length (Option 1D6 Only) . . . . . . . . . . . . . . . . . . . . . . . . . . . . . . . . . . . . . . 300
Time Gate Level (Option 1D6 Only) . . . . . . . . . . . . . . . . . . . . . . . . . . . . . . . . . . . . . . . 301
Time Gate Polarity (Option 1D6 Only) . . . . . . . . . . . . . . . . . . . . . . . . . . . . . . . . . . . . . 301
Preset Time Gate (Option 1D6 Only) . . . . . . . . . . . . . . . . . . . . . . . . . . . . . . . . . . . . . . . 301
Control Time Gate (Option 1D6 Only) . . . . . . . . . . . . . . . . . . . . . . . . . . . . . . . . . . . . . . 301
Time Gate Trigger Type (Option 1D6 Only) . . . . . . . . . . . . . . . . . . . . . . . . . . . . . . . . . 302
SOURce Subsystem . . . . . . . . . . . . . . . . . . . . . . . . . . . . . . . . . . . . . . . . . . . . . . . . . . . . . . 303
Sets the Output Power Offset Correction . . . . . . . . . . . . . . . . . . . . . . . . . . . . . . . . . . . . 303
Source Attenuation . . . . . . . . . . . . . . . . . . . . . . . . . . . . . . . . . . . . . . . . . . . . . . . . . . . . . 303
Automatic Source Attenuation . . . . . . . . . . . . . . . . . . . . . . . . . . . . . . . . . . . . . . . . . . . . 304
Sets the Output Power . . . . . . . . . . . . . . . . . . . . . . . . . . . . . . . . . . . . . . . . . . . . . . . . . . . 304
Sets the Source Output Power Mode . . . . . . . . . . . . . . . . . . . . . . . . . . . . . . . . . . . . . . . 305
Set the Source Sweep Power Range . . . . . . . . . . . . . . . . . . . . . . . . . . . . . . . . . . . . . . . . 305
13
Page 14

Contents
Set the Output Power at the Start of the Sweep . . . . . . . . . . . . . . . . . . . . . . . . . . . . . . . .306
Set the Output Power to Step Automatically . . . . . . . . . . . . . . . . . . . . . . . . . . . . . . . . . .306
Set the Output Power Step Size . . . . . . . . . . . . . . . . . . . . . . . . . . . . . . . . . . . . . . . . . . . .306
Set the Source Sweep Power Range . . . . . . . . . . . . . . . . . . . . . . . . . . . . . . . . . . . . . . . .307
Output Power Tracking . . . . . . . . . . . . . . . . . . . . . . . . . . . . . . . . . . . . . . . . . . . . . . . . . .307
Output Power Tracking Peak . . . . . . . . . . . . . . . . . . . . . . . . . . . . . . . . . . . . . . . . . . . . . .307
STATus Subsystem . . . . . . . . . . . . . . . . . . . . . . . . . . . . . . . . . . . . . . . . . . . . . . . . . . . . . . .308
Operation Condition Query . . . . . . . . . . . . . . . . . . . . . . . . . . . . . . . . . . . . . . . . . . . . . . .308
Operation Enable . . . . . . . . . . . . . . . . . . . . . . . . . . . . . . . . . . . . . . . . . . . . . . . . . . . . . . .308
Operation Event Query . . . . . . . . . . . . . . . . . . . . . . . . . . . . . . . . . . . . . . . . . . . . . . . . . .308
Operation Negative Transition . . . . . . . . . . . . . . . . . . . . . . . . . . . . . . . . . . . . . . . . . . . . .309
Operation Positive Transition . . . . . . . . . . . . . . . . . . . . . . . . . . . . . . . . . . . . . . . . . . . . .309
Preset the Status Byte . . . . . . . . . . . . . . . . . . . . . . . . . . . . . . . . . . . . . . . . . . . . . . . . . . .309
STATus:QUEStionable Subsection . . . . . . . . . . . . . . . . . . . . . . . . . . . . . . . . . . . . . . . . . . .310
Questionable Calibration Condition . . . . . . . . . . . . . . . . . . . . . . . . . . . . . . . . . . . . . . . .310
Questionable Calibration Enable . . . . . . . . . . . . . . . . . . . . . . . . . . . . . . . . . . . . . . . . . . .310
Questionable Calibration Event Query . . . . . . . . . . . . . . . . . . . . . . . . . . . . . . . . . . . . . .310
Questionable Calibration Negative Transition . . . . . . . . . . . . . . . . . . . . . . . . . . . . . . . .311
Questionable Calibration Positive Transition . . . . . . . . . . . . . . . . . . . . . . . . . . . . . . . . .311
Questionable Condition . . . . . . . . . . . . . . . . . . . . . . . . . . . . . . . . . . . . . . . . . . . . . . . . . .311
Questionable Enable . . . . . . . . . . . . . . . . . . . . . . . . . . . . . . . . . . . . . . . . . . . . . . . . . . . .312
Questionable Event Query . . . . . . . . . . . . . . . . . . . . . . . . . . . . . . . . . . . . . . . . . . . . . . . .312
Questionable Frequency Condition . . . . . . . . . . . . . . . . . . . . . . . . . . . . . . . . . . . . . . . . .312
Questionable Frequency Enable . . . . . . . . . . . . . . . . . . . . . . . . . . . . . . . . . . . . . . . . . . .313
Questionable Frequency Event Query . . . . . . . . . . . . . . . . . . . . . . . . . . . . . . . . . . . . . . .313
Questionable Frequency Negative Transition . . . . . . . . . . . . . . . . . . . . . . . . . . . . . . . . .313
Questionable Frequency Positive Transition . . . . . . . . . . . . . . . . . . . . . . . . . . . . . . . . . .314
Questionable Integrity Condition . . . . . . . . . . . . . . . . . . . . . . . . . . . . . . . . . . . . . . . . . . .314
Questionable Integrity Enable . . . . . . . . . . . . . . . . . . . . . . . . . . . . . . . . . . . . . . . . . . . . .314
Questionable Integrity Event Query . . . . . . . . . . . . . . . . . . . . . . . . . . . . . . . . . . . . . . . .314
Questionable Integrity Negative Transition . . . . . . . . . . . . . . . . . . . . . . . . . . . . . . . . . . .315
Questionable Integrity Positive Transition . . . . . . . . . . . . . . . . . . . . . . . . . . . . . . . . . . .315
Questionable Integrity Uncalibrated Enable . . . . . . . . . . . . . . . . . . . . . . . . . . . . . . . . . .315
Questionable Integrity Uncalibrated Event Query . . . . . . . . . . . . . . . . . . . . . . . . . . . . . .316
Questionable Integrity Uncalibrated Negative Transition . . . . . . . . . . . . . . . . . . . . . . . .316
Questionable Integrity Uncalibrated Positive Transition . . . . . . . . . . . . . . . . . . . . . . . . .316
Questionable Negative Transition . . . . . . . . . . . . . . . . . . . . . . . . . . . . . . . . . . . . . . . . . .317
Questionable Power Condition . . . . . . . . . . . . . . . . . . . . . . . . . . . . . . . . . . . . . . . . . . . .317
Questionable Power Enable . . . . . . . . . . . . . . . . . . . . . . . . . . . . . . . . . . . . . . . . . . . . . . .317
Questionable Power Event Query . . . . . . . . . . . . . . . . . . . . . . . . . . . . . . . . . . . . . . . . . .317
Questionable Power Negative Transition . . . . . . . . . . . . . . . . . . . . . . . . . . . . . . . . . . . .318
Questionable Power Positive Transition . . . . . . . . . . . . . . . . . . . . . . . . . . . . . . . . . . . . .318
14
Page 15

Contents
Questionable Positive Transition . . . . . . . . . . . . . . . . . . . . . . . . . . . . . . . . . . . . . . . . . . 318
SYSTem Subsystem . . . . . . . . . . . . . . . . . . . . . . . . . . . . . . . . . . . . . . . . . . . . . . . . . . . . . . 319
GPIB Address . . . . . . . . . . . . . . . . . . . . . . . . . . . . . . . . . . . . . . . . . . . . . . . . . . . . . . . . . 319
Serial Port DTR Setup . . . . . . . . . . . . . . . . . . . . . . . . . . . . . . . . . . . . . . . . . . . . . . . . . . 319
Serial Port RTS Setup . . . . . . . . . . . . . . . . . . . . . . . . . . . . . . . . . . . . . . . . . . . . . . . . . . . 320
Serial Port Baud Rate Setup . . . . . . . . . . . . . . . . . . . . . . . . . . . . . . . . . . . . . . . . . . . . . . 320
Serial Port Receive Pace Setup . . . . . . . . . . . . . . . . . . . . . . . . . . . . . . . . . . . . . . . . . . . . 321
Serial Port Transmit Pace Setup . . . . . . . . . . . . . . . . . . . . . . . . . . . . . . . . . . . . . . . . . . . 321
Hardware Configuration Query . . . . . . . . . . . . . . . . . . . . . . . . . . . . . . . . . . . . . . . . . . . 321
Display the Hardware Configuration . . . . . . . . . . . . . . . . . . . . . . . . . . . . . . . . . . . . . . . 321
System Configuration Query . . . . . . . . . . . . . . . . . . . . . . . . . . . . . . . . . . . . . . . . . . . . . 322
Display System Configuration . . . . . . . . . . . . . . . . . . . . . . . . . . . . . . . . . . . . . . . . . . . . 322
Set Date . . . . . . . . . . . . . . . . . . . . . . . . . . . . . . . . . . . . . . . . . . . . . . . . . . . . . . . . . . . . . . 322
Error Information Query . . . . . . . . . . . . . . . . . . . . . . . . . . . . . . . . . . . . . . . . . . . . . . . . . 322
Locate SCPI Command Errors . . . . . . . . . . . . . . . . . . . . . . . . . . . . . . . . . . . . . . . . . . . . 323
Host Identification Query . . . . . . . . . . . . . . . . . . . . . . . . . . . . . . . . . . . . . . . . . . . . . . . . 323
License Key – Install Application/Option . . . . . . . . . . . . . . . . . . . . . . . . . . . . . . . . . . . 324
Delete a License Key . . . . . . . . . . . . . . . . . . . . . . . . . . . . . . . . . . . . . . . . . . . . . . . . . . . 324
Query Instrument Options . . . . . . . . . . . . . . . . . . . . . . . . . . . . . . . . . . . . . . . . . . . . . . . 324
Power On Elapsed Time . . . . . . . . . . . . . . . . . . . . . . . . . . . . . . . . . . . . . . . . . . . . . . . . . 325
Power On Time . . . . . . . . . . . . . . . . . . . . . . . . . . . . . . . . . . . . . . . . . . . . . . . . . . . . . . . . 325
Power On Type . . . . . . . . . . . . . . . . . . . . . . . . . . . . . . . . . . . . . . . . . . . . . . . . . . . . . . . . 325
Enable IF/Video/Sweep Output Ports . . . . . . . . . . . . . . . . . . . . . . . . . . . . . . . . . . . . . . . 325
Preset . . . . . . . . . . . . . . . . . . . . . . . . . . . . . . . . . . . . . . . . . . . . . . . . . . . . . . . . . . . . . . . . 326
Persistent State Reset . . . . . . . . . . . . . . . . . . . . . . . . . . . . . . . . . . . . . . . . . . . . . . . . . . . 326
Preset Type . . . . . . . . . . . . . . . . . . . . . . . . . . . . . . . . . . . . . . . . . . . . . . . . . . . . . . . . . . . 326
Save User Preset . . . . . . . . . . . . . . . . . . . . . . . . . . . . . . . . . . . . . . . . . . . . . . . . . . . . . . . 327
Speaker Control . . . . . . . . . . . . . . . . . . . . . . . . . . . . . . . . . . . . . . . . . . . . . . . . . . . . . . . 327
Set Time . . . . . . . . . . . . . . . . . . . . . . . . . . . . . . . . . . . . . . . . . . . . . . . . . . . . . . . . . . . . . 327
SCPI Version Query . . . . . . . . . . . . . . . . . . . . . . . . . . . . . . . . . . . . . . . . . . . . . . . . . . . . 327
TRACe Subsystem . . . . . . . . . . . . . . . . . . . . . . . . . . . . . . . . . . . . . . . . . . . . . . . . . . . . . . . 328
Copy Trace . . . . . . . . . . . . . . . . . . . . . . . . . . . . . . . . . . . . . . . . . . . . . . . . . . . . . . . . . . . 328
Transfer Trace Data . . . . . . . . . . . . . . . . . . . . . . . . . . . . . . . . . . . . . . . . . . . . . . . . . . . . 328
Exchange Traces . . . . . . . . . . . . . . . . . . . . . . . . . . . . . . . . . . . . . . . . . . . . . . . . . . . . . . . 329
Trace Math Add . . . . . . . . . . . . . . . . . . . . . . . . . . . . . . . . . . . . . . . . . . . . . . . . . . . . . . . 329
Mean Trace Data . . . . . . . . . . . . . . . . . . . . . . . . . . . . . . . . . . . . . . . . . . . . . . . . . . . . . . . 330
Query the Signal Peaks . . . . . . . . . . . . . . . . . . . . . . . . . . . . . . . . . . . . . . . . . . . . . . . . . . 330
Query Number of Peaks Found . . . . . . . . . . . . . . . . . . . . . . . . . . . . . . . . . . . . . . . . . . . 330
Peak Sorting . . . . . . . . . . . . . . . . . . . . . . . . . . . . . . . . . . . . . . . . . . . . . . . . . . . . . . . . . . 330
Smooth Trace Data . . . . . . . . . . . . . . . . . . . . . . . . . . . . . . . . . . . . . . . . . . . . . . . . . . . . . 330
Number of Points for Smoothing . . . . . . . . . . . . . . . . . . . . . . . . . . . . . . . . . . . . . . . . . . 332
Trace Math Subtract . . . . . . . . . . . . . . . . . . . . . . . . . . . . . . . . . . . . . . . . . . . . . . . . . . . . 332
15
Page 16

Contents
Trace Math Subtract From Display Line . . . . . . . . . . . . . . . . . . . . . . . . . . . . . . . . . . . . .333
Select Trace Display Mode . . . . . . . . . . . . . . . . . . . . . . . . . . . . . . . . . . . . . . . . . . . . . . .333
TRIGger Subsystem . . . . . . . . . . . . . . . . . . . . . . . . . . . . . . . . . . . . . . . . . . . . . . . . . . . . . . .334
External Trigger, Line Trigger Delay Value . . . . . . . . . . . . . . . . . . . . . . . . . . . . . . . . . .334
External Trigger, Line Trigger Delay Enable . . . . . . . . . . . . . . . . . . . . . . . . . . . . . . . . .334
External Trigger Slope . . . . . . . . . . . . . . . . . . . . . . . . . . . . . . . . . . . . . . . . . . . . . . . . . . .334
Trigger Offset . . . . . . . . . . . . . . . . . . . . . . . . . . . . . . . . . . . . . . . . . . . . . . . . . . . . . . . . .335
Trigger Source . . . . . . . . . . . . . . . . . . . . . . . . . . . . . . . . . . . . . . . . . . . . . . . . . . . . . . . . .336
Video Trigger Level Amplitude . . . . . . . . . . . . . . . . . . . . . . . . . . . . . . . . . . . . . . . . . . .336
Video Trigger Level Frequency . . . . . . . . . . . . . . . . . . . . . . . . . . . . . . . . . . . . . . . . . . . .337
UNIT Subsystem . . . . . . . . . . . . . . . . . . . . . . . . . . . . . . . . . . . . . . . . . . . . . . . . . . . . . . . . .338
Select Power Units of Measure . . . . . . . . . . . . . . . . . . . . . . . . . . . . . . . . . . . . . . . . . . . .338
6. Agilent 8590/EMC Analyzers Programming Conversion Guide
16
Page 17

Commands
Alphabetical Listing
:SOURce:POWer:ATTenuation <ampl> . . . . . . . . . . . . . . . . . . . . . . . . . . . . . . . . . . . . . . . . . . . . . . . . . . . . . . . . 303
*CAL? . . . . . . . . . . . . . . . . . . . . . . . . . . . . . . . . . . . . . . . . . . . . . . . . . . . . . . . . . . . . . . . . . . . . . . . . . . . . . . . . . . 193
*CLS . . . . . . . . . . . . . . . . . . . . . . . . . . . . . . . . . . . . . . . . . . . . . . . . . . . . . . . . . . . . . . . . . . . . . . . . . . . . . . . . . . . . 193
*CLS . . . . . . . . . . . . . . . . . . . . . . . . . . . . . . . . . . . . . . . . . . . . . . . . . . . . . . . . . . . . . . . . . . . . . . . . . . . . . . . . . . . . 196
*ESE <number> . . . . . . . . . . . . . . . . . . . . . . . . . . . . . . . . . . . . . . . . . . . . . . . . . . . . . . . . . . . . . . . . . . . . . . . . . . . 193
*ESE? . . . . . . . . . . . . . . . . . . . . . . . . . . . . . . . . . . . . . . . . . . . . . . . . . . . . . . . . . . . . . . . . . . . . . . . . . . . . . . . . . . . 193
*ESR? . . . . . . . . . . . . . . . . . . . . . . . . . . . . . . . . . . . . . . . . . . . . . . . . . . . . . . . . . . . . . . . . . . . . . . . . . . . . . . . . . . . 194
*IDN? . . . . . . . . . . . . . . . . . . . . . . . . . . . . . . . . . . . . . . . . . . . . . . . . . . . . . . . . . . . . . . . . . . . . . . . . . . . . . . . . . . . 194
*LRN? . . . . . . . . . . . . . . . . . . . . . . . . . . . . . . . . . . . . . . . . . . . . . . . . . . . . . . . . . . . . . . . . . . . . . . . . . . . . . . . . . . 194
*OPC . . . . . . . . . . . . . . . . . . . . . . . . . . . . . . . . . . . . . . . . . . . . . . . . . . . . . . . . . . . . . . . . . . . . . . . . . . . . . . . . . . . 195
*OPC?. . . . . . . . . . . . . . . . . . . . . . . . . . . . . . . . . . . . . . . . . . . . . . . . . . . . . . . . . . . . . . . . . . . . . . . . . . . . . . . . . . . 195
*RCL <register> . . . . . . . . . . . . . . . . . . . . . . . . . . . . . . . . . . . . . . . . . . . . . . . . . . . . . . . . . . . . . . . . . . . . . . . . . . . 195
*RST . . . . . . . . . . . . . . . . . . . . . . . . . . . . . . . . . . . . . . . . . . . . . . . . . . . . . . . . . . . . . . . . . . . . . . . . . . . . . . . . . . . . 196
*RST . . . . . . . . . . . . . . . . . . . . . . . . . . . . . . . . . . . . . . . . . . . . . . . . . . . . . . . . . . . . . . . . . . . . . . . . . . . . . . . . . . . . 196
*RST . . . . . . . . . . . . . . . . . . . . . . . . . . . . . . . . . . . . . . . . . . . . . . . . . . . . . . . . . . . . . . . . . . . . . . . . . . . . . . . . . . . . 196
*SAV <register> . . . . . . . . . . . . . . . . . . . . . . . . . . . . . . . . . . . . . . . . . . . . . . . . . . . . . . . . . . . . . . . . . . . . . . . . . . . 196
*SRE <integer> . . . . . . . . . . . . . . . . . . . . . . . . . . . . . . . . . . . . . . . . . . . . . . . . . . . . . . . . . . . . . . . . . . . . . . . . . . . 196
*SRE? . . . . . . . . . . . . . . . . . . . . . . . . . . . . . . . . . . . . . . . . . . . . . . . . . . . . . . . . . . . . . . . . . . . . . . . . . . . . . . . . . . . 196
*STB? . . . . . . . . . . . . . . . . . . . . . . . . . . . . . . . . . . . . . . . . . . . . . . . . . . . . . . . . . . . . . . . . . . . . . . . . . . . . . . . . . . . 196
*TRG . . . . . . . . . . . . . . . . . . . . . . . . . . . . . . . . . . . . . . . . . . . . . . . . . . . . . . . . . . . . . . . . . . . . . . . . . . . . . . . . . . . 197
*TST? . . . . . . . . . . . . . . . . . . . . . . . . . . . . . . . . . . . . . . . . . . . . . . . . . . . . . . . . . . . . . . . . . . . . . . . . . . . . . . . . . . . 197
*WAI. . . . . . . . . . . . . . . . . . . . . . . . . . . . . . . . . . . . . . . . . . . . . . . . . . . . . . . . . . . . . . . . . . . . . . . . . . . . . . . . . . . . 197
:ABORt. . . . . . . . . . . . . . . . . . . . . . . . . . . . . . . . . . . . . . . . . . . . . . . . . . . . . . . . . . . . . . . . . . . . . . . . . . . . . . . . . . 198
:CALCulate:BWIDth|BANDwidth:NDB <rel_ampl>. . . . . . . . . . . . . . . . . . . . . . . . . . . . . . . . . . . . . . . . . . . . . . 199
:CALCulate:BWIDth|BANDwidth:NDB? . . . . . . . . . . . . . . . . . . . . . . . . . . . . . . . . . . . . . . . . . . . . . . . . . . . . . . . 199
:CALCulate:BWIDth|BANDwidth:RESult? . . . . . . . . . . . . . . . . . . . . . . . . . . . . . . . . . . . . . . . . . . . . . . . . . . . . . 199
:CALCulate:BWIDth|BANDwidth:RESult? . . . . . . . . . . . . . . . . . . . . . . . . . . . . . . . . . . . . . . . . . . . . . . . . . . . . . 199
:CALCulate:BWIDth|BANDwidth[:STATe] OFF|ON|0|1 . . . . . . . . . . . . . . . . . . . . . . . . . . . . . . . . . . . . . . . . . . . 200
:CALCulate:BWIDth|BANDwidth[:STATe]? . . . . . . . . . . . . . . . . . . . . . . . . . . . . . . . . . . . . . . . . . . . . . . . . . . . . 200
:CALCulate:CLIMits:FAIL? . . . . . . . . . . . . . . . . . . . . . . . . . . . . . . . . . . . . . . . . . . . . . . . . . . . . . . . . . . . . . . . . . 200
:CALCulate:CORRection:ATFREquency? <freq> . . . . . . . . . . . . . . . . . . . . . . . . . . . . . . . . . . . . . . . . . . . . . . . . 200
17
Page 18

Commands
Alphabetical Listing
:CALCulate:EMI:SLISt:ADD:MARKer [1]|2|3|4 . . . . . . . . . . . . . . . . . . . . . . . . . . . . . . . . . . . . . . . . . . . . . . . . . 201
:CALCulate:EMI:SLISt:ADD:MEASured . . . . . . . . . . . . . . . . . . . . . . . . . . . . . . . . . . . . . . . . . . . . . . . . . . . . . . 201
:CALCulate:EMI:SLISt:CLEar ALL|CURRent|<integer> . . . . . . . . . . . . . . . . . . . . . . . . . . . . . . . . . . . . . . . . . . 204
:CALCulate:EMI:SLISt:COMMent:ALL <string> . . . . . . . . . . . . . . . . . . . . . . . . . . . . . . . . . . . . . . . . . . . . . . . . 205
:CALCulate:EMI:SLISt:COMMent:CURRent <string> . . . . . . . . . . . . . . . . . . . . . . . . . . . . . . . . . . . . . . . . . . . . 205
:CALCulate:EMI:SLISt:COMMent:MARKed <string> . . . . . . . . . . . . . . . . . . . . . . . . . . . . . . . . . . . . . . . . . . . . 205
:CALCulate:EMI:SLISt:DELete ALL|CURRent|MARKed| <integer> . . . . . . . . . . . . . . . . . . . . . . . . . . . . . . . . 205
:CALCulate:EMI:SLISt:DISPlay:STATe?. . . . . . . . . . . . . . . . . . . . . . . . . . . . . . . . . . . . . . . . . . . . . . . . . . . . . . . 206
:CALCulate:EMI:SLISt:DISPlay[:STATe] OFF|ON|0|1 . . . . . . . . . . . . . . . . . . . . . . . . . . . . . . . . . . . . . . . . . . . . 206
:CALCulate:EMI:SLISt:FETCh? CURRent|<integer> . . . . . . . . . . . . . . . . . . . . . . . . . . . . . . . . . . . . . . . . . . . . . 206
:CALCulate:EMI:SLISt:LENGth?. . . . . . . . . . . . . . . . . . . . . . . . . . . . . . . . . . . . . . . . . . . . . . . . . . . . . . . . . . . . . 206
:CALCulate:EMI:SLISt:MARK ALL|CURRent|TOEnd|DUPLicate|LOWer|COMPlement <integer> . . . . . . . . 206
:CALCulate:EMI:SLISt:SELect FIRSt|LAST|NEXT|PREVious| <integer>. . . . . . . . . . . . . . . . . . . . . . . . . . . . . 207
:CALCulate:EMI:SLISt:SORT FREQ, ASC? . . . . . . . . . . . . . . . . . . . . . . . . . . . . . . . . . . . . . . . . . . . . . . . . . . . . 207
:CALCulate:EMI:SLISt:SORT
FREQuency|PEAK|QPEak|AVERage|LLINE1|LLINE2 ASCending|DESending . . . . . . . . . . . . . . . . . . . . . . . . 207
:CALCulate:EMI:SLISt:View
COMMent|PEAK|QPEak|AVERage . . . . . . . . . . . . . . . . . . . . . . . . . . . . . . . . . . . . . . . . . . . . . . . . . . . . . . . . . . . 208
:CALCulate:EMI:SLISt:View? . . . . . . . . . . . . . . . . . . . . . . . . . . . . . . . . . . . . . . . . . . . . . . . . . . . . . . . . . . . . . . . 208
:CALCulate:LLINe:ALL:DELete . . . . . . . . . . . . . . . . . . . . . . . . . . . . . . . . . . . . . . . . . . . . . . . . . . . . . . . . . . . . . 209
:CALCulate:LLINe:CMODe FIXed|RELative . . . . . . . . . . . . . . . . . . . . . . . . . . . . . . . . . . . . . . . . . . . . . . . . . . . 209
:CALCulate:LLINe:CMODe? . . . . . . . . . . . . . . . . . . . . . . . . . . . . . . . . . . . . . . . . . . . . . . . . . . . . . . . . . . . . . . . . 209
:CALCulate:LLINe:CONTrol:DOMain FREQuency|TIME . . . . . . . . . . . . . . . . . . . . . . . . . . . . . . . . . . . . . . . . . 210
:CALCulate:LLINe:CONTrol:DOMain?. . . . . . . . . . . . . . . . . . . . . . . . . . . . . . . . . . . . . . . . . . . . . . . . . . . . . . . . 210
:CALCulate:LLINe[1]|2:AMPLitude:INTerpolate:TYPE LOGarithmic|LINear . . . . . . . . . . . . . . . . . . . . . . . . . 209
:CALCulate:LLINe[1]|2:AMPLitude:INTerpolate:TYPE? . . . . . . . . . . . . . . . . . . . . . . . . . . . . . . . . . . . . . . . . . . 209
:CALCulate:LLINe[1]|2:CONTrol:INTerpolate:TYPE LOGarithmic| . . . . . . . . . . . . . . . . . . . . . . . . . . . . . . . . . 211
:CALCulate:LLINe[1]|2:CONTrol:INTerpolate:TYPE? . . . . . . . . . . . . . . . . . . . . . . . . . . . . . . . . . . . . . . . . . . . . 211
:CALCulate:LLINe[1]|2:DATA <x-axis>,<ampl>,<connected>{,<x-axis>,<ampl>,<connected>} . . . . . . . . . . 211
:CALCulate:LLINe[1]|2:DATA:MERGe <x-axis>,<ampl>,<connected>{,<x-axis>,<ampl>,<connected>} . . . 213
:CALCulate:LLINe[1]|2:DATA? . . . . . . . . . . . . . . . . . . . . . . . . . . . . . . . . . . . . . . . . . . . . . . . . . . . . . . . . . . . . . . 211
:CALCulate:LLINe[1]|2:DELete . . . . . . . . . . . . . . . . . . . . . . . . . . . . . . . . . . . . . . . . . . . . . . . . . . . . . . . . . . . . . . 213
18
Page 19

Commands
Alphabetical Listing
:CALCulate:LLINe[1]|2:DISPlay OFF|ON|0|1 . . . . . . . . . . . . . . . . . . . . . . . . . . . . . . . . . . . . . . . . . . . . . . . . . . . 213
:CALCulate:LLINe[1]|2:DISPlay?. . . . . . . . . . . . . . . . . . . . . . . . . . . . . . . . . . . . . . . . . . . . . . . . . . . . . . . . . . . . . 213
:CALCulate:LLINe[1]|2:FAIL? . . . . . . . . . . . . . . . . . . . . . . . . . . . . . . . . . . . . . . . . . . . . . . . . . . . . . . . . . . . . . . . 214
:CALCulate:LLINe[1]|2:MARGin <rel_ampl> . . . . . . . . . . . . . . . . . . . . . . . . . . . . . . . . . . . . . . . . . . . . . . . . . . . 214
:CALCulate:LLINe[1]|2:MARGin:STATe OFF|ON|0|1 . . . . . . . . . . . . . . . . . . . . . . . . . . . . . . . . . . . . . . . . . . . . 214
:CALCulate:LLINe[1]|2:MARGin:STATe? . . . . . . . . . . . . . . . . . . . . . . . . . . . . . . . . . . . . . . . . . . . . . . . . . . . . . . 214
:CALCulate:LLINe[1]|2:MARGin? . . . . . . . . . . . . . . . . . . . . . . . . . . . . . . . . . . . . . . . . . . . . . . . . . . . . . . . . . . . . 214
:CALCulate:LLINe[1]|2:STATe OFF|ON|0|1 . . . . . . . . . . . . . . . . . . . . . . . . . . . . . . . . . . . . . . . . . . . . . . . . . . . . . 215
:CALCulate:LLINe[1]|2:STATe? . . . . . . . . . . . . . . . . . . . . . . . . . . . . . . . . . . . . . . . . . . . . . . . . . . . . . . . . . . . . . . 215
:CALCulate:LLINe[1]|2:TYPE UPPer|LOWer . . . . . . . . . . . . . . . . . . . . . . . . . . . . . . . . . . . . . . . . . . . . . . . . . . . 215
:CALCulate:LLINe[1]|2:TYPE? . . . . . . . . . . . . . . . . . . . . . . . . . . . . . . . . . . . . . . . . . . . . . . . . . . . . . . . . . . . . . . 215
:CALCulate:MARKer:AOFF . . . . . . . . . . . . . . . . . . . . . . . . . . . . . . . . . . . . . . . . . . . . . . . . . . . . . . . . . . . . . . . . . 216
:CALCulate:MARKer:FCOunt:RESolution <real> . . . . . . . . . . . . . . . . . . . . . . . . . . . . . . . . . . . . . . . . . . . . . . . . 216
:CALCulate:MARKer:FCOunt:RESolution:AUTO OFF|ON|0|1 . . . . . . . . . . . . . . . . . . . . . . . . . . . . . . . . . . . . . 217
:CALCulate:MARKer:FCOunt:RESolution:AUTO?. . . . . . . . . . . . . . . . . . . . . . . . . . . . . . . . . . . . . . . . . . . . . . . 217
:CALCulate:MARKer:FCOunt:RESolution?. . . . . . . . . . . . . . . . . . . . . . . . . . . . . . . . . . . . . . . . . . . . . . . . . . . . . 216
:CALCulate:MARKer:MODE SPAN. . . . . . . . . . . . . . . . . . . . . . . . . . . . . . . . . . . . . . . . . . . . . . . . . . . . . . . . . . . 226
:CALCulate:MARKer:PEAK: . . . . . . . . . . . . . . . . . . . . . . . . . . . . . . . . . . . . . . . . . . . . . . . . . . . . . . . . . . . . . . . . 220
:CALCulate:MARKer:PEAK:EXCursion <rel_ampl> . . . . . . . . . . . . . . . . . . . . . . . . . . . . . . . . . . . . . . . . . . . . . 220
:CALCulate:MARKer:PEAK:EXCursion? . . . . . . . . . . . . . . . . . . . . . . . . . . . . . . . . . . . . . . . . . . . . . . . . . . . . . . 220
:CALCulate:MARKer:PEAK:SEARch:MODE PARameter|MAXimum . . . . . . . . . . . . . . . . . . . . . . . . . . . . . . . 220
:CALCulate:MARKer:PEAK:THReshold <ampl> . . . . . . . . . . . . . . . . . . . . . . . . . . . . . . . . . . . . . . . . . . . . . . . . 221
:CALCulate:MARKer:PEAK:THReshold? . . . . . . . . . . . . . . . . . . . . . . . . . . . . . . . . . . . . . . . . . . . . . . . . . . . . . . 221
:CALCulate:MARKer:TABLe:STATe OFF|ON|0|1 . . . . . . . . . . . . . . . . . . . . . . . . . . . . . . . . . . . . . . . . . . . . . . . . 223
:CALCulate:MARKer:TABLe:STATe? . . . . . . . . . . . . . . . . . . . . . . . . . . . . . . . . . . . . . . . . . . . . . . . . . . . . . . . . . 223
:CALCulate:MARKer[1]:FCOunt:X? . . . . . . . . . . . . . . . . . . . . . . . . . . . . . . . . . . . . . . . . . . . . . . . . . . . . . . . . . . 217
:CALCulate:MARKer[1]|2|3|4:CPEak[:STATe] OFF|ON|0|1 . . . . . . . . . . . . . . . . . . . . . . . . . . . . . . . . . . . . . . . . 216
:CALCulate:MARKer[1]|2|3|4:CPEak[:STATe]?. . . . . . . . . . . . . . . . . . . . . . . . . . . . . . . . . . . . . . . . . . . . . . . . . . 216
:CALCulate:MARKer[1]|2|3|4:FCOunt:X? . . . . . . . . . . . . . . . . . . . . . . . . . . . . . . . . . . . . . . . . . . . . . . . . . . . . . . 217
:CALCulate:MARKer[1]|2|3|4:FCOunt[:STATe] OFF|ON|0|1 . . . . . . . . . . . . . . . . . . . . . . . . . . . . . . . . . . . . . . . 217
:CALCulate:MARKer[1]|2|3|4:FCOunt[:STATe]?. . . . . . . . . . . . . . . . . . . . . . . . . . . . . . . . . . . . . . . . . . . . . . . . . 217
19
Page 20

Commands
Alphabetical Listing
:CALCulate:MARKer[1]|2|3|4:FUNCtion BPOWer|NOISe|OFF . . . . . . . . . . . . . . . . . . . . . . . . . . . . . . . . . . . . . 217
:CALCulate:MARKer[1]|2|3|4:FUNCtion? . . . . . . . . . . . . . . . . . . . . . . . . . . . . . . . . . . . . . . . . . . . . . . . . . . . . . . 217
:CALCulate:MARKer[1]|2|3|4:MAXimum . . . . . . . . . . . . . . . . . . . . . . . . . . . . . . . . . . . . . . . . . . . . . . . . . . . . . . 218
:CALCulate:MARKer[1]|2|3|4:MAXimum:LEFT. . . . . . . . . . . . . . . . . . . . . . . . . . . . . . . . . . . . . . . . . . . . . . . . . 218
:CALCulate:MARKer[1]|2|3|4:MAXimum:NEXT . . . . . . . . . . . . . . . . . . . . . . . . . . . . . . . . . . . . . . . . . . . . . . . . 218
:CALCulate:MARKer[1]|2|3|4:MAXimum:RIGHt . . . . . . . . . . . . . . . . . . . . . . . . . . . . . . . . . . . . . . . . . . . . . . . . 219
:CALCulate:MARKer[1]|2|3|4:MINimum. . . . . . . . . . . . . . . . . . . . . . . . . . . . . . . . . . . . . . . . . . . . . . . . . . . . . . . 219
:CALCulate:MARKer[1]|2|3|4:MODE POSition|DELTa|BAND|SPAN . . . . . . . . . . . . . . . . . . . . . . . . . . . . . . . . 219
:CALCulate:MARKer[1]|2|3|4:MODE? . . . . . . . . . . . . . . . . . . . . . . . . . . . . . . . . . . . . . . . . . . . . . . . . . . . . . . . . 219
:CALCulate:MARKer[1]|2|3|4:PTPeak . . . . . . . . . . . . . . . . . . . . . . . . . . . . . . . . . . . . . . . . . . . . . . . . . . . . . . . . . 221
:CALCulate:MARKer[1]|2|3|4:STATe OFF|ON|0|1 . . . . . . . . . . . . . . . . . . . . . . . . . . . . . . . . . . . . . . . . . . . . . . . 222
:CALCulate:MARKer[1]|2|3|4:STATe? . . . . . . . . . . . . . . . . . . . . . . . . . . . . . . . . . . . . . . . . . . . . . . . . . . . . . . . . . 222
:CALCulate:MARKer[1]|2|3|4:TRACe <integer>. . . . . . . . . . . . . . . . . . . . . . . . . . . . . . . . . . . . . . . . . . . . . . . . . 223
:CALCulate:MARKer[1]|2|3|4:TRACe:AUTO OFF|ON|0|1. . . . . . . . . . . . . . . . . . . . . . . . . . . . . . . . . . . . . . . . . 223
:CALCulate:MARKer[1]|2|3|4:TRACe:AUTO? . . . . . . . . . . . . . . . . . . . . . . . . . . . . . . . . . . . . . . . . . . . . . . . . . . 223
:CALCulate:MARKer[1]|2|3|4:TRACe? . . . . . . . . . . . . . . . . . . . . . . . . . . . . . . . . . . . . . . . . . . . . . . . . . . . . . . . . 223
:CALCulate:MARKer[1]|2|3|4:TRCKing[:STATe] OFF|ON|0|1 . . . . . . . . . . . . . . . . . . . . . . . . . . . . . . . . . . . . . . 223
:CALCulate:MARKer[1]|2|3|4:TRCKing[:STATe]? . . . . . . . . . . . . . . . . . . . . . . . . . . . . . . . . . . . . . . . . . . . . . . . 223
:CALCulate:MARKer[1]|2|3|4:X <param> . . . . . . . . . . . . . . . . . . . . . . . . . . . . . . . . . . . . . . . . . . . . . . . . . . . . . . 224
:CALCulate:MARKer[1]|2|3|4:X:CENTer <param> . . . . . . . . . . . . . . . . . . . . . . . . . . . . . . . . . . . . . . . . . . . . . . . 224
:CALCulate:MARKer[1]|2|3|4:X:CENTer?. . . . . . . . . . . . . . . . . . . . . . . . . . . . . . . . . . . . . . . . . . . . . . . . . . . . . . 224
:CALCulate:MARKer[1]|2|3|4:X:POSition <integer> . . . . . . . . . . . . . . . . . . . . . . . . . . . . . . . . . . . . . . . . . . . . . 224
:CALCulate:MARKer[1]|2|3|4:X:POSition:CENTer <param> . . . . . . . . . . . . . . . . . . . . . . . . . . . . . . . . . . . . . . . 225
:CALCulate:MARKer[1]|2|3|4:X:POSition:CENTer? . . . . . . . . . . . . . . . . . . . . . . . . . . . . . . . . . . . . . . . . . . . . . . 225
:CALCulate:MARKer[1]|2|3|4:X:POSition:SPAN <param>. . . . . . . . . . . . . . . . . . . . . . . . . . . . . . . . . . . . . . . . . 225
:CALCulate:MARKer[1]|2|3|4:X:POSition:SPAN? . . . . . . . . . . . . . . . . . . . . . . . . . . . . . . . . . . . . . . . . . . . . . . . 225
:CALCulate:MARKer[1]|2|3|4:X:POSition:STARt <param> . . . . . . . . . . . . . . . . . . . . . . . . . . . . . . . . . . . . . . . . 225
:CALCulate:MARKer[1]|2|3|4:X:POSition:STARt? . . . . . . . . . . . . . . . . . . . . . . . . . . . . . . . . . . . . . . . . . . . . . . . 225
:CALCulate:MARKer[1]|2|3|4:X:POSition:STOP <param>. . . . . . . . . . . . . . . . . . . . . . . . . . . . . . . . . . . . . . . . . 226
:CALCulate:MARKer[1]|2|3|4:X:POSition:STOP? . . . . . . . . . . . . . . . . . . . . . . . . . . . . . . . . . . . . . . . . . . . . . . . 226
:CALCulate:MARKer[1]|2|3|4:X:POSition? . . . . . . . . . . . . . . . . . . . . . . . . . . . . . . . . . . . . . . . . . . . . . . . . . . . . . 224
20
Page 21

Commands
Alphabetical Listing
:CALCulate:MARKer[1]|2|3|4:X:READout FREQuency|TIME|ITIMe|PERiod . . . . . . . . . . . . . . . . . . . . . . . . . 226
:CALCulate:MARKer[1]|2|3|4:X:READout? . . . . . . . . . . . . . . . . . . . . . . . . . . . . . . . . . . . . . . . . . . . . . . . . . . . . 226
:CALCulate:MARKer[1]|2|3|4:X:SPAN <param> . . . . . . . . . . . . . . . . . . . . . . . . . . . . . . . . . . . . . . . . . . . . . . . . . 226
:CALCulate:MARKer[1]|2|3|4:X:SPAN? . . . . . . . . . . . . . . . . . . . . . . . . . . . . . . . . . . . . . . . . . . . . . . . . . . . . . . . 226
:CALCulate:MARKer[1]|2|3|4:X:STARt <param> . . . . . . . . . . . . . . . . . . . . . . . . . . . . . . . . . . . . . . . . . . . . . . . . 227
:CALCulate:MARKer[1]|2|3|4:X:STARt? . . . . . . . . . . . . . . . . . . . . . . . . . . . . . . . . . . . . . . . . . . . . . . . . . . . . . . . 227
:CALCulate:MARKer[1]|2|3|4:X:STOP <param> . . . . . . . . . . . . . . . . . . . . . . . . . . . . . . . . . . . . . . . . . . . . . . . . . 227
:CALCulate:MARKer[1]|2|3|4:X:STOP?. . . . . . . . . . . . . . . . . . . . . . . . . . . . . . . . . . . . . . . . . . . . . . . . . . . . . . . . 227
:CALCulate:MARKer[1]|2|3|4:X? . . . . . . . . . . . . . . . . . . . . . . . . . . . . . . . . . . . . . . . . . . . . . . . . . . . . . . . . . . . . . 224
:CALCulate:MARKer[1]|2|3|4:Y? . . . . . . . . . . . . . . . . . . . . . . . . . . . . . . . . . . . . . . . . . . . . . . . . . . . . . . . . . . . . . 217
:CALCulate:MARKer[1]|2|3|4:Y? . . . . . . . . . . . . . . . . . . . . . . . . . . . . . . . . . . . . . . . . . . . . . . . . . . . . . . . . . . . . . 227
:CALCulate:MARKer[1]|2|3|4[:SET]:CENTer . . . . . . . . . . . . . . . . . . . . . . . . . . . . . . . . . . . . . . . . . . . . . . . . . . . 221
:CALCulate:MARKer[1]|2|3|4[:SET]:RLEVel . . . . . . . . . . . . . . . . . . . . . . . . . . . . . . . . . . . . . . . . . . . . . . . . . . . 221
:CALCulate:MARKer[1]|2|3|4[:SET]:SPAN . . . . . . . . . . . . . . . . . . . . . . . . . . . . . . . . . . . . . . . . . . . . . . . . . . . . . 222
:CALCulate:MARKer[1]|2|3|4[:SET]:STARt . . . . . . . . . . . . . . . . . . . . . . . . . . . . . . . . . . . . . . . . . . . . . . . . . . . . 222
:CALCulate:MARKer[1]|2|3|4[:SET]:STEP . . . . . . . . . . . . . . . . . . . . . . . . . . . . . . . . . . . . . . . . . . . . . . . . . . . . . 222
:CALCulate:MARKer[1]|2|3|4[:SET]:STOP . . . . . . . . . . . . . . . . . . . . . . . . . . . . . . . . . . . . . . . . . . . . . . . . . . . . . 222
:CALCulate:NTData[:STATe] OFF|ON|0|1 . . . . . . . . . . . . . . . . . . . . . . . . . . . . . . . . . . . . . . . . . . . . . . . . . . . . . . 228
:CALCulate:NTData[:STATe]? . . . . . . . . . . . . . . . . . . . . . . . . . . . . . . . . . . . . . . . . . . . . . . . . . . . . . . . . . . . . . . . 228
:CALibration:AUTO OFF|ON|0|1 . . . . . . . . . . . . . . . . . . . . . . . . . . . . . . . . . . . . . . . . . . . . . . . . . . . . . . . . . . . . . 230
:CALibration:AUTO:MODE ALL|NRF . . . . . . . . . . . . . . . . . . . . . . . . . . . . . . . . . . . . . . . . . . . . . . . . . . . . . . . . 229
:CALibration:AUTO:MODE? . . . . . . . . . . . . . . . . . . . . . . . . . . . . . . . . . . . . . . . . . . . . . . . . . . . . . . . . . . . . . . . . 229
:CALibration:AUTO?. . . . . . . . . . . . . . . . . . . . . . . . . . . . . . . . . . . . . . . . . . . . . . . . . . . . . . . . . . . . . . . . . . . . . . . 230
:CALibration:DATA:DEFault . . . . . . . . . . . . . . . . . . . . . . . . . . . . . . . . . . . . . . . . . . . . . . . . . . . . . . . . . . . . . . . . 230
:CALibration:FMDemod . . . . . . . . . . . . . . . . . . . . . . . . . . . . . . . . . . . . . . . . . . . . . . . . . . . . . . . . . . . . . . . . . . . . 230
:CALibration:FMDemod? . . . . . . . . . . . . . . . . . . . . . . . . . . . . . . . . . . . . . . . . . . . . . . . . . . . . . . . . . . . . . . . . . . . 230
:CALibration:FREQuency:REFerence:COARse <setting> . . . . . . . . . . . . . . . . . . . . . . . . . . . . . . . . . . . . . . . . . . 231
:CALibration:FREQuency:REFerence:COARse? . . . . . . . . . . . . . . . . . . . . . . . . . . . . . . . . . . . . . . . . . . . . . . . . . 231
:CALibration:FREQuency:REFerence:FINE <setting>. . . . . . . . . . . . . . . . . . . . . . . . . . . . . . . . . . . . . . . . . . . . . 231
:CALibration:FREQuency:REFerence:FINE? . . . . . . . . . . . . . . . . . . . . . . . . . . . . . . . . . . . . . . . . . . . . . . . . . . . . 231
:CALibration:FREQuency:REFerence? . . . . . . . . . . . . . . . . . . . . . . . . . . . . . . . . . . . . . . . . . . . . . . . . . . . . . . . . . 230
21
Page 22

Commands
Alphabetical Listing
:CALibration:FREQuency[:STATe] OFF|ON|0|1 . . . . . . . . . . . . . . . . . . . . . . . . . . . . . . . . . . . . . . . . . . . . . . . . . 231
:CALibration:FREQuency[:STATe]? . . . . . . . . . . . . . . . . . . . . . . . . . . . . . . . . . . . . . . . . . . . . . . . . . . . . . . . . . . . 231
:CALibration:RF . . . . . . . . . . . . . . . . . . . . . . . . . . . . . . . . . . . . . . . . . . . . . . . . . . . . . . . . . . . . . . . . . . . . . . . . . . 231
:CALibration:RF? . . . . . . . . . . . . . . . . . . . . . . . . . . . . . . . . . . . . . . . . . . . . . . . . . . . . . . . . . . . . . . . . . . . . . . . . . 231
:CALibration:SOURce:STATe OFF|ON|0|1 . . . . . . . . . . . . . . . . . . . . . . . . . . . . . . . . . . . . . . . . . . . . . . . . . . . . . 232
:CALibration:SOURce:STATe? . . . . . . . . . . . . . . . . . . . . . . . . . . . . . . . . . . . . . . . . . . . . . . . . . . . . . . . . . . . . . . . 232
:CALibration:TG . . . . . . . . . . . . . . . . . . . . . . . . . . . . . . . . . . . . . . . . . . . . . . . . . . . . . . . . . . . . . . . . . . . . . . . . . . 232
:CALibration:TG? . . . . . . . . . . . . . . . . . . . . . . . . . . . . . . . . . . . . . . . . . . . . . . . . . . . . . . . . . . . . . . . . . . . . . . . . . 232
:CALibration[:ALL]. . . . . . . . . . . . . . . . . . . . . . . . . . . . . . . . . . . . . . . . . . . . . . . . . . . . . . . . . . . . . . . . . . . . . . . . 229
:CALibration[:ALL]?. . . . . . . . . . . . . . . . . . . . . . . . . . . . . . . . . . . . . . . . . . . . . . . . . . . . . . . . . . . . . . . . . . . . . . . 229
:CONFigure:<measurement>. . . . . . . . . . . . . . . . . . . . . . . . . . . . . . . . . . . . . . . . . . . . . . . . . . . . . . . . . . . . . . . . . 254
:CONFigure:EMI:AFRequency <freq><unit> . . . . . . . . . . . . . . . . . . . . . . . . . . . . . . . . . . . . . . . . . . . . . . . . . . . 257
:CONFigure:EMI:MARKer[1|2|3|4]? . . . . . . . . . . . . . . . . . . . . . . . . . . . . . . . . . . . . . . . . . . . . . . . . . . . . . . . . . . 258
:CONFigure:EMI:PEAKs . . . . . . . . . . . . . . . . . . . . . . . . . . . . . . . . . . . . . . . . . . . . . . . . . . . . . . . . . . . . . . . . . . . 259
:CONFigure:EMI:SLISt[CURRent]|MARKed|ALL . . . . . . . . . . . . . . . . . . . . . . . . . . . . . . . . . . . . . . . . . . . . . . . 259
:COUPle ALL|NONE . . . . . . . . . . . . . . . . . . . . . . . . . . . . . . . . . . . . . . . . . . . . . . . . . . . . . . . . . . . . . . . . . . . . . . 233
:COUPle? . . . . . . . . . . . . . . . . . . . . . . . . . . . . . . . . . . . . . . . . . . . . . . . . . . . . . . . . . . . . . . . . . . . . . . . . . . . . . . . . 233
:DISPlay:ANGLe <integer> . . . . . . . . . . . . . . . . . . . . . . . . . . . . . . . . . . . . . . . . . . . . . . . . . . . . . . . . . . . . . . . . . 235
:DISPlay:ANGLe? . . . . . . . . . . . . . . . . . . . . . . . . . . . . . . . . . . . . . . . . . . . . . . . . . . . . . . . . . . . . . . . . . . . . . . . . . 235
:DISPlay:ANNotation:CLOCk:DATE:FORMat MDY|DMY . . . . . . . . . . . . . . . . . . . . . . . . . . . . . . . . . . . . . . . . 235
:DISPlay:ANNotation:CLOCk:DATE:FORMat? . . . . . . . . . . . . . . . . . . . . . . . . . . . . . . . . . . . . . . . . . . . . . . . . . 235
:DISPlay:ANNotation:CLOCk[:STATe] OFF|ON|0|1 . . . . . . . . . . . . . . . . . . . . . . . . . . . . . . . . . . . . . . . . . . . . . . 235
:DISPlay:ANNotation:CLOCk[:STATe]? . . . . . . . . . . . . . . . . . . . . . . . . . . . . . . . . . . . . . . . . . . . . . . . . . . . . . . . 235
:DISPlay:ANNotation:TITLe:DATA <string> . . . . . . . . . . . . . . . . . . . . . . . . . . . . . . . . . . . . . . . . . . . . . . . . . . . 236
:DISPlay:ANNotation:TITLe:DATA? . . . . . . . . . . . . . . . . . . . . . . . . . . . . . . . . . . . . . . . . . . . . . . . . . . . . . . . . . . 236
:DISPlay:ENABle OFF|ON|0|1 . . . . . . . . . . . . . . . . . . . . . . . . . . . . . . . . . . . . . . . . . . . . . . . . . . . . . . . . . . . . . . . 236
:DISPlay:MENU:STATe OFF|ON|0|1 . . . . . . . . . . . . . . . . . . . . . . . . . . . . . . . . . . . . . . . . . . . . . . . . . . . . . . . . . . 236
:DISPlay:MENU:STATe?. . . . . . . . . . . . . . . . . . . . . . . . . . . . . . . . . . . . . . . . . . . . . . . . . . . . . . . . . . . . . . . . . . . . 236
:DISPlay:WINDow:ANNotation[:ALL] OFF|ON|0|1 . . . . . . . . . . . . . . . . . . . . . . . . . . . . . . . . . . . . . . . . . . . . . . 237
:DISPlay:WINDow:ANNotation[:ALL]? . . . . . . . . . . . . . . . . . . . . . . . . . . . . . . . . . . . . . . . . . . . . . . . . . . . . . . . 237
:DISPlay:WINDow:TRACe:GRATicule:GRID[:STATe] OFF|ON|0|1 . . . . . . . . . . . . . . . . . . . . . . . . . . . . . . . . . 237
22
Page 23

Commands
Alphabetical Listing
:DISPlay:WINDow:TRACe:GRATicule:GRID[:STATe]?. . . . . . . . . . . . . . . . . . . . . . . . . . . . . . . . . . . . . . . . . . . 237
:DISPlay:WINDow:TRACe:X[:SCALe]:OFFSet <freq> . . . . . . . . . . . . . . . . . . . . . . . . . . . . . . . . . . . . . . . . . . . 237
:DISPlay:WINDow:TRACe:X[:SCALe]:OFFSet? . . . . . . . . . . . . . . . . . . . . . . . . . . . . . . . . . . . . . . . . . . . . . . . . 237
:DISPlay:WINDow:TRACe:Y:DLINe <ampl> . . . . . . . . . . . . . . . . . . . . . . . . . . . . . . . . . . . . . . . . . . . . . . . . . . . 238
:DISPlay:WINDow:TRACe:Y:DLINe:STATe OFF|ON|0|1. . . . . . . . . . . . . . . . . . . . . . . . . . . . . . . . . . . . . . . . . . 238
:DISPlay:WINDow:TRACe:Y:DLINe:STATe? . . . . . . . . . . . . . . . . . . . . . . . . . . . . . . . . . . . . . . . . . . . . . . . . . . . 238
:DISPlay:WINDow:TRACe:Y:DLINe? . . . . . . . . . . . . . . . . . . . . . . . . . . . . . . . . . . . . . . . . . . . . . . . . . . . . . . . . . 238
:DISPlay:WINDow:TRACe:Y[:SCALe]:NRLevel <rel_ampl> . . . . . . . . . . . . . . . . . . . . . . . . . . . . . . . . . . . . . . 239
:DISPlay:WINDow:TRACe:Y[:SCALe]:NRLevel? . . . . . . . . . . . . . . . . . . . . . . . . . . . . . . . . . . . . . . . . . . . . . . . 239
:DISPlay:WINDow:TRACe:Y[:SCALe]:NRPosition <integer> . . . . . . . . . . . . . . . . . . . . . . . . . . . . . . . . . . . . . . 239
:DISPlay:WINDow:TRACe:Y[:SCALe]:NRPosition? . . . . . . . . . . . . . . . . . . . . . . . . . . . . . . . . . . . . . . . . . . . . . 239
:DISPlay:WINDow:TRACe:Y[:SCALe]:PDIVision <rel_ampl> . . . . . . . . . . . . . . . . . . . . . . . . . . . . . . . . . . . . . 240
:DISPlay:WINDow:TRACe:Y[:SCALe]:PDIVision:FREQuency . . . . . . . . . . . . . . . . . . . . . . . . . . . . . . . . . . . . 240
:DISPlay:WINDow:TRACe:Y[:SCALe]:PDIVision:FREQuency?. . . . . . . . . . . . . . . . . . . . . . . . . . . . . . . . . . . . 240
:DISPlay:WINDow:TRACe:Y[:SCALe]:PDIVision? . . . . . . . . . . . . . . . . . . . . . . . . . . . . . . . . . . . . . . . . . . . . . . 240
:DISPlay:WINDow:TRACe:Y[:SCALe]:RLEVel <ampl> . . . . . . . . . . . . . . . . . . . . . . . . . . . . . . . . . . . . . . . . . . 240
:DISPlay:WINDow:TRACe:Y[:SCALe]:RLEVel:OFFSet <rel_ampl> . . . . . . . . . . . . . . . . . . . . . . . . . . . . . . . . 241
:DISPlay:WINDow:TRACe:Y[:SCALe]:RLEVel:OFFSet? . . . . . . . . . . . . . . . . . . . . . . . . . . . . . . . . . . . . . . . . . 241
:DISPlay:WINDow:TRACe:Y[:SCALe]:RLEVel? . . . . . . . . . . . . . . . . . . . . . . . . . . . . . . . . . . . . . . . . . . . . . . . . 240
:DISPlay:WINDow:TRACe:Y[:SCALe]:SPACing LINear|LOGarithmic . . . . . . . . . . . . . . . . . . . . . . . . . . . . . . 242
:DISPlay:WINDow:TRACe:Y[:SCALe]:SPACing? . . . . . . . . . . . . . . . . . . . . . . . . . . . . . . . . . . . . . . . . . . . . . . . 242
:FETCh:<measurement>[n]? . . . . . . . . . . . . . . . . . . . . . . . . . . . . . . . . . . . . . . . . . . . . . . . . . . . . . . . . . . . . . . . . . 255
:FETCH?. . . . . . . . . . . . . . . . . . . . . . . . . . . . . . . . . . . . . . . . . . . . . . . . . . . . . . . . . . . . . . . . . . . . . . . . . . . . . . . . . 257
:FORMat:BORDer NORMal|SWAPped . . . . . . . . . . . . . . . . . . . . . . . . . . . . . . . . . . . . . . . . . . . . . . . . . . . . . . . . 243
:FORMat:BORDer? . . . . . . . . . . . . . . . . . . . . . . . . . . . . . . . . . . . . . . . . . . . . . . . . . . . . . . . . . . . . . . . . . . . . . . . . 243
:FORMat[:TRACe][:DATA]?. . . . . . . . . . . . . . . . . . . . . . . . . . . . . . . . . . . . . . . . . . . . . . . . . . . . . . . . . . . . . . . . . 243
:FORMat[:TRACe][:DATA]ASCii|INTeger,32|REAL,32|
REAL,64|UINTeger,16. . . . . . . . . . . . . . . . . . . . . . . . . . . . . . . . . . . . . . . . . . . . . . . . . . . . . . . . . . . . . . . . . . . . . . 243
:HCOPy:ABORt . . . . . . . . . . . . . . . . . . . . . . . . . . . . . . . . . . . . . . . . . . . . . . . . . . . . . . . . . . . . . . . . . . . . . . . . . . . 245
:HCOPy:DEVice:TYPE AUTO|CUSTom|NONE . . . . . . . . . . . . . . . . . . . . . . . . . . . . . . . . . . . . . . . . . . . . . . . . . 245
:HCOPy:DEVice:TYPE? . . . . . . . . . . . . . . . . . . . . . . . . . . . . . . . . . . . . . . . . . . . . . . . . . . . . . . . . . . . . . . . . . . . . 245
23
Page 24

Commands
Alphabetical Listing
:HCOPy:EMI:ITEM:REPort:SCReem|SLISt|ISETups[:State]? . . . . . . . . . . . . . . . . . . . . . . . . . . . . . . . . . . . . . . 245
:HCOPy:EMI:ITEM:REPort:SCReen|SLISt|ISETups[:State] |ON|OFF|1|0 . . . . . . . . . . . . . . . . . . . . . . . . . . . . . 245
:HCOPy:EMI:ITEM:SLISt:DELTa1|DELTa2:PPEak|QPEak|AVERage
:STATe ON|OFF|1|0 . . . . . . . . . . . . . . . . . . . . . . . . . . . . . . . . . . . . . . . . . . . . . . . . . . . . . . . . . . . . . . . . . . . . . . . . 246
:HCOPy:EMI:ITEM:SLISt:PPEak|QPEak|AVERage|LLINe1|LLINe2| CORRection|UNCertainty|COM-
Ment:STATe ON|OFF|1|0 . . . . . . . . . . . . . . . . . . . . . . . . . . . . . . . . . . . . . . . . . . . . . . . . . . . . . . . . . . . . . . . . . . . . 246
:HCOPy:EMI:ITEM:SLISt:PPEak|QPEak|AVERage|LLINe1|LLINe2| CORRection|UNCertainty|COM-
Ment:STATe? . . . . . . . . . . . . . . . . . . . . . . . . . . . . . . . . . . . . . . . . . . . . . . . . . . . . . . . . . . . . . . . . . . . . . . . . . . . . . 246
:HCOPy:EMI:REPort:IMMediate . . . . . . . . . . . . . . . . . . . . . . . . . . . . . . . . . . . . . . . . . . . . . . . . . . . . . . . . . . . . . 245
:HCOPy:IMAGe:COLor[:STATe] OFF|ON|0|1 . . . . . . . . . . . . . . . . . . . . . . . . . . . . . . . . . . . . . . . . . . . . . . . . . . . 246
:HCOPy:IMAGe:COLor[:STATe]? . . . . . . . . . . . . . . . . . . . . . . . . . . . . . . . . . . . . . . . . . . . . . . . . . . . . . . . . . . . . 246
:HCOPy:ITEM:FFEed[:IMMediate] . . . . . . . . . . . . . . . . . . . . . . . . . . . . . . . . . . . . . . . . . . . . . . . . . . . . . . . . . . . 247
:HCOPy:PAGE:ORIentation LANDscape|PORTrait. . . . . . . . . . . . . . . . . . . . . . . . . . . . . . . . . . . . . . . . . . . . . . . 247
:HCOPy:PAGE:ORIentation? . . . . . . . . . . . . . . . . . . . . . . . . . . . . . . . . . . . . . . . . . . . . . . . . . . . . . . . . . . . . . . . . 247
:HCOPy:PAGE:PRINts <integer> . . . . . . . . . . . . . . . . . . . . . . . . . . . . . . . . . . . . . . . . . . . . . . . . . . . . . . . . . . . . . 247
:HCOPy:PAGE:PRINts? . . . . . . . . . . . . . . . . . . . . . . . . . . . . . . . . . . . . . . . . . . . . . . . . . . . . . . . . . . . . . . . . . . . . 247
:HCOPy:PAGE:SIZE A|B|A3|A4|LETTer|LEGal|EXECutive|LEDGer . . . . . . . . . . . . . . . . . . . . . . . . . . . . . . . . 248
:HCOPy:PAGE:SIZE? . . . . . . . . . . . . . . . . . . . . . . . . . . . . . . . . . . . . . . . . . . . . . . . . . . . . . . . . . . . . . . . . . . . . . . 248
:HCOPy:REPOrt:TYPE SCREen|REPort . . . . . . . . . . . . . . . . . . . . . . . . . . . . . . . . . . . . . . . . . . . . . . . . . . . . . . . 248
:HCOPy[:IMMediate] . . . . . . . . . . . . . . . . . . . . . . . . . . . . . . . . . . . . . . . . . . . . . . . . . . . . . . . . . . . . . . . . . . . . . . 247
:INITiate:ABort . . . . . . . . . . . . . . . . . . . . . . . . . . . . . . . . . . . . . . . . . . . . . . . . . . . . . . . . . . . . . . . . . . . . . . . . . . . 250
:INITiate:CONTinuous OFF|ON|0|1 . . . . . . . . . . . . . . . . . . . . . . . . . . . . . . . . . . . . . . . . . . . . . . . . . . . . . . . . . . . 249
:INITiate:CONTinuous?. . . . . . . . . . . . . . . . . . . . . . . . . . . . . . . . . . . . . . . . . . . . . . . . . . . . . . . . . . . . . . . . . . . . . 249
:INITiate:PAUSe . . . . . . . . . . . . . . . . . . . . . . . . . . . . . . . . . . . . . . . . . . . . . . . . . . . . . . . . . . . . . . . . . . . . . . . . . . 250
:INITiate:RESTart . . . . . . . . . . . . . . . . . . . . . . . . . . . . . . . . . . . . . . . . . . . . . . . . . . . . . . . . . . . . . . . . . . . . . . . . . 251
:INITiate:RESume . . . . . . . . . . . . . . . . . . . . . . . . . . . . . . . . . . . . . . . . . . . . . . . . . . . . . . . . . . . . . . . . . . . . . . . . . 251
:INITiate[:IMMediate] . . . . . . . . . . . . . . . . . . . . . . . . . . . . . . . . . . . . . . . . . . . . . . . . . . . . . . . . . . . . . . . . . . . . . . 250
:INPut:COUPling AC|DC . . . . . . . . . . . . . . . . . . . . . . . . . . . . . . . . . . . . . . . . . . . . . . . . . . . . . . . . . . . . . . . . . . . 252
:INPut:COUPling? . . . . . . . . . . . . . . . . . . . . . . . . . . . . . . . . . . . . . . . . . . . . . . . . . . . . . . . . . . . . . . . . . . . . . . . . . 252
:INPut:PROTection:CLEar . . . . . . . . . . . . . . . . . . . . . . . . . . . . . . . . . . . . . . . . . . . . . . . . . . . . . . . . . . . . . . . . . . 253
:MEASure:<measurement>[n]? . . . . . . . . . . . . . . . . . . . . . . . . . . . . . . . . . . . . . . . . . . . . . . . . . . . . . . . . . . . . . . . 255
:MEASure:EMI:AFRequency? <freq><unit> . . . . . . . . . . . . . . . . . . . . . . . . . . . . . . . . . . . . . . . . . . . . . . . . . . . . 257
24
Page 25

Commands
Alphabetical Listing
:MEASure:EMI:MARKer[1|2|3|4]? . . . . . . . . . . . . . . . . . . . . . . . . . . . . . . . . . . . . . . . . . . . . . . . . . . . . . . . . . . . . 258
:MEASure:EMI:MARKer[1|2|3|4]ADD?. . . . . . . . . . . . . . . . . . . . . . . . . . . . . . . . . . . . . . . . . . . . . . . . . . . . . . . . 258
:MEASure:EMI:MMIN:STATe OFF|ON|0|1 . . . . . . . . . . . . . . . . . . . . . . . . . . . . . . . . . . . . . . . . . . . . . . . . . . . . . 258
:MEASure:EMI:MMIN:STATe? . . . . . . . . . . . . . . . . . . . . . . . . . . . . . . . . . . . . . . . . . . . . . . . . . . . . . . . . . . . . . . 258
:MEASure:EMI:SLISt?[CURRent]MARKed|ALL . . . . . . . . . . . . . . . . . . . . . . . . . . . . . . . . . . . . . . . . . . . . . . . . 259
:MEASure:MARKer?. . . . . . . . . . . . . . . . . . . . . . . . . . . . . . . . . . . . . . . . . . . . . . . . . . . . . . . . . . . . . . . . . . . . . . . 258
:MMEMory:CATalog? <drive> . . . . . . . . . . . . . . . . . . . . . . . . . . . . . . . . . . . . . . . . . . . . . . . . . . . . . . . . . . . . . . . 260
:MMEMory:COPY <file_name1>,<file_name2> . . . . . . . . . . . . . . . . . . . . . . . . . . . . . . . . . . . . . . . . . . . . . . . . . 260
:MMEMory:DATA <file_name>,<definite_length_block>. . . . . . . . . . . . . . . . . . . . . . . . . . . . . . . . . . . . . . . . . . 261
:MMEMory:DATA? <file_name> . . . . . . . . . . . . . . . . . . . . . . . . . . . . . . . . . . . . . . . . . . . . . . . . . . . . . . . . . . . . . 261
:MMEMory:DELete <file_name> . . . . . . . . . . . . . . . . . . . . . . . . . . . . . . . . . . . . . . . . . . . . . . . . . . . . . . . . . . . . . 261
:MMEMory:LOAD:CORRection ANTenna|CABLe|OTHer|USER,<file_name> . . . . . . . . . . . . . . . . . . . . . . . . 261
:MMEMory:LOAD:LIMit LLINE1|LLINE2,<file_name> . . . . . . . . . . . . . . . . . . . . . . . . . . . . . . . . . . . . . . . . . . 261
:MMEMory:LOAD:SIGNallist <file_name>. . . . . . . . . . . . . . . . . . . . . . . . . . . . . . . . . . . . . . . . . . . . . . . . . . . . . 263
:MMEMory:LOAD:STATe 1,<file_name> . . . . . . . . . . . . . . . . . . . . . . . . . . . . . . . . . . . . . . . . . . . . . . . . . . . . . . 262
:MMEMory:LOAD:TRACe <file_name> . . . . . . . . . . . . . . . . . . . . . . . . . . . . . . . . . . . . . . . . . . . . . . . . . . . . . . . 262
:MMEMory:MDIRectory <dir_path> . . . . . . . . . . . . . . . . . . . . . . . . . . . . . . . . . . . . . . . . . . . . . . . . . . . . . . . . . . 263
:MMEMory:RDIRectory <dir_name> . . . . . . . . . . . . . . . . . . . . . . . . . . . . . . . . . . . . . . . . . . . . . . . . . . . . . . . . . . 264
:MMEMory:STORe:CORRection ANTenna|CABLe|OTHer|USER,<file_name> . . . . . . . . . . . . . . . . . . . . . . . . 264
:MMEMory:STORe:LIMit LLINE1|LLINE2,<file_name> . . . . . . . . . . . . . . . . . . . . . . . . . . . . . . . . . . . . . . . . . 265
:MMEMory:STORe:RESults <file_name> . . . . . . . . . . . . . . . . . . . . . . . . . . . . . . . . . . . . . . . . . . . . . . . . . . . . . . 265
:MMEMory:STORe:SCReen <file_name> . . . . . . . . . . . . . . . . . . . . . . . . . . . . . . . . . . . . . . . . . . . . . . . . . . . . . . 265
:MMEMory:STORe:SIGNallist <file_name> . . . . . . . . . . . . . . . . . . . . . . . . . . . . . . . . . . . . . . . . . . . . . . . . . . . . 263
:MMEMory:STORe:STATe 1,<file_name> . . . . . . . . . . . . . . . . . . . . . . . . . . . . . . . . . . . . . . . . . . . . . . . . . . . . . . 265
:MMEMory:STORe:TRACe <label>,<file_name> . . . . . . . . . . . . . . . . . . . . . . . . . . . . . . . . . . . . . . . . . . . . . . . . 266
:OUTPut[:STATe] OFF|ON|0|1 . . . . . . . . . . . . . . . . . . . . . . . . . . . . . . . . . . . . . . . . . . . . . . . . . . . . . . . . . . . . . . . 267
:OUTPut[:STATe]? . . . . . . . . . . . . . . . . . . . . . . . . . . . . . . . . . . . . . . . . . . . . . . . . . . . . . . . . . . . . . . . . . . . . . . . . . 267
:READ:<measurement>[n]?. . . . . . . . . . . . . . . . . . . . . . . . . . . . . . . . . . . . . . . . . . . . . . . . . . . . . . . . . . . . . . . . . . 256
:SOURce:CORRection:OFFSet <rel_ampl> . . . . . . . . . . . . . . . . . . . . . . . . . . . . . . . . . . . . . . . . . . . . . . . . . . . . . 303
:SOURce:CORRection:OFFSet? . . . . . . . . . . . . . . . . . . . . . . . . . . . . . . . . . . . . . . . . . . . . . . . . . . . . . . . . . . . . . . 303
:SOURce:POWer:ATTenuation <ampl>. . . . . . . . . . . . . . . . . . . . . . . . . . . . . . . . . . . . . . . . . . . . . . . . . . . . . . . . . 303
25
Page 26

Commands
Alphabetical Listing
:SOURce:POWer:ATTenuation:AUTO OFF|ON|0|1 . . . . . . . . . . . . . . . . . . . . . . . . . . . . . . . . . . . . . . . . . . . . . . . 304
:SOURce:POWer:ATTenuation:AUTO? . . . . . . . . . . . . . . . . . . . . . . . . . . . . . . . . . . . . . . . . . . . . . . . . . . . . . . . . 304
:SOURce:POWer:ATTenuation? . . . . . . . . . . . . . . . . . . . . . . . . . . . . . . . . . . . . . . . . . . . . . . . . . . . . . . . . . . . . . . 303
:SOURce:POWer:MODE FIXed|SWEep . . . . . . . . . . . . . . . . . . . . . . . . . . . . . . . . . . . . . . . . . . . . . . . . . . . . . . . 305
:SOURce:POWer:MODE? . . . . . . . . . . . . . . . . . . . . . . . . . . . . . . . . . . . . . . . . . . . . . . . . . . . . . . . . . . . . . . . . . . . 305
:SOURce:POWer:SPAN <rel_ampl> . . . . . . . . . . . . . . . . . . . . . . . . . . . . . . . . . . . . . . . . . . . . . . . . . . . . . . . . . . . 305
:SOURce:POWer:SPAN? . . . . . . . . . . . . . . . . . . . . . . . . . . . . . . . . . . . . . . . . . . . . . . . . . . . . . . . . . . . . . . . . . . . . 305
:SOURce:POWer:STARt <ampl> . . . . . . . . . . . . . . . . . . . . . . . . . . . . . . . . . . . . . . . . . . . . . . . . . . . . . . . . . . . . . 306
:SOURce:POWer:STARt? . . . . . . . . . . . . . . . . . . . . . . . . . . . . . . . . . . . . . . . . . . . . . . . . . . . . . . . . . . . . . . . . . . . 306
:SOURce:POWer:STEP:AUTO OFF|ON|0|1 . . . . . . . . . . . . . . . . . . . . . . . . . . . . . . . . . . . . . . . . . . . . . . . . . . . . 306
:SOURce:POWer:STEP:AUTO? . . . . . . . . . . . . . . . . . . . . . . . . . . . . . . . . . . . . . . . . . . . . . . . . . . . . . . . . . . . . . . 306
:SOURce:POWer:STEP[:INCRement] <ampl> . . . . . . . . . . . . . . . . . . . . . . . . . . . . . . . . . . . . . . . . . . . . . . . . . . 306
:SOURce:POWer:STEP[:INCRement]? . . . . . . . . . . . . . . . . . . . . . . . . . . . . . . . . . . . . . . . . . . . . . . . . . . . . . . . . 306
:SOURce:POWer:SWEep <rel_ampl>. . . . . . . . . . . . . . . . . . . . . . . . . . . . . . . . . . . . . . . . . . . . . . . . . . . . . . . . . . 307
:SOURce:POWer:SWEep? . . . . . . . . . . . . . . . . . . . . . . . . . . . . . . . . . . . . . . . . . . . . . . . . . . . . . . . . . . . . . . . . . . 307
:SOURce:POWer:TRCKing <integer> . . . . . . . . . . . . . . . . . . . . . . . . . . . . . . . . . . . . . . . . . . . . . . . . . . . . . . . . . 307
:SOURce:POWer:TRCKing:PEAK . . . . . . . . . . . . . . . . . . . . . . . . . . . . . . . . . . . . . . . . . . . . . . . . . . . . . . . . . . . . 307
:SOURce:POWer:TRCKing? . . . . . . . . . . . . . . . . . . . . . . . . . . . . . . . . . . . . . . . . . . . . . . . . . . . . . . . . . . . . . . . . . 307
:SOURce:POWer[:LEVel][:IMMediate][:AMPLitude] <ampl> . . . . . . . . . . . . . . . . . . . . . . . . . . . . . . . . . . . . . . 304
:SOURce:POWer[:LEVel][:IMMediate][:AMPLitude] UP|DOWN . . . . . . . . . . . . . . . . . . . . . . . . . . . . . . . . . . . 304
:SOURce:POWer[:LEVel][:IMMediate][:AMPLitude]? . . . . . . . . . . . . . . . . . . . . . . . . . . . . . . . . . . . . . . . . . . . . 304
:STATus:OPERation:CONDition? . . . . . . . . . . . . . . . . . . . . . . . . . . . . . . . . . . . . . . . . . . . . . . . . . . . . . . . . . . . . . 308
:STATus:OPERation:ENABle<integer> . . . . . . . . . . . . . . . . . . . . . . . . . . . . . . . . . . . . . . . . . . . . . . . . . . . . . . . . 308
:STATus:OPERation:ENABle? . . . . . . . . . . . . . . . . . . . . . . . . . . . . . . . . . . . . . . . . . . . . . . . . . . . . . . . . . . . . . . . 308
:STATus:OPERation:NTRansition <integer> . . . . . . . . . . . . . . . . . . . . . . . . . . . . . . . . . . . . . . . . . . . . . . . . . . . . 309
:STATus:OPERation:NTRansition? . . . . . . . . . . . . . . . . . . . . . . . . . . . . . . . . . . . . . . . . . . . . . . . . . . . . . . . . . . . . 309
:STATus:OPERation:PTRansition <integer> . . . . . . . . . . . . . . . . . . . . . . . . . . . . . . . . . . . . . . . . . . . . . . . . . . . . . 309
:STATus:OPERation:PTRansition? . . . . . . . . . . . . . . . . . . . . . . . . . . . . . . . . . . . . . . . . . . . . . . . . . . . . . . . . . . . . 309
:STATus:OPERation[:EVENt]? . . . . . . . . . . . . . . . . . . . . . . . . . . . . . . . . . . . . . . . . . . . . . . . . . . . . . . . . . . . . . . . 308
:STATus:PRESet . . . . . . . . . . . . . . . . . . . . . . . . . . . . . . . . . . . . . . . . . . . . . . . . . . . . . . . . . . . . . . . . . . . . . . . . . . 309
:STATus:QUEStionable:CALibration:CONDition? . . . . . . . . . . . . . . . . . . . . . . . . . . . . . . . . . . . . . . . . . . . . . . . 310
26
Page 27

Commands
Alphabetical Listing
:STATus:QUEStionable:CALibration:ENABle <integer>. . . . . . . . . . . . . . . . . . . . . . . . . . . . . . . . . . . . . . . . . . . 310
:STATus:QUEStionable:CALibration:ENABle? . . . . . . . . . . . . . . . . . . . . . . . . . . . . . . . . . . . . . . . . . . . . . . . . . . 310
:STATus:QUEStionable:CALibration:NTRansition <integer> . . . . . . . . . . . . . . . . . . . . . . . . . . . . . . . . . . . . . . . 311
:STATus:QUEStionable:CALibration:NTRansition? . . . . . . . . . . . . . . . . . . . . . . . . . . . . . . . . . . . . . . . . . . . . . . . 311
:STATus:QUEStionable:CALibration:PTRansition <integer> . . . . . . . . . . . . . . . . . . . . . . . . . . . . . . . . . . . . . . . . 311
:STATus:QUEStionable:CALibration:PTRansition? . . . . . . . . . . . . . . . . . . . . . . . . . . . . . . . . . . . . . . . . . . . . . . . 311
:STATus:QUEStionable:CALibration[:EVENt]? . . . . . . . . . . . . . . . . . . . . . . . . . . . . . . . . . . . . . . . . . . . . . . . . . . 310
:STATus:QUEStionable:CONDition? . . . . . . . . . . . . . . . . . . . . . . . . . . . . . . . . . . . . . . . . . . . . . . . . . . . . . . . . . . 311
:STATus:QUEStionable:ENABle <integer> . . . . . . . . . . . . . . . . . . . . . . . . . . . . . . . . . . . . . . . . . . . . . . . . . . . . . 312
:STATus:QUEStionable:ENABle? . . . . . . . . . . . . . . . . . . . . . . . . . . . . . . . . . . . . . . . . . . . . . . . . . . . . . . . . . . . . . 312
:STATus:QUEStionable:FREQuency:CONDition? . . . . . . . . . . . . . . . . . . . . . . . . . . . . . . . . . . . . . . . . . . . . . . . . 312
:STATus:QUEStionable:FREQuency:ENABle <integer> . . . . . . . . . . . . . . . . . . . . . . . . . . . . . . . . . . . . . . . . . . . 313
:STATus:QUEStionable:FREQuency:ENABle? . . . . . . . . . . . . . . . . . . . . . . . . . . . . . . . . . . . . . . . . . . . . . . . . . . 313
:STATus:QUEStionable:FREQuency:NTRansition <integer>. . . . . . . . . . . . . . . . . . . . . . . . . . . . . . . . . . . . . . . . 313
:STATus:QUEStionable:FREQuency:NTRansition? . . . . . . . . . . . . . . . . . . . . . . . . . . . . . . . . . . . . . . . . . . . . . . . 313
:STATus:QUEStionable:FREQuency:PTRansition <integer> . . . . . . . . . . . . . . . . . . . . . . . . . . . . . . . . . . . . . . . . 314
:STATus:QUEStionable:FREQuency:PTRansition? . . . . . . . . . . . . . . . . . . . . . . . . . . . . . . . . . . . . . . . . . . . . . . . 314
:STATus:QUEStionable:FREQuency[:EVENt]? . . . . . . . . . . . . . . . . . . . . . . . . . . . . . . . . . . . . . . . . . . . . . . . . . . 313
:STATus:QUEStionable:INTegrity:CONDition? . . . . . . . . . . . . . . . . . . . . . . . . . . . . . . . . . . . . . . . . . . . . . . . . . . 314
:STATus:QUEStionable:INTegrity:ENABle <integer> . . . . . . . . . . . . . . . . . . . . . . . . . . . . . . . . . . . . . . . . . . . . . 314
:STATus:QUEStionable:INTegrity:ENABle? . . . . . . . . . . . . . . . . . . . . . . . . . . . . . . . . . . . . . . . . . . . . . . . . . . . . 314
:STATus:QUEStionable:INTegrity:NTRansition <integer>. . . . . . . . . . . . . . . . . . . . . . . . . . . . . . . . . . . . . . . . . . 315
:STATus:QUEStionable:INTegrity:NTRansition? . . . . . . . . . . . . . . . . . . . . . . . . . . . . . . . . . . . . . . . . . . . . . . . . . 315
:STATus:QUEStionable:INTegrity:PTRansition <integer> . . . . . . . . . . . . . . . . . . . . . . . . . . . . . . . . . . . . . . . . . . 315
:STATus:QUEStionable:INTegrity:PTRansition? . . . . . . . . . . . . . . . . . . . . . . . . . . . . . . . . . . . . . . . . . . . . . . . . . 315
:STATus:QUEStionable:INTegrity[:EVENt]? . . . . . . . . . . . . . . . . . . . . . . . . . . . . . . . . . . . . . . . . . . . . . . . . . . . . 314
:STATus:QUEStionable:NTRansition <integer> . . . . . . . . . . . . . . . . . . . . . . . . . . . . . . . . . . . . . . . . . . . . . . . . . . 317
:STATus:QUEStionable:NTRansition? . . . . . . . . . . . . . . . . . . . . . . . . . . . . . . . . . . . . . . . . . . . . . . . . . . . . . . . . . 317
:STATus:QUEStionable:POWer:CONDition? . . . . . . . . . . . . . . . . . . . . . . . . . . . . . . . . . . . . . . . . . . . . . . . . . . . . 317
:STATus:QUEStionable:POWer:ENABle <integer> . . . . . . . . . . . . . . . . . . . . . . . . . . . . . . . . . . . . . . . . . . . . . . . 317
:STATus:QUEStionable:POWer:ENABle?> . . . . . . . . . . . . . . . . . . . . . . . . . . . . . . . . . . . . . . . . . . . . . . . . . . . . . 317
27
Page 28

Commands
Alphabetical Listing
:STATus:QUEStionable:POWer:NTRansition <integer> . . . . . . . . . . . . . . . . . . . . . . . . . . . . . . . . . . . . . . . . . . . 318
:STATus:QUEStionable:POWer:NTRansition? . . . . . . . . . . . . . . . . . . . . . . . . . . . . . . . . . . . . . . . . . . . . . . . . . . . 318
:STATus:QUEStionable:POWer:PTRansition <integer> . . . . . . . . . . . . . . . . . . . . . . . . . . . . . . . . . . . . . . . . . . . . 318
:STATus:QUEStionable:POWer:PTRansition? . . . . . . . . . . . . . . . . . . . . . . . . . . . . . . . . . . . . . . . . . . . . . . . . . . . 318
:STATus:QUEStionable:POWer[:EVENt]? . . . . . . . . . . . . . . . . . . . . . . . . . . . . . . . . . . . . . . . . . . . . . . . . . . . . . . 317
:STATus:QUEStionable:PTRansition <integer> . . . . . . . . . . . . . . . . . . . . . . . . . . . . . . . . . . . . . . . . . . . . . . . . . . 318
:STATus:QUEStionable:PTRansition? . . . . . . . . . . . . . . . . . . . . . . . . . . . . . . . . . . . . . . . . . . . . . . . . . . . . . . . . . . 318
:STATus:QUEStionable[:EVENt]? . . . . . . . . . . . . . . . . . . . . . . . . . . . . . . . . . . . . . . . . . . . . . . . . . . . . . . . . . . . . 312
:SYSTem:COMMunicate:GPIB[1][:SELF]:ADDRess <integer>. . . . . . . . . . . . . . . . . . . . . . . . . . . . . . . . . . . . . 319
:SYSTem:COMMunicate:GPIB[1][:SELF]:ADDRess? . . . . . . . . . . . . . . . . . . . . . . . . . . . . . . . . . . . . . . . . . . . . 319
:SYSTem:COMMunicate:SERial[1]:CONTrol:DTR OFF|ON|IBFull . . . . . . . . . . . . . . . . . . . . . . . . . . . . . . . . . 319
:SYSTem:COMMunicate:SERial[1]:CONTrol:DTR?. . . . . . . . . . . . . . . . . . . . . . . . . . . . . . . . . . . . . . . . . . . . . . 319
:SYSTem:COMMunicate:SERial[1]:CONTrol:RTS OFF|ON|IBFull . . . . . . . . . . . . . . . . . . . . . . . . . . . . . . . . . . 320
:SYSTem:COMMunicate:SERial[1]:CONTrol:RTS? . . . . . . . . . . . . . . . . . . . . . . . . . . . . . . . . . . . . . . . . . . . . . . 320
:SYSTem:COMMunicate:SERial[1]:TRANsmit:PACE XON|NONE . . . . . . . . . . . . . . . . . . . . . . . . . . . . . . . . . 321
:SYSTem:COMMunicate:SERial[1]:TRANsmit:PACE? . . . . . . . . . . . . . . . . . . . . . . . . . . . . . . . . . . . . . . . . . . . 321
:SYSTem:COMMunicate:SERial[1][:RECeive]:BAUD <baud_rate> . . . . . . . . . . . . . . . . . . . . . . . . . . . . . . . . . 320
:SYSTem:COMMunicate:SERial[1][:RECeive]:BAUD? . . . . . . . . . . . . . . . . . . . . . . . . . . . . . . . . . . . . . . . . . . . 320
:SYSTem:COMMunicate:SERial[1][:RECeive]:PACE XON|NONE . . . . . . . . . . . . . . . . . . . . . . . . . . . . . . . . . . 321
:SYSTem:COMMunicate:SERial[1][:RECeive]:PACE? . . . . . . . . . . . . . . . . . . . . . . . . . . . . . . . . . . . . . . . . . . . . 321
:SYSTem:CONFigure:HARDware:STATe OFF|ON|0|1 . . . . . . . . . . . . . . . . . . . . . . . . . . . . . . . . . . . . . . . . . . . . 321
:SYSTem:CONFigure:HARDware:STATe? . . . . . . . . . . . . . . . . . . . . . . . . . . . . . . . . . . . . . . . . . . . . . . . . . . . . . 321
:SYSTem:CONFigure:HARDware? . . . . . . . . . . . . . . . . . . . . . . . . . . . . . . . . . . . . . . . . . . . . . . . . . . . . . . . . . . . 321
:SYSTem:CONFigure[:SYSTem]:STATe OFF|ON|0|1 . . . . . . . . . . . . . . . . . . . . . . . . . . . . . . . . . . . . . . . . . . . . . 322
:SYSTem:CONFigure[:SYSTem]:STATe? . . . . . . . . . . . . . . . . . . . . . . . . . . . . . . . . . . . . . . . . . . . . . . . . . . . . . . 322
:SYSTem:CONFigure[:SYSTem]? . . . . . . . . . . . . . . . . . . . . . . . . . . . . . . . . . . . . . . . . . . . . . . . . . . . . . . . . . . . . 322
:SYSTem:DATE <year>,<month>,<day> . . . . . . . . . . . . . . . . . . . . . . . . . . . . . . . . . . . . . . . . . . . . . . . . . . . . . . . 322
:SYSTem:DATE? . . . . . . . . . . . . . . . . . . . . . . . . . . . . . . . . . . . . . . . . . . . . . . . . . . . . . . . . . . . . . . . . . . . . . . . . . . 322
:SYSTem:ERRor:VERBose OFF|ON|0|1 . . . . . . . . . . . . . . . . . . . . . . . . . . . . . . . . . . . . . . . . . . . . . . . . . . . . . . . 323
:SYSTem:ERRor:VERBose? . . . . . . . . . . . . . . . . . . . . . . . . . . . . . . . . . . . . . . . . . . . . . . . . . . . . . . . . . . . . . . . . . 323
:SYSTem:ERRor[:NEXT]? . . . . . . . . . . . . . . . . . . . . . . . . . . . . . . . . . . . . . . . . . . . . . . . . . . . . . . . . . . . . . . . . . . 322
28
Page 29

Commands
Alphabetical Listing
:SYSTem:HID?. . . . . . . . . . . . . . . . . . . . . . . . . . . . . . . . . . . . . . . . . . . . . . . . . . . . . . . . . . . . . . . . . . . . . . . . . . . . 323
:SYSTem:LKEY <“option”>, <“license key”> . . . . . . . . . . . . . . . . . . . . . . . . . . . . . . . . . . . . . . . . . . . . . . . . . . . 324
:SYSTem:LKEY:DELete <“option”> . . . . . . . . . . . . . . . . . . . . . . . . . . . . . . . . . . . . . . . . . . . . . . . . . . . . . . . . . . 324
:SYSTem:LKEY? <“option”> . . . . . . . . . . . . . . . . . . . . . . . . . . . . . . . . . . . . . . . . . . . . . . . . . . . . . . . . . . . . . . . . 324
:SYSTem:OPTions? . . . . . . . . . . . . . . . . . . . . . . . . . . . . . . . . . . . . . . . . . . . . . . . . . . . . . . . . . . . . . . . . . . . . . . . . 324
:SYSTem:PON:ETIMe? . . . . . . . . . . . . . . . . . . . . . . . . . . . . . . . . . . . . . . . . . . . . . . . . . . . . . . . . . . . . . . . . . . . . . 325
:SYSTem:PON:TIME? . . . . . . . . . . . . . . . . . . . . . . . . . . . . . . . . . . . . . . . . . . . . . . . . . . . . . . . . . . . . . . . . . . . . . . 325
:SYSTem:PON:TYPE PRESet|LAST . . . . . . . . . . . . . . . . . . . . . . . . . . . . . . . . . . . . . . . . . . . . . . . . . . . . . . . . . . 325
:SYSTem:PON:TYPE?. . . . . . . . . . . . . . . . . . . . . . . . . . . . . . . . . . . . . . . . . . . . . . . . . . . . . . . . . . . . . . . . . . . . . . 325
:SYSTem:PRESet . . . . . . . . . . . . . . . . . . . . . . . . . . . . . . . . . . . . . . . . . . . . . . . . . . . . . . . . . . . . . . . . . . . . . . . . . . 326
:SYSTem:PRESet:PERSistent . . . . . . . . . . . . . . . . . . . . . . . . . . . . . . . . . . . . . . . . . . . . . . . . . . . . . . . . . . . . . . . . 319
:SYSTem:PRESet:PERSistent . . . . . . . . . . . . . . . . . . . . . . . . . . . . . . . . . . . . . . . . . . . . . . . . . . . . . . . . . . . . . . . . 326
:SYSTem:PRESet:TYPE FACTory|USER. . . . . . . . . . . . . . . . . . . . . . . . . . . . . . . . . . . . . . . . . . . . . . . . . . . . . . . 325
:SYSTem:PRESet:TYPE FACTory|USER|MODE . . . . . . . . . . . . . . . . . . . . . . . . . . . . . . . . . . . . . . . . . . . . . . . . 326
:SYSTem:PRESet[:USER]:SAVE . . . . . . . . . . . . . . . . . . . . . . . . . . . . . . . . . . . . . . . . . . . . . . . . . . . . . . . . . . . . . 327
:SYSTem:SPEaker[:STATe] OFF|ON|0|1. . . . . . . . . . . . . . . . . . . . . . . . . . . . . . . . . . . . . . . . . . . . . . . . . . . . . . . . 327
:SYSTem:SPEaker[:STATe]? . . . . . . . . . . . . . . . . . . . . . . . . . . . . . . . . . . . . . . . . . . . . . . . . . . . . . . . . . . . . . . . . . 327
:SYSTem:TIME <hour>,<minute>,<second> . . . . . . . . . . . . . . . . . . . . . . . . . . . . . . . . . . . . . . . . . . . . . . . . . . . . 327
:SYSTem:TIME? . . . . . . . . . . . . . . . . . . . . . . . . . . . . . . . . . . . . . . . . . . . . . . . . . . . . . . . . . . . . . . . . . . . . . . . . . . 327
:SYSTem:VERSion? . . . . . . . . . . . . . . . . . . . . . . . . . . . . . . . . . . . . . . . . . . . . . . . . . . . . . . . . . . . . . . . . . . . . . . . 327
:TRACe:COPY <source_trace>,<dest_trace> . . . . . . . . . . . . . . . . . . . . . . . . . . . . . . . . . . . . . . . . . . . . . . . . . . . . 328
:TRACe:EXCHange <trace_1>,<trace_2> . . . . . . . . . . . . . . . . . . . . . . . . . . . . . . . . . . . . . . . . . . . . . . . . . . . . . . 329
:TRACe:MATH:ADD <destination_trace>,<source_trace1>,<source_trace2> . . . . . . . . . . . . . . . . . . . . . . . . . . 329
:TRACe:MATH:MEAN? <trace> . . . . . . . . . . . . . . . . . . . . . . . . . . . . . . . . . . . . . . . . . . . . . . . . . . . . . . . . . . . . . 330
:TRACe:MATH:PEAK:POINts? . . . . . . . . . . . . . . . . . . . . . . . . . . . . . . . . . . . . . . . . . . . . . . . . . . . . . . . . . . . . . . 330
:TRACe:MATH:PEAK:SORT AMPLitude|FREQuency. . . . . . . . . . . . . . . . . . . . . . . . . . . . . . . . . . . . . . . . . . . . 330
:TRACe:MATH:PEAK:SORT? . . . . . . . . . . . . . . . . . . . . . . . . . . . . . . . . . . . . . . . . . . . . . . . . . . . . . . . . . . . . . . . 330
:TRACe:MATH:PEAK[:DATA]?. . . . . . . . . . . . . . . . . . . . . . . . . . . . . . . . . . . . . . . . . . . . . . . . . . . . . . . . . . . . . . 330
:TRACe:MATH:SMOoth <trace> . . . . . . . . . . . . . . . . . . . . . . . . . . . . . . . . . . . . . . . . . . . . . . . . . . . . . . . . . . . . . 330
:TRACe:MATH:SMOoth:POINts <integer> . . . . . . . . . . . . . . . . . . . . . . . . . . . . . . . . . . . . . . . . . . . . . . . . . . . . . 332
:TRACe:MATH:SMOoth:POINts? . . . . . . . . . . . . . . . . . . . . . . . . . . . . . . . . . . . . . . . . . . . . . . . . . . . . . . . . . . . . 332
29
Page 30

Commands
Alphabetical Listing
:TRACe:MATH:SUBTract <destination_trace>,<source_trace1>,<source_trace2> . . . . . . . . . . . . . . . . . . . . . . 332
:TRACe:MATH:SUBTract:DLINe <trace> . . . . . . . . . . . . . . . . . . . . . . . . . . . . . . . . . . . . . . . . . . . . . . . . . . . . . . 333
:TRACe[:DATA] <trace_name>|RAWTRACE,<definite_length_
block>|<comma_separated_ASCII_data> . . . . . . . . . . . . . . . . . . . . . . . . . . . . . . . . . . . . . . . . . . . . . . . . . . . . . . . 328
:TRACe[:DATA]? <trace_name> . . . . . . . . . . . . . . . . . . . . . . . . . . . . . . . . . . . . . . . . . . . . . . . . . . . . . . . . . . . . . 328
:TRACe1|2|3:MODE WRITe|MAXHold|MINHold|VIEW|BLANk . . . . . . . . . . . . . . . . . . . . . . . . . . . . . . . . . . . 333
:TRACe1|2|3:MODE? . . . . . . . . . . . . . . . . . . . . . . . . . . . . . . . . . . . . . . . . . . . . . . . . . . . . . . . . . . . . . . . . . . . . . . 333
:TRIG:SEQ:OFFS 1.0s . . . . . . . . . . . . . . . . . . . . . . . . . . . . . . . . . . . . . . . . . . . . . . . . . . . . . . . . . . . . . . . . . . . . . 335
:TRIGger[:SEQuence]:DELay . . . . . . . . . . . . . . . . . . . . . . . . . . . . . . . . . . . . . . . . . . . . . . . . . . . . . . . . . . . . . . . . 334
:TRIGger[:SEQuence]:DELay:STATe OFF|ON|0|1 . . . . . . . . . . . . . . . . . . . . . . . . . . . . . . . . . . . . . . . . . . . . . . . 334
:TRIGger[:SEQuence]:DELay:STATe? . . . . . . . . . . . . . . . . . . . . . . . . . . . . . . . . . . . . . . . . . . . . . . . . . . . . . . . . . 334
:TRIGger[:SEQuence]:DELay? . . . . . . . . . . . . . . . . . . . . . . . . . . . . . . . . . . . . . . . . . . . . . . . . . . . . . . . . . . . . . . . 334
:TRIGger[:SEQuence]:EXTernal[1]:SLOPe POSitive|NEGative . . . . . . . . . . . . . . . . . . . . . . . . . . . . . . . . . . . . . 334
:TRIGger[:SEQuence]:EXTernal[1]:SLOPe? . . . . . . . . . . . . . . . . . . . . . . . . . . . . . . . . . . . . . . . . . . . . . . . . . . . . 334
:TRIGger[:SEQuence]:OFFSet <64 bit floating point value>. . . . . . . . . . . . . . . . . . . . . . . . . . . . . . . . . . . . . . . . 335
:TRIGger[:SEQuence]:OFFSet? . . . . . . . . . . . . . . . . . . . . . . . . . . . . . . . . . . . . . . . . . . . . . . . . . . . . . . . . . . . . . . 335
:TRIGger[:SEQuence]:SOURce IMMediate|VIDeo|LINE|EXTernal . . . . . . . . . . . . . . . . . . . . . . . . . . . . . . . . . . 336
:TRIGger[:SEQuence]:SOURce? . . . . . . . . . . . . . . . . . . . . . . . . . . . . . . . . . . . . . . . . . . . . . . . . . . . . . . . . . . . . . 336
:TRIGger[:SEQuence]:VIDeo:LEVel <ampl>. . . . . . . . . . . . . . . . . . . . . . . . . . . . . . . . . . . . . . . . . . . . . . . . . . . . 336
:TRIGger[:SEQuence]:VIDeo:LEVel:FREQuency . . . . . . . . . . . . . . . . . . . . . . . . . . . . . . . . . . . . . . . . . . . . . . . . 337
:TRIGger[:SEQuence]:VIDeo:LEVel:FREQuency? . . . . . . . . . . . . . . . . . . . . . . . . . . . . . . . . . . . . . . . . . . . . . . . 337
:TRIGger[:SEQuence]:VIDeo:LEVel? . . . . . . . . . . . . . . . . . . . . . . . . . . . . . . . . . . . . . . . . . . . . . . . . . . . . . . . . . 336
:UNIT:POWer DBM|DBMV|DBUV|DBUA|V|W|A . . . . . . . . . . . . . . . . . . . . . . . . . . . . . . . . . . . . . . . . . . . . . . . 338
:UNIT:POWer?. . . . . . . . . . . . . . . . . . . . . . . . . . . . . . . . . . . . . . . . . . . . . . . . . . . . . . . . . . . . . . . . . . . . . . . . . . . . 338
[:SENSe]:AVERage:CLEar . . . . . . . . . . . . . . . . . . . . . . . . . . . . . . . . . . . . . . . . . . . . . . . . . . . . . . . . . . . . . . . . . . 269
[:SENSe]:AVERage:COUNt <integer> . . . . . . . . . . . . . . . . . . . . . . . . . . . . . . . . . . . . . . . . . . . . . . . . . . . . . . . . . 269
[:SENSe]:AVERage:COUNt? . . . . . . . . . . . . . . . . . . . . . . . . . . . . . . . . . . . . . . . . . . . . . . . . . . . . . . . . . . . . . . . . 269
[:SENSe]:AVERage:TYPE VIDeo|RMS . . . . . . . . . . . . . . . . . . . . . . . . . . . . . . . . . . . . . . . . . . . . . . . . . . . . . . . . 271
[:SENSe]:AVERage:TYPE:AUTO OFF|ON|0|1 . . . . . . . . . . . . . . . . . . . . . . . . . . . . . . . . . . . . . . . . . . . . . . . . . . 270
[:SENSe]:AVERage:TYPE:AUTO? . . . . . . . . . . . . . . . . . . . . . . . . . . . . . . . . . . . . . . . . . . . . . . . . . . . . . . . . . . . 270
[:SENSe]:AVERage:TYPE? . . . . . . . . . . . . . . . . . . . . . . . . . . . . . . . . . . . . . . . . . . . . . . . . . . . . . . . . . . . . . . . . . 271
30
Page 31

Commands
Alphabetical Listing
[:SENSe]:AVERage:TYPE? . . . . . . . . . . . . . . . . . . . . . . . . . . . . . . . . . . . . . . . . . . . . . . . . . . . . . . . . . . . . . . . . . . 271
[:SENSe]:AVERage[:STATe] OFF|ON|0|1. . . . . . . . . . . . . . . . . . . . . . . . . . . . . . . . . . . . . . . . . . . . . . . . . . . . . . . 269
[:SENSe]:AVERage[:STATe]? . . . . . . . . . . . . . . . . . . . . . . . . . . . . . . . . . . . . . . . . . . . . . . . . . . . . . . . . . . . . . . . . 269
[:SENSe]:BANDwidth:TYPE IMPulse|DB6|DB3. . . . . . . . . . . . . . . . . . . . . . . . . . . . . . . . . . . . . . . . . . . . . . . . . 275
[:SENSe]:BANDwidth:TYPE? . . . . . . . . . . . . . . . . . . . . . . . . . . . . . . . . . . . . . . . . . . . . . . . . . . . . . . . . . . . . . . . 275
[:SENSe]:BANDwidth|BWIDth:VIDeo <freq>. . . . . . . . . . . . . . . . . . . . . . . . . . . . . . . . . . . . . . . . . . . . . . . . . . . 273
[:SENSe]:BANDwidth|BWIDth:VIDeo:AUTO OFF|ON|0|1 . . . . . . . . . . . . . . . . . . . . . . . . . . . . . . . . . . . . . . . . 273
[:SENSe]:BANDwidth|BWIDth:VIDeo:AUTO? . . . . . . . . . . . . . . . . . . . . . . . . . . . . . . . . . . . . . . . . . . . . . . . . . . 273
[:SENSe]:BANDwidth|BWIDth:VIDeo:RATio <number> . . . . . . . . . . . . . . . . . . . . . . . . . . . . . . . . . . . . . . . . . . 273
[:SENSe]:BANDwidth|BWIDth:VIDeo:RATio:AUTO OFF|ON|0|1 . . . . . . . . . . . . . . . . . . . . . . . . . . . . . . . . . . 273
[:SENSe]:BANDwidth|BWIDth:VIDeo:RATio:AUTO? . . . . . . . . . . . . . . . . . . . . . . . . . . . . . . . . . . . . . . . . . . . . 273
[:SENSe]:BANDwidth|BWIDth:VIDeo:RATio? . . . . . . . . . . . . . . . . . . . . . . . . . . . . . . . . . . . . . . . . . . . . . . . . . . 273
[:SENSe]:BANDwidth|BWIDth:VIDeo?. . . . . . . . . . . . . . . . . . . . . . . . . . . . . . . . . . . . . . . . . . . . . . . . . . . . . . . . 273
[:SENSe]:BANDwidth|BWIDth[:RESolution] <freq> . . . . . . . . . . . . . . . . . . . . . . . . . . . . . . . . . . . . . . . . . . . . . 272
[:SENSe]:BANDwidth|BWIDth[:RESolution]:AUTO OFF|ON|0|1 . . . . . . . . . . . . . . . . . . . . . . . . . . . . . . . . . . . 272
[:SENSe]:BANDwidth|BWIDth[:RESolution]:AUTO? . . . . . . . . . . . . . . . . . . . . . . . . . . . . . . . . . . . . . . . . . . . . 272
[:SENSe]:BANDwidth|BWIDth[:RESolution]:MODE EMI|SAN|OFF . . . . . . . . . . . . . . . . . . . . . . . . . . . . . . . . 272
[:SENSe]:BANDwidth|BWIDth[:RESolution]:MODE? . . . . . . . . . . . . . . . . . . . . . . . . . . . . . . . . . . . . . . . . . . . . 272
[:SENSe]:BANDwidth|BWIDth[:RESolution]? . . . . . . . . . . . . . . . . . . . . . . . . . . . . . . . . . . . . . . . . . . . . . . . . . . 272
[:SENSe]:CORRection:CSET:ALL:DELete . . . . . . . . . . . . . . . . . . . . . . . . . . . . . . . . . . . . . . . . . . . . . . . . . . . . . 276
[:SENSe]:CORRection:CSET:ALL[:STATe] OFF|ON|0|1 . . . . . . . . . . . . . . . . . . . . . . . . . . . . . . . . . . . . . . . . . . 276
[:SENSe]:CORRection:CSET:ALL[:STATe]? . . . . . . . . . . . . . . . . . . . . . . . . . . . . . . . . . . . . . . . . . . . . . . . . . . . . 276
[:SENSe]:CORRection:CSET[1]|2|3|4:DATA <freq>,<rel_ampl>{,<freq>,<rel_ampl>} . . . . . . . . . . . . . . . . . . 276
[:SENSe]:CORRection:CSET[1]|2|3|4:DATA:MERGe <freq>,<rel_ampl>{,<freq>,<rel_ampl>} . . . . . . . . . . . 277
[:SENSe]:CORRection:CSET[1]|2|3|4:DATA? . . . . . . . . . . . . . . . . . . . . . . . . . . . . . . . . . . . . . . . . . . . . . . . . . . . 276
[:SENSe]:CORRection:CSET[1]|2|3|4:DELete . . . . . . . . . . . . . . . . . . . . . . . . . . . . . . . . . . . . . . . . . . . . . . . . . . . 278
[:SENSe]:CORRection:CSET[1]|2|3|4:X:SPACing LINear|LOGarithmic . . . . . . . . . . . . . . . . . . . . . . . . . . . . . . 278
[:SENSe]:CORRection:CSET[1]|2|3|4[:STATe] OFF|ON|0|1 . . . . . . . . . . . . . . . . . . . . . . . . . . . . . . . . . . . . . . . . 278
[:SENSe]:CORRection:CSET[1]|2|3|4[:STATe]?. . . . . . . . . . . . . . . . . . . . . . . . . . . . . . . . . . . . . . . . . . . . . . . . . . 278
[:SENSe]:CORRection:IMPedance[:INPut][:MAGNitude] <number>. . . . . . . . . . . . . . . . . . . . . . . . . . . . . . . . . 279
[:SENSe]:CORRection:IMPedance[:INPut][:MAGNitude]?. . . . . . . . . . . . . . . . . . . . . . . . . . . . . . . . . . . . . . . . . 279
31
Page 32

Commands
Alphabetical Listing
[:SENSe]:CORRection:OFFSet[:MAGNitude]. . . . . . . . . . . . . . . . . . . . . . . . . . . . . . . . . . . . . . . . . . . . . . . . . . . 279
[:SENSe]:CORRection:OFFSet[:MAGNitude]? . . . . . . . . . . . . . . . . . . . . . . . . . . . . . . . . . . . . . . . . . . . . . . . . . . 279
[:SENSe]:DEMod AM|FM . . . . . . . . . . . . . . . . . . . . . . . . . . . . . . . . . . . . . . . . . . . . . . . . . . . . . . . . . . . . . . . . . . 280
[:SENSe]:DEMod:FMDeviation <freq> . . . . . . . . . . . . . . . . . . . . . . . . . . . . . . . . . . . . . . . . . . . . . . . . . . . . . . . . 280
[:SENSe]:DEMod:FMDeviation? . . . . . . . . . . . . . . . . . . . . . . . . . . . . . . . . . . . . . . . . . . . . . . . . . . . . . . . . . . . . . 280
[:SENSe]:DEMod:SQUelch <integer> . . . . . . . . . . . . . . . . . . . . . . . . . . . . . . . . . . . . . . . . . . . . . . . . . . . . . . . . . 280
[:SENSe]:DEMod:STATe OFF|ON|0|1 . . . . . . . . . . . . . . . . . . . . . . . . . . . . . . . . . . . . . . . . . . . . . . . . . . . . . . . . . 281
[:SENSe]:DEMod:STATe?. . . . . . . . . . . . . . . . . . . . . . . . . . . . . . . . . . . . . . . . . . . . . . . . . . . . . . . . . . . . . . . . . . . 281
[:SENSe]:DEMod:TIME <time> . . . . . . . . . . . . . . . . . . . . . . . . . . . . . . . . . . . . . . . . . . . . . . . . . . . . . . . . . . . . . . 281
[:SENSe]:DEMod:TIME? . . . . . . . . . . . . . . . . . . . . . . . . . . . . . . . . . . . . . . . . . . . . . . . . . . . . . . . . . . . . . . . . . . . 281
[:SENSe]:DEMod?. . . . . . . . . . . . . . . . . . . . . . . . . . . . . . . . . . . . . . . . . . . . . . . . . . . . . . . . . . . . . . . . . . . . . . . . . 280
[:SENSe]:DETector:AUTO OFF|ON|0|1 . . . . . . . . . . . . . . . . . . . . . . . . . . . . . . . . . . . . . . . . . . . . . . . . . . . . . . . . 282
[:SENSe]:DETector:AUTO? . . . . . . . . . . . . . . . . . . . . . . . . . . . . . . . . . . . . . . . . . . . . . . . . . . . . . . . . . . . . . . . . . 282
[:SENSe]:DETector:RANGe:IMMediate . . . . . . . . . . . . . . . . . . . . . . . . . . . . . . . . . . . . . . . . . . . . . . . . . . . . . . . 286
[:SENSe]:DETector:RANGe:IMMediate . . . . . . . . . . . . . . . . . . . . . . . . . . . . . . . . . . . . . . . . . . . . . . . . . . . . . . . 286
[:SENSe]:DETector[:FUNCtion] NEGative|POSitive|SAMPle|AVERage|RMS . . . . . . . . . . . . . . . . . . . . . . . . . 284
[:SENSe]:DETector[:FUNCtion]: EMI QPEak|AVERage|OFF . . . . . . . . . . . . . . . . . . . . . . . . . . . . . . . . . . . . . . 285
[:SENSe]:DETector[:FUNCtion]:EMI? . . . . . . . . . . . . . . . . . . . . . . . . . . . . . . . . . . . . . . . . . . . . . . . . . . . . . . . . . 285
[:SENSe]:DETector[:FUNCtion]? . . . . . . . . . . . . . . . . . . . . . . . . . . . . . . . . . . . . . . . . . . . . . . . . . . . . . . . . . . . . . 284
[:SENSe]:DETector[:FUNCtion]EMI:VIEW POSitive|EMI. . . . . . . . . . . . . . . . . . . . . . . . . . . . . . . . . . . . . . . . . 286
[:SENSe]:DETector[:FUNCtion]EMI:VIEW? . . . . . . . . . . . . . . . . . . . . . . . . . . . . . . . . . . . . . . . . . . . . . . . . . . . 286
[:SENSe]:DETector[:UNRange] . . . . . . . . . . . . . . . . . . . . . . . . . . . . . . . . . . . . . . . . . . . . . . . . . . . . . . . . . . . . . . 286
[:SENSe]:EMI:MEASure:DETector:AVERage:DWELl<time> . . . . . . . . . . . . . . . . . . . . . . . . . . . . . . . . . . . . . . 288
[:SENSe]:EMI:MEASure:DETector:AVERage:DWELl? . . . . . . . . . . . . . . . . . . . . . . . . . . . . . . . . . . . . . . . . . . . 288
[:SENSe]:EMI:MEASure:DETector:AVERage? . . . . . . . . . . . . . . . . . . . . . . . . . . . . . . . . . . . . . . . . . . . . . . . . . . 287
[:SENSe]:EMI:MEASure:DETector:AVERage[STATe] OFF|ON|0|1 . . . . . . . . . . . . . . . . . . . . . . . . . . . . . . . . . . 287
[:SENSe]:EMI:MEASure:DETector:PPEak:DWELl<time> . . . . . . . . . . . . . . . . . . . . . . . . . . . . . . . . . . . . . . . . . 288
[:SENSe]:EMI:MEASure:DETector:PPEak:DWELl?. . . . . . . . . . . . . . . . . . . . . . . . . . . . . . . . . . . . . . . . . . . . . . 288
[:SENSe]:EMI:MEASure:DETector:PPEak? . . . . . . . . . . . . . . . . . . . . . . . . . . . . . . . . . . . . . . . . . . . . . . . . . . . . 287
[:SENSe]:EMI:MEASure:DETector:PPEak[STATe]OFF|ON|0|1| . . . . . . . . . . . . . . . . . . . . . . . . . . . . . . . . . . . . 287
[:SENSe]:EMI:MEASure:DETector:QPEak:DWELl<time> . . . . . . . . . . . . . . . . . . . . . . . . . . . . . . . . . . . . . . . . 288
32
Page 33

Commands
Alphabetical Listing
[:SENSe]:EMI:MEASure:DETector:QPEak:DWELl? . . . . . . . . . . . . . . . . . . . . . . . . . . . . . . . . . . . . . . . . . . . . . 288
[:SENSe]:EMI:MEASure:DETector:QPEak? . . . . . . . . . . . . . . . . . . . . . . . . . . . . . . . . . . . . . . . . . . . . . . . . . . . . 287
[:SENSe]:EMI:MEASure:DETector:QPEak[STATe]OFF|ON|0|1| . . . . . . . . . . . . . . . . . . . . . . . . . . . . . . . . . . . . 287
[:SENSe]:EMI:MEASure:PCENter[:STATe] OFF|ON|0|1 . . . . . . . . . . . . . . . . . . . . . . . . . . . . . . . . . . . . . . . . . . 288
[:SENSe]:EMI:MEASure:PCENter[:STATe]? . . . . . . . . . . . . . . . . . . . . . . . . . . . . . . . . . . . . . . . . . . . . . . . . . . . . 288
[:SENSe]:EMI:MEASure:PEAKs:SGTMargin? . . . . . . . . . . . . . . . . . . . . . . . . . . . . . . . . . . . . . . . . . . . . . . . . . . 289
[:SENSe]:EMI:MEASure:PEAKs:SGTMargin[:STATe]ON|OFF|1|0 . . . . . . . . . . . . . . . . . . . . . . . . . . . . . . . . . . 289
[:SENSe]:EMI:MEASure:RANGe:DWELl<time> . . . . . . . . . . . . . . . . . . . . . . . . . . . . . . . . . . . . . . . . . . . . . . . . 289
[:SENSe]:EMI:MEASure:RANGe:DWELl? . . . . . . . . . . . . . . . . . . . . . . . . . . . . . . . . . . . . . . . . . . . . . . . . . . . . . 289
[:SENSe]:FREQuency:CENTer <freq> . . . . . . . . . . . . . . . . . . . . . . . . . . . . . . . . . . . . . . . . . . . . . . . . . . . . . . . . . 290
[:SENSe]:FREQuency:CENTer UP|DOWN . . . . . . . . . . . . . . . . . . . . . . . . . . . . . . . . . . . . . . . . . . . . . . . . . . . . . 290
[:SENSe]:FREQuency:CENTer:STEP:AUTO OFF|ON|0|1 . . . . . . . . . . . . . . . . . . . . . . . . . . . . . . . . . . . . . . . . . 290
[:SENSe]:FREQuency:CENTer:STEP:AUTO? . . . . . . . . . . . . . . . . . . . . . . . . . . . . . . . . . . . . . . . . . . . . . . . . . . . 290
[:SENSe]:FREQuency:CENTer:STEP[:INCRement] <freq> . . . . . . . . . . . . . . . . . . . . . . . . . . . . . . . . . . . . . . . . 291
[:SENSe]:FREQuency:CENTer:STEP[:INCRement]? . . . . . . . . . . . . . . . . . . . . . . . . . . . . . . . . . . . . . . . . . . . . . 291
[:SENSe]:FREQuency:CENTer? . . . . . . . . . . . . . . . . . . . . . . . . . . . . . . . . . . . . . . . . . . . . . . . . . . . . . . . . . . . . . . 290
[:SENSe]:FREQuency:SPAN <freq> . . . . . . . . . . . . . . . . . . . . . . . . . . . . . . . . . . . . . . . . . . . . . . . . . . . . . . . . . . . 291
[:SENSe]:FREQuency:SPAN:FULL . . . . . . . . . . . . . . . . . . . . . . . . . . . . . . . . . . . . . . . . . . . . . . . . . . . . . . . . . . . 292
[:SENSe]:FREQuency:SPAN:PREVious . . . . . . . . . . . . . . . . . . . . . . . . . . . . . . . . . . . . . . . . . . . . . . . . . . . . . . . . 292
[:SENSe]:FREQuency:SPAN? . . . . . . . . . . . . . . . . . . . . . . . . . . . . . . . . . . . . . . . . . . . . . . . . . . . . . . . . . . . . . . . . 291
[:SENSe]:FREQuency:STARt <freq> . . . . . . . . . . . . . . . . . . . . . . . . . . . . . . . . . . . . . . . . . . . . . . . . . . . . . . . . . . 292
[:SENSe]:FREQuency:STARt? . . . . . . . . . . . . . . . . . . . . . . . . . . . . . . . . . . . . . . . . . . . . . . . . . . . . . . . . . . . . . . . 292
[:SENSe]:FREQuency:STOP <freq> . . . . . . . . . . . . . . . . . . . . . . . . . . . . . . . . . . . . . . . . . . . . . . . . . . . . . . . . . . . 293
[:SENSe]:FREQuency:STOP? . . . . . . . . . . . . . . . . . . . . . . . . . . . . . . . . . . . . . . . . . . . . . . . . . . . . . . . . . . . . . . . . 293
[:SENSe]:FREQuency:SYNThesis 1|2|3 . . . . . . . . . . . . . . . . . . . . . . . . . . . . . . . . . . . . . . . . . . . . . . . . . . . . . . . . 293
[:SENSe]:FREQuency:SYNThesis:AUTO OFF|ON|0|1 . . . . . . . . . . . . . . . . . . . . . . . . . . . . . . . . . . . . . . . . . . . . 294
[:SENSe]:FREQuency:SYNThesis:AUTO? . . . . . . . . . . . . . . . . . . . . . . . . . . . . . . . . . . . . . . . . . . . . . . . . . . . . . 294
[:SENSe]:FREQuency:SYNThesis?. . . . . . . . . . . . . . . . . . . . . . . . . . . . . . . . . . . . . . . . . . . . . . . . . . . . . . . . . . . . 293
[:SENSe]:POWer:QPGain[:STATe]? . . . . . . . . . . . . . . . . . . . . . . . . . . . . . . . . . . . . . . . . . . . . . . . . . . . . . . . . . . . 295
[:SENSe]:POWer:QPGain[:STATe]ON|OFF|1|0 . . . . . . . . . . . . . . . . . . . . . . . . . . . . . . . . . . . . . . . . . . . . . . . . . . 295
[:SENSe]:POWer[:RF]:ATTenuation <rel_ampl> . . . . . . . . . . . . . . . . . . . . . . . . . . . . . . . . . . . . . . . . . . . . . . . . . 295
33
Page 34

Commands
Alphabetical Listing
[:SENSe]:POWer[:RF]:ATTenuation:AUTO OFF|ON|0|1 . . . . . . . . . . . . . . . . . . . . . . . . . . . . . . . . . . . . . . . . . . 295
[:SENSe]:POWer[:RF]:ATTenuation:AUTO? . . . . . . . . . . . . . . . . . . . . . . . . . . . . . . . . . . . . . . . . . . . . . . . . . . . . 295
[:SENSe]:POWer[:RF]:ATTenuation? . . . . . . . . . . . . . . . . . . . . . . . . . . . . . . . . . . . . . . . . . . . . . . . . . . . . . . . . . . 295
[:SENSe]:POWer[:RF]:GAIN[:STATe] OFF|ON|0|1. . . . . . . . . . . . . . . . . . . . . . . . . . . . . . . . . . . . . . . . . . . . . . . 296
[:SENSe]:POWer[:RF]:GAIN[:STATe]? . . . . . . . . . . . . . . . . . . . . . . . . . . . . . . . . . . . . . . . . . . . . . . . . . . . . . . . . 296
[:SENSe]:POWer[:RF]:MIXer:RANGe[:UPPer] <ampl>. . . . . . . . . . . . . . . . . . . . . . . . . . . . . . . . . . . . . . . . . . . 296
[:SENSe]:POWer[:RF]:MIXer:RANGe[:UPPer]?. . . . . . . . . . . . . . . . . . . . . . . . . . . . . . . . . . . . . . . . . . . . . . . . . 296
[:SENSe]:POWer[:RF]:PADJust <freq> . . . . . . . . . . . . . . . . . . . . . . . . . . . . . . . . . . . . . . . . . . . . . . . . . . . . . . . . 296
[:SENSe]:POWer[:RF]:PADJust? . . . . . . . . . . . . . . . . . . . . . . . . . . . . . . . . . . . . . . . . . . . . . . . . . . . . . . . . . . . . . 296
[:SENSe]:POWer[:RF]:PCENter . . . . . . . . . . . . . . . . . . . . . . . . . . . . . . . . . . . . . . . . . . . . . . . . . . . . . . . . . . . . . . 297
[:SENSe]:SWEep:POINts <number of points> . . . . . . . . . . . . . . . . . . . . . . . . . . . . . . . . . . . . . . . . . . . . . . . . . . . 298
[:SENSe]:SWEep:POINts? . . . . . . . . . . . . . . . . . . . . . . . . . . . . . . . . . . . . . . . . . . . . . . . . . . . . . . . . . . . . . . . . . . 298
[:SENSe]:SWEep:SPACing LINear|LOGarithmic . . . . . . . . . . . . . . . . . . . . . . . . . . . . . . . . . . . . . . . . . . . . . . . . 237
[:SENSe]:SWEep:SPACing LINear|LOGarithmic . . . . . . . . . . . . . . . . . . . . . . . . . . . . . . . . . . . . . . . . . . . . . . . . 298
[:SENSe]:SWEep:SPACing? . . . . . . . . . . . . . . . . . . . . . . . . . . . . . . . . . . . . . . . . . . . . . . . . . . . . . . . . . . . . . . . . . 298
[:SENSe]:SWEep:TIME <time> . . . . . . . . . . . . . . . . . . . . . . . . . . . . . . . . . . . . . . . . . . . . . . . . . . . . . . . . . . . . . . 299
[:SENSe]:SWEep:TIME:AUTO OFF|ON|0|1 . . . . . . . . . . . . . . . . . . . . . . . . . . . . . . . . . . . . . . . . . . . . . . . . . . . . 299
[:SENSe]:SWEep:TIME:AUTO:MODE SRESponse|SANalyzer. . . . . . . . . . . . . . . . . . . . . . . . . . . . . . . . . . . . . 300
[:SENSe]:SWEep:TIME:AUTO:MODE? . . . . . . . . . . . . . . . . . . . . . . . . . . . . . . . . . . . . . . . . . . . . . . . . . . . . . . . 300
[:SENSe]:SWEep:TIME:AUTO? . . . . . . . . . . . . . . . . . . . . . . . . . . . . . . . . . . . . . . . . . . . . . . . . . . . . . . . . . . . . . 299
[:SENSe]:SWEep:TIME:GATE:DELay <time> . . . . . . . . . . . . . . . . . . . . . . . . . . . . . . . . . . . . . . . . . . . . . . . . . . 300
[:SENSe]:SWEep:TIME:GATE:DELay? . . . . . . . . . . . . . . . . . . . . . . . . . . . . . . . . . . . . . . . . . . . . . . . . . . . . . . . 300
[:SENSe]:SWEep:TIME:GATE:LENGth <time> . . . . . . . . . . . . . . . . . . . . . . . . . . . . . . . . . . . . . . . . . . . . . . . . . 300
[:SENSe]:SWEep:TIME:GATE:LENGth? . . . . . . . . . . . . . . . . . . . . . . . . . . . . . . . . . . . . . . . . . . . . . . . . . . . . . . 300
[:SENSe]:SWEep:TIME:GATE:LEVel HIGH|LOW. . . . . . . . . . . . . . . . . . . . . . . . . . . . . . . . . . . . . . . . . . . . . . . 301
[:SENSe]:SWEep:TIME:GATE:LEVel? . . . . . . . . . . . . . . . . . . . . . . . . . . . . . . . . . . . . . . . . . . . . . . . . . . . . . . . . 301
[:SENSe]:SWEep:TIME:GATE:POLarity NEGative|POSitive. . . . . . . . . . . . . . . . . . . . . . . . . . . . . . . . . . . . . . . 301
[:SENSe]:SWEep:TIME:GATE:POLarity? . . . . . . . . . . . . . . . . . . . . . . . . . . . . . . . . . . . . . . . . . . . . . . . . . . . . . . 301
[:SENSe]:SWEep:TIME:GATE:PRESet . . . . . . . . . . . . . . . . . . . . . . . . . . . . . . . . . . . . . . . . . . . . . . . . . . . . . . . . 301
[:SENSe]:SWEep:TIME:GATE:TYPE LEVel|EDGE . . . . . . . . . . . . . . . . . . . . . . . . . . . . . . . . . . . . . . . . . . . . . . 302
[:SENSe]:SWEep:TIME:GATE:TYPE? . . . . . . . . . . . . . . . . . . . . . . . . . . . . . . . . . . . . . . . . . . . . . . . . . . . . . . . . 302
34
Page 35

Commands
Alphabetical Listing
[:SENSe]:SWEep:TIME:GATE[:STATe] OFF|ON|0|1 . . . . . . . . . . . . . . . . . . . . . . . . . . . . . . . . . . . . . . . . . . . . . 301
[:SENSe]:SWEep:TIME:GATE[:STATe]?. . . . . . . . . . . . . . . . . . . . . . . . . . . . . . . . . . . . . . . . . . . . . . . . . . . . . . . 301
[:SENSe]:SWEep:TIME? . . . . . . . . . . . . . . . . . . . . . . . . . . . . . . . . . . . . . . . . . . . . . . . . . . . . . . . . . . . . . . . . . . . . 299
35
Page 36

Commands
Alphabetical Listing
36
Page 37

1 Programming Fundamentals
The purpose of this chapter is to serve as a reminder of SCPI (Standard Commands
for Programmable Instruments) fundamentals to those who have previous
experience in programming SCPI. This chapter is not intended to teach you
everything about the SCPI programming language.
37
Page 38

Programming Fundamentals
The SCPI Consortium or IEEE can provide detailed information on the subject of
SCPI programming. Refer to IEEE Standard 488.1-1987, IEEE Standard Digital
Interface for Programmable Instrumentation. New York, NY, 1987, or to IEEE
Standard 488.2-1992, IEEE Standard Codes, Formats, Protocols and Common
Commands for Use with ANSI/IEEE Std 488.1-1987. New York, NY, 1992.
Valid EMC Analyzer SCPI commands are used for examples in this chapter.
Topics included in this chapter are:
• “Creating Valid Commands”
• “Command Notation Syntax”
• “Special Characters in Commands”
• “Parameters in Commands”
• “Improving Measurement Speed”
• “Putting Multiple Commands on the Same Line”
• “Overview of GPIB (Option A4H)”
• “Overview of RS-232 (Option 1AX)”
• “Printer Setup and Operation”
38 Chapter 1
Page 39

Creating Valid Commands
Commands are not case sensitive and there are often many different ways of
writing a particular command. These are examples of valid commands for a given
command syntax:
Command Syntax Sample Valid Commands
Programming Fundamentals
Creating Valid Commands
[:SENSe]:BANDwidth[:RESolution]
<freq>
:CALCulate:MARKer[1]|2|3|4:Y? The last command below returns different results than
[:SENSe]:DETector[:FUNCtion]
NEGative|POSitive|SAMPle
The following sample commands are all identical. They
will all cause the same result.
• :Sense:Band:Res 1700
• :BANDWIDTH:RESOLUTION 1.7e3
• :sens:band 1.7KHZ
• :SENS:band 1.7E3Hz
• :band 1.7kHz
• :bandwidth:RES 1.7e3Hz
the commands above it. The number 3 in the command
causes this. See the command description for more
information.
• :CALC:MARK:Y?
• :calc:mark:y?
• :CALC:MARK2:Y?
• DET:FUNC NEG
• :Sense:Detector:Function Sample
:INITiate:CONTinuous OFF|ON|0|1 The sample commands below are identical.
• :INIT:CONT ON
• :init:continuous 1
Chapter 1 39
Page 40

Programming Fundamentals
Command Notation Syntax
Command Notation Syntax
A typical command is made up of key words set off by colons. The key words are
followed by parameters that can be followed by optional units.
Example: :TRIGger:SEQuence:VIDeo:LEVel 2.5V
The instrument does not distinguish between upper and lower case letters. In the
documentation, upper case letters indicate the short form of the key word. The
upper and lower case letters, together, indicate the long form of the key word.
Either form may be used in the command.
Example: :Trig:Seq:Vid:Lev 2.5V is the same as
trigger:sequence:video:level 2.5V.
NOTE The command :TRIGG:Sequence:Video:Level 2.5V is not valid because
:TRIGG is neither the long, nor the short form of the command.
40 Chapter 1
Page 41

Special Characters in Commands
Programming Fundamentals
Special Characters in Commands
Special
Character
| A vertical stroke between
[ ] Key words in square brackets
Meaning Example
parameters indicates
alternative choices. The effect
of the command is different
depending on which parameter
is selected.
A vertical stroke between key
words indicates identical
effects exist for several key
words. Only one of these key
words is used at a time. The
command functions the same
for either key word.
are optional when composing
the command. These implied
key words will be executed
even if they are omitted.
Command:
[:SENSe]:DETector[:FUNCtion]
NEGative|POSitive|SAMPle
The choices are neg, pos, and samp.
:SENSe:DETector:FUNCtion SAMPle is one possible
command choice.
Command:
[:SENSe]:CHPower:BANDwidth|BWIDth:INTegrati
on
Two identical commands are:
:SENSe:CHPower:BANDwidth:INTegration
:SENSe:CHPower:BWIDth:INTegration
Command:
[SENSe:]BANDwidth[:RESolution]:AUTO
The following commands are all valid and have identical
effects:
:bandwidth:auto
:bandwidth:resolution:auto
:sense:bandwidth:auto
< > Angle brackets around a word,
or words, indicates they are not
to be used literally in the
command. They represent the
needed item.
{ } Parameters in braces can
optionally be used in the
command either not at all,
once, or several times.
Command:
:SENSe:FREQ <freq>
In this command example the word <freq> should be
replaced by an actual frequency:
:SENSe:FREQ 9.7 MHz
Command:
[SENSe:]CORRection:CSET[1]|2|3|4:DATA:MERGe
<freq>,<rel_ampl>{,<freq>,<rel_ampl>}
A valid form of this command is:
[SENSe:]CORRection:CSET1:DATA:MERGe
740000,.94 1250000,.31 3320000,1.7
Chapter 1 41
Page 42

Programming Fundamentals
Parameters in Commands
Parameters in Commands
There are four basic types of parameters: boolean, key words, variables and
arbitrary block program data.
Boolean
The expression OFF|ON|0|1 is a two state boolean-type parameter. The numeric
value 0 is equivalent to OFF. Any numeric value other than 0 is equivalent to ON.
The numeric values of 0 or 1 are commonly used in the command instead of OFF
or ON, and queries of the parameter always return a numeric value of 0 or 1.
Key Word
The parameter key words that are allowed for a particular command are defined in
the command description and are separated with a vertical slash.
Units
Numerical variables may include units. The valid units for a command depends on
the variable type being used. See the following variable descriptions. If no units are
sent, the indicated default units will be used. Units can follow the numerical value
with, or without, a space.
Variable
A variable can be entered in exponential format as well as standard numeric
format. The appropriate variable range and its optional units are defined in the
command description.
In addition to these values, the following key words may also be used in commands
where they are applicable.
MINimum - sets the parameter to the smallest possible value.
MAXimum - sets the parameter to the largest possible value.
UP - increments the parameter.
DOWN- decrements the parameter.
Include the key word MINimum or MAXimum after the question mark in a query
in order to return the numeric value of the key word.
Example query: [:SENSE]:FREQuency:CENTer? MAXimum
Variable Parameters
<ampl>,
<rel_ampl> The <ampl> (amplitude) parameter and the <rel_ampl> (relative
amplitude) parameter consist of a rational number followed by
optional units. Acceptable units for <ampl> include: V, mV, µV,
dBm, dBmV, dBµV, Watts, W. <rel_ampl> units are given in dB.
42 Chapter 1
Page 43

Programming Fundamentals
Parameters in Commands
<angle> An angle parameter is a rational number followed by optional
units. The default units are degrees. Acceptable units include:
DEG, RAD.
<file_name> A file name parameter is the name of your file including the full
path. The back slash that follows the drive colon (C:\), usually
used in computer paths, is not used in the SCPI command string.
<freq> A frequency parameter is a positive rational number followed by
optional units. The default unit is Hz. Acceptable units include:
Hz, kHz, MHz, GHz.
<integer> There are no units associated with an integer parameter.
<number> A number parameter is a member of the set of positive or
negative intriguers and including zero. Fractional numbers are
included in the number parameter. There are no units associated
with a number parameter.
<percent> A percent parameter is a rational number between 0 and 100,
with no units.
<rel_power> A relative power parameter is a positive rational number
followed by optional units. The default units are dB. Acceptable
units are dB only.
<string> A string parameter includes a series of alpha numeric characters.
<time> A time parameter is a rational number followed by optional
units. The default units are seconds. Acceptable units include: S,
MS, US.
Block Program Data
Definite length arbitrary block response data is defined in section 8.7.9.2 of IEEE
Standard 488.2-1992, IEEE Standard Codes, Formats, Protocols and Common
Commands for Use with ANSI/IEEE Std 488.1-1987. New York, NY, 1992.
<definite_length_block> Allows data to be transmitted over the system
interface as a series of 8 bit data bytes. This
element is particularly useful for sending
large quantities of data, 8 bit extended ASCII
codes, or other data that are not able to be
directly displayed.
A definite length block of data starts with an
ASCII header that begins with # and indicates
how many additional data points are
following in the block. For example, if the
header is #512320, then interpret the header
as follows:
• The first digit in the header (5) represents
how many additional digits/bytes there are
in the header.
Chapter 1 43
Page 44

Programming Fundamentals
Parameters in Commands
• The numbers 12320 indicates 12
thousand, 3 hundred, 20 data bytes follow
the header.
• To determine how may points in the
block, divide 12320 by your selected data
format bytes/point. Divide by 8 for real
64, or 4 for real 32. In this example there
are 1540 points in the block if your
selected data format is real 64.
44 Chapter 1
Page 45

Programming Fundamentals
Improving Measurement Speed
Improving Measurement Speed
There are a number of things you can do in your programs to make them run faster:
“Turn off the display updates” on page 45.
“Use binary data format instead of ASCII” on page 46.
“Minimize the number of GPIB transactions.” on page 46.
“Avoid unnecessary use of *RST.” on page 47.
“Minimize DUT/instrument setup changes.” on page 47.
Turn off the display updates
:DISPlay:ENABle OFF turns off the display. Updating the display slows down
the measurement. For remote testing, since the computer is processing the data
rather than a person, there is no need to display the data on the analyzer screen.
Disable auto alignment
:CALibration:AUTO OFF disables the automatic alignment process of the
instrument. Automatic alignment processing occurs at the end of each sweep. In a
stable operating environment, automatic alignment consumes very little instrument
resources. However, in a high throughput application, any demand upon
instrument resources affects measurement update rate.
NOTE When auto alignment is off, the Align Now, All function should be performed
periodically. Refer to the appropriate “Specifications and Characteristics” chapter
in the Agilent Technologies EMC Analyzers Specifications Guide for more
information on how often to perform Align Now, All when the auto alignment is
off.
Use a fixed IF Gain range
In applications where narrow resolution bandwidths (< 1 kHz) are required and a
high dynamic range is not required,
:DISPlay:WINDow:TRACe:Y[SCALe]:LOG:RANGe:AUTO OFF disables auto
ranging and results in increased measurement update rate.
Disable the IF/Video/Sweep output ports
If the analyzer has Options A4J (IF, Video and Sweep Ports) or AYX (Fast Time
Domain Sweeps), various output signals with rear-panel ports are controlled by
instrument processing. If these ports are not used in a particular application,
:SYSTem:PORTs:IFVSweep:ENABle OFF can be used to disable the ports and
conserve instrument resources.
Chapter 1 45
Page 46

Programming Fundamentals
Improving Measurement Speed
Select phase noise performance
[:SENSe]:FREQuency:SYNThesis can be used to optimize either phase noise
performance or tuning speed. In some settings optimizing for tuning speed reduces
sweep time and the “re-tune” time between sweeps. In other settings only the
re-tune time is improved.
Use binary data format instead of ASCII
The ASCII data format is the instrument default since it is easier for people to
understand and is required by SCPI for *RST. However, data input/output is faster
using the binary formats.
:FORMat:DATA REAL,64 selects the 64-bit binary data format for all your
numerical data queries. You may need to swap the byte order if you are using a PC
rather than UNIX. NORMal is the default byte order. Use :FORMat:BORDer
SWAP to change the byte order so that the least significant byte is sent first.
When using the binary format, data is sent in a block of bytes with an
A data query would return the block of data in the following format: #DNNN<nnn
binary data bytes>
To parse the data:
• Read two characters (#D), where D tells you how many N characters follow the
D character.
• Read D characters, the resulting integer specifies the number of data bytes sent.
• Read the bytes into a real array.
For example, suppose the header is #512320.
• The first character/digit in the header (5) tells you how many additional digits
there are in the header.
• The 12320 means 12 thousand, 3 hundred, 20 data bytes follow the header.
• Divide this number of bytes by your current data format (bytes/data point),
8 for real, 64. For this example, there are 1540 data points in the block of data.
ASCII header.
Minimize the number of GPIB transactions.
When you are using the GPIB for control of your instrument, each transaction
requires driver overhead and bus handshaking, so minimizing these transactions
reduces the time used.
You can reduce bus transactions by sending multiple commands per transaction.
See the information on “Putting Multiple Commands on the Same Line” in the
SCPI Language Basics section.
If you are using the pre-configured
the same measurement multiple times with small changes in the measurement
setup, use the single READ command. It is faster then using INITiate and FETCh.
46 Chapter 1
MEASURE key measurements and are making
Page 47

Programming Fundamentals
Improving Measurement Speed
Avoid unnecessary use of *RST.
Remember that *RST presets all the measurements and settings to their factory
defaults and my also change the mode. This forces you to reset the measurement
settings of the analyzer even if they use similar mode setup or measurement
settings. See Minimize DUT/instrument setup changes. below.
Minimize DUT/instrument setup changes.
• Some instrument setup parameters are common to multiple measurements. You
should look at your measurement process with a focus on minimizing setup
changes. If your test process involves nested loops, make sure that the
inner-most loop is the fastest. Also, check if the loops could be nested in a
different order to reduce the number of parameter changes as you step through
the test.
• Are you are using the pre-configured Measurements (
MEASURE key)?
Remember that if you have already set your Meas Setup parameters for a
measurement, and you want to make another one of these measurements later,
use READ:<meas>?. The MEASure:<meas>?. command resets all the settings
to the defaults, while READ changes back to that measurement without
changing the setup parameters from the previous use.
• Are you are using the pre-configured Measurements (
MEASURE key)? Also
remember that Mode Setup parameters remain constant across all the
measurements (such as: center/channel frequency, amplitude, radio standard,
input selection, trigger setup). You don’t have to re-initialize them each time
you change to a different measurement.
Chapter 1 47
Page 48

Programming Fundamentals
Putting Multiple Commands on the Same Line
Putting Multiple Commands on the Same Line
Multiple commands can be written on the same line, reducing your code space
requirement. To do this:
• Commands must be separated with a semicolon (;).
• If the commands are in different subsystems, the key word for the new
subsystem must be preceded by a colon (:).
• If the commands are in the same subsystem, the full hierarchy of the command
key words need not be included. The second command can start at the same key
word level as the command that was just executed.
SCPI Termination and Separator Syntax
A terminator must be provided when an instrument is controlled using RS-232
(Option 1AX). There are several issues to be understood about choosing the proper
SCPI terminator and separator when this is the case. There is no current SCPI
standard for RS-232. Although one intent of SCPI is to be interface independent,
<END> is only defined for IEEE 488 operation. At the time of this writing, the
RS-232 terminator issue was in the process of being addressed in IEEE standard
1174.
A semicolon (;) is not a SCPI terminator, it is a separator. The purpose of the
separator is to queue multiple commands or queries in order to obtain multiple
actions and/or responses. Make sure that you do not attempt to use the semicolon
as a terminator when using RS-232 control.
Basically all binary trace and response data is terminated with <NL><END>, as
defined in Section 8.5 of IEEE Standard 488.2-1992, IEEE Standard Codes,
Formats, Protocols and Common Commands for Use with ANSI/IEEE Std
488.1-1987. New York, NY, 1992.
The following are some examples of good and bad commands. The examples are
created from an EMC analyzer with the simple set of commands indicated below:
[:SENSe]
:POWer
[:RF]
:ATTenuation 40dB
[:SENSe]
:FREQuency
:STARt
:POWer
[:RF]
:MIXer
:RANGe
[:UPPer]
48 Chapter 1
Page 49

Programming Fundamentals
Putting Multiple Commands on the Same Line
:TRIGger
[:SEQuence]
:EXTernal [1]
:SLOPe
POSitive
Bad Command Good Command
PWR:ATT 40dB POW:ATT 40dB
The short form of POWER is POW, not PWR.
FREQ:STAR 30MHz;MIX:RANG –20dBm FREQ:STAR 30MHz;POW:MIX:RANG
–20dBm
The :MIX:RANG command is in the same :SENSE subsystem as :FREQ, but executing
the :FREQ command puts you back at the :SENSE level. You must specify :POW to
get to the :MIX:RANG command.
FREQ:STAR 30MHz;POW:MIX RANG
–20dBm
FREQ:STAR 30MHz;POW:MIX:RANG
–20dBm
:MIX and :RANG require a colon to separate them.
:POW:ATT 40dB;TRIG:FREQ:STAR
2.3GHz
:POW:ATT 40dB;:FREQ:STAR
2.3GHz
:FREQ:STAR is in the :SENSE subsystem, not the :TRIGGER subsystem.
:POW:ATT?:FREQ:STAR? :POW:ATT?;:FREQ:STAR?
:POW and :FREQ are within the same :SENSE subsystem, but they are two separate
commands, so they should be separated with a semicolon, not a colon.
:POW:ATT -5dB;:FREQ:STAR 10MHz :POW:ATT 5dB;:FREQ:STAR 10MHz
Attenuation cannot be a negative value.
Chapter 1 49
Page 50

Programming Fundamentals
Overview of GPIB (Option A4H)
Overview of GPIB (Option A4H)
GPIB Instrument Nomenclature
An instrument that is part of a GPIB network is categorized as a listener, talker, or
controller, depending on its current function in the network.
Listener A listener is a device capable of receiving data or commands
from other instruments. Any number of instruments in the GPIB
network can be listeners simultaneously.
Talker A talker is a device capable of transmitting data or commands to
other instruments. To avoid confusion, an GPIB system allows
only one device at a time to be an active talker.
Controller A controller is an instrument, typically a computer, capable of
managing the various GPIB activities. Only one device at a time
can be an active controller.
GPIB Command Statements
Command statements form the nucleus of GPIB programming. They are
understood by all instruments in the network. When combined with the
programming language codes, they provide all management and data
communication instructions for the system. Refer to the your programming
language manual and your computers I/O programming manual for more
information.
The seven fundamental command functions are as follows:
• An abort function that stops all listener/talker activity on the interface bus, and
prepares all instruments to receive a new command from the controller.
Typically, this is an initialization command used to place the bus in a known
starting condition (sometimes called: abort, abortio, reset, halt).
• A remote function that causes an instrument to change from local control to
remote control. In remote control, the front panel keys are disabled except for
the Local key and the line power switch (sometimes called: remote, resume).
• A local lockout function, that can be used with the remote function, to disable
the front panel Local key. With the Local key disabled, only the controller (or a
hard reset by the line power switch) can restore local control (sometimes called:
local).
50 Chapter 1
Page 51

Programming Fundamentals
Overview of GPIB (Option A4H)
• A local function that is the complement to the remote command, causing an
instrument to return to local control with a fully enabled front panel (sometimes
called: local, resume).
• A clear function that causes all GPIB instruments, or addressed instruments, to
assume a cleared condition. The definition of clear is unique for each
instrument (sometimes called: clear, reset, control, send).
In the Agilent EMC Analyzer, clear does the following:
1. Clears the Input Buffer and the Output Queue.
2. Resets the parser.
3. Clears any current operations, such as *OPC, i.e., returns the device to
Operation Complete Query Idle State and Operation Complete Command
Idle State.
4. Aborts /resumes the current sweep.
• An output function that is used to send function commands and data commands
from the controller to the addressed instrument (sometimes called: output,
control, convert, image, iobuffer, transfer).
• An enter function that is the complement of the output function and is used to
transfer data from the addressed instrument to the controller (sometimes called:
enter, convert, image, iobuffer, on timeout, set timeout, transfer).
Chapter 1 51
Page 52

Programming Fundamentals
Overview of RS-232 (Option 1AX)
Overview of RS-232 (Option 1AX)
Serial interface programming techniques are similar to most general I/O
applications. Due to the asynchronous nature of serial I/O operations, special care
must be exercised to ensure that data is not lost by sending to another device before
the device is ready to receive. Modem line handshaking can he used to help solve
this problem. These and other topics are discussed in greater detail in your
programming language documentation.
Settings for the Serial Interface
Please refer to the documentation on your computer and I/O to configure the serial
interface. Some common serial interface configuration settings are:
Baud Rate to 9600
Bits per character to 8
Parity to Odd or disabled
Stop bits to 1
Handshake and Baud Rate
To determine hardware operating parameters, you need to know the answer for
each of the following questions about the peripheral device:
• Which of the following signal and control lines are actively used during
communication with the peripheral?
— Data Set Ready (DSR)
— Clear to Send (CTS)
• What baud rate is expected by the peripheral?
Character Format Parameters
To define the character format, you must know the requirements of the peripheral
device for the following parameters:
• Character Length: Eight data bits are used for each character, excluding start,
stop, and parity bits.
• Parity Enable: Parity is disabled (absent) for each character.
• Stop Bits: One stop bit is included with each character.
52 Chapter 1
Page 53

Programming Fundamentals
Overview of RS-232 (Option 1AX)
Modem Line Handshaking
To use modem line handshaking for data transfer you would consider the following
tasks:
1. Set Data Terminal Ready and Request-to-Send modem lines to active state.
2. Check Data Set Ready and Clear-to-Send modem lines to be sure they are
active.
3. Send information to the interface and thence to the peripheral.
4. After data transfer is complete, clear Data Terminal Ready and
Request-to-Send signals.
For ENTER operations:
1. Set Data Terminal Ready line to active state. Leave Request-to-Send inactive.
2. Check Data Set Ready and Data Carrier Detect modem lines to be sure they are
active.
3. Input information from the interface as it is received from the peripheral.
4. After the input operation is complete, clear the Data Terminal Ready signal.
Data Transfer Errors
The serial interface can generate several types of errors when certain conditions are
encountered while receiving data from the peripheral device. Errors can be
generated by any of the following conditions:
• Parity error. The parity bit on an incoming character does not match the parity
expected by the receiver. This condition is most commonly caused by line
noise.
• Framing error. Start and stop bits do not match the timing expectations of the
receiver. This can occur when line noise causes the receiver to miss the start bit
or obscures the stop bits.
• Overrun error. Incoming data buffer overrun caused a loss of one or more data
characters. This is usually caused when data is received by the interface, but no
ENTER statement has been activated to input the information.
• Break received. A BREAK was sent to the interface by the peripheral device.
The desktop computer program must be able to properly interpret the meaning
of a break and take appropriate action.
Chapter 1 53
Page 54

Programming Fundamentals
Printer Setup and Operation
Printer Setup and Operation
Equipment
• Agilent EMC Analyzer equipped with standard I/O Option A4H (GPIB) and
(Parallel Interface) or Option 1AX (RS-232 and Parallel Interface).
• IEEE 1284 compliant printer cable (such as HP C2950A).
• Supported printer equipped with a parallel interface. (A supported printer is one
that accepts Printer Control Language Level 3 or 5).
— PCL3 printers include most HP DeskJet printers.
— PCL5 printers include most HP LaserJet printers and the 1600C DeskJet
printer.
Interconnection and Setup
1. Turn off the printer and the analyzer.
2. Connect the printer to the analyzer parallel I/O interface connector using an
IEEE 1284 compliant parallel printer cable.
3. If appropriate, configure your printer using configuration menus or switches.
Refer to your printer’s documentation for more specific information on
configuring your printer.
4. Turn on the analyzer and printer.
5. Press
Print Setup on the front panel and then press the Printer Type menu key.
Printer Type accesses the following keys:
None None disables the analyzer from attempting to print to a
printer. This is the appropriate setting if no printer is
connected to the analyzer.
Custom Custom allows you to access the Define Custom menu
keys. The Define Custom menu keys allow you to specify
printer characteristics such as PCL Level and printer color
capability.
Auto Auto enables the analyzer to automatically attempt to
identify the connected printer when the Print key is pressed
or when Printer Type is set to Auto.
54 Chapter 1
Page 55

Programming Fundamentals
Printer Setup and Operation
6. Press Printer Type to access the Printer Type menu keys. Press Auto to make
the analyzer attempt to identify the connected printer. When you press
Auto,
the analyzer will respond in one of the three following ways:
• The
Print Setup menu will be displayed with the Auto key selected and no
new message will be displayed in the display status line. This indicates that
the analyzer has successfully identified the connected printer and no further
setup is required. As long as
Auto remains selected in the Printer Type
menu, the analyzer will attempt to identify the printer when the front panel
Print key is pressed.
• The
Print Setup menu will be displayed with the Custom key selected and
one of the following diagnostic messages will be displayed in the display
status line:
Unknown printer, Define Custom to set up printer
No printer response, Define Custom to set up
printer
Invalid printer response, Define Custom to set up
printer
This indicates that the analyzer was unable to automatically identify the
connected printer, and
Press
Print Setup, Define Custom to select specific printer characteristics
Custom has been selected in the Printer Type menu.
such as the printer language (PCL3 or PCL5) and color printing capability.
Once you have set these characteristics to match those of your connected
printer, the printer setup process is complete. As long as
selected in the
Printer Type menu, the analyzer will not attempt to
automatically identify the connected printer when the front panel
Custom remains
Print key
is pressed.
• The
Print Setup menu will be displayed with the None key selected and the
following message will appear in the display status line:
Unsupported printer, Printer Type set to None
This indicates that the analyzer has successfully identified the connected
printer, but the printer is not supported by the analyzer. As long as
None is
selected in the Printer Type menu, the analyzer will respond to any print
command by displaying the message Printer Type is None in the
display status line.
Chapter 1 55
Page 56

Programming Fundamentals
Printer Setup and Operation
Testing Printer Operation
When you have completed the printer setup for the analyzer, press Print Setup,
Print (Screen), and then press Print on the front panel. If the printer is ready and
the printer setup was successful, a printout of the analyzer display will be printed.
If the printer is not ready, the message Printer Timeout will appear on the
analyzer display. Printer Timeout will remain on the display until the printer
is ready or until you press
ESC to cancel the printout request.
56 Chapter 1
Page 57

2 Status Registers
This chapter contains a comprehensive description of status registers explaining
what status registers are and how to use them. Information pertaining to all bits of
the registers in Agilent EMC analyzers is also provided.
57
Page 58

Status Registers
Use Status Registers to Determine the State of Analyzer Events and Conditions
Use Status Registers to Determine the State of
Analyzer Events and Conditions
Programs often need to detect and manage error conditions or changes in analyzer
status. Agilent EMC products allow this function to be performed using status
registers. You can determine the state of certain analyzer hardware and firmware
events and conditions by programming the status register system.
Refer to Figure 2-1. The status system is comprised of multiple registers arranged
in a hierarchical order. The service request enable register is at the top of the
hierarchy and contains the general status information for the analyzer events and
conditions. The lower-priority status registers propagate their data to the
higher-priority registers in the data structures by means of summary bits. These
registers are used to determine the states of specific events or conditions.
Figure 2-1 Status Register System Simplified Block Diagram
The two methods used to programmatically access the information in status
registers are the polling method and the service request method. An explanation of
these methods is given in the next section “What are the Status Registers?”
58 Chapter 2
Page 59

Status Registers
Use Status Registers to Determine the State of Analyzer Events and Conditions
What are the Status Registers?
Refer toFigure 2-2, which shows the overall status register system in detail. Most
status registers are composed of the five individual registers described below. One
such status register in the figure is entitled “STATus: QUEStionable,” which is
both the name of the register, and the SCPI command form used to access the
register. From now on, the SCPI command form will be used when referring to the
various registers. There are IEEE common SCPI commands noted under some
register names in parenthesis. These commands are associated with those registers,
and their effects are described under “How Do You Access the Status Registers?”
in this chapter, and in the beginning of Chapter 5, “Language Reference,” in this
guide.
Refer to the right-hand part of the STATus: QUEStionable register while reading
the following register descriptions.
Condition
Register A condition register continuously monitors the hardware and
firmware status of the analyzer. There is no latching or buffering
for a condition register.
Negative
Transition
Filter A negative transition filter specifies the bits in the condition
register that will set corresponding bits in the event register
when the condition bit changes from
1 to 0.
Positive
Transition
Filter A positive transition filter specifies the bits in the condition
register that will set corresponding bits in the event register
when the condition bit changes from
0 to 1.
Event
Register An event register latches transition events from the condition
register as specified by the positive and negative transition
filters. Bits in the event register are latched, and once set, they
remain set until cleared by either querying the register contents
or sending the *CLS command.
Event
Enable
Register An event enable register specifies the bits in the event register
that can generate a summary bit. Summary bits are, in turn, used
by the status byte register.
Chapter 2 59
Page 60
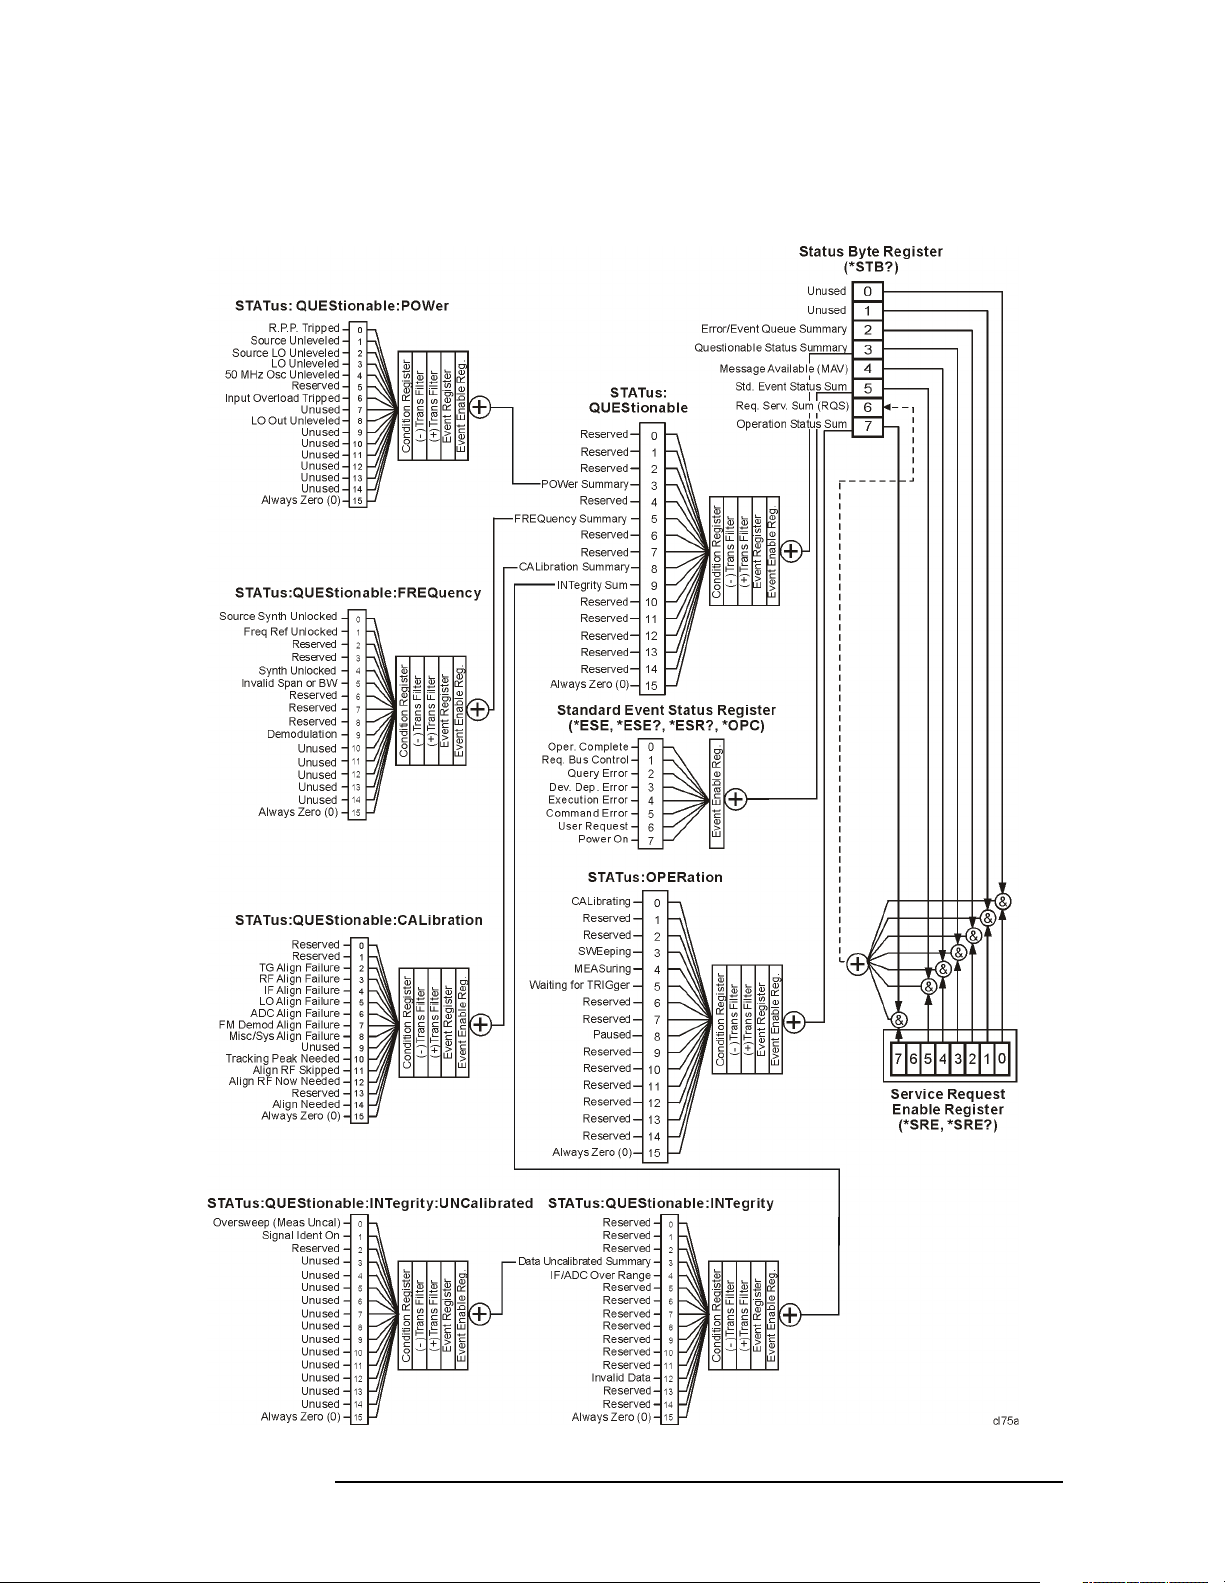
Status Registers
Use Status Registers to Determine the State of Analyzer Events and Conditions
Figure 2-2 Overall Status Register System Diagram
60 Chapter 2
Page 61

Status Registers
Use Status Registers to Determine the State of Analyzer Events and Conditions
Status registers (except for the status byte register and the standard event status
register) consist of the registers whose contents can be used to produce status
summary bits.
These summary bits are then manipulated as follows: The condition register passes
summary bits to the negative and positive transition filters, after which they are
stored in the event register. The contents of the event register are logically ANDed
with the contents of the event enable register and the result is logically ORed to
produce a status summary bit. The status summary bit is then passed to the status
byte register either directly, or through the STATus: QUEStionable register. Next,
the summary bits are logically ANDed with the contents of the service request
enable register and the result is logically ORed to produce the request service
(*RQS) bit in the status byte register.
How Do You Access the Status Registers?
There are two different methods to access the status registers:
• Common Commands Accesses and Controls
• Status Subsystem Commands
Common Command Access and Control
Most monitoring of the analyzer conditions is done at the highest level using the
following IEEE common commands:
*CLS (clear status) clears the status byte by emptying the error queue and
clearing all the event registers.
*ESE,*ESE? (event status enable) sets and queries the bits in the enable
register part of the standard event status register.
*ESR? (event status register) queries and clears the standard event status
register.
*OPC (operation complete) sets bit 0 in the standard event status register when
all operations are complete.
*SRE,*SRE? (service request enable) sets and queries the value of the service
request enable register.
*STB? (status byte) queries the value of the status byte register without erasing
its contents.
Complete command descriptions are given in Chapter 5, “Language Reference,”
under the subsection entitled “IEEE Common Commands” on page 193.
Chapter 2 61
Page 62

Status Registers
Use Status Registers to Determine the State of Analyzer Events and Conditions
NOTE If you are using the status bits and the analyzer mode is changed, the status bits
should be read, and any error conditions resolved, prior to switching modes. Error
conditions that exist prior to switching modes cannot be detected using the
condition registers after the mode change. This is true unless they recur after the
mode change, although transitions of these conditions can be detected using the
event registers.
Changing modes resets all SCPI status registers and mask registers to their
power-on defaults. Hence any event or condition register masks must be
re-established after a mode change. Also note that the power up status bit is set by
any mode change, since that is the default state after power up.
Status Subsystem Commands
Individual status registers can be set and queried using the commands in the
STATus subsystem in Chapter 5, “Language Reference,” in this guide. There are
two methods used to programmatically detect and manage error conditions or
changes in analyzer status. Either method allows you to monitor one or more
conditions. The two methods are:
• The Polling Method
• The Service Request (SRQ) Method
The Polling Method
In the polling method, the analyzer has a passive role. It only tells the controller
that conditions have changed when the controller asks the right question. The
polling method works well if you do not need to know about changes the moment
they occur. This method is very efficient.
Use the polling method when either:
— your programming language/development environment does not support SRQ
interrupts
— you want to write a simple, single-purpose program and don’t want the added
complexity of setting up an SRQ handler
The Service Request (SRQ) Method
The SRQ method allows timely communication of information without requiring
continuous controller involvement. Using this method, the analyzer takes a more
active role. It tells the controller when there has been a condition change without
the controller asking. The SRQ method should be used if you must know
immediately when a condition changes. This is in contrast to the polling method,
which requires the program to repeatedly read the registers to detect a change.
62 Chapter 2
Page 63

Status Registers
Use Status Registers to Determine the State of Analyzer Events and Conditions
Use the SRQ method when either:
— you need time-critical notification of changes
— you are monitoring more than one device which supports SRQs
— you need to have the controller do something else while the analyzer is making
a measurement
— you can’t afford the performance penalty inherent to polling
Using the Service Request (SRQ) Method
Your language, bus, and programming environment must be able to support SRQ
interrupts (for example, using C and C++ with the GPIB). When you monitor a
condition with the SRQ method, you must establish the following parameters:
1. Determine which bit monitors the condition.
2. Determine how that bit reports to the request service (RQS) bit of the status
byte.
3. Send GPIB commands to enable the bits that monitor the condition and to
enable the summary bits that report the condition to the RQS bit.
4. Enable the controller to respond to service requests.
When the condition changes, the analyzer sets the RQS bit and the GPIB SRQ line.
The controller is informed of the change as soon as it occurs. The time the
controller would otherwise have used to monitor the condition can now be used to
perform other tasks. Your program also determines how the controller responds to
the SRQ.
Generating a Service Request
Before using the SRQ method of generating a service request, first become
familiar with how service requests are generated. Bit 6 of the status byte register is
the request service summary (RQS) bit. The RQS bit is set whenever there is a
change in the register bit that it has been configured to monitor. The RQS bit will
remain set until the condition that caused it is cleared. It can be queried without
erasing the contents using the *STB? command. Configure the RQS function using
the *SRE command.
When a register set causes a summary bit in the status byte to change from 0 to 1,
the analyzer can initiate the service request (SRQ) process. However, the process is
only initiated if both of the following conditions are true:
• The corresponding bit of the service request enable register is also set to 1.
• The analyzer does not have a service request pending. (A service request is
considered to be pending between the time the analyzer SRQ process is
initiated, and the time the controller reads the status byte register.)
The SRQ process sets the GPIB SRQ line true. It also sets the status byte request
service (RQS) bit to 1. Both actions are necessary to inform the controller that the
analyzer requires service. Setting the SRQ line only informs the controller that
some device on the bus requires service. Setting the RQS bit allows the controller
to determine which device requires service.
Chapter 2 63
Page 64

Status Registers
Use Status Registers to Determine the State of Analyzer Events and Conditions
If your program enables the controller to detect and respond to service requests, it
should instruct the controller to perform a serial poll when the GPIB SRQ line is
set true. Each device on the bus returns the contents of its status byte register in
response to this poll. The device, whose RQS bit is set to 1, is the device that
requested service.
NOTE When you read the analyzer status byte register with a serial poll, the RQS bit is
reset to 0. Other bits in the register are not affected.
Restarting a measurement with the :INITiate command can cause the
measuring bit to pulse low. A low pulse causes an SRQ if the status register is
configured to SRQ upon end-of-measurement. To avoid this, perform the
following steps:
1. Set :INITiate:CONTinuous off.
2. Set/enable the status registers.
3. Restart the measurement (send :INITiate).
Example of Monitoring Conditions Using the :STATus Command
Use the following steps to monitor a specific condition:
1. Determine which register contains the bit that reports the condition.
2. Send the unique SCPI query that reads that register.
3. Examine the bit to see if the condition has changed.
4. Act upon the cause of the condition and the SRQ to re-enable the method.
The examples below show how to use the :STATus command to perform the
following tasks:
• Check the analyzer hardware and firmware status.
Do this by querying the condition registers which continuously monitor status.
These registers represent the current state of the analyzer. Bits in a condition
register are updated in real time. When the condition monitored by a particular
bit becomes true, the bit is set to 1. When the condition becomes false, the bit is
reset to 0.
• Monitor a particular bit (condition), or bits.
Once you have enabled a bit using the event enable register, the analyzer will
monitor that particular bit. If the bit becomes true in the event register it will
stay set until the event register is cleared. Querying the event register allows
you to detect that this condition occurred even if the condition no longer exists.
The event register can only be cleared by querying it or sending the *CLS
command, which clears all event registers.
• Monitor a change in the condition of a particular bit, or bits.
Once you have enabled a bit, the analyzer will monitor it for a change in its
condition. The transition registers are preset to respond to the condition of
going from 0 to 1 (positive transitions). This can be changed so that the selected
bit is detected if it goes from 1 to 0 (negative transition), or if either transition
occurs. Query the event register to determine whether or not a change has been
made to how the transition registers respond. The event register can only be
cleared by querying it or sending the *CLS command, which clears all event
registers.
64 Chapter 2
Page 65

Status Registers
Use Status Registers to Determine the State of Analyzer Events and Conditions
Setting and Querying the Status Register
See Figure 2-3. Each bit in a register is represented by a numerical value based on
its location. This number is sent with the command to enable a particular bit. To
enable more than one bit, send the sum of all of the bits involved.
For example, to enable bit 0 and bit 6 of the standard event status register, you
would send the command *ESE 65 (1 + 64).
The results of a query are evaluated in a similar way. If the *STB? command
returns a decimal value of 140, (140 = 128 + 8 + 4) then bit 7 is true, bit 3 is true,
and bit 2 is true.
Figure 2-3 Status Register Bit Values
Decimal Value
Bit Number
32768
16384
8192
4096
2048
1024
89101112131415
512
7
256
6
128
64
5
32
16
432
8
2
4
1
1
0
ck730a
Details of Bits in All Registers
Refer to Figure 2-2. The rest of this chapter lists the bits in each register shown in
the figure, along with descriptions of their purpose.
Chapter 2 65
Page 66

Status Registers
Use Status Registers to Determine the State of Analyzer Events and Conditions
Status Byte Register
Figure 2-4 Status Byte Register Diagram
&
&
&
&
&
&
Status Byte Register
Unused
0
Unused
1
Error/Event Queue Summary Bit
2
Questionable Summary BitStatus
3
Message Available (MAV)
4
Standard Event Summary Bit
5
Request Service Summary (RQS)
6
Operation Summary BitStatus
7
+
&
2
4
6
1
0
3
7
5
Service Request Enable Register
ck763a
The status byte register contains the following bits:
Bit Decimal
Va lu e
01Unused: This bit is always set to 0.
12Unused: This bit is always set to 0.
24Error/Event Queue Summery Bit: A 1 in this bit position
38Questionable Status Summary Bit: A 1 in this bit
416Message Available (MAV): A 1 in this bit position
Description
indicates that the SCPI error queue is not empty. The SCPI error
queue contains at least one error message.
position indicates that the questionable status summary bit has
been set. The questionable status event register can then be read
to determine the specific condition that caused this bit to be set.
indicates that the analyzer has data ready in the output queue.
There are no lower status groups that provide input to this bit.
66 Chapter 2
Page 67

Status Registers
Use Status Registers to Determine the State of Analyzer Events and Conditions
Bit Decimal
Va lu e
532Standard Event Status Summary Bit: A 1 in this bit
664Request Service (RQS) Summery Bit: A 1 in this bit
7128Operation Status Summary Bit: A 1 in this bit position
Description
position indicates that the standard event status summary bit has
been set. The standard event status register can then be read to
determine the specific event that caused this bit to be set.
position indicates that the analyzer has at least one reason to
report a status change. This bit is also called the master summary
status bit (MSS).
indicates that the operation status summary bit has been set. The
operation status event register can then be read to determine the
specific event that caused this bit to be set.
To query the status byte register, send the *STB command. The response will be
the decimal sum of the bits that are set to 1. For example, if bit number 7 and bit
number 3 are set to 1, the decimal sum of the 2 bits is 128 plus 8. So the decimal
value 136 is returned.
Service Request Enable Register
In addition to the status byte register, the status byte group also contains the service
request enable register. The status byte service request enable register lets you
choose which bits in the Status Byte Register will trigger a service request.
Send the *SRE <number> command (where <number> is the sum of the decimal
values of the bits you want to enable plus the decimal value of bit 6). For example,
assume that you want to enable bit 7 so that whenever the operation status
summary bit is set to 1, it will trigger a service request. Send the *SRE 192 (128 +
64) command. The *SRE? command returns the decimal value of the sum of the
bits enabled previously with the *SRE <number> command.
NOTE You must always add 64 (the numeric value of RQS bit 6) to your numeric sum
when you enable any bits for a service request.
The service request enable register contains the following bits:
Chapter 2 67
Page 68
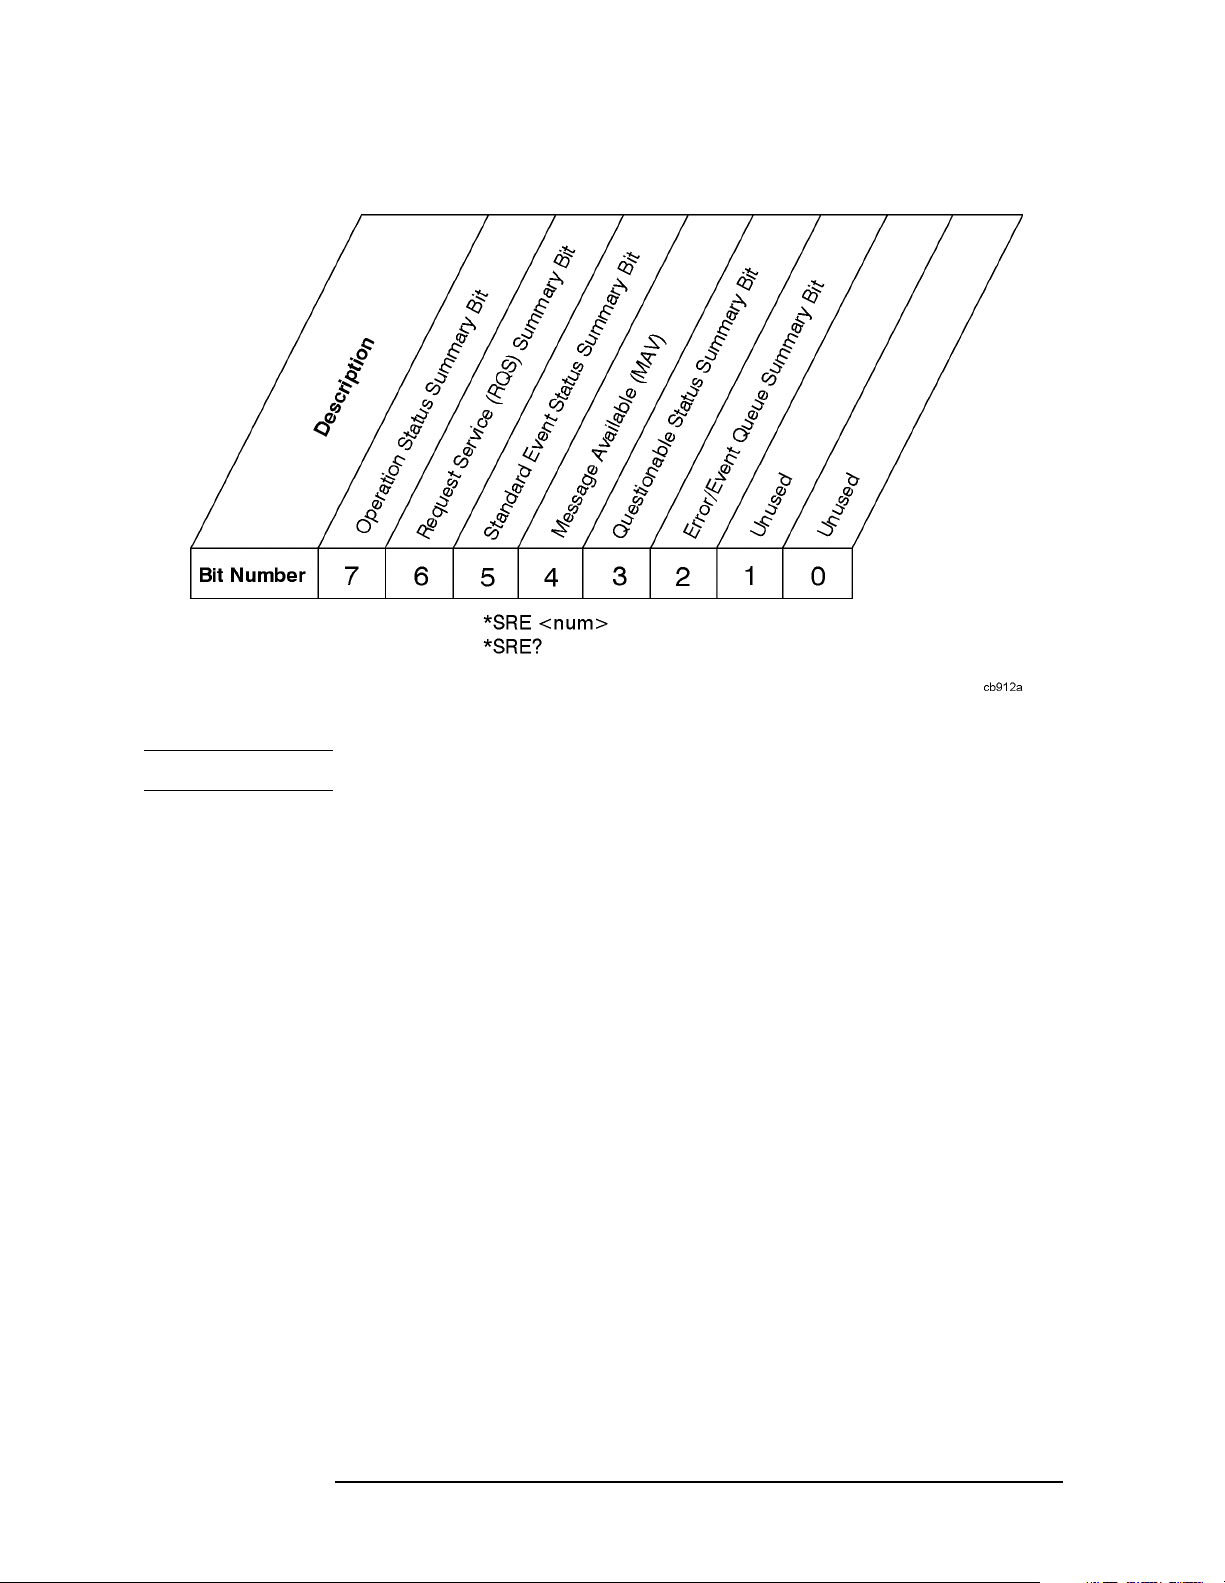
Status Registers
Use Status Registers to Determine the State of Analyzer Events and Conditions
Figure 2-5 Service Request Enable Register
NOTE The service request enable register presets to zeros (0).
Standard Event Status Register
The standard event status register is used to determine the specific event that sets
bit 5 in the status byte register. The standard event status register does not have
negative and positive transition registers, nor a condition register. Use the IEEE
common commands at the beginning of Chapter 5, “Language Reference,” in this
guide to access the register.
To query the standard event status register, send the *ESR command. The response
will be the decimal sum of the bits which are set to 1. For example, if bit number 7
and bit number 3 are set to 1, the decimal sum of the 2 bits is 128 plus 8. So the
decimal value 136 is returned.
See “Setting and Querying the Status Register” on page 65 in this chapter for more
information.
68 Chapter 2
Page 69

Status Registers
Use Status Registers to Determine the State of Analyzer Events and Conditions
Figure 2-6 Standard Event Status Register Diagram
Operation Complete
Request Bus Control
Query Error
Device Dependent Error
Execution Error
Command Error
User Request
Power On
Event Register
&
+
Event
Enable Register
To Status Byte Register Bit #5
&
&
&
&
&
01234567
&
&
01234567
ck723a
The standard event status register contains the following bits:
Bit Decimal
Va lu e
01Operation Complete: A 1 in this bit position indicates that all
12Request Bus Control: This bit is always set to 0. (The
Description
operations were completed following execution of the *OPC
command.
analyzer does not request control.)
24Query Error: A 1 in this bit position indicates that a query error
has occurred. Query errors have SCPI error numbers from −499 to
–400.
38Device Dependent Error: A 1 in this bit position indicates
that a device dependent error has occurred. Device dependent
errors have SCPI error numbers from –399 to –300 and 1 to
32767.
416Execution Error: A 1 in this bit position indicates that an
execution error has occurred. Execution errors have SCPI error
numbers from –299 to –200.
Chapter 2 69
Page 70

Status Registers
Use Status Registers to Determine the State of Analyzer Events and Conditions
Bit Decimal
Val ue
532Command Error: A 1 in this bit position indicates that a
664User Request Key (Local: A 1 in this bit position indicates
7 128 Power On: A 1 in this bit position indicates that the analyzer has
Description
command error has occurred. Command errors have SCPI error
numbers from –199 to –100.
that the
analyzer is in local lockout mode.
been turned off and then on.
LOCAL key has been pressed. This is true even if the
Standard Event Status Event Enable Register
The event enable register (contained in the standard event status register) lets you
choose which bits will set the summary bit (bit 5 of the status byte register) to 1.
Send the *ESE <number> command (where <number> is the sum of the decimal
values of the bits you want to enable).
For example, to enable bit 7 and bit 6 so that whenever either of those bits is set to
1, the standard event status summary bit of the status byte register will also be set
to 1, send the *ESE 192 (128 + 64) command. The *ESE? command returns the
decimal value of the sum of the bits previously enabled with the *ESE <number>
command.
Figure 2-7 Standard Event Status Event Enable Register
STATus:OPERation Register
The STATus:OPERation register is used to determine the specific event that sets
bit 7 in the status byte register. This register also monitors the current measurement
state and checks to see if the analyzer is performing any of these functions:
• measuring
• calibrating
70 Chapter 2
Page 71

Status Registers
Use Status Registers to Determine the State of Analyzer Events and Conditions
• sweeping
• waiting for a trigger
Figure 2-8 Status Operation Register Diagram
Chapter 2 71
Page 72

Status Registers
Use Status Registers to Determine the State of Analyzer Events and Conditions
The STATus:OPERation condition register contains the following bits:
Bit Decimal
Description
Va lu e
00Calibrating: A 1 in this bit position indicates that the
analyzer is performing a self-calibration.
12Reserved: This bit is not used by the analyzer, but is for
future use with other Agilent products.
24Reserved: This bit is not used by the analyzer, but is for
future use with other Agilent products.
38Sweeping: A 1 in this bit position indicates that a sweep is
in progress.
a
4
16 Measuring: A 1 in this bit position indicates that a
measurement is in progress.
a
5
32 Waiting for Trigger: A 1 in this bit position indicates
that a measurement is in a “wait for trigger” state.
664Reserved: This bit is not used by the analyzer, but is for
future use with other Agilent products.
7 128 Reserved: This bit is not used by the analyzer, but is for
future use with other Agilent products.
8 256 Paused: A 1 in this bit position indicates that the instrument
is in the paused state of the measurement.
9 512 Reserved: This bit is not used by the analyzer, but are for
future use with other Agilent products.
10 1024 Reserved: This bit is not used by the analyzer, but are for
future use with other Agilent products.
11 2048 Reserved: This bit is not used by the analyzer, but are for
future use with other Agilent products.
12 4096 Reserved: This bit is not used by the analyzer, but are for
future use with other Agilent products.
13 8192 Reserved: This bit is not used by the analyzer, but are for
future use with other Agilent products.
14 16384 Reserved: This bit is not used by the analyzer, but are for
future use with other Agilent products.
15 32768 Always Zero (0)
a. The description of this bit refers to any measurement under the MEASURE key.
72 Chapter 2
Page 73

Status Registers
Use Status Registers to Determine the State of Analyzer Events and Conditions
STATus:OPERation Condition and Event Enable Registers
The STATus:OPERation condition register continuously monitors the hardware
and firmware status of the analyzer, and is read-only. To query the register, send
the :STATus:OPERation:CONDition? command. The response will be the
decimal sum of the bits that are set to 1. For example, if bit number 9 and bit
number 3 are set to 1, the decimal sum of the 2 bits is 512 plus 8. So the decimal
value 520 is returned.
The transition filter specifies which types of bit state changes in the condition
register will set corresponding bits in the event register. The changes may be
positive (from 0 to 1) or negative (from 1 to 0). Send the
:STATus:OPERation:NTRansition <num> (negative transition) command
or the :STATus:OPERation:PTRansition <num> (positive transition)
command (where <num> is the sum of the decimal values of the bits you want to
enable).
The STATus:OPERation event register latches transition events from the condition
register as specified by the transition filters. Event registers are destructive
read-only data. Reading data from an event register will clear the content of that
register. To query the event register, send the
:STATus:OPERation:[:EVENt]? command.
The STATus:OPERation event enable register lets you choose the bits that will set
the operation status summary bit (bit 7) of the status byte register to 1. Send the
:STATus:OPERation:ENABle <num> command where <num> is the sum of
the decimal values of the bits you want to enable.
For example, to enable bit 9 and bit 3 (so that whenever either bit 9 or 3 is set to 1,
the operation status summary bit of the status byte register will be set to 1), send
the :STATus:OPERation:ENABle 520 (512 + 8) command. The
:STATus:OPERation:ENABle? command returns the decimal value of the
sum of the bits previously enabled with the :STATus:OPERation:ENABle
<num> command.
STATus:QUEStionable Registers
STATus:QUEStionable registers monitor the overall analyzer condition. They are
accessed with the :STATus:OPERation and :STATus:QUEStionable
commands in the :STATus command subsystem.
The STATus:QUEStionable registers also monitor the analyzer to see if there are
any questionable events that occurred. These registers look for anything that may
cause an error or that may induce a faulty measurement. Signs of a faulty
measurement include the following:
• hardware problems
• out of calibration situations
• unusual signals
Chapter 2 73
Page 74

Status Registers
Use Status Registers to Determine the State of Analyzer Events and Conditions
NOTE All bits are summary bits from lower-level event registers. (For a general diagram
of the STATus:QUEStionable register, see Figure 2-9.)
A Questionable Status condition register query response will be the decimal sum
of the bits which are set to 1. For example, if bit number 9 and bit number 3 are set
to 1, the decimal sum of the 2 bits is 512 plus 8. So the decimal value 520 is
returned.
The transition filter specifies which types of bit state changes in the condition
register will set corresponding bits in the event register. The changes may be
positive (from 0 to 1) or negative (from 1 to 0). Send the command
:STATus:QUEStionable:NTRansition <num> (negative transition) or
:STATus:QUEStionable:PTRansition <num> (positive transition) where
<num> is the sum of the decimal values of the bits you want to enable.
The Questionable Status event register latches transition events from the condition
register as specified by the transition filters. Event registers are destructive
read-only. Reading data from an event register will clear the content of that
register. To query the event register, send the command
:STATus:QUEStionable[:EVENt]?
74 Chapter 2
Page 75

Status Registers
Use Status Registers to Determine the State of Analyzer Events and Conditions
Figure 2-9 Status Questionable Register Diagram
Reserved
Reserved
Reserved
POWer Summary
Reserved
FREQuency Summary
Reserved
Reserved
CALibration Summary
INTregrity Sum
Reserved
Reserved
Reserved
Reserved
Reserved
Always Zero (0)
QUEStionable
Condition Register
QUEStionable
Positive
Transition Filter
QUEStionable
Negative
Transition Filter
QUEStionable
Event Register
+
QUEStionable
Event
Enable Register
Status
Status
Status
Status
Status
012345678910111214 1315
3
45678910111214 1315
3
45678910111214 1315
3
45678910111214 1315
&
&
&
&
&
&
&
&
&
&
&
&
&
012
012
012
&
&
&
012345678910111214 1315
To Status Byte Register Bit #3
ck759a
Chapter 2 75
Page 76
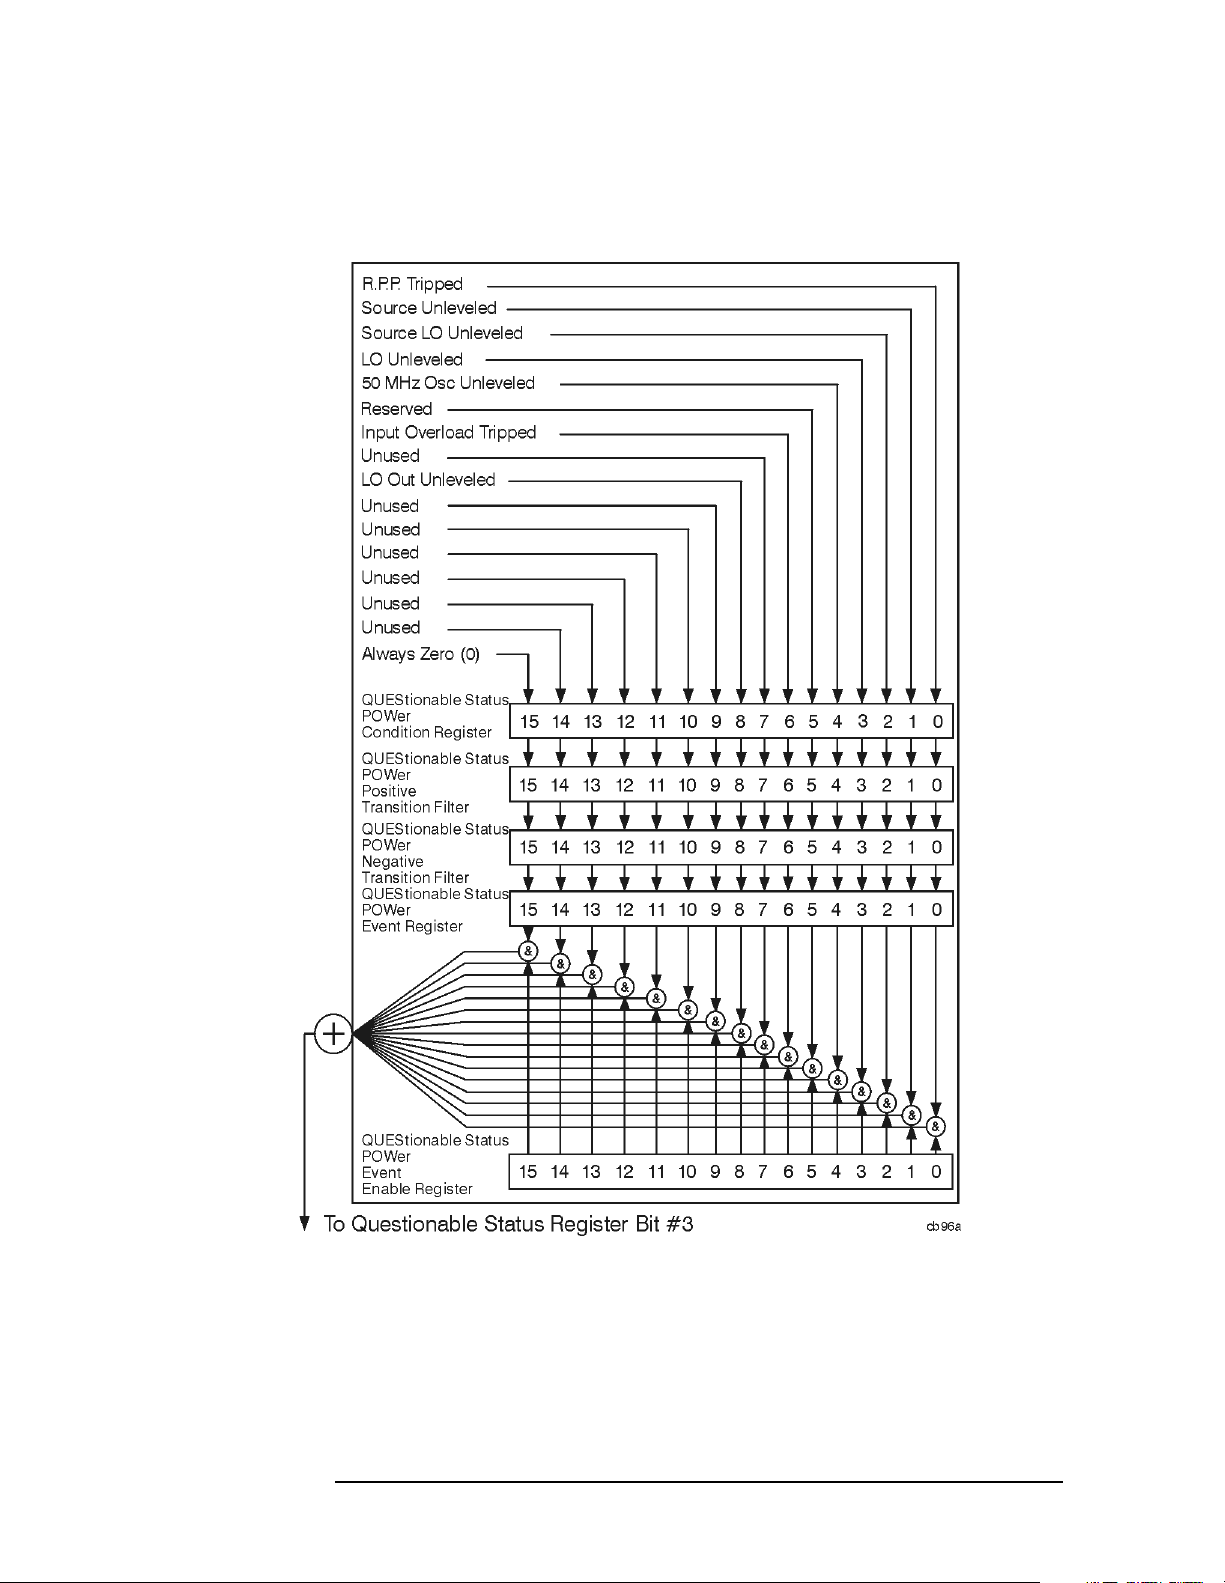
Status Registers
Use Status Registers to Determine the State of Analyzer Events and Conditions
STATus:QUEStionable:POWer Register
Figure 2-10 Questionable Status Power Register Diagram
76 Chapter 2
Page 77

Status Registers
Use Status Registers to Determine the State of Analyzer Events and Conditions
Bit descriptions in the Questionable Status Power Condition Register are given in
the following table.
Bit Decimal
Va lu e
00R.P.P Tripped: A 1 in this bit position indicates that the
12Source Unleveled: A 1 in this bit position indicates that
24Source LO Unleveled: A 1 in this bit position indicates
38LO Unleveled: A 1 in this bit position indicates that the
41650 MHz Osc Unleveled: A 1 in this bit position indicates
532Reserved: This bit is not used by the analyzer, but is for
664Input Overload Tripped: A 1 in this bit position
Description
reverse power protection is tripped (Agilent model E7401A
only). Reverse power protection is “overload” protection for
the tracking generator.
the source (tracking generator) output is unleveled.
that the local oscillator (LO) in the source (tracking generator)
is unleveled.
analyzer local oscillator (LO) is unleveled.
that the 50 MHz amplitude reference signal is unleveled.
future use with other Agilent products.
indicates that the input overload protection is tripped (Agilent
EMC model E7401A only).
7 128 Unused: This bit is always set to 0.
8 256 LO Out Unleveled: A 1 in this bit position indicates that
the first local oscillator (LO) output is unleveled.
9 512 Unused: This bit is always set to 0.
10 1024 Unused: This bit is always set to 0.
11 2048 Unused: This bit is always set to 0.
12 4096 Unused: This bit is always set to 0.
13 8192 Unused: This bit is always set to 0.
14 16384 Unused: This bit is always set to 0.
15 32768 Always Zero (0): This bit is always set to 0.
Questionable Status Event Enable Register
The Questionable Status Event Enable Register lets you choose which bits in the
Questionable Status Event Register will set the summary bit (bit 3 of the Status
Byte Register) to 1. Send the command :STATus:QUEStionable:ENABle
<num> where <num> is the sum of the decimal values of the bits you want to
enable.
Chapter 2 77
Page 78

Status Registers
Use Status Registers to Determine the State of Analyzer Events and Conditions
For example, to enable bit 9 and bit 3 so that whenever either of those bits is set to
1, the Questionable Status Summary bit of the Status Byte Register will be set to 1,
send the command :STAT:QUES:ENAB 520 (512 + 8). The command
:STATus:QUEStionable:ENABle? returns the decimal value of the sum of
the bits previously enabled with the :STATus:QUEStionable:ENABle <num>
command.
Figure 2-11 Questionable Status Event Enable Register
Bit descriptions in the Status Questionable Condition Register are given in the
following table.
Bit Decimal
Va lu e
01Reserved: This bit is not used by the analyzer, but are for
1 2Reserved: This bit is not used by the analyzer, but are for
24Reserved: This bit is not used by the analyzer, but are for
38POWer Summary: This is the summary bit for the
416Reserved: This bit is not used by the analyzer, but are for
532FREQuency Summary: This is the summary bit for the
664Reserved: This bit is not used by the analyzer, but are for
Description
future use with other Agilent products.
future use with other Agilent products.
future use with other Agilent products.
Questionable Power Status Register.
future use with other Agilent products.
Questionable Frequency Status Register.
future use with other Agilent products.
78 Chapter 2
Page 79

Status Registers
Use Status Registers to Determine the State of Analyzer Events and Conditions
Bit Decimal
Va lu e
7 128 Reserved: This bit is not used by the analyzer, but are for
8 256 CALibration Summary: This is the summary bit for the
9 512 INTegrity Sum: This is the summary bit for the
10 1024 Reserved: This bit is not used by the analyzer, but are for
11 2048 Reserved: This bit is not used by the analyzer, but are for
12 4096 Reserved: This bit is not used by the analyzer, but are for
13 8192 Reserved: This bit is not used by the analyzer, but are for
14 16384 Reserved: This bit is not used by the analyzer, but are for
15 32768 Always Zero (0)
Description
future use with other Agilent products.
Questionable Calibration Status Register.
Questionable Integrity Status Register.
future use with other Agilent products.
future use with other Agilent products.
future use with other Agilent products.
future use with other Agilent products.
future use with other Agilent products.
Questionable Status Power Condition and Event Registers
The Questionable Status Power Condition Register continuously monitors output
power status of the analyzer. Condition registers are read-only. To query the
condition register, send the command
:STATus:QUEStionable:POWer:CONDition? The response will be the
decimal sum of the bits which are set to 1.
The transition filter specifies which types of bit state changes in the condition
register will set corresponding bits in the event register. The changes may be
positive (from 0 to 1) or negative (from 1 to 0). Send the command
:STATus:QUEStionable:POWer:NTRansition <num> (negative
transition) or :STATus:QUEStionable:POWer:PTRansition <num>
(positive transition) where <num> is the sum of the decimal values of the bits you
want to enable.
The Questionable Status Power Event Register latches transition events from the
condition register as specified by the transition filters. Event registers are
destructive read-only. Reading data from an event register will clear the content of
that register. To query the event register, send the command
:STATus:QUEStionable:POWer[:EVENt]?
See “Questionable Status Event Enable Register” on page 77 for an explanation of
how to set the summary bit using the event enable register. In this case, use the
command :STATus:QUEStionable:POWer:ENABle <num>.
Chapter 2 79
Page 80

Status Registers
Use Status Registers to Determine the State of Analyzer Events and Conditions
STATus:QUEStionable:FREQuency Register
Figure 2-12 Questionable Status Frequency Register Diagram
Bit descriptions in the Questionable Status Frequency Condition Register are given
in the following table.
80 Chapter 2
Page 81

Status Registers
Use Status Registers to Determine the State of Analyzer Events and Conditions
Bit Decimal
Description
Va lu e
00Source Synth Unlocked: A 1 in this bit position indicates
that the synthesizer in the source (tracking generator) is
unlocked.
12Freq Ref Unlocked: A 1 in this bit position indicates that
the analyzer frequency reference is unlocked.
24Reserved: This bit is not used by the analyzer, but are for
future use with other Agilent products.
38Reserved: This bit is not used by the analyzer, but is for
future use with other Agilent products.
416Synth Unlocked: A 1 in this bit position indicates that the
analyzer synthesizer is unlocked.
532Invalid Span or BW: A 1 in this bit position indicates
an invalid span or bandwidth during frequency count.
664Reserved: This bit is not used by the analyzer, but are for
future use with other Agilent products.
7 128 Reserved: This bit is not used by the analyzer, but are for
future use with other Agilent products.
8 256 Reserved: This bit is not used by the analyzer, but are for
future use with other Agilent products.
9 512 Demodulation: A 1 in this bit position indicates an invalid
span during FM Demodulation and Listen measurements.
10 1024 Unused: This bit is always set to 0.
11 2048 Unused: This bit is always set to 0.
12 4096 Unused: This bit is always set to 0.
13 8192 Unused: This bit is always set to 0.
14 16384 Unused: This bit is always set to 0.
15 32768 Always Zero (0): This bit is always set to 0.
Chapter 2 81
Page 82

Status Registers
Use Status Registers to Determine the State of Analyzer Events and Conditions
Questionable Status Frequency Condition and
Event Enable Registers
The Questionable Status Frequency condition register continuously monitors
output frequency status of the analyzer. Condition registers are read-only. To query
the condition register, send the command
:STATus:QUEStionable:FREQuency:CONDition? The response will be
the decimal sum of the bits which are set to 1.
The negative and positive transition filters specify which types of bit state changes
in the condition register will set corresponding bits in the event register. The
changes may be positive (from 0 to 1) or negative (from 1 to 0). Send the
command :STATus:QUEStionable:FREQuency
:NTRansition <num> (negative transition) or :STATus:QUEStionable
:FREQuency:PTRansition <num> (positive transition) where <num> is the
sum of the decimal values of the bits you want to enable.
The Questionable Status Frequency Event register latches transition events from
the condition register as specified by the transition filters. Event registers are
destructive read-only. Reading data from an event register will clear the content of
that register. To query the event register, send the command
:STATus:QUEStionable:FREQuency
[:EVENt]?
See “Questionable Status Event Enable Register” on page 77 for an explanation of
how to set the summary bit using the event enable register. In this case, use the
command :STATus:QUEStionable:FREQ:ENABle <num>.
82 Chapter 2
Page 83

Status Registers
Use Status Registers to Determine the State of Analyzer Events and Conditions
STATus:QUEStionable:CALibration Register
Figure 2-13 Questionable Status Calibration Register Diagram
Chapter 2 83
Page 84

Status Registers
Use Status Registers to Determine the State of Analyzer Events and Conditions
Bit descriptions in the Questionable Status Calibration Condition Register are
given in the following table.
Bit Decimal
Va lu e
00Reserved: This bit is not used by the analyzer, but are for
12Reserved: This bit is not used by the analyzer, but are for
24TG Align Failure: A 1 in this bit position indicates that a
38RF Align Failure: A 1 in this bit position indicates that a
416IF Align Failure: A 1 in this bit position indicates that a
532LO Align Failure: A 1 in this bit position indicates that
664ADC Align Failure: A 1 in this bit position indicates that
Description
future use with other Agilent products.
future use with other Agilent products.
failure has occurred while trying to align the tracking
generator (TG).
failure has occurred while trying to align the RF section.
failure has occurred while trying to align the IF section.
a failure has occurred while trying to align the local oscillator
(LO).
a failure has occurred while trying to align the
analog-to-digital converter (ADC).
7128FM Demod Align Failure: A 1 in this bit position
indicates that a failure has occurred while trying to align the
FM demodulation circuitry.
8256Misc/Sys Align Failure: A 1 in this bit position
indicates that a failure has occurred while trying to align the
quasi-peak detector.
9512Unused: This bit is always set to 0.
10 1024 Tracking Peak Needed: A 1 in this bit position indicates
that a tracking peak needs to be performed (the tracking
generator is in operation). (Agilent EMC models E7402A,
E7403A, E7404A, and E7405A, with Option 1DN, Tracking
Generator, only).
11 2048 Align RF Skipped: A 1 in this bit position indicates that
the alignment of the RF section was skipped, perhaps due to
an external 50 MHz signal having been detected.
12 4096 Align RF Now Needed: A 1 in this bit position indicates
that the RF section needs to be aligned.
13 8192 Reserved: This bit is not used by the analyzer, but is for
future use with other Agilent products.
84 Chapter 2
Page 85

Status Registers
Use Status Registers to Determine the State of Analyzer Events and Conditions
Bit Decimal
Description
Va lu e
14 16384 Align Needed: A 1 in this bit position indicates that a full
alignment is needed, perhaps due to a large temperature
change having been detected with auto align off, or due to
default data being used.
15 32768 Always Zero (0): This bit is always set to 0.
Chapter 2 85
Page 86

Status Registers
Use Status Registers to Determine the State of Analyzer Events and Conditions
STATus:QUEStionable:INTegrity:UNCalibrated Register
Figure 2-14 Questionable Status Integrity Uncalibrated Register Diagram
Bit descriptions in the Questionable Status Integrity Uncalibrated Condition
Register are given in the following table.
86 Chapter 2
Page 87

Status Registers
Use Status Registers to Determine the State of Analyzer Events and Conditions
Bit Decimal
Va lu e
00Oversweep (Meas Uncal): A 1 in this position indicates
12Signal Ident ON: A 1 in this bit position indicates that
24Reserved: This bit is not used by the analyzer, but is for
3 8Unused: This bit is always set to 0.
416Unused: This bit is always set to 0.
5 32Unused: This bit is always set to 0.
6 64Unused: This bit is always set to 0.
7 128 Unused: This bit is always set to 0.
8 256 Unused: This bit is always set to 0.
Description
that the analyzer is in a state that could lead to uncalibrated
measurements. This is typically caused by sweeping too fast
for the current combination of span, resolution bandwidth, and
video bandwidth. Auto coupling may resolve this problem.
amplitude measurements may be in error due to signal
identification routines being active. Amplitude accuracy is
degraded when signal identification is active.
future use with other Agilent products.
9 512 Unused: This bit is always set to 0.
10 1024 Unused: This bit is always set to 0.
11 2048 Unused: This bit is always set to 0.
12 4096 Unused: This bit is always set to 0.
13 8192 Unused: This bit is always set to 0.
14 16384 Unused: This bit is always set to 0.
15 32768 Always Zero (0): This bit is always set to 0.
Questionable Status Calibration Condition and
Event Enable Registers
The Questionable Status Calibration condition register continuously monitors the
calibration status of the analyzer. Condition registers are read-only. To query the
condition register, send the command
:STATus:QUEStionable:CALibration:CONDition? The response will be
the decimal sum of the bits which are set to 1.
The transition filter specifies which types of bit state changes in the condition
register will set corresponding bits in the event register. The changes may be
positive (from 0 to 1) or negative (from 1 to 0). Send the command
Chapter 2 87
Page 88

Status Registers
Use Status Registers to Determine the State of Analyzer Events and Conditions
:STATus:QUEStionable:CALibration:NTRansition <num> (negative
transition) or :STATus:QUEStionable:CALibration:PTRansition
<num> (positive transition) where <num> is the sum of the decimal values of the
bits you want to enable.
The Questionable Status Calibration Event register latches transition events from
the condition register as specified by the transition filters. Event registers are
destructive read-only. Reading data from an event register will clear the content of
that register. To query the event register, send the command
:STATus:QUEStionable:CALibration
[:EVENt]?
See “Questionable Status Event Enable Register” on page 77 for an explanation of
how to set the summary bit using the event enable register. In this case, use the
command :STATus:QUEStionable:CALibration:ENABle <num>.
Questionable Status Integrity Uncalibrated Condition and
Event Enable Registers
The Questionable Status Integrity Uncalibrated Condition Register continuously
monitors the calibration status of the analyzer. Condition registers are read-only.
To query the condition register, send the command
:STATus:QUEStionable:INTegrity:UNCalibrated:CONDition? The
response will be the decimal sum of the bits which are set to 1.
The transition filter specifies which types of bit state changes in the condition
register will set corresponding bits in the event register. The changes may be
positive (from 0 to 1) or negative (from 1 to 0). Send the command
:STATus:QUEStionable:INTegrity:UNCalibrated:NTRansition
<num> (negative transition) or
:STATus:QUEStionable:INTegrity:UNCalibrated:PTRansition
<num> (positive transition) where <num> is the sum of the decimal values of the
bits you want to enable.
The Questionable Status Integrity Uncalibrated Event Register latches transition
events from the condition register as specified by the transition filters. Event
registers are destructive read-only. Reading data from an event register will clear
the content of that register. To query the event register, send the command
:STATus:QUEStionable:INTegrity:UNCalibrated[:EVENt]?
See “Questionable Status Event Enable Register” on page 77 for an explanation of
how to set the summary bit using the event enable register. In this case, use the
command :STATus:QUEStionable:INTegrity:UNCalibrated:ENABle
<num>.
88 Chapter 2
Page 89

Status Registers
Use Status Registers to Determine the State of Analyzer Events and Conditions
STATus:QUEStionable:INTegrity Register
Figure 2-15 Questionable Status Integrity Register Diagram
Bit descriptions in the Questionable Status Integrity Condition Register are given
in the following table.
Chapter 2 89
Page 90

Status Registers
Use Status Registers to Determine the State of Analyzer Events and Conditions
Bit Decimal
Description
Val ue
01Reserved: This bit is not used by the analyzer, but is for
future use with other Agilent products.
12Reserved: This bit is not used by the analyzer, but is for
future use with other Agilent products.
24Reserved: This bit is not used by the analyzer, but is for
future use with other Agilent products.
38Data Uncalibrated Summary: This is the summary
bit for the Questionable Status Integrity Uncalibrated
Register.
416IF/ADC Over Range: The signal input level is too high,
causing the analyzer analog-to-digital converter (ADC)
range to be exceeded. This may occur with resolution
bandwidths less than or equal to 300 Hz in zero span.
5 32Reserved: This bit is not used by the analyzer, but are for
future use with other Agilent products.
6 64Reserved: This bit is not used by the analyzer, but are for
future use with other Agilent products.
7 128Reserved: This bit is not used by the analyzer, but are for
future use with other Agilent products.
8 256Reserved: This bit is not used by the analyzer, but are for
future use with other Agilent products.
9 512 Reserved: This bit is not used by the analyzer, but are for
future use with other Agilent products.
10 1024 Reserved: This bit is not used by the analyzer, but are for
future use with other Agilent products.
11 2048 Reserved: This bit is not used by the analyzer, but are for
future use with other Agilent products.
12 4096 Invalid Data: A 1 in this bit position indicates that the
present trace data does not reflect the existing analyzer
state. Trigger a new sweep and/or measurement.
13 8192 Reserved: This bit is not used by the analyzer, but is for
future use with other Agilent products.
14 16384 Reserved: This bit is not used by the analyzer, but is for
future use with other Agilent products.
15 32768 Always Zero (0): This bit is always set to 0.
90 Chapter 2
Page 91

Status Registers
Use Status Registers to Determine the State of Analyzer Events and Conditions
Questionable Status Integrity Event Condition and
Enable Registers
The Questionable Status Integrity Condition Register continuously monitors the
calibration status of the analyzer. Condition registers are read-only. To query the
condition register, send the command
:STATus:QUEStionable:INTegrity:CONDition? The response will be
the decimal sum of the bits which are set to 1.
The transition filter specifies which types of bit state changes in the condition
register will set corresponding bits in the event register. The changes may be
positive (from 0 to 1) or negative (from 1 to 0). Send the command
:STATus:QUEStionable:INTegrity:NTRansition <num> (negative
transition) or :STATus:QUEStionable:INTegrity:PTRansition <num>
(positive transition) where <num> is the sum of the decimal values of the bits you
want to enable.
The Questionable Status Integrity Event Register latches transition events from the
condition register as specified by the transition filters. Event registers are
destructive read-only. Reading data from an event register will clear the content of
that register. To query the event register, send the command
:STATus:QUEStionable:INTegrity[:EVENt]?
See “Questionable Status Event Enable Register” on page 77 for an explanation of
how to set the summary bit using the event enable register. In this case, use the
command :STATus:QUEStionable:INTegrity:ENABle <num>.
Chapter 2 91
Page 92

Status Registers
Use Status Registers to Determine the State of Analyzer Events and Conditions
92 Chapter 2
Page 93

3 Programming Examples
This chapter includes examples of how to program the analyzer using the analyzer
SCPI programming commands. Twelve examples are written for an analyzer with
an GPIB interface (Option A4H). Three examples are written for an analyzer with
an RS-232 interface (Option 1AX).
93
Page 94

Programming Examples
List of Programming Examples
List of Programming Examples
The programming examples included in this chapter are:
“Using Marker Peak Search and Peak Excursion”
“Using Marker Delta Mode and Marker Minimum Search”
“Performing Internal Self-alignment”
“Reading Trace Data using ASCII Format (GPIB)”
“Reading Trace Data Using 32-bit Real Format (GPIB)”
“Reading Trace Data Using ASCII Format (RS-232)”
“Reading Trace Data Using 32-bit Real Format (RS-232)”
“Using Limit Lines”
“Measuring Noise”
“Entering Amplitude Correction Data”
“Status Register–Determine When a Measurement is Done”
“Determine if an Error has Occurred”
“Measuring Harmonic Distortion (GPIB)”
“Measuring Harmonic Distortion (RS-232)”
“Making Faster Measurements (multiple measurements)”
94 Chapter 3
Page 95

Programming Examples
Programming Examples System Requirements
Programming Examples System Requirements
These examples were written for use on an IBM compatible PC configured as
follows:
• Pentium processor
1
• Windows 95
• C programming language
• National Instruments GPIB interface card (for analyzers with Option A4H)
• National Instruments VISA Transition Libraries (VTL)
• COM1 serial port configured as follows (for analyzers with Option 1AX)
— 9600 baud
— 8 data bits
or Windows NT 4.0 operating system
— 1 stop bit
— no parity bits
— hardware flow control
A HP/Agilent 82341C card may be substituted for the National Instruments GPIB,
and the HP VISA libraries may be substituted for the National Instruments VISA
Transition Libraries. If substitutions are made, the subdirectories for the include
and library files will be different than those listed in the following paragraphs.
Refer to the documentation for your interface card and the VISA libraries for
details.
1. Microsoft is a U.S. registered trademark of Microsoft Corporation.
Chapter 3 95
Page 96

Programming Examples
C Programming Examples using VTL
C Programming Examples using VTL
The programming examples that are provided in this guide are written using the
C programming language and the VTL (VISA transition library). This section
includes some basic information about programming in the C language. Refer to
your C programming language documentation for more details. (This information
is taken from the manual “HP VISA Transition Library”, HP part number
E2090-90026.) If you are using the National Instruments VISA library, most of
this information will still apply, but the include and library files will be in different
subdirectories. Also, this information assumes a computer running a Windows 95
operating system with an HP/Agilent 82341C GPIB interface card is being used.
The following topics are included:
“Typical Example Program Contents” on page 96.
“Linking to VTL Libraries” on page 97.
“Compiling and Linking a VTL Program” on page 97.
“Example Program” on page 99.
“Including the VISA Declarations File” on page 99.
“Opening a Session” on page 100.
“Device Sessions” on page 100.
“Addressing a Session” on page 102.
“Closing a Session” on page 103.
Typical Example Program Contents
The following is a summary of the VTL function calls used in the example
programs.
visa.h This file is included at the beginning of the file to provide the
function prototypes and constants defined by VTL.
ViSession The ViSession is a VTL data type. Each object that will
establish a communication channel must be defined as
ViSession.
viOpenDefaultRM
You must first open a session with the default resource manager
with the viOpenDefaultRM function. This function will
initialize the default resource manager and return a pointer to
that resource manager session.
viOpen This function establishes a communication channel with the
device specified. A session identifier that can be used with other
VTL functions is returned. This call must be made for each
device you will be using.
96 Chapter 3
Page 97

Programming Examples
C Programming Examples using VTL
viPrintf
viScanf These are the VTL formatted I/O functions that are patterned
after those used in the C programming language. The
viPrintf call sends the SCPI commands to the analyzer. The
viPrintf call can also be used to query the analyzer. The
viScanf call is then used to read the results.
viClose This function must be used to close each session. When you
close a device session, all data structures that had been allocated
for the session will be deallocated. When you close the default
manager session, all sessions opened using the default manager
session will be closed.
Linking to VTL Libraries
Your application must link to one of the VTL import libraries:
32-bit Version (assumes Windows 95 operating system):
C:\VXIPNP\WIN95\LIB\MSC\VISA32.LIB for Microsoft compilers
C:\VXIPNP\WIN95\LIB\BC\VISA32.LIB for Borland compilers
16-bit Version:
C:\VXIPNP\WIN\LIB\MSC\VISA.LIB for Microsoft compilers
C:\VXIPNP\WIN\LIB\BC\VISA.LIB for Borland compilers
See the following section for information on how to use the VTL run-time
libraries.
Compiling and Linking a VTL Program
32-bit Applications (assumes Windows 95 operating system)
The following is a summary of important compiler-specific considerations for
several C/C++ compiler products when developing WIN32 applications.
For Microsoft Visual C++ version 2.0 compilers:
• Select Project | Update All Dependencies from the menu.
• Select Project | Settings from the menu. Click on the C/C++ button.
Select Code Generation from the Use Run-Time Libraries list
box. VTL requires these definitions for WIN32. Click on OK to close the dialog
boxes.
Chapter 3 97
Page 98

Programming Examples
C Programming Examples using VTL
• Select Project | Settings from the menu. Click on the Link button
and add visa32.lib to the Object / Library Modules list box.
Optionally, you may add the library directly to your project file. Click on OK to
close the dialog boxes.
• You may wish to add the include file and library file search paths. They are set
by doing the following:
1. Select Tools | Options from the menu.
2. Click on the Directories button to set the include file path.
3. Select Include Files from the Show Directories For list box.
4. Click on the Add button and type in the following:
C:\VXIPNP\WIN95\INCLUDE
5. Select Library Files from the Show Directories For list box.
6. Click on the Add button and type in the following:
C:\VXIPNP\WIN95\LIB\MSC
For Borland C++ version 4.0 compilers:
• You may wish to add the include file and library file search paths. They are set
under the Options | Project menu selection. Double click on
Directories from the Topics list box and add the following:
C:\VXIPNP\WIN95\INCLUDE
C:\VXIPNP\WIN95\LIB\BC
16-bit Applications
The following is a summary of important compiler-specific considerations for the
Windows compiler.
For Microsoft Visual C++ version 1.5:
• To set the memory model, do the following:
1. Select Options | Project.
2. Click on the Compiler button, then select Memory Model from the
Category list.
3. Click on the Model list arrow to display the model options, and select
Large.
4. Click on OK to close the Compiler dialog box.
• You may wish to add the include file and library file search paths. They are set
under the Options | Directories menu selection:
C:\VXIPNP\WIN\INCLUDE
C:\VXIPNP\WIN\LIB\MSC
Otherwise, the library and include files should be explicitly specified in the
project file.
98 Chapter 3
Page 99

Programming Examples
C Programming Examples using VTL
Example Program
This example program queries a GPIB device for an identification string and prints
the results. Note that you must change the address if something other than the
EMC default value of 18 is required.
/*idn.c - program filename */
#include "visa.h"
#include <stdio.h>
void main ()
{
/*Open session to GPIB device at address 18 */
ViOpenDefaultRM(&defaultRM);
ViOpen(defaultRM, “GPIB0::18::INSTR”, VI_NULL,
VI_NULL, &vi);
/*Initialize device */
viPrintf(vi, “*RST\n”);
/*Send an *IDN? string to the device */
printf(vi, “*IDN?\n”);
/*Read results */
viScanf(vi, "%t", &buf);
/*Print results */
printf(“Instrument identification string: %s\n”, buf);
/* Close the sessions */
viClose(vi);
viClose(defaultRM);
}
Including the VISA Declarations File
For C and C++ programs, you must include the visa.h header file at the
beginning of every file that contains VTL function calls:
#include “visa.h”
This header file contains the VISA function prototypes and the definitions for all
VISA constants and error codes. The visa.h header file includes the
visatype.h header file.
Chapter 3 99
Page 100

Programming Examples
C Programming Examples using VTL
The visatype.h header file defines most of the VISA types. The VISA types are
used throughout VTL to specify data types used in the functions. For example, the
viOpenDefaultRM function requires a pointer to a parameter of type
ViSession. If you find ViSession in the visatype.h header file, you will
find that ViSession is eventually typed as an unsigned long.
Opening a Session
A session is a channel of communication. Sessions must first be opened on the
default resource manager, and then for each device you will be using. The
following is a summary of sessions that can be opened:
• A resource manager session is used to initialize the VISA system. It is a
parent session that knows about all the opened sessions. A resource manager
session must be opened before any other session can be opened.
• A device session is used to communicate with a device on an interface. A
device session must be opened for each device you will be using. When you use
a device session you can communicate without worrying about the type of
interface to which it is connected. This insulation makes applications more
robust and portable across interfaces. Typically a device is an instrument, but
could be a computer, a plotter, or a printer.
NOTE All devices that you will be using need to be connected and in working condition
prior to the first VTL function call (viOpenDefaultRM). The system is
configured only on the first viOpenDefaultRM per process. Therefore, if
viOpenDefaultRM is called without devices connected and then called again
when devices are connected, the devices will not be recognized. You must close
ALL resource manager sessions and re-open with all devices connected and in
working condition.
Device Sessions
There are two parts to opening a communications session with a specific device.
First you must open a session to the default resource manager with the
viOpenDefaultRM function. The first call to this function initializes the default
resource manager and returns a session to that resource manager session. You only
need to open the default manager session once. However, subsequent calls to
viOpenDefaultRM returns a session to a unique session to the same default
resource manager resource.
Next, you open a session with a specific device with the viOpen function. This
function uses the session returned from viOpenDefaultRM and returns its own
session to identify the device session. The following shows the function syntax:
viOpenDefaultRM (sesn);
viOpen (sesn, rsrcName, accessMode, timeout, vi);
100 Chapter 3
 Loading...