

Page 1

Application Note
Cardiovascular Research
Assessment of Cardiomyocyte
Disease Models Using the Agilent
xCELLigence CardioECR System
Authors
Xiaoyu Zhang, Jeff Li, and
Yama Abassi
Agilent Technologies, Inc.
Abstract
The Agilent xCELLigence RTCA CardioECR system combines simultaneous
measurement of field potential signal using extracellular recording (ECR) electrodes
as well as contractility and viability using impedance electrodes. The real-time
multiplexed evaluation of the functional activity of beating cardiomyocytes using
the CardioECR system allows for depicting and recapitulating disease phenotype of
cardiomyocytes differentiated from patient-specific induced pluripotent stem cell
(PS-iPSC) and investigating their pharmacological responses, which could potentially
provide information about underlying disease mechanisms.
Page 2
Introduction
B
ECR/FP
In 2006, Yamanaka and his colleagues
established the first induced pluripotent
stem cells (iPSC) from murine
fibroblasts via transduction of four
specific transcriptional factors. This
novel discovery was also translated to
human somatic cells and has created
a new frontier in the medical field in
many respects. The characteristics of
iPSCs, including infinite self-renewal
and multipotency, allow them to be
potentially used in a wide variety of
applications, including disease modeling,
drug screening, and regenerative
therapy.
iPSCs obtained from patients maintain
patient-specific genetic lesions, providing
a rationale for disease modeling using
patient-specific iPSCs (PS-iPSCs).
Even though primary patient cells have
previously been used for studying
disease mechanisms, certain cell types
such as neurons and cardiomyocytes,
are rather difficult to obtain. The
scalability of primary diseased cells
and the duration of maintaining these
cells in culture has also been a hurdle
for investigating disease mechanisms.
PS-iPSC differentiated target cells
provide researchers with a stable,
scalable, and physiologically relevant
cell source for disease modeling.5
To date, numerous studies have
reported that these target cells can
recapitulate disease phenotypes similar
to those observed from patients. The
pathophysiological cellular phenotypes
of genetically heritable heart diseases,
such as cardiomyopathies and
channelopathies, have been successfully
modeled invitro using patient-specific
iPSC-derived cardiomyocytes
(PS-iPSC-CMs).6 These model systems
are promising tools for understanding
disease mechanisms and can potentially
be used in drug discovery, personalized
1,2
It is well established that
3,4
medicine, and cardiac liability
assessment in specific populations that
may carry geneticanomalies.
This application note used the
AgilentxCELLigence RTCA CardioECR
system (CardioECR system) to compare
functional profiles of contractility and
electrophysiology between a PS-iPSCCM disease model and its isogenic
control. After identifying baseline
phenotypes at the cellular level, this
study investigated pharmacological
responses of diseased and isogenic
cardiomyocytes to compounds with
established mechanisms. As a further
approach to assessing the responses
of the wild type and diseased CM, both
cell lines were subjected to electrical
stimulation followed by treatment with
isoproterenol.
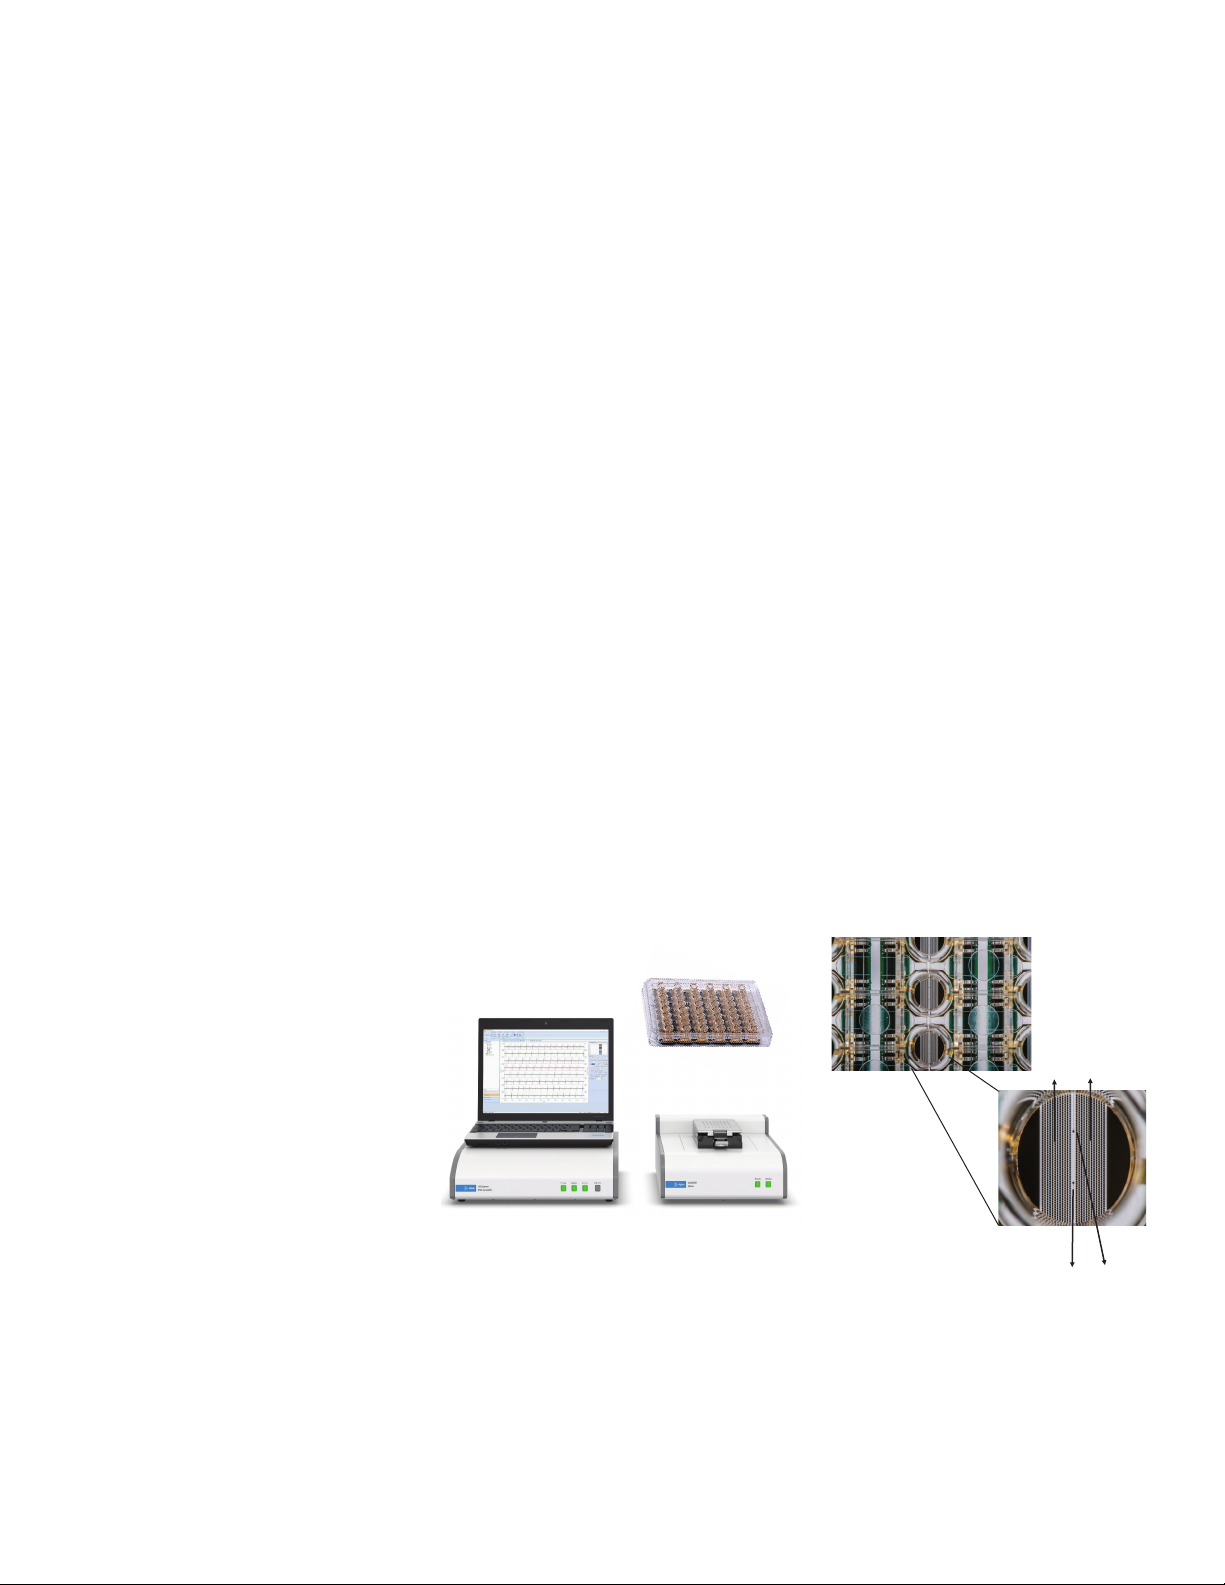
components, CardioECR control unit
(laptop), CardioECR analyzer, CardioECR
station, and E-plate CardioECR 48
(CardioECR plate) (Figure 1A). Two
sets of electrodes, interdigitated
impedance (IMP) micro-electrode
arrays as well as two individual field
potential electrodes are integrated
into the bottom of each well of the
CardioECR plate (Figure 1B). Similar to
other Agilent xCELLigence platforms, the
CardioECR System uses IMP electrodes
to measure cellular impedance, which
is affected by the number of cells
covering the electrode, the morphology
of the cells, and the extent of cell
attachment. The fast sampling rate of
IMP measurement (2ms) allows for
capturing of the temporal rhythmic
changes in cell morphology and
degree of cell attachment to the plate,
Assay principle
The xCELLigence RTCA CardioECR
system is a dual-mode instrument that
includes both simultaneous monitoring
of hiPSC-CM viability, contraction,
and field potential (FP) in real time
as well as directed electrical pacing
of hiPSC-CMs. It consists of four
A
Figure 1. (A) The Agilent xCELLigence RTCA CardioECR system consists of four components: Control
unit/laptop, CardioECR analyzer (left), CardioECR station (right), and E-PlateCardioECR 48. (B) A close-up
image of E-Plate CardioECR48. Inset: a close-up of the wells reveals the layout of the electrodes,
impedance (IMP) electrode assays, and two field potential (FP) electrodes.
which is a hallmark of contraction
of cardiomyocytes. Therefore, the
physical contraction of cardiomyocytes
is monitored and recorded in real
time with high temporal resolution.
Additionally, the millisecond time
resolution can be performed at regular
intervals over a prolonged duration of
IMP
2
Page 3
time providing beating and viability
Da
information of cardiomyocytes in real
time. Furthermore, two field potential
electrodes are used to measure
integrated ion channel activities at a data
acquisition rate of 10 kHz simultaneously
while IMP recording is taking place via
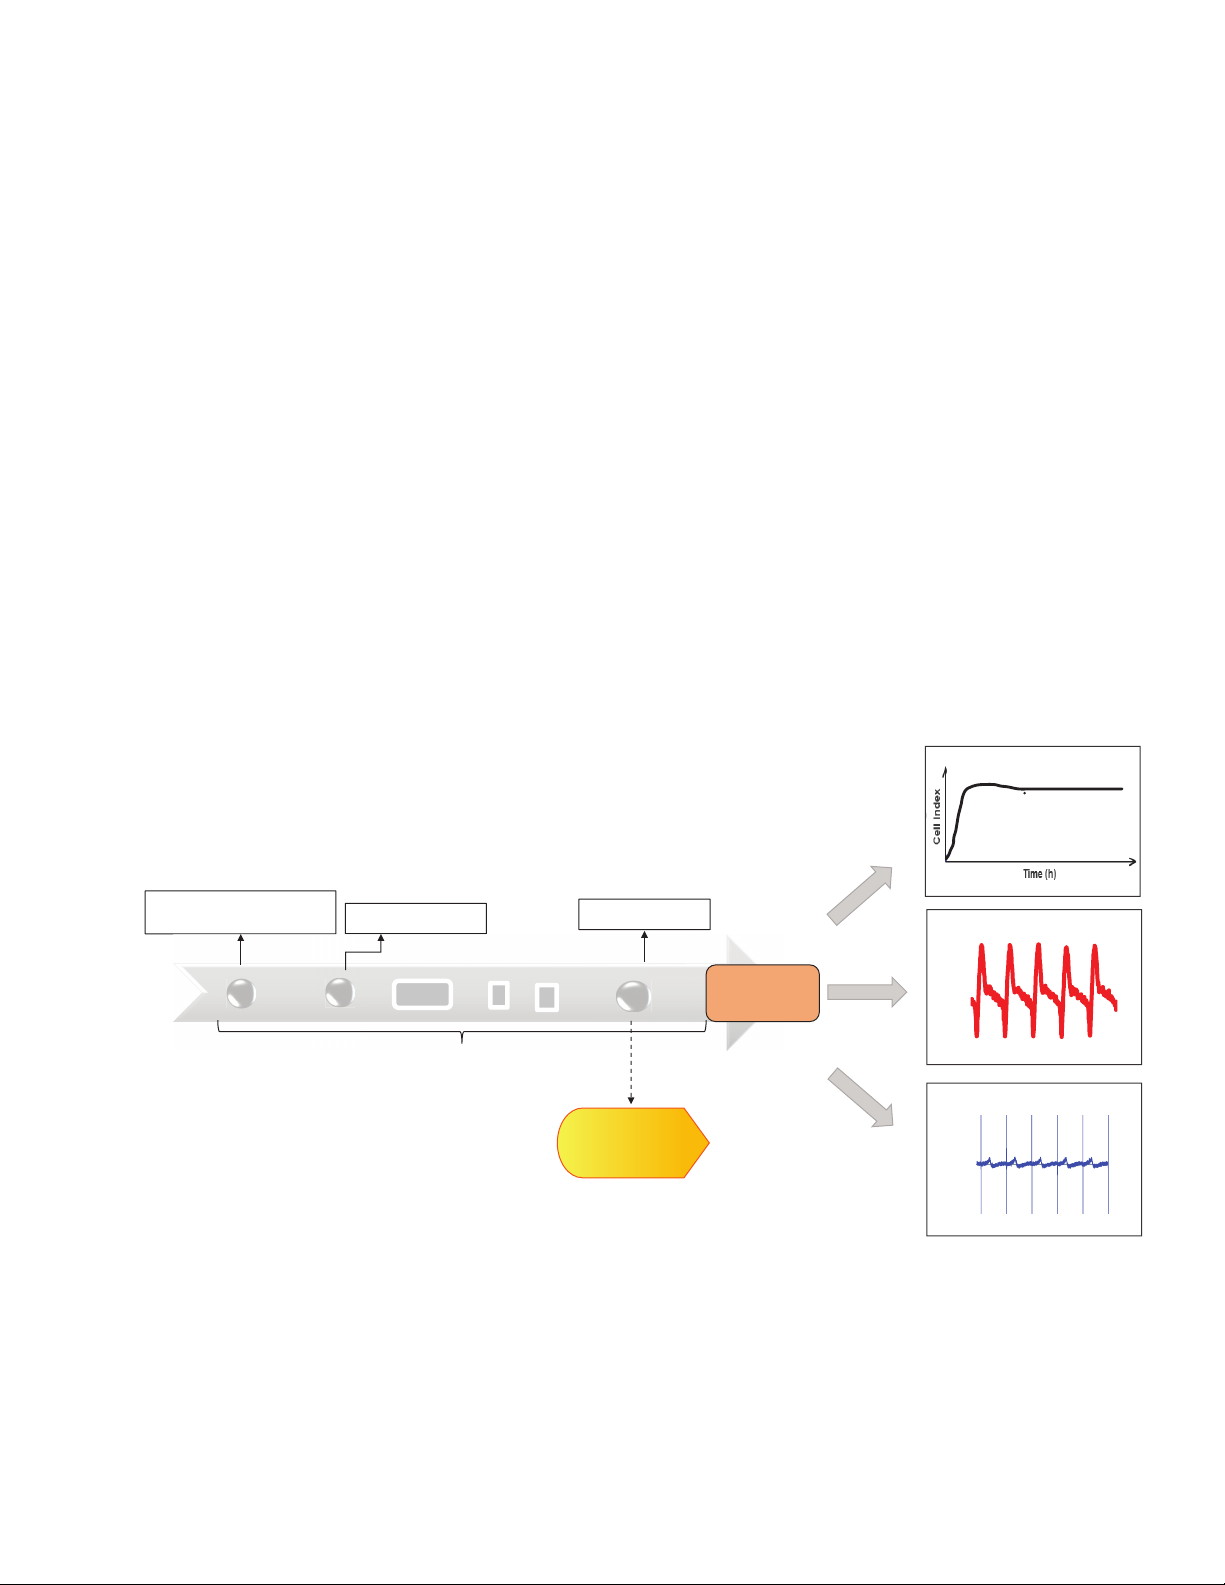
IMP electrodes. A typical workflow of
cardiomyocyte assay using CardioECR
system is shown in Figure 2.
One of the other critical features of
the CardioECR system is its ability
to electrically pace cardiomyocytes.
During electrical pacing, electrical
pulses are directly applied to the cells
through the IMP electrodes. For most
cardiomyocytes, the length of each
electrical pulse employed by the IMP
electrode is less than 2 ms, which allows
the contractile activities of cells to be
immediately captured and recorded
while the cells are being paced by IMP
electrodes. The optimal conditions for
electrical pacing are dependent on the
cell type, the inherent beating frequency,
and the experimental context. The pacing
functionality of the CardioECR system is
suitable for both acute pacing regimens
to evaluate compound effects on
contractility under controlled beating rate
and long-term stimulation used for the
improvement of functional maturation of
hiPSC-CMs.
Raw data collected from IMP electrodes
and ECR electrodes were analyzed
offline using Agilent xCELLigence RTCA
CardioECR data analysis software. The
software provides users with more
than 25 analysis parameters based on
IMP and FP signals to assess cardiac
cell beating and electric activities. The
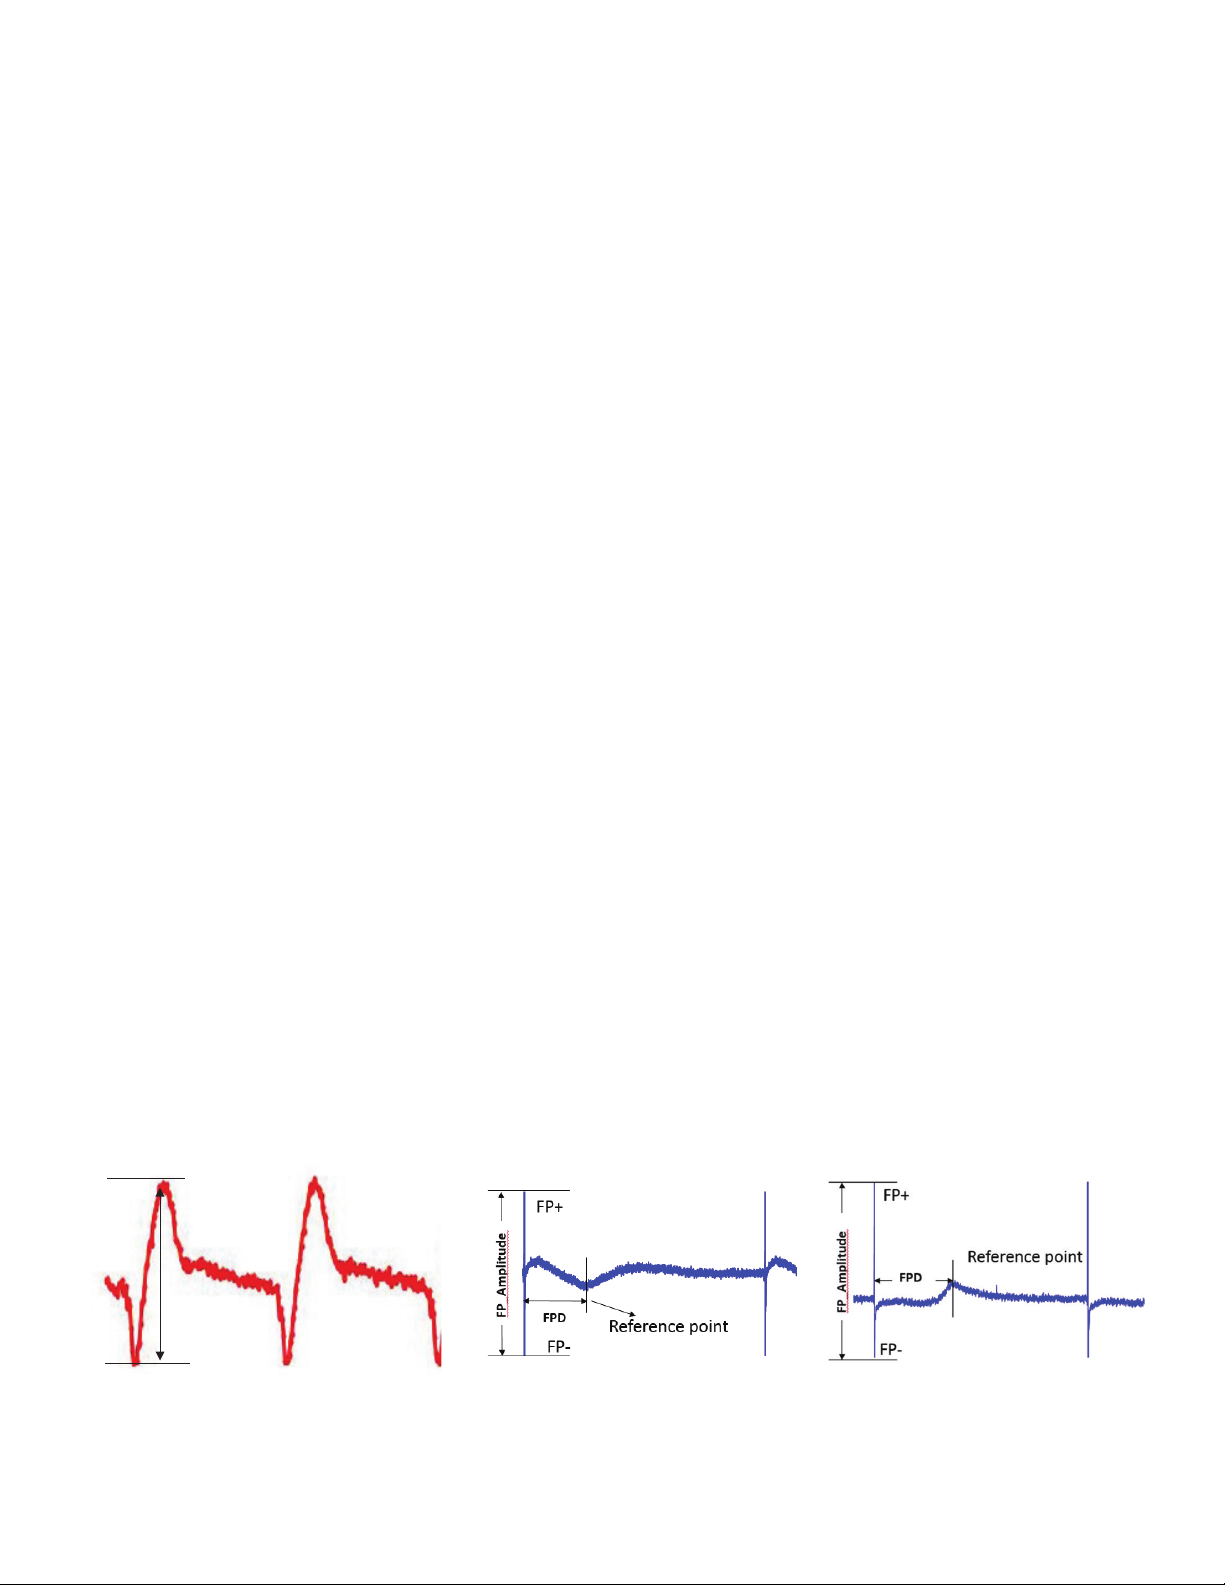
fundamental parameter for contractility
using cellular impedance measurement
are beating amplitude (BAmp) and
beating rate (BR). The beating rate
is defined as the number of beats
per unit of time and is expressed as
beats/minute. BAmp is defined as the
absolute (delta) Cell Index (CI) value
between the lowest and highest points
within a beating waveform (Figure 3A).
For analysis of FP signal, the FP spike
amplitude (FP-Amp) is derived, which
is the absolute (delta) value in mV from
the lowest point of the initial spike to
the highest point of the spike. The FP
Duration (FPD) is defined as the period
between the negative peak of the FP
spike to the maximum or minimum point
of the reference wave. The reference
wave can be negative or positive
depending on how the cells are situated
to the FP electrodes (Figure 3B).
Cell viability
Thaw cellsand plateinto
E-plateCardioECR 48
ys in culture
Figure 2. (A) The workflow of hiPSC cardiomyocyte assay using the Agilent xCELLigence RTCA CardioECR system: cell seeding on day 0, start to measure cell
performance on day 3, start cell status QC before compound addition, add compounds to the cells if they pass QC. Alternatively, after cells start to generate stable
and robust functional activity, approximately 5 days after seeding, progressive electrical pacing is applied to the cells for consecutive 15 days to achieve functional
maturation before compound addition.15 After treatment, cell viability, contraction, and electrophysiology are evaluated via IMP and FP readouts measured by
CardioECR system.
0
Signal acquisition
3
Medium change
Cell status QC
5 to 14
Progressive
electrical pacing
Compound
addition
Contractility/IMP
Cell Index
(impedance)
ECR(mV)
Fieldpotential
3
Page 4
Materials and methods
Beating amplitude
A
Cell culture
Patient-specific iPSC-derived
cardiomyocytes (PS-iPSC CMs) were
purchased from FUJIFILM Cellular
Dynamics International (FCDI, Madison,
WI, USA). The cells were stored in liquid
nitrogen until thawed and cultured
according to manufacturer instructions.
Briefly, each well of the E-Plate
CardioECR 48 (Agilent Technologies,
Santa Clara, CA, USA) was coated with
50 µL of a 1:100 diluted fibronectin
(FN) solution at 10 µg/mL (F1114,
Sigma-Aldrich, St. Louis, MO, USA) and
incubated at 37 °C for at least 1hour.
Next, the fibronectin solution was
replaced with 50 µL of prewarmed iCell
cardiomyocyte plating medium. Cells
were thawed and diluted in prewarmed
plating medium at the manufacture’s
recommended concentration. 50 µL
of the cell suspension was transferred
using a multichannel pipette and
seeded directly onto a precoated E-Plate
CardioECR 48 (20,000 viable and
plateable cells/well) in a laminar hood.
The plates containing PS-iPSC CMs were
kept in the hood at room temperature for
30 minutes, then placed and cultivated
in a humidified incubator with 5% CO2 at
37 °C. The plating medium was replaced
with iCell cardiomyocyte maintenance
medium 48 hours postseeding. A
medium change was performed every
other day afterward.
Chemical reagents
All the chemical reagents were
purchased from Tocris (Minneapolis, MN,
USA), Sigma-Aldrich (St. Louis, MO, USA),
or provided by the Chemotherapeutic
Agents Repository of the National Cancer
Institute. The 1,000-fold chemical stock
solutions were prepared in DMSO and
stored at –20 °C. The serially diluted
chemicals (1,000-fold) were further
prepared in DMSO immediately before
compound addition. The 10-fold final
dilution of the chemicals was prepared
with the culture medium for a single-time
use only. The final concentration of
DMSO in the treated well was 0.1%.
Results and discussion
Evaluation Brugada channelopathy
model using CardioECR system
Brugada syndrome (BrS) is one of
the more common forms of familial
arrhythmic syndromes characterized
by a dynamic or persistent ST
segment elevation, an enhanced risk of
syncope, and sudden cardiac death in
young adults without structural heart
disease.
genes identified so far, L-type Ca2+
channelopathy of loss-of-function
mutations in the CACNA1C (Cav1.2a1)
has been reported to give rise toBrS
Type 3(BrS3).
7,8
Among several responsible
8,9
This study used used BrS3
cardiomyocytes (BrS3 CMs) purchased
from Fujifilm CDI (Fujifilm CDI, part
number R1136). This BrS3 CM line
possesses a change of amino acid 490
from glycine-to-arginine (G490R), which
was genetically engineered into the
genome of iCell cardiomyocytes (iCell
CMs) derived from a healthy donor with
no known disease-related genotypes.
iCell CMs (Fujifilm CDI, part number
R11320) were used as the isogenic
control for BrS3 CMs. To investigate
the functional consequences of the
mutation, the BrS3 CMs and WT iCell
CMs were seeded first on the same
E-Plate CardioECR 48 at the same
seeding density (20,000 cells/well). The
cell performance, including attachment,
growth, and functional activities were
monitored and recorded immediately
after cell seeding. Figure 4A shows
that BrS3 had slower kinetics of cell
attachment and spreading than the
control line reflected by the lower
slope at the exponential phase of the
Cell Index curve. Overall, Cell Index
values of BrS3 were generally smaller
than the control line. In addition to the
attachment and growth profiles, the
excitation-contraction profiles of the
BrS3 CM and WT iCell CM displayed
significant differences. As shown in
Figures 4B and 4D, the BAmp of BrS3
CMs was smaller than control cells by
27 ±13% while the BR of BrS3 was faster
Figure 3. Definition of main parameters used to evaluate cell contractile and field potential activities. (A) The typical IMP waveform/contraction pattern and (B) the
typical field potential (FP) waveforms were obtained from diseased and WT CM. The reference point can be negative or positive.
+
–––
4
+
B
Page 5

than the control by 26 ±17%. Even though
30
Cell Index
A
there was no noticeable difference in the
Fridericia corrected FPD (FPDc) between
the two lines, the BrS3 line exhibited a
smaller amplitude of FP spike (FP-Amp)
compared to the WT cells.
The next step was to assess the
pharmacological responses to the
calcium channel modulators, isradipine
and BayK 8644. Isradipine is a Ca2+
channel blocker with negative inotropic
activity. However, BayK 8644 is a Ca2+
channel activator, which increases
the action potential duration of
25
20
cardiomyocytes.10 The cell responses to
isradipine and BayK8644 were evaluated
by the percentage change in beating
amplitude, beating rate, and corrected
FPD, 30 minutes postdrug. Isradipine
caused a dose-dependent reduction of
beating amplitude, increase in beating
rate, and decrease in FPDc (Figure 5A)
in both lines. BrS3 and WT showed
similar percentage changes of the
parameters at all tested concentrates.
BrS3 and WT cardiomyocytes also had
appropriate responses to BayK 8644 as
evidenced by a dose-dependent decrease
in beating rate and prolongation of
BrS3
WT
FPDc (Figure5B) due to the activation
of the L-type Ca2+ channel. However, it
appeared that BayK844 caused more
significant impacts on beating rate and
FPDc in WT than in BrS3. A profound
difference in percentage change between
BrS3 and WT occurred at concentrations
above 10 nM. A concentration of 300nM
BayK 8644 increased FPDc by 77±16%
in WT and 50 ±9% in BrS3, but decreased
beating rate by 40 ±8% in WT and only
15±8% in BrS3 (Figure 5B).
15
10
5
0
04080120 160200 240
B
Time (hours)
BrS3
WT
C
BrS3
WT
Figures 4A to 4C. The profile of performance obtained from BrS3 and WT CM lines. (A) The overall Cell Index curve was recorded in real time after cell seeding.
(B)10seconds of IMP waveforms measured in BrS3 (red trace) and W T (black trace) CM lines, which were further averaged into single waveforms shown in the
overlay of BrS3 and WT IMP waveforms. (C) The overlay of FP waveforms recorded in BrS3 (red trace) and WT (black trace) CM lines.
5
Page 6

0.30
Cell Index
Beating amplitude
WT BrS3
Filed potential (mV)
WT BrS3
D
0.25
0.20
Beating rate
60
**
50
40
**
0.15
0.10
0.05
0
FP amplitude
7
6
5
4
3
2
1
0
BAmp
BR (beats/min)
FP_Amp (mV)
FPDc (ms)
WT BrS3
**
Br3 WT % Br3 to WT
0.17 ±0.03 0.24 ±0.04 73 ±13%
44 ±6 35 ±1 126 ±17%
2.18 ±0.83 4.50 ±1.64 48 ±18%
393.5 ±27.1 382.7 ±21.1 103 ±7%
30
Beats/min
20
10
0
FPDc
500
400
300
200
100
Filed potential duration (ms)
0
WT BrS3
Figure 4D. The functional activity of BrS3 and WT CM lines were evaluated and compared by beating amplitude (BAmp), beating rate (BR), the amplitude of FP
(FP-Amp) and corrected field potential duration (FPDc). The data are represented by mean ±std. dev., N ≥24. Statistical analysis by T-test, ** P <0.05.
Evaluation of LMNA-related dilated
cardiomyopathy model using
CardioECR system
Dilated cardiomyopathy (DCM) is
characterized by weakening heart
muscle due to the progressive loss of
functional cardiomyocytes, resulting in
reduced cardiac output and arrhythmia.
A portion of familial DCM is due to
mutations in theLMNAgene encoding
the nuclear lamina proteins lamin A
and C, which have an important role
in maintaining the shape and nuclear
structure, DNA and protein expression
level, and chromatin organization.11 To
get better insights into the pathobiology
behind LMNA mutation, the functional
DCM (L35P) (Fujifilm CDI, catalog
number R1153) was investigated
using the CardioECR system. The
LMNA-related DCM line (LMNA) was
differentiated from patient-specific
iPSCs, which harbor theLMNAL35P
mutation. In addition, an isogenic control
of LMNA-DCM (CTRL) generated using
genome engineering strategies to correct
the mutation (Fujifilm CDI, catalog
number R1154) was used in the study.
As in the BrS3 study, the LMNA and CTRL
lines were seeded in the same E-Plate
Cardio 48 at the same seeding density
(20,000 cells/well). The time course of
the overall Cell Index (Figure6A) showed
very similar kinetics between disease
phenotype of MyCellCardiomyocytes
and healthy lines. However, the Cell
Index curve of the disease line started
to show slightly smaller but significant
Cell Index values compared to the
control after five days post-seeding,
which persisted for the rest of the culture
time. The functional performance of the
control and diseased cells was recorded
(Figures6B and C) and evaluated after
both lines reached the stable stage with
respect to cell contraction on day 14
in culture. The fundamental contractile
activities, namely beating amplitude
and beating rate were quantified and
evaluated in both lines. LMNA CM
exhibited a significantly faster beating
rate by 43 ±5% and a smaller beating
amplitude by 18 ±8% compared to the
6
Page 7

20%
% Change % Change
Concentration (nM)
Concentration (nM)
Concentration (nM)
Beating amplitude – Isradipine
Beating rate – Isradipine
FPDc – Isradipine
A
B
0%
-20%
-40%
-60%
-80%
-100%
BrS3
WT
1310 30 100
Concentration (nM)
% Change % Change
120%
100%
80%
60%
40%
20%
0%
20%
0%
-20%
BrS3
WT
1310 30 100 1310 30 100
Concentration (nM)
% Change
-40%
-60%
-80%
BrS3
WT
Concentration (nM)
Beating amplitude – BayK8644
40%
20%
0%
-20%
-40%
-60%
13 10 30 100 300
Figure 5. The percentage change of the key parameters after compound addition. (A) % change of beating amplitude, beating rate to the time-matched vehicle
CTRL and % change of corrected FPD to the baseline 30 minutes after isradipine addition to BrS3 (red) and WT (black); (B) % change of beating amplitude, beating
rate to the time-matched vehicle CTRL and % change of corrected FPD to the baseline 30 minutes after BayK 8644 addition to BrS3 (red) and W T CMs (black).
CTRL (Figure 6D). Due to the profound
BR difference observed in both lines, and
compared FPD using two approaches,
Fridericia’s formula and electrical
stimulation, which controlled the BR of
both lines at 1 Hz during the evaluation
of FPD. Interestingly, both approaches
showed very similar results. LMNA cells
had significantly reduced FPD compared
to the control cells (Figure6D). It has
been reported that LMNA-related dilated
cardiomyopathy may associate with
weakening cardiac contraction.12 It was
further investigated if the LMNA line
would show phenotypic and functional
differences after the treatment by
isoproterenol (ISO), a βadrenergic
activator, which increases beating rate
and strengthens contractile force invivo.
Consistent with previous findings in
different hiPSC-CMs
displayed a significant increase in BR but
a decrease in BAmp after ISO addition
(Figure 7A). As shown previously15, the
ISO-induced decrease in BAmp was due
to the immaturity state of iPSC-derived
BrS3
WT
13,14
, both lines
cardiomyocytes. Therefore, a decision
to assess cell responses to ISO after
improving the functional maturation of
cells using long-term electrical pacing.
As demonstrated previously, the control
cells displayed a noticeable increase in
BAmp by 30% after electrical pacing.15
Intriguingly, LMNA CM did not have
display an improved response to ISO
compared to CTLR CM, potentially due to
defective contractile functionality of the
LMNA line.
This study explored the utility of the
CardioECR system for functional
assessment of diseased iPSC-CM lines.
It first evaluated iPSC-CM that contained
a common mutation found in Brugada
patients, which is a mutation in the
L-type Ca2+ channel. Brugada syndrome
is a hereditary primary electrical disease,
which is associated with right ventricular
conduction abnormalities in vivo.
Even though the conduction property
of the BrS3 line in the 2D cell model
could not be investigated, there was
an observation of abnormal contractile
Beating rate – BayK 8644
40%
20%
0%
-20%
-40%
-60%
BrS3
WT
13 10 30 100 300
and electrical activities at the cellular
level depicted by the simultaneous
measurement of IMP readout and FP
readout on the CardioECR system.
From a contractile/IMP perspective,
the BrS3 line exhibited a much smaller
beating amplitude and faster beating
rate compared to its isogenic control
(Figure4B), which is comparable with the
results of hiPSC-CMs treated with L-type
Ca2+ channel blockers, such as isradipine
and nifedipine.
that the change of amino acid 490 from
glycine-to-arginine (G490R) in CACNA1C
(Cav1.2a1) is a loss-of-function
mutation. It has been reported calcium
signaling affects cell-cell adhesion.18
The slower kinetics of the overall Cell
Index (IMP signal) observed in the BrS3
line compared to the control line at
the cell attachment phase (Figure4A)
may be related to reduced Ca2+ flux
induced by the loss-of-function mutation
in CACNA1C. In the meantime, the
electrophysiologic profile (Figures 4C and
4D) indicated that the BrS3 line did not
100%
80%
60%
40%
% Change
20%
0%
FPDc – BayK8644
BrS3
WT
13 10 30 100 300
16,17
This finding suggests
7
Page 8

A
25
30
Cell Index
20
15
10
5
0
050 100 150 200 250 300
Time (hours)
LMNA
CTRL
B
LMNA
CTRL
C
LMNA
CTRL
Figure 6A to 6C. The profile of performance obtained from LMNA and CTRL CM lines. (A) The overall Cell Index curve was recorded in real time after cell seeding.
(B)10seconds of IMP waveforms measured in LMNA (red trace) and CTRL (black trace) CM lines, which were further averaged into single waveforms shown in
the overlay of LMNA and CTRL IMP waveforms. (C) The overlay of FP waveforms recorded in LMNA (red trace) and CTRL (black trace) CM lines.
8
Page 9

Beating rate
CTRL LMNA
CTRL LMNA
CTRL LMNA
0.25
Beating amplitudeD
0.20
**
0.15
0.10
Cell Index
0.05
0
CTRL LMNA
70
60
**
50
40
30
Beats/min
20
10
0
CTRL LMNA
FP amplitude
1.6
1.4
1.2
1.0
0.8
0.6
0.4
Field potential (mV)
0.2
0
Field potential duration (ms)
400
350
300
250
200
150
100
FPDc
FPD_1Hz
400
**
350
300
**
250
200
150
100
50
0
50
Field potential duration (ms)
0
LMNA CTRL % LMNA to CTRL
BAmp
BR (beats/min)
FP_Amp (mV)
FPDc (ms)
FPD_1Hz
0.15 ±0.02 0.19 ±0.03 82 ±8%
56 ±2 39 ±2 143 ±5%
0.79 ±0.50 0.98 ±0.55 82 ±52%
296.9 ±39.5 337.6 ±37.9 88 ±12%
276.1 ±18.9 330.2 ±22.1 84 ±6%
Figure 6D. The functional activity of LMAN and CTRL CM lines were evaluated and compared by BAmp, BR, FP-Amp, FPDc, and FPD that were measured when
beating rates of LMNA and CTRL CM lines were controlled at 1 Hz by electrical pacing. The data are represented by mean ±std. dev., N ≥24. Statistical analysis by
T-test, ** P <0.05.
9
Page 10

A
B
% Change
Beating amplitude – ISO (nonpaced) Beating rate – ISO (nonpaced)
% Change
10%
5%
0%
-5%
-10%
-15%
-20%
LMNA
CTRL
Beating amplitude – ISO (paced)
60%
40%
20%
0%
-20%
-40%
LMNA
CTRL
100 nM 1,000 nM
0
–4
34
±5%
±5%
100 nM 1,000 nM
8
±4%
±14%
±6%
–5
–8
±5%
–1632±10%
±1%
% Change
% Change
100%
80%
60%
40%
20%
0%
LMNA
CTRL
Beating rate – ISO (paced)
140%
120%
100%
80%
60%
40%
20%
0%
LMNA
CTRL
100 nM 1,000 nM
54
±7%
±7%
73
100 nM 1,000 nM
74
±2%
±10%
112
±6%
34
42
±8%
60
±4%
±10%
93
Figure 7. Contractile responses of LMNA and CTRL CMs to Isoproterenol (ISO), a known positive inotrope, before (nonpaced) and after electrical pacing (paced).
(A) The % change of beating amplitude and beating rate 30 minutes after 100 and 1,000 nM ISO addition to nonpaced LMNA (red bar) and CTRL (black bar) CMs.
(B) The % change of beating amplitude and beating rate 30 minutes after 100 and 1,000 nM ISO addition to paced LMNA (red bar) and CTRL (black bar) CMs. The
data are represented by mean ±std. dev. (n ≥3).
show a significant difference in FPD after
correcting it to the BR using Fridericia’s
formula. Interestingly, the FP-Amp of the
BrS3 line was significantly smaller than
the control suggesting the mutation may
somehow affect Na+ channel activity. In
addition, the loss-of-function phenotype
of BrS3 was also demonstrated by
its lower sensitivity to the treatment
of BayK8644, the L-type Ca2+ channel
activator (Figure 5B).
This work extended the study of
diseased iPSC CM by evaluating the
LMNA line, which was differentiated
directly from PS-iPSC derived from a
patient that harbors theLMNAL35P
mutation. Even though the mutations in
the LMNA gene cause a wide range of
human diseases, including Hutchinson
Gilford Progeria (premature aging
syndrome), muscular dystrophy, and
familial DCM, LMNA-related familial DCM
is primarily characterized by early-onset
atrial fibrillation and conduction
disorder.19 Both FP and IMP readouts
recorded by the CardioECR system did
not show any sign of fibrillation and/or
arrhythmic events in the LMNA line
throughout the entire culture. However,
shorter corrected FPD (Fridericia’s
formula) in the LMNA line compared to
the control was detected. Intriguingly,
FPD measured when the BR of LMNA
and control cells was synchronized
at 1Hz using electrical pacing of
CardioECR showed very similar results to
the Fridericia-corrected FPD (Figure6D),
suggesting that Fridericia’s formula used
in vivo is suitable for correcting FPD of
spontaneous beating cardiomyocytes
in 2D culture. Compared to the control,
the baseline profile of LMNA contractility
showed much faster BR but smaller
BAmp indicating an impaired contraction
of LMNA (Figures6B and 6D). But the
extent of contraction force weakening
in the LMNA line was not substantial.
As reported in the application note of
the xCELLigence RTCA ePacer system
for maturation15, long-term electrical
pacing improved the contractile property
10
Page 11

of hiPSC CMs. Therefore, this study
investigated if long-term pacing could
have an impact on the phenotypical
differences between LMNA and control.
The response of control cells to ISO was
reversed after 15 days of continuous
pacing, as demonstrated by an increase
in beating amplitude. However, the
response of LMNA to ISO remained the
same (Figure7B) indicating an inherent
deficiency in excitation-contraction
coupling leading to force generation.
Conclusion
Our data show that the
AgilentxCELLigence CardioECR
system is well suited to assess the
functional differences relating to cell
growth and viability, contractility, and
electrophysiology of diseased iPSC-CM
cells, providing a method to identify
unique disease-related phenotypes.
Additionally, applying electrical pacing
provided yet another approach to
delineate phenotypic differences
between control and diseased lines.
Once a unique disease-associated
phenotype is identified, the platform
could be used for screening of small
molecule as well as genetic manipulation
of the cells, which could potentially
rescue the cells and, revert to wild
typeactivity.
References
1. Grskovic, M. et al. Induced
Pluripotent Stem Cells—
Opportunities for Disease Modelling
and Drug Discovery.Nat. Rev. Drug
Discov.2011, 10, 915–929.
2. Wu, S. M.; Hochedlinger, K.
Harnessing the potential of
induced pluripotent stem cells for
regenerative medicine.Nat. Cell
Biol.2011, 13, 497–505.
3. Park, I. H. et al. Disease-Specific
Induced Pluripotent Stem
Cells.Cell2008,134, 877–886.
4. Kiskinis, E.; Eggan, K. Progress
Toward the Clinical Application of
Patient-Specific Pluripotent Stem
Cells.J. Clin. Investig.2010, 120,
51–5914.
5. Tiscornia, G. et al. Diseases in a Dish:
Modeling Human Genetic Disorders
Using Induced Pluripotent Cells.Nat.
Med.2011, 17, 1570–1576
6. Tanaka, A. et al.Cardiovascular
Disease Modeling Using
Patient-Specific Induced Pluripotent
Stem Cells, Int. J. Mol. Sci. 2015,
16(8), 18894–922.
7. Canpolat, U.; Bayazit, Y.; Aytemir, K.
Brugada Syndrome Unmasked by
Heat Exhaustion.Ann. Noninvasive
Electrocardiol.2017, 22.
8. Splawski, I. et al. Ca(V)1.2 Calcium
Channel Dysfunction Causes a
Multisystem Disorder Including
Arrhythmia and Autism.Cell2004,
119, 19–31.
9. Antzelevitch, C. et al. Loss-ofFunction Mutations in the Cardiac
Calcium Channel Underlie a New
Clinical Entity Characterized by
ST-Segment Elevation, Short QT
Intervals, and Sudden Cardiac
Death.Circulation2007, 115,
442–449.
10. Thomas, G.;Chung,M.; Cohen, C.J.
A Dihydropyridine (Bay k 8644)
That Enhances Calcium Currents in
Guinea Pig and Calf Myocardial Cells.
A New Type of Positive Inotropic
Agent. Circ. Res.1985, 56(1), 87–96.
11. Goidescu C. M. Dilated
Cardiomyopathy Produced by Lamin
A/C Gene Mutations Clujul Med.
2013, 86(4), 309–312.
12. Luk, A. et al. Dilated Cardiomyopathy:
a Review. J. Clin. Pathol. 2009, 62,
219–225.
13. Yang, X.;Pabon, L.;Murry, C. E.
Engineering Adolescence: Maturation
of Human Pluripotent Stem
Cell-Derived Cardiomyocytes. Circ.
Res. 2014, 114(3), 511–23
14. Ravenscroft, S. M. et al. Cardiac
Non-myocyte Cells Show Enhanced
Pharmacological Function
Suggestive of Contractile Maturity
in Stem Cell Derived Cardiomyocyte
Microtissues. Toxicol. Sci. 2016,
152(1), 99–112.
15. Zhang, X.; Li, J.; Abassi, Y. A. Using
the Agilent xCELLigence RTCA
ePacer for Functional Maturation of
Human-Induced Pluripotent Stem
Cell-Derived Cardiomyocytes, Agilent
Technologies application note,
publication number 5994-1552EN,
2019.
16. Abassi, Y. A. et al. Dynamic
Monitoring of Beating Periodicity of
Stem Cell-Derived Cardiomyocytes
as a Predictive Tool for Preclinical
Safety Assessment. Br. J. Pharmacol.
2012, 165(5), 1424–41.
17. Zhang, X. et al. Multi-Parametric
Assessment of Cardiomyocyte
Excitation-Contraction Coupling
Using Impedance and Field Potential
Recording: A Tool for Cardiac Safety
Assessment. J. Pharmacol. Toxicol.
Methods 2016, 81, 201–16.
18. Dalal, P. J.; Muller, W. A.; Sullivan,D.P.
Endothelial Cell Calcium Signaling
during Barrier Function and
Inflammation. Aging (Albany NY).
2012 Nov, 4(11), 803–822.
19. Siu, C. W. et al. Modeling of Lamin
A/C Mutation Premature Cardiac
Aging Using Patient‐Specific Induced
Pluripotent Stem Cells. Aging (Albany
NY) 2012 Nov, 4(11), 803–822.
11
Page 12

www.agilent.com/chem
This information is subject to change without notice.
© Agilent Technologies, Inc. 2021
Printed in the USA, March 10, 2021
5994-3112EN
 Loading...