

Page 1
Automated Parallel Capillary Electrophoresis
Nucleic Acid Analysis for Sample
Quality Assessment Using the
Agilent Fragment Analyzer Systems
Application Compendium
Page 2

Agilent Automated Electrophoresis
Nucleic Acid Analysis for Sample
Quality Assessment Using the
Agilent Fragment Analyzer Systems
Application Compendium
2
Page 3

Contents
Nucleic Acid Analysis for Sample Quality
Assessment Using the Agilent Fragment Analyzer Systems 4
Product Information
Application Notes and
Technical Overviews
Agilent Fragment Analyzer Systems 6
Capillary Electrophoresis 6
Fragment Analyzer Models 7
Benefits of the Fragment Analyzer systems 7
Reagent Kits for the Fragment Analyzer systems 8
Quality Metrics Overview 10
Genomic DNA quality number (GQN) 11
RNA quality number (RQN) 11
DV
11
200
Analysis of DNA 12
GQN quality metrics for genomic DNA quality assessment 12
Best sizing practices 13
Best quantification practices 14
Separation resolution of fragments 15
Consistent sizing of genomic DNA 16
Next-Generation Sequencing (NGS) 17
Library size and quantification comparison with two kits 17
Quality control in the Agilent Magnis SureSelect XT HS workflow 18
Library comparison between the Fragment Analyzer
and Bioanalyzer systems 19
Analysis of Cell-free DNA (cfDNA) 20
Quality control analysis of cfDNA 20
Separation of cfDNA with the HS NGS Fragment kit 21
Analysis of RNA 22
RQN quality metrics 22
Eukaryotic total RNA 23
Comparison of the RIN and RQN 24
Assessing quality of plant RNA 25
Analysis of IVT mRNA 26
Quality control of IVT mRNA 26
Long IVT mRNA sizing 27
CRISPR/Cas Engineering 28
Single-guide RNA quality assessment 28
Analysis of long, single-stranded DNA 29
Polyadenylation of Cas9 mRNA 30
Engineered restriction site to estimate CRISPR
homology-directed repair efficiency 31
3
Page 4

Nucleic Acid Analysis for Sample Quality Assessment
Using the Agilent Fragment Analyzer Systems
Recent years have seen the proliferation of genetic and genomic analyses throughout both the
research lab and the clinic. The applications of these technologies are as numerous as their
methods and include markets such as:
– Pharmaceutical/biopharmaceutical
– Genetic testing labs
– University or Institute core facilities
– Sequencing service providers
– Biobanks and repositories
– Synthetic bio/genome engineering
No matter the application, getting the most from your research requires a robust workflow.
The integration of sample assessment and quality control (QC) checkpoints into workflows
helps accomplish this by providing accurate information about nucleic acid samples, aiding in
workflow optimization and minimizing the use of unfit samples in downstream applications.
The Agilent Fragment Analyzer systems are parallel capillary electrophoresis instruments that
were designed for reliable and accurate nucleic acid sample assessment. A broad range of
application kits are available, allowing you to easily size, qualify, and quantify both DNA and RNA
– Plant, forestry and animal genomic
analysis
– Environmental testing
– Clinical research and human disease
research
– Microbial/infectious disease research
samples. With its unique design and intuitive features, common QC bottlenecks are eliminated,
and lab efficiency is increased with the ability to load multiple gels for both DNA and RNA
applications. There are three models to choose from with varying throughputs to match your
lab’s needs.
4
Page 5

Common analysis workflows and samples that leverage the Fragment Analyzer systems for
quality assessment include:
– Genomic DNA (gDNA)
– Cell-free DNA (cfDNA)
– Formalin-fixed paraffin-embedded (FFPE)
– Plasmid DNA
– CRISPR-TILLING mutation detection
– CRISPR guide RNA
DNA
– Polyadenylated IVT RNA
– Next-generation sequencing (NGS) library
preparation
– Genotyping
– PCR amplicons
– Simple sequence repeats (SSR)/
microsatellite amplicons
– Total RNA
– mRNA
– IVT RNA
– FFPE RNA
– Small RNAs (including microRNAs)
– Restriction digest analysis
To demonstrate the benefits of sample QC in these workflows, we compiled this compendium of
application notes written by Agilent scientists. We also briefly describe capillary electrophoresis
technology and the Fragment Analyzer system product portfolio. This application compendium
demonstrates the advantages offered by sample assessment and how easily it can be
incorporated into virtually any genomics workflow.
5
Page 6
Agilent Fragment Analyzer Systems
The Fragment Analyzer systems utilize automated parallel capillary
electrophoresis to provide reliable QC for a broad variety of sample
types and applications, including NGS libraries, RNA samples, PCR
amplicons, and CRISPR workflows.
The Fragment Analyzer systems break through analytic bottlenecks by providing
a sample quality assessment tool that easily integrates with key genetic analysis
workflows, giving researchers the results they need, when they need them.
Automated parallel capillary electrophoresis enables analysis of multiple samples
at once without researcher intervention. The ability to accommodate two different
gel matrices allows for unattended and consecutive analysis of multiple reagent
kits.
The Fragment Analyzer systems are indispensable for sample QC because of
their many benefits, including:
– Flexible, interchangeable arrays allow for adjustable throughputs and
applications to fit the changing needs of the laboratory
– Minimal sample concentration requirements enable researchers to conserve
precious samples for further analysis
Capillary electrophoresis
The capillary array is the basis of the Fragment Analyzer systems, as it can
reliably separate both DNA and RNA samples, easily switching between
applications. The arrays are available in three different lengths (short, ultrashort,
and long) to allow the user to prioritize separation resolution or time, depending
on workflow needs. A shorter capillary array offers faster run times, while longer
capillary arrays offer improved separation resolution.
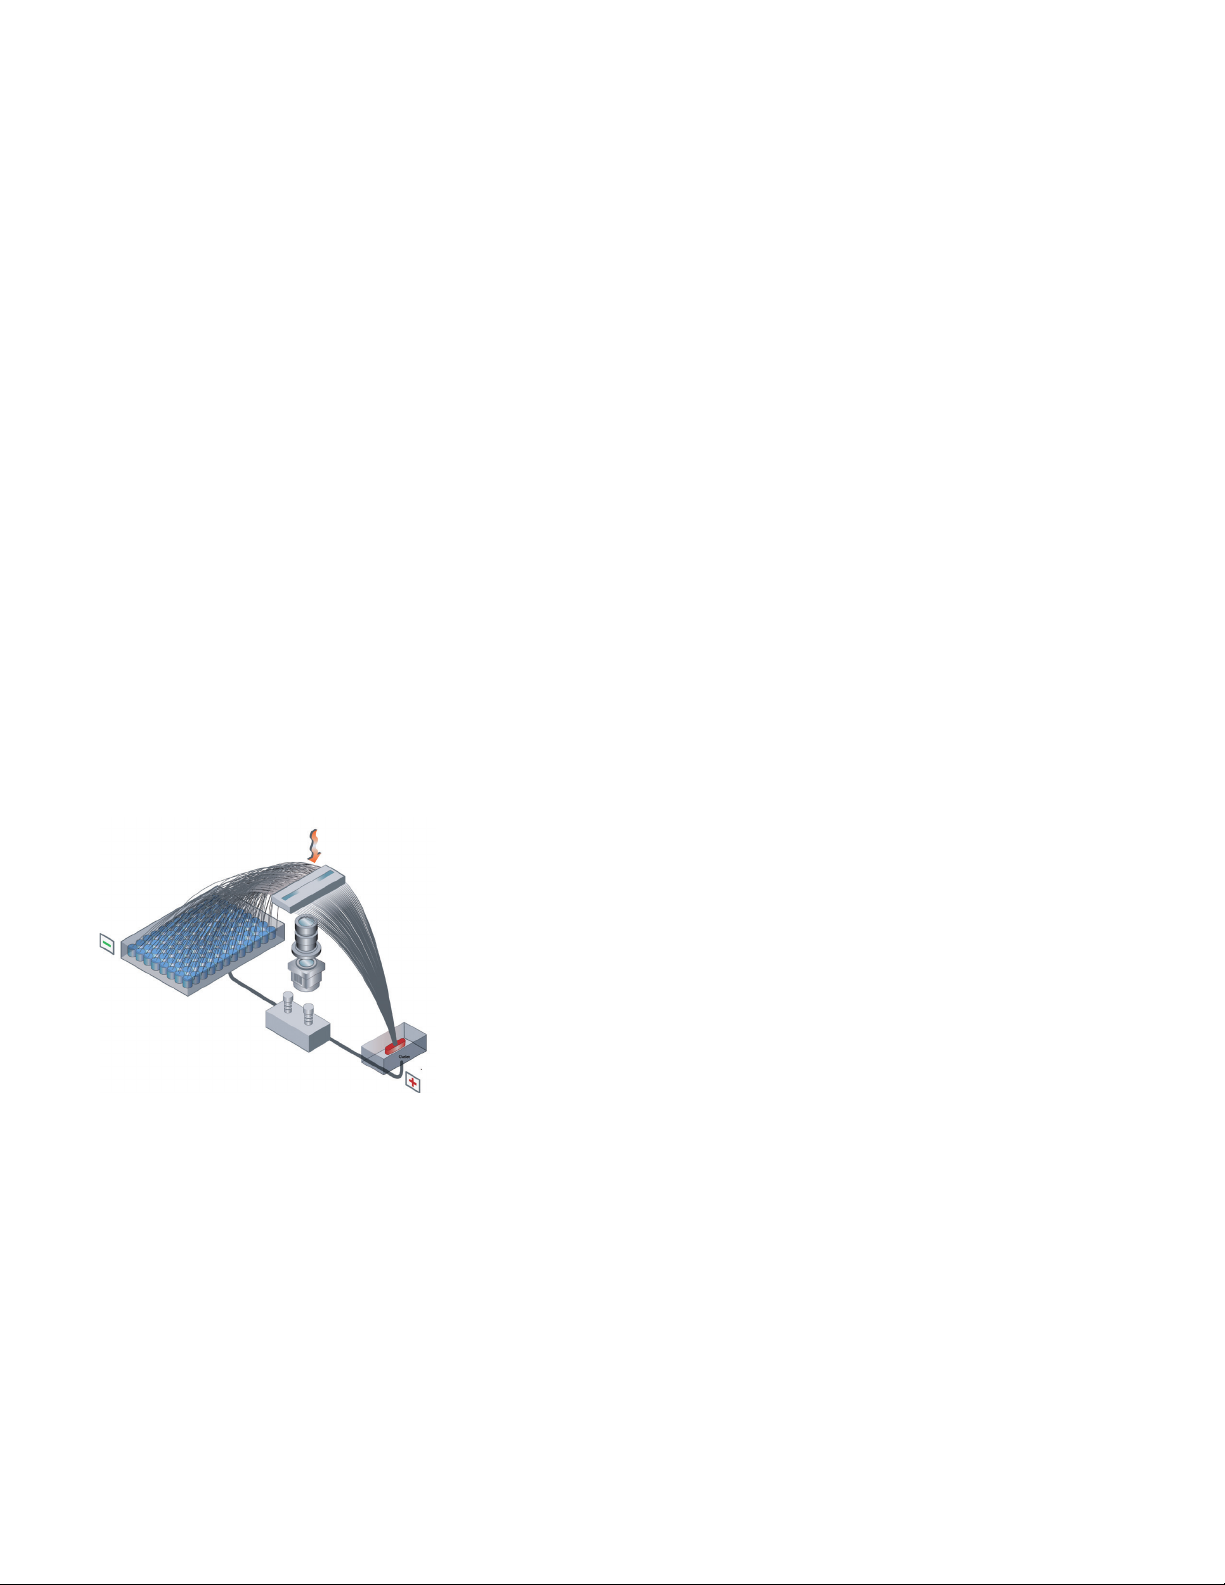
Principles of capillary electrophoresis:
1. Individual capillaries are filled with gel that serves as the separation matrix
2. Samples are voltage-injected into the capillaries, and each sample moves
through an individual capillary in a size-dependent manner
3. As the fragments pass the detection window, a sensitive charged coupled
device (CCD) detector captures the size and concentration level of the sample
4. The resulting series of images are merged together to produce a highresolution electropherogram across the entire sizing range
6
Page 7
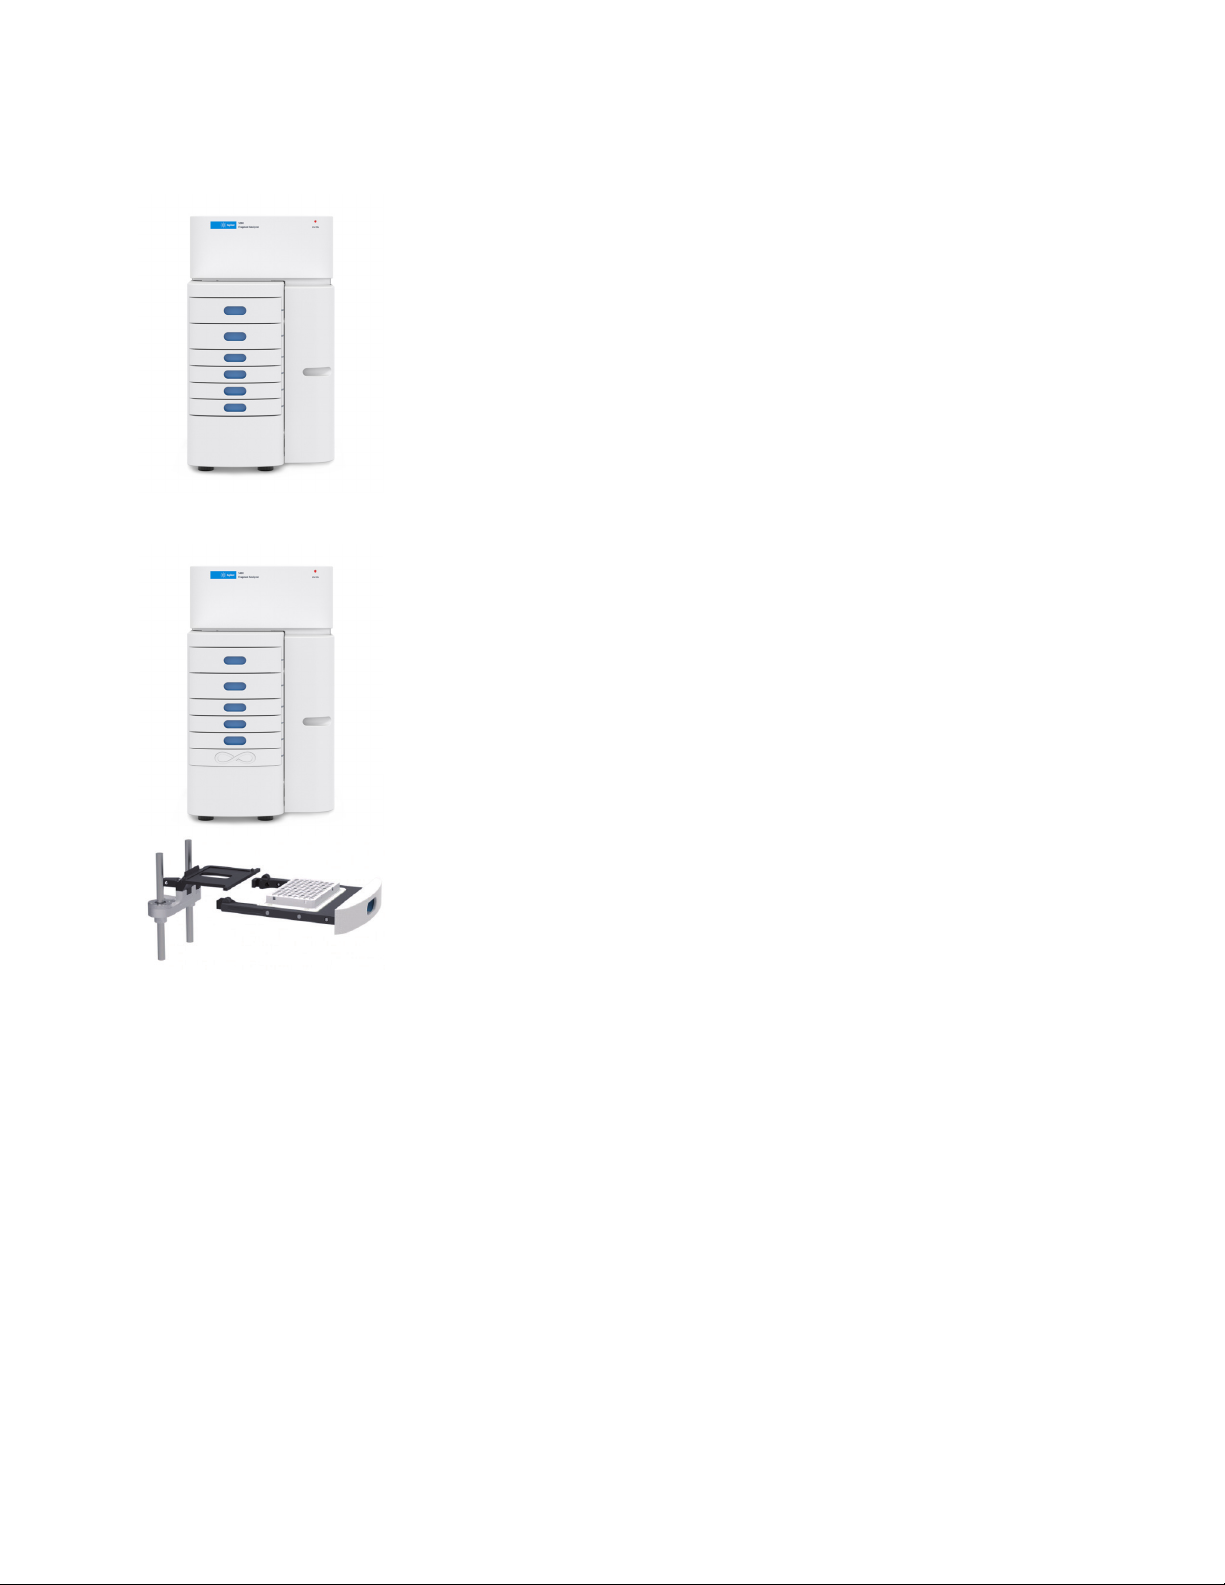
Fragment Analyzer Models
With three different models, the Fragment Analyzer systems are easily adaptable
to the workflow of any lab:
The 5200 Fragment Analyzer and 5300 Fragment Analyzer systems provide
variability in throughput by using different capillary arrays.
– The 5200 Fragment Analyzer system uses a 12-capillary array allowing for 12
samples to run at one time
– The 5300 Fragment Analyzer system offers higher throughput, with the ability
to run either a 48- or a 96-capillary array
– Both models have the ability to load up to three 96-well plates and process in
any order
The 5400 Fragment Analyzer system is an ultrahigh-throughput system, enabling
the analysis of thousands of samples per day.
– The system utilizes a 96-capillary array and is capable of full integration with
most robotic systems
– An application program interface (API) controls the movement of the buffer,
waste, and sample drawers, allowing for continuous runs without user
intervention
– Integrated software packages allow for remote control of the instrument
Note: Experiments performed using the 5200 Fragment Analyzer system and can be replicated
with comparable results on Agilent 5300 Fragment Analyzer and 5400 Fragment Analyzer
systems when using the same array length.
Features and benefits of the Fragment Analyzer systems
– With electrophoresis times as short as 15 minutes, no daily array handling,
and room-temperature stable reagents, instrument set-up and run time is
minimized allowing faster time to results
– 3 bp resolution of fragments approximately 300 bp and smaller provides
discrimination of closely sized products giving you confidence in sample
composition
– Two orders of magnitude dynamic range enables loading of unknown
quantities, eliminating the need to predetermine sample concentration
– Quality metrics for RNA (RNA quality number, RQN) and genomic DNA
(genomic DNA quality number, GQN) allow for objective quality assessment
aiding nucleic acid sample standardization
– Always-accessible sample drawers permit the addition of samples, even while
the instrument is running, eliminating down time
– Ability to re-arrange the sample queue even while the instrument is running
lets high priority samples to be run sooner
7
Page 8

Reagent kits for the Fragment Analyzer systems
A broad range of kits are available for the Fragment Analyzer systems, allowing
you to easily qualify and quantify both DNA and RNA samples. The diversity of
sample types these systems can separate make these instruments ideal for a
variety of workflows, including sample QC for NGS library preparation.
The Small Fragment and NGS kits facilitate the separation of DNA fragments,
smears and NGS libraries, with sizing from 50 to 1,500 bp and 100 to 6,000 bp,
respectively. The NGS kit covers a concentration range of 0.1 to 10 ng/µL for
fragments and 5 to 100 ng/µL for smears. The HS Small Fragment and HS NGS
kits have a smaller concentration range of 5 to 500 pg/µL for fragments and 50
to 5,000 pg/µL for smears. Each of the kits provides accurate quantification and
sizing, making them ideal for NGS library preparation workflows.
The Large Fragment kits are used for automated qualitative and quantitative
analysis for large DNA fragments and smear up to 48,500 kb. Each of the kits
has a different input concentration range, specific for fragments or smears.
The Large Fragment kits are ideal for reliable QC checkpoints in many different
workflows, including long-read NGS, formalin-fixed paraffin-embedded (FFPE)
DNA analysis, and restriction digest analysis. By comparing the sizing of sheared
and unsheared large DNA samples, the kits provide a reliable evaluation of DNA
fragmentation, an essential step in the preparation of large-insert libraries.
The Genomic DNA kits were developed for the separation of genomic DNA
(gDNA). Automated assessment of gDNA size and integrity is extremely
beneficial for QC of samples to be used in long-read and whole genome NGS,
metagenomics, and analysis of degraded DNA. A broad sizing range allows
accurate and precise sizing of samples through 60 kb. Covering expansive
concentration ranges, the HS gDNA 50 kb kit is for samples ranging from 0.3 to
12 ng/µL, while the gDNA 50 kb kit extends from 25 to 250 ng/µL. Easily analyze
gDNA samples with a user-defined quality metric (GQN), which allows users to
decide what qualifies as good gDNA for their purposes.
The RNA kits can be used for analysis of both total RNA and mRNA, including IVT
mRNA sizing. Ensuring quality RNA is crucial to many downstream applications,
including NGS and gene expression studies. RNA analysis with the RNA kits
provides each sample a quality metric, the RQN. Excellent resolution allows
for distinction between small RNA and degraded RNA, providing a reliable and
accurate RQN score. Specific RNA analysis modes are available for eukaryotic,
prokaryotic, plant, and mRNA samples. The RNA kits have a sizing range of 200
to 6,000 nt. The RNA kit (15 nt) covers a concentration range of 5 to 500 ng/μL,
while the HS RNA kit is for less concentrated samples, with a range of
50 to 5,000 pg/μL.
8
Page 9

The Small RNA kits focus on microRNA and small RNA QC analysis, essential
for downstream applications such as small RNA NGS library preparation. The
kits provide accurate and precise quantification and sizing of small RNA and
microRNA, focusing on the narrow range from 15 to 200 nt. Focusing on this
small sizing range allows for high-resolution separation and detailed analysis of
both the microRNA (10 to 40 nt) and small RNA (40 to 200 nt) regions. A region
analysis function automatically calculates the percent microRNA and quantifies
the microRNA and small RNA regions.
The Qualitative DNA kits provide automated and accurate sizing with relative
quantification of DNA fragments. Common uses include the analysis of PCR
amplicons, simple sequence repeats (SSRs)/microsatellites, and genotyping.
There are six different kits to choose from based on the size of the DNA or PCR
fragments, ranging from 35 to 20,000 bp. Specially formulated gels, markers,
and ladders are designed for each kit, enabling reliable sizing over a broad range
with varying applications. High-resolution kits enable the separation of fragments
under 300 bp with a 3 bp difference.
The Plasmid DNA kit is used in the analysis of supercoiled and linear plasmid
DNA. The ladder provided with this kit is optimized for the accurate sizing and
relative quantification of supercoiled plasmids between 2,000 and 10,000 bp.
Linearized plasmids can be evaluated for quality and relative quantification;
however, only comparative sizing is possible.
Efficient and accurate identification of CRISPR mutation events is a critical
component of CRISPR/Cas9 workflows. The CRISPR Discovery Gel kit
automates the screening of heteroduplex cleavage assays and provides fragment
sizing and relative concentration. These important pieces of information are
automatically processed by ProSize data analysis software to indicate successful
editing events and other crucial information like percent mutated.
9
Page 10

Quality Metrics Overview
High-quality nucleic acids are necessary for successful library preparations and sequencing
results. Nucleic acid QC can determine which samples are not suitable for library preparation.
Not all extraction methods are the same, resulting in nucleic acids with varying integrity. Nucleic
acid samples such as FFPE, ancient samples, and RNA are easily degraded due to chemical
fixation, time, temperature, enzyme digestion, and improper handling. If a sample is too far
degraded, it will result in poor sequencing results; important coding areas of interest are lost,
and gaps appear in the full-length gDNA. Knowing the quality of the input nucleic acid helps
provide guidance for changes needed to optimize workflow for applications such as NGS, long
read sequencing, microarray, and genotyping.
Quality metrics provide the user with reliable assessment of the integrity of a sample. Users
can establish quality metric standards in their workflows by doing degradation studies and
comparing the quality metrics scores between the samples. In addition, quality metrics can
save time and money by reducing variation between user assessments and misinterpretation
of the results, while easily identifying unfit starting material that would lead to poor results. The
Fragment Analyzer instruments provide reliable quality metrics for different sample types. The
Agilent quality metrics are widely accepted and referenced in literature. The Fragment Analyzer
systems ProSize data analysis software has the quality metrics built in for easy assessment of
samples.
10
Page 11

Genomic DNA Quality Number (GQN)
Genomic DNA (gDNA) is easily sheared with routine handling, such as pipetting,
mixing and vortexing, and multiple freeze-thaw events. DNA from fresh, frozen,
or FFPE tissue can be assessed with the genomic DNA quality number (GQN)
on the Fragment Analyzer systems. Agilent designed the GQN to allow for easy
analysis of sheared DNA and gDNA quality. The user defines a size threshold they
deem appropriate for their specific application. The GQN value is then calculated
based on the fraction of the total measured concentration of the sample that lies
above the specified size threshold. The GQN scores samples on a scale of 0 to
10. A score of 0 indicates that none of the sample exceeds the threshold and 10
indicates 100% of the sample lies above the threshold value.
RNA Quality Number (RQN)
Total RNA from fresh or frozen tissue can be assessed with the RNA quality
number (RQN). The RQN takes into consideration the entire electropherogram
including the 5S and fast region where the small RNA separates, as well as the
small and large ribosomal peaks, the baseline resolution between the peaks, the
ratio of the small and large ribosomal peaks, and the degradation in front of the
small ribosomal peak when calculating the RQN. It is calculated using a scale
from 1 to 10. A high RQN indicates highly intact RNA, and a low number, strongly
degraded RNA sample. Several studies have been performed demonstrating the
equivalences of the Bioanalyzer RIN to the RQN as highlighted in the Analysis of
total RNA section.
DV
200
FFPE RNA samples are challenging to analyze, as degradation due to fixation
and storage conditions is often extensive. It is important to evaluate the quality
of each FFPE RNA sample before proceeding with library preparation to eliminate
highly degraded samples containing RNA fragments smaller than the optimal
size range. Although the RQN value is a reliable metric for evaluating the quality
of RNA isolated from fresh, frozen, or cell culture tissue, it is not a definitive
measure of RNA quality from FFPE samples. To solve this problem, the DV
quality metric was developed for use with the Agilent Automated Electrophoresis
systems including the Fragment Analyzer. It calculates the percentage of RNA
fragments greater than 200 nucleotides in size. The DV
determine the minimal RNA input required for successful library preparation and
reproducible results. Given the strong correlation between DV
yield, the DV
construction.
metric is ideal for assessing FFPE RNA quality prior to library
200
metric is then used to
200
values and library
200
200
Fragment Analyzer Systems Quality Metrics
Metric GQN RQN DV
200
Sample Type gDNA and FFPE DNA RNA FFPE RNA
Definition / calculation Calculated based on the
fraction of the total measured
concentration of the sample
that lies above the specified
size threshold, on a scale
from 0 to 10. A score of 10
indicates that 100% of the
sample is observed above
Calculated using a scale from
1 to 10. A high RQN indicates
highly intact RNA, and a low
number, strongly degraded
RNA sample.
Calculation of the percentage
of RNA fragments greater
than 200 nucleotides in size.
The DV
200
to determine the minimal
RNA input required for successful library preparation
and reproducible results.
threshold.
metric is then used
11
Page 12

Application Notes and Technical Overviews
DNF-467 DNF-468
GQN
DNF-467 DNF-468
y
GQN1,000
GQN10,000
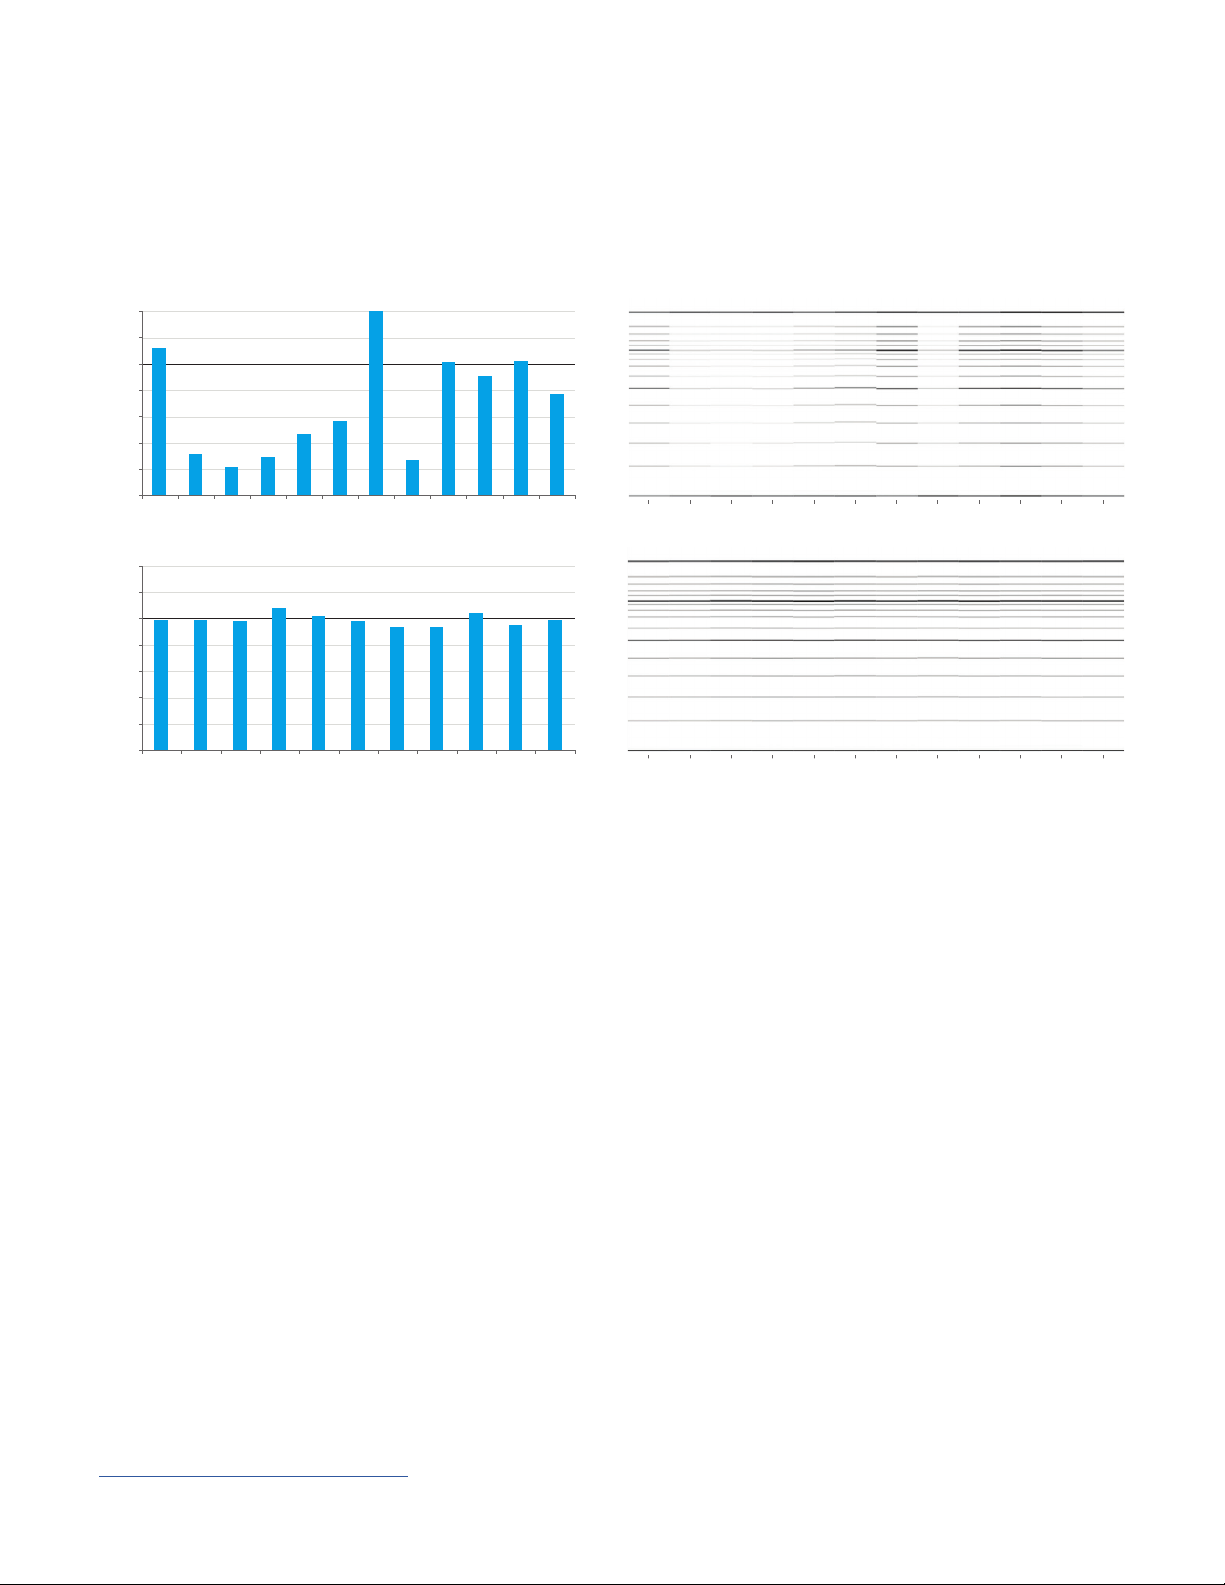
Analysis of DNA
GQN quality metrics for genomic DNA quality assessment
A
10
9
8
7
6
5
4
3
2
1
0
Cotton E. coli CoriellCotton E. coli Coriell
Short array
Ultrashort array
BA
10
B
8
6
GQN
4
2
0
Cotton E. coli CoriellCotton E. coli Coriell
Short array
Ultrashort arra
Kits: Genomic DNA 50 kb kit; HS Genomic DNA 50 kb kit
Abstract: Quality assessment of nucleic acids is critical to the success of many downstream applications, including
NGS. The Fragment Analyzer systems provide quick and easy assessment of gDNA quality and integrity with the GQN. The
GQN is commonly used for evaluating the input gDNA material for NGS library preparation. To prepare a successful library,
the sample must be of the correct size and of sufficient quality for sequencing. The GQN threshold can be set by the user to
reflect the size threshold necessary for their particular requirements. The GQN is given on a scale of 0 to 10, with a higher
score indicating that more of the sample exceeds the user-defined threshold. The GQN size threshold was set at 1,000 bp
(A) and 10,000 bp (B) for cotton, E. coli, and Coriell gDNA samples, demonstrating the GQN flexibility when evaluating the
quality of gDNA. The higher 10,000 bp size threshold gave a lower GQN for the smaller sized cotton (3.6) and E. coli (5.9)
samples compared to Coriell (8.6), as expected due to their varying size. The lower 1,000 bp size threshold reported a similar
GQN for all three samples because the majority of the sample lies above the size threshold parameter. The GQN values were
consistent between both the Genomic DNA 50 kb kit and the HS Genomic DNA 50 kb kit on both the short and ultrashort
arrays for all samples.
Application note: 5994-0511EN
12
Page 13

Application Notes and Technical Overviews
0
Size (bp)
LM
UM
RFU
4
4
5
6
7
3
2
1
0
8
12
16
20
24
28
32
36
200
100
1
300
300
400
600
700
800
1,000
2,000
3,000
6,000
1,500
500
×10
3
×10
3
Size (bp)
RFU
Analysis of DNA
Best sizing practices
A B
Average (bp)
Range (bp)
Standard deviation
% CV
% Error
Sizing over concentration range
4.5 to 600 pg/µL
300 bp DNF-474 1,000 bp DNF-474
299 997
297 to 302 992 to 1,001
1.2 3.3
0.41 % 0.33 %
0.06 % -0.3 %
9,000
8,000
7,000
6,000
5,000
4,000
3,000
2,000
1,000
0
Smear size over concentration range
Concentration (pg/µL)
Average (bp)
Standard deviation
Precision % CV
LM
1
50
5,300 2,900 1,350 650 320 160 78
295 294 294 294 296 296 295
3.5 2.6 3.2 4.3 6.2 5.9 9.4
1.2 % 0.9 % 1.1 % 1.5 % 2.1 % 2.0 % 3.2 %
100
150
200
250
300
400
500
600
800
UM
1,000
1,500
Kits: HS NGS Fragment kit (1-6000 bp); HS Small Fragment kit; HS Large Fragment 50 kb kit
Abstract: QC of nucleic acids is essential for many downstream applications, including NGS. The Fragment Analyzer
systems provide accurate and reliable sizing analysis of DNA smears and fragments with many reagent kits suited for
different sizing ranges. This application note discusses the difference between peak size and average smear size provided
by the ProSize data analysis software, how the presence of salt in your sample can affect analysis, and highlights the sizing
accuracy and precision provided by the Fragment Analyzer systems.
Serial dilutions of two fragment sizes, 300 and 1,000 bp, were analyzed using the HS NGS Fragment kit (1–6000 bp). Serial
dilutions of both fragments indicate that sizing of DNA fragments under 6,000 bp are not affected by concentration. An
electropherogram overlay shows the consistent sizing of the 300 bp fragment at 15.6, 62.5, and 500 pg/µL (A). Similarly,
a serial dilution of a DNA smear was analyzed using the HS Small Fragment kit, and the average smear size remained
consistent over all concentrations (B). The Fragment Analyzer systems provide reliable sizing analysis for DNA fragments
and smears for many sizes.
Application note: 5994-0585EN
13
Page 14
Application Notes and Technical Overviews
A
B
Well number
Analysis of DNA
Best quantification practices
A
No mixing
No mixing
1.4
1.2
1.0
0.8
0.6
0.4
Concentration (ng/µL)
0.2
0
1
B
1.4
1.2
1.0
0.8
0.6
0.4
Concentration (ng/µL)
0.2
0
2 3 4 5 6 7 8 9 10 11 12
Plate shaker
Plate shaker
1
2 3 4 5 6 7 8 9 10 11
Well number
Well number
6,000
3,000
2,000
1,500
1,000
900
800
700
600
500
400
300
Size (bp)Size (bp)
200
100
1
6,000
3,000
2,000
1,500
1,000
900
800
700
600
500
400
300
200
100
1
A1
A2 A3 A4 A5 A6 A7 A8 A9 A10 A11 A12
Well number
A1
A2 A3 A4 A5 A6 A7 A8 A9 A10 A11 A12
Kits: HS NGS Fragment kit (1-6000 bp); Genomic DNA kit
Abstract: Accurate and reliable quantification of nucleic acids is essential for many downstream applications,
including PCR and next-generation sequencing library preparation. The Fragment Analyzer systems provide reliable
quantification for fragments and smears. This application note describes best practices for measurement and factors
that can affect analysis of nucleic acids. These include choosing the appropriate method for the sample, using the correct
mixing method for each kit, proper pipetting technique, and sample preparation.
To demonstrate the effect that mixing can have on sample quantification, replicates of a ladder were prepared for analysis
with the HS NGS Fragment kit. In the first run, the ladders were pipetted into the diluent marker and analyzed without any
further mixing (A). For the second run, the samples and diluent marker were mixed together by plate shaker at 3,000 rpm for
2 minutes before analysis (B). The non-mixed samples exhibited a large variation in sample concentration, while the mixed
samples showed a consistent quantification across all replicates. Following best practices for sample preparation will help
ensure reliable and accurate DNA quantification with the Fragment Analyzer systems.
Application note: 5994-0513EN
14
Page 15

Application Notes and Technical Overviews
Analysis of DNA
Separation resolution of fragments
Long Array
Long Array
3,000
A
LM
A
2,750
2,500
2,250
2,000
1,750
1,500
RFU
1,250
1,000
8,000
7,000
6,000
5,000
4,000
RFU
3,000
2,000
1,000
750
500
250
0
0
1
Short Array
Short Array
B
LM
B
1
35
35
75
75
99, 102
100
98, 101
100
Size (bp)
Size (bp)
150
150
203, 206
200
203, 206
200
250
250
316, 319
300
317, 320
300
Kits: dsDNA 905 Reagent kit (1-500 bp); HS Small Fragment kit
Abstract: The ability to distinguish between two closely sized fragments is referred to as separation resolution in
electrophoresis systems. Resolution of fragments is critical for accurate DNA sizing and identification of extra fragments
when studying small PCR products. Traditional agarose gel-based systems lack the ability to resolve fragments close
in size. The Fragment Analyzer system utilizes a unique gel chemistry, which allows for separation of closely sized DNA
fragments, providing better insight into nucleic acid sample size. The HS Small Fragment kit and the dsDNA 905 Reagent
kit (1-500 bp) are ideal for separating and sizing small PCR products. The electropherograms are overlays of the fragment
mixes. Separation with the long array (A) produced a complete baseline resolution of the 101/104 bp fragments while
displaying two partially separated peaks for the 201/204 and 306/309 bp fragment mixes. The short array (B) demonstrated
a 3 bp separation as two partially resolved peaks for all three fragment mixes. The 5200 Fragment Analyzer system offers
exceptional separation of similarly sized fragments with excellent precision and accuracy.
Application note: 5994-0517EN
15
Page 16

Application Notes and Technical Overviews
RFU
6,000
9,000
Analysis of DNA
Consistent sizing of genomic DNA
5,500
5,000
4,500
4,000
3,500
3,000
2,500
2,000
1,500
1,000
500
A
A
Short array
Short array
LM
0
Cotton (DNF-467)
Cotton (DNF-468)
Coriell (DNF-467)
Coriell (DNF-468)
E. coli (DNF-467)
E. coli (DNF-468)
1
75
200
400
600
800
1,000
3,000
6,000
1,500
10,000
15,000
48,500
Size (bp)
8,000
7,000
6,000
5,000
RFU
4,000
3,000
2,000
1,000
B
B
Ultrashort array
Ultrashort array
LM
0
1
Cotton (DNF-467)
Cotton (DNF-468)
Coriell (DNF-467)
Coriell (DNF-468)
E. coli (DNF-467)
E. coli (DNF-468)
75
200
400
600
800
1,000
3,000
6,000
1,500
10,000
15,000
48,500
Size (bp)
Kits: Genomic DNA 50 kb kit; HS Genomic DNA 50 kb kit
Abstract: The quality and concentration of gDNA starting material is crucial for successful downstream long-
read and whole genome NGS. Quality analysis for gDNA with varying ranges of concentrations can be performed on the
Fragment Analyzer systems with the Genomic DNA 50 kb kit (DNF-467) and the HS Genomic DNA 50 kb kit (DNF-468). The
Genomic DNA 50 kb kit offers a concentration range of 25 to 250 ng/μL input gDNA, while the HS Genomic DNA 50 kb kit
has a lower concentration range of 0.3 to 12 ng/μL input gDNA for low-concentrated samples. Genomic DNA from cotton,
E. coli, and human (Coriell) were compared on both kits with the FA 12-Capillary Array Short, 33 cm (short array (A)) and
FA 12-Capillary Array Ultrashort, 22 cm (ultrashort array (B)). On both kits, the short and ultrashort arrays demonstrated
consistent sizing for the three sample types. The ultrashort array offers the convenience of shortened run times while
providing comparable gDNA sizing, concentration, and GQN compared to the short array with both kits.
Application note: 5994-0511EN
16
Page 17

Application Notes and Technical Overviews
0
LM
50
100
150
200
250
300
400
500
600
700
800
900
1,000
UM
1,500
500
1,000
1,500
2,000
2,500
3,000
3,500
4,000
4,500
A
8 9 10 11 12 13 14 15 16 17 18 19 20 21 22 23 24 25 26 27 28 29 30
Time (min)
RFU
RFU
RFU
Size (bp)
8 9 10 11 12 13 14 15 16 17 18 19 20 21 22 23 24
Time (min)
0
LM
UM
6,000
1,000
2,000
3,000
4,000
5,000
6,000
D
RFU
100
200
300
400
500
600
700
800
900
1,000
1,200
1,500
2,000
3,000
HS Small kit ladder ultrashort array HS NGS kit ladder ultrashort array
Next-Generation Sequencing
Library size and quantification comparison with two kits
A
A
HS Small kit short array Sample 1
HS Small kit short array Sample 1 HS NGS kit short array Sample 3
1,400
LM
1,200
1,000
800
600
400
200
0
1
50
B
B
HS Small kit ultrashort array Sample 1
HS Small kit ultrashort array Sample 1 HS NGS kit ultrashort array Sample 3
4,000
3,500
3,000
2,500
2,000
1,500
1,000
500
LM
0
1
153
100
150
153
10050200
150
200
250
Size (bp)
250
300
Size (bp)
300
400
500
400
600
700
800
500
1,000
600
UM
1,500
700
800
1,000
UM
1,500
1,800
1,600
1,400
1,200
1,000
RFU
2,800
2,400
2,000
1,600
RFU
1,200
1,0.8
800
600
400
200
0.4
0
0
Kits: HS Small Fragment kit; HS NGS Fragment kit (1-6000 bp)
Abstract: The quality of NGS libraries is crucial to successful sequencing results. The Fragment Analyzer system
offers easy analysis of sheared gDNA smears and libraries with the HS NGS Fragment kit (1-6000 bp) and the HS Small
Fragment kit. The HS NGS Fragment kit sizes larger smears and fragments up to 6,000 bp, while the HS Small Fragment
kit focuses on smaller sizes up to 1,500 bp. The FA 12-Capillary Array Ultrashort, 22 cm, decreases run time by 10 to 20
minutes compared to the standard FA 12-Capillary Array Short, 33 cm. The size and concentration of several DNA smears
were compared between both kits and the short and ultrashort arrays. Library sizing and quantification remained consistent
between the short and ultrashort arrays and both kits. The HS Small Fragment kit and the HS NGS Fragment kit can be used
interchangeably for sizing and quantification of NGS libraries as long as the sample fits within the sizing specifications of
the kit.
C
C
HS NGS kit short array Sample 3
LM
1
100
D
D
HS NGS kit ultrashort array Sample 3
LM
1
100
200
200
Size (bp)
325
300
326
300
400
400
500
500
600
600
700
800
700
1,000
800
1,000
1,500
1,500
UM
3,000
UM
3,000
6,000
6,000
Application note: 5994-0515EN
17
Page 18

Application Notes and Technical Overviews
Size in bp
Next-Generation Sequencing
Quality control in the Agilent Magnis SureSelect XT HS workflow
Average Size Post-Shear Library
200
150
100
50
0
NA 18507 (10X)
Average Size Pre-Capture Library
400
300
200
100
0
HD799
HD798NA 18507 HD803
HD799
HD803
Average Size of Post-Capture Library
400
300
200
100
0
HD799HD798NA 18507 HD803
4150 TapeStation 2100 Bioanalyzer 5200 Fragment Analyzer
Instruments: Magnis NGS Prep system; Fragment Analyzer systems
Kits: HS NGS Fragment kit (1-6000 bp)
Abstract: The Agilent Magnis NGS prep system is an automated NGS library preparation solution for the Agilent
SureSelect XT HS kit. It addresses challenges of manual library preparation such as hands-on time, expertise, optimization,
and validation for diverse applications. It is beneficial to perform QC steps and quantification on the starting material, after
fragmentation, the materials derived from intermediate steps (optional), and the final library to ensure reliability and overall
success of the sequencing data. QC steps can be performed with the automated electrophoresis portfolio of instruments,
including the Fragment Analyzer systems, Bioanalyzer system, and TapeStation systems.
Magnis SureSelect XT HS post-shear, pre-capture, and post-capture libraries were assessed on all three platforms and
displayed similar sizing across multiple samples, as shown above. Each of the automated electrophoresis instruments
provide reliable QC analysis, which is critical to ensure successful library preparation and sequencing.
Application Note: 5994-1741EN
18
Page 19

Application Notes and Technical Overviews
10447
RFU
A. Fragment Analyzer
Next-Generation Sequencing
Library comparison between the Fragment Analyzer and Bioanalyzer systems
A
NGS final library no. 22
10000
Fragment Analyzer
NGS final library no. 22
9500
9000
8500
8000
7500
7000
6500
6000
5500
5000
4500
4000
3500
3000
2423
[FU]
B. Bioanalyzer
B
NGS final library no. 22
Bioanalyzer
250
NGS final library no. 22
LM
1
Adapter dimer
100
200
Size (bp)
420 bp
300
400
500
600
700
800
900
UM
1000
1200
1500
2000
3000
6000
UM
200
150
100
50
0
LM
413 bp
Adapter dimer
35 100 150 200 300 400 500 500 1000 2000 10380 [bp]
Region 1
Instruments: Fragment Analyzer and Bioanalyzer systems
Kits: Small Fragment and HS NGS Fragment kit (1-6000 bp) (Fragment Analyzer); DNA 1000
and HS DNA kit (Bioanalyzer)
Abstract: Quality control throughout the NGS library preparation workflow is critical to ensure successful
downstream sequencing. The Agilent Fragment Analyzer and Bioanalyzer systems provide reliable QC analysis for
monitoring size, quantity, and molarity of the sample at different steps in the NGS workflow for two different library kits.
The Small Fragment kit of the Fragment Analyzer system and the DNA 1000 kit of the Bioanalyzer system reported similar
sizing, quantification, and molarity of NGS pre-capture libraries. In addition, the HS NGS Fragment kit of the Fragment
Analyzer system (A) and the HS DNA kit of the Bioanalyzer system (B) displayed similar traces and reported similar sizing,
quantification, and molarity for NGS final libraries. The high sensitivity of both instruments enabled them to detect a
minute amount of adapter dimer contamination after cleanup with SPRI beads. Reliable and comparable QC results can be
obtained from either the Fragment Analyzer system or the Bioanalyzer system, providing ease of mind when gathering data
between two labs or transferring QC protocols from one system to the other.
Technical overview: 5994-2459EN
19
Page 20
Application Notes and Technical Overviews
RFU
Time (HH:MM:SS)
38:00
RFU
Size (bp)
C
RFU
Analysis of Cell-free DNA (cfDNA)
Quality control analysis of cfDNA
5231
5000
B
A
A
HS Small Fragment kit
1,600
1,400
1,200
1,000
800
600
400
200
0
12:00
15:00 18:00 21:00 24:00 27:00 30:00 33:00 36:00
C
HS Large Fragment kit, cfDNA with gDNA
3,000
2,750
2,500
2,250
2,000
1,750
1,500
1,250
1,000
750
500
250
0
152
356
1
75
200
582
400
761
166
600
Fragmented gDNA
2,695
800
1,000
353
1,500
3,000
6,000
569
10,000
UMLM
15,000
48,500
UMLM
200,000
B
4800
HS Large Fragment kit
4600
4400
4200
4000
3800
3600
3400
3200
3000
2800
2600
2400
2200
2000
1800
1600
1400
1200
1000
800
600
400
200
0
UM
LM
157
347
400
600
Size (bp)
800
1000
528
1500
3000
6000
10000
15000
48500
200000
1
75
200
Kits: HS Small Fragment kit; HS Large Fragment kit
Abstract: Circulating cell-free DNA (cfDNA) is gaining prevalence as a noninvasive, alternative approach for
the detection of tumor mutations in cancer management and screening tests for fetal abnormalities from the mother’s
blood. cfDNA is known to circulate in healthy and pathological conditions and is present in plasma, serum, cerebral spinal
fluid, and saliva. A typical cfDNA electropherogram displays one, two, or three nucleosomal fragments. The HS Small
Fragment kit distinctively separated three cfDNA peaks from healthy human serum at 166, 353, and 569 bp (A). These
peak sizes corresponded to a nucleosome guided fragmentation pattern of apoptotic cfDNA, oftentimes referred to as
mononucleosome, dinucleosome, and trinucleosome cfDNA. The same sample was also analyzed with the HS Large
Fragment kit and three peaks were separated at 157, 347, and 528 bp (B). The HS Large Fragment kit also allows for reliable
quantification and sizing for cfDNA samples containing fragmented genomic DNA (C).
Application note: 5994-0510EN
20
Page 21

Application Notes and Technical Overviews
2,000
(bp)
RFU
1,000
1,500
2,000
3,000
6,000
900
(bp)
RFU
1,000
1,500
2,000
3,000
6,000
Analysis of Cell-free DNA (cfDNA)
Separation of cfDNA with the HS NGS Fragment kit
A B
1,800
1,600
1,400
1,200
1,000
800
600
400
200
LM
0
1
100
165
200
300
350
400
500
581
600
700
800
UM
Size
800
700
600
500
400
300
200
100
LM
158
Fragmented gDNA
367
0
1
100
200
300
400
500
576
600
700
800
UM
Size
Kits: HS NGS Fragment kit (1-6000 bp)
Abstract: Quality analysis of extracted circulating cfDNA plays an important role in determining sizing and purity,
thus providing knowledge that is necessary for sensitive downstream applications such as NGS. cfDNA was extracted from
healthy human serum using the Quick-cfDNA serum and plasma kit from Zymo. Typical cfDNA separation profiles display
two or three distinct peaks (A). Extraction of fragmented gDNA with cfDNA can occur. The results showed that the HS
NGS Fragment kit (1-6000 bp) was able to effectively separate the three nucleosome cfDNA peaks from gDNA (B). Some
extraction kits have the option to use carrier RNA during cfDNA extraction. Carrier RNA was shown to comigrate with the
dinucleosome peak on the HS NGS Fragment kit, inflating the concentration of the second peak. It is recommended to take
into consideration the cfDNA extraction methods when analyzing cfDNA.
Application note: 5994-0522EN
21
Page 22

Application Notes and Technical Overviews
Size (bp)
12,000
Size (bp)
1,000
1,500
2,000
3,000
4,000
6,000
Analysis of RNA
RQN quality metrics
A
A
10,000
9,000
8,000
7,000
6,000
RFU
2,000
4,000
LM
3,000
2,000
RFU
7,000
6,500
6,000
5,500
5,000
4,500
4,000
3,500
3,000
2,500
2,000
15
B
B
LM
15
200
200
500
500
1,000
18S
1,500
18S
2,000
3,000
28S
4,000
28S
6,000
RQN = 9.7
28S/18S = 1.9
RQN = 5.9
28S/18S = 0.1
Kits: HS RNA kit (15 nt)
Abstract: The RQN is a user-independent quality metric for easy evaluation of total RNA quality. Total RNA quality
is a constant concern because of how easily RNA degrades due to temperature, enzymatic degradation from the abundance
of RNase in the environment, and improper handling. The Fragment Analyzer system and RQN metric were utilized to
analyze universal mouse reference total RNA degradation. Samples treated for 0 minutes at 70 °C resulted in an RQN of 9.7
(A), while 10 minutes at 70 °C degraded the sample to an RQN of 5.9 (B). Electropherograms allow for the total RNA profiles
to be compared at different points of degradation. The concentration, RQN, and ribosomal ratio are automatically reported in
ProSize, allowing for easy evaluation of total RNA quality.
Application note: 5994-0521EN
22
Page 23

Application Notes and Technical Overviews
15
0
A
Size (nt)
LM
RFU
2,000
4,000
6,000
8,000
10,000
12,000
14,000
16,000
18,000
20,000
22,000
200
500
1,000
1,500
2,000
3,000
4,000
6,000
Analysis of RNA
Eukaryotic total RNA
22,000
A
A B
20,000
18,000
16,000
14,000
12,000
RFU
10,000
8,000
6,000
LM
4,000
2,000
0
15
200
500
1,000
1,500
2,000
3,000
4,000
Size (nt)
6,000
B
C
C
RQN
10
9
8
7
6
5
RQN
4
3
2
1
0
5.0 2.5 1.250.5
Concentration
7
6
5
4
3
2
1
Measured concentration (ng/µL)
0
5.0 2.5 1.250.5
Dilution series (ng/µL)
Dilution series (ng/µL)
Kits: HS RNA kit (15 nt)
Abstract: High-quality total RNA is critical for successful outcomes in RT-PCR, microarray analysis, and NGS.
The Fragment Analyzer systems independently assign an RQN that justly represents the sample quality. The RQN is based
on a scale from 1 to 10, where 1 represents completely degraded total RNA, and 10 represents intact total RNA. Universal
mouse reference total RNA was separated on the 5200 Fragment Analyzer system with the HS RNA kit (15 nt) throughout
the concentration range of the kit. Excellent separation resolution was seen between the 18S and 28S ribosomal peaks and
in the small RNA region. As shown in the overlay (A), the sizing of the 18S and 28S ribosomal peaks remained constant and
was unchanged by the sample concentration. The RQN also remained consistent across the dilution series, averaging
9.2 ± 0.1 (B). The concentration of each sample (approximately 5, 2.5, 1.25, and 0.5 ng/μL) was analyzed and compared
between the Qubit and 5200 Fragment Analyzer systems (C). Both the Qubit and the Fragment Analyzer systems reported
similar concentrations throughout the dilution series with a percent error of 8% or less.
Qubit
5200 Fragment Analyzer
Application note: 5994-0519EN
23
Page 24

y = 0.9574x + 0.4957
R² = 0.9628
0.0
2.0
4.0
6.0
8.0
10. 0
12. 0
0 2 4 6 8 10 12
Bioanaly zer (RIN)
Fragment Analyzer (RQN)
SS RNA Kits
Eukaryotic RNA
y = 0.9875x - 0.0423
R² = 0.9746
0
2
4
6
8
10
12
0 2 4 6 8 10 12
Bioanaly zer (RIN)
Fragment Analyzer (RQN)
HS RNA Kits
Eukaryotic RNA
Application Notes and Technical Overviews
Analysis of RNA
Comparison of the RIN and RQN
A B
Instruments: Fragment Analyzer and Bioanalyzer systems
Kits: RNA (15 nt) and HS RNA (15 nt) kits (Fragment Analyzer); RNA 6000 nano
and RNA 6000 pico kits (Bioanalyzer)
Abstract: The Bioanalyzer instrument is well established for providing a reliable, automated RNA integrity number
(RIN). The RIN provides an objective assessment of RNA integrity. The Fragment Analyzer offers a user-independent quality
metric, the RQN, for easy evaluation of total RNA quality. Both the RIN and RQN consider the entire electropherogram with
scoring from 10 to 1, where 10 indicates the highest possible RNA quality and 1 completely degraded RNA. Eukaryotic
samples with a varying degree of RNA integrity from completely intact, to mildly and strongly degraded were compared on
the Bioanalyzer and Fragment Analyzer instruments. Both the standard-sensitivity (A) and high-sensitivity RNA (B) kits for
both instruments provided comparable RIN and RQN scores throughout the degradation series. This is demonstrated with
the slope and R² value close to 1. This technical overview also shows a strong correlation between the RIN and RQN for
prokaryotic E. coli RNA samples.
Technical overview: 5994-1860EN
24
Page 25

Application Notes and Technical Overviews
4,000
RFU
3,600 -
Analysis of RNA
Assessing quality of plant RNA
3
×10
5.5
A
A
Rice Root
Rice root
5.0
RQN = 8.0
RQN = 8.0
4.5
4.0
3.5
3.0
RFU
2.5
LM
2.0
1.5
1.0
0.5
0
15
C
3,400 -
Corn Leaf with gDNA
3,200 -
RQN = 5.4
3,000 2,800 2,600 2,400 2,200 2,000 1,800 1,600 1,400 1,200 1,000 -
800 600 400 200 -
0 -
5S
200
Size (nt)
LM
3
×10
5.0
B
RFU
4.5
4.0
3.5
3.0
2.5
B
Rice Leaf
Rice leaf
RQN = 5.5
RQN = 5.5
16S
23S
18S
25S
25S
18S
2.0
1.5
LM
1.0
5S
0.5
0
500
1,000
1,500
2,000
3,000
4,000
23S
16S
15 -
200 -
500 -
18S
1,000 -
1,500 -
15
25S
2,000 -
3,000 -
4,000 -
200
Size (nt)
6,000 -
500
1,000
gDNA contamination
1,500
2,000
Size (nt)
3,000
Kits: HS RNA kit
Abstract: Plant tissues have three types of ribosomal RNAs (rRNA): chloroplast, cytosolic, and mitochondrial. The
5200 Fragment Analyzer system delivers ample resolution to separate all four leaf rRNA peaks: 16S, 23S, 18S, and 25S. The
ProSize data analysis software has a dedicated plant mode for evaluating complex plant RNA samples. For example, the
electropherograms pictured highlight the difference between rice root (A) and leaf RNA (B). Leaf samples have additional
chloroplast rRNA (16S and 23S) not present in root RNA. High-quality RNA, free of gDNA, is critical for the success of
many downstream techniques including RT-PCR, microarray analysis, and NGS. The electropherogram displayed in ProSize
software provides an easy visual in determining if any gDNA contamination is present in the RNA sample. Figure C shows
an example of corn leaf RNA with gDNA contamination.
Application note: 5994-0518EN
25
Page 26

Application Notes and Technical Overviews
Size (bp)
RFU
4,000
10,000
20,000
Size (nt)
Analysis of IVT mRNA
Quality control of IVT mRNA
A
3,500
3,000
2,500
2,000
1,500
1,000
5,000
4,500
4,000
3,500
3,000
2,500
RFU
2,000
1,500
1,000
500
500
4,000
Peak of interest
5,000
7,000
UM
LM
0
75
200
300
400
500
700
1,000
1,500
2,000
3,000
B
1,831 nt
LM
DNA template
0
15
200
500
1,000
1,500
2,000
3,000
4,000
6,000
Kits: RNA kit (15 nt); HS RNA kit (15 nt); dsDNA 930 Reagent kit (75-20000 bp)
Abstract: QC analysis is an essential part of the in vitro transcription (IVT) RNA workflow. QC during IVT allows
for detection of poor PCR amplification, poor transcription, RNA contamination from DNA template, and degraded RNA, as
well as ensuring that downstream applications start with high-quality RNA. The first recommended QC checkpoint helps
to determine if the PCR amplification and product cleanup procedures were successful. PCR product was analyzed on the
Fragment Analyzer system with the dsDNA 930 Reagent kit (A). Multiple unwanted peaks indicated a poor PCR reaction.
The second recommended QC checkpoint occurs after transcription. Cleanup of the transcription product involves the
use of DNase to eliminate the DNA template, leaving a purified RNA product. The Fragment Analyzer systems can detect
the presence of a DNA template in RNA (B). Detection of degraded, contaminated, or otherwise unsuitable RNA allows
researchers to rework or remove these samples early in the process.
Application note: 5994-0512EN
26
Page 27
Application Notes and Technical Overviews
5,000
Size (bp)
Size (bp)
1,000
1,500
2,000
2,500
3,000
5,000
4,000
6,000
9,000
Analysis of IVT mRNA
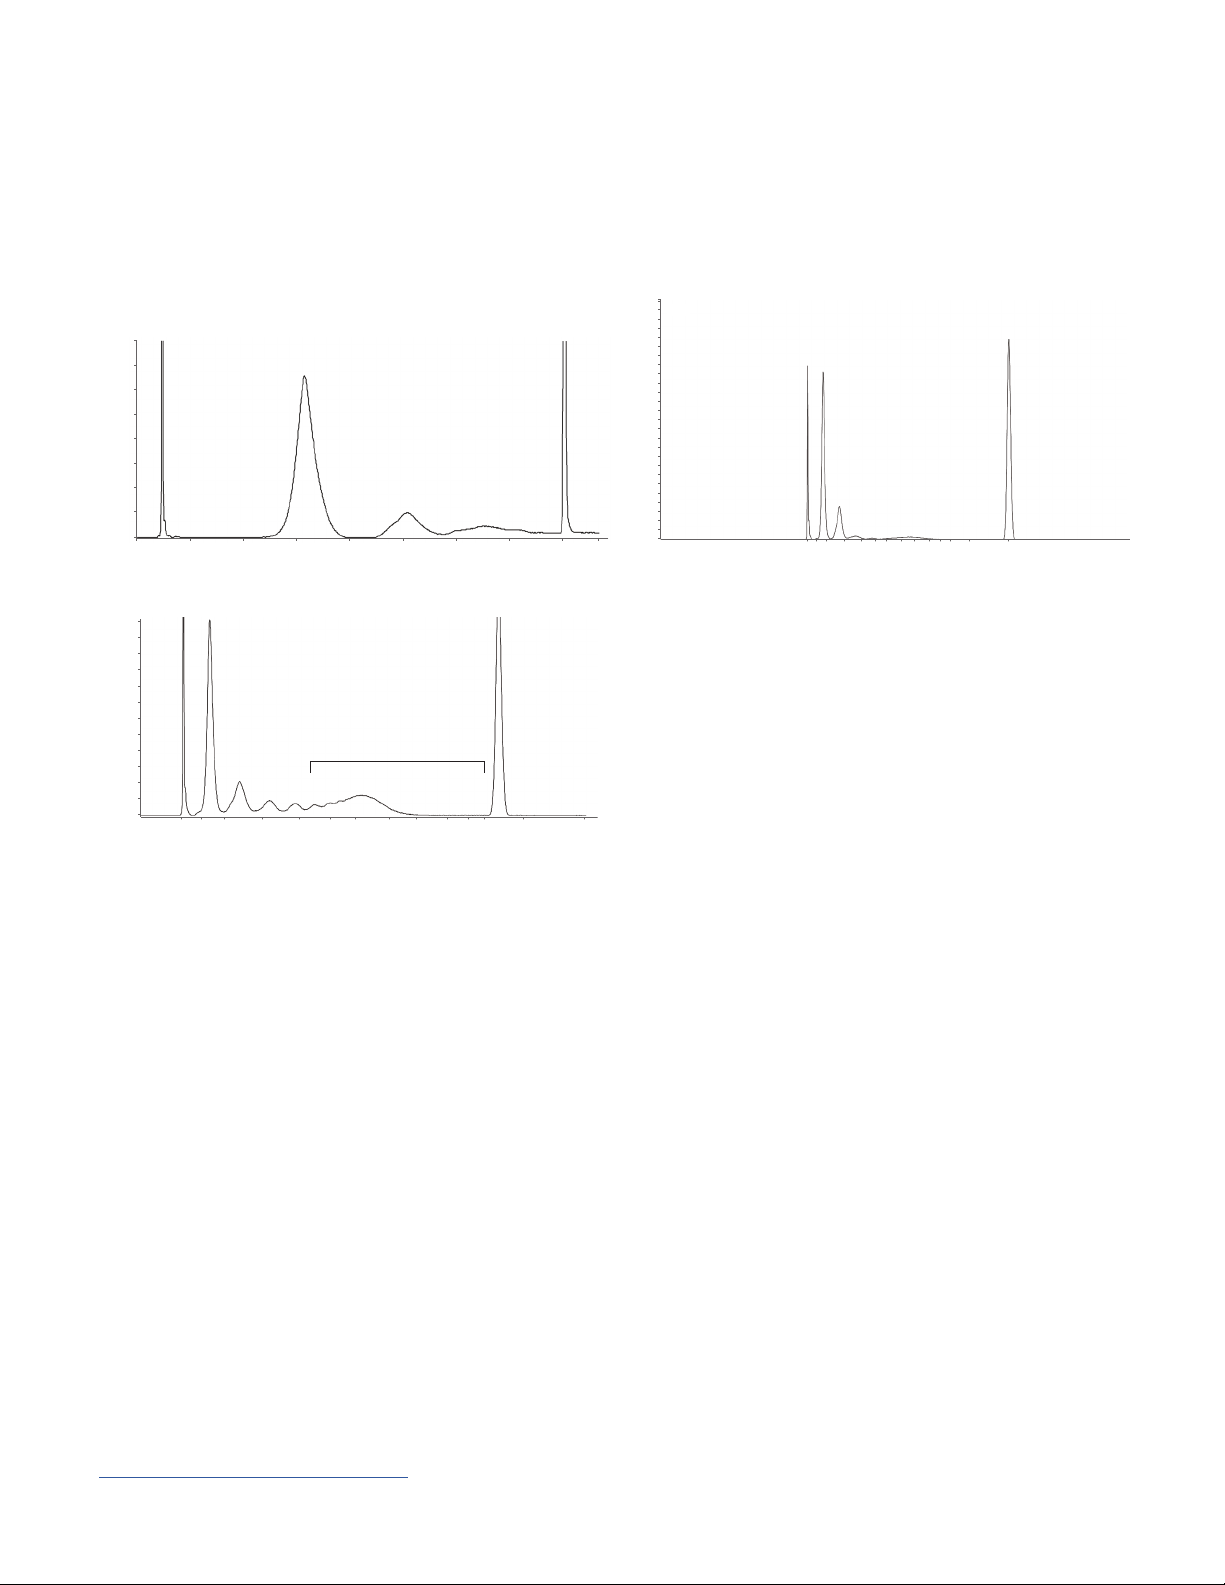
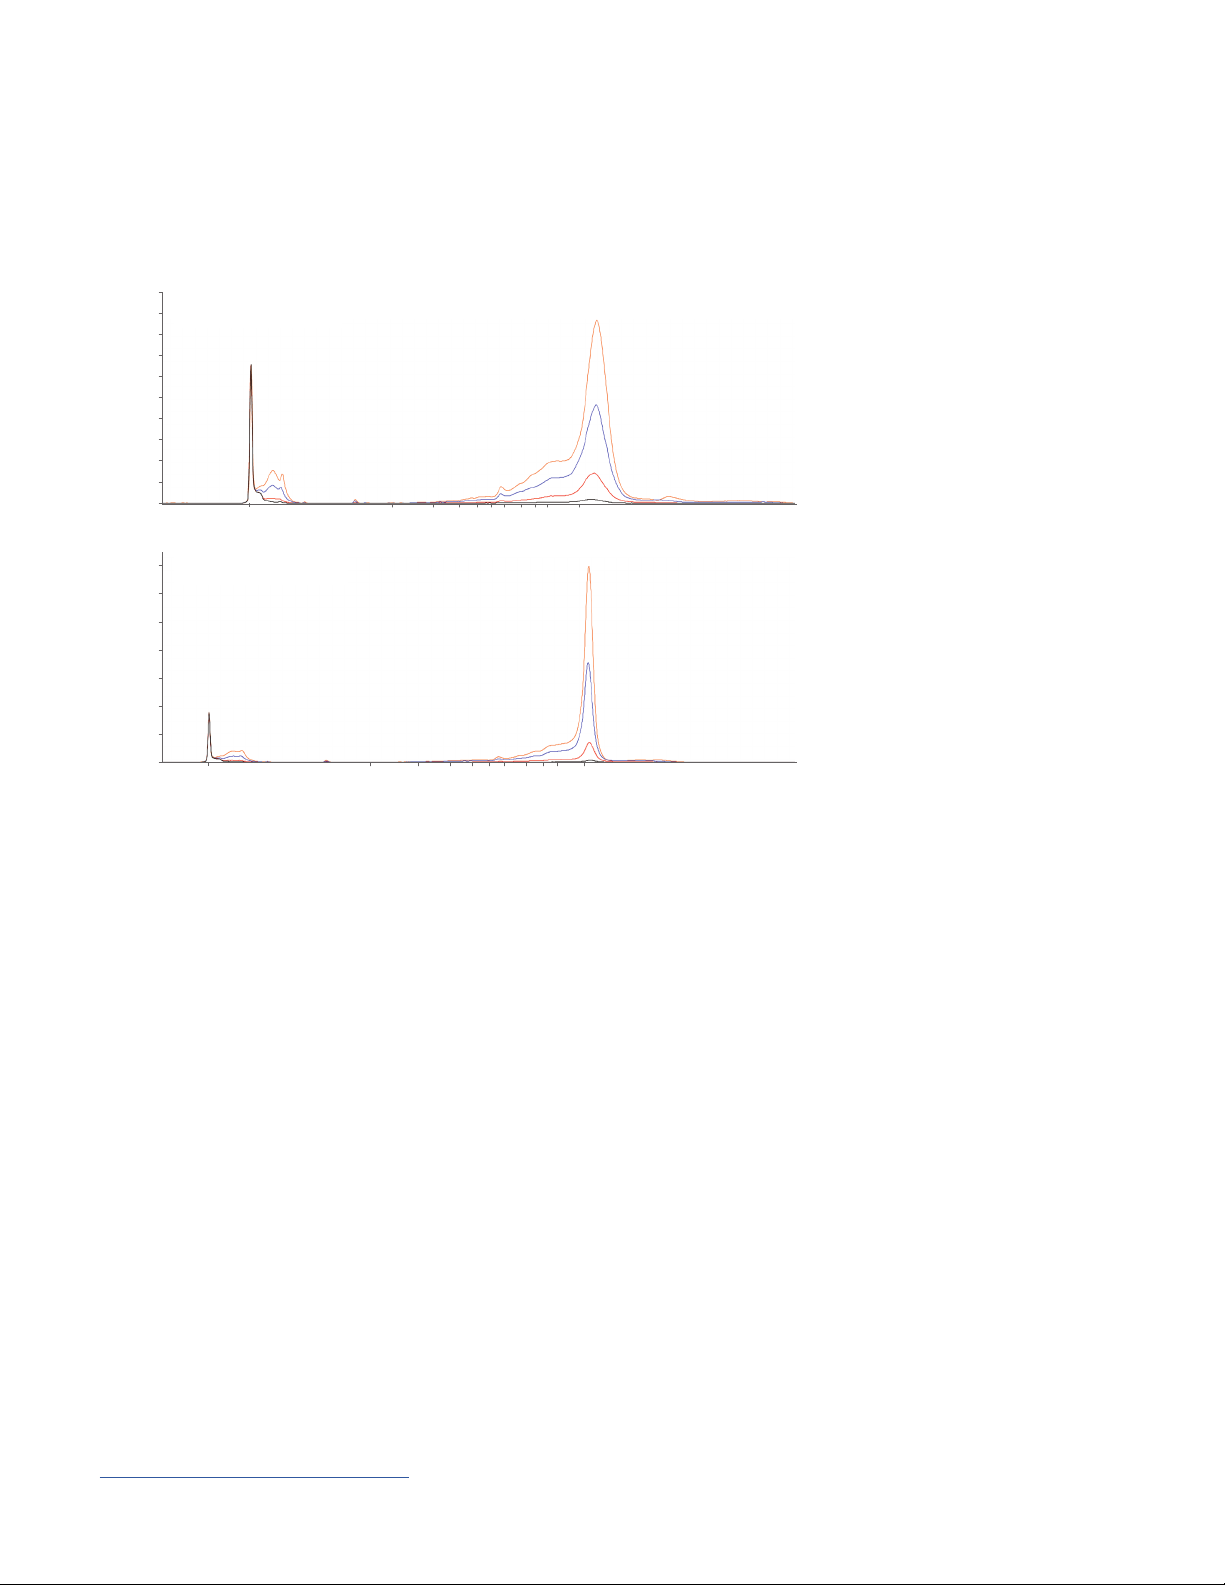
Long IVT mRNA sizing
A Normal RNA method
A
4,500
4,000
3,500
3,000
2,500
RFU
2,000
1,500
1,000
14,000
12,000
10,000
8,000
RFU
6,000
4,000
2,000
500
Normal RNA method
LM
0
B Extended RNA method
B
0
15
Extended RNA method
LM
15
500
500
1,000
1,500
2,000
2,500
3,000
5,000
4,000
6,000
9,000
Kits: RNA kit (15 nt)
Abstract: The use of IVT mRNA is becoming widespread in research areas such as ribozyme and aptamer
synthesis, mRNA synthesis, RNA interference, and antisense RNA techniques. Longer RNA transcripts greater than 3,000 nt
are needed for gene structure and functional studies. Reliable sizing and quality assessment of IVT mRNA at 10,000 nt was
obtained using the 5200 Fragment Analyzer system with the Agilent RNA kit (15 nt) with a normal (8 kV, 45 minutes) and an
extended RNA separation method (4 kV, 90 minutes). A dilution series over the entire concentration range of the kit (100, 50,
10 and 1 ng/μL) of the 10,000 nt IVT mRNA sample was assessed. The average size throughout the dilution series for the
normal (A) and extended method (B) respectively, was 10,526 and 9,543 nt with a low percent coefficient of variance (% CV)
of 0.4% and 0.5% and a low percent error of 5.2% and -4.6%, indicating precise and accurate sizing for both methods. The
extended method provided sharper peaks enabling the ability to distinguish minute amounts of degradation.
Application note: 5994-0878EN
27
Page 28

Application Notes and Technical Overviews
)S
)Size (nt)
RFU
16,000
17,000
15
0
C
No. 7 HS RNA kit
90 °C
LM
DG
LP
146
SSP
250–750 nt
RFU
500
1,000
1,500
2,000
2,500
3,000
3,500
4,000
4,500
5,000
5,500
6,000
6,500
7,000
7,500
8,500
8,000
200
500
CRISPR/Cas Engineering
Single-guide RNA quality assessment
A
15,000
No heat Heat
14,000
13,000
12,000
11,000
10,000
9,000
8,000
7,000
6,000
5,000
4,000
LM
3,000
2,000
1,000
0
LP
147
SSP
543
20
Size (nt
200
500
RFU
16,000
15,000
14,000
13,000
12,000
11,000
10,000
9,000
8,000
7,000
6,000
5,000
4,000
3,000
2,000
1,000
B
LP
146
200
SSP
490
500
LM
DG
0
15
ize (nt
Kits: HS RNA kit (15 nt)
Abstract: One method of CRISPR/Cas9 gene editing is the delivery of Cas9 complexed in vitro with a single-
guide RNA (sgRNA). Traditionally, quality control analysis of sgRNA prior to Cas9 complexing is performed by agarose gel
electrophoresis. While this process can determine whether an sgRNA is extensively degraded, the resolution and sensitivity
of agarose gels does not allow for detection of low levels of degradation that can affect editing efficiency. Heat denaturing
RNA before separation by electrophoresis reduces extensive secondary structure peaks (SSP) formed by intramolecular
base pairing, which may inhibit size-dependent migration of RNA fragments. Separation of sgRNAs with (B) and without
(A) heat denaturation was performed on the 5200 Fragment Analyzer system with the HS RNA kit. sgRNAs are capable of
folding into many different secondary structures. The presence of denaturing formamide in the diluent marker of the kit was
adequate to limit sgRNA secondary structure formation without heat denaturation in most samples.
Application note: 5994-0523EN
28
Page 29

Application Notes and Technical Overviews
(bp)
RFU
dsDNA
CRISPR/Cas Engineering
Analysis of long, single-stranded DNA
26,000
24,000
22,000
20,000
18,000
16,000
14,000
12,000
10,000
8,000
6,000
4,000
2,000
300
ssDNA
405 bp
Small amount of
undigested dsDNA
400
500
LM
0
1
100
200
600
1,078 bp
800
700
1,000
1,500
2,000
3,000
UM
Size
6,000
Kits: CRISPR Discovery Gel kit
Abstract: Single-stranded DNA (ssDNA) templates are becoming increasingly useful in CRISPR/Cas homology-
directed repair (HDR). ssDNA templates, ranging from 500 base to kilobase length, have been found to greatly increase the
number of homologous recombination events when compared to the traditional double-stranded DNA (dsDNA) templates.
Creation of ssDNA templates requires quality control steps to ensure complete conversion from dsDNA to ssDNA. Analysis
of ssDNA prepared from digestion of dsDNA was analyzed on the 5200 Fragment Analyzer system. The overlay of ssDNA
digest product (blue) and beginning dsDNA (black) shows a minute amount of undigested dsDNA left over after digestion.
The high sensitivity and resolution of the Fragment Analyzer instrument allowed for detection of small amounts of
undigested dsDNA not detectable on agarose gel.
Application note: 5994-0584EN
29
Page 30

Application Notes and Technical Overviews
6,000
Size
4,000
3,000
2,000
1,500
1,000
Minutes of polyadenylation
CRISPR/Cas Engineering
Polyadenylation of Cas9 mRNA
(nt)
500
200
4,101 4,501 4,934 5,753 6,098 6,197
15
01020
30 40 50 HS RNA
Ladder
Kits: HS RNA kit (15 nt)
Abstract: DNA-free CRISPR gene editing has become a popular way to control for off-target effects during CRISPR
transfection. However, the size of the Cas9 protein does not always allow for transfection of Cas9/sgRNA ribonucleoprotein
complexes. A way to overcome this method of DNA-free CRISPR gene editing is to transfect both in vitro-transcribed sgRNA
and Cas9 mRNA. Polyadenylation of the Cas9 mRNA allows for a longer translation time by protecting and increasing the
stability of the Cas9 transcript. Above is a digital gel image of Cas9 mRNA with polyadenylation reaction time = 0, 10, 20, 30,
40, and 50 minutes separated on the 5200 Fragment Analyzer system with the HS RNA kit (15 nt). The size increases with
increased polyadenylation. The Fragment Analyzer instrument provides high-resolution separation and consistent sizing of
the Cas9 mRNA with or without polyadenylation.
Application note: 5994-0583EN
30
Page 31

Application Notes and Technical Overviews
36,000
Size (bp)
CRISPR/Cas Engineering
Engineered restriction site to estimate CRISPR homology-directed repair efficiency
34,000
32,000
30,000
28,000
26,000
24,000
22,000
20,000
18,000
RFU
16,000
14,000
12,000
10,000
8,000
6,000
4,000
2,000
Digested fragments
LM
0
1
100
200
Homoduplexes
424
300
400
Indigestable heteroduplexes
500
600
700
800
1,000
1,200
1,500
2,000
3,000
UM
6,000
Kits: CRISPR Discovery Gel kit
Abstract: The 5200 Fragment Analyzer system coupled with the CRISPR Discovery Gel kit provides high-
throughput analysis for detection of CRISPR-induced, homology-directed repair (HDR) knock-in of novel restriction enzyme
sites. The presented method enables determination of the approximate frequency of HDR repairs in both pooled and
individual cell line systems when using CRISPR gene editing. Analysis of BamHI digested from 40% pHDR mixed template
PCR using the 5200 Fragment Analyzer system with the CRISPR Discovery Gel kit. Heteroduplex formation was easily seen
on the 5200 Fragment Analyzer system, providing for rapid assessment of cleavage accuracy.
Application note: 5994-0524EN
31
Page 32

Learn more:
www.agilent.com/genomics/fragment-analyzer
Buy online:
www.agilent.com/chem/store
U.S. and Canada
1-800-227-9770
agilent_inquiries@agilent.com
Europe
info_agilent@agilent.com
Asia Pacific
inquiry_lsca@agilent.com
For Research Use Only. Not for use in diagnostic procedures.
PR7000-7675
This information is subject to change without notice.
© Agilent Technologies, Inc. 2021
Published in the USA, March 1, 2021
5994-2813EN
 Loading...