

Page 1

Data Sheet and
Technical
Specifications
Keysight 2-Port
PNA-L Network Analyzer
N5234A (
10 MHz to 43.5 GHz
)
N5235A (10 MHz to 50 GHz)
Page 2

Documentation Warranty
THE MATERIAL CONTAINED IN THIS DOCUMENT IS PROVIDED "AS IS," AND IS SUBJECT TO BEING
CHANGED, WITHOUT NOTICE, IN FUTURE EDITIONS. FURTHER, TO THE MAXIMUM EXTENT
PERMITTED BY APPLICABLE LAW, KEYSIGHT DISCLAIMS ALL WARRANTIES, EITHER EXPRESS OR
IMPLIED WITH REGARD TO THIS MANUAL AND ANY INFORMATION CONTAINED HEREIN, INCLUDING
BUT NOT LIMITED TO THE IMPLIED WARRANTIES OF MERCHANTABILITY AND FITNESS FOR A
PARTICULAR PURPOSE. KEYSIGHT SHALL NOT BE LIABLE FOR ERRORS OR FOR INCIDENTAL OR
CONSEQUENTIAL DAMAGES IN CONNECTION WITH THE FURNISHING, USE, OR PERFORMANCE OF
THIS DOCUMENT OR ANY INFORMATION CONTAINED HEREIN. SHOULD KEYSIGHT AND THE USER
HAVE A SEPARATE WRITTEN AGREEMENT WITH WARRANTY TERMS COVERING THE MATERIAL IN
THIS DOCUMENT THAT CONFLICT WITH THESE TERMS, THE WARRANTY TERMS IN THE SEPARATE
AGREEMENT WILL CONTROL.
U.S. Government Rights
U.S. Government Rights. The Software is “commercial computer software,” as defined by Federal
Acquisition Regulation (“FAR”) 2.101. Pursuant to FAR 12.212 and 27.405-3 and Department of Defense
FAR Supplement (“DFARS”) 227.7202, the U.S. government acquires commercial computer software
under the same terms by which the software is customarily provided to the public. Accordingly, Keysight
provides the Software to U.S. government customers under its standard commercial license, which is
embodied in its End User License Agreement (EULA), a copy of which can be found at
http://www.keysight.com/find/sweula. The license set forth in the EULA represents the exclusive authority by
which the U.S. government may use, modify, distribute, or disclose the Software. The EULA and the
license set forth therein, does not require or permit, among other things, that Keysight: (1) Furnish
technical information related to commercial computer software or commercial computer software
documentation that is not customarily provided to the public; or (2) Relinquish to, or otherwise provide,
the government rights in excess of these rights customarily provided to the public to use, modify,
reproduce, release, perform, display, or disclose commercial computer software or commercial
computer software documentation. No additional government requirements beyond those set forth in
the EULA shall apply, except to the extent that those terms, rights, or licenses are explicitly required
from all providers of commercial computer software pursuant to the FAR and the DFARS and are set
forth specifically in writing elsewhere in the EULA. Keysight shall be under no obligation to update,
revise or otherwise modify the Software. With respect to any technical data as defined by FAR 2.101,
pursuant to FAR 12.211 and 27.404.2 and DFARS 227.7102, the U.S. government acquires no greater
than Limited Rights as defined in FAR 27.401 or DFAR 227.7103-5 (c), as applicable in any technical
data.
2
Page 3

U.S. Government Rights
.................................................................................................................2
Corrected System Performance ..................................................................................................6
N5234A and N5235A Corrected System Performance, All Options.............................................8
Uncorrected System Performance ............................................................................................ 13
Test Port Output ....................................................................................................................... 14
Test Port Input ......................................................................................................................... 18
Dynamic Accuracy .................................................................................................................... 21
General Information ................................................................................................................. 25
Definitions ................................................................................................................................................ 5
System Dynamic Range and Receiver Dynamic Range ........................................................................... 6
Table 1a. System Dynamic Range (dB), N5234A ..................................................................................... 7
Table 1b. System Dynamic Range (dB), N5235A ..................................................................................... 7
Table 2. Receiver Dynamic Range (dB), All Models, All Options - Typical .............................................. 8
Table 3. 85056A Calibration Kit ............................................................................................................... 9
Table 4. N4693A 2-Port Electronic Calibration Module ........................................................................ 11
Table 5a. Error Terms (dB), All Models, All Ports, All Options - Specifications ..................................... 13
Table 5b. Error Terms (dB), All Models, All Ports, All Options - Typical ................................................ 13
Table 6. Frequency Information, All Options .......................................................................................... 14
Table 7a. Maximum Leveled Power (dBm), N5234A , All Ports1 ............................................................ 14
Table 7b. Maximum Leveled Power (dBm), N5235A, All Ports1 ............................................................. 14
Table 8. Power Level Accuracy (dB) at Nominal Power1, All Models, All Options, All Ports2 ................ 15
Table 9. Power Level Linearity1 (dB), All Models, All Options, All Ports2 - Specification ....................... 15
Table 10. Power Sweep Range (dB), All Models, All Ports1 ................................................................... 15
Table 11. Nominal Power (Preset,dBm), All Ports1, All Options ............................................................. 16
Table 12. Power Resolution and Maximum/Minimum Settable Power, All Models, All Ports1 .............. 16
Table 13. 2nd and 3rd Harmonics at Max Specified Power (dBc) All Options, All Ports1 - Typical .......... 16
Table 14. Non-Harmonic Spurs at Nominal Power (dBc), All Models,All Options - Typical ................. 16
Table 15. Phase Noise (dBc/Hz), All Models, All Options - Typical ....................................................... 17
Table 16. Noise Floor1 (dBm) @ 10 Hz IFBW, All Models, All Ports ...................................................... 18
Table 17. 0.1 dB Receiver Compression at Test Port (dBm), All Models, All Options, All Ports - Typical18
Table 18. Receiver Compression at Test Port Power, All Models, All Options, All Ports - Specification19
Table 19a. Trace Noise1 Magnitude (dB rms), All Models, All Options .................................................. 19
Table 19b. Trace Noise1 Phase (deg rms), All Models, All Options ........................................................ 19
Table 20. Reference Level Magnitude, All Models and Options - Specification .................................... 20
Table 21. Stability1, All Models, All Options - Typical ............................................................................ 20
Table 22a. Damage Level, All Models, Option 200 - Typical ................................................................. 20
Table 22b. Damage Level, All Models, Option 216 - Typical ................................................................. 20
Table 23. Dynamic Accuracy - Specification ......................................................................................... 21
Table 24. Group Delay1 .......................................................................................................................... 24
3
Page 4

Table 25. Miscellaneous Information ..................................................................................................... 25
Measurement Throughput Summary ........................................................................................ 29
Specifications: Front-Panel Jumpers ........................................................................................ 33
Test Set Block Diagrams .......................................................................................................... 35
Table 26. Front Panel Information, All Options ...................................................................................... 25
Table 26 (Continued) Front Panel Information, All Options ................................................................... 26
Table 27. Rear Panel Information, All Options ....................................................................................... 26
Table 27. (Continued) Rear Panel Information, All Options ................................................................... 27
Table 28. Analyzer Dimensions and Weight .......................................................................................... 28
Regulatory and Environmental Information ........................................................................................... 28
Table 29. Cycle Time (ms) for Measurement Completion, All Options - Typical ................................... 29
Table 30. Cycle Time vs. IF Bandwidth - Typical ................................................................................... 30
Table 31. Cycle Time vs. Number of Points - Typical ............................................................................ 31
Table 32. Data Transfer Times - Typical ............................................................................................... 32
Table 33. Measurement Receiver Inputs (dBm), Option 216 - Typical .................................................. 33
Table 34. Reference Receiver Inputs and Reference Source Outputs (dBm) - Typical ......................... 33
Table 35. Source Outputs (dBm) - Typical ............................................................................................. 34
Table 36. Coupler Inputs (dB) - Typical ................................................................................................. 34
N5234A and N5235A Option 200 (2-port base model) ........................................................................ 35
N5234A and N5235A Option 216 .......................................................................................................... 35
Receiver Block Diagram ......................................................................................................................... 36
4
Page 5

This is a complete list of the technical specifications for the N5234A and N5235A PNA-L network
analyzers with the following options:
All Models
Option 200 -
Option 216
See block diagrams for all models and options beginning on page 35.
Specification (spec.):
Characteristic (char.):
Typical (typ.):
Nominal (nom.):
Calibration:
Corrected (residual):
Uncorrected (raw):
Standard:
Notes:
2-port base model with standard test set.
- To base model, adds front-panel jumpers and source attenuators (extended power range).
Definitions
All specifications and characteristics apply over a 25 °C ±5 °C range (unless otherwise stated) and 90 minutes after the
instrument has been turned on.
statistical performance distribution, measurement uncertainties, and changes in performance due to environmental
conditions.
but that is not verified in the field and is not covered by the product warranty. A characteristic includes the same
guardbands as a specification.
product warranty. Typical values are produced by averaging the measured data across each frequency band.
product warranty.
errors.
Expected performance of an average unit which does not include guardbands. It is not covered by the
The process of measuring known standards to characterize a network analyzer's systematic (repeatable)
Warranted performance. Specifications include guardbands to account for the expected
A performance parameter that the product is expected to meet before it leaves the factory,
A general, descriptive term that does not imply a level of performance. It is not covered by the
calibration standards and how well "known" they are, plus system repeatability, stability, and noise.
the stability of a calibration.
This document provides technical specifications for the 85056A and N4693A calibration kits.
Please download our free Uncertainty Calculator from http://www.keysight.com/find/na_calculator to
generate the curves for your calibration kit and PNA-L setup.
When referring to the analyzer, this includes no options unless noted otherwise.
Indicates performance after error correction (calibration). It is determined by the quality of
Indicates instrument performance without error correction. The uncorrected performance affects
5
Page 6

Corrected System Performance
The effective dynamic range must take measurement uncertainties and interfering signals
receiver residuals.
The specifications in this section apply for measurements made with the N5234A and N5235A PNA-L network
analyzers
• 10 Hz IF bandwidth
• No averaging applied to data
• Isolation calibration with an averaging factor of 8
System Dynamic Range and Receiver Dynamic Range
• System Dynamic Range is defined as the specified source maximum output power (spec) minus the noise floor
• Extended Dynamic Range at Direct Access Input is defined as the specified source maximum output power (spec)
• Receiver Dynamic Range is defined as the test port compression at 0.1 dB (typical) minus the noise floor (typical).
with the following conditions:
(spec).
minus the direct receiver access input noise floor (spec).
into account.
The direct receiver access input extended dynamic range is calculated as the difference
between the direct receiver access input noise floor and the source maximum output
power. This set-up should only be used when the receiver input will never exceed its
maximum receiver input. When the analyzer is in segment sweep mode, it can have
predefined frequency segments which will output a higher power level when the extended
dynamic range is required (i.e. devices with high insertion loss), and reduced power when
the maximum receiver input level will occur (i.e. devices with low insertion loss). The
extended range is only available in one-path transmission measurements.
It may typically be degraded at particular frequencies below 500 MHz due to spurious
6
Page 7

Table 1a. System Dynamic Range (dB), N5234A
Description Specification Typical
Test Port Test Port
10 MHz to 45 MHz 75 75 110 94 94 138
45 MHz to 500 MHz 90 90 102 117 117 132
500 MHz to 2 GHz 114 112 124 129 129 144
2 GHz to 8.5 GHz 120 118 130 131 130 145
8.5 GHz to 12.5 GHz 122 120 132 132 131 146
12.5 GHz to 13.51 GHz 118 116 128 131 129 144
13.51 GHz to 20 GHz 108 106 118 120 118 133
20 GHz to 35 GHz 100 97 107 116 113 126
35 GHz to 40 GHz 100 97 107 116 113 126
40 GHz to 43.5 GHz 85 85 93 104 100 111
Option
200
Option 216 Option 200 Option 216
Direct
Receiver
Access port
Test Port Test Port
Receiver
Access port
Direct
Table 1b. System Dynamic Range (dB), N5235A
Description Specification Typical
Test Port Test Port
10 MHz to 45 MHz 75 75 110 94 94 138
45 MHz to 500 MHz 90 90 102 117 117 132
500 MHz to 2 GHz 114 112 124 129 129 144
2 GHz to 8.5 GHz 120 118 130 131 130 145
8.5 GHz to 12.5 GHz 122 120 132 132 131 146
12.5 GHz to 13.51 GHz 118 116 128 131 129 144
13.51 GHz to 20 GHz 108 106 118 120 118 133
20 GHz to 35 GHz 100 97 107 116 113 126
35 GHz to 40 GHz 100 97 107 116 113 126
40 GHz to 50 GHz 84 80 88 104 100 111
Option
200
Option 216 Option 200 Option 216
Direct
Receiver
Access port
Test Port Test Port
Receiver
Access port
Direct
7
Page 8

Table 2. Receiver Dynamic Range (dB), All Models, All Options - Typical
Description Typical
10 MHz to 45 MHz 100
45 MHz to 500 MHz 120
500 MHz to 2 GHz 127
2 GHz to 8.5 GHz 128
8.5 GHz to 13.5 GHz 129
13.5 GHz to 20 GHz 117
20 GHz to 35 GHz 116
35 GHz to 40 GHz 114
40 GHz to 43.5 GHz 105
43.5 GHz to 47 GHz 104
47 GHz to 50 GHz 103
N5234A and N5235A Corrected System Performance, All Options
Note: For any Sii reflection measurement:
• Sjj = 0.
For any Sij transmission measurement:
• Sji = Sij when Sij ≤ 1
• Sji = 1/Sij when Sij > 1
• Skk = 0 for all k
Applies to the N5234A/5A Option 200 or 216 analyzers, 85133F flexible test port cable set, and a full 2-port
calibration. Also applies to the following condition:
Environmental temperature 23° ±3 °C, with < 1 °C deviation from calibration temperature
8
Page 9

Table 3. 85056A Calibration Kit
Description Specification (dB)
10 MHz
to
50 MHz
50 MHz to
2 GHz
2 GHz
to
10 GHz
10 GHz to
20 GHz
20 GHz to
30 GHz
30 GHz to
40 GHz
40 GHz to
50 GHz
Directivity 42 42 42 42 38 38 36
Source Match 41 41 38 38 33 33 31
Load Match 42 42 42 42 37 37 35
Reflection Tracking1
Mag ±0.001 ±0.001 ±0.008 ±0.008 ±0.020 ±0.020 ±0.027
Phase (°/°C) ±0.009 ±0.009 ±0.054 ±0.054 ±0.133 ±0.133 ±0.180
Transmission Tracking
1
Mag ±0.019 ±0.019 ±0.051 ±0.060 ±0.129 ±0.129 ±0.220
Phase (°/°C) ±0.126 ±0.126 ±0.335 ±0.393 ±0.848 ±0.848 ±1.453
1
Temperature deviation is a characteristic value.
Transmission Uncertainty, All Options
9
Page 10

Reflection Uncertainty, All Options
10
Page 11

Table 4. N4693A 2-Port Electronic Calibration Module
Description Specification (dB)
Directivity
Source Match
Load Match
10 MHz to
50 MHz
32 42 49 45 41 41
25 44 42 37 35 35
28 38 43 40 35 35
50 MHz to
2 GHz
2 GHz to
10 GHz
10 GHz to
20 GHz
20 GHz to
30 GHz
30 GHz to
40 GHz
40 GHz to
Reflection Tracking1
Mag
Phase (°/°C)
Transmission Tracking
1
Mag
Phase (°/°C)
1
Temperature deviation is a characteristic value.
±0.050 ±0.030 ±0.040 ±0.050 ±0.060 ±0.060
±0.330 ±0.198 ±0.264 ±0.330 ±0.396 ±0.396
±0.345 ±0.061 ±0.052 ±0.093 ±0.112 ±0.149
±2.274 ±0.404 ±0.345 ±0.615 ±0.739 ±0.980
Transmission Uncertainty, All Options
50 GHz
36
32
30
±0.080
±0.528
±0.284
±1.875
11
Page 12

Reflection Uncertainty, All Options
12
Page 13

Uncorrected System Performance
Specifications apply to following conditions:
• Over environmental temperature of 25 °C ±5 °C, with less than 1°C variation from the calibration temperature.
• Cable loss not included in Transmission Tracking.
• Crosstalk measurement conditions: normalized to a thru, measured with shorts on all ports, 10 Hz IF
bandwidth, averaging factor of 8, alternate mode, source power set to the specified maximum power.
Table 5a. Error Terms (dB), All Models, All Ports, All Options - Specifications
Description Directivity
10 MHz to 45 MHz 15 9 10 -- -- --
45 MHz to 2 GHz 23 17 18 -- -- --
2 GHz to 8.5 GHz 21 12 13 -- -- --
8.5 GHz to 12.5 GHz 16 11 11 -- -- --
12.5 GHz to 20 GHz 16 11 9 -- -- --
20 GHz to 40 GHz 15 7 8 -- -- --
40 GHz to 50 GHz 13 5 5 -- -- --
Source
Match
Load Match
Transmission
Tracking
Reflection
Tracking
Crosstalk
Table 5b. Error Terms (dB), All Models, All Ports, All Options - Typical
Description Directivity
10 MHz to 45 MHz 21 13 14 +/- 2.5 +/- 1.5 -86
45 MHz to 200 MHz 27 25 26 +/- 2.5 +/- 1.5 -94
200 MHz to 500 MHz 30 25 22 +/- 2.5 +/- 1.5 -94
Source
Match
Load Match
Transmission
Tracking
Reflection
Tracking
Crosstalk
500 MHz to 2GHz 30 25 22 +/- 2.5 +/- 1.5 -95
2 GHz to 8.5 GHz 25 20 17 +/- 2.5 +/- 1.5 -105
8.5 GHz to 12.5 GHz 22 16 15 +/- 3.0 +/- 1.5 -110
12.5 GHz to
13.51GHz
13.51 GHz to 20 GHz 19 16 14 +/- 3.0 +/- 1.5 -108
20 GHz to 26.5 GHz 20 14 13 +/- 5.0 +/- 2.0 -97
26.5 GHz to 40 GHz 19 14 13 +/- 5.0 +/- 2.0 -97
40 GHz to 43.5 GHz 19 10 10 +/- 5.0 +/- 2.5 -89
43.5 GHz to 50 GHz 18 10 10 +/- 5.0 +/- 2.5 -89
19 16 14 +/- 3.0 +/- 1.5 -110
13
Page 14

Test Port Output
Table 6. Frequency Information, All Options
Description Specification Typical
N5234A Frequency Range 10 MHz to 43.5 GHz --
N5235A Frequency Range 10 MHz to 50 GHz --
Frequency Resolution 1 Hz --
Frequency Accuracy +/- 1 ppm --
Frequency Stability --
1
Assumes no variation in time.
2
Assumes no variation in temperature.
Table 7a. Maximum Leveled Power (dBm), N5234A , All Ports1
Description Specification Typical
Option 200 Option 216 Option 200 Option 216
+/-0.05 ppm, -10° to 70° C
+/-0.1 ppm/yr maximum
1
2
10 MHz to 45 MHz 0.000 0.000 4
45 MHz to 500 MHz 0.000 0.000 7
500 MHz to 8 GHz 4.000 2.000 9
8 GHz to 12.5 GHz 6.000 4.000 10
12.5 GHz to 20 GHz 2.000 0.000 9
20 GHz to 40 GHz -5.000 -8.000 5
40 GHz to 43.5 GHz -10.000 -10.000 0
1
Any port can be used as the source port.
4
7
9
9
7
2
-4
Table 7b. Maximum Leveled Power (dBm), N5235A, All Ports1
Description Specification Typical
Option 200 Option 216 Option 200 Option 216
10 MHz to 45 MHz
45 MHz to 500 MHz
500 MHz to 8 GHz
0.000 0.000
0.000 0.000
4.000 2.000
8 GHz to 12.5 GHz 6.000 4.000
4 4
7 7
9 9
10 9
12.5 GHz to 20 GHz 2.000 0.000
20 GHz to 40 GHz
40 GHz to 50 GHz
1
Any port can be used as the source port.
-5.000 -8.000
-11.000 -15.000
14
9 7
5 2
0 -4
Page 15

Table 8. Power Level Accuracy (dB) at Nominal Power1, All Models, All Options, All Ports2
Description Specification Typical
10 MHz to 45 MHz +/-1.5 +/-0.18
45 MHz to 500 MHz +/-1.5 +/-0.13
500 MHz to 10.5 GHz +/-1.5 +/-0.07
10.5 GHz to 20 GHz +/-1.5 +/-0.08
20 GHz to 40GHz +/-1.5 +/-0.11
40 GHz to 43.5 GHz +/-2.5 +/-0.14
43.5 GHz to 50 GHz +/-3.0 +/-0.23
1
Level accuracy at power other than nominal power, Power Level Accuracy (dB) at Nominal Power + Power Level
Linearity (dB)
2
Either port can be used as the source port.
Table 9. Power Level Linearity1 (dB), All Models, All Options, All Ports2 - Specification
Description -25 dBm ≤ P < -20 dBm -20 dBm ≤ P < -15 dBm P ≥-15 dBm
10 MHz to 45 MHz +/-2.0 +/-1.5 +/-1.5
45 MHz to 50 GHz +/-1.5 +/-1.5 +/-1.5
1
Referenced to nominal power.
2
Either port can be used as the source port.
Table 10. Power Sweep Range (dB), All Models, All Ports1
Description Specification Typical
Option 200 Option 216 Option 200 Option 216
10 MHz to 45 MHz 25 25 31 31
45 MHz to 500 MHz 25 25 34 34
500 MHz to 2 GHz 29 27 36 36
2 GHz to 12.5 GHz 31 29 37 36
12.5 GHz to 20 GHz 27 25 36 34
20 GHz to 40 GHz 20 17 32 29
40 GHz to 50 GHz 14 10 27 23
1
Either port can be used as the source port.
15
Page 16

Table 11. Nominal Power (Preset,dBm), All Ports
1
, All Options
Description N5234A N5235A
Preset Power -10 -15
1
Either port can be used as the source port.
Table 12. Power Resolution and Maximum/Minimum Settable Power, All Models, All Ports1
Description Specification (dB) Typical (dBm)
All Options All Options Option 200 Option 216
Power Resolution 0.01 -- -- --
Maximum Settable Power -- 30 -- --
Minimum Settable Power -- -- -30 -90
1
Either port can be used as the source port.
Table 13. 2nd and 3rd Harmonics at Max Specified Power (dBc) All Options, All Ports1 - Typical
Description2 N5234A N5235A
20 MHz to 500 MHz -22 -22
500 MHz to 2 GHz -23 -23
2 GHz to 15 GHz -28 -28
15 GHz to 20 GHz -33 -33
20 GHz to 40 GHz -30 -30
40 GHz to 43.5 GHz -29 -29
43.5 GHz to 50 GHz -- -29
1
Either port can be used as the source port.
2
Listed frequency is harmonic frequency; test at max specified power.
Table 14. Non-Harmonic Spurs at Nominal Power (dBc), All Models,All Options - Typical
Description Based on 8 kHz offset Frac-N Based on 100 kHz offset Frac-N
10 MHz to 500 MHz -50 -50
500 MHz to 2 GHz -60 -42
2 GHz to 4 GHz -57 -45
4 GHz to 8 GHz -51 -39
8 GHz to 16 GHz -45 -33
16 GHz to 32 GHz -39 -27
32 GHz to 50 GHz -33 -21
16
Page 17

Table 15. Phase Noise (dBc/Hz), All Models, All Options - Typical
Description 1 kHz Offset 10 kHz Offset 100 kHz Offset 1 MHz Offset
10 MHz to 50 MHz -95 -101 -101 -117
50 MHz to 1 GHz -96 -101 -101 -119
1 GHz to 2 GHz -91 -105 -102 -121
2 GHz to 4 GHz -85 -99 -96 -115
4 GHz to 8 GHz -79 -93 -90 -109
8 GHz to 16 GHz -73 -87 -84 -103
16 GHz to 32 GHz -67 -81 -78 -97
32 GHz to 50 GHz -61 -75 -72 -91
17
Page 18

Test Port Input
Table 16. Noise Floor1 (dBm) @ 10 Hz IFBW, All Models, All Ports
Total average (rms) noise power calculated as the mean value of a linear magnitude trace expressed in dBm.
May typically be degraded at particular frequencies below 500 MHz due to spurious receiver residuals.
Description Specification Typical
Options 200, 216 Option 216 Options 200, 216 Option 216
Test Port Direct Receiver
Access Port
Test Port
Direct Receiver
Access Port
10 MHz to 45 MHz2 -75.000 -110 -90 134
45 MHz to 500 MHz2
-90.000 -102 -110 125
500 MHz to 2 GHz -110.000 -122 -120 135
2 GHz to 8.5 GHz -116.000 -128 -121 136
8.5 GHz to 12.5 GHz -116.000 -128 -122 137
12.5 GHz to 13.51 GHz -116.000 -128 -122 137
13.51 GHz to 20 GHz -106.000 -118 -111 126
20 GHz to 40 GHz -105.000 -115 -111 124
40 GHz to 50 GHz -95.000 -103 -104 115
1
Total average (rms) noise power calculated as the mean value of a linear magnitude trace expressed in dBm.
2
May typically be degraded at particular frequencies below 500 MHz due to spurious receiver residuals.
Table 17. 0.1 dB Receiver Compression at Test Port (dBm), All Models, All Options, All Ports - Typical
Description Typical
10 MHz to 500 MHz 10
500 MHz to 13.51 GHz 7
13.51 GHz to 20 GHz 6
20 GHz to 35 GHz 5
35 GHz to 40 GHz 3
40 GHz to 43.5 GHz 1
43.5 GHz to 47 GHz 0
47 GHz to 50 GHz -1
18
Page 19

Table 18. Receiver Compression at Test Port Power, All Models, All Options, All Ports - Specification
Description
10 MHz to 50 MHz1
Test Port Power
(dBm)
Magnitude (dB) Phase (degrees)
- - -
50 MHz to 30 GHz 5 0.40 3.5
30 GHz to 35 GHz 5 0.40 5.0
35 GHz to 40 GHz 5 0.60 5.0
40 GHz to 43.5 GHz 5 0.65 5.0
43.5 GHz to 47 GHz 1 0.55 5.0
47 GHz to 50 GHz -5 0.25 5.0
1
Test port receiver compression at specified input levels below 50 MHz is negligible due to coupler roll off in this
frequency range.
Table 19a. Trace Noise1 Magnitude (dB rms), All Models, All Options
Description Specification Typical
1 kHz IFBW 1 kHz IFBW 100 kHz IFBW 600 kHz IFBW
10 MHz to 45 MHz 0.200 0.071 0.700 2.000
45 MHz to 100 MHz
100 MHz to 500 MHz
0.020
0.020
0.009 0.130 0.400
0.004 0.130 0.200
500 MHz to 13.51 GHz 0.003 0.001 0.035 0.090
13.51 GHz to 40 GHz
40 GHz to 50 GHz
1
Ratioed measurement, nominal power at test port.
0.007
0.010
0.003 0.075 0.200
0.004 0.100 0.300
Table 19b. Trace Noise1 Phase (deg rms), All Models, All Options
Description Specification Typical
1 kHz IFBW 1 kHz IFBW 100 kHz IFBW 600 kHz IFBW
10 MHz to 45 MHz 1.000 0.490 4.700 12.000
45 MHz to 100 MHz
100 MHz to 500 MHz 0.100 0.010 0.500 1.500
500 MHz to 13.51 GHz
13.51 GHz to 40 GHz
40 GHz to 50 GHz 0.090 0.030 1.000 2.000
0.100
0.025
0.060
0.029 1.500 3.000
0.008 0.500 0.700
0.021 0.700 1.300
1
Ratioed measurement, nominal power at test port.
19
Page 20

Table 20. Reference Level Magnitude, All Models and Options - Specification
Description Magnitude (dB) Phase (degrees)
Range +/- 500 +/- 500
Resolution 0.001 0.01
Table 21. Stability1, All Models, All Options - Typical
Description Magnitude (dB/°C) Phase (°/°C)
10 MHz to 45 MHz 0.02 0.25
45 MHz to 500 MHz 0.01 0.05
500 MHz to 2 GHz 0.01 0.03
2 GHz to 4 GHz 0.01 0.05
4 GHz to 8 GHz 0.01 0.09
8 GHz to 13.5 GHz 0.01 0.15
13.5 GHz to 20 GHz 0.01 0.20
20 GHz to 40 GHz 0.03 0.45
40 GHz to 50 GHz 0.03 0.55
1
Stability is defined as a ratio measurement made at the test port.
Table 22a. Damage Level, All Models, Option 200 - Typical
Description RF (dBm) DC (VDC)
Ports 1, 2 30 40
Table 22b. Damage Level, All Models, Option 216 - Typical
Description RF (dBm) DC (VDC)
Ports 1, 2 30 7
RCVR A, B IN 15 7
REF RCVR R1, R2 IN 15 7
REF 1, 2 SOURCE OUT 20 7
PORT 1, 2 SOURCE OUT 30 7
PORT 1, 2 CPLR THRU 30 7
PORT 1, 2 CPLR ARM 30 7
20
Page 21
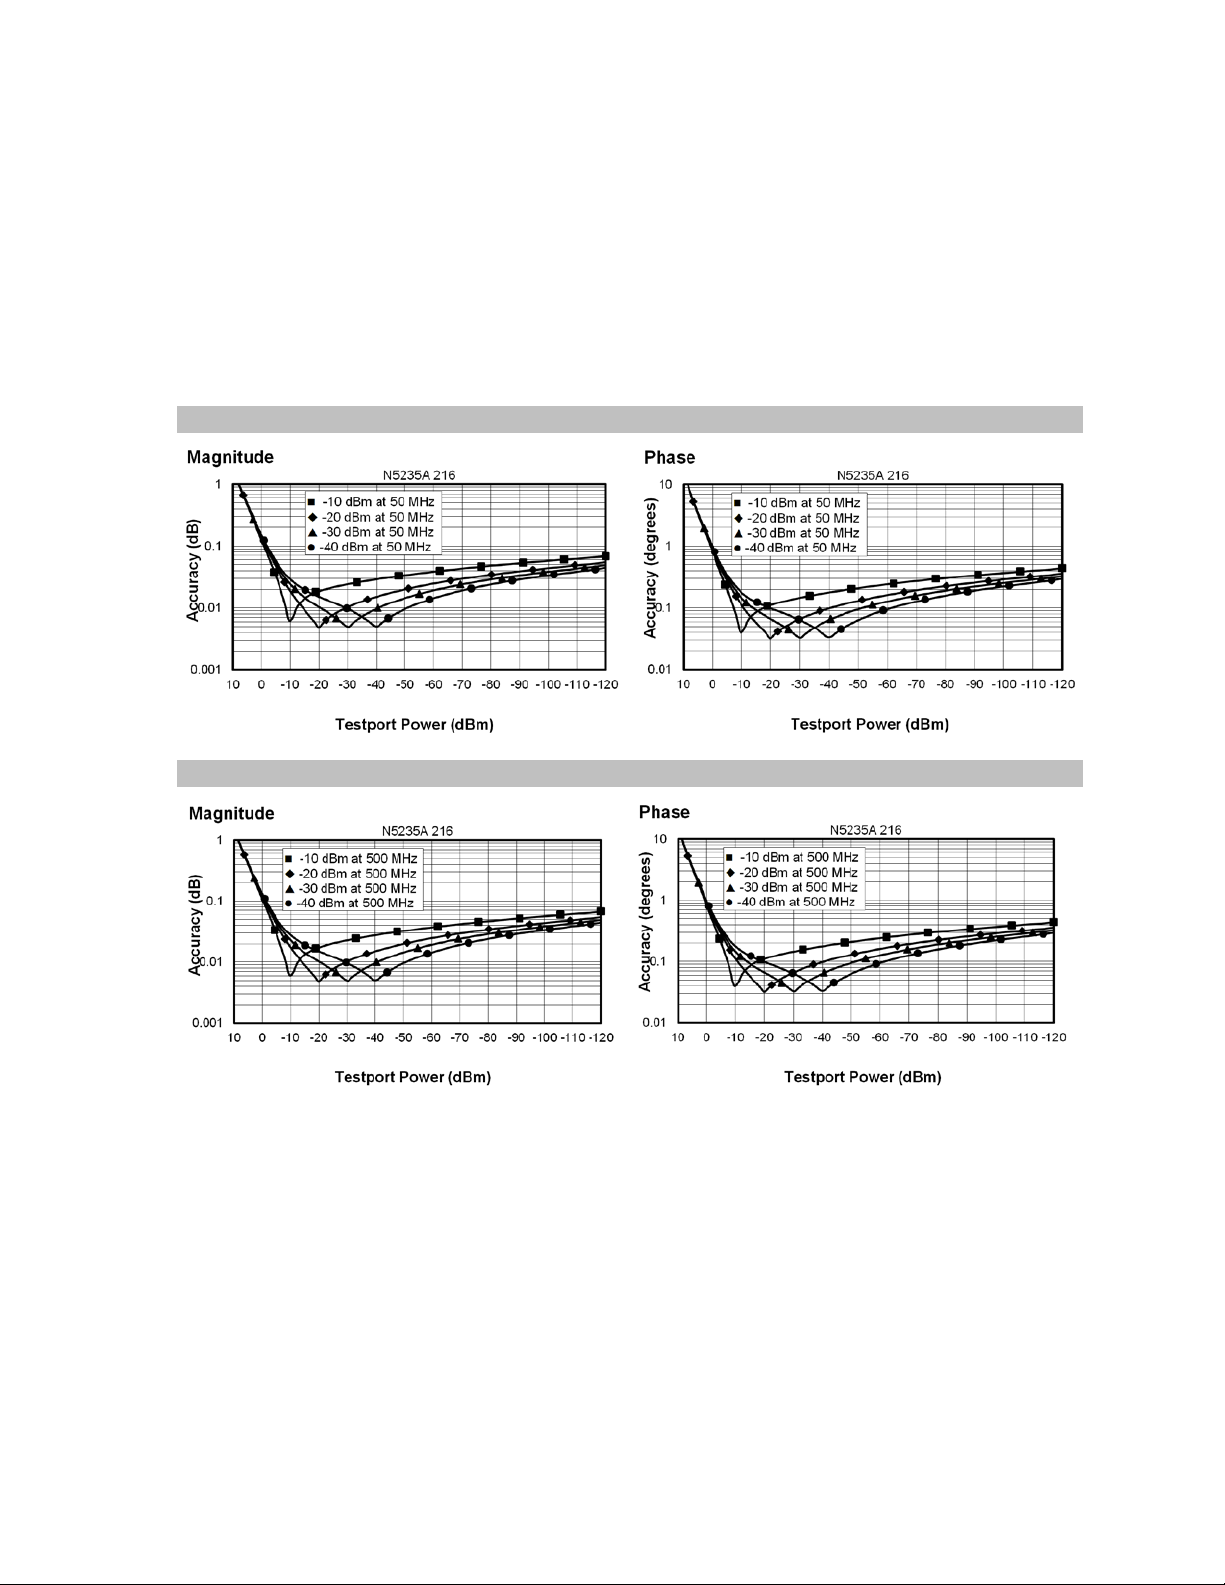
Dynamic Accuracy
Dynamic accuracy is verified with the following measurements:
• Compression over frequency
• IF linearity at a single frequency of 1.998765GHz using a reference level of -20 dBm for an
input power range of 0 to -60 dBm. For values below -60 dBm, refer to “
Dynamic Accuracy Specifications and Uncertainties”
Table 23. Dynamic Accuracy - Specification
Dynamic Accuracy, 50 MHz
VNA Receiver
Dynamic Accuracy, 500 MHz
21
Page 22

Dynamic Accuracy, 1 GHz
Dynamic Accuracy, 2 GHz
Dynamic Accuracy, 20 GHz
22
Page 23

Dynamic Accuracy, 35 GHz
Dynamic Accuracy, 40 GHz
Dynamic Accuracy, 50 GHz
23
Page 24

1
Table 24. Group Delay
In general, the following formula can be used to determine the accuracy, in seconds, of specific group delay
measurement:
±Phase Accuracy (deg)/[360 × Aperture (Hz)]
Depending on the aperture and device length, the phase accuracy used is either incremental phase accuracy or worstcase phase accuracy
Description Typical Performance
Aperture (selectable) (frequency span)/(number of points -1)
Maximum Aperture 20% of frequency span
Range 0.5 x (1/minimum aperture)
Maximum Delay Limited to measuring no more than 180° of phase change within the
minimum aperture.)
The following graphs show characteristic group delay accuracy with full 2-port calibration and a 10 Hz IF bandwidth.
Insertion loss is assumed to be < 2 dB and electrical length to be ten meters.
For any S
Group Delay measurement, Sii = 0, Sij = 1, Sji = 0, Skl = 0 for all kl ≠λij
ij
In general, the following formula can be used to determine the accuracy, in seconds, of specific group delay
measurement:
±Phase Accuracy (deg)/[360 × Aperture (Hz)]
Depending on the aperture and device length, the phase accuracy used is either incremental phase accuracy or
worst-case phase accuracy
1
Group delay is computed by measuring the phase change within a specified frequency step (determined by the
frequency span and the number of points per sweep).
24
Page 25

General Information
• Miscellaneous Information
• Front Panel
• Rear Panel
• Environment and Dimensions
Table 25. Miscellaneous Information
Description Supplemental Information
System IF Bandwidth Range 1 Hz to 15 MHz, nominal
CPU Intel® 1.87 GHz Celeron® with 4 GByte RAM
LXI Class C
Table 26. Front Panel Information, All Options
Description Typical Performance
RF Connectors
Test Ports 2.4 mm (male), 50 ohm, (nominal), 0.002 in. (characteristic)
Jumpers (Option 216) 2.4 mm (female) connectors with 2.4 mm (male) jumper cables
USB 2.0 Ports - Master (4 ports)
Standard Compatible with USB 2.0
Connector USB Type-A female
Display
Size 26.3 cm (10.4 in) diagonal color active matrix LCD; 1024 (horizontal) X 768 (vertical)
resolution
Refresh Rate Vertical 60 Hz; Horizontal 46.08 kHz
Pixels Any of the following would cause a display to be considered faulty:
• A complete row or column consists of “stuck” or “dark” pixels.
• More than six “stuck on” pixels (but not more than three green) or more than 0.002% of
the total pixels are within the LCD specifications.
• More than twelve “dark” pixels (but no more than seven of the same color) or more than
0.004% of the total pixels are within the LCD specifications.
• Two or more consecutive "stuck on" pixels or three or more consecutive "dark" pixel
(but no more than one set of two consecutive dark pixels)
• “Stuck on” “dark” pixels are less than 6.5 mm apart (excluding consecutive pixels)
25
Page 26

Table 26 (Continued) Front Panel Information, All Options
Description Typical Performance
Display Range
Magnitude +/-2500 dB (at 500 dB/div), max
Phase +/-2500° (at 500 dB/div), max
Polar 10 pUnits, min
10,000 Units, max
Display Resolution
Magnitude 0.001 dB/div, min
Phase 0.01°/div, min
Marker Resolution
Magnitude 0.001 dB, min
Phase 0.01°, min
Polar 10 pUnit, min
Table 27. Rear Panel Information, All Options
Description Typical Performance
10 MHz Reference In
Connector BNC, female
Input Frequency 10 MHz ± 10 ppm
Input Level -15 dBm to +20 dBm
Input Impedance
10 MHz Reference Out
Connector BNC, female
Output Frequency 10 MHz ± 1 ppm
Signal Type Sine Wave
Output Level
Output Impedance
Harmonics <-40 dBc, typical
200 Ω, nom.
+10 dBm ± 4 dB into 50 Ω
50 Ω, nominal
26
Page 27

Table 27. (Continued) Rear Panel Information, All Options
Description Typical Performance
VGA Video Output
Connector 15-pin mini D-Sub; Drives VGA compatible monitors
Devices Supported Resolutions
Flat Panel (TFT) 1024 X 768, 800 X 600, 640 X 480
Flat Panel (DSTN) 800 X 600, 640 X 480
CRT Monitor 1280 X 1024, 1024 X 768, 800 X 600, 640 X 480
Simultaneous operation of the internal and external displays is allowed, but with 640 X 480 resolution only. If you
change resolution, you can only view the external display (internal display will "white out").
Trigger Inputs/Outputs BNC(f), TTL/CMOS compatible
Test Set IO 25-pin D-Sub connector, available for external test set control.
Power IO 9-pin D-Sub, female; analog and digital IO
Handler IO 36-pin parallel I/O port; all input/output signals are default set to negative logic;
can be reset to positive logic via GPIB command.
GPIB Two ports - dedicated controller and dedicated talker/listener. 24-pin D-sub (Type
D-24), female; compatible with IEEE-488.
Parallel Port (LPT1) 25-pin D-Sub miniature connector, female; provides connection to printers or any
other parallel port peripherals
USB Ports Four ports on front panel (all Host) and five ports (four Host and one Device) on rear
panel. Type A configuration (eight Host) and Type B configuration (one Device), USB
2.0 compatible. The total current limit for all rear panel USB ports is 2.0 amps. The
total current limit for all front panel USB is 0.9 amps.
LAN 10/100BaseT Ethernet, 8-pin configuration; auto selects between the two data
rates
Line Power
Frequency, Voltage 50/60/ Hz for 100 to 120 VAC
50/60 Hz for 220 to 240 VAC
Power supply is auto switching
Max 350 watts
27
Page 28

Table 28. Analyzer Dimensions and Weight
1
All models are shipped with bottom feet, handles and front and rear hardware.
See detailed PNA dimension drawings at: http://na.tm.keysight.com/pna/PNADimensions.pdf
Cabinet Dimensions Metric (mm) Imperial (inches)
Height
Without bottom feet: EIA RU1 = 6 266.1 10.5
With bottom feet 279.1 11
Width
Without handles or rack-mount flanges 425.6 16.8
With handles, without rack-mount flanges 458.7 18.1
With handles and rack-mount flanges 482.9 19.0
Depth
Without front and rear panel hardware 445.7 17.5
With front and rear panel hardware, handles 497.2 19.6
Weight (nominal) Net Shipping
2-port model (Option 216) 24.6 kg (52 lb) 34.9 kg (77 lb)
Electronics Industry Association rack units. 1 RU = 1.75 in.
Regulatory and Environmental Information
For Regulatory and Environmental information, refer to the PNA-L Series Installation and Quick Start Guide, located
online at http://literature.cdn.keysight.com/litweb/pdf/E8356-90001.pdf.
28
Page 29

Measurement Throughput Summary
§ Typical Cycle Time for Measurement Completion
§ Cycle Time vs. IF Bandwidth
§ Cycle Time vs. Number of Points
§ Data Transfer Time
Cycle time Includes sweep time, retrace time and band-crossing time. Analyzer display turned off with
DISPLAY:ENABLE OFF. Add 21 ms for display on. Data for one trace (S
Table 29. Cycle Time (ms) for Measurement Completion, All Options - Typical
) measurement.
11
Sweep
Range
9 GHz to 10
GHz, All
Models
10 MHz to
43.5 GHz,
N5234A
10 MHz to
50 GHz,
N5235A
IF
Bandwidth
600 kHz
10 kHz
1 kHz
600 kHz
10 kHz
1 kHz
600 kHz
10 kHz
1 kHz
Number of Points
201 401 1601 16001 32001
Uncorrected 6 6 9 55 106
2-Port cal 10 11 19 115 216
Uncorrected 29.1 54 203 1992 3978
2-Port cal 59 109 408 3595 6397
Uncorrected 227 453 1743 17011 33792
2-Port cal 460 904 3423 27238 45100
Uncorrected 47 51 61 149 194
2-Port cal 93 101 121 300 392
Uncorrected 80 142 497 2037 4042
2-Port cal 161 285 995 4078 8094
Uncorrected 246 472 1813 17592 34938
2-Port cal 497 950 3633 35194 46620
Uncorrected 48 54 63 151 197
2-Port cal 99 108 127 304 399
Uncorrected 80 142 500 2034 4040
2-Port cal 161 285 998 4080 8089
Uncorrected 246 472 1814 17612 34979
2-Port cal 497 950 3277 28203 55994
29
Page 30

Table 30. Cycle Time vs. IF Bandwidth - Typical
Applies to the Preset condition (201 points, correction off) except for the following changes:
• CF = 10 GHz
• Span = 100 MHz
• Display off (add 21 ms for display on)
Cycle time includes sweep and retrace time.
Description N5234A/35A
IF Bandwidth (Hz) Cycle Time (ms) Trace Noise Magnitude (dB rms)
600,000 6 0.0035
100,000 7 0.0016
30,000 9 0.0010
10,000 29 0.0005
3,000 71 0.0004
1,000 222 0.0001
300 640 0.0001
100 1823 0.00006
30 5980 0.00006
10 17828 0.00006
3 59273 0.00006
30
Page 31

Table 31. Cycle Time vs. Number of Points - Typical
Applies to the Preset condition (correction off) except for the following changes:
• CF = 10 GHz
• Span = 100 MHz
• Display off (add 21 ms for display on)
Cycle time includes sweep and retrace time.
Description IF Bandwidth (Hz)
Number of Points 1,000 10,000 30,000 600,000
3 7 6 6 6
11 16 6 6 6
51 60 10.4 6 6
101 114 17 7 6
201 222 29 9 6
401 436 54 14 6
801 861 104 24 7
1,601 1706 203 44 9
6,401 6718 799 164 25
16,001 16641 1991 403 55
32,001 33057 3974 803 106
31
Page 32

Table 32. Data Transfer Times - Typical
Internally, the PNA measurement data is handled in 32-bit (single-precision) format.
for Recall & Sweep Speed are not provided for the N532xA analyzers.
• Values are for Real & Imaginary pairs (two values per point)
• Results measured with the analyzer display off. Values will increase slightly if the analyzer display is on.
• LAN values assume a gigabit connection and are highly dependent upon both LAN conditions and the
computer used
• All values are approximate. Example values shown are actual averaged measured results and include the
time required to send the command to request the data
Description
SCPI over GPIB
General Formula
1
(Program executed on external PC)
Example for
1601 Points
Example for
32001 Points
32-bit floating point 1mS + .024 mS/point 39 mS 755 mS
ASCII 1mS + 0.185mS/point 300 mS 5850 mS
SICL over LAN (Program executed on external PC)
32-bit floating point 0.5 mS + 0.18 µS/point 0.78 mS 6.4 mS
ASCII 0.5 mS + .012 mS/point 20.4 mS 390 mS
SICL (Program executed within the analyzer)
32-bit floating point 0.3 mS + 0.18 µS/point 0.64 mS 6.2 mS
ASCII 0.3 mS + .012 mS/point 20.2 mS 388 mS
COM (Program executed within the analyzer)
32-bit floating point 130 µS + .012 µS/point 0.14 mS 0.5 mS
Variant type 130 µS + 1.7 µS/point 2.7 mS 56 mS
DCOM over LAN (Program executed on external PC)
32-bit floating point 350 µS + 0.17 µS/point 0.55 mS 5.7 mS
Variant type 350 µS + 3.4 µS/point 5.8 mS 108 mS
1
Values obtained using USB-to-GPIB adapter (82357B)
Therefore, there is no need to use 64-bit transfers for most data. Frequency values
however, may be rounded slightly with 32-bit transfers since there is insufficient
resolution in this format to represent higher frequencies with 1 Hz accuracy. If this type of
accuracy is needed for frequencies, then you should use 64-bit transfers. Specifications
32
Page 33

Specifications: Front-Panel Jumpers
The following options have front-panel jumpers for each port:
Option 216
• Measurement Receiver Inputs
• Reference Receiver Inputs and Reference Source Outputs
• Source Outputs
• Coupler Inputs
Table 33. Measurement Receiver Inputs (dBm), Option 216 - Typical
(RCVR A, B IN) @ 0.1dB Typical Compression
Description Option 216
10 MHz to 45 MHz -34
45 MHz to 500 MHz -20
500 MHz to 35 GHz -9
35 GHz to 43.5 GHz -11
43.5 GHz to 47GHz -12
47 GHz to 50 GHz -13
Table 34. Reference Receiver Inputs and Reference Source Outputs (dBm) - Typical
(RCVR R1, R2 IN, REF 1, 2 SOURCE OUT) @ Specified Maximum Leveled Power
Description Option 216
10 MHz to 8.5 GHz -28
8.5 GHz to 20 GHz -26
20 GHz to 35 GHz -30
35 GHz to 40 GHz -27
40 GHz to 43.5 GHz -29
43.5 GHz to 50 GHz -28
33
Page 34

Table 35. Source Outputs (dBm) - Typical
(PORT 1, 2 SOURCE OUT) @ Specified Maximum Leveled Power
Description Option 216
10 MHz to 12.5 GHz 1
12.5 GHz to 20 GHz 3
20 GHz to 40 GHz -4
40 GHz to 50 GHz -11
Table 36. Coupler Inputs (dB) - Typical
(PORT 1, 2 CPLR THRU) Insertion Loss of Coupler Thru
Description Option 216
10 MHz to 500 MHz 0.6
500 MHz to 2 GHz 0.8
2 GHz to 20 GHz 2.0
20 GHz to 40 GHz 2.5
40 GHz to 50 GHz 3.0
34
Page 35

Test Set Block Diagrams
For best readability, use a color printer for printing the following graphics.
N5234A and N5235A Option 200 (2-port base model)
N5234A and N5235A Option 216
To base model, adds front-panel jumpers and source attenuators
35
Page 36

Receiver Block Diagram
36
Page 37

This information is subject to change without notice.
© Keysight Technologies 2014-2015
Print Date: October 29, 2015
www.keysight.com
 Loading...