

Page 1

High-Speed Tester for NADC/PDC/PHS
MS8604A
Digital Mobile Radio Transmitter Tester
100 Hz to 8.5 GHz
Page 2

2
Burst Modulation Accuracy Measured
in Under ONE Second
Page 3

3
The MS8604A is a full-featured digital mobile
transmitter tester for evaluating the major
characteristics of transmitters used in the
North-American Digital Cellular Systems
(NADC), Japan's digital mobile telephone
(PDC: Personal Digital Cellular) system and
by cordless telephones (PHS: Personal
Handy Phone System). It covers frequencies
from 100 Hz to 8.5 GHz, and measures spurious emissions over a broad frequency range.
It can also measure RF signals directly up
to 10 W (average burst power) and baseband devices can be evaluated using its
I/Q signal input function (option).
The MS8604A is ideal for high-speed
measurement of frequency deviation,
spurious emissions, occupied bandwidth,
antenna power, leakage power during
carrier-off, transmission ramp-up and rampdown power, modulation accuracy, leakage
power of adjacent channel, and signal transmission rate of digital mobile transmitters.
In addition to measurements conforming
to EIA/TIA, ETSI, RCR, and MKK standards,
DSP (digital signal processing) and highspeed measurement function based on a
unique measurement algorithm combine to
greatly reduce the time required for manufacturing and inspecting transmitters.
PTA functions enabling free programming
of test procedures are provided as a
standard feature.
• Major transmitter functions evaluated
by single system
• Compatible with NADC/PDC/PHS
systems (compatibility with single
system provided as standard; optional
expansion to all three systems)
• High-speed measurement (under 1
second for modulation-accuracy
measurements)
• Input up to 10 W (internal 20 dB
attenuator and power meter for high
power levels)
• Superior operability
• I/Q signal input (option)
Fast, Accurate Measurement of
Digital Modulated Signals
A unique high-speed measurement method
is available for measuring occupied bandwidth and leakage power of adjacent
channel in addition to RCR (Research &
Development Center for Radio Systems)
standards and Specifications for the type
approval test of the Ministry of Posts and
Telecommunications of Japan. For RCR
standards, a spectrum analyzer is used to
determine the occupied bandwidth and
leakage power of adjacent channel from
the burst signal frequency spectrum.
In this method, frequency sweeps must be
performed slowly to obtain an accurate
burst wave spectrum, so measurement
speed falls. For example, more than 10
seconds are required when measuring PDC.
With Anritsu's unique measurement method,
digital signal processing is used to compute
the frequency components from a single
burst signal waveform, and the occupied
bandwidth and leakage power of adjacent
channel are computed from the results.
Measurement times of 2 seconds and less
are possible for PDC transmitters.
Unique High-Speed Measurement Method
MS8604A
Page 4

4
Evaluation of Digital Mobile Transmitters
Automated Measurement by Simple key Operations
Quick Configuration for Different
Communication Systems
Measurement software for one communication system
is provided as a standard feature; others can be added
as options. When these options are chosen, the
communication system can be selected by pressing
a single key.
Measurement of Frequency, Modulation
Accuracy, Signal Transmission Rate
Both absolute frequencies and deviations can be read
directly. Measurement of modulation accuracy includes
both vector errors within burst signals, amplitude errors,
phase errors, origin offset and droop factors, and
vector errors for first ten symbols immediately following
startup. Ten-burst averages and signal transmission
rates can also be measured.
Measurement of Antenna Power and
Leakage Power during Carrier-Off
At measurement of burst signal antenna power, the
power-on intervals are auto-detected based on the
modulated wave, so an external synchronization trigger
is not needed. In addition, the average power during
power-on intervals is automatically matched to a template value, simplifying measurement automation. Any
template can be set, and three types can be stored.
The leakage power during carrier-off can be measured
as either an absolute value or as an on/off ratio.
When the carrier-off power is low, measurements can
be performed in a wide-dynamic-range mode (during
single-mode measurements with synchronizing word).
One-Touch Selection of Measurement Items
Measurement items can be selected by pressing a single
key. The input connector (RF/IQ), maximum input power,
and type of signal for measurement (uplink/downlink,
number of slots per carrier, channel number/frequency,
frequency steps, synchronizing words, root Nyquist filter
switching) can be preset. In particular, synchronizing
words can be predefined to any value. Measurement
can be performed in either the single-measurement
mode (one measurement performed each time key
pressed), or in the automatic continuous repeat mode.
Example of burst rise characteristics (PHS)
NORMAL mode
WIDE DYNAMIC
RANGE mode
Page 5

Measurement of Transmission Ramp-up
and Ramp-down Power
Transmission ramp-up and ramp-down power can be
measured simultaneously with antenna power measurements. In addition, the marker points can be moved and
the marker point symbol power can be read directly.
Measurement of Leakage Power of Adjacent Channel
Users can select either a standard mode using
spectrum-analyzer methods, or a high-speed mode to
reduce measurement time.
Measurement of Occupied Bandwidth
Users can select either a standard mode using
spectrum-analyzer methods, or a high-speed mode to
reduce measurement time.
Measurement of Spurious Emissions
Up to 15 spurious measurement frequencies can be
stored in one memory table and three memory tables
are provided. In addition, a function is provided for
automatic measurement of the highest level within
a ±500 kHz range of a specified frequency. By using
spectrum-analysis functions, spurious emissions can be
detected over a wide frequency range.
• Measurement Times
5
Measurement item NADC PDC PHS
Frequency, modulation accuracy
#1s
(simultaneous)
approx. 9s (fixed frequencies),
Spurious emissions (15 specified) approx. 9s (fixed frequencies),
approx. 25s (search within
waves) approx. 40s (search within 6500 kHz)
6500 kHz)
Occupied bandwidth —
approx. 12s (standard mode), approx. 4s (standard mode),
#1s (high-speed mode) #1s (high-speed mode)
Antenna power, leakage power during
carrier-off, transmission ramp-up and #1s
ramp-down power (simultaneous)
Leakage power of adjacent channel #2s
approx. 13s (standard mode, approx. 5s (standard mode)
#1.5s (high-speed mode) #1.5s (high-speed mode)
Signal transmission rate #3s #2s
Note: Measurement times are for continuous measurement under identical conditions and settings.
Page 6

6
The modulation error can be found by connecting the
I/Q vector components of symbol points.
Intervals between symbol points are smoothly
interpolated for dynamic observation of the movement
of I/Q vector components.
Constellation Display Function
The I/Q vector components of measured signals are
displayed as symbol points. The frequency error,
RMS/PEAK vector error, and origin offset can also be
displayed on the same screen.
Scaled Modulation Error Display
The modulation error scale can be switched between
5%, 10% and 20%, and can be displayed for each
symbol point—a useful feature when making decisions
on modulation accuracy.
For High-Speed Analysis of Digital Modulated Waveforms
Convenient for Real-time Analysis of RF, IF, I/Q Signal Constellation, Evaluation
and Adjustment of Modulation Circuits
Page 7
7
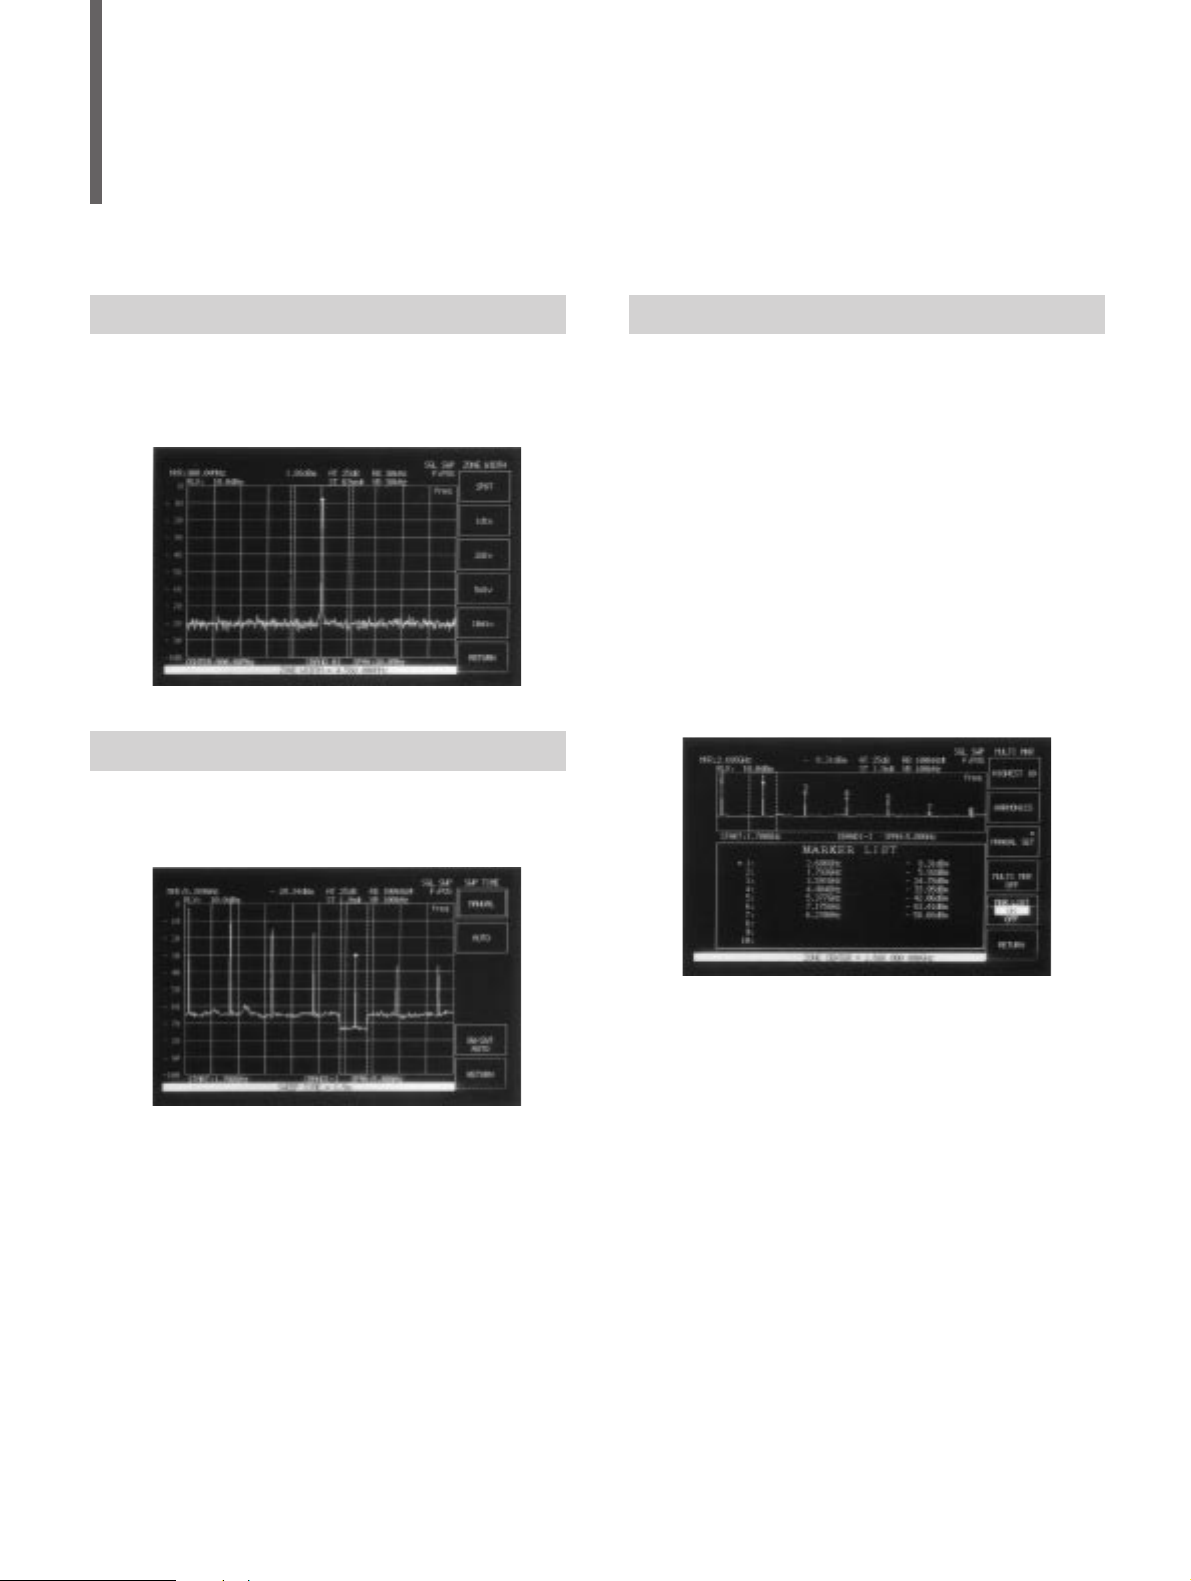
Zone Marker
Zone marker reduce measurement time. A marker is
automatically set at the signal peak just by setting the
received signal in zone marker. Zone marker can be
used to set the zone position and width freely.
Multimarker
The multimarker feature displays up to ten markers on
the measured waveform, and simultaneously lists the
frequencies and levels at the marker points. The multimarker feature includes harmonic measurement,
measurement of the highest ten points, and manual
setting function.
Harmonic measurement: For measurement of high
harmonic spurious emissions; markers are set automatically at integer multiples of the carrier frequency,
and the frequencies and levels at the marker points
are displayed.
Measurement of highest ten points: Markers are set
automatically at the ten points with the highest levels on
the screen, and the frequencies and levels at each of
the marker points are displayed.
Manual setting function: Up to ten markers can be
set manually at any frequency.
Zone Sweeping
The region inside the zone marker is swept repeatedly.
For example, if a zone width of 1 division is set,
sweeping is 10 times faster than for a full sweep.
Full Spectrum Analysis Functions
Page 8

8
Three Measurement Modes
In addition to absolute values in W and dBm, relative
values are also displayed in dB.
High-Power Measurements
Antenna power up to 10 W max. (burst average power)
can be measured directly using the internal high-power
attenuator. This high-power attenuator is pre-calibrated,
for accurate measurement of transmitter power levels.
Direct Measurement with Broadband Power Sensor
The tester has a high-performance power meter
comparable to the Anritsu ML4803A. A broadband
amorphous-element power sensor is coupled directly for
high-precision measurement.
USER CAL FACTOR Input
When losses from connecting cables and external
attenuators are input as the “USER CAL FACTOR,”
displayed results are corrected by the factor. And, the
burst average power can be displayed by setting a
burst wave duty factor for correction.
Internal Calibration Signal
An internal 1 mW calibration signal is provided for
calibrating the sensitivity of the power sensor
automatically by pressing the CAL ADJUST key.
High-Precision Power-Meter Functions
Precise Measurement of Antenna Power by Power-Meter Method
Page 9

9
Just pressing the TxTest key produces rapid measurement results by category. And spectrum-analyzer
functions can be selected with the Spectrum key for
signal spectrum analysis.
1
Function keys provide one-touch selection of
measurement items during transmitter testing.
2
These keys select single or repeated
measurements.
3
Press the TxTest key to evaluate transmitters, and
the Spectrum key for spectrum analysis.
4
For hard-copying the screen display. In addition,
four parameter settings can be saved and recalled.
5
Keys for entering alphanumeric characters, units
and other items.
6
PMC (Plug-in Memory Card) slot
EThe save/recall function can be used to
save/recall parameter settings to/from the PMC
EPTA programs can be saved and loaded
EPMCs can be written and read as data files
during PTA program execution
6
Intuitive Key Layout, Simple Operation
Separate Functions for Transmitter Tests and Spectrum Analysis
Page 10

10
1 2 3 4
5
MS8604A
Digital Mobile Radio
Transmitter Tester
Power Sensor
Page 11

11
Measurement Software and Measurement Items
♦
Option 11: Measurement Software for PDC (Personal Digital Cellular)
Measurement Item RCR STD-27B Type Approval Test*
1
Anritsu High-Speed
Measurement Method
Frequency deviation ✓✓
Strength of spurious emissions ✓✓✓
Occupied bandwidth ✓✓✓
Antenna power deviation ✓✓
Leakage power during carrier-off ✓✓
Transmission ramp-up and ramp-
✓ —
down power
Modulation accuracy ✓ —
Leakage power of adjacent channel ✓✓
Signal transmission rate ✓
♦
Option 12: Measurement software for PHS (Personal Handy Phone System)
Measurement Item RCR STD-28
Anritsu High-Speed Measurement
Method
Frequency deviation ✓
Strength of spurious emissions ✓✓
Occupied bandwidth ✓✓
Antenna power deviation ✓
Leakage power during carrier-off ✓
Transmission ramp-up and ramp-down
✓
power
Modulation accuracy ✓
Leakage power of adjacent channel ✓✓
Signal transmission rate ✓
♦
Option 13: Measurement software for NADC (North American Digital Cellular Systems)
Measurement Item*
2
EIA/TIA IS-55
Frequency stability ✓
Modulation accuracy ✓
Carrier switching time ✓
RF power output ✓
Adjacent and alternate channel power due to modulation ✓
Out of band power arising from switching transients ✓
Harmonic and spurious emissions ✓
Time alignment
✓ : Measurement method for use with MS8604A
—: Measurements not included in method for type approval test by the Ministry of Posts and Telecommunications of Japan
*
1
: Method for type approval test by the Ministry of Posts and Telecommunications of Japan
*
2
: Items only for digital systems
Page 12

12
MS8604A-Based Automated Measurement Systems
The MS8604A includes PTA (Personal Test Automation)
programming functions as a standard feature, PTA is a
personal computer function that allows the user to simple
programs to the function keys for controlling external
devices and performing sophisticated measurements.
PTA offers outstanding flexibility as a personal specialized
automated measurement system.
Measurement with one original card
Programs written while checking the measurement
procedure can be stored in the nonvolatile memory in
the MS8604A or saved on the PMC (Plug-in Memory
Card). A new card is made every time the user develops
a new measurement function, thus making it possible to
organize functions by cards.
In addition to programs, measurement data and program
control variables can also be stored on PMCs.
PTA Automated Measurement System
Page 13

13
Full-Featured Interface for Configuring Optimum System
Two-Port GP IB System
The MS8604A has two GP IB ports as standard
equipment. Consequently, a PTA-automated measurement system can be expanded to a system controlled
by a host. PTA-based distributed processing offers
greater efficiency than systems in which several
instruments are under the central control of a host.
Three-Port Interface
The MS8604A is available parallel I/Q interface and
an optional RS-232C interface in addition to the two
GP IB interface for configuring the ideal PTA-automated
measurement system from numerous possible
combinations.
Parallel I/O Application Examples
Measurement items
Antenna power (spectrumanalyzer method, power-meter
method)
Frequency deviation (phasetrace method)
Occupied bandwidth
Leakage power of adjacent
channel
Spurious emissions
Leakage power during carrier-off
Modulation accuracy
Signal transmission rate
Transmit power control
characteristics
I/Q Oscillator Evaluation (using option 03)
The modulation accuracy, amplitude and occupied
bandwidth of an I/Q oscillator can be evaluated.
Evaluation of Transceiver Characteristics
by PTA Control
Host
GB IB 1
MS8604 PTA
GB IB 2
IQ
I/Q Oscillator
GP IB 1
RS-232C or parallel I/O
Switch
Error rate
DUT
measuring
equipment
Printer
Connection with Host
Power Sensor
SG
Digital modulated
signal source
Parallel I/O
DUT Controller
(provided by user)
Page 14

Frequency Range 100Hz to 8.5 GHz
Max. Input Level
+40 dBm (10 W)
(Continuous wave average power)
Frequency: 10 MHz
Starting characteristics: ≤ 5 x 10
-8
(option: ≤ 2 x 10⁻⁸, after 30 min. warm-up) *After 10 min. of warm-up,
Reference Oscillator compared to the frequency after 24 hour warm-up
Aging rate: ≤ 2 x 10
-8
/day(option: ≤ 5 x 10⁻⁹/day), ≤ 1 x 10⁻⁷/year (option: ≤ 5 x 10⁻⁸/year) *Compared to the
frequency after 24-hour warm-up
T emperatur e characteristics: 5 x 10⁻⁸(option: 3 x 10-8) *0˚ to 50˚C, relative to the frequency at 25˚C
Applicable Systems
NADC (option 13) PDC (option 11) PHS (option 12)
Specifications below guaranteed after pressing key for optimizing internal level
Frequency range 400 kHz to 2.1 GHz 400 kHz to 2.1 GHz 10 MHz to 2.1 GHz
Input level
–10 to 40 dBm (burst average power)
When using the low power-input connector, measurement to levels 20 dB lower than the above values is possible.
Frequency accuracy
± (Accuracy of reference oscillator +1 Hz)
± (Accuracy of reference oscillator
+10 Hz)
Modulation accuracy ± (2% of indicated value +0.5%) ± (2% of indicated value +0.7%)
Origin offset accuracy ±0.5 dB to signal level of –30 dBc
Transmission rate accuracy ±1 ppm
Measuring range of
48.6 kbps ±100 ppm 42 kbps ±100 ppm 384 kbps ±100 ppm
transmission rate
Waveform display Constellation display
≤ 1 s (except transmission rate
Measurement time
≤ 1 s (except transmission rate measurement) measurement)
≤ 3 s (transmission rate measurement) ≤ 2 s (transmission rate
measurement)
Frequency range 10 MHz to 2.1 GHz
Input level range +10 to +40 dBm (Average power of burst signal)
Transmission power
±10% (using high-power input after calibration with Power Sensor MA4601A)
accuracy
Carrier-off power
Rise/fall edge characteristics Displays rising/falling edges while synchronizing modulation data of measured signal.
Measurement time ≤ 1 s
Impedance 50Ω(VSWR: ≤1.2)
Frequency range 10 MHz to 2.1 GHz
Input level range +10 to +40 dBm (Average power of burst signal)
Standard mode
(Spectrum analyzer mode)
High-speed mode Measurement: Displays r esults of occupied bandwidth measurement after FFT of measured signal
Measurement time: ≤ 1 s
14
Specifications
Modulation/
Frequency
Measurement
Amplitude
Measurement
Occupied
Bandwidth
Measurement
G
E
N
E
R
A
L
T
R
A
N
S
M
I
T
T
E
R
M
E
A
S
U
R
E
M
E
N
T
Measurement range in NORMAL
mode: ≥ 65 dB (T o average power of
burst signal)
Average noise level in Wide dynamic
range mode: ≤ –60 dBm (100MHz
≤ Freq. ≤ 2.1GHZ)
*Measurement range is ≥ 96 dB for
+36 dBm input level of average
power of burst signal
Measurement:
Displays results of occupied bandwidth measurement after measuring
signal with spectrum analyzer
Measurement time:
Approx. 12 s in full rate when number of data points set to NORMAL
Measurement:
Displays results of occupied bandwidth measurement after measuring
signal with spectrum analyzer
Measurement time:
Approx. 4 s when number of data
points set to NORMAL
Measurement range in NORMAL
mode: ≥ 65 dB (T o average
power of burst signal)
Average noise level in Wide
dynamic range mode:
≤ –60 dBm
(100 MHz ≤ Freq. ≤ 2.1 GHz)
*Measurement range is ≥ 95 dB for
3 W input level of average power of
burst signal.
Measurement range in NORMAL
mode: ≥ 55 dB (T o average
power of burst signal)
Average noise level in Wide
dynamic range mode:
≤ –50 dBm
(100 MHz ≤ Freq. ≤ 2.1 GHz)
*Measurement range is ≥ 69 dB for
10 mW average power (Burst
average power: 80 mW).
Page 15

Applicable Systems NADC (option 13) PDC (option 11) PHS (option 12)
Frequency range 100 MHz to 2.1 GHz
Input level range +10 to +40 dBm (Average power of burst signal)
Measurement
Measurement range
10 MHz to 8.5 GHz
10 MHz to 8.5 GHz
Frequency range
Except frequency range ±1 MHz of carrier frequency
Except frequency range ±50 MHz
of carrier frequency
Input level range:
+10 to +40 dBm (Average power of burst signal)
(Transmission power)
≥ 65 dB (10 MHz to 1.7 GHz) ≥ 60 dB (10 MHz to 1.7 GHz)
Measurement range
≥ 75 dB (1.7 to 8.5 GHz) ≥ 70 dB (1.7 to 8.5 GHz)
At carrier frequency range 800 MHz to 1.7 GHz At carrier frequency range 800 MHz
to 2.1 GHz
Input level range: 0.3 to 1.5 Vp-p
I/Q input Input impedance: 5 kΩ, AC/DC coupling (switchable)
(option 03) Measurement items:
Modulation, Amplitude, Occupied bandwidth
Setting range: 100 Hz to 8.5 GHz (resolution: 1 Hz), 0 to 2 GHz (freq. band: 0)
1.7 to 7.5 GHz (freq. band: 1 –), 6.5 to 8.5 GHz (freq. band 1 +)
Preselector range: 1.7 to 8.5 GHz (bands: 1–/1+)
Display accuracy: ± (Displayed freq. x Reference freq. accuracy +Span x Span Accuracy)
Span:
Setting range: 0 Hz, 100 Hz to 8.5 GHz
Frequency
Accuracy: ±2.5% (Span ≥1 kHz), ±5% (100 Hz ≤ Span < 1 kHz)
RBW:
Setting range: 10 Hz to 3 MHz (3 dB), 1-3 sequence
Accuracy: ±20%
Selectivity (60/3 dB), ≤ 15:1 (100 kHz to 3 MHz), ≤12:1 (10 Hz to 30 kHz)
VBW: 1 Hz to 3 MHz, Off, 1-3 sequence
Signal purity (SSB, 1 MHz to 4 GHz): ≤ –100 dBc/Hz (10 kHz offset), ≤–115 dBc/Hz (50 kHz offset),
≤ –120 dBc/Hz (100 kHz offset)
Level measuring range: Average noise level to +40 dBm
Level measurement Average noise level: ≤ –112 dBm (10 MHz to 8.5 GHz, RBW 10 Hz, VBW 1 Hz, Input att. setting 20 dB)
Residual response: ≤ –75 dBm (1 MHz to 8.5 GHz, Input att. setting 20 dB)
Setting range: -80 to +40 dBm
Accuracy: ±0.5 dB (–30 to +20 dBm), ±0.75 dB (–40 to –30 dBm, +20 to +40 dBm),
±1.5 dB (–60 to –40 dBm)
After calibration and at Freq. 100 MHz, Span ≤ 2 MHz, and in Auto mode for Input att, RBW, VBW and Sweep time
Amplitude
Reference level
settings
RBW switching error (after calibration): ±0.3 dB (RBW: ≤ 300 kHz), ±0.7 dB (RBW: ≥1 MHz)
LOG/LIN switching error: ±0.3 dB (after calibration)
Input attenuator:
Setting range: 20 to 75 dB in 5 dB steps
Switching error: ±0.3 dB (referred to input att. 30 dB, at 100 MHz)
Frequency response
±0.5 dB (100 MHz to 2 GHz, band: 0), ±1 dB (1.7 to 8.5 GHz, bands: 1–/1+)
*Referred to at 100 MHz, Input att. 30 dB, temperature 18˚ to 28˚C (after tuning Preselector at bands 1–/1+)
15
T
R
A
N
S
M
I
T
T
E
R
M
E
A
S
U
R
E
M
E
N
T
S
P
E
C
T
R
U
M
A
N
A
L
Y
Z
E
R
High speed mode:
≥ 30 dB (30 kHz offset)
≥ 60 dB (60 kHz offset)
≥ 65 dB (90 kHz offset)
*Ratio of average power of burst
signal to average value of leakage
power of adjacent channel at burston time
Standard mode:
≥ 60 dB (50 kHz offset)
≥ 65 dB (100 kHz offset)
High-speed mode:
≥ 60 dB (50 kHz offset)
≥ 65 dB (100 kHz offset)
*In High-speed mode, ratio of
average power of burst signal to
average value of leakage power
of adjacent channel at burst on time
Standard mode:
≥ 60 dB (600 kHz offset)
≥ 60 dB (900 kHz offset)
High-speed mode:
≥ 60 dB (600 kHz offset)
≥ 65 dB (900 kHz offset)
*In High-speed mode, ratio of
average power of burst signal to
average value of leakage power
of adjacent channel at burst on time
Spectrum analyzer mode:
Displays results of leakage power
of adjacent channel measurement
after measuring signal with
spectrum analyzer
Measurement time:
Approx. 13 s in full rate when
number of data points set to
Normal
High-speed mode:
Displays results of leakage power
of adjacent channel measured
after passing signal through internal
root-Nyquist filter
Measurement time: ≤2 s
Standard mode:
Displays results of leakage power
of adjacent channel measurement
after measuring signal with
spectrum analyzer
Measurement time:
Approx. 13 s in full rate when
number of data points set to
Normal in All mode
High-speed mode:
Displays results of leakage power
of adjacent channel measured
after passing signal through internal
root-Nyquist filter
Measurement time: ≤1.5 s
Standard mode:
Displays results of leakage power
of adjacent channel measurement
after measuring signal with
spectrum analyzer
Measurement time:
Approx. 5 s when number of data
points set to Normal in All mode
High-speed mode:
Displays results of leakage power
of adjacent channel measured
after passing signal through internal
root-Nyquist filter
Measurement time: ≤1.5 s
Leakage
Power of
Adjacent
Channel
Measurement
Spurious
Measurement
Page 16

External
control
PTA
16
NADC (option 13) PDC (option 11) PHS (option 12)
LOG: ±0.3 (0 to -20 dB, RBW: ≤ 1 MHz), ±1 dB (0 to –60 dB, RBW: ≤ 100 kHz),
±1.5 dB (0 to -80 dB, RBW: ≤ 10 kHz)
LIN: ±5% (to refer ence level)
2nd harmonics:
≤ –70 dBc (5 to 800 MHz, band: 0, mixer input level: –30 dBm)
≤ –80 dBc (800 to 850 MHz, band: 0, mixer input level: –30 dBm)
≤ –90 dBc (850 MHz to 2.1 GHz, bands: 1–/1+, mixer input level: –10 dBm)
Two-single thir d-order intermodulation distortion:
≤ –70 dBc (10 to 50 MHz), ≤–85 dBc (50 MHz to 2.1 GHz),
*Frequency difference between two signals ≥50 kHz, mixer input level –30 dBm
Image response: ≤ –70 dBc
Multiple-response: ≤ –70 dBc (bands: 1–/1+)
Sweep time:
Setting range:
20 ms to 1000 s (TRACE-FREQ., Data points: NORMAL), 50 ms to 1000 s at other conditions
Accuracy: ±10% (20 ms to 200 s), ±15% (200 to 1000 s)
Sweep mode: CONTINUOUS, SINGLE
Trigger: FREE RUN, TRIGGERED
Trigger source: VIDEO, LINE, EXT (±10 V), EXT (TTL)
Gate mode (OFF, Random sweep mode):
GATE DELAY: 0 to 65.5 ms (in 1 µs steps, GATE END: INT)
GATE END: INT/EXT
Sweep time:
50, 100 to 900 µs (Data point: NORMAL, One most significant digit can be set.)
1 ms to 1000 s (Data point: NORMAL, two most significant digits can be set.)
100, 200 to 800 µs (Data point: DOUBLE, One most significant digit can be set as even number.)
1 ms to 1000 s (Data point: DOUBLE, Two most significant digits can be set as even number
Delay time:
Pre-trigger: -time span to 0 s (in 1-point steps)
Post trigger: 0 to 65.5 ms (in 1 µs steps)
Amplitude display resolution:
50 µs to 49 ms, 10 bits (0.1% of full scale)
50 ms to 1000 s, 14 bits (0.01% of full scale)
POS PEAK, SAMPLE, NEG PEAK
NORMAL: 501 points, DOUBLE: 1002 points
Demodulated waveform display and monitoring demodulated audio signal with internal speaker
IF output 21.4 MHz: –10 dBm ±2 dB (at top of screen, with output terminated by 50Ω terminator.)
Y output: 0 to 0.5 V ±0.1 V (at range between top and bottom of screen, LOG: 10 dB/div., LIN: 10% div.,
100 MHz and with output terminated by 75Ω terminator), BNC connector
External trigger input: Input 1; Max. ±10 V (in 0.1 V steps, rising/falling edge, selectable and pulse width ≥ 10 µs), BNC connector
Input 2; TTL level (Rising/falling edges, selectable and pulse width ≥ 10 µs), BNC connector
100 kHz to 5.5 GHz
–20 to +20 dBm
±0.5%
±0.5% of full scale at most sensitive range (100 µW range)
±0.2% of full scale after zero setting at most sensitive range
Freq.: 50 MHz, Out: 1.00 mW, Accuracy ±1.2%
MA4601A
640 x 400-dot, 9-inch EL
Reference input: 10 MHz ±10 Hz, 2 to 5 Vp-p, ≥ 50Ω, BNC connector
Reference buffer output: 10 MHz, 2 to 3 Vp-p (with the output terminated by a 200Ω terminator), BNC connector
Separate video output: Compatible with 8-pin DIN connector
One slot can be connected.
Internal memory (4 sets of spectrum and Tx test conditions),
Can save/recall setting conditions at external memory (PMC)
Can hard-copy screen via GP IB2
As device controlled by host, all functions except power switch
Control other instruments as controller using PTA
SH1, AH1, T6, L4, SR1, RL1, PPO, DC1, DT1, CO (C1, C2, C3 and C24 with PTA)
Control other instruments as controller
SH1, AH1, T6, L4, SR1, RL1, PPO, DCO, DTO, C1, C2, C3, C4, C28
Output port A/B: 8-bit (TTL level), Input/Output port C/D: 4-bit (TTL level), Exclusive port: 3-bit (TTL level)
Control signal: 4 (TTL level), +5V output: max. 50mA
Control other instruments as controller
PTL: High level language interpreter based on BASIC
Using external keyboard
On PMC or FD
Upload/Download from/to PC
900 Kbytes
0˚ to 50˚C
85 to 132/170 to 250 Vac, 47.5 to 63 Hz, ≤500 VA
221.5 H x 426 W x 451 D mm, < 27 kg
EN55011: 1991, Group 1, Class A
EN50082-1: 1992
Amplitude
Linearity
(after calibration)
Dynamic range
Spurious
Sweep
Time domain
waveform display
Detection mode
Number of points
AM/FM demodulation
Auxiliary inputs/outputs
GP IB 1 (IEEE 488.2)
GP IB 2 (IEEE 488.1)
I/O port
RS-232C (option 02)
Language
Programming
Program memory
Programming capacity
S
P
E
C
T
R
U
M
A
N
A
L
Y
Z
E
R
P
O
W
E
R
M
E
T
E
R
O
T
H
E
R
S
Applicable System
Frequency range
Level range
Instrumentation accuracy
Zero set
Zero shift between ranges
Calibration oscillator
Applicable Power Sensor
Display
Inputs/outputs on rear panel
External memory
Save/recall
Direct plotting
Operating Temperature
Power
Dimensions and mass
EMC*
1
*1EMC : Electromagnetic Compatibility
Page 17

Model/Order No. Name Remarks
Main frame
MS8604A Digital Mobile Radio Transmitter Tester
Standard Accessories
J0114A Coaxial cord, 1m: 1pc. UG-21D/U•RG-9A/U•UG-21D/U
J0017F Power cord, 2.5m: 1 pc.
P0005 PMC: 1 pc. BS32F1-C-172, 32 Kbytes
MA4601A Power Sensor: 1 pc. 100 kHz to 5.5 GHz, -30 to +20 dBm
J0370N Power Sensor Connector Cable, 0.5m 1 pc.
F0014 Fuse, 6.3A: 2pcs. T6.3A250V
W0682AE MS8604A Operation Manual: 1 pc.
Options
MS8604A-01 Reference quartz oscillator Aging rate: ≤5 x 10
-9
/day
MS8604A-02 RS-232C Interface (for external control)
MS8604A-03 I/Q input
MS8604A-11 Measurement software Ver.3 (PDC)
MS8604A-12 Measurement software Ver.3 (PHS)
MS8604A-13 Measurement software Ver.3 (NADC)
MS8604A-14 Measurement software Ver.2 (Digital MCA)
Added to the MS8604A firmware at the factory
MS8604A-15 Measurement software Ver.2 (GMSK)
MS8604A-16 Measurement software (π/4 DQPSK)
W0722AE Measurement software operation manual Supplied with Option 14
W0876AE Measurement software operation manual Supplied with Option 15
W0973AE Measurement software operation manual Supplied with Option 16
Z0251A MS8604A service kit
Application software Supplied with PMC (Plug-in Memory Card)
MX3512A π/4 DQPSK Analysis Software For MS8604A-11/12/13
MX3513A Digital MCA Analysis Software For MS8604A-14
MX3518A GSM Application Software For MS8604A-15
MX3519A DECT Application Software For MS8604A-15
MX3520A CT2 Application Software For MS8604A-15
Peripheral Equipment and Parts
MC3305A JIS type PTA keyboard
MC3306A ASCII type PTA keyboard
VP-870 Printer with GP-IB (EPSON product)
J0007 GP IB Cable, 1m 408JE-101
J0008 GP IB Cable, 2m 408JE-102
P0006 PMC, 64 KB BS64F1-C-173
P0007 PMC, 128 KB BS128F1-C-174
P0008 PMC, 256 KB BS256F1-C-1175
P0009 PMC, 512 KB BS512F1-C-1176
MA4001A Range Calibrator
MN1607A 50ΩCoaxial Switch DC to 3 GHz, 50Ω (externally controlled)
MP59B 50Ω Coaxial Switch DC to 3 GHz, 50Ω
MP640A Branch DC to 1.7 GHz, 40 dB
MP654A Directional Coupler 0.8 to 3 GHz, 30 dB
MP520C CM Directional Coupler 25 to 500 MHz, 50Ω, N type
J0395 Fixed Attenuator for high-power 30 dB, 30W, DC to 8 GHz
J0055 Coaxial Adapter NC-P•BNC-J
562 DC Block 10 MHz to 12.4 GHz (NARDA product)
B0329D Protective Cover
B0331D Front Handle Kit 2 pcs/set
B0332 Joint Plates 4 pcs/set
B0333D Rack Mount Kit
B0334D Hard Carrying Case with protective cover casters
Please specify the Model/Order No., names, and quantities when ordering.
}
17
Ordering Information
Page 18

ANRITSU CORPORATION
5-10-27, Minamiazabu, Minato-ku, Tokyo 106-8570, Japan
Phone: +81- 3-3446-1111
Telex: J34372
Fax: +81-3-3442-0235
Overseas Subsidiaries
•
U.S.A.
ANRITSU COMPANY
North American Region Headquarters
1155 East Collins Blvd., Richardson, Tx 75081, U.S.A.
Phone: +1-972-644-1777
Fax: +1- 972-644 -3416
•
Canada
ANRITSU ELECTRONICS LTD.
Unit 102, 215 Stafford Road West
Nepean, Ontario K2H 9C1, Canada
Phone: +1-613-828-4090
Fax: +1- 613-828 -5400
•
Brasil
ANRITSU ELETRÔNICA LTDA.
Praia de Botafogo 440, Sala 2401 CEP 22250-040,
Rio de Janeiro, RJ, Brasil
Phone: +55-21-5276922
Fax: +55-21-537-1456
•
U.K.
ANRITSU LTD.
200 Capability Green, Luton, Bedfordshire LU1 3LU, U.K.
Phone: +44-1582-433200
Fax: +44-1582-731303
•
Germany
ANRITSU GmbH
Grafenberger Allee 54-56, 40237 Düsseldorf 1,
Germany
Phone: +49- 211- 96855-0
Fax: +49-211-96855-55
•
France
ANRITSU S.A.
9, Avenue du Québec Z.A. de Courtabœuf 91951 Les
Ulis Cedex, France
Phone: +33- 1 -60-92-15-50
Fax: +33-1-64-46-10-65
•
Italy
ANRITSU S.p.A.
Via Elio Vittorini, 129, 00144 Roma EUR, Italy
Phone: +39- 06 -502-26-66
Fax: +39-06-502-24-25
•
Sweden
ANRITSU AB
Botvid Center, Fittja Backe 1-3 145 84 Stockholm,
Sweden
Phone: +46- 853470700
Fax: +46-853470730
•
Singapore
ANRITSU PTE LTD.
6, New Industrial Rd., #06-01/02, Hoe Huat Industrial
Building, Singapore 536199
Phone: +65- 282-2400
Fax: +65-282-2533
•
Hong Kong
ANRITSU COMPANY LTD.
Suite 719, 7/F., Chinachem Golden Plaza, 77 Mody
Road, Tsimshatsui East, Kowloon, Hong Kong, China
Phone: +852-2301-4980
Fax: +852-2301-3545
•
Korea
ANRITSU CORPORATION
14F Hyun Juk Bldg. 832-41, Yeoksam-dong,
Kangnam-ku, Seoul, Korea
Phone: +82-2-553-6603
Fax: +82-2-553-6604
˜
5
•
Australia
ANRITSU PTY LTD.
Unit 3/170 Forster Road Mt. Waverley, Victoria, 3149,
Australia
Phone: +61-3-9558-8177
Fax: +61-3-9558-8255
•
Taiwan
ANRITSU COMPANY INC.
6F, 96, Sec. 3, Chien Kou North Rd. Taipei, Taiwan,
R.O.C.
Phone: +886-2-2515-6050
Fax: +886-2-2509-5519
Specifications are subject to change without notice.
Catalog No. MS8604A-E-A- 1-(2.00) Printed in Japan 1999-10 20KL/O
 Loading...