

Page 1

Agilent N1913/1914A
EPM Series Power
Meters
User’s Guide
Agilent Technologies
Page 2

Notices
CAUTION
WARNING
© Agilent Technologies, Inc. 2009
No p art o f this manu al may be reprod uced in
any form or by any means (including electronic storage and retrieval or translation
into a foreign language) without prior agreement and written consent from Agilent
Technologies, Inc. as governed by United
States and international copyright laws.
Manual Part Number
N1913-90001
Edition
First Edition, May 13, 2009
Printed in Malaysia
Agilent Technologies, Inc.
3501 Stevens Creek Blvd.
Santa Clara, CA 95052 USA
Warranty
The material contained in this document is provided “as is,” and is subject to being changed, without notice,
in future editions. Further, to the maximum extent permitted by applicable
law, Agilent disclaims all warranties,
either express or implied, with regard
to this manual and any information
contained herein, including but not
limited to the implied warranties of
merchantability and fitness for a particular purpose. Agilent shall not be
liable for errors or for incidental or
consequential damages in connection with the furnishing, use, or performance of this document or of any
information contained herein. Should
Agilent and the user have a separate
written agreement with warranty
terms covering the material in this
document that conflict with these
terms, the warranty terms in the separate agreement shall control.
Technology Licenses
The hardware and/or software described in
this document are furnished under a license
and may be used or copied only in accordance with the terms of such license.
Restricted Rights Legend
U.S. Government Restricted Rights. Software and technical data rights granted to
the federal government include only those
rights customarily provided to end user customers. Agilent provides this customary
commercial license in Software and technical data pursuant to FAR 12.211 (Technical
Data) and 12.212 (Computer Software) and,
for the Department of Defense, DFARS
252.227-7015 (Technical Data - Commercial
Items) and DFARS 227.7202-3 (Rights in
Commercial Computer Software or Computer Software Documentation).
Safety Notices
A CAUTION notice denotes a haz-
ard. It calls attention to an operating procedure, practice, or the like
that, if not correctly performed or
adhered to, could result in damage
to the product or loss of important
data. Do not proceed beyond a
CAUTION notice until the indicated
conditions are fully understood and
met.
A WARNING notice denotes a
hazard. It calls attention to an
operating procedure, practice, or
the like that, if not correctly performed or adhered to, could result
in personal injury or death. Do not
proceed beyond a WARNING
notice until the indicated conditions are fully understood and
met.
ii
Page 3

Certification
General Warranty
Agilent Technologies certifies that this product met its published
specifications at the time of shipment. Agilent further certifies that its
calibration measurements are traceable to the United States National
Institute of Standard and Technology (formerly National Bureau of
Standards), to the extent allowed by that organization’s calibration facility,
and to the calibration facilities of other International Standards
Organization members.
The material contained in this document is provided “as is,” and is subject
to being changed, without notice, in future editions. Further, to the
maximum extent permitted by applicable law, Agilent disclaims all
warranties, either express or implied with regard to this manual and any
information contained herein, including but not limited to the implied
warranties of merchantability and fitness for a particular purpose. Agilent
shall not be liable for errors or for incidental or consequential damages in
connection with the furnishing, use, or performance of this document or
any information contained herein. Should Agilent and the user have a
separate written agreement with warranty terms covering the material in
this document that conflict with these terms, the warranty terms in the
separate agreement shall control. Duration and conditions of warranty for
this product may be superseded when the product is integrated into
(becomes a part of) other Agilent products. During the warranty period,
Agilent will, at its option, either repair or replace products which prove to
be defective. The warranty period begins on the date of delivery or on the
date of installation if installed by Agilent.
Warranty Service
For warranty service or repair, this product must be returned to a service
facility designated by Agilent. For products returned to Agilent for
warranty service, the Buyer shall prepay shipping charges to Agilent and
Agilent shall pay shipping charges to return the product to the Buyer.
However, the Buyer shall pay all shipping charges, duties, and taxes for
products returned to Agilent from another country.
iii
Page 4

Limitation of Warranty
Exclusive Remedies
The foregoing warranty shall not apply to defects resulting from improper
or inadequate maintenance by the Buyer, Buyer-supplied products or
interfacing, unauthorized modification or misuse, operation outside of the
environmental specifications for the product, or improper site preparation
or maintenance.
The design and implementation of any circuit on this product is the sole
responsibility of the Buyer. Agilent does not warrant the Buyer’s circuitry
or malfunctions of Agilent products that result from the Buyer’s circuitry.
In addition, Agilent does not warrant any damage that occurs as a result of
the Buyer’s circuit or any defects that result from Buyer-supplied products.
To the extent allowed by local law, Agilent makes no other warranty,
expressed or implied, whether written or oral with respect to this product
and specifically disclaims any implied warranty or condition of
merchantability, fitness for a particular purpose or satisfactory quality.
To the extent allowed by local law, the remedies provided herein are the
Buyer’s sole and exclusive remedies. Agilent shall not be liable for any
direct, indirect, special, incidental, or consequential damages (including
lost profit or data), whether based on warranty, contract, tort, or any other
legal theory.
iv
Page 5

Restricted Rights Legend
The Software and Documentation have been developed entirely at private
expense. They are delivered and licensed as “commercial computer
software” as defined in DFARS 252.227-7013 (Oct 1988), DFARS
252.211-7015 (May 1991), or DFARS 252.227-7014 (Jun 1995), as a
“commercial item” as defined in FAR 2.101(a), or as “restricted computer
software” as defined in FAR 52.227-19 (Jun 1987) (or any equivalent
agency regulation or contract clause), whichever is applicable. You have
only those rights provided for such Software and Documentation by the
applicable FAR or DFARS clause or the Agilent standard software
agreement for the product involved.
Technology Licenses
The hardware and/or software described in this document are furnished
under a license and may be used or copied only in accordance with the
terms of such license.
v
Page 6

Safety Summary
WARNING
CAUTION
Safety Notices
The following general safety precautions must be observed during all
phases of operation of this instrument. Failure to comply with these
precautions or with specific warnings elsewhere in this manual violates
safety standards of design, manufacture, and intended use of the
instrument. Agilent Technologies, Inc. assumes no liability for the
customer’s failure to comply with these requirements.
A WARNING notice denotes a hazard. It calls attention to an operating
procedure, practice, or the like that, if not correctly performed or
adhered to, could result in personal injury or loss of life. Do not proceed
beyond a WARNING notice until the indicated conditions are fully
understood and met.
A CAUTION notice denotes a hazard. It calls attention to an operating
procedure, practice, or the like that, if not correctly performed or adhered
to, could result in damage to the product or loss of important data. Do not
proceed beyond a CAUTION notice until the indicated conditions are fully
understood and met.
vi
Page 7

Safety Symbols
The following symbol on the instrument and in the documentation
indicates precautions that must be taken to maintain safe operation of the
instrument.
Caution, risk of danger. The Instruction
Documentation Symbol. The
instrument is marked with this symbol
when it is necessary for the user to
refer to the inst ructions in the supplied
documentation.
Alternating current (AC)
Direct current (DC) On (Supply)
Both direct and alternating current Off (Supply)
Three-phase alternating current Caution, risk of electric shock
Earth (ground) TERMINAL Caution, hot surface
This symbol indicates the operating
switch for ‘Stand-by’ mode.
Note, this instrument is NOT isolated
from the mains when the switch is
pressed. To isolate the instrument, the
mains coupler (mains input cord) should
be removed from the power supply.
Instrument protected throughout by
DOUBLE INSULATION or REINFORCED
INSULATION.
PROTECTIVE CONDUCTOR
TERMINAL
Frame or chassis TERMINAL Out position of bi-stable push control
Equipotentiality
In position of bi-stable push control
vii
Page 8

General Safety Information
WARNING
This is a Safety Class I instrument (provided with a protective earthing
ground, incorporated in the power cord). The mains plug shall only be
inserted in a socket outlet provided with a protective earth contact. Any
interruption of the protective conductor inside or outside of the instrument
is likely to damage the meter. Intentional interruption is prohibited.
• Do not operate the instrument in an explosive atmosphere or in the
• Do not use repaired fuses or short-circuited fuseholders: For
• Do not perform procedures involving cover or shield removal unless
• Do not service or adjust alone: Under certain conditions, dangerous
• Do not operate damaged instrument: Whenever it is possible that the
• Do not substitute parts or modify the instrument: Because of the
presence of flammable gasses or fumes.
continued protection against fire, replace the line fuse(s) only with
fuse(s) of the same voltage and current rating and type.
you are qualified to do so: Operating personnel must not remove the
meter covers or shields. Procedures involving the removal of covers
and shields are for use by service-trained personnel only.
voltages may exist even with the instrument switched off. To avoid
electrical shock, service personnel must not attempt internal service
or adjustment unless another person, capable of rendering first aid
and resuscitation, is present.
safety protection features built into this instrument have been
impaired, either through physical damage, excessive moisture, or
any other reason, REMOVE POWER and do not use the instrument
until safe operation can be verified by service-trained personnel. If
necessary, return the instrument to a Agilent Technologies Sales and
Service Office for service and repair to ensure the safety features are
maintained.
danger of introducing additional hazards, do not install substitute
parts or perform any unauthorized modification to the instrument.
Return the instrument to a Agilent Technologies Sales and Service
Office for service and repair to ensure the safety features are
maintained.
viii
Page 9

ix
Page 10

In This Guide...
1 Introduction
This chapter introduces you to the front panel display and instrument Web
browser of the N1913/1914A EPM Series power meters.
2 General Power Meter Functions
This chapter describes in detail the general operation of the N1913/1914A
EPM Series power meters.
3 Using E9300 E-Series Power Sensors
This chapter describes how to use your E9300 E-Series power sensors
with N1913/1914A EPM Series power meters
4 Using E4410 E-Series Power Sensors
This chapter describes how to use your E4410 E-Series power sensors
with N1913/1914A EPM Series power meters
5 Using 8480 Series Power Sensors
This chapter describes how to use your 8480 Series power sensors with
N1913/1914A EPM Series power meters.
6 Using N8480 Series Power Sensors
This chapter describes how to use your N8480 Series power sensors with
N1913/1914A EPM Series power meters.
7 Using U2000 Series USB Power Sensors
This chapter describes how to use your U2000 Series power sensors with
N1913/1914A EPM Series power meters.
8 Maintenance
This chapters describes the built-in tests, error messages, and general
maintenance.
x
Page 11

9 Specifications and Characteristics
This chapter describes the specifications and characteristics of your
N1913/1914A EPM Series power meters.
xi
Page 12

xii
Page 13

Contents
Notices ii
Certification iii
General Warranty iii
Warranty Service iii
Limitation of Warranty iv
Exclusive Remedies iv
Restricted Rights Legend v
Technology Licenses v
Safety Summary vi
Safety Symbols vii
General Safety Information viii
In This Guide... x
1 Introduction
LXI Class-C Compliant Power Meter 2
Power Meter and Sensor Capability 3
Conventions Used in this Guide 4
Front Panel Keys and Connections 5
The Display Layout 10
Window Symbols and Pop-ups 13
Rear Panel Connections 16
Using the Instrument Web Browser 17
Making Socket Connection 24
2 General Power Meter Functions
Setting the Units of Measurement 28
Setting the Measurement Frequency 29
Setting the Resolution 30
Making Relative Measurements 31
Setting Offsets 33
Setting Measurement Averaging 45
xiii
Page 14

Step Detection 47
Setting External Trigger for Average Power Measurement 48
Setting Measurement Limits 56
Single Function Measurement 61
Combined Measurement 62
Max Hold/Min Hold 63
Recorder Output 66
Saving and Recalling Power Meter States 69
Zeroing and Calibrating the Power Meter 71
Blank Screen 78
Secure Blank 79
Backlight Intensity Control 84
Memory Erase/Secure Erase 85
VGA Output (Optional) 88
Warm Start 89
Battery Information (Optional) 90
3 Using E9300 E-Series Power Sensors
Introduction 98
Power Meter Configuration 99
Measurement Accuracy 101
Measuring Spread Spectrum and Multitone Signals 104
Measuring TDMA Signals 107
Electromagnetic Compatibility (EMC) Measurements 109
Measurement Accuracy and Speed 110
4 Using E4410 E-Series Power Sensors
Introduction 114
Power Meter Configuration 115
Measurement Accuracy 117
5 Using 8480 Series Power Sensors
Introduction 120
xiv
Page 15

Power Meter Configuration 121
Measurement Accuracy 125
Frequency Specific Calibration Factors 126
Sensor Calibration Tables 130
6 Using N8480 Series Power Sensors
Introduction 142
Power Meter Configuration Changes 143
Default Channel Setup 144
N8480 Series Sensors Connection Requirements 145
N8480 Series Power Sensors (excluding Option CFT) 146
N8480 Series Power Sensors with Option CFT 148
7 Using U2000 Series USB Power Sensors
Introduction 162
Power Meter Configuration 163
Measurement Accuracy 166
Electromagnetic Compatibility (EMC) Measurements 168
Measurement Accuracy and Speed 169
8 Maintenance
Self Test 174
Error Messages 178
Operator Maintenance 189
Contacting Agilent Technologies 190
Erasing Memory Data 193
Returning Your Power Meter for Service 194
Agilent Sales and Service Offices 196
9 Specifications and Characteristics
Introduction 198
Power Meter Specifications 200
Power Sensor Specifications 201
xv
Page 16

Power Meter Supplemental Characteristics 205
Measurement Characteristics 214
Rear Panel Inputs and Output Connections 215
1 mW Power Reference 216
Environmental Conditions 217
Physical Characteristics 218
Regulatory Information 219
xvi
Page 17

List of Figures
Figure 1-1 Dual numeric display 10
Figure 1-2 Single numeric and analog display 11
Figure 1-3 Full screen numeric display 12
Figure 1-4 Opening the instrument Web interface. 17
Figure 1-5 N1913A EPM Series power meter Web browser (Welcome Page) 18
Figure 1-6 Status message before Toggle ID is selected. 19
Figure 1-7 Status message when Toggle ID is selected. 19
Figure 1-8 Example of Lan Status message. 20
Figure 1-9 Viewing LAN configuration settings from the Web interface 21
Figure 1-10 Password security dialog box. 22
Figure 1-11 Changing the instrument LAN interface configuration 23
Figure 2-1 Frequency pop-up 29
Figure 2-2 Typical relative measurement display 31
Figure 2-3 Numeric display 32
Figure 2-4 Simplified measurement path 33
Figure 2-5 Typical channel offset display 34
Figure 2-6 Channel offset indicator 35
Figure 2-7 Typical display offset display 36
Figure 2-8 Frequency dependent offset tables display 38
Figure 2-9 Frequency dependent offset indicator 39
Figure 2-10 “Edit Offset” display with data added 41
Figure 2-11 Edit table title pop-up 41
Figure 2-12 Changing offset unit 42
Figure 2-14 Typical averaged readings 45
Figure 2-15 Meas Avg Count pop-up 46
Figure 2-16 TRIG IN and TRIG OUT connection diagram between power meter and
power source. 49
Figure 2-17 Channel Setup display 50
Figure 2-18 Trigger setting menu 1 of 2 51
Figure 2-19 Trigger setting menu 2 of 2 51
Figure 2-20 Limits checking applications 56
Figure 2-21 Limits checking results 56
Figure 2-22 Minimum limit pop-up 58
Figure 2-23 Limit failures 59
xvii
Page 18

Figure 2-24 Measurement Setup showing single configuration 60
Figure 2-25 Function pop-up 61
Figure 2-26 Measurement Setup showing combined configuration 62
Figure 2-27 Measurement example display 62
Figure 2-28 Max hold/min hold measurement is performed on the ‘HOLD’ block 63
Figure 2-29 Hold pop-up 64
Figure 2-30 Min Hold and Max Hold measurement mode indicated in the display 64
Figure 2-31 Measurement mode in full word 65
Figure 2-32 Recorder Minimum pop-up 67
Figure 2-33 Recorder Maximum pop-up 67
Figure 2-34 Save/Recall screen 69
Figure 2-35 Save confirm pop-up 69
Figure 2-36 File name pop-up 70
Figure 2-37 Recall pop-up 70
Figure 2-38 Zeroing pop-up 71
Figure 2-39 Please zero and calibrate window 72
Figure 2-40 Calibration wait pop-up 73
Figure 2-42 Secure Blank feature 79
Figure 2-43 Enter 6-digit Password pop-up 80
Figure 2-44 6-digit password entered 80
Figure 2-45 Warning message 81
Figure 2-46 Reconfirm password 81
Figure 2-47 Warning message 82
Figure 2-48 Password reconfirmation pop-up 82
Figure 2-49 Enter password to restore display 83
Figure 2-50 Backlight intensity control 84
Figure 2-51 Increase or decrease the backlight brightness 84
Figure 2-52 Activate memory erase using combo keys 85
Figure 2-53 Secure Erase 86
Figure 2-54 Confirmation to begin secure erase 86
Figure 2-55 Warning pop-up 87
Figure 2-56 VGA toggle ON/OFF 88
Figure 2-57 Enable/disable warm start feature 89
Figure 2-58 “Running under battery power” pop-up 90
Figure 2-59 Battery indicator 91
xviii
Page 19

Figure 2-60 Battery menu 91
Figure 2-61 Battery status display 92
Figure 2-62 Low battery indicator 92
Figure 2-63 Display backlight control 93
Figure 3-1 E9300 E-Series auto-averaging settings 99
Figure 3-2 E9300 E-Series sensor default channel setup 100
Figure 3-4 Frequency pop-up 103
Figure 3-5 Spread spectrum signal 104
Figure 3-6 Wideband CDMA error of E-Series E9300 power sensor versus corrected CW
sensor 105
Figure 3-7 CDMA (IS-95A): 9Ch Fwd 105
Figure 3-8 Calibration factors versus frequency 106
Figure 4-1 E-Series CW sensor auto-averaging settings 115
Figure 4-2 E-Series E4410 sensor default channel setup 116
Figure 4-3 Frequency pop-up 118
Figure 5-1 8480 Series auto-averaging settings 121
Figure 5-2 8480 Series sensor default channel setup 122
Figure 5-3 Reference Calibration Factor pop-up window 127
Figure 5-4 Calibration factor pop-up window 128
Figure 5-5 Calibration factor display 128
Figure 5-6 Sensor table selected 131
Figure 5-7 Frequency dependent offset indicator 131
Figure 5-8 Frequency/calibration table display 132
Figure 5-9 “Sensor Tbls” screen 134
Figure 5-10 “Edit Cal” display 135
Figure 5-11 Edit table title pop-up 135
Figure 6-1 Auto-averaging settings 143
Figure 6-2 N8480 Series sensor (excluding Option CFT) default channel setup 144
Figure 6-3 N8480 Series sensor with Option CFT default channel setup 144
Figure 6-4 Frequency pop-up 147
Figure 6-5 Reference calibration factor pop-up window 149
Figure 6-6 Calibration factor pop-up window 150
Figure 6-7 Calibration factor displayed 151
Figure 6-8 Sensor table selected 154
Figure 6-9 Frequency dependent offset indicator 155
xix
Page 20

Figure 6-10 Frequency/calibration table display 156
Figure 6-11 “Sensor Tbls” screen 158
Figure 6-12 “Edit Cal” display 159
Figure 6-13 Edit table title pop-up 159
Figure 7-1 U2000 Series auto-averaging settings 164
Figure 7-2 U2000 Series USB power sensor default channel setup 165
Figure 7-3 Frequency pop-up 167
Figure 8-1 Self test complete 175
Figure 8-2 Error indicator position 178
Figure 8-3 Replacing the fuse 189
Figure 8-4 Secure erase status pop-up 193
Figure 9-1 8480 Series Settling Time with Auto-Filter 209
Figure 9-2 E441x Series Settling Time with Auto-Filter 210
Figure 9-3 E9300 Series Settling Time with Auto-Filter 211
Figure 9-4 N8480 Series Settling Time with Auto-Filter 212
Figure 9-5 U2000 Series Settling Time with Auto-Filter 213
xx
Page 21

List of Tables
Ta b l e 1 - 1 Type of Lan Status message. 20
Ta b l e 2 - 1 Measurement units - Single channel meters 28
Ta b l e 2 - 2 Measurement units - Dual channel meters 28
Ta b l e 2 - 3 Range of values for window limits 57
Ta b l e 2 - 4 Ranges of recorder output setting 68
Ta b l e 2 - 5 Power Sensor Connection Requirements 76
Ta b l e 3 - 3 Power sensor connection requirements 101
Ta b l e 5 - 1 8480 Series connection requirements 123
Ta b l e 5 - 2 Installed power sensor models 133
Ta b l e 6 - 1 Power range in the Range setting 142
Ta b l e 6 - 2 N8480 Series connection requirements 145
Ta b l e 6 - 3 Installed power sensor models 157
Ta b l e 7 - 1 Power sensor connection requirements 166
Ta b l e 9 - 1 Zero set specifications 202
Ta b l e 9 - 2 Zero Set (Internal and External) for U2000 Series 204
Ta b l e 9 - 3 Noise Multiplier 205
Ta b l e 9 - 4 Power sensor specifications 206
Ta b l e 9 - 5 U2000 Series power sensors specifications 208
Ta b l e 9 - 6 8480 Series Settling Time 209
Ta b l e 9 - 7 E441x and E9300 Series Settling Time 210
Ta b l e 9 - 8 N8480 Series Settling Time 212
Ta b l e 9 - 9 U2000 Series power sensors’settling time 213
xxi
Page 22

xxii
Page 23

Agilent N1913/1914A EPM Series Power Meters
User’s Guide
1 Introduction
LXI Class-C Compliant Power Meter 2
Power Meter and Sensor Capability 3
Conventions Used in this Guide 4
Front Panel Keys and Connections 5
The Display Layout 10
Window Symbols and Pop-ups 13
Rear Panel Connections 16
Using the Instrument Web Browser 17
Making Socket Connection 24
This chapter introduces you to the front panel display and instrument Web browser of the
N1913/1914A EPM Series power meter.
Agilent Technologies
1
Page 24

1Introduction
LXI Class-C Compliant Power Meter
The N1913/1914A EPM Series power meter is a LXI
Class C compliant instrument, developed using LXI
Technology. LXI, an acronym for LAN eXtension for
Instrumentation, is an instrument standard for devices
that use the Ethernet (LAN) as their primary
communication interface.
Hence, it is an easy-to- use instrument especially with the usage of an
integrated Web browser that provides a convenient way to configure the
instrument’s functionality.
2 Agilent N1913/1914A EPM Series Power Meters User’s Guide
Page 25

Power Meter and Sensor Capability
NOTE
Your N1913/1914A EPM Series power meter is compatible with Agilent
E9300 E- Series, E4410 E- Series, 8480 Series, N8480 Series, and the U2000
Series power sensors. However, not all sensor and meter combinations
have the same features or capabilities. The main differences are as below:
Introduction 1
Features E-Series
E9300
Average power of CW signal
Average power of modulated signal
Cal factors stored on EEPROM
Correction factors stored in a 3 MB
Flash memory
>200 readings/sec
* Not applicable for N8480 Series power sensors with Option CFT
•••••
••••
•• •
••
E-Series
E4410
The E-Series and 8480 Series power sensors require Agilent 11730A power sensor cable
when connected to the N1913/1914A EPM Series power meters.
Specifications
The specifications for the power meter are listed in Chapter 9,
“Specifications and Characteristics,” starting on page 204.
8480
Series
N8480
Series
U2000
Series
*
•
Agilent N1913/1914A EPM Series Power Meters User’s Guide 3
Page 26

1Introduction
Softkey
Channel
Channel A
Channel B
Softkey
Conventions Used in this Guide
The following conventions are used throughout this guide.
This symbol and text represents a labeled key on the power meter front
panel.
This symbol and text represents a labeled softkey and is used to
indicate that you should press the unmarked key beside the displayed
text.
Message This text represents a displayed message.
Parameter This is used to represent a parameter, value, or title.
“Channel” This User’s Guide describes the operation for both the single channel
and the dual channel power meter. To identify channels on a dual
channel meter a softkey on an N1913A meter becomes
When you are asked to press “the channel” in a procedure,
make sure you select the relevant channel.
and on an N1914A.
4 Agilent N1913/1914A EPM Series Power Meters User’s Guide
Page 27

Front Panel Keys and Connections
This section briefly describes the functions of the front panel keys and
connectors.
These keys are located to the left of the display.
Key Function
Press this key to preset the power-meter to the default setting.
Introduction 1
Press this key to control the power meter from the front panel when it is
operating via the remote interfaces (when Local Lock Out is not enabled).
Press this key to select the upper or lower measurement window. The
selected window is highlighted by a blue line on the right side of the
window. Any measurement setup you create is performed in the selected
window.
Press this key to choose windowed, expanded, or full-screen display of a
numeric measurement.
Press this key to switch the meter between on and standby. When power
is supplied, the background LED is red. Pressing the key, switches the
power meter on and the background LED is green. When the meter is
powered on, the start-up will take approximately 10 seconds.
Agilent N1913/1914A EPM Series Power Meters User’s Guide 5
Page 28

1Introduction
These keys are located along the lower edge of the display.
Key Function
Press this key to access general configuration-menus, such as GPIB
address. You can also access some measurement configuration menus.
The measurement screen remains visible.
Press this key to access the channel configuration menus. Channel
parameters such as averaging and offsets are configured from this
menu.
Press this key to access the triggering menu. The triggering feature will
be made available in future for power sensors with triggering capability.
Press this key to setup relative measurements or set display offsets.
Use this key to configure the selected measurement.
Press this key to access the measurement display menu. You can
choose the displayed measurement resolution, units and display format.
Use this key together with to configure measurement
displays.
6 Agilent N1913/1914A EPM Series Power Meters User’s Guide
Page 29

Introduction 1
Confirm
These keys are all associated with the menu labels and data entry. They
are located to the right of the display.
Key Function
Press this key to return to the previous screen. This key also cancels
pop-up entry.
These unmarked keys are called ‘softkeys’ and are referred to by the text
on the display next to them.
For example, during a Preset, you are given an option to confirm the
command. Press to continue, that is, press the softkey beside
the displayed word ‘confirm’.
The lowest of the unmarked softkeys is used when there is a two page
menu to be displayed. For example, a 1 of 2 is displayed beside the key
indicating the first page of a two page menu. Press the key to access the
next page or second page. (A 2 of 2 is displayed).
Agilent N1913/1914A EPM Series Power Meters User’s Guide 7
Page 30

1Introduction
These keys and connectors are associated with the measurement channels
and are located on the right-hand side of the front panel.
Key Function
The arrow keys are used for navigation around the parameter entry
screens. The up and down arrows are used for selecting values from
a pop-up list. They are also used to enter text, for example, table
names.
Press this key to select a highlighted field to allow data entry, check
a checkbox and terminate entry of a popup list.
Press this key to access the zero and calibration menus.
Press this key to reset the MAX HOLD and MIN HOLD
measurement.
Press these keys to enter numeric values in the pop-up fields, for
example, the offset values. To complete the entry, use the softkey.
8 Agilent N1913/1914A EPM Series Power Meters User’s Guide
Page 31

Connector Function
The power reference is a 1 mW (0 dBm) 50 MHz signal
available from a 50
an 8480 or E-Series power sensor and meter system. If the
meter is configured with Option 109, the connector is fitted to
the rear panel. The Green LED beside the connector is lit when
the calibrator is turned on.
The sensor input connectors (N1914A shown, the N1913A has
one input). If the meter is configured with Option 108 or 109,
the connectors are fitted to the rear panel and the front panel
connectors are retained.
The USB Type A port is solely for U2000 Series power sensors
usage only. If the meter is configured with Option105, one USB
Type A port is fitted to the front panel (Channel C) and another
Type A port (Channel D) to the rear panel. If the meter is
configured with Option 103, 108, or 109, two USB Type A ports
are fitted to the rear panel. The USB port on the left is Channel
C and the port on the right is Channel D.
W
type-N connector. It is used for calibratin g
Introduction 1
Agilent N1913/1914A EPM Series Power Meters User’s Guide 9
Page 32
1Introduction
Disp Type
1
2
3
4
5
7
6
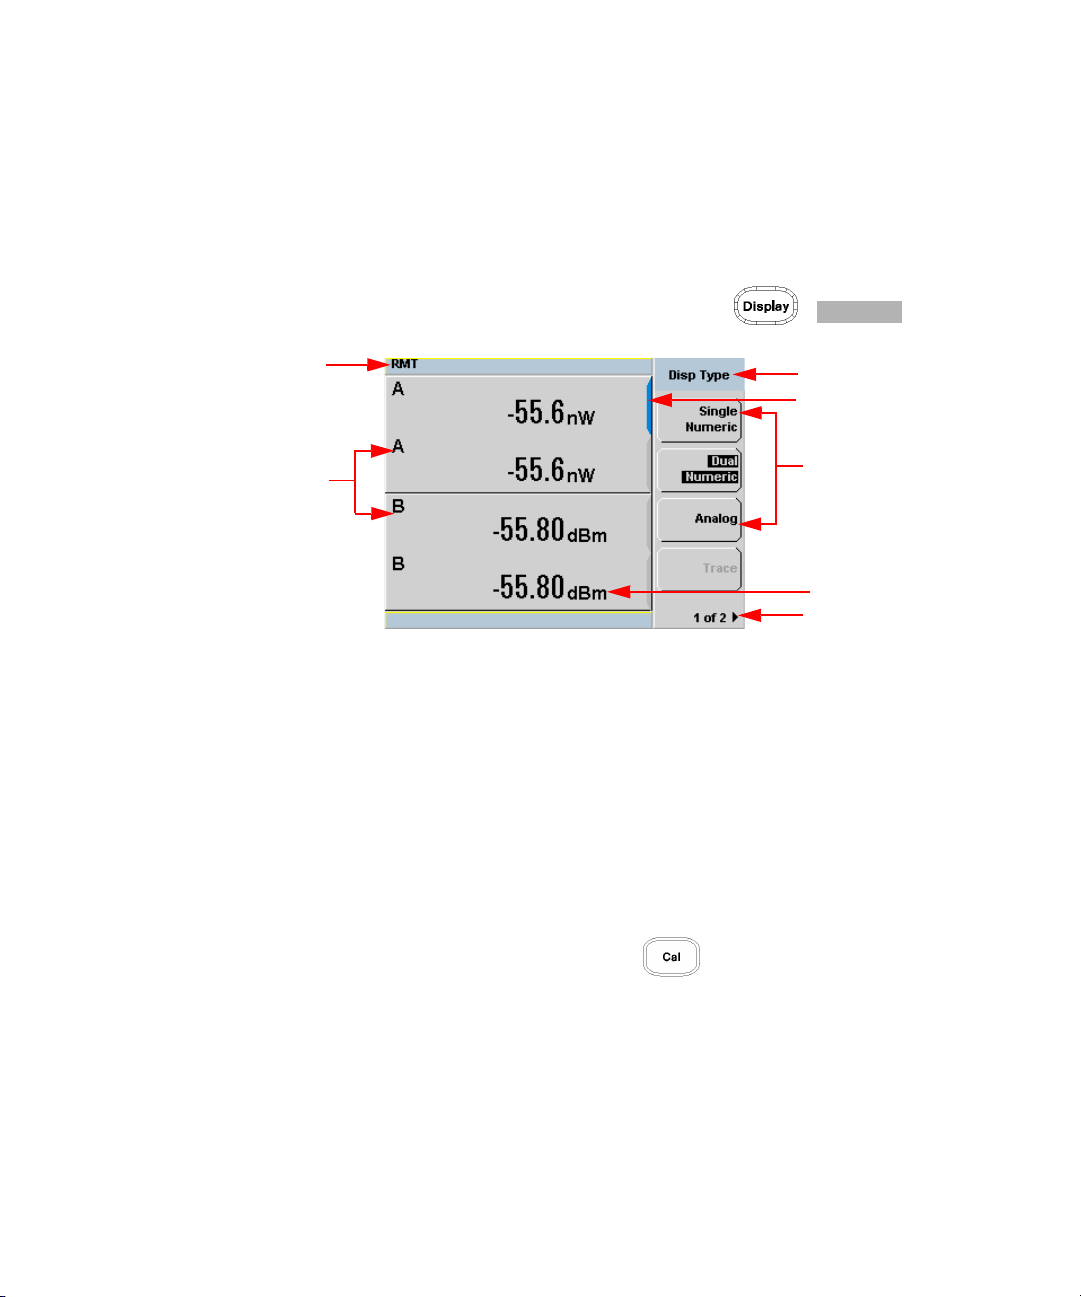
The Display Layout
Figure 1- 1 shows the display layout when two windows are configured in
dual numeric mode.
Other display formats are available by pressing ,
.
Figure 1-1 Dual numeric display
1 The status reporting line displays messages and the control status of
the power meter.
For example, the status can be either RMT (remote, GPIB, USB or LAN
operation) or LCL (local, front panel operation). The message fields
indicate ERR for any error conditions that occur or informing you to
Please Zero the power sensor.
2 The measured channel is shown with a 8480 Series or E-Series power
sensor connected.
3 This field displays the menu title.
For example, Channel Setup or press and the Zero/Cal menu is
displayed.
4 The blue highlight on the right hand side of the window shows it is the
currently selected measurement display line. This measurement line is
the Upper Window/Upper Measurement.
5 The available softkey labels are displayed in these three fields.
Additionally, settings associated with the labeled function are displayed
under the label.
10 Agilent N1913/1914A EPM Series Power Meters User’s Guide
Page 33

Introduction 1
8
9
10
11
12
Softkeys labels that are grayed out cannot be selected.
6 This displays the measurement units, either dBm or Watts (W).
7 This displays the number of pages in the current menu. For example, 1
of 2 indicates that there are two pages in the menu and the first page is
currently displayed. Pressing the softkey displays the next page,
indicated by 2 of 2 (press the softkey to display the previous menu page).
Figure 1-2 Single numeric and analog display
Figure 1- 2 shows the default display mode of two measurement windows.
8 The channel measurement frequency.
9 The upper window is configured to show a single numeric display.
10 The lower window is configured to show an analog meter which
displays the measurement result and the meter scaling.
11 This displays the connected sensor, the offset value, and the acquisition
mode on the channel. On dual channel models, it shows for both
channels.
12 The blue highlight on the right hand side of the window shows it is the
currently selected measurement display line.
Using the , , or keys, you can change the measurement
window selection.
Using the key on numeric measurement results window, you can
choose either two rectangular windows, a single enlarged window, or a
full screen display. The display style is applied to the currently selected
window or measurement line.
Agilent N1913/1914A EPM Series Power Meters User’s Guide 11
Page 34

1Introduction
18
13
17
14
15
16
Figure 1-3 Full screen numeric display
Figure 1- 3 shows a single numeric full screen displaying a relative result.
13 This field displays Minimum Hold if range hold is set to minimum.
14 The information in this field is displayed on two lines and depends on
the sensor type, sensor calibration table, frequency dependent offset
table currently selected, and the measurement frequency.
15 This field displays Dty Cyc if a duty cycle is set.
16 This field displays Ofs if an offset is set.
17 This field displays Rel if relative mode is on.
18 This field indicates the measurement result is beyond the configured
upper or lower limit. If the measurement is within the limits this field
is empty. If the measurement result is less than the minimum limit set,
Undr Lmt is displayed. If the measurement result is more than the
maximum limit set, Over Lmt is displayed.
12 Agilent N1913/1914A EPM Series Power Meters User’s Guide
Page 35

Window Symbols and Pop-ups
There are several different graphic symbols and pop- up windows that can
occur on the power meter display. These can occur for a variety of
reasons, for example:
• An error or warning occurs
• You are required to wait while the power meter carries out a procedure
• You are required to select an entry from a list
• You are required to enter a numeric value
There are three different colors used to signify the pop-up status:
• Green - used to allow data entry
• Orange - used to display information
• Red - used to display an error
Warning Symbol Pop-up
Introduction 1
The warning symbol is displayed either in a pop-up window or directly in
the measurement window when such an event occurs. A pop- up window
is displayed for approximately two seconds. The text in the pop- up
window gives details of the warning type, for example, to indicate that a
power sensor has insufficient bandwidth or a previous entered frequency
value in a table. Depending on the severity of the warning, the pop- up
may be displayed in orange or red.
Agilent N1913/1914A EPM Series Power Meters User’s Guide 13
Page 36

1Introduction
Wait Symbol Pop-up
Confirm Symbol Pop-up
The wait symbol is displayed when the power meter is carrying out a
procedure and no action is required from you. The symbol appears in a
pop-up window. It may appear, for example, during a calibration.
This type of pop- up window is displayed when you are required to press
Confirm to verify your previous selection. For example, prior to a Save
being carried out.
Numeric Entry Pop-up
This type of pop-up window is displayed when you need to modify
numeric data. The numeric keys allow you to enter the value.
14 Agilent N1913/1914A EPM Series Power Meters User’s Guide
Page 37

Introduction 1
Text E n try P o p-u p
This type of pop-up window is displayed when you need to modify
alphanumeric data such as table names. The up/down arrow keys
increment and decrement the alphanumeric digit that the cursor is
currently positioned. The left/right arrow keys move the cursor to another
alphanumeric digit.
List Pop-up
This pop-up window is displayed when you are required to select an entry
from a list. Use the up/down arrow keys to highlight your choice. Press
select to complete the entry.
Agilent N1913/1914A EPM Series Power Meters User’s Guide 15
Page 38

1Introduction
7
8
6 9
4
3
2
1
5
Rear Panel Connections
No. Connections
1 VGA Output (Option 010)
2 Ground Connector
3 USB Type A port (Option 008, Option 009)
This USB port is solely for U2000 Series power sensors usage only.
4Recorder 1/2
Recorder output (two outputs are fitted to dual channel meters) connections are made via
BNC connectors. This output produces a DC voltage that corresponds to the power level of
the channel input.
5AC Inlet
This power meter has an auto configuring power supply. This allows it to operate over a
range of voltages without manually being set to a certain voltage.
6 Trig In/Trig Out
Trigger input and output connections are made via BNC connectors.
7USB Mini-B port
This USB port is used only for remote interface connection.
8LAN
9GPIB
This connector allows the power meter to be controlled remotely using the General Purpose
Interface Bus.
16 Agilent N1913/1914A EPM Series Power Meters User’s Guide
Page 39

Using the Instrument Web Browser
NOTE
The N1913/1914A EPM Series power meters network settings can be
configured using its Web- based interface (Web browser). The instrument’s
Web browser can be opened from Agilent Connection Expert as shown in
Figure 1- 4.
Alternatively, the instrument’s Web- based interface can also be opened
directly from a Web browser by entering the instrument’s IP address or
hostname in the browser’s ‘address’ window.
Introduction 1
Figure 1-4 Opening the instrument Web interface.
Agilent N1913/1914A EPM Series Power Meters User’s Guide 17
Page 40

1Introduction
Remote Interfaces
An example of the Web browser is shown in “N1913A EPM Series power
meter Web browser (Welcome Page)” on page 18.
18 Agilent N1913/1914A EPM Series Power Meters User’s Guide
Figure 1-5 N1913A EPM Series power meter Web browser (Welcome Page)
Instrument on the network can be physically identified through the Status
message on Remote Interfaces screen by clicking Toggle ID within the
Web browser. This changes the status of the Instrument ID to ON or OFF.
Before the instrument identification starts, press
,
to view the Status message.
When Instrument ID is toggled to ON, this causes the Status message
“LAN identify start” in Remote Interface screen on the front panel to
blink 3 times. When the Toggle ID is selected again, the default Status
message “Running” is returned. See Figure 1- 6 and Figure 1- 7.
Page 41

Figure 1-6 Status message before Toggle ID is selected.
Status message “LAN
identity start” to blink 3
times when Toggle ID is
selected.
Remote Interfaces
Introduction 1
Agilent N1913/1914A EPM Series Power Meters User’s Guide 19
Figure 1-7 Status message when Toggle ID is selected.
When the instrument is configured to LAN, the Lan Status on
screen will show the LAN error condition and status of
the LAN configuration connection. There are six types of Lan Status
messages that may occur. See Table 1- 1. See also Figure 1- 8 for the
example of Lan Status message.
Page 42

1Introduction
NOTE
Ta b le 1 - 1 Ty pe of Lan Status message.
Type of message Description
Lan: No Fault
Status: Initialized
Lan: No Fault
Status: Running
Lan: Fault
Status: Initialization failed
Lan: Fault
Status: Disconnected
Lan: –
Status: Restarting
Lan: DHCP Not Available
Status: Running
• A valid IP address is successfully obtained using selected
LAN configuration and the network state is initialized.
• A valid IP address is successfully obtained using selected
LAN configuration, while network is running.
• IP conflict occurs, or
• IP address failed to be obtained using selected LAN
configuration, or
• No LAN configuration is selected.
• LAN cable is unplugged.
• Restart the network and try to obtain an IP address using
selected LAN configuration.
• Unable to obtain IP address from DHCP server (if user
select DHCP configuration)
• IP address obtained from Auto-IP or manual
configuration.
Figure 1-8 Example of Lan Status message.
For more details on remote interface configuration, refer to N1913/1914A EPM Series
Power Meters Installation Guide.
20 Agilent N1913/1914A EPM Series Power Meters User’s Guide
Page 43

Introduction 1
Editing the Instrument’s LAN Settings
Once communication path to the instrument has been established, the
instrument’s LAN configuration can be viewed and modified using the Web
browser.
On the Welcome Page, click View and Modify Configuration. This opens
the configuration window shown in Figure 1- 9.
Figure 1-9 Viewing LAN configuration settings from the Web interface
To edit parameters shown, click Modify Configuration. The Enter
Password dialog box appears as shown in Figure 1- 10.
Agilent N1913/1914A EPM Series Power Meters User’s Guide 21
Page 44

1Introduction
NOTE
Remote Interfaces
1 of 2
LAN Reset
NOTE
NOTE
LAN Reset
Figure 1-10 Password security dialog box.
Click the Submit (accept the default password) and the window opens as
shown in Figure 1- 11. The default password is “agilent”.
A LAN reset needs to be performed to ensure that the password is reset to default. See
LAN reset procedure as below.
Procedure:
1 Press , to display the Remote Interfaces screen.
2 Press softkey to display the second page of the Remote I/F menu.
3 Press softkey to reset the LAN settings to default.
When softkey is pressed, it will also change the GPIB address to default.
You can change the password from the Configuring your N1913A Power Meter window as
shown in Figure 1-11. Scroll down the Parameter column until you locate the Change
Password parameter.
22 Agilent N1913/1914A EPM Series Power Meters User’s Guide
Page 45

Figure 1-11 Changing the instrument LAN interface configuration
Introduction 1
Agilent N1913/1914A EPM Series Power Meters User’s Guide 23
Page 46

1Introduction
Making Socket Connection
The power meter can be remotely connected via socket connection. To
connect the meter using socket connection,
1 Right-click the Agilent IO Libraries icon on the taskbar and select
Agilent Connection Expert.
2 On the Agilent Connection Expert window, click on . An
Add Instrument window will be prompted out. Select Add LAN instrument
on LAN (TCPIPO) interface and click OK (see Figure 1- 12).
Figure 1-12 Add Instrument window
3 On the Add LAN Instruments window (see Figure 1- 13), click the Add
Address.
4 Select the Use IP Address option and type the IP address. Select the Use
socket connection.
5 Click Test Connection to test if the instrument is present.
6 Click OK. You will then return to the Agilent Connection Expert window
(see Figure 1- 14). Your meter is successfully connected via socket
connection.
24 Agilent N1913/1914A EPM Series Power Meters User’s Guide
Page 47

Figure 1-13 Add LAN Instruments window
Introduction 1
Figure 1-14 N1914A meter connected via socket connection
Agilent N1913/1914A EPM Series Power Meters User’s Guide 25
Page 48

1Introduction
26 Agilent N1913/1914A EPM Series Power Meters User’s Guide
Page 49

N1913/1914A EPM Series Power Meters
User’s Guide
2 General Power Meter Functions
Setting the Units of Measurement 28
Setting the Measurement Frequency 29
Setting the Resolution 30
Making Relative Measurements 31
Setting Offsets 33
Setting Measurement Averaging 45
Step Detection 47
Setting External Trigger for Average Power Measurement 48
Setting Measurement Limits 56
Single Function Measurement 61
Combined Measurement 62
Max Hold/Min Hold 63
Recorder Output 66
Saving and Recalling Power Meter States 69
Zeroing and Calibrating the Power Meter 71
Blank Screen 78
Secure Blank 79
Backlight Intensity Control 84
Memory Erase/Secure Erase 85
VGA Output (Optional) 88
Warm Start 89
Battery Information (Optional) 90
This chapter describes the general operation of the N1913/1914A EPM Series power
meters.
Agilent Technologies
27
Page 50

2 General Power Meter Functions
Units
dBmWdB
%
NOTE
Setting the Units of Measurement
The Units menu is used to select the measurement units for the currently
selected window. These can either be logarithmic (dBm or dB) or linear
(Watt or %) units. Presetting ( ) the power meter sets the
measurement units to dBm (logarithmic units). Table 2- 1 and Table 2- 2
show units that are applicable to each measurement mode.
Press , . Select the unit of measurement from , , ,
and . Softkeys which cannot be selected in your particular mode of
operation are grayed out.
When the measurement unit is set to Watt (W), it is possible that negative power results
are displayed when measuring low power levels.
Ta b le 2 - 1 Measurement units - Single channel meters
Measurement Mode Relative Mode Off Relative Mode On
Log dBm dB
Linear Watt %
Ta b le 2 - 2 Measurement units - Dual channel meters
Measurement Mode Relative Mode Off Relative Mode On
Ratio Log dB dB
Linear % %
Difference Log dBm dB
Linear Watt %
28 N1913/1914A EPM Series Power Meters User’s Guide
Page 51

Setting the Measurement Frequency
MHz
GHz
Entering the frequency of the RF signal you are measuring optimizes the
accuracy and minimizes measurement uncertainty, especially when making
comparative measurements between signals.
Procedure
Set the measurement frequency as follows:
1 Press . On dual channel meters select the required channel.
2 Use the and keys to highlight the Frequency value field and
press
to display the Frequency pop- up. Use the numeric keypad to
enter the required value in the Frequency pop- up window.
General Power Meter Functions 2
Figure 2-1 Frequency pop-up
3 Confirm your choice by pressing or .
4 Press key to close the Channel Setup screen.
N1913/1914A EPM Series Power Meters User’s Guide 29
Page 52

2 General Power Meter Functions
Resolution
Resolution
Setting the Resolution
The resolution of each of the power meter’s numeric type windows can be
set to four different levels (1, 2, 3 or 4).
These four levels represent:
• 1, 0.1, 0.01, 0.001 dB respectively if the measurement suffix is dBm or
dB.
• 1, 2, 3 or 4 significant digits respectively if the measurement suffix is
W or %.
The default value is 0.01 dB (3 digits).
To set the resolution on the currently selected window:
1 Press . The current setting of the resolution is highlighted under
the
2 To change this setting, press repeatedly until the required
resolution setting is highlighted.
softkey.
30 N1913/1914A EPM Series Power Meters User’s Guide
Page 53

Making Relative Measurements
Meas Select
Relative
setting field
Relative field
Original result
Result field
Selected window/
measurement
Relative mode enables comparison of a measurement result to a reference
value. The relative reading, or difference, can be displayed in either dB or
% terms. When the measurement result is displayed in % a prefix
multiplier may be shown.
Procedure
1 Press to display the Measurement Setup menu.
Figure 2- 2 shows a Measurement Setup display and the relative
measurement items labeled.
2 Select the window you wish to set a reference value on by pressing the
key. The currently selected window/measurement is
displayed.
3 Use the and keys to highlight the Relative setting field.
General Power Meter Functions 2
Figure 2-2 Typical relative measurement display
4 Press to check the Relative setting field.
5 Confirm that the power meter is measuring the signal you want to use
as the reference. This is displayed under the Result field.
6 Press the , , key to highlight the Rel field.
N1913/1914A EPM Series Power Meters User’s Guide 31
Page 54

2 General Power Meter Functions
NOTE
Relative indicator
NOTE
7 Press and the original result value will appear on the right hand
side of the Rel check field.
8 The relative value displayed under Result field will change as the
measured signal varies.
If you return the power meter to display the numeric display, a Rel symbol will be displayed
in the measurement window it is applied to.
Figure 2-3 Numeric display
The Rel symbol is not displayed when the associated measurement is displayed in Dual
Numeric or Analog format.
32 N1913/1914A EPM Series Power Meters User’s Guide
Page 55

Setting Offsets
Channel Functions
Window Functions
Display
Relative
Offset
Channel A
Upper Window
Lower Window
Display
Relative
Offset
Display
Relative
Offset
Display
Relative
Offset
Measurement Highway
Freq Dep
Offset
Channel
Offset
Cal
Factor
Channel B
Freq Dep
Offset
Channel
Offset
Cal
Factor
Channel C
Freq Dep
Offset
Channel
Offset
Cal
Factor
Channel D
Freq Dep
Offset
Channel
Offset
Cal
Factor
The power meter can be configured to compensate for a signal loss or gain
in your test setup. The power meter allows you to apply offsets at three
different points in the measurement path.
General Power Meter Functions 2
N1913/1914A EPM Series Power Meters User’s Guide 33
Figure 2-4 Simplified measurement path
Page 56

2 General Power Meter Functions
Offsets
Offset value field
Offset setting field
Figure 2- 4 shows that how you can apply a Channel Offset or a
Frequency Dependent Offset prior to any mathematical functions. These
allow you to compensate each channel individually. An overall offset can
be applied if required using the Display Offset.
Setting Channel Offsets
This gain or loss is applied to the measured power before any
mathematical functions, display offsets or relative functions are included.
Offsets are entered in dB and the range is –100 dB to +100 dB.
The equivalent range in % is from 0.0000000001% to 10000000000%.
A positive value compensates for a loss and a negative value compensates
for a gain.
Procedure
To enter a channel offset:
34 N1913/1914A EPM Series Power Meters User’s Guide
1 Press to display the Channel Setup screen. Confirm the channel
requiring setup is displayed.
2 Press to display the Offsets Setup.
3 Use the and keys to highlight the Offset setting field.
4 Press to check the Offset setting field.
Figure 2-5 Typical channel offset display
5 Press to highlight the Offset value field and press to display
the Offset pop- up. Use the numeric keypad to enter the required value
in the Offset pop- up window.
Page 57

General Power Meter Functions 2
dB
Offset indicator
NOTE
Meas Select
6 Confirm your choice by pressing .
7 Press key to complete the offset entry. If either a channel or a
display offset is set, the Ofs indicator is displayed.
Figure 2-6 Channel offset indicator
The Ofs symbol is not displayed when the associated measurement is displayed in Dual
Numeric or Analog format.
Setting Display Offsets
This gain or loss is applied to the measured power after any channel
offsets or mathematical functions have been included.
Offsets are entered in dB and the range of values is –100 dB to +100 dB.
A positive value compensates for a loss, and a negative value compensates
for a gain.
Procedure
Enter a display offset on the currently selected window:
1 Press to display the Measurement Setup screen.
2 Select the window you wish to set the offset value on by pressing the
key. The currently selected window/measurement is
displayed.
3 Use the and keys to highlight the Offset setting field.
4 Press to check the Offset setting field.
N1913/1914A EPM Series Power Meters User’s Guide 35
Page 58

2 General Power Meter Functions
Selected window/
measurement
Offset value field
Offset setting field
dB
NOTE
Figure 2-7 Typical display offset display
5 Press to highlight the Offset value field and press to display
the Display Offset pop- up. Use the numeric keypad to enter the required
value in the Offset pop-up window.
6 Confirm your choice by pressing . Press key to complete the
offset entry.
36 N1913/1914A EPM Series Power Meters User’s Guide
The Ofs indicator is displayed if Display Offset is selected.
Page 59

General Power Meter Functions 2
Tables
Meter
Freq. Dep . Of fs et
Tables
Sensor ChC
Freq. Dep . Of fs et
Tables
Sensor ChD
Freq. Dep . Of fs et
Setting Frequency Dependent Offsets
Frequency dependent offset tables provide a quick and convenient method
of compensating for frequency related changes in the response of your test
system. Note that when selected, frequency dependent offset corrections
are applied IN ADDITION to any correction for sensor frequency response.
The power meter is capable of storing 10 frequency dependent offset
tables with a maximum of 80 frequency points each.
To use frequency dependent offset tables:
1 Select the table to be applied to a channel. Refer to “Setting Frequency
Dependent Offsets” on page 37 for further information. If you require to
edit the table refer to “Editing Frequency Dependent Offset Tables” on
page 40 for further information.
2 If an 8480 Series, N8480 Series, an E-Series, or an U2000 Series sensor
is used, zero and calibrate the power sensor. The reference calibration
factor used during the calibration is automatically set by the power
meter from the sensor calibration table (if selected).
3 Specify the frequency of the signal you want to measure. The
calibration factor/offset is automatically set by the power meter from
the sensor calibration table (if selected) and the frequency dependent
offset table. Refer to “Procedure” on page 38 for further information.
4 Make the measurement.
N1913/1914A EPM Series Power Meters User’s Guide 37
Selecting a Frequency Dependent Offset Table
You can select a frequency dependent offset table from the key
menu followed by , , and for Channel A or
Channel B.
For Channel C, you can select the frequency dependent offset table from
the key menu followed by , , and .
For Channel D, you can select the frequency dependent offset table from
the key menu followed by , , and .
Page 60

2 General Power Meter Functions
NOTE
Offsets
Tables
Freq. Dep. Offset
Offsets
The State column indicates if any frequency dependent offset tables are
currently selected. The Offset Tables screen is shown in Figure 2- 8.
You can also view which FDO table is being used by pressing the ,
and use the and keys to highlight the FDO Table setting field and press to
display the table.
Procedure
Select an offset table as follows:
1 Press, either:
a. , , .
b. , and use the and keys to highlight the
FDO Table setting field and press to display the table.
Figure 2-8 Frequency dependent offset tables display
38 N1913/1914A EPM Series Power Meters User’s Guide
Page 61

General Power Meter Functions 2
Table
A Table
B Table
On
NOTE
Table
Offset Table A Selected
NOTE
2 Use the and keys to highlight one of the 10 table titles and
press ( or for dual channel) to highlight .
When no data is contained in the highlighted table, the key is disabled (grayed out).
3 Press to complete the selection of the offset table.
4 Press again to display the measurement screen. Figure 2- 9
shows which offset table is selected.
Figure 2-9 Frequency dependent offset indicator
N1913/1914A EPM Series Power Meters User’s Guide 39
5 To change the frequency, press and use the and keys
to highlight the Frequency field.
6 Press to display the Frequency pop- up window. Use the numeric
keypad to enter the required value in the Frequency pop-up window.
7 To confirm your choice, press the appropriate unit softkey.
8 Connect the power sensor to the signal to be measured.
9 The measurement result, including offset, is now displayed.
If the measurement frequency does not correspond directly to a frequency in the sensor
calibration table (if selected) and the frequency dependent offset table being used, the
power meter calculates the calibration factor and offset using linear interpolation.
If you enter a frequency outside the frequency range defined in the sensor calibration table
or the frequency dependent offset table, the power meter uses the highest or lowest
frequency point in the appropriate table to set the calibration factor and offset.
Page 62

2 General Power Meter Functions
Tables
Freq. Dep. Offset
NOTE
Tables
Freq. Dep. Offset
Edit Table
Editing Frequency Dependent Offset Tables
There are ten frequency dependent offset tables named CUSTOM_A through
CUSTOM_J. They are empty of any data when the power meter is shipped
from the factory.
You cannot delete any of the 10 existing frequency dependent offset tables
or create any additional tables. However, you can enter values into the 10
existing tables. Each frequency dependent offset table can contain a
maximum of 80 frequency points.
To view the frequency dependent offset tables currently stored in the
power meter, press , , . The Frequency
Dependent Offset Tables screen is displayed as shown in Figure 2- 8.
Editing frequency dependent offset tables requires the following steps:
1 Identify and select the table you want to edit
2 Rename the table
3 Enter the frequency and offset pairs
4 Save the table
40 N1913/1914A EPM Series Power Meters User’s Guide
Procedure
First, select the table you want to edit as follows:
A frequency in the range of 0.001 MHz to 1000.0 GHz can be entered. A calibration factor in
the range of 0.0000000001 to 10000000000 can be entered.
1 Press , , to display the Offset Tbls screen.
2 Choose the table you want to edit using the and keys. Press
to display the Edit Offset screen as shown in Figure 2-10.
Page 63
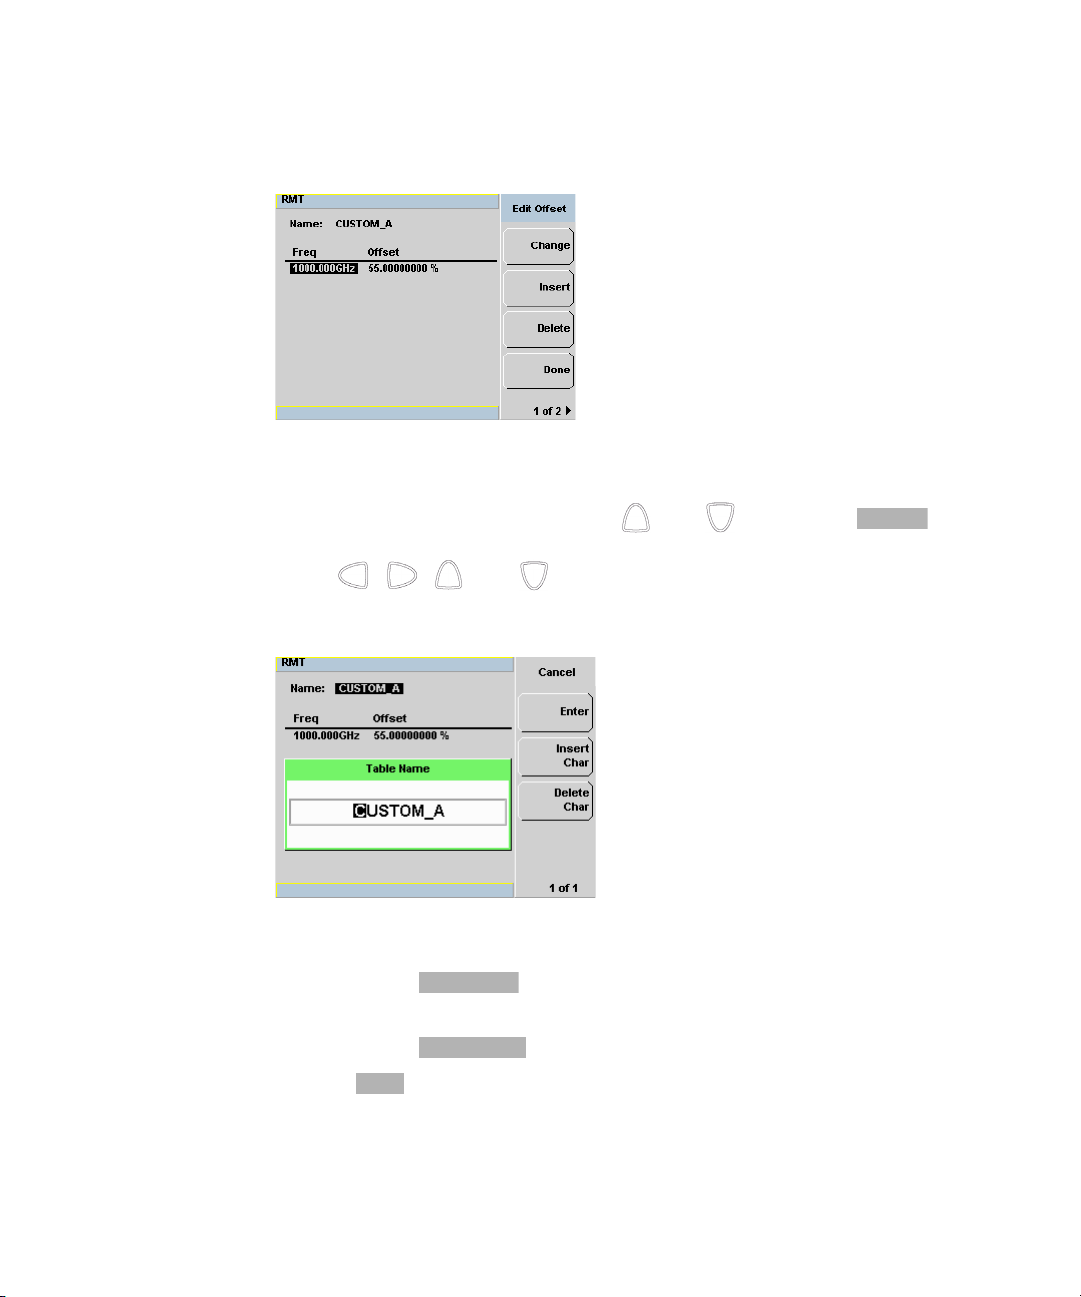
General Power Meter Functions 2
Change
Insert Char
Delete Char
Enter
Figure 2-10 “Edit Offset” display with data added
3 Highlight the table title using the and keys. Press and
use
the , , and keys to select and change the characters in
the Tab le N a me pop- up to create the name you want to use.
Figure 2-11 Edit table title pop-up
• Pressing adds a new character to the right of the
selected character.
• Pressing removes the selected character.
4 Press to complete the entry.
N1913/1914A EPM Series Power Meters User’s Guide 41
Page 64

2 General Power Meter Functions
NOTE
Insert
Change
GHz
MHz
Change
%
Done
The following rules apply to naming sensor calibration tables:
• The name must consist of no more than 12 characters.
• All characters must be upper or lower case alphabetic characters, or numeric (0-9), or
an underscore (_).
• No other characters are allowed.
• No spaces are allowed in the name.
Enter (or edit) the frequency and offset pairs as follows:
1 Press to add a new frequency value (or press to edit).
Use the numeric keypad to enter the required value in the Frequency
pop-up window. Complete the entry by pressing the , keys.
2 Enter the new offset value (or press to edit). Use the numeric
keypad to enter the required value in the Offset pop- up window.
Complete the entry by pressing the key.
Figure 2-12 Changing offset unit
3 Continue adding/editing values until you have entered all the data you
require.
4 When you have finished editing the table press to save the table.
42 N1913/1914A EPM Series Power Meters User’s Guide
Page 65

General Power Meter Functions 2
NOTE
1 of 2
Offset Unit
dB
1 of 2
Offset Unit
%
If you measure a signal with a frequency outside the frequency range defined in the
frequency dependent offset table, the power meter uses the highest or lowest frequency
point in the frequency dependent offset table to calculate the offset
Selectable Frequency Dependent Offset Unit (dB or %)
The offset in dB range is from –100 dB to +100 dB.
The equivalent range in % is from 0.0000000001% to 10000000000%.
Once the offset unit is selected, it will be applied to all the offsets in the
selected table and also to the remaining nine tables.
To change the offset unit to dB, press , , and .
To change the offset unit to %, press , , and .
N1913/1914A EPM Series Power Meters User’s Guide 43
Page 66

2 General Power Meter Functions
If the selected offset unit is %, the display of the offset will be in
engineering unit only if the percentage value is less than 0.01% or more
than 999%. The format of the display in engineering unit for an offset
greater than 999% will be shown as follows,
xxx. yyyyyyyyy e+z
• There is a maximum of three numbers before the decimal point
indicated by x.
• y is optional if there are non-zero numbers after the decimal point.
For example,
• 123478202 will be displayed as 123.478202 e+6
• 10000 will be displayed as 100 e+2.
The format of the display in engineering unit for an offset less than 0.01%
will be as follows,
x. yyyyyyyyy e-z
• The first leading non-zero number, x, is placed before the decimal
point.
• y is optional if there are non-zero numbers after the decimal point.
For example,
• 0.009876 will be displayed as 9.876 e- 3
• 0.0001 will be displayed as 1e- 4.
Figure 2-13 Offset display in engineering unit (when the selected unit is %)
44 N1913/1914A EPM Series Power Meters User’s Guide
Page 67

Setting Measurement Averaging
10 dB
10 dB
Minimum sensor power
Maximum sensor power
Power Sensor
Dynamic Range
10 dB
10 dB
1234
1 8 128 128
Resolution Setting
Number of Averages
1116256
11232
11116
1118
The power meter uses a digital filter to average power readings. The
number of readings averaged can range from 1 to 1024. This filter is used
to reduce noise, obtain the desired resolution and to reduce the jitter in
the measurement results. Increasing the value of the measurement average
reduces measurement noise. However, the measurement time is increased.
You can manually select the measurement average or you can set the
power meter to auto measurement average mode. The default is AUTO.
When the auto measurement average mode is enabled, the power meter
automatically sets the number of readings averaged together to satisfy the
filtering requirements for most power measurements. The number of
readings averaged together depends on the resolution setting and the
power level currently being measured.
General Power Meter Functions 2
Figure 2-14 Typical averaged readings
Figure 2- 14 shows the typical number of averages for each range and
N1913/1914A EPM Series Power Meters User’s Guide 45
resolution when the power meter is in auto filter mode and is set to
normal speed mode. N1913/1914A EPM Series power meters recognize
different sensor types when they are connected, and configure suitable
averaging automatically.
Page 68

2 General Power Meter Functions
Enter
Resolution is a measurement display function and not a channel function.
In the case where a channel is set up in both the upper and lower
window and the resolution settings are different, the highest resolution
setting is taken to calculate the averaging number.
These four resolution levels represent:
• 1, 0.1, 0.01, 0.001 dB respectively if the measurement suffix is dBm or
dB.
• 1, 2, 3 or 4 significant digits respectively if the measurement suffix is
Ω or %.
Procedure
Set measurement averaging as follows:
1 Press . On dual channel meters select the required channel. The
current setting is shown in the Meas Avg field (
the Channel Setup screen. The default is
2 Use the and keys to select the Filter setting field.
AUTO, MAN, or OFF) on
AUTO.
3 Press and use the and to step through the available
settings. If you have selected AUTO or OFF proceed at step 7. If you have
selected MAN proceed as follows.
4 Use the key to select the Meas Avg: value field.
5 Press to display the Meas Avg Count pop- up.
Figure 2-15 Meas Avg Count pop-up
6 Use the numeric keys to enter the required value and press .
7 Press key to close the Channel Setup screen.
46 N1913/1914A EPM Series Power Meters User’s Guide
Page 69

Step Detection
To reduce the filter settling time after a significant step in the measured
power the filter can be set to re- initialize upon detection of a step
increase or decrease in the measured power. Step detection can be set in
both manual and automatic measurement average modes.
Procedure
Set step detection as follows:
1 Press . On dual channel meters select the required channel.
2 Use the and keys to select the Step Detect setting field.
3 Press to check the step detection to on or off.
4 Press key to close the Channel Setup screen.
General Power Meter Functions 2
N1913/1914A EPM Series Power Meters User’s Guide 47
Page 70

2 General Power Meter Functions
NOTE
Setting External Trigger for Average Power Measurement
There are two modes featured in triggered average power measurement
• Power sweep mode
• Frequency sweep mode
These modes are used to eliminate the need for lengthy test routines,
while increasing measurement throughput by reducing overhead of
communication with the controller. The sweep feature allows you to make
power measurement by quickly stepping through a series of frequencies or
power levels. Configuration shown in Figure 2- 16 illustrates the triggering
connection required to synchronize power meter measurement to the
power source settings.
Trigger delay and trigger holdoff are both not applicable when the power meter is set to
power sweep mode or frequency sweep mode.
48 N1913/1914A EPM Series Power Meters User’s Guide
Page 71

General Power Meter Functions 2
NOTE
TRIG
IN
TRIG
IN
TRIG
OUT
TRIG
OUT
Power Meter
Power Source
Average Power Sensor
(optional connection)
Power Sweep Mode
Power sweep is generally used in power level calibration setup where the
frequency is fixed (CW frequency), and the amplitude of the power source
signal is swept. This mode can be used to characterize the flatness,
linearity or gain compression of a device under test.
This feature is only available when 8480 Series, N8480 Series, E-Series E4410, or E-Series
E9300 sensor is connected.
Procedures
1 Connect sensor to a power source.
2 Connect power meter TRIG OUT to power source TRIG IN using a
BNC cable. The same connection is applied for power source TRIG OUT
to power meter TRIG IN.
Figure 2-16 TRIG IN and TRIG OUT connection diagram between power meter and power
source.
3 Press . The Channel Setup screen displays as below.
N1913/1914A EPM Series Power Meters User’s Guide 49
Page 72

2 General Power Meter Functions
NOTE
Acqn
Sing Trig
Cont Trig
Sing Trig
Cont Trig
Settings
Figure 2-17 Channel Setup display
When 8480 Series, N8480 Series, E-Series E4410, E-Series E9300 or U2000 Series sensor is
connected, Sensor Mode is set to AVG only by default.
4 Press . The Trigger menu is displayed.
5 Press softkey to configure the trigger.
6 Select either or .
• is a single shot mode. After triggering, the measurement is
halted, and the symbol is displayed. You can start another
measurement by pressing the key.
• is a continuos trigger mode. The symbol or is
displayed.
7 Press to configure the remaining trigger parameters. The trigger
Settings menu consists of two pages. Figure 2-18 shows page 1 and
Figure 2- 19 shows page 2.
50 N1913/1914A EPM Series Power Meters User’s Guide
Page 73

Figure 2-18 Trigger setting menu 1 of 2
External trigger source
Source
Ext
1 of 2
Output
On
Slope
+
–
General Power Meter Functions 2
Figure 2-19 Trigger setting menu 2 of 2
8 Press and will be automatically enabled.
9 Press , and to allow a TTL level high to be produced
at the rear panel TRIG OUT BNC port when the meter is triggered upon a
completed measurement.
10 Press and select or to set the trigger edge.
11 Set the trigger buffer size by sending SENSE:BUFFer:COUNt
<buffer_size> command to meter using remote interface.
N1913/1914A EPM Series Power Meters User’s Guide 51
Page 74

2 General Power Meter Functions
NOTE
NOTE
Refer to the N1913/1914A EPM Series Power Meters Programming Guide for the
commands usage details.
Example of command set:
BUFF:COUN 100
The power meter can be remotely controlled by LAN, USB and GPIB (IEEE488)
programming interfaces. Refer to N1913/1914A EPM Series Power Meters Installation
Guide for details.
12 Press or to setup measurement setting such as
measurement averaging, measurement frequency, offsets, duty cycle and
so forth. Refer to “General Power Meter Functions” on page 27 for the
setup procedures.
13 Send *OPC (OPeration Complete) command to meter to set the
operation complete bit in the Standard Event Status register when all
pending device operations are completed.
14 Set the meter to continuous trigger mode by sending
INITiate:CONTinuous ON command to meter.
15 Configure and set the required power sweep range and step on the
power source accordingly.
16 Set the power source trigger input and trigger output, then start
sweeping.
17 Poll the status of the power meter by sending *ESR?. *ESR? will return
a 1 when buffering is completed. Use FETCh? to retrieve all the
buffered measurement.
52 N1913/1914A EPM Series Power Meters User’s Guide
Page 75

General Power Meter Functions 2
NOTE
NOTE
Acqn
Sing Trig
Cont Trig
Settings
Source
Ext
1 of 2
Output
On
Frequency Sweep Mode
Frequency sweep is generally used in a frequency response calibration
system where the amplitude is fixed, and the frequency of the power
source signal is swept. This mode can be used to determine the frequency
response of a device under test.
This feature is only available when N8480 Series, E-Series E4410, or E-Series E9300 sensor
is connected.
Procedures
1 Connect sensor to a power source.
2 Connect power meter TRIG OUT to power source TRIG IN using a
BNC cable. The same connection is applied for power source TRIG OUT
to power meter TRIG IN. See Figure 2- 16.
3 Press . The Channel Setup displays as shown in Figure 2-17.
When N8480 Series, E-Series E4410, E-Series E9300 or U2000 Series sensor is connected,
Sensor Mode is set to AVG only by default.
4 Press . The Trigger menu is displayed.
5 Press softkey to configure a trigger.
6 Select either or .
7 Press to configure the remaining trigger parameters. The trigger
Settings menu consists of two pages. Figure 2-18 shows page 1 and
Figure 2- 19 shows page 2.
8 Press and will be automatically enabled.
9 Press , and to allow a TTL level high to be produced
at the rear panel TRIG OUT BNC port when the meter is triggered upon a
completed measurement.
N1913/1914A EPM Series Power Meters User’s Guide 53
Page 76

2 General Power Meter Functions
NOTE
NOTE
10 Press or to setup measurement settings such as
measurement averaging, measurement frequency, offsets, duty cycle and
so forth. Refer to “General Power Meter Functions” on page 27 for the
setup procedures.
11 Set the frequency range and step by sending the below commands to
meter using remote interface.
• SENSe1:FREQuency:STARt
<start_frequency><frequency_unit>
• SENSe1:FREQuency:STOP <stop_frequency><frequency_unit>
• SENSe1:FREQuency:STEP <frequency_step_size>
Refer to the EPM Series Power Meters Programming Guide for the commands usage
details.
Example of commands set:
FREQ:STAR 10MHz
FREQ:STOP 500MHz
FREQ:STEP 10
The power meter can be remotely controlled by LAN, USB and GPIB (IEEE488)
programming interfaces. Refer to N1913/1914A EPM Series Power Meters Installation
Guide for details.
12 Send *OPC (OPeration Complete) command to meter; to set the
operation complete bit in the Standard Event Status register when all
pending device operations are completed.
13 Set the meter to continuous trigger cycles by sending
INITiate:CONTinuous ON command to meter.
14 Configure and set the required power sweep range and step of the
power source.
15 Set the power source trigger input and trigger output.
16 Set the power source to sweep.
54 N1913/1914A EPM Series Power Meters User’s Guide
Page 77

General Power Meter Functions 2
NOTE
17 Poll the status of the power meter by sending *ESR?. *ESR? will return
a 1 when buffering is completed. Use FETCh? to retrieve all the
buffered measurement.
In both power sweep and frequency sweep mode, the meter TRIG OUT to power source
TRIG IN connection is optional. You may choose to setup the Dwell time in the power
source step setting to cater the maximum settling time required by the power meter.
Determine the Right Step to be Set
Number of frequency step can be calculated by using equation below:
Step = (f
stop
– f
+ Interval)/Interval
start
where,
Step = Number of frequency step
f
= Frequency sweep’s start point
start
f
= Frequency sweep’s stop point
stop
Interval = Frequency step size
Example
When f
Step
Step
= 1 GHz and f
start
should be set to
= (f
stop
– f
start
+ Interval)/Interval
= 5 GHz with given interval of 0.5 GHz, the
stop
= (5 GHz – 1 GHz + 0.5 GHz)/0.5 GHz
= 9
N1913/1914A EPM Series Power Meters User’s Guide 55
Page 78

2 General Power Meter Functions
Power Meter
Swept Source
OUT
OUT
Device
Under Test
+4 dBm
+10 dBm
Amplitude
Frequency
o
o
o
o
o
o
o
Fail
Fail
Upper limit line
Lower limit line
Setting Measurement Limits
You can configure the power meter to detect when a measurement has
crossed over a predefined upper and/or lower limit value.
Limits are boundaries set for a certain power range and it can be applied
to power, ratio or difference measurement.
Figure 2-20 Limits checking applications
In this application a swept frequency signal is applied to the input of the
Device Under Test. The power meter measures the output power. The
limits have been set at +4 dBm and +10 dBm. A fail occurs each time the
output power is outside these limits as shown in Figure 2- 21.
56 N1913/1914A EPM Series Power Meters User’s Guide
Figure 2-21 Limits checking results
Page 79

General Power Meter Functions 2
NOTE
Meas Select
Setting Limits
The power meter can be configured to verify the current measurement in
any measurement line against predefined upper and/or lower limit values.
The range of values that can be set for the upper and lower limits and the
default values depends on the measurement units in the currently selected
measurement line (see Table 2- 3).
Ta b le 2 - 3 Range of values for window limits
Window
Units
dB +200 dB –180 dB 60 dB –120 dB
dBm +230 dBm –150 dBm 90 dBm –90 dBm
% 999.9 X% 100.0 a% 100.0 M% 100.0 p%
W 100.000 XW 1.000 aW 1.000 MW 1.000 pW
Maximum Minimum Default
Maximum
Default
Minimum
Procedure
Set the limits as follows:
Ensure you have selected the channel you wish to set up.
1 Press , to display the Measurement Setup menus.
2 Use the and keys to highlight the Limits: setting field.
3 Press to check the Limits: setting field.
4 Use the key to highlight the Minimum Limits: value field.
5 Press to display the Minimum Limit pop- up.
N1913/1914A EPM Series Power Meters User’s Guide 57
Page 80

2 General Power Meter Functions
dBm
dBm
NOTE
Figure 2-22 Minimum limit pop-up
6 Use the numeric keys to enter the required value and press .
7 Use the key to highlight the Maximum Limits: value field.
8 Press to display the Maximum Limit pop- up.
9 Use the numeric keys to enter the required value and press .
10 Press key to close the Measurement Setup screen.
The Limits can be disabled and re-enabled by checking the Limits: setting field.
58 N1913/1914A EPM Series Power Meters User’s Guide
Page 81

General Power Meter Functions 2
This measurement has failed as the
result is greater than the set limit level.
This measurement has failed as the
result is less than the set limit level.
Checking for Limit Failures
Limit failures are displayed in the appropriate field in the measurement
window on the power meter’s display as shown in Figure 2-23.
Figure 2-23 Limit failures
N1913/1914A EPM Series Power Meters User’s Guide 59
Page 82

2 General Power Meter Functions
Single Numeric
Dual Numeric
Meas Select
Selected Window/
Function Field
Measurement Field
Measurements
Channel Field
Numeric Format
Configure a measurement displayed in or
format as follows:
• Press , to select the measurement window or
measurement line you want to configure.
60 N1913/1914A EPM Series Power Meters User’s Guide
Figure 2-24 Measurement Setup showing single configuration
Page 83

Single Function Measurement
NOTE
Figure 2- 24 shows an average measurement assigned in the upper
measurement line of the upper window. (For single channel power meter,
N1913A, the Channel field will be disabled, as shown in Figure 2- 24).
The gate field is disabled if trigger acquisition is Free Run.
1 Use the , , , , to highlight the Combination function field.
2 Press to display the Function pop-up, and use the and
to highlight Single.
Figure 2-25 Function pop-up
General Power Meter Functions 2
3 Press to complete the entry.
4 The Meas field is set to Avg by default.
5 Press key to complete the setup and display the measurement
results.
N1913/1914A EPM Series Power Meters User’s Guide 61
Page 84

2 General Power Meter Functions
Selected window/
Function field
Gate fields
Measurement fields
Combination field
measurement
Channel fields
Combined Measurement
Figure 2- 26 shows a Combined Measurement configuration; Channel A and
Channel C to be displayed in the upper measurement line of the upper
display window. (For single channel power meter, N1913A, the Channel
field will be disabled, as shown in Figure 2- 26).
Figure 2-26 Measurement Setup showing combined configuration
62 N1913/1914A EPM Series Power Meters User’s Guide
1 Use the , , , , to highlight the Combination function field.
2 Press to display the Function pop- up (see Figure 2- 25) and use
the and to highlight Combined.
3 Press to complete the entry.
4 Press key to complete the setup and display the measurements
results.
Figure 2-27 Measurement example display
Page 85

Max Hold/Min Hold
SENSe1:
Input from
SENSe1
block
SENSe2:
Input from
SENSe2
block
(N1914A only)
:FEED
FEED1
FEED2
:MATH
“A” |”B”
“A- A”|“A / A “
“B-A”|“B/A“
“A- B ” |“A/ B “
“B-B”|“B/B“
A
B
:GAIN :HOLD
:REL
CALCulate Block
AVG
AVG
Max Hold/
Min Hold
The max hold/min hold setting on the measurement setup window can be
set on the front panel or via SCPI.
Min hold is the minimum of all measurements since the start time. The
min hold reading will be updated as new minimum reading appears.
Max hold is the maximum of all measurements since the start time. The
max reading will be updated as new maximum reading appears.
The max hold/min hold reading can be resetable by pressing the
key.
General Power Meter Functions 2
Figure 2-28 Max hold/min hold measurement is performed on the ‘HOLD’ block
N1913/1914A EPM Series Power Meters User’s Guide 63
Page 86

2 General Power Meter Functions
To set max hold/min hold,
1 Press to display the Measurement Setup menu.
2 Use the , , , , to highlight the Hold function field.
3 Press to display the Hold pop- up, and use the and to
highlight Min or Max (see Figure 2- 29).
Figure 2-29 Hold pop-up
4 Press to complete the entry.
5 Press key to complete the setup and display the measurements
results.
Figure 2-30 Min Hold and Max Hold measurement mode indicated in the display
64 N1913/1914A EPM Series Power Meters User’s Guide
Page 87

General Power Meter Functions 2
6 Press to display the measurement window in full screen mode.
The measurement mode will be indicated in full word in the expanded
window (see Figure 2- 31).
Figure 2-31 Measurement mode in full word
N1913/1914A EPM Series Power Meters User’s Guide 65
Page 88

2 General Power Meter Functions
Max Power
Min Power
NOTE
Meas Select
Recorder Output
The rear panel Recorder Output connectors (1 and 2) produce a dc
voltage that corresponds to the power level in Watts of the channel
depending on the measurement mode. This dc voltage ranges from 0 to
+1 Vdc. The output impedance is typically 1 kΩ. Channel and display
offsets, and duty cycle have no effect on the Recorder Outputs.
For example, the Recorder Outputs can be used to:
• Record swept measurements
• Level an output from a source using external leveling, or
• Monitor the output power
To access the Recorder menu press , and enable Rec o/p. This
allows you to switch the Recorder Output signal either on or off. The
and softkeys allow you to scale the power levels to
represent the 1 Vdc maximum and 0 Vdc minimum output voltage of the
Recorder Output.
Procedure
Set the recorder output as follows:
Ensure you have selected the channel you want to set up.
1 Press , to display the Measurement Setup menus.
2 Use the and keys to highlight the Rec o/p: setting field.
3 Press to reveal the Recorder option menu.
4 Use the and keys to highlight the option you require.
• The N1913A has only two options, On or Off.
66 N1913/1914A EPM Series Power Meters User’s Guide
Page 89

General Power Meter Functions 2
dBm
dBm
• The N1914A has three options: 1, 2, or Off.
5 Press .
6 Use the key to highlight the Recorder Minimum: value field.
7 Press to display the Recorder Minimum pop- up.
Figure 2-32 Recorder Minimum pop-up
8 Use the numeric keys to enter the power level you want to generate a 1
Vdc output in the Recorder Maximum pop-up and press .
9 Use the key to highlight the Recorder Maximum: value field.
10 Press to display the Recorder Maximum pop- up.
Figure 2-33 Recorder Maximum pop-up
11 Use the numeric keys to enter the power level you want to generate a 0
Vdc output in the Recorder Minimum pop- up and press .
12 Press key to close the Measurement Setup screen.
N1913/1914A EPM Series Power Meters User’s Guide 67
Page 90

2 General Power Meter Functions
NOTE
The recorder output can be disabled and re-enabled by checking the Rec o/p: setting field.
The highest power you are going to measure is used to determine the value which you
should set for the Recorder Output maximum setting. For example, if you are measuring a
power less than 1 mW and greater than 100 mW, then set the recorder maximum value to
1mW.
Ta b le 2 - 4 Ranges of recorder output setting
Log5040302010 0
Lin 100 W 10 W 1 W 100 mW 10 mW 1 mW
Log –10 –20 –30 –40 –50 –60
Lin 100 mW 10 mW 1 mW 100 nW 10 nW 1 nW
68 N1913/1914A EPM Series Power Meters User’s Guide
Page 91

Saving and Recalling Power Meter States
Save/Recall
Save
Confirm
To reduce repeated setup sequences, you can save a maximum of ten
power meter states in the non- volatile memory.
The save/recall functions are part of the Sys/Inputs menu, accessed by
pressing the key.
To save a measurement setup:
1 Press , to display the Save/Recall screen as shown in
Figure 2- 34.
General Power Meter Functions 2
Figure 2-34 Save/Recall screen
2 Using the and keys, select an available name from the
displayed list. To change the name of a register -See Chapter 2,
“Editing a Register’s Name,” starting on page 70, otherwise press .
3 The power meter prompts you to press to proceed.
Figure 2-35 Save confirm pop-up
N1913/1914A EPM Series Power Meters User’s Guide 69
Page 92

2 General Power Meter Functions
Save/Recall
Edit Name
Insert Char
Delete Char
Enter
Save/Recall
Recall
Recall
Confirm
Editing a Register’s Name
1 If you have not already done so, press , .
2 Use the and keys to select the required register and press
this as required:
Figure 2-36 File name pop-up
3 Use and keys to modify the character on which the cursor is
currently positioned.
4 Use or to move to other characters.
5 Use and as required.
6 To confirm your choice press .
. The selected name is displayed in a pop-up window. Modify
Recalling a Measurement Setup
1 Press , .
2 Use the and keys to select the required register and press
. The key is disabled (grayed out) when an unused register
is selected.
Figure 2-37 Recall pop-up
3 Press .
70 N1913/1914A EPM Series Power Meters User’s Guide
Page 93

Zeroing and Calibrating the Power Meter
Zero
NOTE
Zero
Zero A
Zero B
Zero Both
This section describes how to zero and calibrate the power meter. You
should always zero the power meter prior to calibrating it.
Zeroing the Power Meter
Zeroing adjusts the power meter for a zero power reading with no power
applied to the power sensor. During zeroing, which takes approximately 10
seconds, the wait symbol is displayed.
Figure 2-38 Zeroing pop-up
General Power Meter Functions 2
When to Zero?
Zeroing of the power meter is recommended:
o
•When a 5
•Every 24 hours.
• Prior to measuring low level signals. For example, 10 dB above the
lowest specified power for your power sensor.
C change in temperature occurs.
To zero the power meter:
• Press and the channel softkey.
•The Zeroing pop- up is displayed.
On dual channel meters you can zero each channel independently or both channels
sequentially by pressing the softkey - choosing , or
N1913/1914A EPM Series Power Meters User’s Guide 71
Page 94

2 General Power Meter Functions
1 of 2
Must Cal
Off On1 of 2
Must Cal
Off
On
Zero/Cal Lockout
The Zero/Cal Lockout facility provides a mean of ensuring that a
measurement cannot be taken until the connected sensor has been zeroed
and calibrated. If the Zero/Cal Lockout facility is enabled and a sensor is
connected which have not been zeroed and calibrated, then the display
window for the sensor will display the message Please Zero and Cal.
Figure 2-39 Please zero and calibrate window
When you zero the sensor, the message changes to
calibrate the sensor before zeroing it, the message changes to
Please Cal. If you
Please Zero.
Dual channel meters display channel specific messages when a sensor is
connected. The Zero/Cal Lockout configuration is applied to both channels
- it cannot be applied to one channel only.
You can enable and disable the Zero/Cal Lockout facility from the System
menu or the Cal menu as follow:
Press , , or .
Similarly,
press , , or .
72 N1913/1914A EPM Series Power Meters User’s Guide
Page 95

General Power Meter Functions 2
NOTE
Calibration
Calibration sets the gain of the power meter using a 50 MHz 1 mW
calibrator as a traceable power reference. The power meter’s POWER REF
output or a suitable external reference is used as the signal source for
calibration. An essential part of calibrating is setting the correct reference
calibration factor for the power sensor you are using. The N1913/1914A
EPM Series Power Meter User’s Guide require you to set the reference
calibration factor. The E- Series power sensors and N8480 Series power
sensors (excluding Option CFT) set the reference calibration factor
automatically. During calibration, the wait symbol is displayed. Offset,
relative, and duty cycle settings are ignored during calibration.
Figure 2-40 Calibration wait pop-up
During calibration, the power meter automatically switches the power reference calibrator
on (if it is not already on), then after calibration, it switches it to the state it was in prior to
the calibration.
N1913/1914A EPM Series Power Meters User’s Guide 73
Page 96

2 General Power Meter Functions
Cal
Calibration Procedure Using E-Series Power Sensors and N8480 Series Power Sensors (excluding Option CFT)
The following procedure describes how you calibrate the power meter with
an E- Series power sensor or N8480 Series power sensor (excluding
Option CFT). Since the power meter automatically downloads the ESeries power sensor or N8480 Series power sensor (excluding Option
CFT)’s calibration table, there is no requirement to enter the reference
calibration factor. The power meter identifies that an E- Series power
sensor or N8480 Series power sensor (excluding Option CFT) is connected
and will not allow you to select certain softkeys. The text on these
softkeys appears grayed out.
To calibrate:
1 Press .
2 Connect the power sensor to the POWER REF output.
3 Press the softkey to start the calibration routine. The Calibrating
pop- up is then displayed (the power meter automatically turns on the
POWER REF output).
74 N1913/1914A EPM Series Power Meters User’s Guide
Page 97

General Power Meter Functions 2
NOTE
Tables
Linearity
Atyp
Dtyp
2 of 3
Ref CFs
Ref CFs
Ref CFs
%
Cal
Calibration Procedure Using 8480 Series Power Sensors and N8480 Series Power Sensors (with Option CFT)
The following procedure describes how you calibrate the power meter with
the 8480 Series power sensors and N8480 Series power sensors with
Option CFT.
V8486A and W8486A sensors
For most 8480 Series sensors, the correct (A type or D type) linearity correction table is
automatically selected. However, for the V8486A and W8486A sensors, the automatic
selection must be overridden and the D type correction selected. Subsequent connection of
another A type sensor will result in a warning message stating that “Linearity Override May
be Required”.
To select the linearity type to be applied,
• Press , and to select either or .
There are a variety of methods to connect the power sensors to the power
meter depending on the model of power sensor you are using. Refer to
Table 2- 5 on page 76 for details on connecting different power sensor
models.
1 Press , and .
Verify the reference calibration factor of your power sensor with that
displayed under . The value shown is obtained from the sensor
calibration table (if one is selected), otherwise it is the last value set or
the default of 100%. If the value is incorrect, press . The
reference calibration factor pop- up window will be displayed. Use the
numeric keypad to enter the required value in the pop- up window.
2 Confirm your choice by pressing .
3 Press the to start the calibration routine. The Calibrating pop- up is
then displayed (the power meter automatically turns on the POWER
REF output).
N1913/1914A EPM Series Power Meters User’s Guide 75
Page 98

2 General Power Meter Functions
Ta b le 2 - 5 Power Sensor Connection Requirements
Sensor Model Connection Requirements
Agilent 8481A
Agilent 8481H
Agilent 8482A
Agilent 8482H
Agilent N8481A
Agilent N8482A
Agilent E4412A
Agilent E930xA
Agilent E930xH
Agilent E9304 H18
Agilent E9304 H19
Agilent 8481D
Agilent 8484A
Agilent 8483A This power sensor requires a 75 Ω (f) to 50 Ω (m) N-Type adapter
Agilent R8486A
Agilent Q8486A
Agilent V8486A
Agilent W8486A
Agilent R8486D
Agilent Q8486D
Agilent 8481B
Agilent 8482B
Agilent E930xB
Agilent 8485A
Agilent N8485A
Agilent E4413A
Agilent E9300A H24
Agilent E9300A H25
These power sensors connect directly to the reference calibrator.
Prior to the power meter being calibrated, an Agilent 11708A 30 dB
reference attenuator should be connected between the power sensor
and the reference calibrator. Remove this attenuator from the power
sensor input before making measurements.
(1250-0597) to connect to the reference calibrator. Remove this
adapter from the power sensor input before making measurements.
The waveguide power sensors have two connectors. The N-Type
connector is the one which is used to calibrate the power meter.
These power sensors are configured with an attenuator. Prior to the
power meter being calibrated, this attenuator must be removed. The
attenuator must be reconnected prior to making measurements.
This power sensor requires an APC 3.5 (f) to 50 Ω (m) N-Type adapter
(08485-60005) to connect to the reference calibrator. Remove this
adapter before making measurements.
76 N1913/1914A EPM Series Power Meters User’s Guide
Page 99

General Power Meter Functions 2
Sensor Model Connection Requirements
Agilent 8485D Prior to the power meter being zeroed and calibrated, an Agilent
11708A 30 dB reference attenuator and an APC 3.5 (f) to 50 Ω (m)
N-Type adapter (08485-60005) should be connected between the
power sensor and the reference calibrator. Remove this attenuator
from the power sensor input before making measurements.
Agilent 8487A This power sensor requires an APC 2.4 (f) to 50 Ω (m) N-Type adapter
(08487-60001) to connect to the power meter. Remove this attenuator
before making measurements.
Agilent 8487D Prior to the power meter being zeroed and calibrated, an Agilent
11708A 30 dB reference attenuator and an APC 2.4 (f) to 50 Ω (m)
N-Type adapter (08487-60001) should be connected between the
power sensor and the reference calibrator. Remove this attenuator
from the power sensor input before making measurements.
N1913/1914A EPM Series Power Meters User’s Guide 77
Page 100

2 General Power Meter Functions
1 of 2
Service
1 of 2
Display
Blank Screen
Blank Screen
The blank screen feature enables you to blank the whole display screen.
The feature ensures that the meter’s display is not shown to casual
observers.
To restore the display, press any buttons on the front panel.
To access this feature, press , and select . In the
Service menu, press and select . Press .
Figure 2-41 Blank screen
78 N1913/1914A EPM Series Power Meters User’s Guide
 Loading...