

Page 1

Caution
Do not exceed the operating input power, voltage, and current
level and signal type appropriate for the instrument being used, refer to
your instrument's Function Reference.
Electrostatic discharge(ESD) can damage the highly sensitive
microcircuits in your instrument. ESD damage is most likely to occur as
the test fixtures are being connected or disconnected. Protect them from
ESD damage by wearing a grounding strap that provides a high
resistance path to ground. Alternatively, ground yourself to discharge any
static charge built-up by touching the outer shell of any grounded
instrument chassis before touching the test port connectors.
Page 2

Safety Summary
When you notice any of the unusual conditions listed below, immediately
terminate operation and disconnect the power cable.
Contact your local Agilent Technologies sales representative or
authorized service company for repair of the instrument. If you continue
to operate without repairing the instrument, there is a potential fire or
shock hazard for the operator.
- Instrument operates abnormally.
- Instrument emits abnormal noise, smell, smoke or a spark-like
light during operation.
- Instrument generates high temperature or electrical shock
during operation.
- Power cable, plug, or receptacle on instrument is damaged.
- Foreign substance or liquid has fallen into the instrument.
Page 3

Herstellerbescheinigung
GERAUSCHEMISSION
LpA<70 dB
am Arbeitsplatz
normaler Betrieb
nach DIN 45635 T.19
Manufacturer's Declaration
ACOUSTIC NOISE EMISSION
LpA<70 dB
operator position
normal operation
per ISO 7779
Page 4

Regulatory compliance information
This product complies with the essential requirements of the following applicable European Directives, and
carries the CE marking accordingly:
The Low Voltage Directive 73/23/EEC, amended by 93/68/EEC
The EMC Directive 89/336/EEC, amended by 93/68/EEC
To obtain Declaration of Conformity, please contact your local Agilent Technologies sales office, agent or
distributor.
Page 5

Safety notice supplement
・ This equipment complies with EN/IEC61010-1:2001.
・ This equipment is MEASUREMENT CATEGORY I (CAT I). Do not use for CAT II, III, or IV.
・ Do not connect the measuring terminals to mains.
・ This equipment is POLLUTION DEGREE 2, INDOOR USE product.
・ This equipment is tested with stand-alone condition or with the combination with the accessories supplied
by Agilent Technologies against the requirement of the standards described in the Declaration of
Conformity. If it is used as a system component, compliance of related regulations and safety requirements
are to be confirmed by the builder of the system.
Page 6

Page 7

Agilent E5052A Signal Source Analyzer
User’s Guide
Seventh Edition
FIRMWARE REVISIONS
This manual applies directly to instruments that have the firmware revision A.02.5x.
For additional information about firmware revisions, see Appendix A.
Manufacturing No. E5052-90060
November 2007
Page 8

Notices
The information contained in this document is subject to change without notice.
This document contains proprietary information that is protected by copyright. All rights
are reserved. No part of this document may be photocopied, reproduced, or translated to
another language without the prior written consent of Agilent Technologies.
Microsoft®,MS-DOS®,Windows®,Visual C++®,Visual Basic®,VBA® and Excel® are
registered
UNIX is a registered trademark in U.S. and other countries, licensed
exclusively through X/Open Company Limited.
Portions ©Copyright 1996, Microsoft Corporation. All rights reserved.
© Copyright 2004, 2005, 2006, 2007 Agilent Technologies
Manual Printing History
The manual’s printing date and part number indicate its current edition. The printing date
changes when a new edition is printed (minor corrections and updates that are incorporated
at reprint do not cause the date to change). The manual part number changes when
extensive technical changes are incorporated.
August 2004 First Edition (part number: E5052-90000)
October 2004 Second Edition (part number: E5052-90010, changes for firmeware
version A.01.10)
February 2005 Third Edition (part number: E5052-90020, changes for firmeware
version A.01.50)
August 2005 Fourth Edition (part number: E5052-90030, changes for firmeware
version A.02.00)
June 2006 Fifth Edition (part number: E5052-90040, changes for firmeware
version A.02.50)
June 2007 Sixth Edition (part number: E5052-90050)
November 2007 Seventh Edition (part number: E5052-90060)
2
Page 9

Safety Summary
The following general safety precautions must be observed during all phases of operation,
service, and repair of this instrument. Failure to comply with these precautions or with
specific WARNINGS elsewhere in this manual may impair the protection provided by the
equipment. Such noncompliance would also violate safety standards of design,
manufacture, and intended use of the instrument. Agilent Technologies assumes no liability
for the customer’s failure to comply with these precautions.
NOTE The E5052A complies with INSTALLATION CATEGORY II as well as POLLUTION
DEGREE 2 in IEC61010-1. The E5052A is an INDOOR USE product.
NOTE The LEDs in the E5052A are Class 1 in accordance with IEC60825-1,
CLASS 1 LED PRODUCT
NOTE This equipment is MEASUREMENT CATEGORY I (CAT I). Do not use for CA T II, III, or
IV.
NOTE This equipment is tested with stand-alone condition or with the combination with the
accessories supplied by Agilent Technologies against the requirement of the standards
described in the Declaration of Conformity. If it is used as a system component,
compliance of related regulations and safety requirements are to be confirmed by the
builder of the system.
• Ground the Instrument
To avoid electric shock, the instrument chassis and cabinet must be grounded with the
supplied power cable’s grounding prong.
• DO NOT Operate in an Explosive Atmosphere
Do not operate the instrument in the presence of inflammable gasses or fumes.
Operation of any electrical instrument in such an environment clearly constitutes a
safety hazard.
• Keep Away from Live Circuits
Operators must not remove instrument covers. Component replacement and internal
adjustments must be made by qualified maintenance personnel. Do not replace
components with the power cable connected. Under certain conditions, dangerous
voltage levels may remain even after the power cable has been disconnected. To avoid
injuries, always disconnect the power and discharge circuits before touching them.
• DO NOT Service or Adjust the Instrument Alone
Do not attempt internal service or adjustment unless another person, capable of
rendering first aid and resuscitation, is present.
• DO NOT Substitute Parts or Modify the Instrument
To avoid the danger of introducing additional hazards, do not install substitute parts or
perform unauthorized modifications to the instrument. Return the instrument to an
Agilent Technologies Sales and Service Office for service and repair to ensure that
3
Page 10

safety features are maintained in operational condition.
• Dangerous Procedure Warnings
Warnings, such as the example below, precede potentially dangerous procedures
throughout this manual. Instructions contained in the warnings must be followed.
WARNING Dangerous voltage levels, capable of causing death, are present in this instrument.
Use extreme caution when handling, testing, and adjusting this instrument.
• Do not connect the measuring terminals to mains.
Safety Symbols
General definitions of safety symbols used on the instrument or in manuals are listed
below.
Instruction Manual symbol: the product is marked with this symbol when it is necessary for
the user to refer to the instrument manual.
Alternating current.
Direct current.
On (Supply).
Off (Supply).
In-position of push-button switch.
Out-position of push-button switch.
A chassis terminal; a connection to the instrument’s chassis, which includes all exposed
metal structure.
Stand-by.
WARNING This warning sign denotes a hazard. It calls attention to a procedure, practice, or
condition that, if not correctly performed or adhered to, could result in injury or
death to personnel.
CAUTION This Caution sign denotes a hazard. It calls attention to a procedure, practice, or condition
that, if not correctly performed or adhered to, could result in damage to or destruction of
part or all of the instrument.
NOTE This Note sign denotes important information. It calls attention to a procedure, practice, or
condition that is essential for the user to understand.
4
Page 11

Certification
Agilent Technologies certifies that this product met its published specifications at the time
of shipment from the factory. Agilent Technologies further certifies that its calibration
measurements are traceable to the United States National Institute of Standards and
Technology, to the extent allowed by the Institution’s calibration facility or by the
calibration facilities of other International Standards Organization members.
Documentation Warranty
The material contained in this document is provided "as is," and is subject to being
changed, without notice, in future editions. Further, to the maximum extent permitted by
applicable law, Agilent disclaims all warranties, either express or implied with regard to
this manual and any information contained herein, including but not limited to the implied
warranties of merchantability and fitness for a particular purpose. Agilent shall not be
liable for errors or for incidental or consequential damages in connection with the
furnishing, use, or performance of this document or any information contained herei n.
Should Agilent and the user have a separate written agreement with warranty terms
covering the material in this document that conflict with these terms, the warranty terms in
the separate agreement will control.
Exclusive Remedies
The remedies provided herein are Buyer’s sole and exclusive remedies. Agilent
T echnologies shall not be liable for any direct, indirect, special, incidental, or
consequential damages, whether based on contract, tort, or any other legal theory.
Assistance
Product maintenance agreements and other customer assistance agreements are available
for Agilent Technologies products.
For any assistance, contact your nearest Agilent Technologies Sales and Service Office.
Addresses are provided at the back of this manual.
5
Page 12

Typeface Conventions
Sample (bold) Boldface type is used when a term is defined or
emphasis.
Sample (Italic) Italic type is used for emphasis.
key Indicates a hardkey (key on the front panel or
external keyboard) labeled “Sample.” “key” may
be omitted.
Sample menu/button/box Indicates a menu/button/box on the screen labeled
“Sample” which can be selected/executed by
clicking. “menu,” “button,” or “box” may be
omitted.
Sample block/toolbar Indicates a block (group of hardkeys) or a toolbar
(setup toolbar) labeled “Sample.”
Sample 1 - Sample 2 - Sample 3 Indicates a sequential operation of Sample 1,
Sample 2, and Sample 3 (menu, button, or box).
“-” may be omitted.
6
Page 13

Documentation Map
The following manuals are available for the Agilent E5052A.
• User’s Guide (Part Number E5052-900x0, attached to Option ABA)
This manual describes most of the basic information needed to use the E5052A. It
provides a function overview, detailed operation procedure for each function (from
preparation for measurement to analysis of measurement results), measurement
examples, specifications, and supplemental information. For programming guidance on
performing automatic measurement with the E5052A, please see the Programming
Manual.
• Programmer’s Guide (Part Number E5052-900x1, attached to Option ABA)
This manual provides programming information for performing automatic
measurement with the E5052A. It includes an outline of remote control, procedures for
detecting measurement start (trigger) and end (sweep end), application programming
examples, a command reference, and related information.
• VBA Programmer’s Guide (Part Number E5052-900x2, attached to Option ABA)
This manual describes programming information for performing automatic
measurement with internal controller. It includes an outline of VBA programming,
some sample programming examples, a COM object reference, and related
information.
NOTE The number position shown by “x” in the part numbers above indicates the edition number.
VBA Macro
The Agilent folder (D:\Agilent) on the hard disk of the E5052A contains the VBA macros
(VBA Projects) used in this manual.
The customer shall have the personal, non-transferable rights to use, copy, or modify the
VBA macros for the customer’s internal operations.
The customer shall use the VBA macros solely and exclusively for their own purposes and
shall not license, lease, market, or distribute the VBA macros or modification of any part
thereof.
Agilent Technologies shall not be liable for any infringement of any patent, trademark,
copyright, or other proprietary right by the VBA macros or their use. Agilent Technologies
does not warrant that the VBA macros are free from infringements of such rights of third
parties. However, Agilent Technologies will not knowingly infringe or deliver software
that infringes the patent, trademark, copyright, or other proprietary right of a third party.
7
Page 14

8
Page 15

1. Precautions
Software Installed . . . . . . . . . . . . . . . . . . . . . . . . . . . . . . . . . . . . . . . . . . . . . . . . . . . . . . . . . . . . . . . . . . . . . 18
Before contacting us . . . . . . . . . . . . . . . . . . . . . . . . . . . . . . . . . . . . . . . . . . . . . . . . . . . . . . . . . . . . . . . . . . . 19
2. Overview of Functions
Front Panel: Names and Functions of Parts . . . . . . . . . . . . . . . . . . . . . . . . . . . . . . . . . . . . . . . . . . . . . . . . . 22
1. Standby Switch . . . . . . . . . . . . . . . . . . . . . . . . . . . . . . . . . . . . . . . . . . . . . . . . . . . . . . . . . . . . . . . . . . . 23
2. LCD Screen. . . . . . . . . . . . . . . . . . . . . . . . . . . . . . . . . . . . . . . . . . . . . . . . . . . . . . . . . . . . . . . . . . . . . . 23
3. WINDOW/TRACE Block. . . . . . . . . . . . . . . . . . . . . . . . . . . . . . . . . . . . . . . . . . . . . . . . . . . . . . . . . . . 24
4. MEASUREMENT Block . . . . . . . . . . . . . . . . . . . . . . . . . . . . . . . . . . . . . . . . . . . . . . . . . . . . . . . . . . . 25
5. CONTROL Block . . . . . . . . . . . . . . . . . . . . . . . . . . . . . . . . . . . . . . . . . . . . . . . . . . . . . . . . . . . . . . . . . 26
6. Floppy Disk Drive. . . . . . . . . . . . . . . . . . . . . . . . . . . . . . . . . . . . . . . . . . . . . . . . . . . . . . . . . . . . . . . . . 27
7. NAVIGATION Block . . . . . . . . . . . . . . . . . . . . . . . . . . . . . . . . . . . . . . . . . . . . . . . . . . . . . . . . . . . . . . 28
8. ENTRY Block. . . . . . . . . . . . . . . . . . . . . . . . . . . . . . . . . . . . . . . . . . . . . . . . . . . . . . . . . . . . . . . . . . . . 30
9. INSTR STATE Block . . . . . . . . . . . . . . . . . . . . . . . . . . . . . . . . . . . . . . . . . . . . . . . . . . . . . . . . . . . . . . 31
10. MKR/ANALYSIS Block. . . . . . . . . . . . . . . . . . . . . . . . . . . . . . . . . . . . . . . . . . . . . . . . . . . . . . . . . . . 32
11. DUT Interface . . . . . . . . . . . . . . . . . . . . . . . . . . . . . . . . . . . . . . . . . . . . . . . . . . . . . . . . . . . . . . . . . . . 32
12. OPTIONAL RF Ports . . . . . . . . . . . . . . . . . . . . . . . . . . . . . . . . . . . . . . . . . . . . . . . . . . . . . . . . . . . . . 33
LCD Screen: Names and Functions of Parts . . . . . . . . . . . . . . . . . . . . . . . . . . . . . . . . . . . . . . . . . . . . . . . . 34
1. Data Entry Bar. . . . . . . . . . . . . . . . . . . . . . . . . . . . . . . . . . . . . . . . . . . . . . . . . . . . . . . . . . . . . . . . . . . . 35
2. Softkey Menu Bar . . . . . . . . . . . . . . . . . . . . . . . . . . . . . . . . . . . . . . . . . . . . . . . . . . . . . . . . . . . . . . . . . 36
3. Instrument Status Bar . . . . . . . . . . . . . . . . . . . . . . . . . . . . . . . . . . . . . . . . . . . . . . . . . . . . . . . . . . . . . . 38
4. Measurement Window . . . . . . . . . . . . . . . . . . . . . . . . . . . . . . . . . . . . . . . . . . . . . . . . . . . . . . . . . . . . . 41
Rear Panel: Names and Functions of Parts. . . . . . . . . . . . . . . . . . . . . . . . . . . . . . . . . . . . . . . . . . . . . . . . . . 46
1. 24-bit I/O Port . . . . . . . . . . . . . . . . . . . . . . . . . . . . . . . . . . . . . . . . . . . . . . . . . . . . . . . . . . . . . . . . . . . . 47
2. LAN Port. . . . . . . . . . . . . . . . . . . . . . . . . . . . . . . . . . . . . . . . . . . . . . . . . . . . . . . . . . . . . . . . . . . . . . . . 47
3. External Monitor Output Terminal (Video). . . . . . . . . . . . . . . . . . . . . . . . . . . . . . . . . . . . . . . . . . . . . . 47
4. GPIB Connector . . . . . . . . . . . . . . . . . . . . . . . . . . . . . . . . . . . . . . . . . . . . . . . . . . . . . . . . . . . . . . . . . . 47
5. External Trigger Input Connector (Ext Trig) . . . . . . . . . . . . . . . . . . . . . . . . . . . . . . . . . . . . . . . . . . . . 47
6. Fan. . . . . . . . . . . . . . . . . . . . . . . . . . . . . . . . . . . . . . . . . . . . . . . . . . . . . . . . . . . . . . . . . . . . . . . . . . . . . 47
7. Line Switch (Always ON). . . . . . . . . . . . . . . . . . . . . . . . . . . . . . . . . . . . . . . . . . . . . . . . . . . . . . . . . . . 47
8. Power Cable Receptacle (to LINE). . . . . . . . . . . . . . . . . . . . . . . . . . . . . . . . . . . . . . . . . . . . . . . . . . . . 48
9. High Stability Frequency Reference Output Connector (Ref Oven) . . . . . . . . . . . . . . . . . . . . . . . . . . 48
10. External Reference Signal Input Connector (Ref In) . . . . . . . . . . . . . . . . . . . . . . . . . . . . . . . . . . . . . 48
11. Internal Reference Signal Output Connector (Ref Out) . . . . . . . . . . . . . . . . . . . . . . . . . . . . . . . . . . . 48
12. Serial Number Plate . . . . . . . . . . . . . . . . . . . . . . . . . . . . . . . . . . . . . . . . . . . . . . . . . . . . . . . . . . . . . . 48
13. Certificate of Authenticity Label. . . . . . . . . . . . . . . . . . . . . . . . . . . . . . . . . . . . . . . . . . . . . . . . . . . . . 49
14. Rear USB port. . . . . . . . . . . . . . . . . . . . . . . . . . . . . . . . . . . . . . . . . . . . . . . . . . . . . . . . . . . . . . . . . . . 49
15. Reserved Port (Reserved) . . . . . . . . . . . . . . . . . . . . . . . . . . . . . . . . . . . . . . . . . . . . . . . . . . . . . . . . . . 49
16. Printer Parallel Port. . . . . . . . . . . . . . . . . . . . . . . . . . . . . . . . . . . . . . . . . . . . . . . . . . . . . . . . . . . . . . . 49
17. Mini-DIN Keyboard Port . . . . . . . . . . . . . . . . . . . . . . . . . . . . . . . . . . . . . . . . . . . . . . . . . . . . . . . . . . 49
18. Mini-DIN Mouse Port. . . . . . . . . . . . . . . . . . . . . . . . . . . . . . . . . . . . . . . . . . . . . . . . . . . . . . . . . . . . . 49
19. USB (USBTMC) Interface Port . . . . . . . . . . . . . . . . . . . . . . . . . . . . . . . . . . . . . . . . . . . . . . . . . . . . . 49
Contents
3. Installation
Checking the Shipment. . . . . . . . . . . . . . . . . . . . . . . . . . . . . . . . . . . . . . . . . . . . . . . . . . . . . . . . . . . . . . . . . 53
Environmental Requirements . . . . . . . . . . . . . . . . . . . . . . . . . . . . . . . . . . . . . . . . . . . . . . . . . . . . . . . . . . . . 56
Operating environment . . . . . . . . . . . . . . . . . . . . . . . . . . . . . . . . . . . . . . . . . . . . . . . . . . . . . . . . . . . . . . . 56
9
Page 16

Contents
Ventilation requirements . . . . . . . . . . . . . . . . . . . . . . . . . . . . . . . . . . . . . . . . . . . . . . . . . . . . . . . . . . . . . . 57
Protection against electrostatic discharge (ESD) . . . . . . . . . . . . . . . . . . . . . . . . . . . . . . . . . . . . . . . . . . . 58
Ensuring adequate free space around analyzer for immediate disconnection of power cable in case of emergency
58
Installing Front Handles/Rack Mounting Flanges . . . . . . . . . . . . . . . . . . . . . . . . . . . . . . . . . . . . . . . . . . . . 59
How to install the handle kit (Option 1CN) . . . . . . . . . . . . . . . . . . . . . . . . . . . . . . . . . . . . . . . . . . . . . . . 60
How to install the rack-mount kit (Option 1CM) . . . . . . . . . . . . . . . . . . . . . . . . . . . . . . . . . . . . . . . . . . . 61
How to install the rack-mount and handle kit (Option 1CP) . . . . . . . . . . . . . . . . . . . . . . . . . . . . . . . . . . 61
Connecting the Accessories . . . . . . . . . . . . . . . . . . . . . . . . . . . . . . . . . . . . . . . . . . . . . . . . . . . . . . . . . . . . . 62
Connecting the mouse and keyboard . . . . . . . . . . . . . . . . . . . . . . . . . . . . . . . . . . . . . . . . . . . . . . . . . . . . 62
Connecting a LAN cable. . . . . . . . . . . . . . . . . . . . . . . . . . . . . . . . . . . . . . . . . . . . . . . . . . . . . . . . . . . . . . 63
Connecting a printer . . . . . . . . . . . . . . . . . . . . . . . . . . . . . . . . . . . . . . . . . . . . . . . . . . . . . . . . . . . . . . . . . 64
Power Supply and Blown Fuses. . . . . . . . . . . . . . . . . . . . . . . . . . . . . . . . . . . . . . . . . . . . . . . . . . . . . . . . . . 65
Veri fication of the power supply. . . . . . . . . . . . . . . . . . . . . . . . . . . . . . . . . . . . . . . . . . . . . . . . . . . . . . . . 65
Verification and connection of power cable . . . . . . . . . . . . . . . . . . . . . . . . . . . . . . . . . . . . . . . . . . . . . . . 65
Blown fuses. . . . . . . . . . . . . . . . . . . . . . . . . . . . . . . . . . . . . . . . . . . . . . . . . . . . . . . . . . . . . . . . . . . . . . . . 67
Starting the E5052A. . . . . . . . . . . . . . . . . . . . . . . . . . . . . . . . . . . . . . . . . . . . . . . . . . . . . . . . . . . . . . . . . . . 68
Turning the Power ON and OFF. . . . . . . . . . . . . . . . . . . . . . . . . . . . . . . . . . . . . . . . . . . . . . . . . . . . . . . . 68
Disconnection from supply source . . . . . . . . . . . . . . . . . . . . . . . . . . . . . . . . . . . . . . . . . . . . . . . . . . . . . . 69
Initial Registration of E5052A . . . . . . . . . . . . . . . . . . . . . . . . . . . . . . . . . . . . . . . . . . . . . . . . . . . . . . . . . . . 70
Setting the Internal Clock. . . . . . . . . . . . . . . . . . . . . . . . . . . . . . . . . . . . . . . . . . . . . . . . . . . . . . . . . . . . . . . 73
Setting the Date/Time. . . . . . . . . . . . . . . . . . . . . . . . . . . . . . . . . . . . . . . . . . . . . . . . . . . . . . . . . . . . . . . . 73
Turning the Date/Time display ON and OFF . . . . . . . . . . . . . . . . . . . . . . . . . . . . . . . . . . . . . . . . . . . . . . 74
Daily Maintenance . . . . . . . . . . . . . . . . . . . . . . . . . . . . . . . . . . . . . . . . . . . . . . . . . . . . . . . . . . . . . . . . . . . . 75
Cleaning method. . . . . . . . . . . . . . . . . . . . . . . . . . . . . . . . . . . . . . . . . . . . . . . . . . . . . . . . . . . . . . . . . . . . 75
Maintaining connectors/ports on test port (DUT interface) . . . . . . . . . . . . . . . . . . . . . . . . . . . . . . . . . . . 75
Self-test When Turning on the Power. . . . . . . . . . . . . . . . . . . . . . . . . . . . . . . . . . . . . . . . . . . . . . . . . . . . 75
Considerations When Shipping to a Service Center Due to Breakdown or Other Problems. . . . . . . . . . 76
4. Basic Measurement Using E5052A
Frequency/Power Measurement in Frequency/Power Measurement Mode. . . . . . . . . . . . . . . . . . . . . . . . . 78
Overview of frequency/power measurement . . . . . . . . . . . . . . . . . . . . . . . . . . . . . . . . . . . . . . . . . . . . . . 78
About analyzer mode and tester mode . . . . . . . . . . . . . . . . . . . . . . . . . . . . . . . . . . . . . . . . . . . . . . . . . . . 78
Setting Trace Layout. . . . . . . . . . . . . . . . . . . . . . . . . . . . . . . . . . . . . . . . . . . . . . . . . . . . . . . . . . . . . . . . . 79
Common settings in RF power, frequency and power supply DC current measurement. . . . . . . . . . . . . 81
Setting DC power/DC control and protection. . . . . . . . . . . . . . . . . . . . . . . . . . . . . . . . . . . . . . . . . . . . . . 86
Auto Frequency Control Function . . . . . . . . . . . . . . . . . . . . . . . . . . . . . . . . . . . . . . . . . . . . . . . . . . . . . . 88
About DC control voltage delay, DC power delay and point delay . . . . . . . . . . . . . . . . . . . . . . . . . . . . . 91
Confirming Result of Frequency Measurement . . . . . . . . . . . . . . . . . . . . . . . . . . . . . . . . . . . . . . . . . . . . 94
Confirming Result of RF Power Measurement . . . . . . . . . . . . . . . . . . . . . . . . . . . . . . . . . . . . . . . . . . . . 98
Confirming Result of Power Supply DC Current Measurement . . . . . . . . . . . . . . . . . . . . . . . . . . . . . . 102
Phase Noise Measurement in Phase Noise Measurement Mode . . . . . . . . . . . . . . . . . . . . . . . . . . . . . . . . 106
Overview of Phase Noise Measurement. . . . . . . . . . . . . . . . . . . . . . . . . . . . . . . . . . . . . . . . . . . . . . . . . 106
Setting Phase Noise Measurement . . . . . . . . . . . . . . . . . . . . . . . . . . . . . . . . . . . . . . . . . . . . . . . . . . . . . 106
Confirming Result of Phase Noise Measurement. . . . . . . . . . . . . . . . . . . . . . . . . . . . . . . . . . . . . . . . . . 112
Spectrum Monitor Measurement in Spectrum Monitor Measurement Mode . . . . . . . . . . . . . . . . . . . . . . 119
Overview of Spectrum Monitor Measurement. . . . . . . . . . . . . . . . . . . . . . . . . . . . . . . . . . . . . . . . . . . .
Setting Spectrum Monitor Measurement . . . . . . . . . . . . . . . . . . . . . . . . . . . . . . . . . . . . . . . . . . . . . . . . 119
Setting Averaging Trigger. . . . . . . . . . . . . . . . . . . . . . . . . . . . . . . . . . . . . . . . . . . . . . . . . . . . . . . . . . . . 123
10
119
Page 17

Contents
Confirming Result of Spectrum Monitor Measurement . . . . . . . . . . . . . . . . . . . . . . . . . . . . . . . . . . . . . 124
Transient Measurement in Transient Measurement Mode . . . . . . . . . . . . . . . . . . . . . . . . . . . . . . . . . . . . . 129
Overview of transient measurement . . . . . . . . . . . . . . . . . . . . . . . . . . . . . . . . . . . . . . . . . . . . . . . . . . . . 129
Common Settings for Transient Measurement . . . . . . . . . . . . . . . . . . . . . . . . . . . . . . . . . . . . . . . . . . . . 129
Setting Video Trigger . . . . . . . . . . . . . . . . . . . . . . . . . . . . . . . . . . . . . . . . . . . . . . . . . . . . . . . . . . . . . . . 135
Setting External Trigger . . . . . . . . . . . . . . . . . . . . . . . . . . . . . . . . . . . . . . . . . . . . . . . . . . . . . . . . . . . . . 137
Confirming the result of frequency transient (Wide Band) measurement . . . . . . . . . . . . . . . . . . . . . . . 138
Confirming Result of Frequency Transient (Narrow Band) Measurement. . . . . . . . . . . . . . . . . . . . . . . 142
Confirming Result of Power Transient Measurement. . . . . . . . . . . . . . . . . . . . . . . . . . . . . . . . . . . . . . . 146
Confirming the phase transient measurement. . . . . . . . . . . . . . . . . . . . . . . . . . . . . . . . . . . . . . . . . . . . . 149
User Calibration . . . . . . . . . . . . . . . . . . . . . . . . . . . . . . . . . . . . . . . . . . . . . . . . . . . . . . . . . . . . . . . . . . . . . 155
Overview of User Calibration. . . . . . . . . . . . . . . . . . . . . . . . . . . . . . . . . . . . . . . . . . . . . . . . . . . . . . . . . 155
Setting User Calibration Function. . . . . . . . . . . . . . . . . . . . . . . . . . . . . . . . . . . . . . . . . . . . . . . . . . . . . . 155
Format of the correction data file . . . . . . . . . . . . . . . . . . . . . . . . . . . . . . . . . . . . . . . . . . . . . . . . . . . . . . 155
Correction Method . . . . . . . . . . . . . . . . . . . . . . . . . . . . . . . . . . . . . . . . . . . . . . . . . . . . . . . . . . . . . . . . . 157
5. Measurement Using E5053A and External Mixer
E5053A Microwave Downconverter . . . . . . . . . . . . . . . . . . . . . . . . . . . . . . . . . . . . . . . . . . . . . . . . . . . . . 160
Connection of E5052A and E5053A. . . . . . . . . . . . . . . . . . . . . . . . . . . . . . . . . . . . . . . . . . . . . . . . . . . . 160
Device Configuration Using E5052A and E5053A Microwave Downconverter . . . . . . . . . . . . . . . . . . 164
Setting E5053A Microwave Downconverter . . . . . . . . . . . . . . . . . . . . . . . . . . . . . . . . . . . . . . . . . . . . . 167
Effects of Setting of Downconverter and Input Port for RF Signals. . . . . . . . . . . . . . . . . . . . . . . . . . . . 174
External Mixer . . . . . . . . . . . . . . . . . . . . . . . . . . . . . . . . . . . . . . . . . . . . . . . . . . . . . . . . . . . . . . . . . . . . . . 178
Overview. . . . . . . . . . . . . . . . . . . . . . . . . . . . . . . . . . . . . . . . . . . . . . . . . . . . . . . . . . . . . . . . . . . . . . . . . 178
Setup Parameters. . . . . . . . . . . . . . . . . . . . . . . . . . . . . . . . . . . . . . . . . . . . . . . . . . . . . . . . . . . . . . . . . . . 178
Limitations . . . . . . . . . . . . . . . . . . . . . . . . . . . . . . . . . . . . . . . . . . . . . . . . . . . . . . . . . . . . . . . . . . . . . . . 180
Frequency Offset Function . . . . . . . . . . . . . . . . . . . . . . . . . . . . . . . . . . . . . . . . . . . . . . . . . . . . . . . . . . . . . 181
Overview. . . . . . . . . . . . . . . . . . . . . . . . . . . . . . . . . . . . . . . . . . . . . . . . . . . . . . . . . . . . . . . . . . . . . . . . . 181
Setting Items . . . . . . . . . . . . . . . . . . . . . . . . . . . . . . . . . . . . . . . . . . . . . . . . . . . . . . . . . . . . . . . . . . . . . . 181
Frequency Conversion Equations . . . . . . . . . . . . . . . . . . . . . . . . . . . . . . . . . . . . . . . . . . . . . . . . . . . . . . 182
Consideration on Frequency Setting. . . . . . . . . . . . . . . . . . . . . . . . . . . . . . . . . . . . . . . . . . . . . . . . . . . . 183
Applicable Measurement Results . . . . . . . . . . . . . . . . . . . . . . . . . . . . . . . . . . . . . . . . . . . . . . . . . . . . . . 183
Making phase-noise measurement above 26.5 GHz. . . . . . . . . . . . . . . . . . . . . . . . . . . . . . . . . . . . . . . . . . 184
Basic configuration for expanding frequency range . . . . . . . . . . . . . . . . . . . . . . . . . . . . . . . . . . . . . . . . 184
Setup considerations for > 26.5 GHz measurement . . . . . . . . . . . . . . . . . . . . . . . . . . . . . . . . . . . . . . . . 186
Measurement noise floor. . . . . . . . . . . . . . . . . . . . . . . . . . . . . . . . . . . . . . . . . . . . . . . . . . . . . . . . . . . . . 187
Configuring millimeter-wave phase-noise measurement setup . . . . . . . . . . . . . . . . . . . . . . . . . . . . . . . 188
Advanced measurement techniques for a free-running source measurement. . . . . . . . . . . . . . . . . . . . . 189
Large frequency drift. . . . . . . . . . . . . . . . . . . . . . . . . . . . . . . . . . . . . . . . . . . . . . . . . . . . . . . . . . . . . . . . 189
High phase noise that may saturate phase detector. . . . . . . . . . . . . . . . . . . . . . . . . . . . . . . . . . . . . . . . . 190
Prescaler techniques to suppress frequency drift and high phase noise . . . . . . . . . . . . . . . . . . . . . . . . . 191
Configuring millimeter-wave setup to allow prescaler techniques . . . . . . . . . . . . . . . . . . . . . . . . . . . . 192
Operation of the AgtmmWave VBA macro . . . . . . . . . . . . . . . . . . . . . . . . . . . . . . . . . . . . . . . . . . . . . . 193
Start up the AgtmmWave macro. . . . . . . . . . . . . . . . . . . . . . . . . . . . . . . . . . . . . . . . . . . . . . . . . . . . . . . 193
Set up millimeter-wave measurement parameters. . . . . . . . . . . . . . . . . . . . . . . . . . . . . . . . . . . . . . . . . . 193
Setup for prescaler techniques (Advanced technique for measuring a free-running source) . . . . . . . . . 196
6. Data Analysis and Result Output
11
Page 18

Contents
Analyzing Data on Trace Using Marker. . . . . . . . . . . . . . . . . . . . . . . . . . . . . . . . . . . . . . . . . . . . . . . . . . . 200
About Marker Functions. . . . . . . . . . . . . . . . . . . . . . . . . . . . . . . . . . . . . . . . . . . . . . . . . . . . . . . . . . . . . 200
Reading Values on Trace. . . . . . . . . . . . . . . . . . . . . . . . . . . . . . . . . . . . . . . . . . . . . . . . . . . . . . . . . . . . . 201
Changing Display Position of Marker Value . . . . . . . . . . . . . . . . . . . . . . . . . . . . . . . . . . . . . . . . . . . . . 202
Specifying Sweep Range by Using Marker . . . . . . . . . . . . . . . . . . . . . . . . . . . . . . . . . . . . . . . . . . . . . . 203
Reading Relative Value From Reference Point on Trace . . . . . . . . . . . . . . . . . . . . . . . . . . . . . . . . . . . . 204
Reading Only Actual Measurement Point/Reading Value Interpolated Between Measurement Points. 205
Setting Up Markers for Each Trace/Setting up Markers for Coupled Operations Between Traces. . . . 206
Listing All Marker Values in All Displayed Traces . . . . . . . . . . . . . . . . . . . . . . . . . . . . . . . . . . . . . . . . 207
Searching for Positions that Match Specified Criteria . . . . . . . . . . . . . . . . . . . . . . . . . . . . . . . . . . . . . . . . 208
Setting Search Range (Bandmarkers). . . . . . . . . . . . . . . . . . . . . . . . . . . . . . . . . . . . . . . . . . . . . . . . . . . 208
Searching in Specified Range. . . . . . . . . . . . . . . . . . . . . . . . . . . . . . . . . . . . . . . . . . . . . . . . . . . . . . . . . 209
Setting up Bandmarker for Each Trace/Setting up Markers for Coupled Operations Between T race s . 210
Automatically Executing Search Each Time Sweep is Done (search tracking). . . . . . . . . . . . . . . . . . . 212
Searching for Maximum and Minimum Measured Values. . . . . . . . . . . . . . . . . . . . . . . . . . . . . . . . . . . 213
Searching for Target Value (target search) . . . . . . . . . . . . . . . . . . . . . . . . . . . . . . . . . . . . . . . . . . . . . . . 214
Searching for Peak . . . . . . . . . . . . . . . . . . . . . . . . . . . . . . . . . . . . . . . . . . . . . . . . . . . . . . . . . . . . . . . . . 216
Searching for Multiple Peaks . . . . . . . . . . . . . . . . . . . . . . . . . . . . . . . . . . . . . . . . . . . . . . . . . . . . . . . . . 218
Determining Mean, Standard Deviation, and Peak-to-Peak of the Trace. . . . . . . . . . . . . . . . . . . . . . . . . . 220
Specifying Range for Statistical Data. . . . . . . . . . . . . . . . . . . . . . . . . . . . . . . . . . . . . . . . . . . . . . . . . . . 221
Displaying Statistical Data . . . . . . . . . . . . . . . . . . . . . . . . . . . . . . . . . . . . . . . . . . . . . . . . . . . . . . . . . . . 221
Comparing Traces/Performing Data Math. . . . . . . . . . . . . . . . . . . . . . . . . . . . . . . . . . . . . . . . . . . . . . . . . 222
Operational Procedure . . . . . . . . . . . . . . . . . . . . . . . . . . . . . . . . . . . . . . . . . . . . . . . . . . . . . . . . . . . . . . 222
Comparing Measurement Results in User Window . . . . . . . . . . . . . . . . . . . . . . . . . . . . . . . . . . . . . . . . . . 224
Copy Traces to User Window. . . . . . . . . . . . . . . . . . . . . . . . . . . . . . . . . . . . . . . . . . . . . . . . . . . . . . . . . 224
Add Annotation to Each Trace in User Window . . . . . . . . . . . . . . . . . . . . . . . . . . . . . . . . . . . . . . . . . . 224
Limit Test . . . . . . . . . . . . . . . . . . . . . . . . . . . . . . . . . . . . . . . . . . . . . . . . . . . . . . . . . . . . . . . . . . . . . . . . . . 225
Concept of Limit Test . . . . . . . . . . . . . . . . . . . . . . . . . . . . . . . . . . . . . . . . . . . . . . . . . . . . . . . . . . . . . . . 225
Displaying Judgment Result of Limit Test. . . . . . . . . . . . . . . . . . . . . . . . . . . . . . . . . . . . . . . . . . . . . . . 226
Defining Limit Line . . . . . . . . . . . . . . . . . . . . . . . . . . . . . . . . . . . . . . . . . . . . . . . . . . . . . . . . . . . . . . . . 227
Initializing Limit Lines. . . . . . . . . . . . . . . . . . . . . . . . . . . . . . . . . . . . . . . . . . . . . . . . . . . . . . . . . . . . . . 228
File Saving and Loading Instrument Status Settings . . . . . . . . . . . . . . . . . . . . . . . . . . . . . . . . . . . . . . . . . 229
Saving Procedure . . . . . . . . . . . . . . . . . . . . . . . . . . . . . . . . . . . . . . . . . . . . . . . . . . . . . . . . . . . . . . . . . . 232
Recalling Procedure . . . . . . . . . . . . . . . . . . . . . . . . . . . . . . . . . . . . . . . . . . . . . . . . . . . . . . . . . . . . . . . . 235
Recall Procedure Using “Recall by File Name” Feature . . . . . . . . . . . . . . . . . . . . . . . . . . . . . . . . . . . . 236
Managing Files/Folders . . . . . . . . . . . . . . . . . . . . . . . . . . . . . . . . . . . . . . . . . . . . . . . . . . . . . . . . . . . . . . . 237
Running Windows Explorer . . . . . . . . . . . . . . . . . . . . . . . . . . . . . . . . . . . . . . . . . . . . . . . . . . . . . . . . . . 237
Copying Files/Folders. . . . . . . . . . . . . . . . . . . . . . . . . . . . . . . . . . . . . . . . . . . . . . . . . . . . . . . . . . . . . . . 237
Moving Files/Folders . . . . . . . . . . . . . . . . . . . . . . . . . . . . . . . . . . . . . . . . . . . . . . . . . . . . . . . . . . . . . . . 237
Removing Files/Folders . . . . . . . . . . . . . . . . . . . . . . . . . . . . . . . . . . . . . . . . . . . . . . . . . . . . . . . . . . . . . 238
Changing the Name of File/Folder . . . . . . . . . . . . . . . . . . . . . . . . . . . . . . . . . . . . . . . . . . . . . . . . . . . . . 238
Formatting Floppy Disk . . . . . . . . . . . . . . . . . . . . . . . . . . . . . . . . . . . . . . . . . . . . . . . . . . . . . . . . . . . . . 238
Saving Trace on File . . . . . . . . . . . . . . . . . . . . . . . . . . . . . . . . . . . . . . . . . . . . . . . . . . . . . . . . . . . . . . . . . 239
Saving Trace Data File . . . . . . . . . . . . . . . . . . . . . . . . . . . . . . . . . . . . . . . . . . . . . . . . . . . . . . . . . . . . . . 239
Saving Trace Memory. . . . . . . . . . . . . . . . . . . . . . . . . . . . . . . . . . . . . . . . . . . . . . . . . . . . . . . . . . . . . . . 240
Linearity Evaluation of Chirped FM Signal. . . . . . . . . . . . . . . . . . . . . . . . . . . . . . . . . . . . . . . . . . . . . . . . 241
Create Reference Regression Line . . . . . . . . . . . . . . . . . . . . . . . . . . . . . . . . . . . . . . . . . . . . . . . . . . . . . 241
Evaluate the Linearity. . . . . . . . . . . . . . . . . . . . . . . . . . . . . . . . . . . . . . . . . . . . . . . . . . . . .
Hiding Numeric Information . . . . . . . . . . . . . . . . . . . . . . . . . . . . . . . . . . . . . . . . . . . . . . . . . . . . . . . . . . . 243
. . . . . . . . . . 242
12
Page 19

Hiding Frequency Information on Screen. . . . . . . . . . . . . . . . . . . . . . . . . . . . . . . . . . . . . . . . . . . . . . . . 243
Hiding All Numeric Information Screen. . . . . . . . . . . . . . . . . . . . . . . . . . . . . . . . . . . . . . . . . . . . . . . . . 243
Saving Display Screen . . . . . . . . . . . . . . . . . . . . . . . . . . . . . . . . . . . . . . . . . . . . . . . . . . . . . . . . . . . . . . . . 244
Operational Procedure. . . . . . . . . . . . . . . . . . . . . . . . . . . . . . . . . . . . . . . . . . . . . . . . . . . . . . . . . . . . . . . 244
Printing Screen Image. . . . . . . . . . . . . . . . . . . . . . . . . . . . . . . . . . . . . . . . . . . . . . . . . . . . . . . . . . . . . . . . . 245
Supported Printers. . . . . . . . . . . . . . . . . . . . . . . . . . . . . . . . . . . . . . . . . . . . . . . . . . . . . . . . . . . . . . . . . . 245
Installing Printer Driver . . . . . . . . . . . . . . . . . . . . . . . . . . . . . . . . . . . . . . . . . . . . . . . . . . . . . . . . . . . . . 245
Images You Can Print/save . . . . . . . . . . . . . . . . . . . . . . . . . . . . . . . . . . . . . . . . . . . . . . . . . . . . . . . . . . . 246
Printing Procedure. . . . . . . . . . . . . . . . . . . . . . . . . . . . . . . . . . . . . . . . . . . . . . . . . . . . . . . . . . . . . . . . . . 246
7. Clock Jitter Measurement
Overview. . . . . . . . . . . . . . . . . . . . . . . . . . . . . . . . . . . . . . . . . . . . . . . . . . . . . . . . . . . . . . . . . . . . . . . . . . . 250
Overview of clock jitter measurement . . . . . . . . . . . . . . . . . . . . . . . . . . . . . . . . . . . . . . . . . . . . . . . . . . 250
Relation between phase deviation (spurious) and jitter . . . . . . . . . . . . . . . . . . . . . . . . . . . . . . . . . . . . . 252
Clock jitter measurement with the E5052A . . . . . . . . . . . . . . . . . . . . . . . . . . . . . . . . . . . . . . . . . . . . . . 253
Executing Clock Jitter Measurement . . . . . . . . . . . . . . . . . . . . . . . . . . . . . . . . . . . . . . . . . . . . . . . . . . . . . 255
Starting the VBA program . . . . . . . . . . . . . . . . . . . . . . . . . . . . . . . . . . . . . . . . . . . . . . . . . . . . . . . . . . . 255
Random jitter analysis. . . . . . . . . . . . . . . . . . . . . . . . . . . . . . . . . . . . . . . . . . . . . . . . . . . . . . . . . . . . . . . 256
Frequency analysis for periodic jitter . . . . . . . . . . . . . . . . . . . . . . . . . . . . . . . . . . . . . . . . . . . . . . . . . . . 258
Decomposition analysis for periodic jitter . . . . . . . . . . . . . . . . . . . . . . . . . . . . . . . . . . . . . . . . . . . . . . . 261
Installing the program . . . . . . . . . . . . . . . . . . . . . . . . . . . . . . . . . . . . . . . . . . . . . . . . . . . . . . . . . . . . . . . 265
Error messages . . . . . . . . . . . . . . . . . . . . . . . . . . . . . . . . . . . . . . . . . . . . . . . . . . . . . . . . . . . . . . . . . . . . 266
Contents
8. Setting and Using the Control and Management Functions
Setting the GPIB . . . . . . . . . . . . . . . . . . . . . . . . . . . . . . . . . . . . . . . . . . . . . . . . . . . . . . . . . . . . . . . . . . . . 268
Setting talker/listener GPIB address of E5052A. . . . . . . . . . . . . . . . . . . . . . . . . . . . . . . . . . . . . . . . . . . 268
Setting system controller (USB/GPIB interface) when c drive volume label in hard disk is less than CL250
268
Setting system controller (USB/GPIB interface) when c drive volume label in hard disk is more than CL251
271
Setting the Mouse . . . . . . . . . . . . . . . . . . . . . . . . . . . . . . . . . . . . . . . . . . . . . . . . . . . . . . . . . . . . . . . . . . . . 273
Setup steps. . . . . . . . . . . . . . . . . . . . . . . . . . . . . . . . . . . . . . . . . . . . . . . . . . . . . . . . . . . . . . . . . . . . . . . . 273
Configuring the Network . . . . . . . . . . . . . . . . . . . . . . . . . . . . . . . . . . . . . . . . . . . . . . . . . . . . . . . . . . . . . . 276
Enabling/disabling network. . . . . . . . . . . . . . . . . . . . . . . . . . . . . . . . . . . . . . . . . . . . . . . . . . . . . . . . . . . 276
Setting IP address . . . . . . . . . . . . . . . . . . . . . . . . . . . . . . . . . . . . . . . . . . . . . . . . . . . . . . . . . . . . . . . . . . 277
Specifying computer name . . . . . . . . . . . . . . . . . . . . . . . . . . . . . . . . . . . . . . . . . . . . . . . . . . . . . . . . . . . 279
Accessing Hard Disk of E5052A from External PC. . . . . . . . . . . . . . . . . . . . . . . . . . . . . . . . . . . . . . . . . . 281
Enabling access from an external PC . . . . . . . . . . . . . . . . . . . . . . . . . . . . . . . . . . . . . . . . . . . . . . . . . . . 281
Accessing hard disk of E5052A from external PC . . . . . . . . . . . . . . . . . . . . . . . . . . . . . . . . . . . . . . . . . 283
Disabling USB Mass Storage Device. . . . . . . . . . . . . . . . . . . . . . . . . . . . . . . . . . . . . . . . . . . . . . . . . . . . . 284
Steps for Setting Modification . . . . . . . . . . . . . . . . . . . . . . . . . . . . . . . . . . . . . . . . . . . . . . . . . . . . . . . . 284
Locking the Front Keys, Keyboard, and Mouse (Touch Screen) . . . . . . . . . . . . . . . . . . . . . . . . . . . . . . . . 285
Locking the front keys, keyboard, and mouse . . . . . . . . . . . . . . . . . . . . . . . . . . . . . . . . . . . . . . . . . . . . 285
Setting the Beeper (Built-in Speaker). . . . . . . . . . . . . . . . . . . . . . . . . . . . . . . . . . . . . . . . . . . . . . . . . . . . . 286
Setting the Operation Complete Beeper . . . . . . . . . . . . . . . . . . . . . . . . . . . . . . . . . . . . . . . . . . . . . . . . . 286
Setting the Warning Beeper. . . . . . . . . . . . . . . . . . . . . . . . . . . . . . . . . . . . . . . . . . . . . . . . . . . . . . . . . . . 286
Turning off the LCD Screen Backlight. . . . . . . . . . . . . . . . . . . . . . . . . . . . . . . . . . . . . . . . . . . . . . . . . . . . 287
Turning off the LCD Screen Backlight. . . . . . . . . . . . . . . . . . . . . . . . . . . . . . . . . . . . . . . . . . . . . . . . . . 287
13
Page 20

Contents
Setting display colors . . . . . . . . . . . . . . . . . . . . . . . . . . . . . . . . . . . . . . . . . . . . . . . . . . . . . . . . . . . . . . . . . 288
Selecting display mode. . . . . . . . . . . . . . . . . . . . . . . . . . . . . . . . . . . . . . . . . . . . . . . . . . . . . . . . . . . . . . 288
Setting display color for each item . . . . . . . . . . . . . . . . . . . . . . . . . . . . . . . . . . . . . . . . . . . . . . . . . . . . . 288
Resetting the display colors to factory defaults . . . . . . . . . . . . . . . . . . . . . . . . . . . . . . . . . . . . . . . . . . . 289
Checking the Product Information . . . . . . . . . . . . . . . . . . . . . . . . . . . . . . . . . . . . . . . . . . . . . . . . . . . . . . . 290
Checking the serial number . . . . . . . . . . . . . . . . . . . . . . . . . . . . . . . . . . . . . . . . . . . . . . . . . . . . . . . . . . 290
Checking the firmware revision . . . . . . . . . . . . . . . . . . . . . . . . . . . . . . . . . . . . . . . . . . . . . . . . . . . . . . . 290
Checking the option number . . . . . . . . . . . . . . . . . . . . . . . . . . . . . . . . . . . . . . . . . . . . . . . . . . . . . . . . . . 290
9. Information on Maintenance
Backing Up the Data . . . . . . . . . . . . . . . . . . . . . . . . . . . . . . . . . . . . . . . . . . . . . . . . . . . . . . . . . . . . . . . . . 292
Making backup files . . . . . . . . . . . . . . . . . . . . . . . . . . . . . . . . . . . . . . . . . . . . . . . . . . . . . . . . . . . . . . . . 292
Maintenance of removable hard disk . . . . . . . . . . . . . . . . . . . . . . . . . . . . . . . . . . . . . . . . . . . . . . . . . . . . . 293
Saving system calibration data from removable hard disk to floppy disk . . . . . . . . . . . . . . . . . . . . . . . 2 93
Removing Removable Hard Disk. . . . . . . . . . . . . . . . . . . . . . . . . . . . . . . . . . . . . . . . . . . . . . . . . . . . . . 293
Mounting Removable Hard Disk . . . . . . . . . . . . . . . . . . . . . . . . . . . . . . . . . . . . . . . . . . . . . . . . . . . . . . 294
Recalling system calibration data to removable hard disk . . . . . . . . . . . . . . . . . . . . . . . . . . . . . . . . . . . 295
System Recovery . . . . . . . . . . . . . . . . . . . . . . . . . . . . . . . . . . . . . . . . . . . . . . . . . . . . . . . . . . . . . . . . . . . . 296
Types of system recoveries. . . . . . . . . . . . . . . . . . . . . . . . . . . . . . . . . . . . . . . . . . . . . . . . . . . . . . . . . . . 296
Notes on executing system recovery . . . . . . . . . . . . . . . . . . . . . . . . . . . . . . . . . . . . . . . . . . . . . . . . . . . 296
Procedure to execute factory recovery . . . . . . . . . . . . . . . . . . . . . . . . . . . . . . . . . . . . . . . . . . . . . . . . . . 297
Procedure to create the user backup image. . . . . . . . . . . . . . . . . . . . . . . . . . . . . . . . . . . . . . . . . . . . . . . 300
Procedure to execute the user recovery . . . . . . . . . . . . . . . . . . . . . . . . . . . . . . . . . . . . . . . . . . . . . . . . . 303
Calibration of the Touch Screen. . . . . . . . . . . . . . . . . . . . . . . . . . . . . . . . . . . . . . . . . . . . . . . . . . . . . . . . . 306
Cleaning the Instrument . . . . . . . . . . . . . . . . . . . . . . . . . . . . . . . . . . . . . . . . . . . . . . . . . . . . . . . . . . . . . . . 307
Cleaning the LCD. . . . . . . . . . . . . . . . . . . . . . . . . . . . . . . . . . . . . . . . . . . . . . . . . . . . . . . . . . . . . . . . . . 307
Maintenance of test ports (DUT INTERFACE) and other connectors/ports . . . . . . . . . . . . . . . . . . . . . 307
Cleaning parts other than the LCD. . . . . . . . . . . . . . . . . . . . . . . . . . . . . . . . . . . . . . . . . . . . . . . . . . . . . 307
Replacement of Parts with Limited Service Life . . . . . . . . . . . . . . . . . . . . . . . . . . . . . . . . . . . . . . . . . . . . 308
Cautions Applicable to Requesting Repair, Replacement, Regular Calibration, etc. . . . . . . . . . . . . . . . . 309
Backing up data in the hard disk. . . . . . . . . . . . . . . . . . . . . . . . . . . . . . . . . . . . . . . . . . . . . . . . . . . . . . . 309
Devices to be sent back for repair or regular calibration . . . . . . . . . . . . . . . . . . . . . . . . . . . . . . . . . . . . 309
Recommended Calibration Period . . . . . . . . . . . . . . . . . . . . . . . . . . . . . . . . . . . . . . . . . . . . . . . . . . . . . 309
10. Specifications and Supplemental Information
Definitions . . . . . . . . . . . . . . . . . . . . . . . . . . . . . . . . . . . . . . . . . . . . . . . . . . . . . . . . . . . . . . . . . . . . . . . . . 312
Phase Noise Measurement . . . . . . . . . . . . . . . . . . . . . . . . . . . . . . . . . . . . . . . . . . . . . . . . . . . . . . . . . . . . . 313
Measurement capabilities . . . . . . . . . . . . . . . . . . . . . . . . . . . . . . . . . . . . . . . . . . . . . . . . . . . . . . . . . . . . 320
Frequency, RF Power, DC current Measurements. . . . . . . . . . . . . . . . . . . . . . . . . . . . . . . . . . . . . . . . . . . 321
Specifications of the E5052A use only. . . . . . . . . . . . . . . . . . . . . . . . . . . . . . . . . . . . . . . . . . . . . . . . . . 321
Measurement capabilities . . . . . . . . . . . . . . . . . . . . . . . . . . . . . . . . . . . . . . . . . . . . . . . . . . . . . . . . . . . . 322
Softkeys and SCPI commands that are not available when using “Tester” mode or option 011 is installed
322
Transient Measurement . . . . . . . . . . . . . . . . . . . . . . . . . . . . . . . . . . . . . . . . . . . . . . . . . . . . . . . . . . . . . . . 324
Measurement capabilities . . . . . . . . . . . . . . . . . . . . . . . . . . . . . . . . . . . . . . . . . . . . . . . . . . . . . . . . . . . . 327
Spectrum Monitor. . . . . . . . . . . . . . . . . . . . . . . . . . . . . . . . . . . . . . . . . . . . . . . . . . . . . . . . . . . . . . . . . . . . 328
Measurement capabilities . . . . . . . . . . . . . . . . . . . . . . . . . . . . . . . . . . . . . . . . . . . . . . . . . . . . . . . . . . . . 328
Port Output (DC Power/Control) . . . . . . . . . . . . . . . . . . . . . . . . . . . . . . . . . . . . . . . . . . . . . . . . . . . . . . . . 329
14
Page 21

Test Port Input. . . . . . . . . . . . . . . . . . . . . . . . . . . . . . . . . . . . . . . . . . . . . . . . . . . . . . . . . . . . . . . . . . . . . . . 330
General Information . . . . . . . . . . . . . . . . . . . . . . . . . . . . . . . . . . . . . . . . . . . . . . . . . . . . . . . . . . . . . . . . . . 331
Measurement capabilities . . . . . . . . . . . . . . . . . . . . . . . . . . . . . . . . . . . . . . . . . . . . . . . . . . . . . . . . . . . . . . 338
DC Power/Control Voltage Setting. . . . . . . . . . . . . . . . . . . . . . . . . . . . . . . . . . . . . . . . . . . . . . . . . . . . . . . 338
Trace functions . . . . . . . . . . . . . . . . . . . . . . . . . . . . . . . . . . . . . . . . . . . . . . . . . . . . . . . . . . . . . . . . . . . . . . 339
Storage . . . . . . . . . . . . . . . . . . . . . . . . . . . . . . . . . . . . . . . . . . . . . . . . . . . . . . . . . . . . . . . . . . . . . . . . . . . . 339
System capabilities . . . . . . . . . . . . . . . . . . . . . . . . . . . . . . . . . . . . . . . . . . . . . . . . . . . . . . . . . . . . . . . . . . . 339
Automation . . . . . . . . . . . . . . . . . . . . . . . . . . . . . . . . . . . . . . . . . . . . . . . . . . . . . . . . . . . . . . . . . . . . . . . . . 340
Function differences between standard and option 011 . . . . . . . . . . . . . . . . . . . . . . . . . . . . . . . . . . . . . . . 341
System performance with E5053A Microwave Downconverter . . . . . . . . . . . . . . . . . . . . . . . . . . . . . . . . 342
Clock jitter Analysis . . . . . . . . . . . . . . . . . . . . . . . . . . . . . . . . . . . . . . . . . . . . . . . . . . . . . . . . . . . . . . . . . . 344
A. Manual Changes
Manual Changes . . . . . . . . . . . . . . . . . . . . . . . . . . . . . . . . . . . . . . . . . . . . . . . . . . . . . . . . . . . . . . . . . . . . . 346
Change 5 . . . . . . . . . . . . . . . . . . . . . . . . . . . . . . . . . . . . . . . . . . . . . . . . . . . . . . . . . . . . . . . . . . . . . . . . . 347
Change 4 . . . . . . . . . . . . . . . . . . . . . . . . . . . . . . . . . . . . . . . . . . . . . . . . . . . . . . . . . . . . . . . . . . . . . . . . . 347
Change 3 . . . . . . . . . . . . . . . . . . . . . . . . . . . . . . . . . . . . . . . . . . . . . . . . . . . . . . . . . . . . . . . . . . . . . . . . . 348
Change 2 . . . . . . . . . . . . . . . . . . . . . . . . . . . . . . . . . . . . . . . . . . . . . . . . . . . . . . . . . . . . . . . . . . . . . . . . . 348
Change 1 . . . . . . . . . . . . . . . . . . . . . . . . . . . . . . . . . . . . . . . . . . . . . . . . . . . . . . . . . . . . . . . . . . . . . . . . . 349
Contents
B. Troubleshooting
Troubleshooting . . . . . . . . . . . . . . . . . . . . . . . . . . . . . . . . . . . . . . . . . . . . . . . . . . . . . . . . . . . . . . . . . . . . . 352
Troubleshooting during Startup. . . . . . . . . . . . . . . . . . . . . . . . . . . . . . . . . . . . . . . . . . . . . . . . . . . . . . . . 352
Troubleshooting during Operation . . . . . . . . . . . . . . . . . . . . . . . . . . . . . . . . . . . . . . . . . . . . . . . . . . . . . 353
Troubleshooting for External Devices . . . . . . . . . . . . . . . . . . . . . . . . . . . . . . . . . . . . . . . . . . . . . . . . . . 355
Error Messages . . . . . . . . . . . . . . . . . . . . . . . . . . . . . . . . . . . . . . . . . . . . . . . . . . . . . . . . . . . . . . . . . . . . . . 356
A . . . . . . . . . . . . . . . . . . . . . . . . . . . . . . . . . . . . . . . . . . . . . . . . . . . . . . . . . . . . . . . . . . . . . . . . . . . . . . . 356
D . . . . . . . . . . . . . . . . . . . . . . . . . . . . . . . . . . . . . . . . . . . . . . . . . . . . . . . . . . . . . . . . . . . . . . . . . . . . . . . 357
E . . . . . . . . . . . . . . . . . . . . . . . . . . . . . . . . . . . . . . . . . . . . . . . . . . . . . . . . . . . . . . . . . . . . . . . . . . . . . . . 358
F. . . . . . . . . . . . . . . . . . . . . . . . . . . . . . . . . . . . . . . . . . . . . . . . . . . . . . . . . . . . . . . . . . . . . . . . . . . . . . . . 358
I . . . . . . . . . . . . . . . . . . . . . . . . . . . . . . . . . . . . . . . . . . . . . . . . . . . . . . . . . . . . . . . . . . . . . . . . . . . . . . . . 359
L . . . . . . . . . . . . . . . . . . . . . . . . . . . . . . . . . . . . . . . . . . . . . . . . . . . . . . . . . . . . . . . . . . . . . . . . . . . . . . . 359
M . . . . . . . . . . . . . . . . . . . . . . . . . . . . . . . . . . . . . . . . . . . . . . . . . . . . . . . . . . . . . . . . . . . . . . . . . . . . . . . 360
N . . . . . . . . . . . . . . . . . . . . . . . . . . . . . . . . . . . . . . . . . . . . . . . . . . . . . . . . . . . . . . . . . . . . . . . . . . . . . . . 360
O . . . . . . . . . . . . . . . . . . . . . . . . . . . . . . . . . . . . . . . . . . . . . . . . . . . . . . . . . . . . . . . . . . . . . . . . . . . . . . . 360
P. . . . . . . . . . . . . . . . . . . . . . . . . . . . . . . . . . . . . . . . . . . . . . . . . . . . . . . . . . . . . . . . . . . . . . . . . . . . . . . . 360
R . . . . . . . . . . . . . . . . . . . . . . . . . . . . . . . . . . . . . . . . . . . . . . . . . . . . . . . . . . . . . . . . . . . . . . . . . . . . . . . 361
S. . . . . . . . . . . . . . . . . . . . . . . . . . . . . . . . . . . . . . . . . . . . . . . . . . . . . . . . . . . . . . . . . . . . . . . . . . . . . . . . 362
T . . . . . . . . . . . . . . . . . . . . . . . . . . . . . . . . . . . . . . . . . . . . . . . . . . . . . . . . . . . . . . . . . . . . . . . . . . . . . . . 362
U . . . . . . . . . . . . . . . . . . . . . . . . . . . . . . . . . . . . . . . . . . . . . . . . . . . . . . . . . . . . . . . . . . . . . . . . . . . . . . . 362
Warning Message . . . . . . . . . . . . . . . . . . . . . . . . . . . . . . . . . . . . . . . . . . . . . . . . . . . . . . . . . . . . . . . . . . . . 363
C. List of Default Values
List of Default Values, Save/Recall Settings, and Backup Settings . . . . . . . . . . . . . . . . . . . . . . . . . . . . . . 366
FP Menu . . . . . . . . . . . . . . . . . . . . . . . . . . . . . . . . . . . . . . . . . . . . . . . . . . . . . . . . . . . . . . . . . . . . . . . . . . . 367
PN Menu. . . . . . . . . . . . . . . . . . . . . . . . . . . . . . . . . . . . . . . . . . . . . . . . . . . . . . . . . . . . . . . . . . . . . . . . . . . 376
SP Menu . . . . . . . . . . . . . . . . . . . . . . . . . . . . . . . . . . . . . . . . . . . . . . . . . . . . . . . . . . . . . . . . . . . . . . . . . . . 384
TR Menu. . . . . . . . . . . . . . . . . . . . . . . . . . . . . . . . . . . . . . . . . . . . . . . . . . . . . . . . . . . . . . . . . . . . . . . . . . . 393
15
Page 22

Contents
USER Menu . . . . . . . . . . . . . . . . . . . . . . . . . . . . . . . . . . . . . . . . . . . . . . . . . . . . . . . . . . . . . . . . . . . . . . . . 402
D. Softkey Functions
Phanse Noise Menu (Top Menu) . . . . . . . . . . . . . . . . . . . . . . . . . . . . . . . . . . . . . . . . . . . . . . . . . . . . . . . . 412
PN Menu. . . . . . . . . . . . . . . . . . . . . . . . . . . . . . . . . . . . . . . . . . . . . . . . . . . . . . . . . . . . . . . . . . . . . . . . . . . 413
Spectrum Monitor Menu (Top Menu) . . . . . . . . . . . . . . . . . . . . . . . . . . . . . . . . . . . . . . . . . . . . . . . . . . . . 427
SP Menu . . . . . . . . . . . . . . . . . . . . . . . . . . . . . . . . . . . . . . . . . . . . . . . . . . . . . . . . . . . . . . . . . . . . . . . . . . . 428
Frequency Power Menu (Top Menu) . . . . . . . . . . . . . . . . . . . . . . . . . . . . . . . . . . . . . . . . . . . . . . . . . . . . . 442
FP Menu . . . . . . . . . . . . . . . . . . . . . . . . . . . . . . . . . . . . . . . . . . . . . . . . . . . . . . . . . . . . . . . . . . . . . . . . . . . 443
Transient Menu (Top Menu). . . . . . . . . . . . . . . . . . . . . . . . . . . . . . . . . . . . . . . . . . . . . . . . . . . . . . . . . . . . 458
TR Menu. . . . . . . . . . . . . . . . . . . . . . . . . . . . . . . . . . . . . . . . . . . . . . . . . . . . . . . . . . . . . . . . . . . . . . . . . . . 459
User Defined Menu (Top Menu) . . . . . . . . . . . . . . . . . . . . . . . . . . . . . . . . . . . . . . . . . . . . . . . . . . . . . . . . 475
USER Menu . . . . . . . . . . . . . . . . . . . . . . . . . . . . . . . . . . . . . . . . . . . . . . . . . . . . . . . . . . . . . . . . . . . . . . . . 476
16
Page 23

1. Precautions
1 Precautions
This chapter describes cautions that must be observed in operating the E5052A.
17
Page 24

Precautions
Software Installed
Software Installed
The Windows operating system installed in this machine is customized for more effective
operation, and has different functions that are not part of the Windows operating system for
ordinary PCs (personal computers).
Therefore, do not attempt to use the system in ways other than those described in this
manual or to install Windows-based software (including anti-virus software) for ordinary
PCs as doing so may cause malfunctions.
Also note the followings.
• Do not update the Windows operating system installed in this machine to the Windows
operating system for ordinary PCs. Doing so will cause malfunctions.
• Do not attempt to update VBA (Visual Basic for Applications) software installed in this
machine to its equivalent developed for ordinary PCs. Doing so will cause
malfunctions.
• Do not allow any computer virus to infect the system. This machine has no virus check
function nor anti-virus software installed.
Agilent Technologies will not be held liable for any failure or damage arising from
negligence regarding these prohibitions and warnings.
NOTE If the pre-installed software is damaged somehow, resulting in errant behavior by the
machine, perform a system recovery. For further details of system recovery, refer to
“System Recovery” on page 296.
18 Chapter 1
Page 25

Precautions
Before contacting us
Before contacting us
If you encounter the following problems during startup or operation of the E5052A, in
which initial registration of the Windows 2000 Operating System has been properly
performed, execute system recovery and update the firmware version. As for the system
recovery procedure, refer to “System Recovery” on page 296.
The system starts up, but the normal measurement screen does not appear
• The system automatically shuts down immediately after the startup, or the startup
process stops.
• The measurement screen appears, but "Power on test fail" or "Calibration data lost" is
displayed in the instrument message/warning area against a red background in the
lower-left part of the screen. The system enters the service mode. (The instrument
status bar in the lower-right displays SVC in red).
Unstable Operation
• The system hangs up while the instrument is controlled from VBA or external PCs.
• The blue screen appears and the system hangs up.
1. Precautions
• The response is much slower than usual.
When execution of system recovery does not result in normal operation, a failure may have
occurred. Contact Agilent Technology’ s Customer Contact listed at the end of this guide or
the company from which you bought the device.
For other problems, refer to “Troubleshooting” on page 352.
Chapter 1 19
Page 26

Precautions
Before contacting us
20 Chapter 1
Page 27

2. Overview of
Functions
2 Overview of Functions
This chapter describes the functions of the E5052A that can be accessed from the front
panel, LCD screen, and rear panel.
21
Page 28

Overview of Functions
Front Panel: Names and Functions of Parts
Front Panel: Names and Functions of Parts
This section describes the names and functions of the parts on the front panel of the
E5052A. For more about the functions displayed on the LCD screen, see “LCD Screen:
Names and Functions of Parts” on page 34. For more about the functions of softkeys, see
Appendix D, “Softkey Functions,” on page 411.
Figure 2-1 Front Panel
22 Chapter 2
Page 29

Overview of Functions
Front Panel: Names and Functions of Parts
1. Standby Switch
Used for choosing between power-on ( | ) and standby ( ) states of the E5052A.
NOTE To turn off the power of the E5052A, be sure to follow the steps described below.
1. First, press the standby switch or send a shutdown command from the external
controller to activate the shutdown process (the processing of software and hardware
necessary to turn off the power supply). This will put the E5052A into the standby
state.
2. Next, if necessary, turn off the power supply to the “8. Power Cable Receptacle (to
LINE)” on page 48 on the rear panel.
Under normal use, never directly interrupt the power supply to the power cable
receptacle on the rear panel when the power supply is on. Always keep the “7. Line
Switch (Always ON)” on page 47 at (|). Never turn it off ( ).
If you directly interrupt the power supply to the power cable receptacle when the power
supply is on, or turn off the “7. Line Switch (Always ON)” on page 47, the shutdown
process will not work. This could damage the E5052A’s software and hardware and lead to
device failure.
2. Overview of
Functions
Turning on the power supply after a faulty shutdown may cause the system to start up in a
condition called “safe mode.” If this occurs, first shut down the system to put it into the
standby state and then turn on the power supply again to start up the system in normal
mode.
See also Chapter 3, “Installation,” for further information on power on/off.
2. LCD Screen
A 10.4-inch touch screen TFT color LCD used for displaying traces, scales, settings,
softkeys, etc. The touch screen LCD allows you to manipulate softkeys by touching the
LCD screen directly with a finger. For more about the LCD screen, see “LCD Screen:
Names and Functions of Parts” on page 34.
NOTE Do not press the surface of the LCD screen (both standard and touch screen types)
with a sharp object (e.g., a nail, pen, or screwdriver). Pressing the surface with a
sharp-pointed object can damage the LCD screen surface or cause the screen to fail.
NOTE Occasionally, a few pixels may appear on the screen as a fixed point of blue, green or
red. Please note that this is not a failure and does not affect the performance of your
product.
Chapter 2 23
Page 30

Overview of Functions
Front Panel: Names and Functions of Parts
3. WINDOW/TRACE Block
A group of keys for selecting active measurement windows and active traces. For more
about the concepts of measurement windows and traces, see “4. Measurement Window” on
page 41.
Table 2-1
Key
Key
Key
Key
Pressing this key causes the active measurement window to
switch over to the next higher window number of four
measurement windows. It is possible to define sweep range and
other parameters of an active measurement window. To change
the settings of a window, use this key to first activate the window.
Switches over between normal and maximum display of the active
measurement window. In normal display, all four measurement
windows (both active and non-active) are displayed in split views
on the screen. In maximum display, only the active measurement
window is displayed over the entire area, without showing
non-active measurement windows. You can also switch over
between the normal and maximum windows by double-clicking
the measurement window frame. Measurements are also carried
out on the non-active measurement windows that are not
displayed.
Switches over the active trace to the next one. (Each time the key
is pressed the active trace steps up from the trace with the
designated number to the one with a higher number.) An active
trace is one for which the measurement parameters are defined. To
change the settings for a trace, use this key to first make the trace
active.
Switches over between normal and maximum display of the active
trace within the measurement window. In normal display, all
traces are displayed in split views on the measurement window. In
maximum display, only the active trace is displayed over the
entire area, without showing non-active traces. To maximize the
active trace, you can also double-click the area inside the
measurement window (excluding the frame). Measurements are
also carried out on the non-active traces that are not displayed.
24 Chapter 2
Page 31
Overview of Functions
Front Panel: Names and Functions of Parts
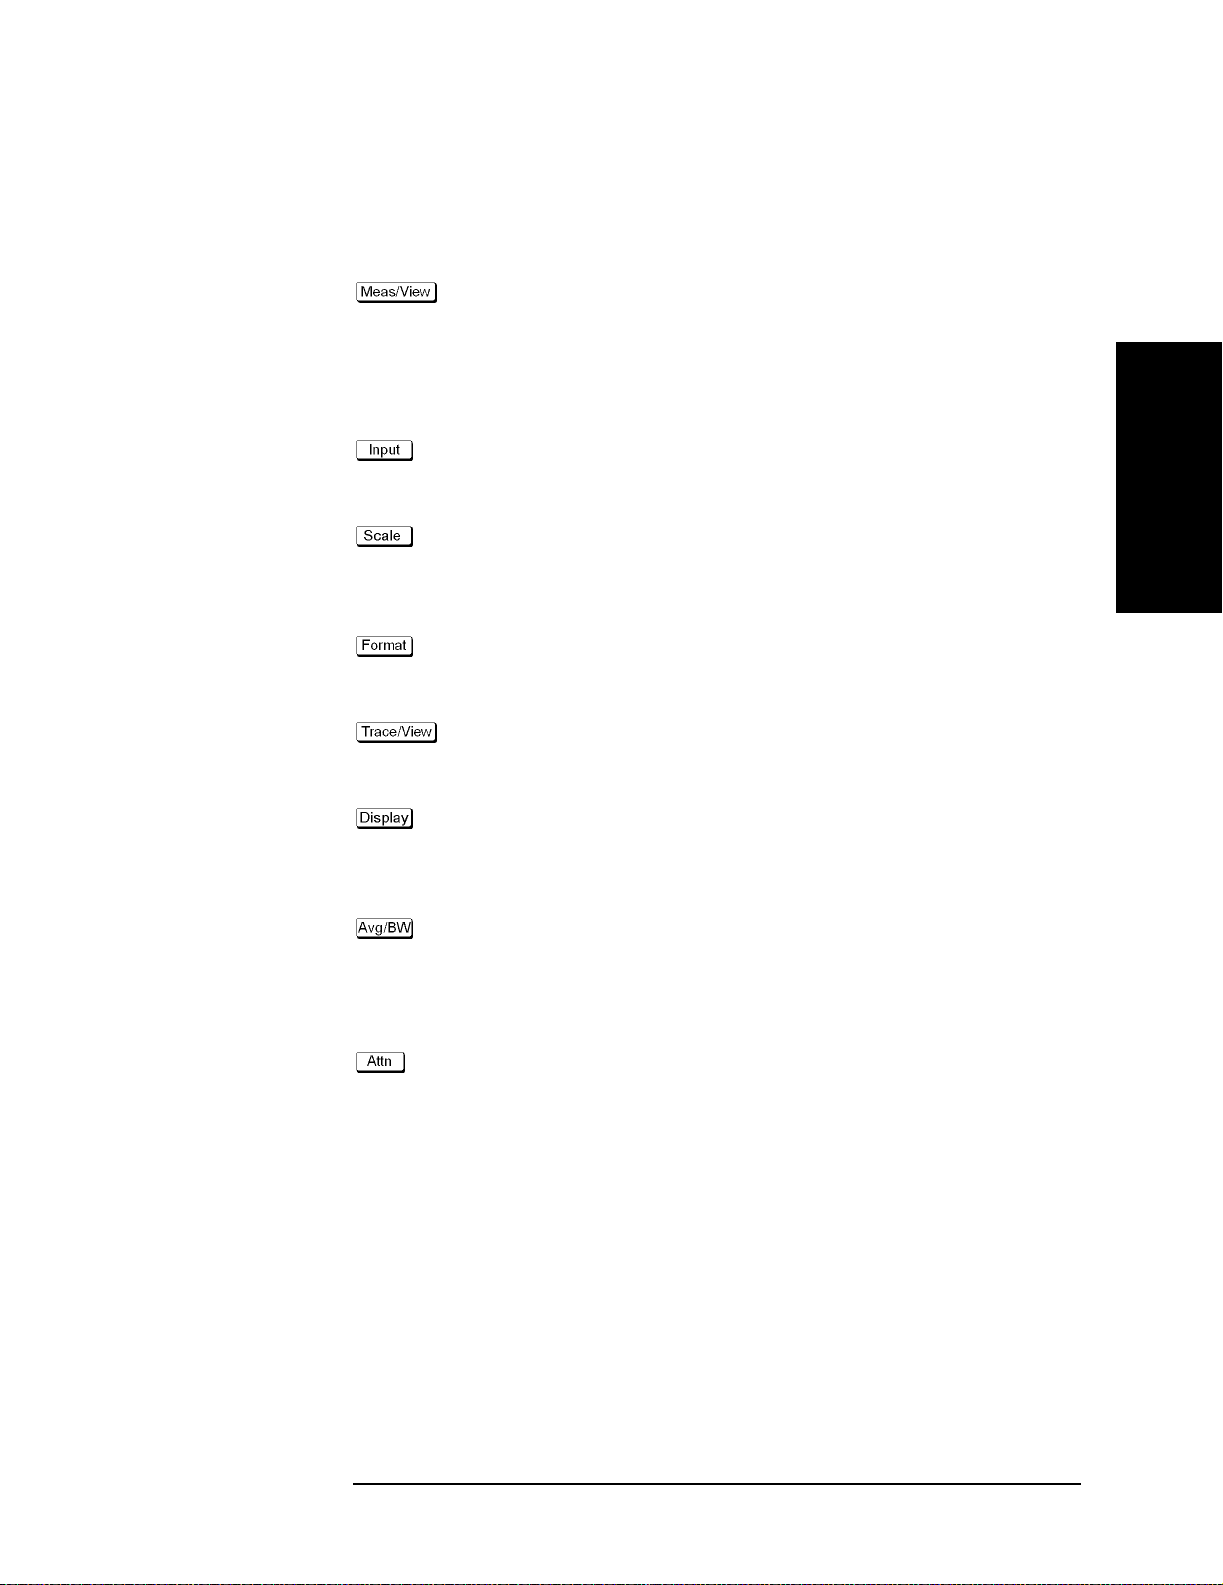
4. MEASUREMENT Block
A group of keys used mainly for setting up measurements on the E5052A.
Table 2-2
Key
Key
Key
Key
Key
Key
Displays the “Measurement View Menu” in the right part of the
screen. Manipulating the “Measurement View Menu” enables you to
select any active measurement window. Active measurement
windows are also selectable in maximum display. In this case, the
measurement window in maximum display will switch over to the
one you have selected.
Displays the “Input Menu” in the right part of the screen.
Manipulating the “Input Menu” enables you to select any port for the
measurement signal input.
Displays the “Scale Menu” in the right part of the screen.
Manipulating the “Scale Menu” enables you to specify the scale for
displaying a trace (magnitude per division, value of the reference
line, etc.) for each trace.
Displays the “Format Menu” in the right part of the screen.
Manipulating the “Format Menu” enables you to specify the data
format (data transformation and graph formats) for each trace.
Displays the “Trace View Menu” in the right part of the screen.
Manipulating the “Trace View Menu” enables you to specify the data
smoothing, data saving on memory, title of trace, etc. for each trace.
Displays the “Display Menu” in the right part of the screen.
Manipulating the “Display Menu” enables you to specify the screen
title display, digit of the y-axis value, marker position, etc. for each
active measurement window .
2. Overview of
Functions
Key
Key
Chapter 2 25
Displays the “Average Menu” in the right part of the screen.
Manipulating the “Average Menu” enables you to specify
enabling/disabling and number of times for averaging, etc. For
spectrum measurements only, you can specify the bandwidth of
resolution.
Displays the “Attenuator Menu” in the right part of the screen.
Manipulating the “Attenuator Menu” enables you to change the
setting of the input signal attenuator.
Page 32

Overview of Functions
Front Panel: Names and Functions of Parts
5. CONTROL Block
A group of keys for defining the values of the DC output port and sweeps as well as trigger
settings.
Table 2-3
Key
Key
Displays the data input bar in the upper part of the screen by
which you can specify the start value of the sweep range for the
active measurement trace or the time offset value for the transient
measurement. Also displays the menu in the right part of the
screen that allows you to specify the sweep range. You can use the
following menus:
• Phase noise measurement “Start Menu”
• Spectrum measurement “Start/Center Menu”
• Frequency power measurement “Start/Center Menu”
• Transient measurement “Time Offset Menu”
Displays the data input bar in the upper part of the screen by
which you can specify the stop value of the sweep range for the
active measurement trace or the span value for the transient
measurement. Also displays the menu in the right part of the
screen that allows you to specify the sweep range. You can use the
following menus:
• Phase noise measurement “Stop Menu”
• Spectrum measurement “Stop/Span Menu”
• Frequency power measurement “Stop/Span Menu”
• Transient measurement “Span Menu”
In these menus, the titles are different from those at the start, but
the function of the softkey is the same.
Key
Key
Key
Key
26 Chapter 2
Displays the “DC Control Voltage Menu” by which you can
specify the values of control voltage output for the DC
CONTROL port.
Displays the “DC Power Voltage Menu” by which you can specify
the values of power voltage output for the DC power port.
Displays the “Setup Menu” in the right part of the screen.
Manipulating the “Setup Menu” enables you to specify the
frequency range, IF Gain, input level, etc. required for individual
measurements.
Displays the “Trigger Menu” in the right part of the screen.
Manipulating the “Trigger Menu” enables you to specify the
trigger mode and trigger source and obtain triggers. Specify the
trigger mode for each measurement window.
Page 33

Overview of Functions
Front Panel: Names and Functions of Parts
6. Floppy Disk Drive
A device to use for storing to and reading from a floppy disk the setup state of the E5052A,
measurement data, calibration data, data on images displayed on the LCD screen, VBA
(Visual Basic for Applications) programs, etc. The floppy disk drive is compatible with a
3.5-inch, 1.44-MB DOS (Disk Operating System) formatted floppy disk.
A floppy disk access lamp is provided at the lower left of the floppy disk drive opening.
When the floppy disk drive is accessing a disk (for reading or writing), this lamp is lit
green.
A disk eject button is provided at the lower right of the floppy disk drive opening. Pressing
this button ejects the inserted floppy disk.
NOTE Insert a floppy disk into the floppy disk drive opening rightside up in the direction of the
arrow marked on the disk.
Do not press the disk eject button while the floppy disk access lamp is on. Trying to
forcefully pull the floppy disk out while the lamp is on may damage the floppy disk or disk
drive.
2. Overview of
Functions
Chapter 2 27
Page 34

Table 2-4
Overview of Functions
Front Panel: Names and Functions of Parts
7. NAVIGATION Block
The keys and knob in the NAVIGATION block are used to navigate between softkey
menus or selected (highlighted) areas in a dialog box and to change numeric values in the
data entry area by stepping up or down. When selecting one of two or more objects
(softkey menus, data entry areas, etc.) to manipulate with the NAVIGATION block keys
displayed on the screen, first press the key in the “8. ENTRY Block” on page 30
to select the object to be manipulated (focus on the object) and then manipulate the
NAVIGATION block keys (knob) to move your selection (highlighted object) or change
numeric values.
In the following, you will see how the NAVIGATION block keys work in both the softkey
menu and the data entry area. For more on manipulating tables and dialog boxes, refer to
the manipulation procedure for each of those functions.
Operation in softkey menu (softkey menu is selected)
When the focus is on the softkey menu (the menu title area in the uppermost part is
displayed in blue), the NAVIGATION block keys work as described below.
Table 2-5
Knob
(turned clockwise or
counterclockwise)
Key
Key
Key
Knob (pressed) or
key
After pressing the data entry softkey, the focus automatically moves to the data entry area.
Operation in data entry area (data entry area is selected)
When the focus is on the data entry area (the data entry bar is displayed in blue), the
NAVIGATION block keys work as described below.
Knob
(turned clockwise or
counterclockwise)
Moves the softkey selection (highlighted display) up or
down.
Moves the softkey selection (highlighted display) up or
down.
Displays the softkey menu one layer above.
Displays the softkey menu one layer below.
Executes the function of the selected softkey.
Increases or decreases the numeric value in the data entry
area in small steps.
Keys
28 Chapter 2
Increases or decreases the numeric value in the data entry
area in large steps.
Page 35

Table 2-5
Overview of Functions
Front Panel: Names and Functions of Parts
Keys
Knob (pressed) or
key
Moves the cursor (|) in the data entry area laterally back
and forth. Use it together with the “8. ENTRY Block” keys
to change data one character at a time.
Finishes the entry in the data entry area and moves the
focus to the softkey menu.
2. Overview of
Functions
Chapter 2 29
Page 36

Table 2-6
Overview of Functions
Front Panel: Names and Functions of Parts
8. ENTRY Block
A group of keys used for entering numeric data.
. . .
Keys (numeric keys)
Key
Keys
Key
Key
Key
T ype numeric characters and a decimal point at the position
of the cursor in the data entry area.
Alternately changes the sign (+, −) of the numeric value in
the data entry area.
Adds a prefix to the numeric data typed by using the
numeric key and and then enters that data. One of the
two prefixes written on the surface of the key is
automatically selected depending on the parameter to be
entered. is entered without a prefix being given.
Turns off the data entry bar if it is displayed. If the dialog
box is displayed, cancels the entry and close the dialog box.
If the data entry bar and dialog box are not displayed, turns
the softkey menu display on/off.
Deletes the character to the left of the cursor (|) in the data
entry area. When two or more characters in the data entry
area are selected (highlighted), deletes all the characters
selected.
Changes the selection (focus) between the objects to be
manipulated by the keys for “7. NAV IGATION Block” on
page 28 and “8. ENTRY Block” on page 30.
“7. NAVIGATION Block”: The objects to be manipulated
by the “8. ENTRY Block” keys include softkey menus,
data entry areas, tables (e.g., segment tables, limit tables,
and marker tables), and dialog boxes. When two or more of
these are displayed on the screen and need selecting, use
this key to change the selection (focus) between the objects
to be manipulated. When a softkey menu is selected, the
menu name area at the top of the menu is displayed in blue.
When a data entry area is selected, the data entry bar is
displayed in blue. When a table is selected, the frame of the
table window is displayed in light gray.
While a dialog box is displayed, the focus is fixed on the
dialog box and cannot be changed.
30 Chapter 2
Page 37

Table 2-7
Overview of Functions
Front Panel: Names and Functions of Parts
9. INSTR STATE Block
A group of keys related to the macro function, store and call function, control/management
function, and the presetting of the E5052A (returning it to the preset state).
Key
Key
Key
Key
Key
Displays the “Macro Setup Menu” in the right part of the
screen. Manipulating the “Macro Setup Menu” enables you
to start up the VBA editor, or create, call, or store a VBA
project.
Executes a VBA procedure called “main” that has a VBA
module named Module1.
Stops the VBA procedure being executed.
Displays the “Save/Recall Menu” in the right part of the
screen. Manipulating the “Save/Recall Menu” enables you
to store to or read from the internal hard disk or floppy disk
the setup conditions and trace data of the analyzer.
First, temporarily saves the data for the image displayed on
the LCD screen at the moment the key is pressed to the
internal memory (clipboard). Immediately afterwards, it
displays the “System Menu” on the right side of the screen.
Manipulating the “System Menu” enables you to define the
setup for the control and management of the analyzer.
Using the
Dump Screen Image key enables you to store
the image data in the clipboard to a file on the internal hard
disk or a floppy disk. Also, using the
Print key in the
System menu enables you to print the image data in the
clipboard to a printer.
2. Overview of
Functions
Key
Displays the “Preset Menu” on the right side of the screen.
Pressing
Factory enables you to return the analyzer to the
initial setup state. For the initial setup for each of the
functions, see Appendix C, “List of Default Values,” on
page 365. Pressing
User recalls the Autorec.sta in the F
drive.
Chapter 2 31
Page 38

Overview of Functions
Front Panel: Names and Functions of Parts
10. MKR/ANALYSIS Block
A group of keys used to control the markers in analyzing the measurement results. For
more on the functions of the keys in the MKR/ANALYSIS block, see Chapter 2 “Overview
of Functions” in the User’s Guide.
Table 2-8
Key
Key
Key
Key
Displays the “Marker Menu” on the right side of the screen.
Manipulating the “Marker Menu” enables you to turn the
markers on/off and to move them by entering stimulus values.
You can place up to 6 markers on each trace.
Displays the “Marker Search Menu” on the right side of the
screen. Manipulating the “Marker Search Menu” enables you to
move a marker to a specific point (maximum, minimum, peak,
and a point with a target value) on a trace. You can also find and
display the bandwidth parameters (up to six).
Displays the “Marker To Menu” in the right part of the screen.
Manipulating the “Marker To Menu ” enables you to specify the
marker sweep range and the coupling of markers within a
measurement and to display statistical data on traces.
Displays the “Analysis Menu” on the right side of the screen.
Manipulating the “Analysis Menu” enables you to use the
analytical functions.
11. DUT Interface
A port used to connect the DUT. It has a DC CONTROL port, DC POWER port, and RF
port. The connector type of each port is given below.
RF port: 50 Ω, N-type, female connector
DC CONTROL port, DC POWER port: BNC, female connector
CAUTION Do not apply a DC voltage or current to the individual ports of the DUT interface.
Applying a DC voltage or current may lead to device failure. In particular, there is the risk
of the capacitor remaining charged. Connect the measurement sample (DUT) to the port (or
the test fixture, cables, etc. connected to the port) after the analyzer’s power has been
completely discharged.
The individual ports comply with Installation Category I of IEC 61010-1 and Measurement
Category I of IEC 61010-1.
32 Chapter 2
Page 39

Overview of Functions
Front Panel: Names and Functions of Parts
12. OPTIONAL RF Ports
For the firmware version A.01.50, th ese po rts are already connected and ready to operate;
the user does not have to connect them.
For the firmware version A.02.00, the user have to connect these ports when the E5053A
microwave downconverter are used with the E5052A.
2. Overview of
Functions
Chapter 2 33
Page 40

Overview of Functions
LCD Screen: Names and Functions of Parts
LCD Screen: Names and Functions of Parts
This section describes the names and functions of the parts on the E5052A’s LCD screen.
Figure 2-2 Screen Display
34 Chapter 2
Page 41

Overview of Functions
LCD Screen: Names and Functions of Parts
1. Data Entry Bar
Used to enter numeric data into the E5052A. Press a hardkey or softkey to enter data, and
the data entry bar will appear at the top of the screen. To assign a title to a measurement
window, the entry bar also allows you to enter letters and symbols by using the front panel
keys or mouse.
Figure 2-3 Data Entry Bar
NOTE T o manipulate the data entry bar with the front panel keys, it has to be selected as the object
to manipulate (focus placed on it). When the focus is placed on the data entry bar , the entire
bar is displayed in blue. Pressing or clicking on of “8. ENTRY Block” on page 30
enables you to move the focus to the desired object.
2. Overview of
Functions
1-1. Parameter Name
Displays the name of the parameter for which data will be entered.
1-2. Data Entry Area
When the data entry bar is displayed for the first time, the current settings are displayed on
it. You can change numeric values by typing from the keyboard or in the ENTRY block on
the front panel.
1-3. Step Button (Small)
Increases or decreases the numeric value in the data entry area in small steps. Use the
mouse to manipulate these buttons.
1-4. Step Button (Large)
Increases or decreases the numeric value in the data entry area in large steps. Use the
mouse to manipulate these buttons.
1-5. Close Button
Closes the data entry area (turns off the display). Use the mouse to manipulate this button.
Chapter 2 35
Page 42

Overview of Functions
LCD Screen: Names and Functions of Parts
2. Softkey Menu Bar
A group of keys on the screen called up by the hardkeys or menu bars. You can manipulate
these keys by using the NAVIGATION block keys on the front panel, the mouse, or the
keyboard. You can perform manipulations by directly touching the screen with your finger
instead of using a mouse.
Figure 2-4 Softkey Menu Bar
NOTE T o manipulate a menu bar , it has to be selected as the object to manipulate (focus placed on
it). When the focus is placed on a menu bar, any of the softkeys may be highlighted. An
example of the focus not being placed on the menu bar is when it’s on the data entry bar.
2-1. Softkey Menu Title
The title of the softkey menu is displayed here. Double-clicking on this part of the menu
bar displays the top layer of softkeys.
2-2. Scroll Arrow (Large)
When the softkeys in a menu overflow the screen, using this key enables you to scroll the
menu page by page. There are four scroll arrows: two for up and down and two for
returning to the top menu (at top and bottom). Use the mouse to manipulate these buttons.
2-3. Softkeys
These are the actual keys you can use to perform setup. A displayed to the right of a
softkey indicates that pressing that softkey will display the lower layer of softkeys.
36 Chapter 2
Page 43

Overview of Functions
LCD Screen: Names and Functions of Parts
2-4. Highlighted Softkey
Pressing and on the front panel or pressing on the keyboard causes the
highlighted (selected) softkey to be executed. You can change which softkey in the menu is
highlighted by turning or pressing on the front panel or by pressing
on the keyboard.
Pressing the key on the front panel or the key on the keyboard brings up the upper
level softkey menu, and pressing the key on the front panel or the key on the
keyboard brings up the lower level softkey menu.
2-5. Selection Mark
Shows which softkey function is currently selected.
2-6. Softkey Status Display
Displays the setup status of that softkey.
2-7. Scroll Bar
When the softkeys in a menu overflow the screen, clicking on the blank part of this scroll
bar enables you to scroll the softkey menu up or down.
2-8. Scroll Box
You can scroll the softkey menu up or down by using the mouse to select and drag the
scroll box (pressing the button on the object to be moved and then releasing the button at
the desired location). The length and position of the scroll box indicate the length and
position of the currently displayed part of the softkey menu relative to the entire menu.
2-9. Scroll Arrow (Small)
2. Overview of
Functions
Using this button, you can scroll the menu one softkey at a time. Both upward and
downward scroll arrows are available. Use the mouse to manipulate these buttons.
Chapter 2 37
Page 44

Overview of Functions
LCD Screen: Names and Functions of Parts
3. Instrument Status Bar
This graphical bar displays the status of the entire instrument.
Figure 2-5 Instrument Status Bar
3-1. Instrument Message/Warning
Displays instrument messages and warnings. Instrument messages are displayed in gray
and warnings in red. For the meanings of the instrument messages and warnings, see
Appendix B, “Troubleshooting,” on page 35 1.
3-2. Measurement Name/Measurement Status
Displays the measurement name and measurement status of the E5052A. Each
measurement status is described below.
Table 2-9
Hold A holding state is maintained for measurement (idling).
Man The trigger source is set to “Manual” and waiting for trigger.
Ext The trigger source is set to “External” and waiting for trigger.
Bus The trigger source is set to “Bus” and waiting for trigger.
*1
NVideo
WVideo
Meas A measurement is in progress.
*1.You can select "Narrow Video" or "Wide Video" for the transient measurement only.
The trigger source is set to “Narrow Video” and waiting for trigger.
*1
The trigger source is set to “Wide Video” and waiting for trigger.
3-3. DC Control Voltage Calibration Indicator
When the DC control voltage calibration is enabled, it is displayed in blue. When disabled,
it is displayed in grey.
38 Chapter 2
Page 45

Table 2-10
Overview of Functions
LCD Screen: Names and Functions of Parts
3-4. DC Control Voltage Status
When the DC control voltage signal output is turned on, the specified voltage is displayed.
3-5. DC Power Voltage Status
When the DC power voltage signal output is turned on, the specified voltage is displayed.
3-6. Attenuator Status
The specified attenuator value is displayed.
3-7. External Reference Signal Phase Lock
When the frequency reference signal is input to the “10. External Reference Signal Input
Connector (Ref In)” on page 48 on the rear panel and the measurement signal of the
E5052A is phase-locked to the reference signal,
ExtRef (displayed in blue) Measurement signal is phase-locked to external reference
ExtRef is displayed in blue.
signal.
ExtRef (displayed in gray) Measurement signal is not phase-locked to external
reference signal.
2. Overview of
Functions
NOTE When the phase lock function is not operated improperly, “Unlock“ is displayed in red.
Even when “9. High Stability Frequency Reference Output Connector (Ref Oven)” on
page 48 and “10. External Reference Signal Input Connector (Ref In)” on page 48 are
interconnected, the measurement signal may not be phase-locked immediately after
powered on under a cool-temperature environment (i.e. the display of “ExtRef” does not
change from grey to blue). In this case, wait a few minutes until the instrument warms-up
and “ExtRef” is displayed in blue.
3-8. VBA Status
Indicates the current status of the VBA program running on the E5052A.
Table 2-11
Run VBA program is currently running.
Stop VBA program has stopped.
Chapter 2 39
Page 46

Table 2-12
Table 2-13
Overview of Functions
LCD Screen: Names and Functions of Parts
3-9. Service Mode
Indicates the service mode status.
SVC (displayed in red) An abnormal condition has been detected inside the
E5052A. The unit may be damaged. Notify the Customer
Contact listed at the end of this brochure or the distributor
from whom the unit was purchased.
SVC (displayed in gray) The E5052A is in normal mode.
3-10. Date / Time
Displays the date and time generated by the internal clock. The display format is as
follows:
YYYY-MM-DD HH:MM YYYY: Year (AD)
MM: Month
DD: Day
HH:MM: Time (0:00 to 23:59)
You can turn the date and time display on/off by manipulating the keys: -
Setup
- Clock Setup - Show Clock.
Misc
3-11. Display Update OFF Indicator
When you have turned off updating of information displayed on the LCD screen, this
indicator is displayed.
40 Chapter 2
Page 47

Overview of Functions
LCD Screen: Names and Functions of Parts
4. Measurement Window
This provides windows for displaying traces. Because a measurement corresponds to a
window, it is called a measurement window. When the outer frame of a measurement
window is displayed in light gray, the measurement is active (the measurement for which
setup is being performed). Figure 2-2 on page 34 shows that the transient measurement is
active (lower-right window). To make a measurement active, use . Clicking
inside a measurement window will also make it active. Figure 2-6 shows a spectrum
measurement displayed in maximum screen by using .
Figure 2-6 Measurement Window
2. Overview of
Functions
Chapter 2 41
Page 48

Overview of Functions
LCD Screen: Names and Functions of Parts
4-1. Measurement Title
You can assign a title to each channel and have the title displayed in the bar. To set up the
measurement title, enter a title in display by using -
Title Label .
Edit Title Label and then toggle on/off the title
4-2. Trace Name
The names of the traces on the measurement are displayed here. to the left of the trace
name indicates the active trace (the trace for which setup is being performed). To switch
over the active trace, use .. Clicking the graph of the trace will also activate the
trace.
4-3. Scale Settings
The scale setting for each trace is displayed here. This example shows that “0.00dB/”
corresponds to 10 dB per division. “Ref -50.00.000dB” shows that the value of the
reference line is -50 dB. To specify the scale settings, use each softkey that can be
displayed by pressing the hardkey.
4-4. Trace Status Area
The setup for each trace is displayed here.
Table 2-14 Trace Status Display
Classification Contents inside the [ ] Meaning
Turning on/off traces Nothing Data trace: ON, Memory trace: OFF
M Data trace: OFF, Memory trace: ON
D&M Data trace: ON, Memory trace: ON
off Data trace: OFF, Memory trace: OFF
Performing data math:
Refer to the indication in
parentheses when the memory
trace is turned on.
Smoothing
4-5. Reference Line Indicators
These indicate the position of the reference line for the Y- axis scal e in the rect angular
display format. There is an indicator to the right of the scale ( ). To enter a numeric value
for the position of the reference line, open the data entry bar using the keys: -
Reference Position. You can also move the position of the reference line by placing the
mouse pointer on the reference line indicator (the pointer changes from to . ), moving
the indicator vertically with the left mouse button kept pressed, and then releasing the
button at the desired location (i.e., a drag-and-drop operati on).
D+M (D+M&M) Execution of Data+Mem math
D−M (D-M&M) Execution of Data−Mem math
D*M (D*M&M) Execution of Data*Mem math
D/M (D/M&M) Execution of Data/Mem math
Smo Smoothing: ON
42 Chapter 2
Page 49

Overview of Functions
LCD Screen: Names and Functions of Parts
4-6. Measurement Status Bar
The status of each measurement is displayed here (see parts 4-7 through 4-10).
4-7. Measurement Status
Displays the update status of traces on the measurement.
Table 2-15
# Invalid traces. The measurement conditions have changed, but
the traces on the measurement window currently displayed have
not been updated to match the new conditions.
(not displayed) Valid traces.
4-8. Averaging Status
Displays the averaging factor and averaging count when averaging is turned on.
Table 2-16
2. Overview of
Functions
n/m (displayed in
Averaging: ON (m: averaging factor; n: averaging count)
blue)
(not displayed) Averaging: OFF
4-9. Sweep Range
Indicates the sweep range by using the start/stop or center/span. This varies depending on
the given parameters or measurements.
4-10. Measurement Name
Indicates the measurement name.
4-11. Measur ement Parameters
Indicates the parameters specified to perform a measurement sweep at the bottom of each
measurement screen. The content may vary depending on the measurement.
4-12. X-axis Labels
X-axis divisions in the rectangular display format. To hide the divisions, select "OFF" in -
# of Digits
. (The display/nondisplay of the X-axis divisions interlocks with that of the
Y-axi s divisions.)
4-13. Y-axis Labels
Y
Y-axis divisions in the rectangular display format. The value of the reference line (the
division line indicated by ) can be entered numerically by opening the data entry bar
using the keys: -
Reference Value. You can change values of the reference line in
one division intervals by placing the mouse pointer in the area of the graticule label (the
pointer changes from to ), moving the pointer vertically with the left mouse button
pressed, and then releasing the button at the desired location. By using -
Digits
, you can select the display format of the graticule label from three options: 4 digits,
Y # of
12digis, and “not displayed.”
Chapter 2 43
Page 50

Table 2-17
Overview of Functions
LCD Screen: Names and Functions of Parts
4-14. Marker Information
The marker information is displayed in a list. It shows the marker number, marker x-axis
value, and marker measurement value from left to right. For the active marker (the one for
which setup and analysis are being performed),
number. For the reference marker, is displayed instead of the marker number.
4-15. Statistics Data
Turning on the statistics data function displays statistics data here. For more about the
statistics data function, see “Determining Mean, Standard Deviation, and Peak-to-Peak of
the Trace” on page 220.
4-16. Markers
The markers used for reading values on a trace. Up to six markers can be displayed for
each trace.
Active marker (ready for setup and analysis)
> is displayed to the left of the marker
Table 2-18
Non-active marker
Here, “n” denotes a marker number. For the reference marker, however, nothing is
displayed at the location of n. Clicking the marker or one of the “4-17. Marker Indicators”
makes the marker active.
4-17. Marker Indicators
These indicate the positions of markers on the x-axis.
Active marker indicator
Non-active marker indicator
You can also move a marker to the desired position by placing the mouse pointer on the
marker indicator or the position of the marker itself (the pointer changes from to ),
moving the indicator vertically with the left mouse button pressed, and then releasing the
button at the desired location.
44 Chapter 2
Page 51

Table 2-19
Overview of Functions
LCD Screen: Names and Functions of Parts
4-18. X-axis Bandmarkers
By turning on the x-axis band marker function, the x-axis band marker is displayed in a
specified position.
Indicator of start value of x-axis band marker
Indicator of stop value of x-axis band marker
Indicator of center value of x-axis band marker
You can also move a marker to the desired position by placing the mouse pointer on the
marker indicator or the position of the marker itself (the pointer changes from to ),
moving the indicator vertically with the left mouse button pressed, and then releasing the
button at the desired location.
4-19. Y-axis Bandmarkers
2. Overview of
Functions
Table 2-20
By turning on the y-axis band marker function, the y-axis band marker is displayed in a
specified position
Indicator of start value of y-axis band marker
Indicator of stop value of y-axis band marker
Indicator of center value of y-axis band marker
You can also move a marker to the desired position by placing the mouse pointer on the
marker indicator or the position of the marker itself (the pointer changes from to ),
moving the indicator up or down with the left mouse button pressed, and then releasing the
button at the desired location.
4-20. Bandmarker information
Turning on the x-axis or y-axis band marker function will display the corresponding band
marker information on a list in the order of start, stop, center and span.
Chapter 2 45
Page 52

Overview of Functions
Rear Panel: Names and Functions of Parts
Rear Panel: Names and Functions of Parts
This section describes the names and functions of the parts on the rear panel of the
E5052A.
Figure 2-7 Rear Panel
46 Chapter 2
Page 53

Overview of Functions
Rear Panel: Names and Functions of Parts
1. 24-bit I/O Port
The terminal to which an automatic machine (handler) used on a production line is
connected. For more about using the 24-bit I/O port, see the Programmer’s Guide.
Connector type: 36-pin Ribbon (centronics) connector
2. LAN Port
A terminal for connecting the E5052A to a LAN (Local Area Network). Connecting this
instrument to a LAN enables you to access the hard disk drive of the instrument from an
external PC or to control this instrument by using SICL-LAN or telnet.
Connector type: 8-pin RJ-45 connector
Base standard: 10Base-T/100Base-TX Ethernet (automatic data rate selection)
3. External Monitor Output Terminal (Video)
The terminal to which an external color monitor (display device) is connected. By
connecting the color monitor to this terminal, the same information shown on the LCD
screen of the main body can be displayed on an external color monitor.
2. Overview of
Functions
Connector type: 15-pin VGA connector, female
4. GPIB Connector
General Purpose Interface Bus (GPIB). The connection of an external controller and other
devices through this connector allows you to configure an automatic measurement system.
For more on automatic measurement systems via GPIB, see the Programmer’s Guide.
5. External Trigger Input Connector (Ext Trig)
External trigger signals are input through this connector, which detects the downward
transition from the HIGH state in TTL signals as the trigger signal. T o use this connector to
generate a trigger, you must set the trigger source to the “external” side (key operation:
-
Source - External).
Connector type: BNC connector, female
6. Fan
The cooling fan for controlling the temperature inside the E5052A. This fan exhausts
heated air from inside the analyzer to the outside.
7. Line Switch (Always ON)
Always keep this switch on (|).
CAUTION Do not use this switch to turn off ( ) the mains. Doing so may cause the analyzer to
fail. For more information, see the description of the “1. Standby Switch” on page 23.
Chapter 2 47
Page 54

Overview of Functions
Rear Panel: Names and Functions of Parts
8. Power Cable Receptacle (to LINE)
The receptacle (outlet) to which the power cable is connected.
NOTE To feed power, use the included three-prong power cable with a ground conductor.
The plug attached to the power cable (on the power outlet side or device side of the cable)
serves as the disconnecting device (device that cuts off power supply) of the E5052A.
When the power supply must be cut off to avoid danger such as electric shock, pull out the
power cable plug (on the power outlet side or device side of the cable). The procedure for
turning off the mains in normal use is given in “1. Standby Switch” on page 23.
For more about the power supply, see Chapter 3, “Installation,”.
9. High Stability Frequency Reference Output Connector (Ref Oven)
A connector from which the reference signals are output.
Connector type: BNC connector, female
Output signal (Nominal): 10 MHz, +0 dBm ±3 dB
10. External Reference Signal Input Connector (Ref In)
The reference signal input connector for phase-locking the measurement signal from the
E5052A to the external frequency reference signal. Inputting the reference signal via this
connector improves the accuracy and stability of the frequency of the measurement signal
from the E5052A.
Connector type: BNC connector, female
Intput signal (typical): 10 MHz ± 10 Hz, − 6 dBm to + 16 dBm
NOTE When the frequency reference signal is input to this connector, the measurement signal
from the E5052A is automatically phase-locked to the reference signal. When an inpu t
signal is not present, the frequency reference signal inside the E5052A is automatically
used. The
phase-locked to the external reference signal and in gray when it is not phase-locked.
ExtRef on the instrument status bar is displayed in blue when the system is
11. Internal Reference Signal Output Connector (Ref Out)
A connector for outputting the internal frequency reference signal from the E5052A. By
connecting this output connector to the external reference signal input connector of another
device, the device can be phase-locked to the internal reference signal of the E5052A and
used under this condition.
Connector type: BNC connector, female
Output signal (typical): 10 MHz ± 50 Hz, + 2.5 dBm ±3 dB
Output impedance (typical): 50 Ω
12. Serial Number Plate
The seal showing the serial number of the product.
48 Chapter 2
Page 55

Overview of Functions
Rear Panel: Names and Functions of Parts
13. Certificate of Authenticity Label
The label showing the information of the “Certificate of Authenticity.”
14. Rear USB port
A USB (Universal Serial Bus) port (number of ports: 2) specifically for a USB/GPIB
interface or a printer.
15. Reserved Port (Reserved)
Using these two ports is not allowed. No connections.
16. Printer Parallel Port
The 25-pin parallel port for printer connection. Connecting a designated printer to this port
allows screen information on the E5052A to be printed. For more on printing, see “Printing
Screen Image” on page 245.
17. Mini-DIN Keyboard Port
The port to which a mini-DIN type keyboard is connected. The keyboard can be used to
edit VBA programs inside the E5052A or to enter file names. Since the arrow keys and
numeric keys on the keyboard work in the same way as the arrow keys and numeric keys
on the front panel of the E5052A, you can use it instead of front panel operation.
NOTE Be sure to only use a keyboard designated for use with this instrument. Using a keyboard
other than those designated may cause erroneous input.
18. Mini-DIN Mouse Port
The port to which a mini-DIN type mouse is connected. Using a mouse enables you to
more efficiently perform the operations of menu bars, softkeys, and dialog boxes as well as
selecting an active channel or an active trace. The mouse also enables you to move a
marker or the scale reference line by using drag-and-drop operations.
2. Overview of
Functions
NOTE Be sure to only use a mouse designated for use with this instrument. Using a mouse other
than those designated may cause erroneous input.
19. USB (USBTMC) Interface Port
Through this port, you can control the E5052A from external controllers. For more
information on the measurement system using the USB port, see the Programmer's Guide.
Connector Types: Universal serial bus (USB) jack, type B (4 contact positions), Female
Compliance Standards: USBTMC-USB488 and USB2.0
Chapter 2 49
Page 56

Overview of Functions
Rear Panel: Names and Functions of Parts
50 Chapter 2
Page 57

3 Installation
3. Installation
This chapter provides information on how to set up the Agilent E5052A signal source
analyzer and on daily maintenance.
51
Page 58

Contents of this
Chapter
Installation
R Checking the Shipment on page 53
After you receive the analyzer, check all of the items in the packing container.
R Environmental Requirements on page 56
Describes the system requirements needed to install the E5052A and how to
secure space for heat radiation.
R Installing Front Handles/Rack Mounting Flanges on page 59
Shows how to mount the front handles used to transport the E5052A and how to
install the flanges needed to install it in a rack.
R Connecting the Accessories on page 62
Provides information for connecting the mouse, keyboard, and LAN cable to the
E5052A.
R Power Supply and Blown Fuses on page 65
Shows how to check the power supply as well as how to check and connect the
power cable. This section also explains how to handle a blown fuse.
R Starting the E5052A on page 68
Describes turning on/off of the Power switch and cutting off the power supply.
R Initial Registration of E5052A on page 70
Describes initial registration of the Windows 2000 operating system.
R Setting the Internal Clock on page 73
Explains how to set the internal clock.
R Daily Maintenance on page 75
Describes the required daily maintenance for the E5052A.
52 Chapter 3
Page 59

Installation
Checking the Shipment
Checking the Shipment
After you receive the analyzer, inspect the contents during unpacking according to the
following procedure.
WARNING When unpacking the analyzer, if an external surface of the analyzer (such as the
cover, front/rear panel, LCD screen, power switch, and port connectors) appears to
have been damaged during transport, do not turn on the power switch. In an extreme
case, this my result in your getting an electric shock.
Step 1. Check that the packing box or shock-absorbing material used to package the analyzer has
not been damaged.
NOTE If the packing box or shock-absorbing material has been damaged, leave the packing box
and shock-absorbing material as is until other inspections are made as follows:
Step 2. Check the packaged items supplied with the analyzer for any damage or defect.
Step 3. By referring to Table 3-1 and Figure 3-1, check that all packaged items supplied with the
analyzer have been provided as per the specified options.
Step 4. After checking, if one of the following applies, contact your nearest Agilent Technologies
sales and service office.
3. Installation
1. The packing box or shock-absorbing material used to package the analyzer has been
damaged or the shock-absorbing material shows evidence where extreme force has
been applied.
2. A packaged item supplied with the analyzer has mechanical damage or defects.
3. An item that should be packaged with the analyzer is missing.
4. A fault has been detected in the subsequent operation check of the analyzer.
If an abnormality is detected in Step 1, contact the company that transported the analyzer
as well as your nearest Agilent Technologies sales and service office. For inspection by the
transport company, save the packing box, shock-absorbing material, and packaged items as
you received them.
Chapter 3 53
Page 60

Installation
Checking the Shipment
Table 3-1 Items Packaged with the E5052A
Name Agilent Product/
Part Number
Standard Accessories
R E5052A E5052A 1
R Power cable
*1
R CD-ROM (of the manual)
*2
-1
E5052-9050x 1
R CD-ROM (of the Agilent IO Libraries Suite) E2094-60003 1
R System recovery disk E5052-16000 1
R BNC adaptor 1250-1859 1
Options
R Keyboard (Option 810) - 1
R Mouse (Option 820) - 1
R Manual (Option ABA)
*3
• User’s Guide E5052-900x0 1
• Programmer’s Guide E5052-900x1 1
• VBA Programmer ’s Guide E5052-900x2 1
R Handle Kit (Option 1CN)
*4
R Rack Mount Kit Without Handles
(Option 1CM)
*4
R Rack Mount Kit With Handles
(Option 1CP)
*4
5063-9230 1
5063-9217 1
5063-9224 1
Qty
*1.This accessory varies from country to country. For an illustration of the power cable
options, see Figure 3-8.
*2.The CD-ROM contains the same information as in the User’s Guide, Programmer’s
Guide, VBA Programmer’s Guide. The “xx” in the part number is a number that is
incremented each time a revision is made, with “00” regarded as the first edition. The
network analyzer will always be supplied with the latest versions of these items.
*3.The “x” in the part number of the Manual is a number that is incremented each time a
revision is made, with “0” regarded as the first edition. The network analyzer will
always be supplied with the latest versions of these items.
*4.This accessory is not shown in Figure 3-1. For details, see Table 3-3 on page 59.
54 Chapter 3
Page 61

Figure 3-1 E5052A accessories
Installation
Checking the Shipment
3. Installation
Chapter 3 55
Page 62

Installation
Environmental Requirements
Environmental Requirements
Set up the E5052A in a location where the following environmental requirements are met.
Operating environment
Ensure that the operating environment meets the following requirements.
Temperature 10°C to 40°C
Temperature range at the
error-correction
Humidity
Altitude 0 to 2,000 m (0 to 6,561 feet)
Vibration 0.21 G maximum, 5 Hz to 500 Hz
NOTE The above environmental requirements are not intended for the specifications and
measurement accuracy of the analyzer but for the operating environment of the analyzer .
23°C ±5°C (<1°C deviation from the temperature
when performing the error-correction)
20% to 80% at wet bulb temperature <+29 °C
(non-condensation)
56 Chapter 3
Page 63

Installation
Environmental Requirements
Ventilation requirements
To ensure compliance with safety requirements, as well as the specifications and
measurement accuracy of the analyzer, you must maintain an environmental temperature
that is within the specified range by providing appropriate cooling clearance around the
analyzer (or, for the rackmount type, by forced air - cooling inside the rack housing). For
more information on the environmental temperature needed to satisfy the specifications
and measurement accuracy of the analyzer, see the Chapter 10, “Specifications and
Supplemental Information.”
When the environmental temperature around the analyzer is kept within the temperature
range of the operating environment specification (see the section on “Operating
environment” on page 56), the analyzer conforms to the requirements of the safety
standard. Furthermore, under that temperature requirement, the analyzer still conforms to
the requirements of the safety standard even when the analyzer is placed with the following
cooling clearance:
Requirement
Back ≥180 mm
Sides ≥60 mm (both right and left)
Figure 3-2 Ventilation space needed for installation
3. Installation
Chapter 3 57
Page 64

Installation
Environmental Requirements
Protection against electrostatic discharge (ESD)
Set up a static-free workstation to protect the electronic components against damage by
electrostatic discharge (ESD) as shown in Figure 3-3.
Figure 3-3 Example of static-free workstation
Ensuring adequate free space around analyzer for immediate
disconnection of power cable in case of emergency
As described in “Disconnection from supply source” on page 69, the power supply is
disconnected by removing the power cable’s connector plug from either the AC outlet or
the E5052A unit. When installing the E5052A, ensure that there is sufficient free space
around the unit to permit quick disconnection of the plug (from AC outlet or E5052A unit)
in case of emergency.
58 Chapter 3
Page 65

Installing Front Handles/Rack Mounting Flanges
Installing Front Handles/Rack Mounting Flanges
The E5052A can be installed on a workbench or in a rack. This section describes how to
install the front handles (Option 1CN) used for transporting the instrument and how to
install the analyzer in an equipment rack as part of a measurement system (Option 1CM:
without handles, Option 1CP: with handles).
Table 3-2 Agilent E5052A handles/rack mounting options
Option Name Agilent Part Number
1CN Handle Kit 5063-9230
1CM Rack-mount Kit 5063-9217
1CP Rack-mount and Handle Kit 5063-9224
Table 3-3 Contents of each option
Option Contents Quantity
Installation
1CN
1CM
1CP
Front Handles 2
Screws 6
Trim Strips 2
Rack-mounting flanges (locking side plate) 2
Screws 6
Rack-mounting flanges (locking side plate) 2
Front Handles 2
Screws 8
3. Installation
Chapter 3 59
Page 66

Installation
Installing Front Handles/Rack Mounting Flanges
Figure 3-4 Installing front handle/rack-mount kits
How to install the handle kit (Option 1CN)
The handle kit is used for transport and relocation of the E5052A. While referring to Figure
3-4, install the handle kit by following these steps.
Step 1. Remove the adhesive-backed trim strip (1) from each side of the outer frame of the
E5052A front panel.
Step 2. Use the provided screws to mount the front handles (2) on each side of the E5052A front
panel frame.
Step 3. Attach the provided modified trim strip (3) to each front handle in order to cover the front
panel locking screws.
WARNING If the installed front handle becomes damaged, replace it with a new one immediately.
A damaged handle can break while moving or lifting the instrum e nt and cause
personal injury or damage to the instrument.
60 Chapter 3
Page 67

Installation
Installing Front Handles/Rack Mounting Flanges
How to install the rack-mount kit (Option 1CM)
The rack-mount kit includes two flanges (locking side plates) for mounting the E5052A on
a rack (482.6 mm/19 inches), conforming to the EIA Standard. While referring to Figure
3-4, install the rack-mount kit by following these steps.
Step 1. Remove the adhesive-backed trim strip (1) from each side of the outer frame of the
E5052A front panel.
Step 2. Use the provided screws to mount a rack-mounting flange (4) on each side of the E5052A
front panel frame.
Step 3. Remove the four bottom feet of the E5052A (lift the bar marked TAB on the inner side of
the foot and slide the foot toward the bar).
Step 4. Mount the E5052A on the rack.
How to install the rack-mount and handle kit (Option 1CP)
The rack-mount and handle kit includes both the rack-mounting flanges (locking side
plates) and front handles. While referring to Figure 3-4, install the rack-mount kit by
following these steps.
Step 1. Remove the adhesive-backed trim strip (1) from each side of the outer frame of the
E5052A front panel.
Step 2. Use the provided screws to mount a front handle (2) and rack-mounting flange (4) on each
side of the E5052A front panel frame.
CAUTION Be sure to use both the front handles and the rack-mounting flanges at the same time.
Do not attempt to install flanges or handles separately with the hardware provided,
since this risks serious electrical damage to the instrument.
Step 3. Remove the four bottom feet of the E5052A (lift the bar marked TAB on the inner side of
the foot and slide the foot toward the bar).
Step 4. Mount the E5052A on the rack.
3. Installation
Chapter 3 61
Page 68
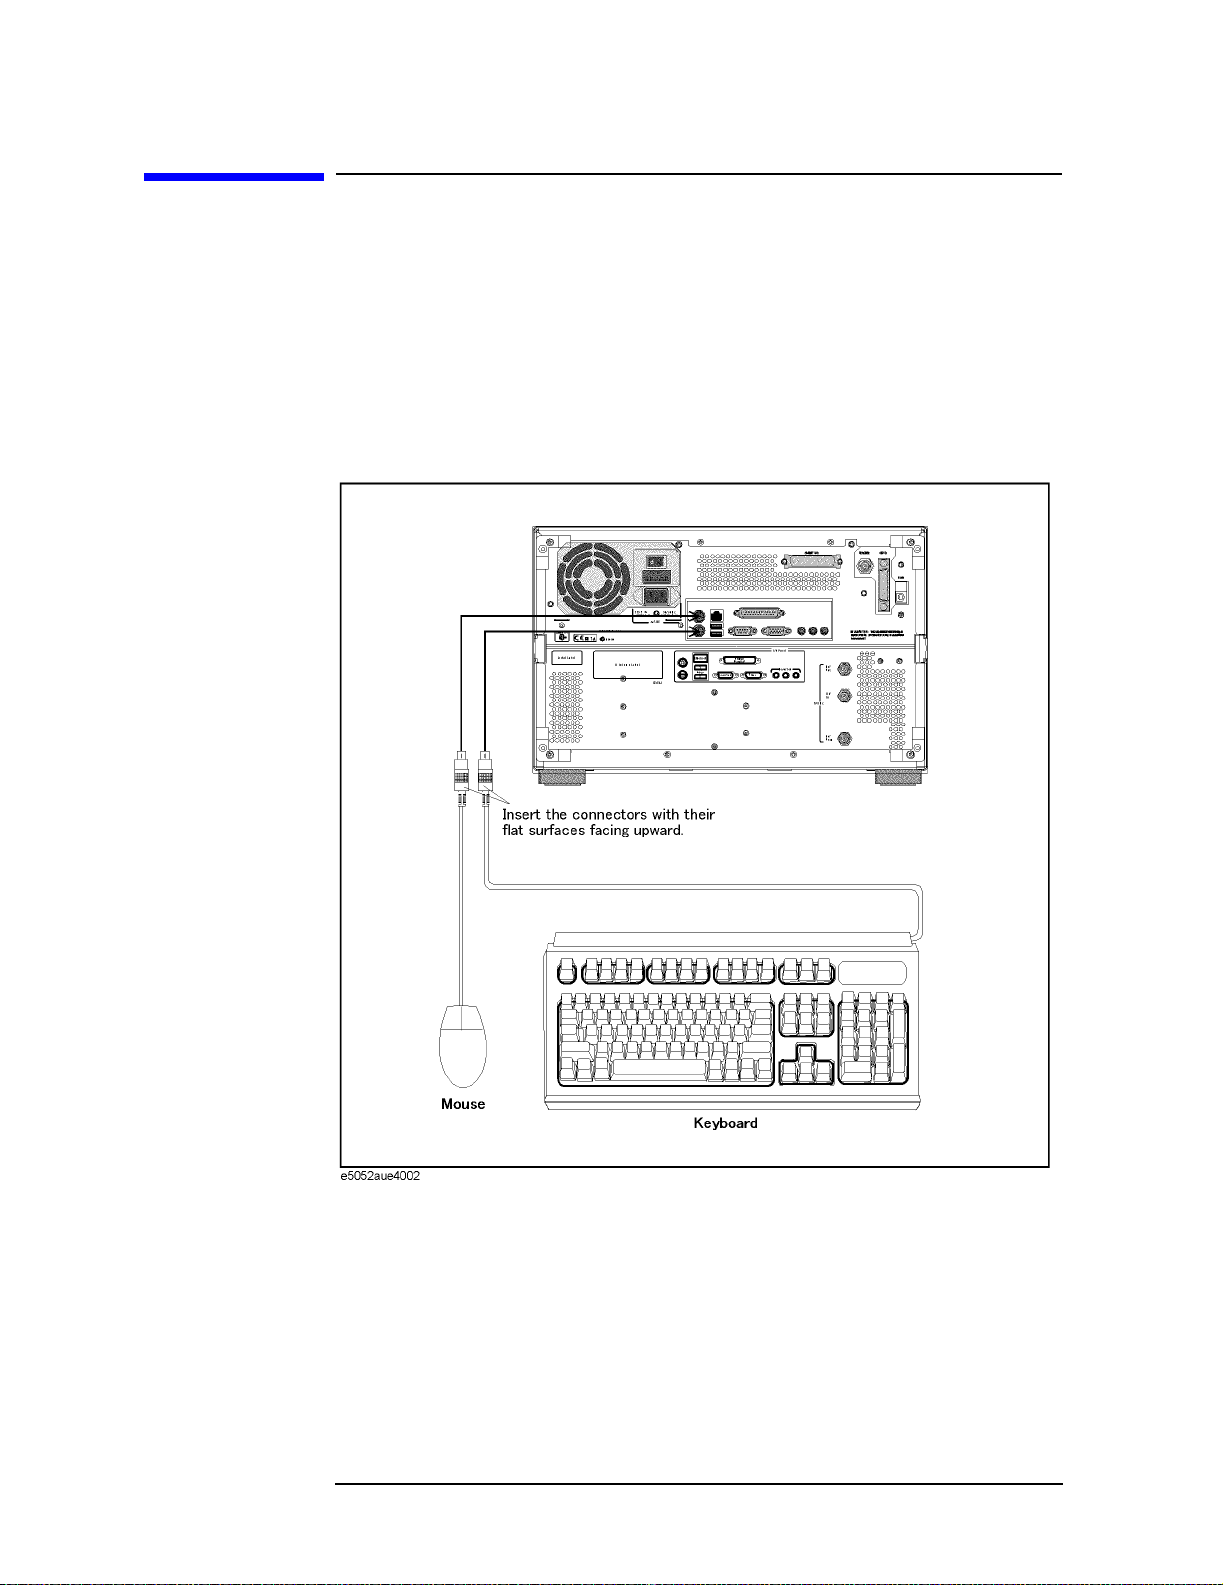
Installation
Connecting the Accessories
Connecting the Accessories
The E5052A allows you to connect a variety of accessories using the USB ports on the
front panel or each of the ports on the rear panel.
Connecting the mouse and keyboard
As shown in Figure 3-5, connect the mouse and keyboard to the mini-DIN mouse port and
mini-DIN keyboard port, respectively, before turning ON the power.
Figure 3-5 Connecting mouse and keyboard
62 Chapter 3
Page 69

Connecting a LAN cable
When using a LAN (local area network), follow the procedure below to connect the
E5052A to the LAN.
Step 1. By referring to the Chapter 8, “Setting and Using the Control and Management Functions,”
on page 267, set up the E5052A LAN.
Step 2. As shown in Figure 3-6, connect a LAN cable to the LAN port on the rear panel of the
E5052A.
Figure 3-6 Connecting LAN cable
Installation
Connecting the Accessories
NOTE When connecting the E5052A to a LAN for use, consult the network administrator about
the proper LAN settings.
Do not connect a LAN cable until the proper LAN settings have been made. Connecting
the E5052A to a LAN with improper settings may cause a problem in the network.
3. Installation
Chapter 3 63
Page 70

Installation
Connecting the Accessories
Connecting a printer
When using a compatible printer, connect it to the printer parallel port or USB (Universal
Serial Bus) port on the rear panel of the E5052A as shown in Figure 3-7.
For a list of printers that work with the E5052A in its factory-shipped condition, see the
Chapter 6, “Data Analysis and Result Output.”
Figure 3-7 Connecting a printer
64 Chapter 3
Page 71

Installation
Power Supply and Blown Fuses
Power Supply and Blown Fuses
Before turning on the E5052A power, check the following important items.
Verification of the power supply
Confirm that the power supplied to the E5052A meets the following requirements:
Requirement
Vol tage
Frequency 47 to 63 Hz
Maximum power consumption 500 VA
*1. Switched automatically by the E5052A in conformity to the voltage used.
90 to 132 VAC or 198 to 264 VAC
*1
Verification and connection of power cable
The three-wire power cable attached to the E5052A has one wire serving as a ground.
Using this power cable allows the E5052A to be grounded, thereby protecting you against
electrical shock from the power outlet.
Step 1. Confirm that the power cable is not damaged.
WARNING NEVER use a power cable showing any sign of damage. Faulty cables can cause
electrical shock.
Step 2. Use the supplied cable to connect between the power cable receptacle (Figure 3-9 on
page 69) on the rear panel of the E5052A and a three-wire power outlet, with the grounding
prong firmly connected in the ground slot.
WARNING Use the supplied power cable with grounding wire to securely ground the E5052A.
3. Installation
Figure 3-8 shows the power cable options.
Chapter 3 65
Page 72

Installation
Power Supply and Blown Fuses
Figure 3-8 Power cable options
66 Chapter 3
Page 73

Installation
Power Supply and Blown Fuses
Blown fuses
If the fuse appears to have blown during operation, this instrument may be subject to
failure and must be repaired. Ship the E5052A to the nearest Agilent T echnologies Service
Center according to the section on “Considerations When Shipping to a Service Center
Due to Breakdown or Other Problems” on page 76
The product uses the following fuse type: UL/CSA T ype, Slow-Blo, 8 A-250 V.
WARNING Do NOT replace the fuse yourself; doing this may expose you to dangerous electrical
shock.
3. Installation
Chapter 3 67
Page 74

Installation
Starting the E5052A
Starting the E5052A
This section explains how to turn on/off the E5052A power, how to cut off the power
supply in an emergency, and how to set the internal clock.
Turning the Power ON and OFF
Perform the following steps to turn the power ON or OFF .
Turning the Power ON
Step 1. If the standby switch ( ) in the low er-left part of the front panel is in the depressed
( ) position, press it to put it in the popped-up position ( ).
Step 2. Press the standby switch to put it in the depressed position ( ).
This operation turns ON the power, and the E5052A starts the self-test.
Step 3. Confirm that the self-test indicates normal operation.
Normal operation is confirmed by the self-test if no error message appears.
Turning the Power OFF
Step 1. Use either of the following methods to turn the power OFF.
• Press the standby switch ( ) in the lower-left part of the front panel (now in the
depressed ( ) position) to put it in the popped-up ( ) po si tion.
• Send the shutdown command from an external controller.
These operations will start the E5052A shutdown process (required software and hardware
processes for turning the power off), and the power will turn OFF after a few seconds.
NOTE Under normal circumstances, always press the standby switch ( ), or send the shutdown
command from an external controller, to execute the E5052A shutdown process. Never cut
off the power supply directly by disconnecting the power cable plug from the rear
panel of the unit.
If the power supply is cut off directly by disconnecting the power cable plug from the
instrument or the AC outlet, the shutdown process is not carried out and there is a risk of
damage to the E5052A’s software or hardware.
68 Chapter 3
Page 75

Figure 3-9 Line switch (Always ON) and power cable receptacle
Installation
Starting the E5052A
Disconnection from supply source
The power supply of the E5052A is cut off by disconnecting the plug of the power cable
(on either AC outlet side or E5052A side). When it is necessary to disconnect the power
supply in order to avoid shock hazards, etc., pull out the power cable plug from either the
AC outlet side or the E5052A side.
NOTE T o allow this to be done smoothly, be sure to follow the guidelines in “Ensuring adequate
free space around analyzer for immediate disconnection of power cable in case of
emergency” on page 58.
When turning the power OFF under normal circumstances, always follow the methods
described in “Turning the Power OFF” on page 68.
3. Installation
Chapter 3 69
Page 76

Installation
Initial Registration of E5052A
Initial Registration of E5052A
When you start up the E5052A for the first time or after executing system recovery, you
need to perform the initial registration of the Windows 2000 operating system used in the
E5052A.
NOTE You cannot use the front panel keys during the initial registration of the E5052A, so be sure
to connect the mouse and keyboard before turning on the power.
NOTE If you perform the following procedure incorrectly, a message appears asking whether to
return to the previous registration screen and perform the registration again. In this case,
follow the instruction to return to the previous registration screen.
Step 1. Turns on the E5052A.
Step 2. The Windows 2000 Professional Setup Wizard appears. Click the
3-10).
Figure 3-10 Windows 2000 Professional Setup Wizard
Next > button (Figure
70 Chapter 3
Page 77

Step 3. In the Windows 2000 Professional Setup dialog box, select the I accept this agreement
box and click the
Next >button (Figure 3-11). Then, the Windows 2000 operating system
restarts automatically.
Figure 3-1 1 Windows 2000 Professional Setup dialog box
Installation
Initial Registration of E5052A
Step 4. The Network Identification Wizard appears. Click the
Figure 3-12 Network Identification Wizard
3. Installation
Next > button (Figure 3-12).
Chapter 3 71
Page 78

Installation
Initial Registration of E5052A
Step 5. In the Network Identification Wizard dialog box (1/2), select the Windows always
assumes the following user has logged on to this computer
is in the
and Confirm password box.
User Name box. If not, type in E5052. Then type in E5052 both in Password box
Click the Next> button (Figure 3-13).
Figure 3-13 Network Identification Wizard dialog box (1/2)
box and check that E5052
Step 6. In the Network Identification Wizard dialog box (2/2), click the
initial registration of the E5052A (Figure 3-14). Then, the measurement display of the
E5052A appears.
Figure 3-14 Network Identification Wizard dialog box (2/2)
Finish button to finish the
72 Chapter 3
Page 79

Installation
Setting the Internal Clock
Setting the Internal Clock
You can set the date/time displayed at the lower right of the screen. When you save data in
the storage unit, for example, the settings of the internal clock will be used for the saved
file’s information. The following describes the setting procedure by using the keys on the
front panel.
NOTE After turning on the instrument’s power for the first time after delivery, be sure to set the
internal clock.
Setting the Date/Time
Step 1. Press the [System] key in the INSTR STATE block. Press the [↓]or [↑] key to move the
focus to the
to move the focus to the
focus on the
dialog box will appear (Figure 3-15).
Misc Setup button and then press the [Enter] or [→] key. Press the [↓]or [↑] key
Clock Setup button and then press the [Enter] or [→] key . Place the
Set Date and Time button and press the [Enter] key. The Date/Time Properties
Figure 3-15 Date/Time Properties dialog box (“Date & Time” tab)
Step 2. Turn the rotary knob ( )on the front panel to place the focus on the
then press the
[→] key to move the focus to the Time Zone tab (Figure 3-16).
3. Installation
Date & Time tab and
Chapter 3 73
Page 80

Installation
Setting the Internal Clock
Figure 3-16 Date/Time Properties dialog box (“Time Zone” tab)
Step 3. Turn the rotary knob ( ) on the front panel to place the focus on the
press the
[←]/[→] or [↓]/[↑] key to select the time zone.
Time Zone box and
NOTE When you select a time zone having daylight savings time (‘summer time’), the
Automatically adjust clock for daylight saving changes box becomes selectable. To set
automatic adjustment to daylight savings time to ON, turn the rotary knob ( ) to place
the focus on the
Automatically adjust clock for daylight saving changes box and press
the rotary knob ( ) to display the √ mark (Figure 3-16).
Step 4. Turn the rotary knob ( ) on the front panel to place the focus on the
press the
[←] key to move the focus to the Date & Time tab.
Time Zone tab and
Step 5. By referring to Figure 3-15, turn the rotary knob ( ) on the front panel to place the focus
on the desired item. Press the
Step 6. Turn the rotary knob ( ) on the front panel to place the focus on the
press the
[Enter] key .
[←]/[→] or [↓]/[↑] keys to set each item.
OK button and then
Turning the Date/Time display ON and OFF
The Date/Time is displayed within the instrument status bar at the lower right of the
display screen.
Step 1. Press the
focus to the
key, move the focus to the
focus on the
on/off.
74 Chapter 3
[System] key in the INSTR STATE block. Press the [↓]or [↑] key to move the
Misc Setup button and then press the [Enter] or [→] key. Press the [↓] or [↑]
Clock Setup button, and press the [Enter] or [→]key. Place the
Show Clock button and press the [Enter] key to set the date/time display to
Page 81

Installation
Daily Maintenance
Daily Maintenance
This section provides the maintenance information for the E5052A and describes the
self-test function, which checks the instrument for failure. This section also provides
information required for shipping the E5052A due to breakdown or other problems.
Cleaning method
To clean the surface of the E5052A, wipe the surface gently with a dry cloth or soft cloth
dampened with water and wrung dry. Never attempt to clean the inside of the instrument.
WARNING To avoid electric shock, always disconnect the power cord of the E5052A from the
power outlet when cleaning.
NOTE To clean a touch-screen LCD, do not wet the cloth with water.
Occasionally, a few pixels may appear on the screen as a fixed point of blue, green or
red. Please note that this is not a failure and does not affect the performance of your
product.
Maintaining connectors/ports on test port (DUT interface)
Each port on the front panel of the E5052A has an N-type connector (female) and a BNC
connector (female). In the RF band, soil or damage on the connector or cable will affect the
measurements. The following describes how to handle and maintain these N-type
connectors and BNC connectors.
• The connectors should always be kept clean and away from dirt.
• To prevent electrostatic discharge (ESD), do not touch the contact face of the
connector.
• Never attempt to use a damaged or nicked connector.
• When cleaning, blow air onto the connector. Never attempt to use abrasives such as
emery paper.
NOTE The RF port on the front panel of the E5052A is a 50 Ω-based N-type connector (female).
Note that connecting a connector with different impedance can damage the connectors.
Self-test When Turning on the Power
3. Installation
When the power is turned on, the E5052A automatically performs a self-test. If any error is
detected by the self-test at power-on, the error message “Power on test fail” appears in the
instrument status bar. This causes the E5052A to enter the service mode. If your E5052A is
in the service mode, ship it to the nearest Agilent T echnologies Service Center by referring
to the section on “Considerations When Shipping to a Service Center Due to Breakdown or
Other Problems” on page 76.
Chapter 3 75
Page 82

Installation
Daily Maintenance
Considerations When Shipping to a Service Center Due to Breakdown or Other Problems
When shipping the E5052A to an Agilent Technologies Service Center because of
breakdown or other problems, for re-shipment use the packing box and shock-absorbing
material used to package the analyzer, or static-protective package in place of them. To find
your nearest Agilent Technologies Service Center, contact the Agilent Technologies
Customer Center displayed at the end of the Manual.
NOTE Occasionally, a few pixels may appear on the screen as a fixed point of blue, green or
red. Please note that this is not a failure and does not affect the performance of your
product.
76 Chapter 3
Page 83

4 Basic Measurement Using E5052A
This chapter describes the basic measurement procedures of the DUT using the
E5052A.The description is mainly based on the manual measurement method.
The E5052A has a measurement screen for each measurement target; and the target you
can measure may vary depending on the screen. Select measurement screens according to
your intended use.
4. Basic Measurement
Using E5052A
77
Page 84

Basic Measurement Using E5052A
Frequency/Power Measurement in Frequency/Power Measurement Mode
Frequency/Power Measurement in Frequency/Power
Measurement Mode
Overview of frequency/power measurement
For frequency/power measurements, the E5052A measures the corresponding frequency,
power and power supply DC current by sweeping the specified range of the DC
control/power given to the DUT.
The E5052A’s frequency/power measurement window has three measurement trace
screens: RF power measurement trace, frequency measurement trace, and power supply
DC current measurement trace. By using the individual trace screen, you can measure RF
power, frequency and power supply DC current corresponding to the DC control/power of
the DUT.
The following sections explain how to use the E5052A to make these basic measurements.
About analyzer mode and tester mode
The frequency/power measurement has two modes: analyzer mode, which analyzes input
signals for a specific range swept by DC voltage (DC control voltage or DC power
voltage), and tester mode, which performs measurement on the spot without DC voltage
sweeping.
In the analyzer mode, an individual change in frequency, RF power or power supply DC
current of the input signals for a specified range of DC voltage will be shown in a graph
and analyzed by using the marker or analysis function.
In the tester mode, the frequency, RF power or power supply DC current of the input
signals will be measured on the spot as if each was measured with dedicated single power
meter, frequency counter, and DC current meter. You can confirm each numeric value by
viewing the screen, however in this mode you cannot observe an exact change of the
signals in response to DC voltage sweeping.
Analyzer mode is not available when option 011 is installed.
Selecting Analyzer Mode or Tester Mode
Step 1. You can select either analyzer mode or tester mode by pressing the -
Analyzer mode is selected by default.
The basic settings and their examples described in the following sections assume s ig n a l
analysis using the analyzer mode.
NOTE When option 011 is installed, switching analyzer mode and tester mode is not available;
only tester mode is supported.
Mode key.
78 Chapter 4
Page 85

Frequency/Power Measurement in Frequency/Power Measurement Mode
Figure 4-1 Example of Tester Mode Screen
Basic Measurement Using E5052A
Setting Trace Layout
In frequency/power measurement mode, four traces will be displayed at the same time. The
four traces consist of two traces in frequency measurement (the unit is Hz and Hz/V), a
trace in RF power measurement (the unit is dBm) and a trace in power supply DC current
measurement (the unit is mA).
You can select the trace layout from three- or four-division mode. In each trace layout, data
will be assigned as Figure 4-2, “Trace Layout.” In the four-division mode, the upper-left
trace is frequency in Hz unit and the lower-right trace is frequency in Hz/V unit. Refer to
“Setting Frequency Format and Sensitivity Aperture” on page 94 for selecting the unit
(data format).
Step 1. Press -
Step 2. Press the desired softkey to select the trace layout.
Allocate key.
4. Basic Measurement
Using E5052A
Chapter 4 79
Page 86

Basic Measurement Using E5052A
Frequency/Power Measurement in Frequency/Power Measurement Mode
Figure 4-2 Trace Layout
80 Chapter 4
Page 87

Basic Measurement Using E5052A
Frequency/Power Measurement in Frequency/Power Measurement Mode
Common settings in RF power, frequency and power supply DC current measurement
The following section describes the common setting steps to measure RF power, frequency
and power supply DC current corresponding to the DUT’s DC control/power by using the
E5052A’s frequency/power measurement window.
Selecting Measurement Window
Step 1. Press -
Freq & Power to select the frequency/power measurement window.
NOTE You can maximize the frequency/power measurement window by pressing
key while the window is selected. You can bring up the original size when you press the
key once again.
You can select the next trace by pressing the key and maximize the target trace
by pressing the key. The frequency/power wi ndo w w ill come back when you
press the key once again.
Setting Downconverter and External mixer
Follow these steps to make the setting when using the E5053A Microwave Downconverter.
Step 1. Press -
Step 2. Press
Downconverter to toggle on/off.
Step 3. If the downconverter is on, press
Downconverter.
RF Input - Downconverter | E5052A Direct to select an
RF input source.
Step 4. If the downconverter is on and the RF input is set to Downconverter, press
-
Not Used | ON to select whether to use the external mixer.
External Mixer
NOTE For more information on the settings of the E5053A Microwave Downconverter, see
Chapter 5, “Measurement Using E5053A and External Mixer.”.
The settings when using the downconverter and the external mixer include:
• Setting of LO frequency and power
• Setting of DC bias current (CH1, CH2)
• Setting of IF gain inside downconverter
• Setting of downconverter ΔIF frequency
Procedure to Select Carrier Frequency Band
Step 1. Press -
Frequency Band .
Step 2. Select a frequency band that contains the carrier signal to be measured from the softkey
menu list. The ranges of the frequency bands are shown below.
Note that, for analyzer mode, select a frequency band that contains the frequency of the
sweep start position.
Chapter 4 81
4. Basic Measurement
Using E5052A
Page 88

Basic Measurement Using E5052A
Frequency/Power Measurement in Frequency/Power Measurement Mode
NOTE Selectable frequency bands differ depending on whether the E5053A Microwave
Downconverter is used and whether the RF input is direct input or downconverter input.
Table 4-1 Selecting Carrier Frequency Band (When E5052A is Used Standalone or with
Downconverter is Off)
Carrier frequency band
10 M to 1.5 GHz
300 M to 7 GHz
T able 4-2 Selecting Carrier F requency Band (When Down converter is On and RF Input
Set to ‘E5052A Direct’)
Carrier frequency band
10 M to 1.5 GHz
300 M to 3 GHz
T able 4-3 Selecting Carrier F requency Band (When Down converter is On and RF Input
Set to ‘Downconverter’)
Carrier frequency band
3 G to 10 GHz
9 G to 26.5 GHz
Specifying Nominal Frequency
When the downconverter setting is turned on, the RF input setting is Downconverter, and
the external mixer setting is Not Used, enter the nominal value of the carrier frequency to
detect the carrier signal.
Note that, for analyzer mode, set the frequency of the sweep start position as the nominal
frequency.
Step 1. Press -
Step 2. Enter the value of the nominal frequency in the data entry field displayed in the upper part
of the screen.
NOTE When using the downconverter RF IN port, the Nominal Frequency setting range is limited
to within the carrier frequency band, and the Nominal Frequency should be set to the actual
input signal frequency.
Nominal Frequency.
In the tester mode, use the Carrier Search function to set the nominal frequency so as to
the input signal frequency. See also “Executing Carrier Search Function” on page 96.
In the analyzer mode, the Nominal Frequency should be set to the initial frequency at the
starting voltage of the built-in DC source (either control voltage or power voltage).
82 Chapter 4
Page 89

Basic Measurement Using E5052A
Frequency/Power Measurement in Frequency/Power Measurement Mode
Specifying Maximum Input Level
When the downconverter is turned on, the RF input is set to Downconverter, and the
external mixer is set to Not Used, set the maximum input level value of the measurement
signal supplied from the input port of the E5053A Microwave Downconverter.
The maximum input level is set to determine the IF gain of the E5053A Microwave
Downconverter.
Step 1. Press -
Max Input Level.
Step 2. Enter the value of the maximum input level in the data entry field displayed in the upper
part of the screen.
NOTE In no cases other than when the downconverter is turned on, the RF input is set to
Downconverter, and the external mixer is set to Not Used, you can set the maximum input
level.
Specifying Sweep Range
Step 1. Press -
Sweep Parameter.
Step 2. Selecting from the softkey menu list, you can define a sweep operation to be performed for
either DC control or DC power. Select
Control Vo ltage for DC control and Power Voltage
for DC power.
Step 3. Press ( ) -
DC Control(Power)Start.
Step 4. Enter the sweep start value in the data entry field that appears in the upper part of the
screen.
Step 5. Press ( ) -
DC Control(Power)Stop.
Step 6. Enter the sweep stop value in the data entry field that appears in the upper part of the
screen.
NOTE Otherwise, press ( ) - DC Control(Power)Center to enter the sweep
center value in the data entry field that appears in the upper part of the screen and then
press
DC Control(Power) Span to enter the sweep span value in the same way.
The same softkey will be displayed by pressing either or
. You can
make the same settings by using either of the two keys.
Specifying Frequency Resolution, Number of Measurement Points and Delay
Step 1. Press -
Freq Resolution.
Step 2. Select the appropriate frequency resolution from the softkey menu list.The available
Chapter 4 83
4. Basic Measurement
Using E5052A
Page 90

Basic Measurement Using E5052A
Frequency/Power Measurement in Frequency/Power Measurement Mode
frequency resolutions are as follows:
Table 4-4 Frequency Resolution List
Frequency Resolution
10 Hz
1 kHz
64 kHz
Step 3. Press -
Points.
Step 4. Enter the number of measurement points in the data entry field that appears in the upper
part of the screen.
Step 5. Press -
Points Delay.
Step 6. Enter the waiting time between each measurement in the data entry field that appears in the
upper part of the screen.
About DC voltage setting and protection
You can specify the DC power/control that will be applied to the DUT. Refer to “Setting
DC power/DC control and protection” on page 86 for the setting procedure.
About Auto Frequency Control Function
If this function is turned on, the E5052A will adjust the control voltage automatically so
that the output signal frequency from the DUT may keep the specified value. For the
setting procedure, refer to the “Auto Frequency Control Function” on page 88.
Setting Average Function
Follow the steps below to use the averaging function.
Step 1. Press -
Avg Factor.
Step 2. Enter the number of times for averaging in the data entry field that appears in the upper part
of the screen.
Step 3. Press -
Averaging to turn on the averaging function.
Setting Trigger
Step 1. Press -
Source.
Step 2. Select the trigger source from the softkey menu list. The available options are as follows.
Internal is selected by default.
Table 4-5 Trigger Source List
Softkey Overview
Internal Sets trigger source to internal continuous trigger signal
84 Chapter 4
Page 91

Frequency/Power Measurement in Frequency/Power Measurement Mode
Table 4-5 Trigger Source List
Softkey Overview
Basic Measurement Using E5052A
External
*1
Sets trigger source to external trigger input connector
Manual Sets trigger source to manual operation
Bus Sets trigger source to the bus; the trigger signal is issued by the
trigger command via GPIB interface or LAN.
*1.If External is selected for the trigger source, the trigger signal must be provided by an
external instrument. Refer to “Setting External Trigger” on page 137 for the setting
procedure.
Step 3. Press - Trigger to Freq & Power to send a tri gger to the frequency /po wer
measurement. By default,
Continuous is selected for sweep.
NOTE The E5052A has four measurement functions: phase noise measurement, spectrum monitor
measurement, frequency/power measurement, and transient measurement. Because
individual measurements differ in their characteristics from one another, each of the
E5052A’s trigger is used exclusively for a single measurement.
In other words, only one measurement function can be triggered at a time, and only it can
perform measurement at that time.
Setting Averaging Trigger
Follow the steps below to use the averaging trigger.
Step 1. Press -
Average Trigger to toggle on/off the averaging trigger.
When the averaging trigger is set to on, a single activation of the trigger system can
perform the number of measurements set by the user as the averaging factor.
The following table shows how this function works by pressing -
Single when the
averaging trigger is on and off.
Averaging T rigger Operation
ON Executes state transitions among Waiting for Trigger,
Trigger , and Measurement for the number of times set for
averaging and then changes to the Hold state.
OFF Enters W aiting for Trigger state once and then changes to
the Hold state after measurement is completed.
NOTE The averaging function (“Setting Average Function” on page 84) must be set before
enabling the averaging trigger.
4. Basic Measurement
Using E5052A
Chapter 4 85
Page 92

Basic Measurement Using E5052A
Frequency/Power Measurement in Frequency/Power Measurement Mode
Setting DC power/DC control and protection
You can set the DC power or the DC control that is applied by the E5052A to the DUT not
only to protect the DUT but also to perform stable measurements.
The E5052A allows you to set the maximum and minimum allowance levels of DC
power/control that are applied to the DUT. This prevents excessive voltage from being
applied to the DUT.
Follow the steps below to set the DC voltage for the DC control measurement.
Setting DC Power
Step 1. Press -
Max Pwr Voltage Limit.
Step 2. Enter the maximum allowance voltage of DC power in the data entry field that appears in
the upper part of the screen.
Step 3. Press -
Min Pwr Voltage Limit.
Step 4. Enter the minimum allowance voltage of DC power in the data entry field that appears in
the upper part of the screen.
Step 5. Press -
DC Power Delay.
Step 6. Enter the waiting time to suppress DC power until the first measurement is finished in the
data entry field that appears in the upper part of the screen.
Step 7. Press -
DC Power Voltage.
Step 8. Enter DC power in the data entry field that appears in the upper part of the screen.
Setting DC Control
Step 1. Press -
Max Ctrl Voltage Limit.
Step 2. Enter the maximum allowance voltage of DC control in the data entry field that appears in
the upper part of the screen.
Step 3. Press -
Min Ctrl Voltage Limit.
Step 4. Enter the minimum allowance voltage of DC control in the data entry field that appears in
the upper part of the screen.
Step 5. Press -
DC Control Delay.
Step 6. Enter the waiting time to suppress DC control until the first measurement is finished in the
data entry field that appears in the upper part of the screen.
Step 7. Press -
DC Control Voltage.
Step 8. Enter DC control in the data entry field that appears in the upper part of the screen.
Pressing voltage calibration function. As necessary, press -
Execute Control Voltage Cal automatically turns on the DC control
Control Voltage Cal to turn
on/off the DC control voltage calibration function.
86 Chapter 4
Page 93

Basic Measurement Using E5052A
Frequency/Power Measurement in Frequency/Power Measurement Mode
NOTE You must perform this calibration every time you power on the instrument, since the DC
control calibration is cleared when the power is turned off.
Applying DC Power/DC Control to DUT
Step 1. Press -
Step 2. Press -
DC Power Output to turn on the DC power output.
DC Control Output to turn on the DC control output.
Chapter 4 87
4. Basic Measurement
Using E5052A
Page 94

Basic Measurement Using E5052A
Frequency/Power Measurement in Frequency/Power Measurement Mode
Auto Frequency Control Function
The automatic frequency control (AFC) function can quickly set and maintain the DUT
output frequency to the target frequency you want. It does this by controlling the internal
DC control voltage and using the measurement results obtained by its internal frequency
counter. The DC control voltage has to be turned on to use the AFC function.
The AFC status appears in the lower right corner of the measurement screen. Each
background color indicates the respective AFC function.
Blue The function is enabled.
Grey The function is disabled. Check if the DC Control Output is turned off.
NOTE The AFC starts immediately before the measurement. During a single measurement, the
DC control voltage is maintained. Therefore, the DC control voltage will not be changed
even if the actual output frequency from the DUT drifts during the measurement.
Be sure to take this into consideration for the long time measurement, for example, by
using the correlation function in the phase noise measurement.
When the external mixer is set to of, the auto frequency control function is not available.
Specifying Auto Frequency Control Function
Step 1. Press -
Step 2. Press
Min Ctrl Voltage Limit.
Auto Freq Control.
Step 3. Enter the minimum allowance voltage for DC control to be used for the Auto Frequency
Control function, in the data entry field that appears in the upper part of the screen.
NOTE Comparing the value entered here with the value specified in Min Ctrl Voltage Limit under
the menu, the E5052A will choose a higher value to apply the limit.
Step 4. Press
Max Ctrl Voltage Limit.
Step 5. Enter the maximum allowance voltage for DC control to be used for the Auto Frequency
Control function, in the data entry field that appears in the upper part of the screen.
NOTE Comparing the value entered here with the value specified in Max Ctrl Vo ltage Limit under
the menu, the E5052A will choose a lower value to apply the limi t.
Step 6. Press
Max Input Level.
Step 7. Enter the maximum level value of the measurement signal that is supplied from the Input
port of the E5053A Microwave Downconverter in the Auto Frequency Control function, in
the data entry field that appears in the upper part of the screen.
NOTE With no settings other than the downconverter is turned on, the RF input is set to
Downconverter, and the external mixer is set to Not Used, setting maximum input level is
available.
88 Chapter 4
Page 95

Basic Measurement Using E5052A
Frequency/Power Measurement in Frequency/Power Measurement Mode
Step 8. Press Frequency Band.
Step 9. Select an appropriate frequency band that contains the target carrier signal, from the
softkey menu list.
NOTE Selectable frequency bands differ depending on whether the E5053A Microwave
Downconverter is used and whether the RF input is direct input or downconverter inpu t.
Table 4-6 Selecting Carrier Frequency Band (When E5052A is Used Standalone or with
Downconverter is Off)
Carrier frequency band
10 M to 1.5 GHz
300 M to 7 GHz
T abl e 4-7 Selecting Carrier Frequency Band (When Downconverter is On and RF Input
Set to 'E5052A Direct')
Carrier frequency band
10 M to 1.5 GHz
300 M to 3 GHz
T abl e 4-8 Selecting Carrier Frequency Band (When Downconverter is On and RF Input
Set to 'Downconverter')
Carrier frequency band
3 G to 10 GHz
9 G to 26.5 GHz
Step 10. Press
Step 11. Enter the target frequency of the output from the DUT in the data entry field that appears in
NOTE In the analyzer mode, the frequency band is automatically altered so that the input signal
Target.
the upper part of the screen. The unit is [Hz].
frequency is within the band when the actual input frequency crosses the band.
Also the E5053A downconverter is automatically controlled to offset the downconverter
LO frequency to track the input signal frequency within the IF frequency being fed to the
E5052A. Note that the maximum frequency step between the two adjacent measurement
points may be limited due to the IF frequency range. Increase the number of measurement
points for the E5052A to detect the input signal frequency within the IF frequency, when
“Downconverter IF not found” error message is found.
4. Basic Measurement
Using E5052A
Step 12. Press
Step 13. Enter the tolerance (an allowable range of difference between the target frequency and the
Tolerance.
actual frequency output from the DUT) in the data entry field that appears in the upper part
Chapter 4 89
Page 96

Basic Measurement Using E5052A
Frequency/Power Measurement in Frequency/Power Measurement Mode
of the screen. The unit is [Hz].
Step 14. Press
Sensitivity.
Step 15. Enter an approximate control sensitivity of the DUT in the data entry field that appears in
the upper part of the screen. The unit is [Hz/V].
Step 16. Press
Max Iteration.
Step 17. Enter the maximum number of times to perform repetitive measurements and calculation
(control -voltage setting loop) for determining the optimum control voltage, in the data
entry field that appears in the upper part of the screen.
Step 18. Press
AFC Status.
Step 19. Select the status of the Auto Frequency Control function from the softkey menu list.
OFF
ON
*1
*1
The Auto Frequency Control will not be performed.
The Auto Frequency Control will be performed prior to each sweep.
Immediate The Auto Frequency Control will be performed only once. If the
status is changed this during sweep, the sweep will be interrupted and
Auto Frequency Control will be performed.
*1.Frequency/Power measurement mode in analyzer mode and Transient measurement
mode doesn’t have the ON/OFF status, but has the Immediate status only.
NOTE The Auto Frequency Control can not be aborted during an operation.
NOTE The wait time specified in - DC control Delay is also applied for repetitive
measurements to obtain the optimum control voltage during the execution of the Auto
Frequency Control function.
NOTE When the downconverter is turned on, the RF input is set to Downconverter, and the
external mixer is set to Not Used, the operation differs depending on whether the
Status
is ON or Immediate.
• When executed before each sweep with the
ON setting
AFC
The auto frequency control function is executed assuming that the input signal
frequency is near the target frequency (within several hundred MHz). If the input signal
is not near the target frequency, the auto frequency control function fails.
• When executed with the
Immediate setting
Because the auto frequency control function is executed after detecting the input signal
by searching for inside the frequency band that is set first in the execution, the auto
frequency control function can be executed provided that the input signal is within the
frequency band even if it is not near the target frequency.
Note that, because the input signal search is performed first, the time required to
complete the auto frequency control function is elongated compared to when it is
executed before each sweep with the AFC Status ON setting.
90 Chapter 4
Page 97

Basic Measurement Using E5052A
Frequency/Power Measurement in Frequency/Power Measurement Mode
About DC control voltage delay, DC power delay and point delay
This section describes the point delay for DC cont rol delay, DC power delay, and common
settings, which were mentioned in the previous sections. This is not a part of the setting
procedures, so for more on settings you can skip this section and proceed to “Confirming
Result of RF Power Measurement” on page 98.
About delay while DC control is selected for sweep parameter
The following section describes how to set up DC control delay and point delay. For better
understanding of each delay, “a,” “b,” “c” and “e” and the measurement point “d” used in
the description below, refer to Figure 4-3, “Delay While DC Control Selected for Sweep
Parameter,”.
• “a” signifies the delay until measurement of the first point starts in the single sweep, or
the delay until measurement of the first point of the first sweep in the continuous
sweep.This delay is equal to the addition of the setting times of DC control delay and
point delay.
• “b” signifies the individual delay between respective measurement points. The setting
times of point delay is set as this delay.
• “c” signifies the time that elapses when the setting of the voltage (DC Control Stop) at
the last measurement point (“d”) of the sweep is different from the setting value of DC
Control Voltage. This tim e is required for generating the DC Control Voltage. It is not
generated when the voltage setting of the DC Control Stop ( ( ) -
DC Control Stop) and that of the DC Control Voltage( - DC Control
Voltage
) is same.
• “e” is signifies the time that elapses to set the voltage back to the starting voltage for
next sweep in the continuous sweep. This time is required for setting of the DC Power
Delay is completed.
Figure 4-3 Delay While DC Control Selected for Sweep Parameter
4. Basic Measurement
Using E5052A
NOTE If the output voltage falls 0 V or exceeds 20 V, the setting time of DC control delay will be
Chapter 4 91
Page 98

Basic Measurement Using E5052A
Frequency/Power Measurement in Frequency/Power Measurement Mode
set as the delay, after the voltage is output.
About Delay While DC Power is Selected for Sweep Parameter
The following section describes how to set up DC power delay and point delay. For better
understanding of each delay, “a,” “b,” “c” and “e” and the measurement point “d” used in
the description, refer to Figure 4-4, “Delay While DC power is Selected for Sweep
Parameter,”.
• “a” signifies the delay until measurement of the first point starts in the single sweep, or
the delay until measurement of the first point of the first sweep in the continuous
sweep.This delay is equal to the addition of the setting times of DC control delay and
point delay.
• “b” signifies the individual delay between respective measurement points. The setting
times of point delay is set as this delay.
• “c” signifies the time that elapses when the setting of the voltage (DC Control Stop) at
the last measurement point (“d”) of the sweep is different from the setting value of DC
Control Voltage. This time is required for generating the DC Control Voltage. It is not
generated when the voltage setting of the DC Control Stop ( ( ) -
DC Control Stop) and that of the DC Control Voltage( - DC Control
Voltage
) is same.
• “e” signifies the time that elapses to set the voltage back to the starting voltage for next
sweep in the continuous sweep. This time is required for setting of the DC Power Delay
is completed.
Figure 4-4 Delay While DC power is Selected for Sweep Parameter
About Delay in Tester Mode
In the tester mode, measurement is made for only one measurement point.The delay for the
measurement point can be set by using a point delay setting. Refer to Figure 4-5, “Delay in
Tester Mode,”.
92 Chapter 4
Page 99
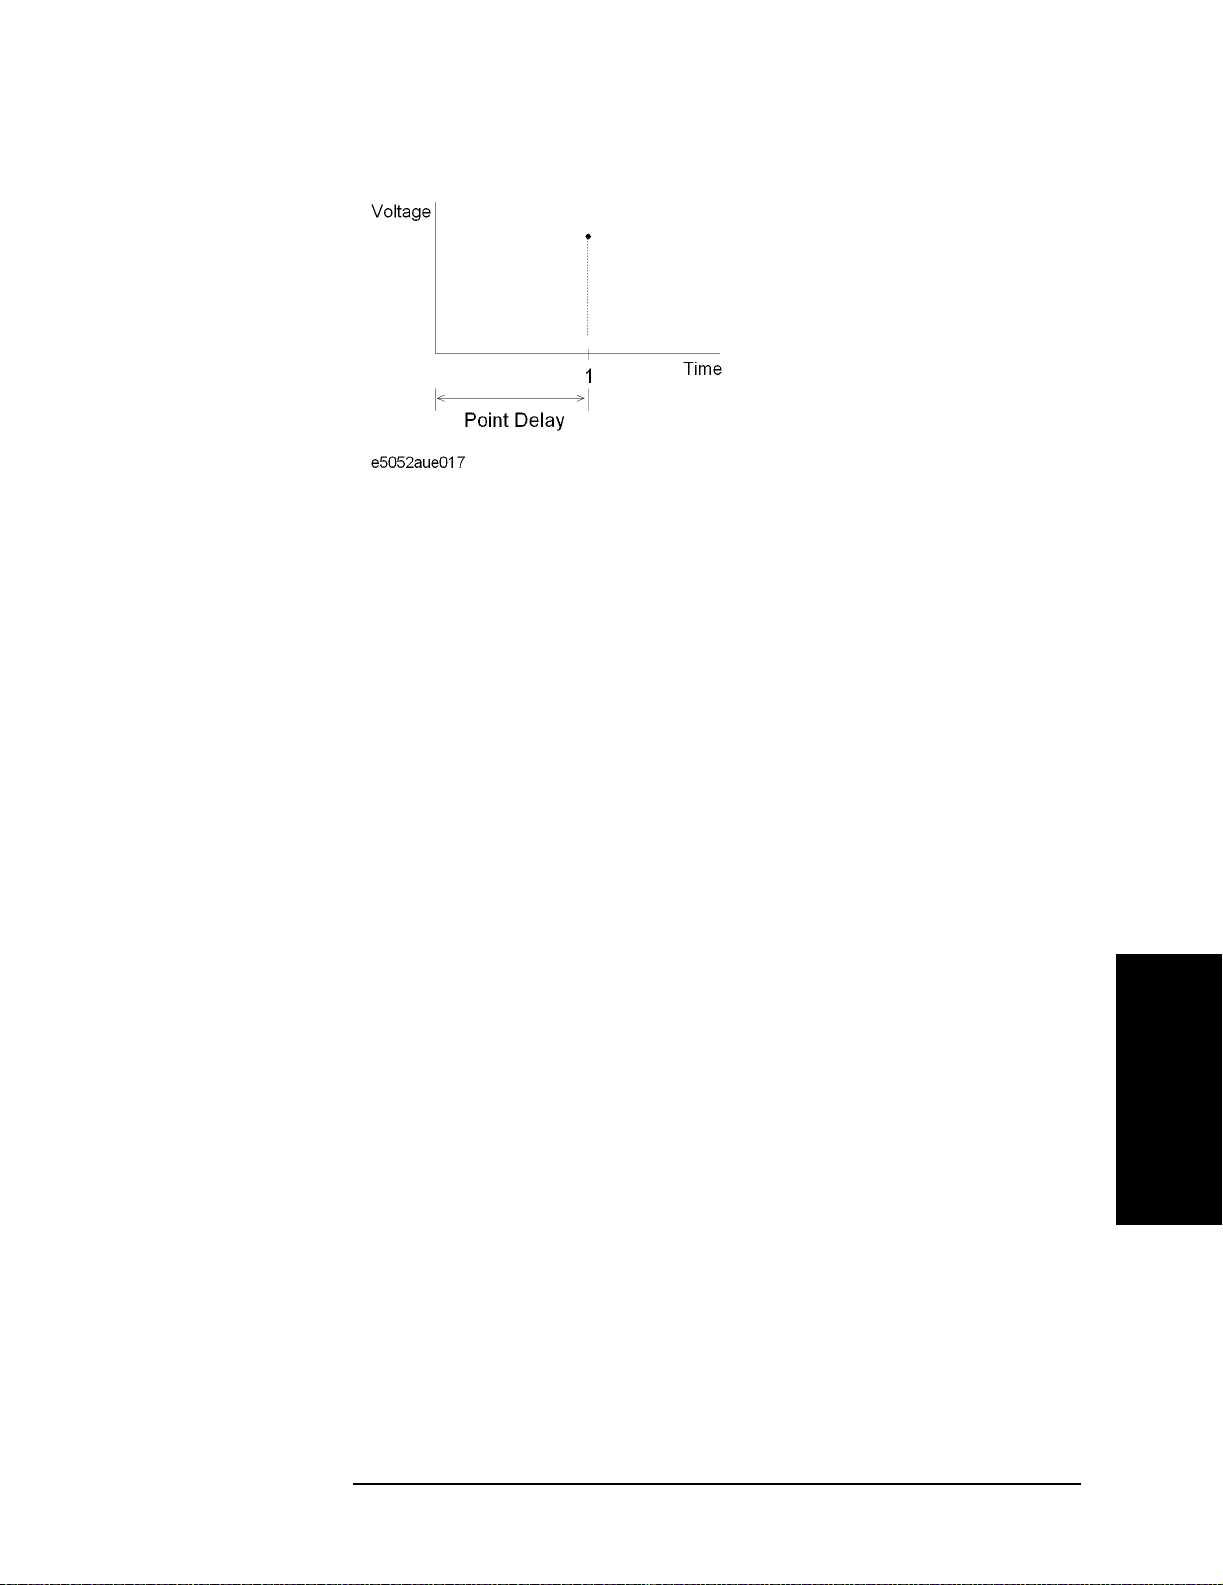
Frequency/Power Measurement in Frequency/Power Measurement Mode
Figure 4-5 Delay in Tester Mode
Basic Measurement Using E5052A
Chapter 4 93
4. Basic Measurement
Using E5052A
Page 100

Basic Measurement Using E5052A
Frequency/Power Measurement in Frequency/Power Measurement Mode
Confirming Result of Frequency Measurement
The following section describes the procedure used to confirm the measurement results of
frequencies corresponding to the DUT’s DC control/power by using the E5052A’s
frequency/power measurement window.
Selecting Trace
Step 1. Press the key to select the frequency measurement trace.
NOTE If you want to maximize the screen, press the key.
Setting Frequency Format and Sensitivity Aperture
You can select the unit (frequency format) used in the frequency trace screen and set the
sensitivity aperture.
Step 1. Press -
Step 2. Select an appropriate frequency format from the softkey menu list. The available options
are as follows.
Table 4-9 Format List
Softkey Overview
Hz Displays the me asurement frequency data.
Hz/V Displays the data obtained from m easurement frequency differentiated
ΔHz Displays the difference subtracted from the reference frequency.
% Displays the difference subtracted from the reference frequency in per
ppm Displays the difference subtracted from the reference frequency in ppm.
Step 3. Press -
for the frequency format.)
Step 4. Enter the sensitivity aperture value in the data entry field that appears in the upper part of
the screen. The unit is %.
Frequency Format.
by the DC control voltage.
cent.
Sensitivity Aperture. (This setting will be used when “Hz/V” is selected
Step 5. Press -
Frequency Reference. (This setting will be used when either “ΔHz”, “%”,
“ppm” is selected for the frequency format.)
Step 6. Enter the frequency reference value in the data entry field that appears in the upper part of
the screen. The unit is Hz.
Setting Scale of Measurement Trace (manual setting)
Follow the steps below to set the scale of the measurement trace manually.
Step 1. Press -
Divisions.
94 Chapter 4
 Loading...