


GSM and EDGE Guide
Agilent Technologies PSA Series
and VSA E4406A
Options 202, 252, BAH
This manual provides documentation for the following instruments:
Transmitter Tester:
E4406A
Spectrum Analyzers:
E4440A (3 Hz – 26.5 GHz)
E4443A (3 Hz – 6.7 GHz)
E4445A (3 Hz – 13.2 GHz)
E4446A (3 Hz – 44.0 GHz)
E4447A (3 Hz – 42.98 GHz)
E4448A (3 Hz – 50.0 GHz)
Manufacturing Part Number: E4406-90306
Supersedes E4406-90287
Printed in USA
June 2007
© Copyright 1999 - 2007 Agilent Technologies, Inc.

The information contained in this document is subject to change
without notice.
Agilent Technologies makes no warranty of any kind with regard to this
material, including but not limited to, the implied warranties of
merchantability and fitness for a particular purpose. Agilent
Technologies shall not be liable for errors contained herein or for
incidental or consequential damages in connection with the furnishing,
performance, or use of this material.
2

Contents
1. Introduction to GSM and EDGE
What Does the Agilent PSA Series and
VSA E4406A do?. . . . . . . . . . . . . . . . . . . . . . . . . . . . . . . . . . . . . . . . . . . . . . . . . . . . . . . . . . . . . 34
Installing Optional Measurement Personalities . . . . . . . . . . . . . . . . . . . . . . . . . . . . . . . . . . . 35
Do You Have Enough Memory to Load All Your Personality Options? . . . . . . . . . . . . . . . . 35
How to Predict Your Memory Requirements . . . . . . . . . . . . . . . . . . . . . . . . . . . . . . . . . . . . . 37
Loading an Optional Measurement Personality . . . . . . . . . . . . . . . . . . . . . . . . . . . . . . . . . . 39
Obtaining and Installing a License Key . . . . . . . . . . . . . . . . . . . . . . . . . . . . . . . . . . . . . . . . 40
Viewing a License Key . . . . . . . . . . . . . . . . . . . . . . . . . . . . . . . . . . . . . . . . . . . . . . . . . . . . . . 41
Using the Delete License Key on PSA . . . . . . . . . . . . . . . . . . . . . . . . . . . . . . . . . . . . . . . . . . 42
Using the Uninstall Key on E4406A . . . . . . . . . . . . . . . . . . . . . . . . . . . . . . . . . . . . . . . . . . . 42
Ordering Optional Measurement Personalities . . . . . . . . . . . . . . . . . . . . . . . . . . . . . . . . . . 43
2. Making Measurements
GSM and EDGE Measurements . . . . . . . . . . . . . . . . . . . . . . . . . . . . . . . . . . . . . . . . . . . . . . . . 46
Setting up and Making a Measurement . . . . . . . . . . . . . . . . . . . . . . . . . . . . . . . . . . . . . . . . . . 48
Making the Initial Signal Connection . . . . . . . . . . . . . . . . . . . . . . . . . . . . . . . . . . . . . . . . . . 48
Using Instrument Mode and Measurement Presets . . . . . . . . . . . . . . . . . . . . . . . . . . . . . . . 48
The 3 Steps to Set Up and Make Measurements . . . . . . . . . . . . . . . . . . . . . . . . . . . . . . . . . 49
EDGE Power vs. Time (PVT) Measurements . . . . . . . . . . . . . . . . . . . . . . . . . . . . . . . . . . . . . . 50
Configuring the Measurement System . . . . . . . . . . . . . . . . . . . . . . . . . . . . . . . . . . . . . . . . . 50
Setting the BTS (Example). . . . . . . . . . . . . . . . . . . . . . . . . . . . . . . . . . . . . . . . . . . . . . . . . . . 51
Measurement Procedure. . . . . . . . . . . . . . . . . . . . . . . . . . . . . . . . . . . . . . . . . . . . . . . . . . . . . 51
Results . . . . . . . . . . . . . . . . . . . . . . . . . . . . . . . . . . . . . . . . . . . . . . . . . . . . . . . . . . . . . . . . . . . 52
For More Information . . . . . . . . . . . . . . . . . . . . . . . . . . . . . . . . . . . . . . . . . . . . . . . . . . . . . . . 55
Troubleshooting Hints . . . . . . . . . . . . . . . . . . . . . . . . . . . . . . . . . . . . . . . . . . . . . . . . . . . . . . 55
EDGE Error Vector Magnitude (EVM) Measurements . . . . . . . . . . . . . . . . . . . . . . . . . . . . . . 56
Configuring the Measurement System . . . . . . . . . . . . . . . . . . . . . . . . . . . . . . . . . . . . . . . . . 56
Setting the BTS (Example). . . . . . . . . . . . . . . . . . . . . . . . . . . . . . . . . . . . . . . . . . . . . . . . . . . 57
Measurement Procedure. . . . . . . . . . . . . . . . . . . . . . . . . . . . . . . . . . . . . . . . . . . . . . . . . . . . . 57
Troubleshooting Hints . . . . . . . . . . . . . . . . . . . . . . . . . . . . . . . . . . . . . . . . . . . . . . . . . . . . . . 60
EDGE Output RF Spectrum (ORFS) Measurements. . . . . . . . . . . . . . . . . . . . . . . . . . . . . . . . 62
Configuring the Measurement System . . . . . . . . . . . . . . . . . . . . . . . . . . . . . . . . . . . . . . . . . 62
Setting the BTS (Example). . . . . . . . . . . . . . . . . . . . . . . . . . . . . . . . . . . . . . . . . . . . . . . . . . . 63
Measurement Procedure. . . . . . . . . . . . . . . . . . . . . . . . . . . . . . . . . . . . . . . . . . . . . . . . . . . . . 63
EDGE ORFS Measurement Results . . . . . . . . . . . . . . . . . . . . . . . . . . . . . . . . . . . . . . . . . . . 65
EDGE Tx Band Spur Measurements . . . . . . . . . . . . . . . . . . . . . . . . . . . . . . . . . . . . . . . . . . . . 74
Configuring the Measurement System . . . . . . . . . . . . . . . . . . . . . . . . . . . . . . . . . . . . . . . . . 74
Setting the BTS (Example). . . . . . . . . . . . . . . . . . . . . . . . . . . . . . . . . . . . . . . . . . . . . . . . . . . 75
Measurement Procedure. . . . . . . . . . . . . . . . . . . . . . . . . . . . . . . . . . . . . . . . . . . . . . . . . . . . . 75
Results . . . . . . . . . . . . . . . . . . . . . . . . . . . . . . . . . . . . . . . . . . . . . . . . . . . . . . . . . . . . . . . . . . . 76
Troubleshooting Hints . . . . . . . . . . . . . . . . . . . . . . . . . . . . . . . . . . . . . . . . . . . . . . . . . . . . . . 76
GMSK Output RF Spectrum (ORFS) Measurements . . . . . . . . . . . . . . . . . . . . . . . . . . . . . . . 77
Configuring the Measurement System . . . . . . . . . . . . . . . . . . . . . . . . . . . . . . . . . . . . . . . . . 77
Setting the BTS (Example). . . . . . . . . . . . . . . . . . . . . . . . . . . . . . . . . . . . . . . . . . . . . . . . . . . 78
Measurement Procedure. . . . . . . . . . . . . . . . . . . . . . . . . . . . . . . . . . . . . . . . . . . . . . . . . . . . . 78
GMSK ORFS Measurement Results . . . . . . . . . . . . . . . . . . . . . . . . . . . . . . . . . . . . . . . . . . . 80
GMSK Phase and Frequency Error Measurements . . . . . . . . . . . . . . . . . . . . . . . . . . . . . . . . . 89
Configuring the Measurement System . . . . . . . . . . . . . . . . . . . . . . . . . . . . . . . . . . . . . . . . . 89
Table of Contents
3

Contents
Table of Contents
Setting the BTS (Example) . . . . . . . . . . . . . . . . . . . . . . . . . . . . . . . . . . . . . . . . . . . . . . . . . . .90
Measurement Procedure . . . . . . . . . . . . . . . . . . . . . . . . . . . . . . . . . . . . . . . . . . . . . . . . . . . . .90
For More Information. . . . . . . . . . . . . . . . . . . . . . . . . . . . . . . . . . . . . . . . . . . . . . . . . . . . . . . .93
Troubleshooting Hints . . . . . . . . . . . . . . . . . . . . . . . . . . . . . . . . . . . . . . . . . . . . . . . . . . . . . . .93
GMSK Power vs. Time (PvT) Measurements. . . . . . . . . . . . . . . . . . . . . . . . . . . . . . . . . . . . . . .94
Configuring the Measurement System . . . . . . . . . . . . . . . . . . . . . . . . . . . . . . . . . . . . . . . . . .94
Setting the BTS (Example) . . . . . . . . . . . . . . . . . . . . . . . . . . . . . . . . . . . . . . . . . . . . . . . . . . .95
Measurement Procedure . . . . . . . . . . . . . . . . . . . . . . . . . . . . . . . . . . . . . . . . . . . . . . . . . . . . .95
Results . . . . . . . . . . . . . . . . . . . . . . . . . . . . . . . . . . . . . . . . . . . . . . . . . . . . . . . . . . . . . . . . . . .96
Troubleshooting Hints . . . . . . . . . . . . . . . . . . . . . . . . . . . . . . . . . . . . . . . . . . . . . . . . . . . . . .100
GMSK Transmitter Band Spurious Signal (Tx Band Spur) Measurements . . . . . . . . . . . . .101
Configuring the Measurement System . . . . . . . . . . . . . . . . . . . . . . . . . . . . . . . . . . . . . . . . .101
Setting the BTS (Example) . . . . . . . . . . . . . . . . . . . . . . . . . . . . . . . . . . . . . . . . . . . . . . . . . .102
Measurement Procedure . . . . . . . . . . . . . . . . . . . . . . . . . . . . . . . . . . . . . . . . . . . . . . . . . . . .102
Results . . . . . . . . . . . . . . . . . . . . . . . . . . . . . . . . . . . . . . . . . . . . . . . . . . . . . . . . . . . . . . . . . .103
Troubleshooting Hints . . . . . . . . . . . . . . . . . . . . . . . . . . . . . . . . . . . . . . . . . . . . . . . . . . . . . .103
Spectrum (Frequency Domain) Measurements . . . . . . . . . . . . . . . . . . . . . . . . . . . . . . . . . . . .104
Configuring the Measurement System . . . . . . . . . . . . . . . . . . . . . . . . . . . . . . . . . . . . . . . . .104
Setting the BTS . . . . . . . . . . . . . . . . . . . . . . . . . . . . . . . . . . . . . . . . . . . . . . . . . . . . . . . . . . .105
Measurement Procedure . . . . . . . . . . . . . . . . . . . . . . . . . . . . . . . . . . . . . . . . . . . . . . . . . . . .105
Transmit Power Measurements . . . . . . . . . . . . . . . . . . . . . . . . . . . . . . . . . . . . . . . . . . . . . . . . 115
Configuring the Measurement System . . . . . . . . . . . . . . . . . . . . . . . . . . . . . . . . . . . . . . . . . 115
Setting the BTS (Example) . . . . . . . . . . . . . . . . . . . . . . . . . . . . . . . . . . . . . . . . . . . . . . . . . . 115
Measurement Procedure . . . . . . . . . . . . . . . . . . . . . . . . . . . . . . . . . . . . . . . . . . . . . . . . . . . . 116
Troubleshooting Hints . . . . . . . . . . . . . . . . . . . . . . . . . . . . . . . . . . . . . . . . . . . . . . . . . . . . . .118
Waveform (Time Domain) Measurements . . . . . . . . . . . . . . . . . . . . . . . . . . . . . . . . . . . . . . . .119
Configuring the Measurement System . . . . . . . . . . . . . . . . . . . . . . . . . . . . . . . . . . . . . . . . . 119
Measurement Procedure . . . . . . . . . . . . . . . . . . . . . . . . . . . . . . . . . . . . . . . . . . . . . . . . . . . .120
Using Option B7C Baseband I/Q Inputs . . . . . . . . . . . . . . . . . . . . . . . . . . . . . . . . . . . . . . . . .131
Baseband I/Q Measurements Available for E4406A VSA Series Transmitter Tester . . . .131
Baseband I/Q Measurement Overview . . . . . . . . . . . . . . . . . . . . . . . . . . . . . . . . . . . . . . . . .131
Baseband I/Q Measurement Result Examples . . . . . . . . . . . . . . . . . . . . . . . . . . . . . . . . . . .132
Using Basic Mode . . . . . . . . . . . . . . . . . . . . . . . . . . . . . . . . . . . . . . . . . . . . . . . . . . . . . . . . . . .136
Basic Mode in E4406A VSA Series Transmitter Testers . . . . . . . . . . . . . . . . . . . . . . . . . . .136
Basic Mode in PSA Series Spectrum Analyzers . . . . . . . . . . . . . . . . . . . . . . . . . . . . . . . . . .136
Interpreting Error Codes . . . . . . . . . . . . . . . . . . . . . . . . . . . . . . . . . . . . . . . . . . . . . . . . . . . . .137
3. Key Reference
Instrument Front Panel Highlights . . . . . . . . . . . . . . . . . . . . . . . . . . . . . . . . . . . . . . . . . . . . .140
Selected E4406A VSA and PSA Front-Panel Features . . . . . . . . . . . . . . . . . . . . . . . . . . . .141
Front Panel Keys . . . . . . . . . . . . . . . . . . . . . . . . . . . . . . . . . . . . . . . . . . . . . . . . . . . . . . . . . . . .143
FREQUENCY Channel Key Menu . . . . . . . . . . . . . . . . . . . . . . . . . . . . . . . . . . . . . . . . . . . .143
Measurement Control Key Menu . . . . . . . . . . . . . . . . . . . . . . . . . . . . . . . . . . . . . . . . . . . . .146
MODE Key Menu . . . . . . . . . . . . . . . . . . . . . . . . . . . . . . . . . . . . . . . . . . . . . . . . . . . . . . . . . .146
Mode Setup Key Menu . . . . . . . . . . . . . . . . . . . . . . . . . . . . . . . . . . . . . . . . . . . . . . . . . . . . . .147
Input/Output Key Menu . . . . . . . . . . . . . . . . . . . . . . . . . . . . . . . . . . . . . . . . . . . . . . . . . . . .152
Measurement Keys . . . . . . . . . . . . . . . . . . . . . . . . . . . . . . . . . . . . . . . . . . . . . . . . . . . . . . . . . .156
EDGE EVM (Error Vector Magnitude)
Measurement Keys. . . . . . . . . . . . . . . . . . . . . . . . . . . . . . . . . . . . . . . . . . . . . . . . . . . . . . . . .156
4

Contents
EDGE Output RF Spectrum Measurement Keys . . . . . . . . . . . . . . . . . . . . . . . . . . . . . . . . 166
EDGE Power vs. Time Measurement Keys . . . . . . . . . . . . . . . . . . . . . . . . . . . . . . . . . . . . . 177
EDGE Tx Band Spur Measurement Keys . . . . . . . . . . . . . . . . . . . . . . . . . . . . . . . . . . . . . . 184
GMSK Output RF Spectrum Measurement Keys . . . . . . . . . . . . . . . . . . . . . . . . . . . . . . . . 187
GMSK Phase and Frequency Error Measurement Keys . . . . . . . . . . . . . . . . . . . . . . . . . . 197
GMSK Power vs. Time Measurement Keys. . . . . . . . . . . . . . . . . . . . . . . . . . . . . . . . . . . . . 204
GMSK Tx Band Spur Measurement Keys . . . . . . . . . . . . . . . . . . . . . . . . . . . . . . . . . . . . . . 214
Spectrum (Frequency Domain) Keys . . . . . . . . . . . . . . . . . . . . . . . . . . . . . . . . . . . . . . . . . . 217
Transmit Power Measurement Keys . . . . . . . . . . . . . . . . . . . . . . . . . . . . . . . . . . . . . . . . . . 234
Waveform (Time Domain) Keys . . . . . . . . . . . . . . . . . . . . . . . . . . . . . . . . . . . . . . . . . . . . . . 240
Baseband I/Q Inputs (Option B7C) Keys . . . . . . . . . . . . . . . . . . . . . . . . . . . . . . . . . . . . . . . . 259
Input Port Key Menu . . . . . . . . . . . . . . . . . . . . . . . . . . . . . . . . . . . . . . . . . . . . . . . . . . . . . . 259
I/Q Setup Key Menu . . . . . . . . . . . . . . . . . . . . . . . . . . . . . . . . . . . . . . . . . . . . . . . . . . . . . . . 260
I/Q Range Key Menu. . . . . . . . . . . . . . . . . . . . . . . . . . . . . . . . . . . . . . . . . . . . . . . . . . . . . . . 262
Baseband I/Q Key Access Locations. . . . . . . . . . . . . . . . . . . . . . . . . . . . . . . . . . . . . . . . . . . 263
Table of Contents
4. Programming Commands
SCPI Command Subsystems . . . . . . . . . . . . . . . . . . . . . . . . . . . . . . . . . . . . . . . . . . . . . . . . . . 266
Programming Command Compatibility
Across Model Numbers and Across Modes . . . . . . . . . . . . . . . . . . . . . . . . . . . . . . . . . . . . . . . 267
Across PSA Modes: Command Subsystem Similarities . . . . . . . . . . . . . . . . . . . . . . . . . . . 267
Across PSA Modes: Specific Command Differences . . . . . . . . . . . . . . . . . . . . . . . . . . . . . . 269
Using Applications in PSA Series vs. VSA E4406A . . . . . . . . . . . . . . . . . . . . . . . . . . . . . . 270
CALCulate Subsystem . . . . . . . . . . . . . . . . . . . . . . . . . . . . . . . . . . . . . . . . . . . . . . . . . . . . . . . 272
Test Current Results Against all Limits . . . . . . . . . . . . . . . . . . . . . . . . . . . . . . . . . . . . . . . 272
Data Query . . . . . . . . . . . . . . . . . . . . . . . . . . . . . . . . . . . . . . . . . . . . . . . . . . . . . . . . . . . . . . 272
Calculate/Compress Trace Data Query . . . . . . . . . . . . . . . . . . . . . . . . . . . . . . . . . . . . . . . . 272
Calculate Peaks of Trace Data . . . . . . . . . . . . . . . . . . . . . . . . . . . . . . . . . . . . . . . . . . . . . . 282
CALCulate EDGE EVM Subsystem . . . . . . . . . . . . . . . . . . . . . . . . . . . . . . . . . . . . . . . . . . 284
EDGE TX Band Spur Calculate Commands . . . . . . . . . . . . . . . . . . . . . . . . . . . . . . . . . . . 300
CALCulate:MARKers Subsystem . . . . . . . . . . . . . . . . . . . . . . . . . . . . . . . . . . . . . . . . . . . . 301
CALCulate Phase and Frequency Error Subsystem . . . . . . . . . . . . . . . . . . . . . . . . . . . . . . 312
Baseband I/Q - Spectrum I/Q Marker Query . . . . . . . . . . . . . . . . . . . . . . . . . . . . . . . . . . . 316
Transmit Band Spurious - Limits . . . . . . . . . . . . . . . . . . . . . . . . . . . . . . . . . . . . . . . . . . . . 317
Baseband I/Q - Waveform I/Q Marker Query . . . . . . . . . . . . . . . . . . . . . . . . . . . . . . . . . . . 317
CONFigure Subsystem . . . . . . . . . . . . . . . . . . . . . . . . . . . . . . . . . . . . . . . . . . . . . . . . . . . . . . 319
Configure the Selected Measurement . . . . . . . . . . . . . . . . . . . . . . . . . . . . . . . . . . . . . . . . . 319
Configure Query . . . . . . . . . . . . . . . . . . . . . . . . . . . . . . . . . . . . . . . . . . . . . . . . . . . . . . . . . . 319
DISPlay Subsystem . . . . . . . . . . . . . . . . . . . . . . . . . . . . . . . . . . . . . . . . . . . . . . . . . . . . . . . . . 320
Adjacent Channel Power - View Selection . . . . . . . . . . . . . . . . . . . . . . . . . . . . . . . . . . . . . 320
Turn the Display On/Off . . . . . . . . . . . . . . . . . . . . . . . . . . . . . . . . . . . . . . . . . . . . . . . . . . . 320
EDGE PVT - Limit Mask On/Off . . . . . . . . . . . . . . . . . . . . . . . . . . . . . . . . . . . . . . . . . . . . . 321
EDGE PVT - View Selection (PSA Only) . . . . . . . . . . . . . . . . . . . . . . . . . . . . . . . . . . . . . . . 321
EDGE Output RF Spectrum - View Selection (PSA Only) . . . . . . . . . . . . . . . . . . . . . . . . . 322
EDGE EVM - View Selection (PSA Only) . . . . . . . . . . . . . . . . . . . . . . . . . . . . . . . . . . . . . . 323
GMSK PVT - View Selection (PSA Only). . . . . . . . . . . . . . . . . . . . . . . . . . . . . . . . . . . . . . . 324
GMSK Output RF Spectrum - View Selection (PSA Only) . . . . . . . . . . . . . . . . . . . . . . . . . 325
GMSK Phase & Frequency - View Selection (PSA Only) . . . . . . . . . . . . . . . . . . . . . . . . . . 326
Select Display Format . . . . . . . . . . . . . . . . . . . . . . . . . . . . . . . . . . . . . . . . . . . . . . . . . . . . . 327
5

Contents
Table of Contents
Select Display Format . . . . . . . . . . . . . . . . . . . . . . . . . . . . . . . . . . . . . . . . . . . . . . . . . . . . . .327
Full Screen Display (PSA Only) . . . . . . . . . . . . . . . . . . . . . . . . . . . . . . . . . . . . . . . . . . . . . .328
PVT - Limit Mask Display . . . . . . . . . . . . . . . . . . . . . . . . . . . . . . . . . . . . . . . . . . . . . . . . . .328
Spectrum - Y-Axis Scale/Div . . . . . . . . . . . . . . . . . . . . . . . . . . . . . . . . . . . . . . . . . . . . . . . . .328
Spectrum - Y-Axis Reference Level . . . . . . . . . . . . . . . . . . . . . . . . . . . . . . . . . . . . . . . . . . .330
Turn a Trace Display On/Off . . . . . . . . . . . . . . . . . . . . . . . . . . . . . . . . . . . . . . . . . . . . . . . . .331
Waveform - Y-Axis Scale/Div . . . . . . . . . . . . . . . . . . . . . . . . . . . . . . . . . . . . . . . . . . . . . . . . .335
Waveform - Y-Axis Reference Level . . . . . . . . . . . . . . . . . . . . . . . . . . . . . . . . . . . . . . . . . . .336
FETCh Subsystem. . . . . . . . . . . . . . . . . . . . . . . . . . . . . . . . . . . . . . . . . . . . . . . . . . . . . . . . . . .338
Fetch the Current Measurement Results . . . . . . . . . . . . . . . . . . . . . . . . . . . . . . . . . . . . . .338
FORMat Subsystem . . . . . . . . . . . . . . . . . . . . . . . . . . . . . . . . . . . . . . . . . . . . . . . . . . . . . . . . .339
Byte Order . . . . . . . . . . . . . . . . . . . . . . . . . . . . . . . . . . . . . . . . . . . . . . . . . . . . . . . . . . . . . . .339
Numeric Data Format . . . . . . . . . . . . . . . . . . . . . . . . . . . . . . . . . . . . . . . . . . . . . . . . . . . . . .339
INITiate Subsystem. . . . . . . . . . . . . . . . . . . . . . . . . . . . . . . . . . . . . . . . . . . . . . . . . . . . . . . . . .341
Take New Data Acquisition for Selected Measurement . . . . . . . . . . . . . . . . . . . . . . . . . . .341
Continuous or Single Measurements . . . . . . . . . . . . . . . . . . . . . . . . . . . . . . . . . . . . . . . . . .341
Take New Data Acquisitions . . . . . . . . . . . . . . . . . . . . . . . . . . . . . . . . . . . . . . . . . . . . . . . . .342
Restart the Measurement . . . . . . . . . . . . . . . . . . . . . . . . . . . . . . . . . . . . . . . . . . . . . . . . . . .342
INSTrument Subsystem . . . . . . . . . . . . . . . . . . . . . . . . . . . . . . . . . . . . . . . . . . . . . . . . . . . . . .343
Catalog Query . . . . . . . . . . . . . . . . . . . . . . . . . . . . . . . . . . . . . . . . . . . . . . . . . . . . . . . . . . . .343
Select Application by Number . . . . . . . . . . . . . . . . . . . . . . . . . . . . . . . . . . . . . . . . . . . . . . .343
Select Application . . . . . . . . . . . . . . . . . . . . . . . . . . . . . . . . . . . . . . . . . . . . . . . . . . . . . . . . .344
MEASure Group of Commands. . . . . . . . . . . . . . . . . . . . . . . . . . . . . . . . . . . . . . . . . . . . . . . . .347
Command Interactions: MEASure, CONFigure, FETCh, INITiate and READ . . . . . . . . .348
50 MHz Amplitude Reference Measurement . . . . . . . . . . . . . . . . . . . . . . . . . . . . . . . . . . . .352
EDGE Error Vector Magnitude Measurement . . . . . . . . . . . . . . . . . . . . . . . . . . . . . . . . . . .353
EDGE Output RF Spectrum Measurement . . . . . . . . . . . . . . . . . . . . . . . . . . . . . . . . . . . . .357
EDGE Power vs. Time Measurement . . . . . . . . . . . . . . . . . . . . . . . . . . . . . . . . . . . . . . . . . .361
EDGE Transmit Band Spurs Measure Commands . . . . . . . . . . . . . . . . . . . . . . . . . . . . . . .364
GMSK Output RF Spectrum Measurement . . . . . . . . . . . . . . . . . . . . . . . . . . . . . . . . . . . .366
GMSK Phase & Frequency Error Measurement . . . . . . . . . . . . . . . . . . . . . . . . . . . . . . . . .370
GMSK Power vs. Time Measurement . . . . . . . . . . . . . . . . . . . . . . . . . . . . . . . . . . . . . . . . .373
Sensor Measurement . . . . . . . . . . . . . . . . . . . . . . . . . . . . . . . . . . . . . . . . . . . . . . . . . . . . . . .377
Spectrum (Frequency Domain) Measurement . . . . . . . . . . . . . . . . . . . . . . . . . . . . . . . . . . .378
Timebase Frequency Measurement . . . . . . . . . . . . . . . . . . . . . . . . . . . . . . . . . . . . . . . . . . .381
GMSK Transmit Band Spurs Measurement . . . . . . . . . . . . . . . . . . . . . . . . . . . . . . . . . . . .382
GMSK Transmit Power Measurement . . . . . . . . . . . . . . . . . . . . . . . . . . . . . . . . . . . . . . . . .383
Waveform (Time Domain) Measurement . . . . . . . . . . . . . . . . . . . . . . . . . . . . . . . . . . . . . . .385
READ Subsystem . . . . . . . . . . . . . . . . . . . . . . . . . . . . . . . . . . . . . . . . . . . . . . . . . . . . . . . . . . .387
Initiate and Read Measurement Data . . . . . . . . . . . . . . . . . . . . . . . . . . . . . . . . . . . . . . . . .387
SENSe Subsystem . . . . . . . . . . . . . . . . . . . . . . . . . . . . . . . . . . . . . . . . . . . . . . . . . . . . . . . . . . .388
Baseband I/Q Commands (E4406A only) . . . . . . . . . . . . . . . . . . . . . . . . . . . . . . . . . . . . . . .388
Channel Commands . . . . . . . . . . . . . . . . . . . . . . . . . . . . . . . . . . . . . . . . . . . . . . . . . . . . . . .390
Signal Corrections Commands . . . . . . . . . . . . . . . . . . . . . . . . . . . . . . . . . . . . . . . . . . . . . . .395
EDGE Error Vector Magnitude Measurement . . . . . . . . . . . . . . . . . . . . . . . . . . . . . . . . . .396
EDGE Output RF Spectrum Measurement . . . . . . . . . . . . . . . . . . . . . . . . . . . . . . . . . . . . .402
EDGE Power vs. Time (Burst Power) Measurement . . . . . . . . . . . . . . . . . . . . . . . . . . . . .419
EDGE Transmit Band Spurs Measurement . . . . . . . . . . . . . . . . . . . . . . . . . . . . . . . . . . . .433
RF Input Signal Alignments . . . . . . . . . . . . . . . . . . . . . . . . . . . . . . . . . . . . . . . . . . . . . . . . .435
6

Contents
Frequency Commands . . . . . . . . . . . . . . . . . . . . . . . . . . . . . . . . . . . . . . . . . . . . . . . . . . . . . 437
GMSK Output RF Spectrum Measurement . . . . . . . . . . . . . . . . . . . . . . . . . . . . . . . . . . . . 438
GMSK Phase & Frequency Error Measurement . . . . . . . . . . . . . . . . . . . . . . . . . . . . . . . . 454
Select I/Q Power Range (E4406A only) . . . . . . . . . . . . . . . . . . . . . . . . . . . . . . . . . . . . . . . . 458
Select I/Q Voltage Range (E4406A only) . . . . . . . . . . . . . . . . . . . . . . . . . . . . . . . . . . . . . . . 458
RF Power Commands . . . . . . . . . . . . . . . . . . . . . . . . . . . . . . . . . . . . . . . . . . . . . . . . . . . . . . 459
GMSK Power vs. Time Measurement . . . . . . . . . . . . . . . . . . . . . . . . . . . . . . . . . . . . . . . . . 462
Radio Standards Commands . . . . . . . . . . . . . . . . . . . . . . . . . . . . . . . . . . . . . . . . . . . . . . . . 478
Reference Oscillator Commands . . . . . . . . . . . . . . . . . . . . . . . . . . . . . . . . . . . . . . . . . . . . . 482
Spectrum (Frequency-Domain) Measurement . . . . . . . . . . . . . . . . . . . . . . . . . . . . . . . . . . 484
Synchronization Commands . . . . . . . . . . . . . . . . . . . . . . . . . . . . . . . . . . . . . . . . . . . . . . . . 498
GMSK Transmit Band Spurs Measurement . . . . . . . . . . . . . . . . . . . . . . . . . . . . . . . . . . . 499
Transmit Power Measurement . . . . . . . . . . . . . . . . . . . . . . . . . . . . . . . . . . . . . . . . . . . . . . 502
Waveform (Time-Domain) Measurement . . . . . . . . . . . . . . . . . . . . . . . . . . . . . . . . . . . . . . 506
TRIGger Subsystem . . . . . . . . . . . . . . . . . . . . . . . . . . . . . . . . . . . . . . . . . . . . . . . . . . . . . . . . . 514
Automatic Trigger Control . . . . . . . . . . . . . . . . . . . . . . . . . . . . . . . . . . . . . . . . . . . . . . . . . . 514
Automatic Trigger Time . . . . . . . . . . . . . . . . . . . . . . . . . . . . . . . . . . . . . . . . . . . . . . . . . . . . 514
External Trigger Delay . . . . . . . . . . . . . . . . . . . . . . . . . . . . . . . . . . . . . . . . . . . . . . . . . . . . . 515
External Trigger Level . . . . . . . . . . . . . . . . . . . . . . . . . . . . . . . . . . . . . . . . . . . . . . . . . . . . . 515
External Trigger Slope . . . . . . . . . . . . . . . . . . . . . . . . . . . . . . . . . . . . . . . . . . . . . . . . . . . . . 515
Frame Trigger Adjust . . . . . . . . . . . . . . . . . . . . . . . . . . . . . . . . . . . . . . . . . . . . . . . . . . . . . . 516
Frame Trigger Period . . . . . . . . . . . . . . . . . . . . . . . . . . . . . . . . . . . . . . . . . . . . . . . . . . . . . . 516
Frame Trigger Sync Source . . . . . . . . . . . . . . . . . . . . . . . . . . . . . . . . . . . . . . . . . . . . . . . . . 517
Frame Trigger Synchronization Offset . . . . . . . . . . . . . . . . . . . . . . . . . . . . . . . . . . . . . . . . 517
Trigger Holdoff . . . . . . . . . . . . . . . . . . . . . . . . . . . . . . . . . . . . . . . . . . . . . . . . . . . . . . . . . . . 518
Video (IF) Trigger Delay . . . . . . . . . . . . . . . . . . . . . . . . . . . . . . . . . . . . . . . . . . . . . . . . . . . 518
Video (IF) Trigger Level . . . . . . . . . . . . . . . . . . . . . . . . . . . . . . . . . . . . . . . . . . . . . . . . . . . . 518
Video (IF) Trigger Slope . . . . . . . . . . . . . . . . . . . . . . . . . . . . . . . . . . . . . . . . . . . . . . . . . . . . 519
RF Burst Trigger Delay . . . . . . . . . . . . . . . . . . . . . . . . . . . . . . . . . . . . . . . . . . . . . . . . . . . . 519
RF Burst Trigger Level . . . . . . . . . . . . . . . . . . . . . . . . . . . . . . . . . . . . . . . . . . . . . . . . . . . . 519
RF Burst Trigger Slope . . . . . . . . . . . . . . . . . . . . . . . . . . . . . . . . . . . . . . . . . . . . . . . . . . . . 520
Table of Contents
5. Concepts
What are GSM and EDGE? . . . . . . . . . . . . . . . . . . . . . . . . . . . . . . . . . . . . . . . . . . . . . . . . . . . 522
Frequently Used Terms . . . . . . . . . . . . . . . . . . . . . . . . . . . . . . . . . . . . . . . . . . . . . . . . . . . . . . 525
Mobile Stations and Base Transceiver Stations . . . . . . . . . . . . . . . . . . . . . . . . . . . . . . . . . 525
Uplink and Downlink . . . . . . . . . . . . . . . . . . . . . . . . . . . . . . . . . . . . . . . . . . . . . . . . . . . . . . 525
ARFCN. . . . . . . . . . . . . . . . . . . . . . . . . . . . . . . . . . . . . . . . . . . . . . . . . . . . . . . . . . . . . . . . . . 525
Timeslots . . . . . . . . . . . . . . . . . . . . . . . . . . . . . . . . . . . . . . . . . . . . . . . . . . . . . . . . . . . . . . . . 525
Transmit Power Measurement Concepts . . . . . . . . . . . . . . . . . . . . . . . . . . . . . . . . . . . . . . . . 526
Purpose . . . . . . . . . . . . . . . . . . . . . . . . . . . . . . . . . . . . . . . . . . . . . . . . . . . . . . . . . . . . . . . . . 526
Measurement Method . . . . . . . . . . . . . . . . . . . . . . . . . . . . . . . . . . . . . . . . . . . . . . . . . . . . . . 526
GMSK Power vs. Time Measurement Concepts . . . . . . . . . . . . . . . . . . . . . . . . . . . . . . . . . . . 527
Purpose . . . . . . . . . . . . . . . . . . . . . . . . . . . . . . . . . . . . . . . . . . . . . . . . . . . . . . . . . . . . . . . . . 527
Measurement Method . . . . . . . . . . . . . . . . . . . . . . . . . . . . . . . . . . . . . . . . . . . . . . . . . . . . . . 527
Measurement Adjustments . . . . . . . . . . . . . . . . . . . . . . . . . . . . . . . . . . . . . . . . . . . . . . . . . 528
Measurement Results . . . . . . . . . . . . . . . . . . . . . . . . . . . . . . . . . . . . . . . . . . . . . . . . . . . . . . 531
GMSK Phase and Frequency Error Measurement Concepts . . . . . . . . . . . . . . . . . . . . . . . . 533
Purpose . . . . . . . . . . . . . . . . . . . . . . . . . . . . . . . . . . . . . . . . . . . . . . . . . . . . . . . . . . . . . . . . . 533
7

Contents
Table of Contents
Measurement Method . . . . . . . . . . . . . . . . . . . . . . . . . . . . . . . . . . . . . . . . . . . . . . . . . . . . . .533
Measurement Adjustments . . . . . . . . . . . . . . . . . . . . . . . . . . . . . . . . . . . . . . . . . . . . . . . . . .533
GMSK Output RF Spectrum Measurement Concepts. . . . . . . . . . . . . . . . . . . . . . . . . . . . . . .536
Purpose . . . . . . . . . . . . . . . . . . . . . . . . . . . . . . . . . . . . . . . . . . . . . . . . . . . . . . . . . . . . . . . . .536
Measurement Method . . . . . . . . . . . . . . . . . . . . . . . . . . . . . . . . . . . . . . . . . . . . . . . . . . . . . .536
Changing the View . . . . . . . . . . . . . . . . . . . . . . . . . . . . . . . . . . . . . . . . . . . . . . . . . . . . . . . . .539
GMSK ORFS Measurements on a Single Bursted Slot . . . . . . . . . . . . . . . . . . . . . . . . . . . .539
GMSK Tx Band Spur Measurement Concepts . . . . . . . . . . . . . . . . . . . . . . . . . . . . . . . . . . . .540
Purpose . . . . . . . . . . . . . . . . . . . . . . . . . . . . . . . . . . . . . . . . . . . . . . . . . . . . . . . . . . . . . . . . . .540
Measurement Method . . . . . . . . . . . . . . . . . . . . . . . . . . . . . . . . . . . . . . . . . . . . . . . . . . . . . .540
Changing the View . . . . . . . . . . . . . . . . . . . . . . . . . . . . . . . . . . . . . . . . . . . . . . . . . . . . . . . . .541
EDGE Power vs. Time Measurement Concepts . . . . . . . . . . . . . . . . . . . . . . . . . . . . . . . . . . . .542
Purpose . . . . . . . . . . . . . . . . . . . . . . . . . . . . . . . . . . . . . . . . . . . . . . . . . . . . . . . . . . . . . . . . . .542
Measurement Method . . . . . . . . . . . . . . . . . . . . . . . . . . . . . . . . . . . . . . . . . . . . . . . . . . . . . .542
Measurement Adjustments . . . . . . . . . . . . . . . . . . . . . . . . . . . . . . . . . . . . . . . . . . . . . . . . . .543
EDGE EVM Measurement Concepts . . . . . . . . . . . . . . . . . . . . . . . . . . . . . . . . . . . . . . . . . . . .544
Purpose . . . . . . . . . . . . . . . . . . . . . . . . . . . . . . . . . . . . . . . . . . . . . . . . . . . . . . . . . . . . . . . . . .544
Measurement Method . . . . . . . . . . . . . . . . . . . . . . . . . . . . . . . . . . . . . . . . . . . . . . . . . . . . . .544
Measurement Adjustments . . . . . . . . . . . . . . . . . . . . . . . . . . . . . . . . . . . . . . . . . . . . . . . . . .544
EDGE Output RF Spectrum Measurement Concepts . . . . . . . . . . . . . . . . . . . . . . . . . . . . . . .549
Purpose . . . . . . . . . . . . . . . . . . . . . . . . . . . . . . . . . . . . . . . . . . . . . . . . . . . . . . . . . . . . . . . . .549
Measurement Method . . . . . . . . . . . . . . . . . . . . . . . . . . . . . . . . . . . . . . . . . . . . . . . . . . . . . .549
Measurement Adjustments . . . . . . . . . . . . . . . . . . . . . . . . . . . . . . . . . . . . . . . . . . . . . . . . . .553
EDGE ORFS Measurements on a Single Bursted Slot . . . . . . . . . . . . . . . . . . . . . . . . . . . .553
EDGE Tx Band Spur Measurement Concepts . . . . . . . . . . . . . . . . . . . . . . . . . . . . . . . . . . . . .554
Purpose . . . . . . . . . . . . . . . . . . . . . . . . . . . . . . . . . . . . . . . . . . . . . . . . . . . . . . . . . . . . . . . . . .554
Measurement Method . . . . . . . . . . . . . . . . . . . . . . . . . . . . . . . . . . . . . . . . . . . . . . . . . . . . . .554
Measurement Adjustments . . . . . . . . . . . . . . . . . . . . . . . . . . . . . . . . . . . . . . . . . . . . . . . . . .555
Spectrum (Frequency Domain) Measurement Concepts. . . . . . . . . . . . . . . . . . . . . . . . . . . . .556
Purpose . . . . . . . . . . . . . . . . . . . . . . . . . . . . . . . . . . . . . . . . . . . . . . . . . . . . . . . . . . . . . . . . .556
Measurement Method . . . . . . . . . . . . . . . . . . . . . . . . . . . . . . . . . . . . . . . . . . . . . . . . . . . . . .556
Troubleshooting Hints . . . . . . . . . . . . . . . . . . . . . . . . . . . . . . . . . . . . . . . . . . . . . . . . . . . . . .556
Waveform (Time Domain) Measurement Concepts . . . . . . . . . . . . . . . . . . . . . . . . . . . . . . . . .557
Purpose . . . . . . . . . . . . . . . . . . . . . . . . . . . . . . . . . . . . . . . . . . . . . . . . . . . . . . . . . . . . . . . . .557
Measurement Method . . . . . . . . . . . . . . . . . . . . . . . . . . . . . . . . . . . . . . . . . . . . . . . . . . . . . .557
Baseband I/Q Inputs (Option B7C) Measurement Concepts . . . . . . . . . . . . . . . . . . . . . . . . .558
What are Baseband I/Q Inputs? . . . . . . . . . . . . . . . . . . . . . . . . . . . . . . . . . . . . . . . . . . . . . .558
What are Baseband I/Q Signals?. . . . . . . . . . . . . . . . . . . . . . . . . . . . . . . . . . . . . . . . . . . . . .559
Why Make Measurements at Baseband? . . . . . . . . . . . . . . . . . . . . . . . . . . . . . . . . . . . . . . .559
Selecting Input Probes for Baseband Measurements . . . . . . . . . . . . . . . . . . . . . . . . . . . . .559
Baseband I/Q Measurement Views . . . . . . . . . . . . . . . . . . . . . . . . . . . . . . . . . . . . . . . . . . . .562
Other Sources of Measurement Information . . . . . . . . . . . . . . . . . . . . . . . . . . . . . . . . . . . . . .565
Instrument Updates at www.agilent.com . . . . . . . . . . . . . . . . . . . . . . . . . . . . . . . . . . . . . . .565
6. Menu Maps
EDGE and GSM Measurement Key Flow . . . . . . . . . . . . . . . . . . . . . . . . . . . . . . . . . . . . . . . .568
8

List of Commands
:CALCulate:CLIMits:FAIL? . . . . . . . . . . . . . . . . . . . . . . . . . . . . . . . . . . . . . . . . . . . . . . . . . . . . . . . . 272
:CALCulate:DATA<n>:COMPress? BLOCk|CFIT|MAXimum|MINimum|MEAN|DMEan|RMS|SAMPle|SDEViation|PPHase [,<soffset>[,<length>[,<roff-
set>[,<rlimit>]]]] . . . . . . . . . . . . . . . . . . . . . . . . . . . . . . . . . . . . . . . . . . . . . . . . . . . . . . . . . . . . . . . . . 272
:CALCulate:DATA<n>:PEAKs? <threshold>,<excursion>[,AMPLitude|FREQuency|TIME] . . . 282
:CALCulate:DATA[n]? . . . . . . . . . . . . . . . . . . . . . . . . . . . . . . . . . . . . . . . . . . . . . . . . . . . . . . . . . . . . 272
:CALCulate:EEVM:LIMit:BTS:EXTReme:EVMP95 <real>. . . . . . . . . . . . . . . . . . . . . . . . . . . . . . . 284
:CALCulate:EEVM:LIMit:BTS:EXTReme:EVMP95? . . . . . . . . . . . . . . . . . . . . . . . . . . . . . . . . . . . . 284
:CALCulate:EEVM:LIMit:BTS:EXTReme:FERRor <real> . . . . . . . . . . . . . . . . . . . . . . . . . . . . . . . 284
:CALCulate:EEVM:LIMit:BTS:EXTReme:FERRor? . . . . . . . . . . . . . . . . . . . . . . . . . . . . . . . . . . . . 284
:CALCulate:EEVM:LIMit:BTS:EXTReme:IQOOffset <float> . . . . . . . . . . . . . . . . . . . . . . . . . . . . . 285
List of Commands
:CALCulate:EEVM:LIMit:BTS:EXTReme:IQOOffset? . . . . . . . . . . . . . . . . . . . . . . . . . . . . . . . . . . . 285
:CALCulate:EEVM:LIMit:BTS:EXTReme:PEVM <real>. . . . . . . . . . . . . . . . . . . . . . . . . . . . . . . . . 286
:CALCulate:EEVM:LIMit:BTS:EXTReme:PEVM? . . . . . . . . . . . . . . . . . . . . . . . . . . . . . . . . . . . . . . 286
:CALCulate:EEVM:LIMit:BTS:EXTReme:REVM <real> . . . . . . . . . . . . . . . . . . . . . . . . . . . . . . . . 287
:CALCulate:EEVM:LIMit:BTS:EXTReme:REVM?. . . . . . . . . . . . . . . . . . . . . . . . . . . . . . . . . . . . . . 287
:CALCulate:EEVM:LIMit:BTS:NORMal:EVMP95 <real>. . . . . . . . . . . . . . . . . . . . . . . . . . . . . . . . 287
:CALCulate:EEVM:LIMit:BTS:NORMal:EVMP95? . . . . . . . . . . . . . . . . . . . . . . . . . . . . . . . . . . . . . 288
:CALCulate:EEVM:LIMit:BTS:NORMal:FERRor <real> . . . . . . . . . . . . . . . . . . . . . . . . . . . . . . . . 288
:CALCulate:EEVM:LIMit:BTS:NORMal:FERRor? . . . . . . . . . . . . . . . . . . . . . . . . . . . . . . . . . . . . . 288
:CALCulate:EEVM:LIMit:BTS:NORMal:IQOOffset <float> . . . . . . . . . . . . . . . . . . . . . . . . . . . . . . 289
:CALCulate:EEVM:LIMit:BTS:NORMal:IQOOffset?. . . . . . . . . . . . . . . . . . . . . . . . . . . . . . . . . . . . 289
:CALCulate:EEVM:LIMit:BTS:NORMal:PEVM <real>. . . . . . . . . . . . . . . . . . . . . . . . . . . . . . . . . . 290
:CALCulate:EEVM:LIMit:BTS:NORMal:PEVM? . . . . . . . . . . . . . . . . . . . . . . . . . . . . . . . . . . . . . . . 290
:CALCulate:EEVM:LIMit:BTS:NORMal:REVM <real> . . . . . . . . . . . . . . . . . . . . . . . . . . . . . . . . . 290
:CALCulate:EEVM:LIMit:BTS:NORMal:REVM? . . . . . . . . . . . . . . . . . . . . . . . . . . . . . . . . . . . . . . . 290
:CALCulate:EEVM:LIMit:MBTS:EXTReme:FERRor <real>. . . . . . . . . . . . . . . . . . . . . . . . . . . . . . 292
:CALCulate:EEVM:LIMit:MBTS:EXTReme:FERRor? . . . . . . . . . . . . . . . . . . . . . . . . . . . . . . . . . . . 292
:CALCulate:EEVM:LIMit:MBTS:NORMal:FERRor <real>. . . . . . . . . . . . . . . . . . . . . . . . . . . . . . . 293
:CALCulate:EEVM:LIMit:MBTS:NORMal:FERRor? . . . . . . . . . . . . . . . . . . . . . . . . . . . . . . . . . . . . 293
:CALCulate:EEVM:LIMit:MS:EXTReme:EVMP95 <real> . . . . . . . . . . . . . . . . . . . . . . . . . . . . . . . 291
:CALCulate:EEVM:LIMit:MS:EXTReme:EVMP95? . . . . . . . . . . . . . . . . . . . . . . . . . . . . . . . . . . . . 291
9

List of Commands
:CALCulate:EEVM:LIMit:MS:EXTReme:FERRor <real> . . . . . . . . . . . . . . . . . . . . . . . . . . . . . . . . .292
:CALCulate:EEVM:LIMit:MS:EXTReme:FERRor? . . . . . . . . . . . . . . . . . . . . . . . . . . . . . . . . . . . . . .292
:CALCulate:EEVM:LIMit:MS:EXTReme:IQOOffset <real> . . . . . . . . . . . . . . . . . . . . . . . . . . . . . . .293
:CALCulate:EEVM:LIMit:MS:EXTReme:IQOOffset? . . . . . . . . . . . . . . . . . . . . . . . . . . . . . . . . . . . .293
:CALCulate:EEVM:LIMit:MS:EXTReme:PEVM <real> . . . . . . . . . . . . . . . . . . . . . . . . . . . . . . . . . .294
:CALCulate:EEVM:LIMit:MS:EXTReme:PEVM? . . . . . . . . . . . . . . . . . . . . . . . . . . . . . . . . . . . . . . .294
:CALCulate:EEVM:LIMit:MS:EXTReme:REVM <real> . . . . . . . . . . . . . . . . . . . . . . . . . . . . . . . . . .295
:CALCulate:EEVM:LIMit:MS:EXTReme:REVM? . . . . . . . . . . . . . . . . . . . . . . . . . . . . . . . . . . . . . . .295
:CALCulate:EEVM:LIMit:MS:NORMal:EVMP95 <real> . . . . . . . . . . . . . . . . . . . . . . . . . . . . . . . . .295
:CALCulate:EEVM:LIMit:MS:NORMal:EVMP95? . . . . . . . . . . . . . . . . . . . . . . . . . . . . . . . . . . . . . .295
List of Commands
:CALCulate:EEVM:LIMit:MS:NORMal:FERRor <real>. . . . . . . . . . . . . . . . . . . . . . . . . . . . . . . . . .296
:CALCulate:EEVM:LIMit:MS:NORMal:FERRor? . . . . . . . . . . . . . . . . . . . . . . . . . . . . . . . . . . . . . . .296
:CALCulate:EEVM:LIMit:MS:NORMal:IQOOffset <real> . . . . . . . . . . . . . . . . . . . . . . . . . . . . . . . .296
:CALCulate:EEVM:LIMit:MS:NORMal:IQOOffset? . . . . . . . . . . . . . . . . . . . . . . . . . . . . . . . . . . . . .296
:CALCulate:EEVM:LIMit:MS:NORMal:PEVM <real> . . . . . . . . . . . . . . . . . . . . . . . . . . . . . . . . . . .297
:CALCulate:EEVM:LIMit:MS:NORMal:PEVM? . . . . . . . . . . . . . . . . . . . . . . . . . . . . . . . . . . . . . . . .297
:CALCulate:EEVM:LIMit:MS:NORMal:REVM <real> . . . . . . . . . . . . . . . . . . . . . . . . . . . . . . . . . . .297
:CALCulate:EEVM:LIMit:MS:NORMal:REVM? . . . . . . . . . . . . . . . . . . . . . . . . . . . . . . . . . . . . . . . .297
:CALCulate:EEVM:LIMit:PBTS:EXTReme:FERRor <real> . . . . . . . . . . . . . . . . . . . . . . . . . . . . . . .298
:CALCulate:EEVM:LIMit:PBTS:EXTReme:FERRor? . . . . . . . . . . . . . . . . . . . . . . . . . . . . . . . . . . . .298
:CALCulate:EEVM:LIMit:PBTS:NORMal:FERRor <real> . . . . . . . . . . . . . . . . . . . . . . . . . . . . . . . .299
:CALCulate:EEVM:LIMit:PBTS:NORMal:FERRor? . . . . . . . . . . . . . . . . . . . . . . . . . . . . . . . . . . . . .299
:CALCulate:ETSPur:LIMit:TEST ABSolute|RELative . . . . . . . . . . . . . . . . . . . . . . . . . . . . . . . . . .300
:CALCulate:ETSPur:LIMit:TEST? . . . . . . . . . . . . . . . . . . . . . . . . . . . . . . . . . . . . . . . . . . . . . . . . . . .300
:CALCulate:ETSPur:LIMit[:UPPer][:DATA] <power> . . . . . . . . . . . . . . . . . . . . . . . . . . . . . . . . . . .300
:CALCulate:ETSPur:LIMit[:UPPer][:DATA]? . . . . . . . . . . . . . . . . . . . . . . . . . . . . . . . . . . . . . . . . . .300
:CALCulate:PFER:LIMit:BTS:FERRor <real> . . . . . . . . . . . . . . . . . . . . . . . . . . . . . . . . . . . . . . . . .312
:CALCulate:PFER:LIMit:BTS:FERRor?. . . . . . . . . . . . . . . . . . . . . . . . . . . . . . . . . . . . . . . . . . . . . . .312
:CALCulate:PFER:LIMit:BTS:PPHase <degree> . . . . . . . . . . . . . . . . . . . . . . . . . . . . . . . . . . . . . . .312
:CALCulate:PFER:LIMit:BTS:PPHase? . . . . . . . . . . . . . . . . . . . . . . . . . . . . . . . . . . . . . . . . . . . . . . .312
:CALCulate:PFER:LIMit:BTS:RPHase <degree> . . . . . . . . . . . . . . . . . . . . . . . . . . . . . . . . . . . . . . .313
10

List of Commands
:CALCulate:PFER:LIMit:BTS:RPHase? . . . . . . . . . . . . . . . . . . . . . . . . . . . . . . . . . . . . . . . . . . . . . . 313
:CALCulate:PFER:LIMit:MBTS:FERRor <real> . . . . . . . . . . . . . . . . . . . . . . . . . . . . . . . . . . . . . . . 313
:CALCulate:PFER:LIMit:MBTS:FERRor? . . . . . . . . . . . . . . . . . . . . . . . . . . . . . . . . . . . . . . . . . . . . 314
:CALCulate:PFER:LIMit:MS:FERRor <real>. . . . . . . . . . . . . . . . . . . . . . . . . . . . . . . . . . . . . . . . . . 314
:CALCulate:PFER:LIMit:MS:FERRor? . . . . . . . . . . . . . . . . . . . . . . . . . . . . . . . . . . . . . . . . . . . . . . . 314
:CALCulate:PFER:LIMit:MS:PPHase <degree>. . . . . . . . . . . . . . . . . . . . . . . . . . . . . . . . . . . . . . . . 315
:CALCulate:PFER:LIMit:MS:PPHase? . . . . . . . . . . . . . . . . . . . . . . . . . . . . . . . . . . . . . . . . . . . . . . . 315
:CALCulate:PFER:LIMit:MS:RPHase <degree> . . . . . . . . . . . . . . . . . . . . . . . . . . . . . . . . . . . . . . . 315
:CALCulate:PFER:LIMit:MS:RPHase? . . . . . . . . . . . . . . . . . . . . . . . . . . . . . . . . . . . . . . . . . . . . . . . 315
:CALCulate:PFER:LIMit:PBTS:FERRor <real>. . . . . . . . . . . . . . . . . . . . . . . . . . . . . . . . . . . . . . . . 316
List of Commands
:CALCulate:PFER:LIMit:PBTS:FERRor? . . . . . . . . . . . . . . . . . . . . . . . . . . . . . . . . . . . . . . . . . . . . . 316
:CALCulate:SPECtrum:MARKer[1]|2|3|4:IQ? . . . . . . . . . . . . . . . . . . . . . . . . . . . . . . . . . . . . . . . . 316
:CALCulate:TSPur:LIMit:TEST ABSolute|RELative . . . . . . . . . . . . . . . . . . . . . . . . . . . . . . . . . . . 317
:CALCulate:TSPur:LIMit:TEST?. . . . . . . . . . . . . . . . . . . . . . . . . . . . . . . . . . . . . . . . . . . . . . . . . . . . 317
:CALCulate:TSPur:LIMit[:UPPer][:DATA] <power> . . . . . . . . . . . . . . . . . . . . . . . . . . . . . . . . . . . . 317
:CALCulate:TSPur:LIMit[:UPPer][:DATA]? . . . . . . . . . . . . . . . . . . . . . . . . . . . . . . . . . . . . . . . . . . . 317
:CALCulate:WAVeform:MARKer[1]|2|3|4:IQ? . . . . . . . . . . . . . . . . . . . . . . . . . . . . . . . . . . . . . . . . 317
:CALCulate:<measurement>:MARKer:AOFF . . . . . . . . . . . . . . . . . . . . . . . . . . . . . . . . . . . . . . . . . 304
:CALCulate:<measurement>:MARKer[1]|2|3|4:FUNCtion:RESult? . . . . . . . . . . . . . . . . . . . . . . 304
:CALCulate:<measurement>:MARKer[1]|2|3|4:MAXimum . . . . . . . . . . . . . . . . . . . . . . . . . . . . . 304
:CALCulate:<measurement>:MARKer[1]|2|3|4:MINimum . . . . . . . . . . . . . . . . . . . . . . . . . . . . . 305
:CALCulate:<measurement>:MARKer[1]|2|3|4:MODE POSition|DELTa . . . . . . . . . . . . . . . . . 305
:CALCulate:<measurement>:MARKer[1]|2|3|4:MODE POSition|DELTa|RMSDegree|RMSRadi-
an|RFM|RMSJitter|OFF . . . . . . . . . . . . . . . . . . . . . . . . . . . . . . . . . . . . . . . . . . . . . . . . . . . . . . . . . 305
:CALCulate:<measurement>:MARKer[1]|2|3|4:MODE?. . . . . . . . . . . . . . . . . . . . . . . . . . . . . . . . 305
:CALCulate:<measurement>:MARKer[1]|2|3|4:TRACe <trace_name> . . . . . . . . . . . . . . . . . . . . 306
:CALCulate:<measurement>:MARKer[1]|2|3|4:TRACe? . . . . . . . . . . . . . . . . . . . . . . . . . . . . . . . 306
:CALCulate:<measurement>:MARKer[1]|2|3|4:X <param> . . . . . . . . . . . . . . . . . . . . . . . . . . . . . 310
:CALCulate:<measurement>:MARKer[1]|2|3|4:X:POSition <integer> . . . . . . . . . . . . . . . . . . . . 311
:CALCulate:<measurement>:MARKer[1]|2|3|4:X:POSition? . . . . . . . . . . . . . . . . . . . . . . . . . . . . 311
:CALCulate:<measurement>:MARKer[1]|2|3|4:X? . . . . . . . . . . . . . . . . . . . . . . . . . . . . . . . . . . . . 310
11

List of Commands
:CALCulate:<measurement>:MARKer[1]|2|3|4:Y? . . . . . . . . . . . . . . . . . . . . . . . . . . . . . . . . . . . . . 311
:CALCulate:<measurement>:MARKer[1]|2|3|4[:STATe] OFF|ON|0|1 . . . . . . . . . . . . . . . . . . . .306
:CALCulate:<measurement>:MARKer[1]|2|3|4[:STATe]? . . . . . . . . . . . . . . . . . . . . . . . . . . . . . . .306
:CONFigure:AREFerence . . . . . . . . . . . . . . . . . . . . . . . . . . . . . . . . . . . . . . . . . . . . . . . . . . . . . . . . . .352
:CONFigure:EEVM . . . . . . . . . . . . . . . . . . . . . . . . . . . . . . . . . . . . . . . . . . . . . . . . . . . . . . . . . . . . . . .353
:CONFigure:EORFspectr. . . . . . . . . . . . . . . . . . . . . . . . . . . . . . . . . . . . . . . . . . . . . . . . . . . . . . . . . . .357
:CONFigure:EPVTime . . . . . . . . . . . . . . . . . . . . . . . . . . . . . . . . . . . . . . . . . . . . . . . . . . . . . . . . . . . . .361
:CONFigure:ETSPur . . . . . . . . . . . . . . . . . . . . . . . . . . . . . . . . . . . . . . . . . . . . . . . . . . . . . . . . . . . . . .364
:CONFigure:ORFSpectrum . . . . . . . . . . . . . . . . . . . . . . . . . . . . . . . . . . . . . . . . . . . . . . . . . . . . . . . . .366
:CONFigure:PFERror . . . . . . . . . . . . . . . . . . . . . . . . . . . . . . . . . . . . . . . . . . . . . . . . . . . . . . . . . . . . .370
List of Commands
:CONFigure:PVTime . . . . . . . . . . . . . . . . . . . . . . . . . . . . . . . . . . . . . . . . . . . . . . . . . . . . . . . . . . . . . .373
:CONFigure:SENSors . . . . . . . . . . . . . . . . . . . . . . . . . . . . . . . . . . . . . . . . . . . . . . . . . . . . . . . . . . . . .377
:CONFigure:SPECtrum . . . . . . . . . . . . . . . . . . . . . . . . . . . . . . . . . . . . . . . . . . . . . . . . . . . . . . . . . . . .378
:CONFigure:TBFRequency . . . . . . . . . . . . . . . . . . . . . . . . . . . . . . . . . . . . . . . . . . . . . . . . . . . . . . . . .381
:CONFigure:TSPur . . . . . . . . . . . . . . . . . . . . . . . . . . . . . . . . . . . . . . . . . . . . . . . . . . . . . . . . . . . . . . .382
:CONFigure:TXPower . . . . . . . . . . . . . . . . . . . . . . . . . . . . . . . . . . . . . . . . . . . . . . . . . . . . . . . . . . . . .383
:CONFigure:WAVeform . . . . . . . . . . . . . . . . . . . . . . . . . . . . . . . . . . . . . . . . . . . . . . . . . . . . . . . . . . . .385
:CONFigure:<measurement> . . . . . . . . . . . . . . . . . . . . . . . . . . . . . . . . . . . . . . . . . . . . . . . . . . . . . . .319
:CONFigure?. . . . . . . . . . . . . . . . . . . . . . . . . . . . . . . . . . . . . . . . . . . . . . . . . . . . . . . . . . . . . . . . . . . . .319
:DISPlay:ACP:VIEW BGRaph|SPECtrum . . . . . . . . . . . . . . . . . . . . . . . . . . . . . . . . . . . . . . . . . . . .320
:DISPlay:ACP:VIEW? . . . . . . . . . . . . . . . . . . . . . . . . . . . . . . . . . . . . . . . . . . . . . . . . . . . . . . . . . . . . .320
:DISPlay:EEVM:VIEW[:SELect] POLar|CONStln|QUAD|DBITs. . . . . . . . . . . . . . . . . . . . . . . . .323
:DISPlay:EEVM:VIEW[:SELect]? . . . . . . . . . . . . . . . . . . . . . . . . . . . . . . . . . . . . . . . . . . . . . . . . . . . .323
:DISPlay:ENABle OFF|ON|0|1 . . . . . . . . . . . . . . . . . . . . . . . . . . . . . . . . . . . . . . . . . . . . . . . . . . . .320
:DISPlay:ENABle? . . . . . . . . . . . . . . . . . . . . . . . . . . . . . . . . . . . . . . . . . . . . . . . . . . . . . . . . . . . . . . . .320
:DISPlay:EORFspectr:VIEW[:SELect] MPOWer|MLIMit|SLIMit . . . . . . . . . . . . . . . . . . . . . . . . .322
:DISPlay:EORFspectr:VIEW[:SELect]? . . . . . . . . . . . . . . . . . . . . . . . . . . . . . . . . . . . . . . . . . . . . . . .322
:DISPlay:EPVTime:LIMit:MASK OFF|ON|0|1 . . . . . . . . . . . . . . . . . . . . . . . . . . . . . . . . . . . . . . . .321
:DISPlay:EPVTime:LIMit:MASK? . . . . . . . . . . . . . . . . . . . . . . . . . . . . . . . . . . . . . . . . . . . . . . . . . . .321
:DISPlay:EPVT:VIEW[:SELect] ALL|BOTH|MSLot . . . . . . . . . . . . . . . . . . . . . . . . . . . . . . . . . . . .321
:DISPlay:EPVT:VIEW[:SELect]?. . . . . . . . . . . . . . . . . . . . . . . . . . . . . . . . . . . . . . . . . . . . . . . . . . . . .321
12

List of Commands
:DISPlay:FORMat:TILE . . . . . . . . . . . . . . . . . . . . . . . . . . . . . . . . . . . . . . . . . . . . . . . . . . . . . . . . . . . 327
:DISPlay:FORMat:ZOOM. . . . . . . . . . . . . . . . . . . . . . . . . . . . . . . . . . . . . . . . . . . . . . . . . . . . . . . . . . 327
:DISPlay:FSCReen[:STATe] OFF|ON|0|1. . . . . . . . . . . . . . . . . . . . . . . . . . . . . . . . . . . . . . . . . . . . 328
:DISPlay:FSCReen[:STATe]? . . . . . . . . . . . . . . . . . . . . . . . . . . . . . . . . . . . . . . . . . . . . . . . . . . . . . . . 328
:DISPlay:FSCREEN|FULLSCREEN[:STATe] ON|OFF|1|0 . . . . . . . . . . . . . . . . . . . . . . . . . . . . 328
:DISPlay:FSCREEN|FULLSCREEN[:STATe]? . . . . . . . . . . . . . . . . . . . . . . . . . . . . . . . . . . . . . . . . 328
:DISPlay:ORFspectrum:VIEW[:SELect] MPOWer|MLIMit|SLIMit . . . . . . . . . . . . . . . . . . . . . . . 325
:DISPlay:ORFspectrum:VIEW[:SELect]? . . . . . . . . . . . . . . . . . . . . . . . . . . . . . . . . . . . . . . . . . . . . . 325
:DISPlay:PFERror:VIEW[:SELect] QUAD|POLar|DBITs . . . . . . . . . . . . . . . . . . . . . . . . . . . . . . . 326
:DISPlay:PFERror:VIEW[:SELect]? . . . . . . . . . . . . . . . . . . . . . . . . . . . . . . . . . . . . . . . . . . . . . . . . . 326
List of Commands
:DISPlay:PVTime:LIMit:MASK OFF|ON|0|1 . . . . . . . . . . . . . . . . . . . . . . . . . . . . . . . . . . . . . . . . 328
:DISPlay:PVTime:LIMit:MASK? . . . . . . . . . . . . . . . . . . . . . . . . . . . . . . . . . . . . . . . . . . . . . . . . . . . . 328
:DISPlay:PVT:VIEW[:SELect] ALL|BOTH|MSLot. . . . . . . . . . . . . . . . . . . . . . . . . . . . . . . . . . . . . 324
:DISPlay:PVT:VIEW[:SELect]? . . . . . . . . . . . . . . . . . . . . . . . . . . . . . . . . . . . . . . . . . . . . . . . . . . . . . 324
:DISPlay:SPECtrum[n]:WINDow[m]:TRACe:Y[:SCALe]:PDIVision <power> . . . . . . . . . . . . . . . . 328
:DISPlay:SPECtrum[n]:WINDow[m]:TRACe:Y[:SCALe]:PDIVision? . . . . . . . . . . . . . . . . . . . . . . . 329
:DISPlay:SPECtrum[n]:WINDow[m]:TRACe:Y[:SCALe]:RLEVel <power> . . . . . . . . . . . . . . . . . . 330
:DISPlay:SPECtrum[n]:WINDow[m]:TRACe:Y[:SCALe]:RLEVel? . . . . . . . . . . . . . . . . . . . . . . . . . 330
:DISPlay:TRACe[n][:STATe] OFF|ON|0|1 . . . . . . . . . . . . . . . . . . . . . . . . . . . . . . . . . . . . . . . . . . . 331
:DISPlay:TRACe[n][:STATe]? . . . . . . . . . . . . . . . . . . . . . . . . . . . . . . . . . . . . . . . . . . . . . . . . . . . . . . . 331
:DISPlay:WAVeform[n]:WINDow[m]:TRACe:Y[:SCALe]:PDIVision <power>. . . . . . . . . . . . . . . . . 335
:DISPlay:WAVeform[n]:WINDow[m]:TRACe:Y[:SCALe]:PDIVision? . . . . . . . . . . . . . . . . . . . . . . . 335
:DISPlay:WAVeform[n]:WINDow[m]:TRACe:Y[:SCALe]:RLEVel <power>. . . . . . . . . . . . . . . . . . . 336
:DISPlay:WAVeform[n]:WINDow[m]:TRACe:Y[:SCALe]:RLEVel?. . . . . . . . . . . . . . . . . . . . . . . . . . 336
:FETCh:AREFerence[n]? . . . . . . . . . . . . . . . . . . . . . . . . . . . . . . . . . . . . . . . . . . . . . . . . . . . . . . . . . . 352
:FETCh:EEVM[n]? . . . . . . . . . . . . . . . . . . . . . . . . . . . . . . . . . . . . . . . . . . . . . . . . . . . . . . . . . . . . . . . 353
:FETCh:EORFspectr[n]? . . . . . . . . . . . . . . . . . . . . . . . . . . . . . . . . . . . . . . . . . . . . . . . . . . . . . . . . . . 357
:FETCh:EPVTime[n]? . . . . . . . . . . . . . . . . . . . . . . . . . . . . . . . . . . . . . . . . . . . . . . . . . . . . . . . . . . . . . 361
:FETCh:ETSPur[n]? . . . . . . . . . . . . . . . . . . . . . . . . . . . . . . . . . . . . . . . . . . . . . . . . . . . . . . . . . . . . . . 364
:FETCh:ORFSpectrum[n]? . . . . . . . . . . . . . . . . . . . . . . . . . . . . . . . . . . . . . . . . . . . . . . . . . . . . . . . . . 366
:FETCh:PFERror[n]? . . . . . . . . . . . . . . . . . . . . . . . . . . . . . . . . . . . . . . . . . . . . . . . . . . . . . . . . . . . . . 370
13

List of Commands
:FETCh:PVTime[n]?. . . . . . . . . . . . . . . . . . . . . . . . . . . . . . . . . . . . . . . . . . . . . . . . . . . . . . . . . . . . . . .373
:FETCh:SENSors[n]? . . . . . . . . . . . . . . . . . . . . . . . . . . . . . . . . . . . . . . . . . . . . . . . . . . . . . . . . . . . . . .377
:FETCh:SPECtrum[n]? . . . . . . . . . . . . . . . . . . . . . . . . . . . . . . . . . . . . . . . . . . . . . . . . . . . . . . . . . . . .378
:FETCh:TBFRequency[n]?. . . . . . . . . . . . . . . . . . . . . . . . . . . . . . . . . . . . . . . . . . . . . . . . . . . . . . . . . .381
:FETCh:TSPur[n]? . . . . . . . . . . . . . . . . . . . . . . . . . . . . . . . . . . . . . . . . . . . . . . . . . . . . . . . . . . . . . . . .382
:FETCh:TXPower[n]? . . . . . . . . . . . . . . . . . . . . . . . . . . . . . . . . . . . . . . . . . . . . . . . . . . . . . . . . . . . . . .383
:FETCh:WAVeform[n]?. . . . . . . . . . . . . . . . . . . . . . . . . . . . . . . . . . . . . . . . . . . . . . . . . . . . . . . . . . . . .385
:FETCh:<measurement>[n]? . . . . . . . . . . . . . . . . . . . . . . . . . . . . . . . . . . . . . . . . . . . . . . . . . . . . . . . .338
:FORMat:BORDer NORMal|SWAPped . . . . . . . . . . . . . . . . . . . . . . . . . . . . . . . . . . . . . . . . . . . . . . .339
:FORMat:BORDer? . . . . . . . . . . . . . . . . . . . . . . . . . . . . . . . . . . . . . . . . . . . . . . . . . . . . . . . . . . . . . . .339
List of Commands
:FORMat[:DATA] ASCii|REAL,32|REAL,64 . . . . . . . . . . . . . . . . . . . . . . . . . . . . . . . . . . . . . . . . . .339
:FORMat[:DATA]? . . . . . . . . . . . . . . . . . . . . . . . . . . . . . . . . . . . . . . . . . . . . . . . . . . . . . . . . . . . . . . . .339
:FORMat[:TRACe][:DATA] ASCii|INTeger,16|INTeger,32|REAL,32|REAL,64|UINTeger,16 . .339
:FORMat[:TRACe][:DATA] ASCii|REAL[,32] . . . . . . . . . . . . . . . . . . . . . . . . . . . . . . . . . . . . . . . . . .339
:FORMat[:TRACe][:DATA]?. . . . . . . . . . . . . . . . . . . . . . . . . . . . . . . . . . . . . . . . . . . . . . . . . . . . . . . . .339
:FORMat[:TRACe][:DATA]?. . . . . . . . . . . . . . . . . . . . . . . . . . . . . . . . . . . . . . . . . . . . . . . . . . . . . . . . .339
:INITiate:AREFerence . . . . . . . . . . . . . . . . . . . . . . . . . . . . . . . . . . . . . . . . . . . . . . . . . . . . . . . . . . . . .352
:INITiate:CONTinuous OFF|ON|0|1 . . . . . . . . . . . . . . . . . . . . . . . . . . . . . . . . . . . . . . . . . . . . . . . .341
:INITiate:CONTinuous?. . . . . . . . . . . . . . . . . . . . . . . . . . . . . . . . . . . . . . . . . . . . . . . . . . . . . . . . . . . .341
:INITiate:EEVM . . . . . . . . . . . . . . . . . . . . . . . . . . . . . . . . . . . . . . . . . . . . . . . . . . . . . . . . . . . . . . . . . .353
:INITiate:EORFspectr . . . . . . . . . . . . . . . . . . . . . . . . . . . . . . . . . . . . . . . . . . . . . . . . . . . . . . . . . . . . .357
:INITiate:EPVTime . . . . . . . . . . . . . . . . . . . . . . . . . . . . . . . . . . . . . . . . . . . . . . . . . . . . . . . . . . . . . . .361
:INITiate:ETSPur. . . . . . . . . . . . . . . . . . . . . . . . . . . . . . . . . . . . . . . . . . . . . . . . . . . . . . . . . . . . . . . . .364
:INITiate:ORFSpectrum . . . . . . . . . . . . . . . . . . . . . . . . . . . . . . . . . . . . . . . . . . . . . . . . . . . . . . . . . . .366
:INITiate:PFERror? . . . . . . . . . . . . . . . . . . . . . . . . . . . . . . . . . . . . . . . . . . . . . . . . . . . . . . . . . . . . . . .370
:INITiate:PVTime. . . . . . . . . . . . . . . . . . . . . . . . . . . . . . . . . . . . . . . . . . . . . . . . . . . . . . . . . . . . . . . . .373
:INITiate:RESTart . . . . . . . . . . . . . . . . . . . . . . . . . . . . . . . . . . . . . . . . . . . . . . . . . . . . . . . . . . . . . . . .342
:INITiate:SENSors . . . . . . . . . . . . . . . . . . . . . . . . . . . . . . . . . . . . . . . . . . . . . . . . . . . . . . . . . . . . . . . .377
:INITiate:SPECtrum . . . . . . . . . . . . . . . . . . . . . . . . . . . . . . . . . . . . . . . . . . . . . . . . . . . . . . . . . . . . . .378
:INITiate:TBFRequency. . . . . . . . . . . . . . . . . . . . . . . . . . . . . . . . . . . . . . . . . . . . . . . . . . . . . . . . . . . .381
:INITiate:TSPur . . . . . . . . . . . . . . . . . . . . . . . . . . . . . . . . . . . . . . . . . . . . . . . . . . . . . . . . . . . . . . . . . .382
14

List of Commands
:INITiate:TXPower . . . . . . . . . . . . . . . . . . . . . . . . . . . . . . . . . . . . . . . . . . . . . . . . . . . . . . . . . . . . . . . 383
:INITiate:WAVeform . . . . . . . . . . . . . . . . . . . . . . . . . . . . . . . . . . . . . . . . . . . . . . . . . . . . . . . . . . . . . . 385
:INITiate:<measurement> . . . . . . . . . . . . . . . . . . . . . . . . . . . . . . . . . . . . . . . . . . . . . . . . . . . . . . . . . 341
:INITiate[:IMMediate] . . . . . . . . . . . . . . . . . . . . . . . . . . . . . . . . . . . . . . . . . . . . . . . . . . . . . . . . . . . . 342
:INSTrument:CATalog? . . . . . . . . . . . . . . . . . . . . . . . . . . . . . . . . . . . . . . . . . . . . . . . . . . . . . . . . . . . 343
:INSTrument:CATalog[:FULL]? . . . . . . . . . . . . . . . . . . . . . . . . . . . . . . . . . . . . . . . . . . . . . . . . . . . . . 343
:INSTrument:NSELect <integer> . . . . . . . . . . . . . . . . . . . . . . . . . . . . . . . . . . . . . . . . . . . . . . . . . . . 343
:INSTrument:NSELect? . . . . . . . . . . . . . . . . . . . . . . . . . . . . . . . . . . . . . . . . . . . . . . . . . . . . . . . . . . . 343
:INSTrument[:SELect] BASIC|SERVICE|CDMA|CDMA2K|GSM|EDGEGSM|IDEN|NADC
|PDC|WCDMA|CDMA1XEV . . . . . . . . . . . . . . . . . . . . . . . . . . . . . . . . . . . . . . . . . . . . . . . . . . . . . . 344
:INSTrument[:SELect] SA|PNOISE|BASIC|CDMA|CDMA2K|EDGEGSM|NADC|PDC
|WCDMA|CDMA1XEV|NFIGURE|WLAN|MRECEIVE . . . . . . . . . . . . . . . . . . . . . . . . . . . . . . . 344
List of Commands
:INSTrument[:SELect]? . . . . . . . . . . . . . . . . . . . . . . . . . . . . . . . . . . . . . . . . . . . . . . . . . . . . . . . . . . . 345
:MEASure:AREFerence[n]? . . . . . . . . . . . . . . . . . . . . . . . . . . . . . . . . . . . . . . . . . . . . . . . . . . . . . . . . 352
:MEASure:EEVM[n]? . . . . . . . . . . . . . . . . . . . . . . . . . . . . . . . . . . . . . . . . . . . . . . . . . . . . . . . . . . . . . 353
:MEASure:EORFspectr[n]? . . . . . . . . . . . . . . . . . . . . . . . . . . . . . . . . . . . . . . . . . . . . . . . . . . . . . . . . 357
:MEASure:EPVTime[n]?. . . . . . . . . . . . . . . . . . . . . . . . . . . . . . . . . . . . . . . . . . . . . . . . . . . . . . . . . . . 361
:MEASure:ETSPur[n]? . . . . . . . . . . . . . . . . . . . . . . . . . . . . . . . . . . . . . . . . . . . . . . . . . . . . . . . . . . . . 364
:MEASure:ORFSpectrum[n]?. . . . . . . . . . . . . . . . . . . . . . . . . . . . . . . . . . . . . . . . . . . . . . . . . . . . . . . 366
:MEASure:PFERror[n]? . . . . . . . . . . . . . . . . . . . . . . . . . . . . . . . . . . . . . . . . . . . . . . . . . . . . . . . . . . . 370
:MEASure:PVTime[n]? . . . . . . . . . . . . . . . . . . . . . . . . . . . . . . . . . . . . . . . . . . . . . . . . . . . . . . . . . . . . 373
:MEASure:SENSors[n]? . . . . . . . . . . . . . . . . . . . . . . . . . . . . . . . . . . . . . . . . . . . . . . . . . . . . . . . . . . . 377
:MEASure:SPECtrum[n]? . . . . . . . . . . . . . . . . . . . . . . . . . . . . . . . . . . . . . . . . . . . . . . . . . . . . . . . . . 378
:MEASure:TBFRequency[n]? . . . . . . . . . . . . . . . . . . . . . . . . . . . . . . . . . . . . . . . . . . . . . . . . . . . . . . . 381
:MEASure:TSPur[n]? . . . . . . . . . . . . . . . . . . . . . . . . . . . . . . . . . . . . . . . . . . . . . . . . . . . . . . . . . . . . . 382
:MEASure:TXPower[n]? . . . . . . . . . . . . . . . . . . . . . . . . . . . . . . . . . . . . . . . . . . . . . . . . . . . . . . . . . . . 383
:MEASure:WAVeform[n]? . . . . . . . . . . . . . . . . . . . . . . . . . . . . . . . . . . . . . . . . . . . . . . . . . . . . . . . . . . 385
:READ:AREFerence[n]? . . . . . . . . . . . . . . . . . . . . . . . . . . . . . . . . . . . . . . . . . . . . . . . . . . . . . . . . . . . 352
:READ:EEVM[n]? . . . . . . . . . . . . . . . . . . . . . . . . . . . . . . . . . . . . . . . . . . . . . . . . . . . . . . . . . . . . . . . . 353
:READ:EORFspectr[n]? . . . . . . . . . . . . . . . . . . . . . . . . . . . . . . . . . . . . . . . . . . . . . . . . . . . . . . . . . . . 357
:READ:EPVTime[n]?. . . . . . . . . . . . . . . . . . . . . . . . . . . . . . . . . . . . . . . . . . . . . . . . . . . . . . . . . . . . . . 361
:READ:ETSPur[n]? . . . . . . . . . . . . . . . . . . . . . . . . . . . . . . . . . . . . . . . . . . . . . . . . . . . . . . . . . . . . . . . 364
15

List of Commands
:READ:ORFSpectrum[n]? . . . . . . . . . . . . . . . . . . . . . . . . . . . . . . . . . . . . . . . . . . . . . . . . . . . . . . . . . .366
:READ:PFERror[n]?. . . . . . . . . . . . . . . . . . . . . . . . . . . . . . . . . . . . . . . . . . . . . . . . . . . . . . . . . . . . . . .370
:READ:PVTime[n]?. . . . . . . . . . . . . . . . . . . . . . . . . . . . . . . . . . . . . . . . . . . . . . . . . . . . . . . . . . . . . . . .373
:READ:SENSors[n]?. . . . . . . . . . . . . . . . . . . . . . . . . . . . . . . . . . . . . . . . . . . . . . . . . . . . . . . . . . . . . . .377
:READ:SPECtrum[n]? . . . . . . . . . . . . . . . . . . . . . . . . . . . . . . . . . . . . . . . . . . . . . . . . . . . . . . . . . . . . .378
:READ:TBFRequency[n]? . . . . . . . . . . . . . . . . . . . . . . . . . . . . . . . . . . . . . . . . . . . . . . . . . . . . . . . . . .381
:READ:TSPur[n]? . . . . . . . . . . . . . . . . . . . . . . . . . . . . . . . . . . . . . . . . . . . . . . . . . . . . . . . . . . . . . . . . .382
:READ:TXPower[n]? . . . . . . . . . . . . . . . . . . . . . . . . . . . . . . . . . . . . . . . . . . . . . . . . . . . . . . . . . . . . . .383
:READ:WAVeform[n]?. . . . . . . . . . . . . . . . . . . . . . . . . . . . . . . . . . . . . . . . . . . . . . . . . . . . . . . . . . . . . .385
:READ:<measurement>[n]?. . . . . . . . . . . . . . . . . . . . . . . . . . . . . . . . . . . . . . . . . . . . . . . . . . . . . . . . .387
List of Commands
:TRIGger[:SEQuence]:AUTO:STATe OFF|ON|0|1 . . . . . . . . . . . . . . . . . . . . . . . . . . . . . . . . . . . . .514
:TRIGger[:SEQuence]:AUTO:STATe? . . . . . . . . . . . . . . . . . . . . . . . . . . . . . . . . . . . . . . . . . . . . . . . . .514
:TRIGger[:SEQuence]:AUTO[:TIME] <time> . . . . . . . . . . . . . . . . . . . . . . . . . . . . . . . . . . . . . . . . . .514
:TRIGger[:SEQuence]:AUTO[:TIME]? . . . . . . . . . . . . . . . . . . . . . . . . . . . . . . . . . . . . . . . . . . . . . . . .514
:TRIGger[:SEQuence]:EXTernal[1]|2:DELay <time> . . . . . . . . . . . . . . . . . . . . . . . . . . . . . . . . . . . .515
:TRIGger[:SEQuence]:EXTernal[1]|2:DELay?. . . . . . . . . . . . . . . . . . . . . . . . . . . . . . . . . . . . . . . . . .515
:TRIGger[:SEQuence]:EXTernal[1]|2:LEVel <voltage> . . . . . . . . . . . . . . . . . . . . . . . . . . . . . . . . . .515
:TRIGger[:SEQuence]:EXTernal[1]|2:LEVel? . . . . . . . . . . . . . . . . . . . . . . . . . . . . . . . . . . . . . . . . . .515
:TRIGger[:SEQuence]:EXTernal[1]|2:SLOPe NEGative|POSitive . . . . . . . . . . . . . . . . . . . . . . . . .515
:TRIGger[:SEQuence]:EXTernal[1]|2:SLOPe?. . . . . . . . . . . . . . . . . . . . . . . . . . . . . . . . . . . . . . . . . .516
:TRIGger[:SEQuence]:FRAMe:ADJust <time> . . . . . . . . . . . . . . . . . . . . . . . . . . . . . . . . . . . . . . . . .516
:TRIGger[:SEQuence]:FRAMe:PERiod <time> . . . . . . . . . . . . . . . . . . . . . . . . . . . . . . . . . . . . . . . . .516
:TRIGger[:SEQuence]:FRAMe:PERiod? . . . . . . . . . . . . . . . . . . . . . . . . . . . . . . . . . . . . . . . . . . . . . . .516
:TRIGger[:SEQuence]:FRAMe:SYNC EXTFront|EXTRear|OFF . . . . . . . . . . . . . . . . . . . . . . . . . .517
:TRIGger[:SEQuence]:FRAMe:SYNC:OFFSet <time> . . . . . . . . . . . . . . . . . . . . . . . . . . . . . . . . . . .517
:TRIGger[:SEQuence]:FRAMe:SYNC:OFFSet? . . . . . . . . . . . . . . . . . . . . . . . . . . . . . . . . . . . . . . . . .517
:TRIGger[:SEQuence]:FRAMe:SYNC? . . . . . . . . . . . . . . . . . . . . . . . . . . . . . . . . . . . . . . . . . . . . . . . .517
:TRIGger[:SEQuence]:HOLDoff <time> . . . . . . . . . . . . . . . . . . . . . . . . . . . . . . . . . . . . . . . . . . . . . . .518
:TRIGger[:SEQuence]:HOLDoff?. . . . . . . . . . . . . . . . . . . . . . . . . . . . . . . . . . . . . . . . . . . . . . . . . . . . .518
:TRIGger[:SEQuence]:IF:DELay <time> . . . . . . . . . . . . . . . . . . . . . . . . . . . . . . . . . . . . . . . . . . . . . .518
:TRIGger[:SEQuence]:IF:DELay? . . . . . . . . . . . . . . . . . . . . . . . . . . . . . . . . . . . . . . . . . . . . . . . . . . . .518
16

List of Commands
:TRIGger[:SEQuence]:IF:LEVel <ampl> . . . . . . . . . . . . . . . . . . . . . . . . . . . . . . . . . . . . . . . . . . . . . . 518
:TRIGger[:SEQuence]:IF:LEVel? . . . . . . . . . . . . . . . . . . . . . . . . . . . . . . . . . . . . . . . . . . . . . . . . . . . . 518
:TRIGger[:SEQuence]:IF:SLOPe NEGative|POSitive . . . . . . . . . . . . . . . . . . . . . . . . . . . . . . . . . . . 519
:TRIGger[:SEQuence]:IF:SLOPe? . . . . . . . . . . . . . . . . . . . . . . . . . . . . . . . . . . . . . . . . . . . . . . . . . . . 519
:TRIGger[:SEQuence]:RFBurst:DELay <time> . . . . . . . . . . . . . . . . . . . . . . . . . . . . . . . . . . . . . . . . 519
:TRIGger[:SEQuence]:RFBurst:DELay? . . . . . . . . . . . . . . . . . . . . . . . . . . . . . . . . . . . . . . . . . . . . . . 519
:TRIGger[:SEQuence]:RFBurst:LEVel <rel_power>. . . . . . . . . . . . . . . . . . . . . . . . . . . . . . . . . . . . . 519
:TRIGger[:SEQuence]:RFBurst:LEVel?. . . . . . . . . . . . . . . . . . . . . . . . . . . . . . . . . . . . . . . . . . . . . . . 519
:TRIGger[:SEQuence]:RFBurst:SLOPe NEGative|POSitive . . . . . . . . . . . . . . . . . . . . . . . . . . . . . 520
:TRIGger[:SEQuence]:RFBurst:SLOPe? . . . . . . . . . . . . . . . . . . . . . . . . . . . . . . . . . . . . . . . . . . . . . . 520
List of Commands
[:SENSe]:CHANnel:ARFCn|RFCHannel <integer> . . . . . . . . . . . . . . . . . . . . . . . . . . . . . . . . . . . . 390
[:SENSe]:CHANnel:ARFCn|RFCHannel:BOTTom . . . . . . . . . . . . . . . . . . . . . . . . . . . . . . . . . . . . . 390
[:SENSe]:CHANnel:ARFCn|RFCHannel:MIDDle . . . . . . . . . . . . . . . . . . . . . . . . . . . . . . . . . . . . . . 391
[:SENSe]:CHANnel:ARFCn|RFCHannel:TOP . . . . . . . . . . . . . . . . . . . . . . . . . . . . . . . . . . . . . . . . . 392
[:SENSe]:CHANnel:ARFCn|RFCHannel? . . . . . . . . . . . . . . . . . . . . . . . . . . . . . . . . . . . . . . . . . . . . 390
[:SENSe]:CHANnel:BURSt NORMal|SYNC|ACCess. . . . . . . . . . . . . . . . . . . . . . . . . . . . . . . . . . . 392
[:SENSe]:CHANnel:BURSt? . . . . . . . . . . . . . . . . . . . . . . . . . . . . . . . . . . . . . . . . . . . . . . . . . . . . . . . 392
[:SENSe]:CHANnel:SLOT <integer> . . . . . . . . . . . . . . . . . . . . . . . . . . . . . . . . . . . . . . . . . . . . . . . . . 393
[:SENSe]:CHANnel:SLOT:AUTO OFF|ON|0|1 . . . . . . . . . . . . . . . . . . . . . . . . . . . . . . . . . . . . . . . 393
[:SENSe]:CHANnel:SLOT:AUTO?. . . . . . . . . . . . . . . . . . . . . . . . . . . . . . . . . . . . . . . . . . . . . . . . . . . 393
[:SENSe]:CHANnel:SLOT? . . . . . . . . . . . . . . . . . . . . . . . . . . . . . . . . . . . . . . . . . . . . . . . . . . . . . . . . 393
[:SENSe]:CHANnel:TSCode <integer> . . . . . . . . . . . . . . . . . . . . . . . . . . . . . . . . . . . . . . . . . . . . . . . 394
[:SENSe]:CHANnel:TSCode:AUTO OFF|ON|0|1 . . . . . . . . . . . . . . . . . . . . . . . . . . . . . . . . . . . . . 394
[:SENSe]:CHANnel:TSCode:AUTO? . . . . . . . . . . . . . . . . . . . . . . . . . . . . . . . . . . . . . . . . . . . . . . . . . 394
[:SENSe]:CHANnel:TSCode? . . . . . . . . . . . . . . . . . . . . . . . . . . . . . . . . . . . . . . . . . . . . . . . . . . . . . . . 394
[:SENSe]:CORRection:BTS[:RF]:LOSS <rel_power> . . . . . . . . . . . . . . . . . . . . . . . . . . . . . . . . . . . . 395
[:SENSe]:CORRection:BTS[:RF]:LOSS? . . . . . . . . . . . . . . . . . . . . . . . . . . . . . . . . . . . . . . . . . . . . . . 395
[:SENSe]:CORRection:MS[:RF]:LOSS <rel_power> . . . . . . . . . . . . . . . . . . . . . . . . . . . . . . . . . . . . . 395
[:SENSe]:CORRection:MS[:RF]:LOSS? . . . . . . . . . . . . . . . . . . . . . . . . . . . . . . . . . . . . . . . . . . . . . . . 395
[:SENSe]:EEVM:AVERage:COUNt <integer> . . . . . . . . . . . . . . . . . . . . . . . . . . . . . . . . . . . . . . . . . 396
[:SENSe]:EEVM:AVERage:COUNt? . . . . . . . . . . . . . . . . . . . . . . . . . . . . . . . . . . . . . . . . . . . . . . . . . 396
17

List of Commands
[:SENSe]:EEVM:AVERage:TCONtrol EXPonential|REPeat . . . . . . . . . . . . . . . . . . . . . . . . . . . . . .396
[:SENSe]:EEVM:AVERage:TCONtrol? . . . . . . . . . . . . . . . . . . . . . . . . . . . . . . . . . . . . . . . . . . . . . . . .396
[:SENSe]:EEVM:AVERage[:STATe] OFF|ON|0|1 . . . . . . . . . . . . . . . . . . . . . . . . . . . . . . . . . . . . . .396
[:SENSe]:EEVM:AVERage[:STATe]?. . . . . . . . . . . . . . . . . . . . . . . . . . . . . . . . . . . . . . . . . . . . . . . . . .396
[:SENSe]:EEVM:BSYNc:PMODulation:ALIGnment OFF|ON|0|1 . . . . . . . . . . . . . . . . . . . . . . . .397
[:SENSe]:EEVM:BSYNc:PMODulation:ALIGnment? . . . . . . . . . . . . . . . . . . . . . . . . . . . . . . . . . . . .397
[:SENSe]:EEVM:BSYNc:SOURce RFBurst|PMODulation|TSEQuence|NONE . . . . . . . . . . . . . .397
[:SENSe]:EEVM:BSYNc:SOURce? . . . . . . . . . . . . . . . . . . . . . . . . . . . . . . . . . . . . . . . . . . . . . . . . . . .397
[:SENSe]:EEVM:DROop OFF|ON|0|1 . . . . . . . . . . . . . . . . . . . . . . . . . . . . . . . . . . . . . . . . . . . . . . .398
[:SENSe]:EEVM:DROop? . . . . . . . . . . . . . . . . . . . . . . . . . . . . . . . . . . . . . . . . . . . . . . . . . . . . . . . . . .398
List of Commands
[:SENSe]:EEVM:ELIMit OFF|ON|0|1. . . . . . . . . . . . . . . . . . . . . . . . . . . . . . . . . . . . . . . . . . . . . . .399
[:SENSe]:EEVM:ELIMit? . . . . . . . . . . . . . . . . . . . . . . . . . . . . . . . . . . . . . . . . . . . . . . . . . . . . . . . . . .399
[:SENSe]:EEVM:FERRor:TRANge WIDE|NORMal . . . . . . . . . . . . . . . . . . . . . . . . . . . . . . . . . . . . .399
[:SENSe]:EEVM:FERRor:TRANge? . . . . . . . . . . . . . . . . . . . . . . . . . . . . . . . . . . . . . . . . . . . . . . . . . .399
[:SENSe]:EEVM:SDOTs[:STATe] OFF|ON|0|1 . . . . . . . . . . . . . . . . . . . . . . . . . . . . . . . . . . . . . . . .399
[:SENSe]:EEVM:SDOTs[:STATe]?. . . . . . . . . . . . . . . . . . . . . . . . . . . . . . . . . . . . . . . . . . . . . . . . . . . .399
[:SENSe]:EEVM:TRACe:SDOTs <integer> . . . . . . . . . . . . . . . . . . . . . . . . . . . . . . . . . . . . . . . . . . . .400
[:SENSe]:EEVM:TRACe:SDOTs? . . . . . . . . . . . . . . . . . . . . . . . . . . . . . . . . . . . . . . . . . . . . . . . . . . . .400
[:SENSe]:EEVM:TRIGger:SOURce EXTernal[1]|EXTernal2|FRAMe|IF|IMMediate|RFBurst.400
[:SENSe]:EEVM:TRIGger:SOURce? . . . . . . . . . . . . . . . . . . . . . . . . . . . . . . . . . . . . . . . . . . . . . . . . . .400
[:SENSe]:EEVM:TYPE:LIMit NORMal|EXTReme . . . . . . . . . . . . . . . . . . . . . . . . . . . . . . . . . . . . .400
[:SENSe]:EEVM:TYPE:LIMit? . . . . . . . . . . . . . . . . . . . . . . . . . . . . . . . . . . . . . . . . . . . . . . . . . . . . . .401
[:SENSe]:EORFSpectrum:DETector:SWITching:FAST[:STATe] OFF|ON|0|1 . . . . . . . . . . . . . . .406
[:SENSe]:EORFSpectrum:DETector:SWITching? . . . . . . . . . . . . . . . . . . . . . . . . . . . . . . . . . . . . . . .406
[:SENSe]:EORFspectr:AVERage:COUNt <integer> . . . . . . . . . . . . . . . . . . . . . . . . . . . . . . . . . . . . .402
[:SENSe]:EORFspectr:AVERage:COUNt? . . . . . . . . . . . . . . . . . . . . . . . . . . . . . . . . . . . . . . . . . . . . .402
[:SENSe]:EORFspectr:AVERage:FAST[:STATe] OFF|ON|0|1 . . . . . . . . . . . . . . . . . . . . . . . . . . . .402
[:SENSe]:EORFspectr:AVERage:FAST[:STATe]? . . . . . . . . . . . . . . . . . . . . . . . . . . . . . . . . . . . . . . . .402
[:SENSe]:EORFspectr:AVERage:MODulation:TYPE LOG|RMS . . . . . . . . . . . . . . . . . . . . . . . . . . .403
[:SENSe]:EORFspectr:AVERage:MODulation:TYPE?. . . . . . . . . . . . . . . . . . . . . . . . . . . . . . . . . . . .403
[:SENSe]:EORFspectr:AVERage[:STATe] OFF|ON|0|1 . . . . . . . . . . . . . . . . . . . . . . . . . . . . . . . . .403
18

List of Commands
[:SENSe]:EORFspectr:AVERage[:STATe]? . . . . . . . . . . . . . . . . . . . . . . . . . . . . . . . . . . . . . . . . . . . . 403
[:SENSe]:EORFspectr:BANDwidth|BWIDth[:RESolution]
:MODulation:CARRier <freq> . . . . . . . . . . . . . . . . . . . . . . . . . . . . . . . . . . . . . . . . . . . . . . . . . . . . . . 403
[:SENSe]:EORFspectr:BANDwidth|BWIDth[:RESolution]
:MODulation:CARRier? . . . . . . . . . . . . . . . . . . . . . . . . . . . . . . . . . . . . . . . . . . . . . . . . . . . . . . . . . . . 403
[:SENSe]:EORFspectr:BANDwidth|BWIDth[:RESolution]
:MODulation:OFFSet:CLOSe <freq>. . . . . . . . . . . . . . . . . . . . . . . . . . . . . . . . . . . . . . . . . . . . . . . . . 404
[:SENSe]:EORFspectr:BANDwidth|BWIDth[:RESolution]
:MODulation:OFFSet:CLOSe? . . . . . . . . . . . . . . . . . . . . . . . . . . . . . . . . . . . . . . . . . . . . . . . . . . . . . . 404
[:SENSe]:EORFspectr:BANDwidth|BWIDth[:RESolution]
:MODulation:OFFSet:FAR <freq> . . . . . . . . . . . . . . . . . . . . . . . . . . . . . . . . . . . . . . . . . . . . . . . . . . . 404
[:SENSe]:EORFspectr:BANDwidth|BWIDth[:RESolution]
:MODulation:OFFSet:FAR? . . . . . . . . . . . . . . . . . . . . . . . . . . . . . . . . . . . . . . . . . . . . . . . . . . . . . . . . 404
[:SENSe]:EORFspectr:BANDwidth|BWIDth[:RESolution]
:SWITching:CARRier <freq> . . . . . . . . . . . . . . . . . . . . . . . . . . . . . . . . . . . . . . . . . . . . . . . . . . . . . . . 405
[:SENSe]:EORFspectr:BANDwidth|BWIDth[:RESolution]
:SWITching:CARRier? . . . . . . . . . . . . . . . . . . . . . . . . . . . . . . . . . . . . . . . . . . . . . . . . . . . . . . . . . . . . 405
[:SENSe]:EORFspectr:BANDwidth|BWIDth[:RESolution]
:SWITching:OFFSet:CLOSe <freq> . . . . . . . . . . . . . . . . . . . . . . . . . . . . . . . . . . . . . . . . . . . . . . . . . . 405
[:SENSe]:EORFspectr:BANDwidth|BWIDth[:RESolution]
:SWITching:OFFSet:CLOSe? . . . . . . . . . . . . . . . . . . . . . . . . . . . . . . . . . . . . . . . . . . . . . . . . . . . . . . . 405
[:SENSe]:EORFspectr:BANDwidth|BWIDth[:RESolution]
:SWITching:OFFSet:FAR <freq> . . . . . . . . . . . . . . . . . . . . . . . . . . . . . . . . . . . . . . . . . . . . . . . . . . . . 405
[:SENSe]:EORFspectr:BANDwidth|BWIDth[:RESolution]
:SWITching:OFFSet:FAR? . . . . . . . . . . . . . . . . . . . . . . . . . . . . . . . . . . . . . . . . . . . . . . . . . . . . . . . . . 406
[:SENSe]:EORFspectr:BFRequency <freq>. . . . . . . . . . . . . . . . . . . . . . . . . . . . . . . . . . . . . . . . . . . . 406
List of Commands
[:SENSe]:EORFspectr:BFRequency? . . . . . . . . . . . . . . . . . . . . . . . . . . . . . . . . . . . . . . . . . . . . . . . . . 406
[:SENSe]:EORFspectr:LIST:MODulation:APPLy
RELative|BOTH|ABSolute{,RELative|BOTH|ABSolute} . . . . . . . . . . . . . . . . . . . . . . . . . . . . . . 407
[:SENSe]:EORFspectr:LIST:MODulation:APPLy? . . . . . . . . . . . . . . . . . . . . . . . . . . . . . . . . . . . . . . 407
[:SENSe]:EORFspectr:LIST:MODulation:BANDwidth|BWIDth
<res bw>{,<res bw>} . . . . . . . . . . . . . . . . . . . . . . . . . . . . . . . . . . . . . . . . . . . . . . . . . . . . . . . . . . . . . . 408
[:SENSe]:EORFspectr:LIST:MODulation:BANDwidth|BWIDth? . . . . . . . . . . . . . . . . . . . . . . . . . 408
[:SENSe]:EORFspectr:LIST:MODulation:LOFFset [:RCARrier]<level>{,<level>}. . . . . . . . . . . . . 410
[:SENSe]:EORFspectr:LIST:MODulation:LOFFset [:RCARrier]?. . . . . . . . . . . . . . . . . . . . . . . . . . 410
[:SENSe]:EORFspectr:LIST:MODulation:LOFFset:ABSolute <level>{,<level>} . . . . . . . . . . . . . . 409
19

List of Commands
[:SENSe]:EORFspectr:LIST:MODulation:LOFFset:ABSolute? . . . . . . . . . . . . . . . . . . . . . . . . . . . .409
[:SENSe]:EORFspectr:LIST:MODulation:STATe OFF|ON|0|1{,OFF|ON|0|1} . . . . . . . . . . . . . .409
[:SENSe]:EORFspectr:LIST:MODulation:STATe? . . . . . . . . . . . . . . . . . . . . . . . . . . . . . . . . . . . . . . .409
[:SENSe]:EORFspectr:LIST:MODulation[:FREQuency] <offset freq>{,<offset freq>}. . . . . . . . . . .408
[:SENSe]:EORFspectr:LIST:MODulation[:FREQuency]? . . . . . . . . . . . . . . . . . . . . . . . . . . . . . . . . .408
[:SENSe]:EORFspectr:LIST:SELect CUSTom|SHORt|STANdard . . . . . . . . . . . . . . . . . . . . . . . . .411
[:SENSe]:EORFspectr:LIST:SELect? . . . . . . . . . . . . . . . . . . . . . . . . . . . . . . . . . . . . . . . . . . . . . . . . . 411
[:SENSe]:EORFspectr:LIST:SWITching:APPLy
RELative|BOTH|ABSolute{,RELative|BOTH|ABSolute} . . . . . . . . . . . . . . . . . . . . . . . . . . . . . . .412
[:SENSe]:EORFspectr:LIST:SWITching:APPLy? . . . . . . . . . . . . . . . . . . . . . . . . . . . . . . . . . . . . . . . .412
List of Commands
[:SENSe]:EORFspectr:LIST:SWITching:BANDwidth|BWIDth <res bw>{,<res bw>}. . . . . . . . . . .414
[:SENSe]:EORFspectr:LIST:SWITching:BANDwidth|BWIDth? . . . . . . . . . . . . . . . . . . . . . . . . . . .414
[:SENSe]:EORFspectr:LIST:SWITching:LOFFset [:RCARrier] <level>{,<level>} . . . . . . . . . . . . . .415
[:SENSe]:EORFspectr:LIST:SWITching:LOFFset [:RCARrier]?. . . . . . . . . . . . . . . . . . . . . . . . . . . .415
[:SENSe]:EORFspectr:LIST:SWITching:LOFFset:ABSolute <level>{,<level>} . . . . . . . . . . . . . . . .412
[:SENSe]:EORFspectr:LIST:SWITching:LOFFset:ABSolute?. . . . . . . . . . . . . . . . . . . . . . . . . . . . . .412
[:SENSe]:EORFspectr:LIST:SWITching:STATe OFF|ON|0|1{,OFF|ON|0|1} . . . . . . . . . . . . . . .413
[:SENSe]:EORFspectr:LIST:SWITching:STATe? . . . . . . . . . . . . . . . . . . . . . . . . . . . . . . . . . . . . . . . .413
[:SENSe]:EORFspectr:LIST:SWITching[:FREQuency] <offset freq>{,<offset freq>} . . . . . . . . . . . .413
[:SENSe]:EORFspectr:LIST:SWITching[:FREQuency]
<offset freq>{,<offset freq>} . . . . . . . . . . . . . . . . . . . . . . . . . . . . . . . . . . . . . . . . . . . . . . . . . . . . . . . . .414
[:SENSe]:EORFspectr:LIST:SWITching[:FREQuency]? . . . . . . . . . . . . . . . . . . . . . . . . . . . . . . . . . .413
[:SENSe]:EORFspectr:LIST:SWITching[:FREQuency]? . . . . . . . . . . . . . . . . . . . . . . . . . . . . . . . . . .415
[:SENSe]:EORFspectr:MEASure MULTiple|SINGle|SWEPt . . . . . . . . . . . . . . . . . . . . . . . . . . . . .407
[:SENSe]:EORFspectr:MEASure MULTiple|SINGle|SWEPt . . . . . . . . . . . . . . . . . . . . . . . . . . . . .416
[:SENSe]:EORFspectr:MEASure? . . . . . . . . . . . . . . . . . . . . . . . . . . . . . . . . . . . . . . . . . . . . . . . . . . . .407
[:SENSe]:EORFspectr:MEASure? . . . . . . . . . . . . . . . . . . . . . . . . . . . . . . . . . . . . . . . . . . . . . . . . . . . .416
[:SENSe]:EORFspectr:OFRequency <freq> . . . . . . . . . . . . . . . . . . . . . . . . . . . . . . . . . . . . . . . . . . . .416
[:SENSe]:EORFspectr:OFRequency? . . . . . . . . . . . . . . . . . . . . . . . . . . . . . . . . . . . . . . . . . . . . . . . . .416
[:SENSe]:EORFspectr:TRIGger:SOURce EXTernal[1]|EXTernal2|FRAMe|IMMediate
|RFBurst . . . . . . . . . . . . . . . . . . . . . . . . . . . . . . . . . . . . . . . . . . . . . . . . . . . . . . . . . . . . . . . . . . . . . . .416
[:SENSe]:EORFspectr:TRIGger:SOURce? . . . . . . . . . . . . . . . . . . . . . . . . . . . . . . . . . . . . . . . . . . . . .416
20

List of Commands
[:SENSe]:EORFspectr:TYPE MODulation|MSWitching|SWITching|FFModulation . . . . . . . . . 417
[:SENSe]:EORFspectr:TYPE:MODulation[:METHod] DISCrete|SWEep . . . . . . . . . . . . . . . . . . . 417
[:SENSe]:EORFspectr:TYPE:MODulation[:METHod]? . . . . . . . . . . . . . . . . . . . . . . . . . . . . . . . . . . 418
[:SENSe]:EORFspectr:TYPE? . . . . . . . . . . . . . . . . . . . . . . . . . . . . . . . . . . . . . . . . . . . . . . . . . . . . . . 417
[:SENSe]:EPVTime:AVERage:COUNt <integer> . . . . . . . . . . . . . . . . . . . . . . . . . . . . . . . . . . . . . . . 419
[:SENSe]:EPVTime:AVERage:COUNt? . . . . . . . . . . . . . . . . . . . . . . . . . . . . . . . . . . . . . . . . . . . . . . . 419
[:SENSe]:EPVTime:AVERage:TCONtrol EXPonential|REPeat . . . . . . . . . . . . . . . . . . . . . . . . . . . 419
[:SENSe]:EPVTime:AVERage:TCONtrol? . . . . . . . . . . . . . . . . . . . . . . . . . . . . . . . . . . . . . . . . . . . . . 419
[:SENSe]:EPVTime:AVERage:TYPE LOG|MAXimum|MINimum|MXMinimum|RMS . . . . . . . 420
[:SENSe]:EPVTime:AVERage:TYPE? . . . . . . . . . . . . . . . . . . . . . . . . . . . . . . . . . . . . . . . . . . . . . . . . 420
List of Commands
[:SENSe]:EPVTime:AVERage[:STATe] OFF|ON|0|1 . . . . . . . . . . . . . . . . . . . . . . . . . . . . . . . . . . . 419
[:SENSe]:EPVTime:AVERage[:STATe]?. . . . . . . . . . . . . . . . . . . . . . . . . . . . . . . . . . . . . . . . . . . . . . . 419
[:SENSe]:EPVTime:BANDwidth|BWIDth[:RESolution] <freq> . . . . . . . . . . . . . . . . . . . . . . . . . . . 420
[:SENSe]:EPVTime:BANDwidth|BWIDth[:RESolution]:TYPE FLATtop|GAUSsian . . . . . . . . . 421
[:SENSe]:EPVTime:BANDwidth|BWIDth[:RESolution]:TYPE? . . . . . . . . . . . . . . . . . . . . . . . . . . 421
[:SENSe]:EPVTime:BANDwidth|BWIDth[:RESolution]? . . . . . . . . . . . . . . . . . . . . . . . . . . . . . . . . 420
[:SENSe]:EPVTime:BSYNc:SLENgth EVEN|INTeger . . . . . . . . . . . . . . . . . . . . . . . . . . . . . . . . . . 421
[:SENSe]:EPVTime:BSYNc:SLENgth? . . . . . . . . . . . . . . . . . . . . . . . . . . . . . . . . . . . . . . . . . . . . . . . 421
[:SENSe]:EPVTime:BSYNc:SOURce TSEQuence|RFBurst|NONE. . . . . . . . . . . . . . . . . . . . . . . . 421
[:SENSe]:EPVTime:BSYNc:SOURce? . . . . . . . . . . . . . . . . . . . . . . . . . . . . . . . . . . . . . . . . . . . . . . . . 421
[:SENSe]:EPVTime:LIMit:MASK OFF|ON|0|1 . . . . . . . . . . . . . . . . . . . . . . . . . . . . . . . . . . . . . . . 422
[:SENSe]:EPVTime:LIMit:MASK?. . . . . . . . . . . . . . . . . . . . . . . . . . . . . . . . . . . . . . . . . . . . . . . . . . . 422
[:SENSe]:EPVTime:MASK:LIST:LOWer:ABSolute
<power>,<power>,<power>,<power>,<power>,... . . . . . . . . . . . . . . . . . . . . . . . . . . . . . . . . . . . . . . . 423
[:SENSe]:EPVTime:MASK:LIST:LOWer:ABSolute? . . . . . . . . . . . . . . . . . . . . . . . . . . . . . . . . . . . . 423
[:SENSe]:EPVTime:MASK:LIST:LOWer:POINts? . . . . . . . . . . . . . . . . . . . . . . . . . . . . . . . . . . . . . . 423
[:SENSe]:EPVTime:MASK:LIST:LOWer:RELative
<rel_power>,<rel_power>,<rel_power>,<rel_power>,<rel_power>,... . . . . . . . . . . . . . . . . . . . . . . . 424
[:SENSe]:EPVTime:MASK:LIST:LOWer:RELative? . . . . . . . . . . . . . . . . . . . . . . . . . . . . . . . . . . . . 424
[:SENSe]:EPVTime:MASK:LIST:LOWer:TIME
<seconds>,<seconds>,<seconds>,<seconds>,<seconds>,... . . . . . . . . . . . . . . . . . . . . . . . . . . . . . . . . 424
[:SENSe]:EPVTime:MASK:LIST:LOWer:TIME? . . . . . . . . . . . . . . . . . . . . . . . . . . . . . . . . . . . . . . . 424
21

List of Commands
[:SENSe]:EPVTime:MASK:LIST:UPPer:ABSolute
<power>,<power>,<power>,<power>,<power>,.... . . . . . . . . . . . . . . . . . . . . . . . . . . . . . . . . . . . . . . .425
[:SENSe]:EPVTime:MASK:LIST:UPPer:ABSolute?. . . . . . . . . . . . . . . . . . . . . . . . . . . . . . . . . . . . . .425
[:SENSe]:EPVTime:MASK:LIST:UPPer:POINts? . . . . . . . . . . . . . . . . . . . . . . . . . . . . . . . . . . . . . . .426
[:SENSe]:EPVTime:MASK:LIST:UPPer:RELative
<rel_power>,<rel_power>,<rel_power>,<rel_power>,<rel_power>,... . . . . . . . . . . . . . . . . . . . . . . . .426
[:SENSe]:EPVTime:MASK:LIST:UPPer:RELative? . . . . . . . . . . . . . . . . . . . . . . . . . . . . . . . . . . . . .426
[:SENSe]:EPVTime:MASK:LIST:UPPer:TIME
<seconds>,<seconds>,<seconds>,<seconds>,<seconds>,... . . . . . . . . . . . . . . . . . . . . . . . . . . . . . . . . .427
[:SENSe]:EPVTime:MASK:LIST:UPPer:TIME? . . . . . . . . . . . . . . . . . . . . . . . . . . . . . . . . . . . . . . . .427
[:SENSe]:EPVTime:MASK:SELect STANdard|CUSTom . . . . . . . . . . . . . . . . . . . . . . . . . . . . . . . . .428
List of Commands
[:SENSe]:EPVTime:MASK:SELect? . . . . . . . . . . . . . . . . . . . . . . . . . . . . . . . . . . . . . . . . . . . . . . . . . .428
[:SENSe]:EPVTime:PCLevel <integer> . . . . . . . . . . . . . . . . . . . . . . . . . . . . . . . . . . . . . . . . . . . . . . .431
[:SENSe]:EPVTime:PCLevel? . . . . . . . . . . . . . . . . . . . . . . . . . . . . . . . . . . . . . . . . . . . . . . . . . . . . . . .431
[:SENSe]:EPVTime:SWEep:TIME <integer> . . . . . . . . . . . . . . . . . . . . . . . . . . . . . . . . . . . . . . . . . . .431
[:SENSe]:EPVTime:SWEep:TIME?. . . . . . . . . . . . . . . . . . . . . . . . . . . . . . . . . . . . . . . . . . . . . . . . . . .431
[:SENSe]:EPVTime:TRIGger:SOURce EXTernal[1]|EXTernal2
|FRAMe|IF|IMMediate|RFBurst . . . . . . . . . . . . . . . . . . . . . . . . . . . . . . . . . . . . . . . . . . . . . . . . . .432
[:SENSe]:EPVTime:TRIGger:SOURce? . . . . . . . . . . . . . . . . . . . . . . . . . . . . . . . . . . . . . . . . . . . . . . .432
[:SENSe]:ETSPur:AVERage:COUNt <integer> . . . . . . . . . . . . . . . . . . . . . . . . . . . . . . . . . . . . . . . . .433
[:SENSe]:ETSPur:AVERage:COUNt? . . . . . . . . . . . . . . . . . . . . . . . . . . . . . . . . . . . . . . . . . . . . . . . . .433
[:SENSe]:ETSPur:AVERage:TCONtrol EXPonential|REPeat . . . . . . . . . . . . . . . . . . . . . . . . . . . . .433
[:SENSe]:ETSPur:AVERage:TCONtrol? . . . . . . . . . . . . . . . . . . . . . . . . . . . . . . . . . . . . . . . . . . . . . . .433
[:SENSe]:ETSPur:AVERage:TYPE LOG|MAXimum|RMS . . . . . . . . . . . . . . . . . . . . . . . . . . . . . . .434
[:SENSe]:ETSPur:AVERage:TYPE? . . . . . . . . . . . . . . . . . . . . . . . . . . . . . . . . . . . . . . . . . . . . . . . . . .434
[:SENSe]:ETSPur:AVERage[:STATe] OFF|ON|0|1 . . . . . . . . . . . . . . . . . . . . . . . . . . . . . . . . . . . . .433
[:SENSe]:ETSPur:AVERage[:STATe]? . . . . . . . . . . . . . . . . . . . . . . . . . . . . . . . . . . . . . . . . . . . . . . . .433
[:SENSe]:ETSPur:TYPE EXAMine|FULL . . . . . . . . . . . . . . . . . . . . . . . . . . . . . . . . . . . . . . . . . . . .434
[:SENSe]:ETSPur:TYPE? . . . . . . . . . . . . . . . . . . . . . . . . . . . . . . . . . . . . . . . . . . . . . . . . . . . . . . . . . .434
[:SENSe]:FEED RF|AREFerence|IFALign|WBALign . . . . . . . . . . . . . . . . . . . . . . . . . . . . . . . . . .435
[:SENSe]:FEED RF|IQ|IONLy|QONLy|AREFerence|IFALign . . . . . . . . . . . . . . . . . . . . . . . . . .435
[:SENSe]:FEED? . . . . . . . . . . . . . . . . . . . . . . . . . . . . . . . . . . . . . . . . . . . . . . . . . . . . . . . . . . . . . . . . .435
22

List of Commands
[:SENSe]:FREQuency:CENTer <freq> . . . . . . . . . . . . . . . . . . . . . . . . . . . . . . . . . . . . . . . . . . . . . . . 437
[:SENSe]:FREQuency:CENTer:STEP[:INCRement] <freq> . . . . . . . . . . . . . . . . . . . . . . . . . . . . . . 437
[:SENSe]:FREQuency:CENTer:STEP[:INCRement]?. . . . . . . . . . . . . . . . . . . . . . . . . . . . . . . . . . . . 437
[:SENSe]:FREQuency:CENTer?. . . . . . . . . . . . . . . . . . . . . . . . . . . . . . . . . . . . . . . . . . . . . . . . . . . . . 437
[:SENSe]:ORFSpectrum:AVERage:COUNt <integer> . . . . . . . . . . . . . . . . . . . . . . . . . . . . . . . . . . . 439
[:SENSe]:ORFSpectrum:AVERage:COUNt? . . . . . . . . . . . . . . . . . . . . . . . . . . . . . . . . . . . . . . . . . . . 439
[:SENSe]:ORFSpectrum:AVERage:FAST[:STATe] OFF|ON|0|1 . . . . . . . . . . . . . . . . . . . . . . . . . . 439
[:SENSe]:ORFSpectrum:AVERage:FAST[:STATe]? . . . . . . . . . . . . . . . . . . . . . . . . . . . . . . . . . . . . . 439
[:SENSe]:ORFSpectrum:AVERage:MODulation:TYPE LOG|RMS . . . . . . . . . . . . . . . . . . . . . . . . 440
[:SENSe]:ORFSpectrum:AVERage:MODulation:TYPE? . . . . . . . . . . . . . . . . . . . . . . . . . . . . . . . . . 440
List of Commands
[:SENSe]:ORFSpectrum:AVERage:SWITching:TYPE?. . . . . . . . . . . . . . . . . . . . . . . . . . . . . . . . . . . 440
[:SENSe]:ORFSpectrum:AVERage[:STATe] OFF|ON|0|1 . . . . . . . . . . . . . . . . . . . . . . . . . . . . . . . 440
[:SENSe]:ORFSpectrum:AVERage[:STATe]?. . . . . . . . . . . . . . . . . . . . . . . . . . . . . . . . . . . . . . . . . . . 440
[:SENSe]:ORFSpectrum:BANDwidth|BWIDth[:RESolution]
:MODulation:CARRier <freq> . . . . . . . . . . . . . . . . . . . . . . . . . . . . . . . . . . . . . . . . . . . . . . . . . . . . . . 441
[:SENSe]:ORFSpectrum:BANDwidth|BWIDth[:RESolution]
:MODulation:CARRier? . . . . . . . . . . . . . . . . . . . . . . . . . . . . . . . . . . . . . . . . . . . . . . . . . . . . . . . . . . . 441
[:SENSe]:ORFSpectrum:BANDwidth|BWIDth[:RESolution]
:MODulation:OFFSet:CLOSe <freq>. . . . . . . . . . . . . . . . . . . . . . . . . . . . . . . . . . . . . . . . . . . . . . . . . 441
[:SENSe]:ORFSpectrum:BANDwidth|BWIDth[:RESolution]
:MODulation:OFFSet:CLOSe? . . . . . . . . . . . . . . . . . . . . . . . . . . . . . . . . . . . . . . . . . . . . . . . . . . . . . . 441
[:SENSe]:ORFSpectrum:BANDwidth|BWIDth[:RESolution]
:MODulation:OFFSet:FAR <freq> . . . . . . . . . . . . . . . . . . . . . . . . . . . . . . . . . . . . . . . . . . . . . . . . . . . 441
[:SENSe]:ORFSpectrum:BANDwidth|BWIDth[:RESolution]
:MODulation:OFFSet:FAR? . . . . . . . . . . . . . . . . . . . . . . . . . . . . . . . . . . . . . . . . . . . . . . . . . . . . . . . . 442
[:SENSe]:ORFSpectrum:BANDwidth|BWIDth[:RESolution]
:SWITching:CARRier <freq> . . . . . . . . . . . . . . . . . . . . . . . . . . . . . . . . . . . . . . . . . . . . . . . . . . . . . . . 442
[:SENSe]:ORFSpectrum:BANDwidth|BWIDth[:RESolution]
:SWITching:CARRier? . . . . . . . . . . . . . . . . . . . . . . . . . . . . . . . . . . . . . . . . . . . . . . . . . . . . . . . . . . . . 442
[:SENSe]:ORFSpectrum:BANDwidth|BWIDth[:RESolution]
:SWITching:OFFSet:CLOSe <freq> . . . . . . . . . . . . . . . . . . . . . . . . . . . . . . . . . . . . . . . . . . . . . . . . . . 442
[:SENSe]:ORFSpectrum:BANDwidth|BWIDth[:RESolution]
:SWITching:OFFSet:CLOSe? . . . . . . . . . . . . . . . . . . . . . . . . . . . . . . . . . . . . . . . . . . . . . . . . . . . . . . . 442
[:SENSe]:ORFSpectrum:BANDwidth|BWIDth[:RESolution]
:SWITching:OFFSet:FAR <freq> . . . . . . . . . . . . . . . . . . . . . . . . . . . . . . . . . . . . . . . . . . . . . . . . . . . . 443
23

List of Commands
[:SENSe]:ORFSpectrum:BANDwidth|BWIDth[:RESolution]
:SWITching:OFFSet:FAR? . . . . . . . . . . . . . . . . . . . . . . . . . . . . . . . . . . . . . . . . . . . . . . . . . . . . . . . . . .443
[:SENSe]:ORFSpectrum:BFRequency <freq> . . . . . . . . . . . . . . . . . . . . . . . . . . . . . . . . . . . . . . . . . .443
[:SENSe]:ORFSpectrum:BFRequency?. . . . . . . . . . . . . . . . . . . . . . . . . . . . . . . . . . . . . . . . . . . . . . . .443
[:SENSe]:ORFSpectrum:DETector:SWITching:FAST[:STATe] OFF|ON|0|1 . . . . . . . . . . . . . . . . .444
[:SENSe]:ORFSpectrum:DETector:SWITching?. . . . . . . . . . . . . . . . . . . . . . . . . . . . . . . . . . . . . . . . .444
[:SENSe]:ORFSpectrum:LIST:MODulation:APPLy RELative|BOTH|ABSolute{,RELa-
tive|BOTH|ABSolute} . . . . . . . . . . . . . . . . . . . . . . . . . . . . . . . . . . . . . . . . . . . . . . . . . . . . . . . . . . . .438
[:SENSe]:ORFSpectrum:LIST:MODulation:APPLy? . . . . . . . . . . . . . . . . . . . . . . . . . . . . . . . . . . . . .438
[:SENSe]:ORFSpectrum:LIST:MODulation:BANDwidth|BWIDth
<res bw>{,<res bw>}. . . . . . . . . . . . . . . . . . . . . . . . . . . . . . . . . . . . . . . . . . . . . . . . . . . . . . . . . . . . . . .444
List of Commands
[:SENSe]:ORFSpectrum:LIST:MODulation:BANDwidth|BWIDth? . . . . . . . . . . . . . . . . . . . . . . . .444
[:SENSe]:ORFSpectrum:LIST:MODulation:LOFFset:ABSolute <level>{,<level>} . . . . . . . . . . . . .446
[:SENSe]:ORFSpectrum:LIST:MODulation:LOFFset:ABSolute? . . . . . . . . . . . . . . . . . . . . . . . . . . .446
[:SENSe]:ORFSpectrum:LIST:MODulation:LOFFset[:RCARrier]
<level>{,<level>} . . . . . . . . . . . . . . . . . . . . . . . . . . . . . . . . . . . . . . . . . . . . . . . . . . . . . . . . . . . . . . . . . .445
[:SENSe]:ORFSpectrum:LIST:MODulation:LOFFset[:RCARrier]? . . . . . . . . . . . . . . . . . . . . . . . . .445
[:SENSe]:ORFSpectrum:LIST:MODulation:STATe OFF|ON|0|1{,OFF|ON|0|1} . . . . . . . . . . . .446
[:SENSe]:ORFSpectrum:LIST:MODulation:STATe? . . . . . . . . . . . . . . . . . . . . . . . . . . . . . . . . . . . . .446
[:SENSe]:ORFSpectrum:LIST:MODulation[:FREQuency] <offset freq>{,<offset freq>} . . . . . . . . .446
[:SENSe]:ORFSpectrum:LIST:MODulation[:FREQuency]? . . . . . . . . . . . . . . . . . . . . . . . . . . . . . . .446
[:SENSe]:ORFSpectrum:LIST:SELect CUSTom|SHORt|STANdard . . . . . . . . . . . . . . . . . . . . . . .447
[:SENSe]:ORFSpectrum:LIST:SELect? . . . . . . . . . . . . . . . . . . . . . . . . . . . . . . . . . . . . . . . . . . . . . . .447
[:SENSe]:ORFSpectrum:LIST:SWITching:APPLy
<RELative|BOTH|ABSolute>{,<RELative|BOTH|ABSolute>} . . . . . . . . . . . . . . . . . . . . . . . . . . .448
[:SENSe]:ORFSpectrum:LIST:SWITching:APPLy? . . . . . . . . . . . . . . . . . . . . . . . . . . . . . . . . . . . . . .448
[:SENSe]:ORFSpectrum:LIST:SWITching:BANDwidth|BWIDth <res_bw>{,<res_bw>} . . . . . . . .449
[:SENSe]:ORFSpectrum:LIST:SWITching:BANDwidth|BWIDth? . . . . . . . . . . . . . . . . . . . . . . . . .449
[:SENSe]:ORFSpectrum:LIST:SWITching:LOFFset:ABSolute <level>{,<level>} . . . . . . . . . . . . . .450
[:SENSe]:ORFSpectrum:LIST:SWITching:LOFFset:ABSolute? . . . . . . . . . . . . . . . . . . . . . . . . . . . .450
[:SENSe]:ORFSpectrum:LIST:SWITching:LOFFset[:RCARrier]
<level>{,<level>} . . . . . . . . . . . . . . . . . . . . . . . . . . . . . . . . . . . . . . . . . . . . . . . . . . . . . . . . . . . . . . . . . .449
[:SENSe]:ORFSpectrum:LIST:SWITching:LOFFset[:RCARrier]? . . . . . . . . . . . . . . . . . . . . . . . . . .449
24

List of Commands
[:SENSe]:ORFSpectrum:LIST:SWITching:STATe OFF|ON|0|1{,OFF|ON|0|1}. . . . . . . . . . . . . 451
[:SENSe]:ORFSpectrum:LIST:SWITching:STATe? . . . . . . . . . . . . . . . . . . . . . . . . . . . . . . . . . . . . . . 451
[:SENSe]:ORFSpectrum:LIST:SWITching[:FREQuency] <offset freq>{,<offset freq>} . . . . . . . . . 451
[:SENSe]:ORFSpectrum:LIST:SWITching[:FREQuency]? . . . . . . . . . . . . . . . . . . . . . . . . . . . . . . . . 451
[:SENSe]:ORFSpectrum:MEASure MULTiple|SINGle|SWEPt. . . . . . . . . . . . . . . . . . . . . . . . . . . 452
[:SENSe]:ORFSpectrum:MEASure? . . . . . . . . . . . . . . . . . . . . . . . . . . . . . . . . . . . . . . . . . . . . . . . . . 452
[:SENSe]:ORFSpectrum:MEASure? . . . . . . . . . . . . . . . . . . . . . . . . . . . . . . . . . . . . . . . . . . . . . . . . . 452
[:SENSe]:ORFSpectrum:OFRequency <freq> . . . . . . . . . . . . . . . . . . . . . . . . . . . . . . . . . . . . . . . . . . 453
[:SENSe]:ORFSpectrum:OFRequency? . . . . . . . . . . . . . . . . . . . . . . . . . . . . . . . . . . . . . . . . . . . . . . . 453
[:SENSe]:ORFSpectrum:TRIGger:SOURce EXTernal[1]|EXTernal2
|FRAMe|IMMediate|RFBurst . . . . . . . . . . . . . . . . . . . . . . . . . . . . . . . . . . . . . . . . . . . . . . . . . . . . . 453
List of Commands
[:SENSe]:ORFSpectrum:TRIGger:SOURce? . . . . . . . . . . . . . . . . . . . . . . . . . . . . . . . . . . . . . . . . . . . 453
[:SENSe]:ORFSpectrum:TYPE MODulation|MSWitching|SWITching|FFModulation . . . . . . . . 454
[:SENSe]:ORFSpectrum:TYPE?. . . . . . . . . . . . . . . . . . . . . . . . . . . . . . . . . . . . . . . . . . . . . . . . . . . . . 454
[:SENSe]:PFERror:AVERage:COUNt <integer>. . . . . . . . . . . . . . . . . . . . . . . . . . . . . . . . . . . . . . . . 455
[:SENSe]:PFERror:AVERage:COUNt? . . . . . . . . . . . . . . . . . . . . . . . . . . . . . . . . . . . . . . . . . . . . . . . 455
[:SENSe]:PFERror:AVERage:TCONtrol EXPonential|REPeat. . . . . . . . . . . . . . . . . . . . . . . . . . . . 455
[:SENSe]:PFERror:AVERage:TCONtrol? . . . . . . . . . . . . . . . . . . . . . . . . . . . . . . . . . . . . . . . . . . . . . 455
[:SENSe]:PFERror:AVERage:TYPE MEAN|MAXimum . . . . . . . . . . . . . . . . . . . . . . . . . . . . . . . . . 456
[:SENSe]:PFERror:AVERage:TYPE? . . . . . . . . . . . . . . . . . . . . . . . . . . . . . . . . . . . . . . . . . . . . . . . . . 456
[:SENSe]:PFERror:AVERage[:STATe] OFF|ON|0|1 . . . . . . . . . . . . . . . . . . . . . . . . . . . . . . . . . . . 455
[:SENSe]:PFERror:AVERage[:STATe]? . . . . . . . . . . . . . . . . . . . . . . . . . . . . . . . . . . . . . . . . . . . . . . . 455
[:SENSe]:PFERror:BSYNc:SOURce EXTernal[1]|EXTernal2|NONE|RFBurst|TSEQuence. . . 456
[:SENSe]:PFERror:BSYNc:SOURce?. . . . . . . . . . . . . . . . . . . . . . . . . . . . . . . . . . . . . . . . . . . . . . . . . 456
[:SENSe]:PFERror:IQOFfset[:STATe] OFF|ON|0|1. . . . . . . . . . . . . . . . . . . . . . . . . . . . . . . . . . . . 456
[:SENSe]:PFERror:IQOFfset[:STATe]? . . . . . . . . . . . . . . . . . . . . . . . . . . . . . . . . . . . . . . . . . . . . . . . 456
[:SENSe]:PFERror:TRACe[:STATe] OFF|ON|0|1 . . . . . . . . . . . . . . . . . . . . . . . . . . . . . . . . . . . . . 457
[:SENSe]:PFERror:TRACe[:STATe]? . . . . . . . . . . . . . . . . . . . . . . . . . . . . . . . . . . . . . . . . . . . . . . . . . 457
[:SENSe]:PFERror:TRIGger:SOURce EXTernal[1]|EXTernal2
|FRAMe|IF|IMMediate|RFBurst . . . . . . . . . . . . . . . . . . . . . . . . . . . . . . . . . . . . . . . . . . . . . . . . . . 457
[:SENSe]:PFERror:TRIGger:SOURce? . . . . . . . . . . . . . . . . . . . . . . . . . . . . . . . . . . . . . . . . . . . . . . . 457
[:SENSe]:POWer:IQ:RANGe[:UPPer] <Float 64>{DBM]|DBMV|W . . . . . . . . . . . . . . . . . . . . . . . 458
25

List of Commands
[:SENSe]:POWer:IQ:RANGe[:UPPer] <power> [DBM]|DBMV|W . . . . . . . . . . . . . . . . . . . . . . . . .388
[:SENSe]:POWer:IQ:RANGe[:UPPer]? . . . . . . . . . . . . . . . . . . . . . . . . . . . . . . . . . . . . . . . . . . . . . . . .388
[:SENSe]:POWer:IQ:RANGe[:UPPer]? . . . . . . . . . . . . . . . . . . . . . . . . . . . . . . . . . . . . . . . . . . . . . . . .458
[:SENSe]:POWer[:RF]:ATTenuation <rel_power> . . . . . . . . . . . . . . . . . . . . . . . . . . . . . . . . . . . . . . .459
[:SENSe]:POWer[:RF]:ATTenuation? . . . . . . . . . . . . . . . . . . . . . . . . . . . . . . . . . . . . . . . . . . . . . . . . .459
[:SENSe]:POWer[:RF]:GAIN[:STATe] ON|OFF. . . . . . . . . . . . . . . . . . . . . . . . . . . . . . . . . . . . . . . . .459
[:SENSe]:POWer[:RF]:GAIN[:STATe]? . . . . . . . . . . . . . . . . . . . . . . . . . . . . . . . . . . . . . . . . . . . . . . . .459
[:SENSe]:POWer[:RF]:RANGe:AUTO OFF|ON|0|1 . . . . . . . . . . . . . . . . . . . . . . . . . . . . . . . . . . . .460
[:SENSe]:POWer[:RF]:RANGe:AUTO? . . . . . . . . . . . . . . . . . . . . . . . . . . . . . . . . . . . . . . . . . . . . . . . .460
[:SENSe]:POWer[:RF]:RANGe[:UPPer] <power> . . . . . . . . . . . . . . . . . . . . . . . . . . . . . . . . . . . . . . .460
List of Commands
[:SENSe]:POWer[:RF]:RANGe[:UPPer]? . . . . . . . . . . . . . . . . . . . . . . . . . . . . . . . . . . . . . . . . . . . . . .460
[:SENSe]:PVTime:AVERage:COUNt <integer> . . . . . . . . . . . . . . . . . . . . . . . . . . . . . . . . . . . . . . . . .462
[:SENSe]:PVTime:AVERage:COUNt? . . . . . . . . . . . . . . . . . . . . . . . . . . . . . . . . . . . . . . . . . . . . . . . . .462
[:SENSe]:PVTime:AVERage:TCONtrol EXPonential|REPeat . . . . . . . . . . . . . . . . . . . . . . . . . . . . .463
[:SENSe]:PVTime:AVERage:TCONtrol? . . . . . . . . . . . . . . . . . . . . . . . . . . . . . . . . . . . . . . . . . . . . . . .463
[:SENSe]:PVTime:AVERage:TYPE LOG|MAXimum|MINimum|MXMinimum|RMS . . . . . . . . .463
[:SENSe]:PVTime:AVERage:TYPE LOG|MAXimum|MINimum|MXMinimum|RMS|POWer . .463
[:SENSe]:PVTime:AVERage:TYPE LOG|MAXimum|MINimum|RMS|SCALar . . . . . . . . . . . . .463
[:SENSe]:PVTime:AVERage:TYPE RMS|MAXimum|MINimum . . . . . . . . . . . . . . . . . . . . . . . . . .463
[:SENSe]:PVTime:AVERage:TYPE? . . . . . . . . . . . . . . . . . . . . . . . . . . . . . . . . . . . . . . . . . . . . . . . . . .463
[:SENSe]:PVTime:AVERage[:STATe] OFF|ON|0|1 . . . . . . . . . . . . . . . . . . . . . . . . . . . . . . . . . . . . .462
[:SENSe]:PVTime:AVERage[:STATe]?. . . . . . . . . . . . . . . . . . . . . . . . . . . . . . . . . . . . . . . . . . . . . . . . .462
[:SENSe]:PVTime:BANDwidth|BWIDth[:RESolution] <freq> . . . . . . . . . . . . . . . . . . . . . . . . . . . . .464
[:SENSe]:PVTime:BANDwidth|BWIDth[:RESolution]:TYPE FLATtop|GAUSsian . . . . . . . . . . .465
[:SENSe]:PVTime:BANDwidth|BWIDth[:RESolution]:TYPE? . . . . . . . . . . . . . . . . . . . . . . . . . . . .465
[:SENSe]:PVTime:BANDwidth|BWIDth[:RESolution]? . . . . . . . . . . . . . . . . . . . . . . . . . . . . . . . . . .464
[:SENSe]:PVTime:BSYNc:SLENgth EVEN|INTeger . . . . . . . . . . . . . . . . . . . . . . . . . . . . . . . . . . . .465
[:SENSe]:PVTime:BSYNc:SLENgth? . . . . . . . . . . . . . . . . . . . . . . . . . . . . . . . . . . . . . . . . . . . . . . . . .465
[:SENSe]:PVTime:BSYNc:SOURce TSEQuence|RFBurst|NONE . . . . . . . . . . . . . . . . . . . . . . . . .466
[:SENSe]:PVTime:BSYNc:SOURce? . . . . . . . . . . . . . . . . . . . . . . . . . . . . . . . . . . . . . . . . . . . . . . . . . .466
[:SENSe]:PVTime:LIMit:MASK OFF|ON|0|1 . . . . . . . . . . . . . . . . . . . . . . . . . . . . . . . . . . . . . . . . .467
26

List of Commands
[:SENSe]:PVTime:LIMit:MASK? . . . . . . . . . . . . . . . . . . . . . . . . . . . . . . . . . . . . . . . . . . . . . . . . . . . . 467
[:SENSe]:PVTime:MASK:LIST:LOWer:ABSolute
<power>,<power>,<power>,<power>,<power>,... . . . . . . . . . . . . . . . . . . . . . . . . . . . . . . . . . . . . . . . 467
[:SENSe]:PVTime:MASK:LIST:LOWer:ABSolute? . . . . . . . . . . . . . . . . . . . . . . . . . . . . . . . . . . . . . . 467
[:SENSe]:PVTime:MASK:LIST:LOWer:POINts? . . . . . . . . . . . . . . . . . . . . . . . . . . . . . . . . . . . . . . . 468
[:SENSe]:PVTime:MASK:LIST:LOWer:RELative
<rel_power>,<rel_power>,<rel_power>,<rel_power>,<rel_power>,... . . . . . . . . . . . . . . . . . . . . . . . 468
[:SENSe]:PVTime:MASK:LIST:LOWer:RELative?. . . . . . . . . . . . . . . . . . . . . . . . . . . . . . . . . . . . . . 468
[:SENSe]:PVTime:MASK:LIST:LOWer:TIME <seconds>{,<seconds>} . . . . . . . . . . . . . . . . . . . . . . 469
[:SENSe]:PVTime:MASK:LIST:LOWer:TIME?. . . . . . . . . . . . . . . . . . . . . . . . . . . . . . . . . . . . . . . . . 469
[:SENSe]:PVTime:MASK:LIST:UPPer:ABSolute
<power>,<power>,<power>,<power>,<power>,... . . . . . . . . . . . . . . . . . . . . . . . . . . . . . . . . . . . . . . . 470
List of Commands
[:SENSe]:PVTime:MASK:LIST:UPPer:ABSolute? . . . . . . . . . . . . . . . . . . . . . . . . . . . . . . . . . . . . . . 470
[:SENSe]:PVTime:MASK:LIST:UPPer:POINts? . . . . . . . . . . . . . . . . . . . . . . . . . . . . . . . . . . . . . . . . 470
[:SENSe]:PVTime:MASK:LIST:UPPer:RELative <rel_power>,
<rel_power>,<rel_power>,<rel_power>,<rel_power>,... . . . . . . . . . . . . . . . . . . . . . . . . . . . . . . . . . . 471
[:SENSe]:PVTime:MASK:LIST:UPPer:RELative? . . . . . . . . . . . . . . . . . . . . . . . . . . . . . . . . . . . . . . 471
[:SENSe]:PVTime:MASK:LIST:UPPer:TIME
<seconds>,<seconds>,<seconds>,<seconds>,<seconds>,... . . . . . . . . . . . . . . . . . . . . . . . . . . . . . . . . 472
[:SENSe]:PVTime:MASK:LIST:UPPer:TIME? . . . . . . . . . . . . . . . . . . . . . . . . . . . . . . . . . . . . . . . . . 472
[:SENSe]:PVTime:MASK:SELect STANdard|CUSTom . . . . . . . . . . . . . . . . . . . . . . . . . . . . . . . . . . 473
[:SENSe]:PVTime:MASK:SELect? . . . . . . . . . . . . . . . . . . . . . . . . . . . . . . . . . . . . . . . . . . . . . . . . . . . 473
[:SENSe]:PVTime:PCLevel <integer> . . . . . . . . . . . . . . . . . . . . . . . . . . . . . . . . . . . . . . . . . . . . . . . . 475
[:SENSe]:PVTime:PCLevel? . . . . . . . . . . . . . . . . . . . . . . . . . . . . . . . . . . . . . . . . . . . . . . . . . . . . . . . . 475
[:SENSe]:PVTime:SWEep:TIME <integer> . . . . . . . . . . . . . . . . . . . . . . . . . . . . . . . . . . . . . . . . . . . 476
[:SENSe]:PVTime:SWEep:TIME? . . . . . . . . . . . . . . . . . . . . . . . . . . . . . . . . . . . . . . . . . . . . . . . . . . . 476
[:SENSe]:PVTime:TRIGger:SOURce EXTernal[1]|EXTernal2
|FRAMe|IF|IMMediate|RFBurst . . . . . . . . . . . . . . . . . . . . . . . . . . . . . . . . . . . . . . . . . . . . . . . . . . 476
[:SENSe]:PVTime:TRIGger:SOURce? . . . . . . . . . . . . . . . . . . . . . . . . . . . . . . . . . . . . . . . . . . . . . . . . 476
[:SENSe]:RADio:CARRier:HOP OFF|ON|0|1 . . . . . . . . . . . . . . . . . . . . . . . . . . . . . . . . . . . . . . . . 478
[:SENSe]:RADio:CARRier:HOP? . . . . . . . . . . . . . . . . . . . . . . . . . . . . . . . . . . . . . . . . . . . . . . . . . . . . 478
[:SENSe]:RADio:CARRier:NUMBer SINGle|MULTiple . . . . . . . . . . . . . . . . . . . . . . . . . . . . . . . . . 478
[:SENSe]:RADio:CARRier:NUMBer? . . . . . . . . . . . . . . . . . . . . . . . . . . . . . . . . . . . . . . . . . . . . . . . . 478
27

List of Commands
[:SENSe]:RADio:CARRier[:TYPE] BURSt|CONTinuous . . . . . . . . . . . . . . . . . . . . . . . . . . . . . . . . .479
[:SENSe]:RADio:CARRier[:TYPE]?. . . . . . . . . . . . . . . . . . . . . . . . . . . . . . . . . . . . . . . . . . . . . . . . . . .479
[:SENSe]:RADio:DEVice BTS|MS . . . . . . . . . . . . . . . . . . . . . . . . . . . . . . . . . . . . . . . . . . . . . . . . . . .479
[:SENSe]:RADio:DEVice:BASE[:TYPE] NORMal|MICRo|MICR1|MICR2|MICR3|PICO . . . . .479
[:SENSe]:RADio:DEVice:BASE[:TYPE]? . . . . . . . . . . . . . . . . . . . . . . . . . . . . . . . . . . . . . . . . . . . . . .479
[:SENSe]:RADio:DEVice? . . . . . . . . . . . . . . . . . . . . . . . . . . . . . . . . . . . . . . . . . . . . . . . . . . . . . . . . . .479
[:SENSe]:RADio:STANdard:BAND
PGSM|EGSM|RGSM|DCS1800|PCS1900|GSM450|GSM480|GSM700|GSM850 . . . . . . . . . .480
[:SENSe]:RADio:STANdard:BAND? . . . . . . . . . . . . . . . . . . . . . . . . . . . . . . . . . . . . . . . . . . . . . . . . . .480
[:SENSe]:ROSCillator:EXTernal:FREQuency <frequency> . . . . . . . . . . . . . . . . . . . . . . . . . . . . . . .482
List of Commands
[:SENSe]:ROSCillator:EXTernal:FREQuency? . . . . . . . . . . . . . . . . . . . . . . . . . . . . . . . . . . . . . . . . .482
[:SENSe]:ROSCillator:OUTPut? . . . . . . . . . . . . . . . . . . . . . . . . . . . . . . . . . . . . . . . . . . . . . . . . . . . . .482
[:SENSe]:ROSCillator:OUTPut[:STATe] OFF|ON|0|1 . . . . . . . . . . . . . . . . . . . . . . . . . . . . . . . . . .482
[:SENSe]:ROSCillator:SOURce INTernal|EXTernal. . . . . . . . . . . . . . . . . . . . . . . . . . . . . . . . . . . . .482
[:SENSe]:ROSCillator:SOURce? . . . . . . . . . . . . . . . . . . . . . . . . . . . . . . . . . . . . . . . . . . . . . . . . . . . . .482
[:SENSe]:SPECtrum:ACQuisition:PACKing AUTO|LONG|MEDium|SHORt . . . . . . . . . . . . . . .484
[:SENSe]:SPECtrum:ACQuisition:PACKing? . . . . . . . . . . . . . . . . . . . . . . . . . . . . . . . . . . . . . . . . . .484
[:SENSe]:SPECtrum:ADC:DITHer[:STATe] AUTO|ON|OFF|2|1|0 . . . . . . . . . . . . . . . . . . . . . . .484
[:SENSe]:SPECtrum:ADC:DITHer[:STATe]? . . . . . . . . . . . . . . . . . . . . . . . . . . . . . . . . . . . . . . . . . . .484
[:SENSe]:SPECtrum:ADC:RANGe AUTO|APEak|APLock|M6|P0|P6|P12|P18|P24 . . . . . . .485
[:SENSe]:SPECtrum:ADC:RANGe AUTO|APEak|APLock|NONE|P0|P6|P12|P18 . . . . . . . . .485
[:SENSe]:SPECtrum:ADC:RANGe? . . . . . . . . . . . . . . . . . . . . . . . . . . . . . . . . . . . . . . . . . . . . . . . . . .485
[:SENSe]:SPECtrum:AVERage:CLEar . . . . . . . . . . . . . . . . . . . . . . . . . . . . . . . . . . . . . . . . . . . . . . . .486
[:SENSe]:SPECtrum:AVERage:COUNt <integer> . . . . . . . . . . . . . . . . . . . . . . . . . . . . . . . . . . . . . .486
[:SENSe]:SPECtrum:AVERage:COUNt? . . . . . . . . . . . . . . . . . . . . . . . . . . . . . . . . . . . . . . . . . . . . . .486
[:SENSe]:SPECtrum:AVERage:TCONtrol EXPonential|REPeat. . . . . . . . . . . . . . . . . . . . . . . . . . .487
[:SENSe]:SPECtrum:AVERage:TCONtrol? . . . . . . . . . . . . . . . . . . . . . . . . . . . . . . . . . . . . . . . . . . . .487
[:SENSe]:SPECtrum:AVERage:TYPE LOG|MAXimum|MINimum|RMS|SCALar . . . . . . . . . . .487
[:SENSe]:SPECtrum:AVERage:TYPE?. . . . . . . . . . . . . . . . . . . . . . . . . . . . . . . . . . . . . . . . . . . . . . . .487
[:SENSe]:SPECtrum:AVERage[:STATe] OFF|ON|0|1 . . . . . . . . . . . . . . . . . . . . . . . . . . . . . . . . . .487
[:SENSe]:SPECtrum:AVERage[:STATe]? . . . . . . . . . . . . . . . . . . . . . . . . . . . . . . . . . . . . . . . . . . . . . .487
28

List of Commands
[:SENSe]:SPECtrum:BANDwidth|BWIDth:IF:AUTO OFF|ON|0|1 . . . . . . . . . . . . . . . . . . . . . . 488
[:SENSe]:SPECtrum:BANDwidth|BWIDth:IF:AUTO? . . . . . . . . . . . . . . . . . . . . . . . . . . . . . . . . . . 488
[:SENSe]:SPECtrum:BANDwidth|BWIDth:IF:FLATness OFF|ON|0|1 . . . . . . . . . . . . . . . . . . . 489
[:SENSe]:SPECtrum:BANDwidth|BWIDth:IF:FLATness?. . . . . . . . . . . . . . . . . . . . . . . . . . . . . . . 489
[:SENSe]:SPECtrum:BANDwidth|BWIDth:PADC OFF|ON|0|1 . . . . . . . . . . . . . . . . . . . . . . . . . 489
[:SENSe]:SPECtrum:BANDwidth|BWIDth:PADC? . . . . . . . . . . . . . . . . . . . . . . . . . . . . . . . . . . . . 489
[:SENSe]:SPECtrum:BANDwidth|BWIDth:PFFT:TYPE FLAT|GAUSsian . . . . . . . . . . . . . . . . . 490
[:SENSe]:SPECtrum:BANDwidth|BWIDth:PFFT:TYPE? . . . . . . . . . . . . . . . . . . . . . . . . . . . . . . . 490
[:SENSe]:SPECtrum:BANDwidth|BWIDth:PFFT[:SIZE] <freq>. . . . . . . . . . . . . . . . . . . . . . . . . . 489
[:SENSe]:SPECtrum:BANDwidth|BWIDth:PFFT[:SIZE]? . . . . . . . . . . . . . . . . . . . . . . . . . . . . . . . 489
List of Commands
[:SENSe]:SPECtrum:BANDwidth|BWIDth[:RESolution] <freq>. . . . . . . . . . . . . . . . . . . . . . . . . . 490
[:SENSe]:SPECtrum:BANDwidth|BWIDth[:RESolution]:AUTO OFF|ON|0|1 . . . . . . . . . . . . . 491
[:SENSe]:SPECtrum:BANDwidth|BWIDth[:RESolution]:AUTO? . . . . . . . . . . . . . . . . . . . . . . . . . 491
[:SENSe]:SPECtrum:BANDwidth|BWIDth[:RESolution]?. . . . . . . . . . . . . . . . . . . . . . . . . . . . . . . 490
[:SENSe]:SPECtrum:DECimate[:FACTor] <integer> . . . . . . . . . . . . . . . . . . . . . . . . . . . . . . . . . . . . 491
[:SENSe]:SPECtrum:DECimate[:FACTor]?. . . . . . . . . . . . . . . . . . . . . . . . . . . . . . . . . . . . . . . . . . . . 491
[:SENSe]:SPECtrum:FFT:LENGth <integer> . . . . . . . . . . . . . . . . . . . . . . . . . . . . . . . . . . . . . . . . . 492
[:SENSe]:SPECtrum:FFT:LENGth:AUTO OFF|ON|0|1 . . . . . . . . . . . . . . . . . . . . . . . . . . . . . . . . 493
[:SENSe]:SPECtrum:FFT:LENGth:AUTO? . . . . . . . . . . . . . . . . . . . . . . . . . . . . . . . . . . . . . . . . . . . 493
[:SENSe]:SPECtrum:FFT:LENGth? . . . . . . . . . . . . . . . . . . . . . . . . . . . . . . . . . . . . . . . . . . . . . . . . . 492
[:SENSe]:SPECtrum:FFT:RBWPoints <real>. . . . . . . . . . . . . . . . . . . . . . . . . . . . . . . . . . . . . . . . . . 493
[:SENSe]:SPECtrum:FFT:RBWPoints? . . . . . . . . . . . . . . . . . . . . . . . . . . . . . . . . . . . . . . . . . . . . . . . 493
[:SENSe]:SPECtrum:FFT:WINDow:DELay <real> . . . . . . . . . . . . . . . . . . . . . . . . . . . . . . . . . . . . . 494
[:SENSe]:SPECtrum:FFT:WINDow:DELay? . . . . . . . . . . . . . . . . . . . . . . . . . . . . . . . . . . . . . . . . . . 494
[:SENSe]:SPECtrum:FFT:WINDow:LENGth <integer> . . . . . . . . . . . . . . . . . . . . . . . . . . . . . . . . . 494
[:SENSe]:SPECtrum:FFT:WINDow:LENGth? . . . . . . . . . . . . . . . . . . . . . . . . . . . . . . . . . . . . . . . . . 494
[:SENSe]:SPECtrum:FFT:WINDow[:TYPE] BH4Tap|BLACkman|FLATtop|GAUSsian|HAM-
Ming|HANNing|KB70|KB90|KB110|UNIForm. . . . . . . . . . . . . . . . . . . . . . . . . . . . . . . . . . . . . . 494
[:SENSe]:SPECtrum:FFT:WINDow[:TYPE]? . . . . . . . . . . . . . . . . . . . . . . . . . . . . . . . . . . . . . . . . . . 495
[:SENSe]:SPECtrum:FREQuency:SPAN <freq>. . . . . . . . . . . . . . . . . . . . . . . . . . . . . . . . . . . . . . . . 495
[:SENSe]:SPECtrum:FREQuency:SPAN? . . . . . . . . . . . . . . . . . . . . . . . . . . . . . . . . . . . . . . . . . . . . . 495
29

List of Commands
[:SENSe]:SPECtrum:SWEep:TIME:AUTO OFF|ON|0|1 . . . . . . . . . . . . . . . . . . . . . . . . . . . . . . . .496
[:SENSe]:SPECtrum:SWEep:TIME:AUTO . . . . . . . . . . . . . . . . . . . . . . . . . . . . . . . . . . . . . . . . . . . .496
[:SENSe]:SPECtrum:SWEep:TIME? . . . . . . . . . . . . . . . . . . . . . . . . . . . . . . . . . . . . . . . . . . . . . . . . .496
[:SENSe]:SPECtrum:SWEep:TIME[:VALue] <time> . . . . . . . . . . . . . . . . . . . . . . . . . . . . . . . . . . . .496
[:SENSe]:SPECtrum:TRIGger:SOURce EXTernal[1]|EXTernal2|FRAMe|IF|LINE|IMMediate
|RFBurst . . . . . . . . . . . . . . . . . . . . . . . . . . . . . . . . . . . . . . . . . . . . . . . . . . . . . . . . . . . . . . . . . . . . . . .497
[:SENSe]:SPECtrum:TRIGger:SOURce? . . . . . . . . . . . . . . . . . . . . . . . . . . . . . . . . . . . . . . . . . . . . . .497
[:SENSe]:SYNC:ALIGnment GSM|HBIT . . . . . . . . . . . . . . . . . . . . . . . . . . . . . . . . . . . . . . . . . . . . .498
[:SENSe]:SYNC:ALIGnment? . . . . . . . . . . . . . . . . . . . . . . . . . . . . . . . . . . . . . . . . . . . . . . . . . . . . . . .498
[:SENSe]:SYNC:BURSt:RFAMplitude:DELay <time> . . . . . . . . . . . . . . . . . . . . . . . . . . . . . . . . . . .498
List of Commands
[:SENSe]:SYNC:BURSt:RFAMplitude:DELay? . . . . . . . . . . . . . . . . . . . . . . . . . . . . . . . . . . . . . . . . .498
[:SENSe]:SYNC:BURSt:STHReshold <rel_power> . . . . . . . . . . . . . . . . . . . . . . . . . . . . . . . . . . . . . .498
[:SENSe]:SYNC:BURSt:STHReshold? . . . . . . . . . . . . . . . . . . . . . . . . . . . . . . . . . . . . . . . . . . . . . . . .498
[:SENSe]:TSPur:AVERage:COUNt <integer> . . . . . . . . . . . . . . . . . . . . . . . . . . . . . . . . . . . . . . . . . .499
[:SENSe]:TSPur:AVERage:COUNt? . . . . . . . . . . . . . . . . . . . . . . . . . . . . . . . . . . . . . . . . . . . . . . . . . .499
[:SENSe]:TSPur:AVERage:TCONtrol EXPonential|REPeat . . . . . . . . . . . . . . . . . . . . . . . . . . . . . .500
[:SENSe]:TSPur:AVERage:TCONtrol? . . . . . . . . . . . . . . . . . . . . . . . . . . . . . . . . . . . . . . . . . . . . . . . .500
[:SENSe]:TSPur:AVERage:TYPE LOG|MAXimum|RMS . . . . . . . . . . . . . . . . . . . . . . . . . . . . . . . .500
[:SENSe]:TSPur:AVERage:TYPE? . . . . . . . . . . . . . . . . . . . . . . . . . . . . . . . . . . . . . . . . . . . . . . . . . . .500
[:SENSe]:TSPur:AVERage[:STATe] OFF|ON|0|1 . . . . . . . . . . . . . . . . . . . . . . . . . . . . . . . . . . . . . .499
[:SENSe]:TSPur:AVERage[:STATe]? . . . . . . . . . . . . . . . . . . . . . . . . . . . . . . . . . . . . . . . . . . . . . . . . . .500
[:SENSe]:TSPur:TYPE EXAMine|FULL . . . . . . . . . . . . . . . . . . . . . . . . . . . . . . . . . . . . . . . . . . . . . .501
[:SENSe]:TSPur:TYPE? . . . . . . . . . . . . . . . . . . . . . . . . . . . . . . . . . . . . . . . . . . . . . . . . . . . . . . . . . . . .501
[:SENSe]:TXPower:AVERage:COUNt <integer> . . . . . . . . . . . . . . . . . . . . . . . . . . . . . . . . . . . . . . . .502
[:SENSe]:TXPower:AVERage:COUNt? . . . . . . . . . . . . . . . . . . . . . . . . . . . . . . . . . . . . . . . . . . . . . . . .502
[:SENSe]:TXPower:AVERage:TCONtrol EXPonential|REPeat . . . . . . . . . . . . . . . . . . . . . . . . . . . .502
[:SENSe]:TXPower:AVERage:TCONtrol? . . . . . . . . . . . . . . . . . . . . . . . . . . . . . . . . . . . . . . . . . . . . . .502
[:SENSe]:TXPower:AVERage:TYPE |LOG|MAX|MIN|RMS . . . . . . . . . . . . . . . . . . . . . . . . . . . . .503
[:SENSe]:TXPower:AVERage:TYPE? . . . . . . . . . . . . . . . . . . . . . . . . . . . . . . . . . . . . . . . . . . . . . . . . .503
[:SENSe]:TXPower:AVERage[:STATe] OFF|ON|0|1 . . . . . . . . . . . . . . . . . . . . . . . . . . . . . . . . . . . .502
[:SENSe]:TXPower:AVERage[:STATe]?. . . . . . . . . . . . . . . . . . . . . . . . . . . . . . . . . . . . . . . . . . . . . . . .502
30

List of Commands
[:SENSe]:TXPower:BANDwidth|BWIDth[:RESolution] <freq> . . . . . . . . . . . . . . . . . . . . . . . . . . . 503
[:SENSe]:TXPower:BANDwidth|BWIDth[:RESolution]:TYPE FLAT|GAUSsian . . . . . . . . . . . . 503
[:SENSe]:TXPower:BANDwidth|BWIDth[:RESolution]:TYPE? . . . . . . . . . . . . . . . . . . . . . . . . . . . 503
[:SENSe]:TXPower:BANDwidth|BWIDth[:RESolution]? . . . . . . . . . . . . . . . . . . . . . . . . . . . . . . . . 503
[:SENSe]:TXPower:SWEep:TIME <integer> . . . . . . . . . . . . . . . . . . . . . . . . . . . . . . . . . . . . . . . . . . 504
[:SENSe]:TXPower:SWEep:TIME? . . . . . . . . . . . . . . . . . . . . . . . . . . . . . . . . . . . . . . . . . . . . . . . . . . 504
[:SENSe]:TXPower:THReshold <power> . . . . . . . . . . . . . . . . . . . . . . . . . . . . . . . . . . . . . . . . . . . . . . 504
[:SENSe]:TXPower:THReshold:TYPE ABSolute|RELative . . . . . . . . . . . . . . . . . . . . . . . . . . . . . . 505
[:SENSe]:TXPower:THReshold:TYPE? . . . . . . . . . . . . . . . . . . . . . . . . . . . . . . . . . . . . . . . . . . . . . . . 505
[:SENSe]:TXPower:THReshold?. . . . . . . . . . . . . . . . . . . . . . . . . . . . . . . . . . . . . . . . . . . . . . . . . . . . . 504
List of Commands
[:SENSe]:TXPower:TRIGger:SOURce EXTernal[1]|EXTernal2|IF|IMMediate|RFBurst . . . . . 505
[:SENSe]:TXPower:TRIGger:SOURce? . . . . . . . . . . . . . . . . . . . . . . . . . . . . . . . . . . . . . . . . . . . . . . . 505
[:SENSe]:VOLTage:IQ:RANGe[:UPPer] <level> . . . . . . . . . . . . . . . . . . . . . . . . . . . . . . . . . . . . . . . . 388
[:SENSe]:VOLTage:IQ:RANGe[:UPPer]<Float 64> [V] . . . . . . . . . . . . . . . . . . . . . . . . . . . . . . . . . . 458
[:SENSe]:VOLTage:IQ:RANGe[:UPPer]? . . . . . . . . . . . . . . . . . . . . . . . . . . . . . . . . . . . . . . . . . . . . . 389
[:SENSe]:VOLTage:IQ:RANGe[:UPPer]? . . . . . . . . . . . . . . . . . . . . . . . . . . . . . . . . . . . . . . . . . . . . . 458
[:SENSe]:WAVeform:ACQuisition:PACKing AUTO|LONG|MEDium|SHORt . . . . . . . . . . . . . . . 506
[:SENSe]:WAVeform:ACQuisition:PACKing? . . . . . . . . . . . . . . . . . . . . . . . . . . . . . . . . . . . . . . . . . . 506
[:SENSe]:WAVeform:ADC:DITHer[:STATe] AUTO|ON|OFF|2|1|0. . . . . . . . . . . . . . . . . . . . . . . 506
[:SENSe]:WAVeform:ADC:DITHer[:STATe]?. . . . . . . . . . . . . . . . . . . . . . . . . . . . . . . . . . . . . . . . . . . 506
[:SENSe]:WAVeform:ADC:FILTer[:STATe] OFF|ON|0|1 . . . . . . . . . . . . . . . . . . . . . . . . . . . . . . . . 507
[:SENSe]:WAVeform:ADC:FILTer[:STATe]?. . . . . . . . . . . . . . . . . . . . . . . . . . . . . . . . . . . . . . . . . . . . 507
[:SENSe]:WAVeform:ADC:RANGe AUTO|APEak|APLock|GROund|M6|P0|P6|P12|P18
|P24. . . . . . . . . . . . . . . . . . . . . . . . . . . . . . . . . . . . . . . . . . . . . . . . . . . . . . . . . . . . . . . . . . . . . . . . . . . 507
[:SENSe]:WAVeform:ADC:RANGe AUTO|APEak|APLock|GROund|NONE|P0|P6|P12|P18 507
[:SENSe]:WAVeform:ADC:RANGe? . . . . . . . . . . . . . . . . . . . . . . . . . . . . . . . . . . . . . . . . . . . . . . . . . . 507
[:SENSe]:WAVeform:APERture? . . . . . . . . . . . . . . . . . . . . . . . . . . . . . . . . . . . . . . . . . . . . . . . . . . . . 508
[:SENSe]:WAVeform:AVERage:COUNt <integer> . . . . . . . . . . . . . . . . . . . . . . . . . . . . . . . . . . . . . . 508
[:SENSe]:WAVeform:AVERage:COUNt? . . . . . . . . . . . . . . . . . . . . . . . . . . . . . . . . . . . . . . . . . . . . . . 508
[:SENSe]:WAVeform:AVERage:TCONtrol EXPonential|REPeat . . . . . . . . . . . . . . . . . . . . . . . . . . 509
[:SENSe]:WAVeform:AVERage:TCONtrol? . . . . . . . . . . . . . . . . . . . . . . . . . . . . . . . . . . . . . . . . . . . . 509
31

List of Commands
[:SENSe]:WAVeform:AVERage:TYPE LOG|MAXimum|MINimum|RMS|SCALar . . . . . . . . . . .509
[:SENSe]:WAVeform:AVERage:TYPE? . . . . . . . . . . . . . . . . . . . . . . . . . . . . . . . . . . . . . . . . . . . . . . . .509
[:SENSe]:WAVeform:AVERage[:STATe] OFF|ON|0|1 . . . . . . . . . . . . . . . . . . . . . . . . . . . . . . . . . . .508
[:SENSe]:WAVeform:AVERage[:STATe]?. . . . . . . . . . . . . . . . . . . . . . . . . . . . . . . . . . . . . . . . . . . . . . .509
[:SENSe]:WAVeform:BANDwidth[:RESolution]:ACTual? . . . . . . . . . . . . . . . . . . . . . . . . . . . . . . . . .510
[:SENSe]:WAVeform:BANDwidth|BWIDth[:RESolution] <freq> . . . . . . . . . . . . . . . . . . . . . . . . . . .510
[:SENSe]:WAVeform:BANDwidth|BWIDth[:RESolution]:TYPE FLATtop|GAUSsian . . . . . . . . . 511
[:SENSe]:WAVeform:BANDwidth|BWIDth[:RESolution]:TYPE? . . . . . . . . . . . . . . . . . . . . . . . . . . 511
[:SENSe]:WAVeform:BANDwidth|BWIDth[:RESolution]? . . . . . . . . . . . . . . . . . . . . . . . . . . . . . . . .510
[:SENSe]:WAVeform:DECimate:STATe OFF|ON|0|1 . . . . . . . . . . . . . . . . . . . . . . . . . . . . . . . . . . .512
List of Commands
[:SENSe]:WAVeform:DECimate:STATe? . . . . . . . . . . . . . . . . . . . . . . . . . . . . . . . . . . . . . . . . . . . . . . .512
[:SENSe]:WAVeform:DECimate[:FACTor] <integer> . . . . . . . . . . . . . . . . . . . . . . . . . . . . . . . . . . . . .511
[:SENSe]:WAVeform:DECimate[:FACTor]? . . . . . . . . . . . . . . . . . . . . . . . . . . . . . . . . . . . . . . . . . . . . .511
[:SENSe]:WAVeform:SWEep:TIME <time> . . . . . . . . . . . . . . . . . . . . . . . . . . . . . . . . . . . . . . . . . . . .512
[:SENSe]:WAVeform:SWEep:TIME? . . . . . . . . . . . . . . . . . . . . . . . . . . . . . . . . . . . . . . . . . . . . . . . . . .512
[:SENSe]:WAVeform:TRIGger:SOURce EXTernal[1]|EXTernal2|FRAMe|IF|IMMediate
|LINE|RFBurst . . . . . . . . . . . . . . . . . . . . . . . . . . . . . . . . . . . . . . . . . . . . . . . . . . . . . . . . . . . . . . . . .513
[:SENSe]:WAVeform:TRIGger:SOURce?. . . . . . . . . . . . . . . . . . . . . . . . . . . . . . . . . . . . . . . . . . . . . . .513
32

1 Introduction to GSM and EDGE
This chapter provides overall information on the GSM and EDGE
communications systems Option BAF, and describes GSM and EDGE
measurements made by the analyzer. Installation instructions for
adding this option to your analyzer are provided in this section, if you
purchased this option separately.
Introduction to GSM and EDGE
33

Introduction to GSM and EDGE
What Does the Agilent PSA Series and VSA E4406A do?
What Does the Agilent PSA Series and
VSA E4406A do?
This instrument makes measurements that conform to the ETSI EN
300 910 (GSM 05.05), ETSI EN 300 607.1, (GSM 11.10-1), ETSI EN 301
087 (GSM 11.21), and ANSI J-STD-007 specifications. It also complies
with the 3GPP TS 51.021 Base Station System (BSS) equipment
specification; Radio Aspects (Release-5) V.5.3.0 (2003-06).
These documents define complex, multi-part measurements used to
maintain an interference-free environment. For example, the
documents include measuring the power of a carrier. The instrument
automatically makes these measurements using the measurement
methods and limits defined in the standards. The detailed results
displayed by the measurements allow you to analyze GSM and EDGE
system performance. You may alter the measurement parameters for
specialized analysis.
Introduction to GSM and EDGE
This instrument was primarily developed for making measurements on
digital transmission carriers. These measurements can help determine
if a GSM transmitter is working correctly. The instrument is capable of
measuring the continuous carrier of a base station transmitter.
For infrastructure test, the instrument can test base station
transmitters in a non-interfering manner through use of a coupler or
power splitter.
This instrument makes the following measurements:
• Transmit Power Measurement - see page 115
• GMSK Power vs. Time Measurement - see page 94
• GMSK Phase and Frequency Error Measurement - see page 89
• GMSK Output RF Spectrum (ORFS) Measurement - see page 62
• GMSK Tx Band Spur Measurement - see page 74
• EDGE Power vs. Time Measurement - see page 50
• EDGE Error Vector Magnitude (EVM) Measurement - see page 56
• EDGE Output RF Spectrum (ORFS) Measurement - see page 62
• EDGE Tx Band Spur Measurement - see page 74
• Spectrum (Frequency Domain) Measurement - see page 104
• Waveform (Time Domain) Measurement - see page 119
For conceptual information about these measurements see Chapter 5 ,
“Concepts,” on page 521.
34 Chapter 1

Introduction to GSM and EDGE
Installing Optional Measurement Personalities
Installing Optional Measurement
Personalities
When you install a measurement personality, you need to follow a three
step process:
1. Determine whether your memory capacity is sufficient to contain all
the options you want to load. If not, decide which options you want to
install now, and consider upgrading your memory. Details follow in
“Do You Have Enough Memory to Load All Your Personality
Options?” on page 35.
2. Install the measurement personality firmware into the instrument
memory. Details follow in “Loading an Optional Measurement
Personality” on page 39.
3. Enter a license key that activates the measurement personality.
Details follow in “Obtaining and Installing a License Key” on page
40.
Adding measurement personalities requires the purchase of an upgrade
kit for the desired option. The upgrade kit contains the measurement
personality firmware and an entitlement certificate that is used to
generate a license key from the internet website. A separate license key
is required for each option on a specific instrument serial number and
host ID.
For the latest information on Agilent Spectrum Analyzer options and
upgrade kits, visit the following web location:
http://www.agilent.com/find/sa_upgrades
Do You Have Enough Memory to Load All Your Personality Options?
If you do not have memory limitations then you can skip ahead to the
next section “Loading an Optional Measurement Personality” on
page 39. If after installing your options you get error messages relating
to memory issues, you can return to this section to learn more about
how to optimize your configuration.
If you have 64 MBytes of memory installed in your instrument, you
should have enough memory to install at least four optional
personalities, with plenty of memory for data and states.
Introduction to GSM and EDGE
The optional measurement personalities require different amounts of
memory. So the number of personalities that you can load varies. This is
also impacted by how much data you need to save. If you are having
memory errors you must swap the applications in or out of memory as
needed. If you only have 48 MBytes of memory, you can upgrade your
Chapter 1 35

Introduction to GSM and EDGE
Installing Optional Measurement Personalities
hardware to 64 MBytes.
Additional memory can be added to any PSA Series analyzer by
installing Option 115. With this option installed, you can install all
currently available measurement personalities in your analyzer and
still have memory space to store more state and trace files than would
otherwise be possible.
To see the size of your installed memory for PSA Series Spectrum
Analyzers:
1. Ensure that the spectrum analyzer is in spectrum analyzer mode
because this can affect the screen size.
Introduction to GSM and EDGE
2. Press
System, More, Show Hdwr.
3. Read Flash Memory size in the table. If Option 115 is installed (PSA
only), the table will also show Compact Flash Type and Compact
Flash Size.
PSA Flash
Memory Size
64 Mbytes 32.5 MBytes 30.0 MBytes
48 Mbytes 16.9 MBytes 14.3 MBytes
PSA Compact Flash
Memory Size
512 Mbytes (Opt. 115) 512 MBytes
Available Memory
Without Option
B7J and Option
122 or 140
Available Additional Memory for
Measurement Personalities
Available Memory With
Option B7J and Option 122 or
140
To see the size of your installed memory for E4406A Transmitter
Testers:
1. Press the
2. Read the
System key, MORE (1 of 3), and MORE (2 of 3) keys.
File System Key - The total of the entries for Used and Free
memory will total the installed flash memory, either 48 or 64
MBytes.
If you have 48 MBytes of memory, and you want to install more than 3
optional personalities, you may need to manage your memory
resources. The following section, “How to Predict Your Memory
Requirements” on page 37, will help you decide how to configure your
installed options to provide optimal operation.
36 Chapter 1

Introduction to GSM and EDGE
Installing Optional Measurement Personalities
How to Predict Your Memory Requirements
If you plan to install many optional personalities, you should review
your memory requirements, so you can determine whether you have
enough memory (unless you have a PSA Series with Option 115). There
is an Agilent “Memory Calculator” available online that can help you do
this, or you can make a calculated approximation using the information
that follows. You will need to know your instrument’s installed memory
size as determined in the previous section and then select your desired
applications.
NOTE If you have a PSA Series analyzer with Option 115, there is adequate memory
to install all of the available optional personalities in your instrument.
To calculate the available memory on your E4406, see:
http://sa.tm.agilent.com/E4406A/memory/
To calculate the available memory on your PSA, see:
http://sa.tm.agilent.com/PSA/memory/
Select the “Memory Calculator” link. You can try any combination of
available personalities to see if your desired configuration is compatible
with your installed memory.
NOTE For PSA: After loading all your optional measurement personalities, you
should have a reserve of ~2 MBytes memory to facilitate mode switching. Less
available memory will increase mode switching time. For example, if you
employ excessive free memory by saving files of states and/or data, your mode
switching time can increase to more than a minute.
You can manually estimate your total memory requirements by adding
up the memory allocations described in the following steps. Compare
the desired total with the available memory that you identified in the
previous section.
1. Program memory - Select option requirements from the table
“Measurement Personality Options and Memory Required” on
page 38.
2. For PSA only: shared libraries require 7.72 MBytes
3. For PSA only: recommended mode swap space is 2 MBytes
4. Screens - .gif files need 20-25 kBytes each
Introduction to GSM and EDGE
5. State memory - State file sizes range from 21 kB for SA mode to
40 kB for W-CDMA. The state of every mode accessed since power-on
will be saved in the state file. File sizes can exceed 150 kB each when
several modes are accessed, for each state file saved.
TIP State memory retains settings for all states accessed before the Save State
command. To reduce this usage to a minimum, reduce the modes accessed
before the Save State is executed. You can set the PSA to boot into a selected
Chapter 1 37

Introduction to GSM and EDGE
Installing Optional Measurement Personalities
mode by accessing the desired mode, then pressing the System, Power
On/Preset, Power On keys and toggle the setting to Last.
Measurement Personality Options and Memory Required
Personality Options
for PSA Series Spectrum Analyzers
a
Option File Size
(PSA Rev: A.10)
cdmaOne measurement personality BAC 1.91 Mbytes
NADC and PDC measurement personalities (not
BAE 2.43 Mbytes
available separately)
W-CDMA or W-CDMA, HSDPA, HSUPA
BAF, 210
5.38 Mbytes
measurement personality
cdma2000 or cdma2000 w/ 1xEV-DV measurement
personality
1xEV-DO measurement personality 204
GSM (with EDGE) measurement personality 202
Shared measurement library
b
Phase Noise measurement personality 226
Noise Figure measurement personality 219
Basic measurement personality with digital demod
hardware
Programming Code Compatibility Suited (8560
B78, 214
4.00 Mbytes
5.61 Mbytes
3.56 Mbytes
n/a 7.72 Mbytes
2.82 Mbytes
4.68 Mbytes
B7J Cannot be deleted
(2.64 Mbytes)
266
1.18 Mbytes
Series, 8590 Series, and 8566/8568)
b
b
b
b
c
c
c
Introduction to GSM and EDGE
TD-SCDMA Power measurement personality 211
TD-SCDMA Modulation Analysis or TD-SCDMA
212, 213 1.82 Mbytes
5.47 Mbytes
c
Modulation Analysis w/ HSDPA/8PSK measurement
personality
Flexible Digital Modulation Analysis 241
WLAN measurement personality 217
External Source Control 215
Measuring Receiver Personality
233
2.11 Mbytes
3.24 Mbytes
0.72 Mbytes
2.91 Mbytes
b
b
c
b
(available with Option 23A - Trigger support for
AM/FM/PM and Option 23B - CCITT filter)
EMC Analyzer
239
4.06 Mbytes
b
a. Available as of the print date of this guide.
b. Many PSA Series personality options use a 7.72 Mbyte shared measurement library. If
you are loading multiple personalities that use this library, you only need to add this
memory allocation once.
c. Shared measurement library allocation not required.
38 Chapter 1

Installing Optional Measurement Personalities
d. This is a no charge option that does not require a license key.
Introduction to GSM and EDGE
Personality Options
for E4406A Transmitter Tester
cdmaOne measurement personality BAC 1.82 Mbytes
NADC measurement personality BAE 1.10 Mbytes
PDC measurement personality BAE 1.23 Mbytes
W-CDMA or W-CDMA, HSDPA, HSUPA
measurement personality
cdma2000 or cdma2000 w/ 1xEV-DV
measurement personality
1xEV-DO measurement personality 204 4.84 Mbytes
GSM (with EDGE) measurement
personality
GSM measurement personality BAH 2.51 Mbytes
EDGE upgrade from BAH measurement
personality
iDEN measurement personality HN1 2.10 Mbytes
WiDEN measurement personality HN1 1.58 Mbytes
Baseband I/Q Inputs B7C n/a (hardware only)
a
Option File Size
(E4406A Rev: A.10)
BAF, 210 5.00 Mbytes
B78, 214 3.88 Mbytes
202 3.56 Mbytes
252 (202) 3.56 Mbytes
Introduction to GSM and EDGE
a. Available as of the print date of this guide.
Memory Upgrade Kits
The PSA 64 MByte Memory Upgrade kit part number is
E4440AU-ANE. The PSA Compact Flash Upgrade kit part number is
E4440AU-115.
The VSA 64 MByte Memory Upgrade kit part number is
E4406AU-ANE.
For more information about memory upgrade kits contact your local
sales office, service office, or see:
http://www.agilent.com/find/sa_upgrades
Loading an Optional Measurement Personality
You must use a PC to load the desired personality option into the
instrument memory. Loading can be done from a firmware CD-ROM or
by downloading the update program from the internet. An automatic
loading program comes with the files and runs from your PC.
You can check the Agilent internet website for the latest PSA firmware
versions available for downloading:
Chapter 1 39

Introduction to GSM and EDGE
Installing Optional Measurement Personalities
http://www.agilent.com/find/psa_firmware
You can check the Agilent internet website for the latest E4406
firmware versions available for downloading:
http://www.agilent.com/find/e4406a_firmware
NOTE When you add a new option, or update an existing option, you will get the
updated versions of all your current options as they are all reloaded
simultaneously. This process may also require you to update the instrument
core firmware so that it is compatible with the new option.
Depending on your installed hardware memory, you may not be able to
fit all of the available measurement personalities in instrument
memory at the same time. You may need to delete an existing option file
from memory and load the one you want. Use the automatic update
program that is provided with the files. Refer to the table showing
“Measurement Personality Options and Memory Required” on page 38.
The approximate memory requirements for the options are listed in this
table. These numbers are worst case examples. Some options share
components and libraries, therefore the total memory usage of multiple
options may not be exactly equal to the combined total.
NOTE You can also use this procedure to reinstall a license key that has been deleted
Introduction to GSM and EDGE
Obtaining and Installing a License Key
If you purchase an optional personality that requires installation, you
will receive an “Entitlement Certificate” which may be redeemed for a
license key specific to one instrument. Follow the instructions that
accompany the certificate to obtain your license key.
To install a license key for the selected personality option, use the
following procedure:
during an uninstall process, or lost due to a memory failure.
For PSA:
1. Press
editor. Use this alpha editor to enter letters (upper-case), and the
front-panel numeric keys to enter numbers for the option
designation. You will validate your option entry in the active
function area of the display. Then, press the
2. Press
You will validate your license key entry in the active function area of
the display. Then, press the
System, More, More, Licensing, Option to accesses the alpha
Enter key.
License Key to enter the letters and digits of your license key.
Enter key.
3. Press the
Activate License key.
For E4406:
1. Press
40 Chapter 1
System, More, More, Install, Choose Option to accesses the alpha

Introduction to GSM and EDGE
Installing Optional Measurement Personalities
editor. Use this alpha editor to enter letters (upper-case), and the
front-panel numeric keys to enter numbers for the option
designation. You will validate your option entry in the active
function area of the display. Then, press the
NOTE Before you enter the license key for the EDGE Retrofit Option 252, you
Done key.
must already have entered the license key for the GSM Option BAH.
2. Press
License Key to enter the letters and digits of your license key.
You will validate your license key entry in the active function area of
the display. Then, press the
3. Press the
Install Now key. The message “New option keys become
active after reboot.” will appear, along with the
press the
Yes key and cycle the instrument power off and then on to
complete your installation process, or press the
Done key.
Yes/No menu:
No key to cancel the
installation process.
Viewing a License Key
Measurement personalities purchased with your instrument have been
installed and activated at the factory before shipment. The instrument
requires a License Key unique to every measurement personality
purchased. The license key is a hexadecimal number specific to your
measurement personality, instrument serial number and host ID. It
enables you to install, or reactivate that particular personality.
Use the following procedure to display the license key unique to your
personality option that is already installed in your PSA:
Press
Personality key displays the personalities loaded, version
information, and whether the personality is licensed.
System, More, More, Licensing, Show License. The System,
Introduction to GSM and EDGE
Use the following procedure to display the license key unique to your
personality option that is already installed in your E4406:
Press
System, More, More, Install, Choose Option to enter the letters
and numbers for the option you want. You can see the key on the
License Key menu key. Press the Done key.
NOTE You will want to keep a copy of your license key in a secure location. Press
System, More, then Licensing, Show License Show System, and print out a
copy of the display that shows the license numbers. If you should lose your
license key, call your nearest Agilent Technologies service or sales office for
assistance.
Chapter 1 41

Introduction to GSM and EDGE
Installing Optional Measurement Personalities
Using the Delete License Key on PSA
This key will make the option unavailable for use, but will not delete it
from memory. Write down the 12-digit license key for the option before
you delete it. If you want to use that measurement personality later,
you will need the license key to reactivate the personality firmware.
NOTE Using the Delete License key does not remove the personality from the
instrument memory, and does not free memory to be available to install
another option. If you need to free memory to install another option, refer to
the instructions for loading firmware updates located at the URL :
http://www.agilent.com/find/psa/
1. Press System, More, More, Licensing, Option. Pressing the Option key
will activate the alpha editor menu. Use the alpha editor to enter the
letters (upper-case) and the front-panel numeric keyboard to enter
the digits (if required) for the option, then press the
enter the option, you will see your entry in the active function area of
the display.
Enter key. As you
NOTE Using the Uninstall key does not remove the personality firmware from
Introduction to GSM and EDGE
2. Press
Delete License to remove the license key from memory.
Using the Uninstall Key on E4406A
This key will make the option unavailable for use, but will not delete it
from memory. The message “Application Not Licensed” will appear
in the Status/Info bar at the bottom of the display. Record the 12-digit
license key for the option before you delete it. If you want to use that
measurement personality later, you will need the license key to
reactivate the personality firmware.
the instrument memory, and does not free memory to be available to
install another option. If you need to free memory to install another
option, refer to the instructions for loading firmware updates available
at the URL: http://www.agilent.com/find/vsa/
1. Press System, More(1 of 3), More(2 of 3), Uninstall, Choose Option to
access the alpha editor. Use this alpha editor to enter the letters
(upper-case), and the front-panel numeric keys to enter the numbers
(if required) for the installed option. You will validate your option
entry in the active function area of the display. Then, press the
key.
Done
42 Chapter 1

Introduction to GSM and EDGE
Installing Optional Measurement Personalities
2. Pressing the Uninstall Now key will activate the Yes/No menu: press
the
Yes key to continue your uninstall process, or press the No key to
cancel the uninstall process.
3. Cycle the instrument power off and then on to complete the uninstall
process.
Ordering Optional Measurement Personalities
When you order a personality option, you will receive an entitlement
certificate. Then you will need to go to the Web site to redeem your
entitlement certificate for a license key. You will need to provide your
instrument serial number and host ID, and the entitlement certificate
number.
Required Information: Front Panel Key Path:
Model #: (Ex. E4440A)
Host ID:
__________________
Instrument
Serial Number:
__________________
System, Show System
System, Show System
Introduction to GSM and EDGE
Chapter 1 43

Introduction to GSM and EDGE
Installing Optional Measurement Personalities
Introduction to GSM and EDGE
44 Chapter 1

2 Making Measurements
This chapter describes procedures used for making measurements of
GSM and EDGE BTS or MS. Instructions to help you set up and
perform the measurements are provided, and examples of GSM and
EDGE measurement results are shown.
Making Measurements
45

Making Measurements
GSM and EDGE Measurements
GSM and EDGE Measurements
The following measurements for the GSM 450, GSM 480, GSM 700,
GSM 850, GSM 900, DCS 1800, and PCS 1900 bands are available by
pressing the
Band Spurs measurements, which support P-GSM, E-GSM, R-GSM,
DCS 1800, and PCS 1900 only):
These are referred to as one-button measurements. When you press the
key to select the measurement, it becomes the active measurement,
using settings and a display unique to that measurement. Data
acquisitions automatically begin, provided trigger requirements, if any,
are met.
Trans mit Power − This test verifies in-channel power for GSM and
EDGE systems. Good measurement results ensure that dynamic
power control is optimized, overall system interference is minimized,
and mobile station battery life is maximized. See “Transmit Power
Measurements” on page 115
Measure key (except for the Tx Band Spurs and EDGE Tx
Power vs. Time − Verifies that the transmitter output power has
the correct amplitude, shape, and timing for the GSM or EDGE
format. GMSK and EDGE versions of this measurement are
available. See “GMSK Power vs. Time (PvT) Measurements” on
page 94 and “EDGE Power vs. Time (PVT) Measurements” on
page 50.
Output RF Spectrum (ORFS) − Verifies that the modulation,
wideband noise, and power level switching spectra are within limits
and do not produce significant interference in the adjacent base
transceiver station (BTS) channels. GMSK and EDGE versions of
this measurement are available. See “GMSK Output RF Spectrum
(ORFS) Measurements” on page 77 and “EDGE Output RF
Spectrum (ORFS) Measurements” on page 62.
Tx Band Spur − Verifies that a BTS transmitter does not transmit
undesirable energy into the transmit band. This energy may cause
interference for other users of the GSM system. GMSK and EDGE
versions of this measurement are available. See“GMSK Transmitter
Band Spurious Signal (Tx Band Spur) Measurements” on page 101
and “EDGE Tx Band Spur Measurements” on page 74.
Phase and Frequency − Verifies modulation quality of the 0.3
GMSK signal for GSM systems. The modulation quality indicates
the carrier to noise performance of the system, which is critical for
mobiles with low signal levels, at the edge of a cell, or under difficult
fading or Doppler conditions. See “GMSK Phase and Frequency
Error Measurements” on page 89.
Making Measurements
Error Vector Magnitude (EVM) − Provides a measure of
46 Chapter 2

Making Measurements
GSM and EDGE Measurements
modulation accuracy. The EDGE 8 PSK modulation pattern uses a
rotation of 3π/8 radians to avoid zero crossing, thus providing a
margin of linearity relief for amplifier performance. This is an EDGE
only measurement. See “EDGE Error Vector Magnitude (EVM)
Measurements” on page 56.
Spectrum − Provides spectrum analysis capability similar to a
swept tuned analyzer. The spectrum measurement is FFT (Fast
Fourier Transform) based. See “Spectrum (Frequency Domain)
Measurements” on page 104.
Waveform − Enables you to view waveforms in the time domain.
This measurement provides fast zero span functionality which is a
crucial feature of traditional spectrum analyzers See “Waveform
(Time Domain) Measurements” on page 119.
For E4406A, Baseband I/Q Inputs, Option B7C, is available for use with
these measurements. For details see “Using Option B7C Baseband I/Q
Inputs” on page 131.
Chapter 2 47
Making Measurements

Making Measurements
Setting up and Making a Measurement
Setting up and Making a Measurement
Making the Initial Signal Connection
CAUTION Before connecting a signal to the instrument, make sure the instrument
can safely accept the signal level provided. The signal level limits are
marked next to the connectors on the front panel.
See “Input Key Menu” for details on selecting input ports and setting
internal attenuation to prevent overloading the instrument.
For PSA only: The “Input Key Menu” also provides details of the
internal preamplifier (
Using Instrument Mode and Measurement Presets
If you want to set your current measurement personality to a known,
factory default state, press
returning the mode setup and all of the measurement setups in the
mode to the factory default parameters.
Int Preamp) operation.
Preset. This initializes the instrument by
NOTE For PSA, note that pressing the Preset key will switch instrument
modes unless the type of preset is selected under
On/Preset is set to Mode or Save User Preset.
System, Power
To preset only the parameters that are specific to an active, selected
measurement, press
Meas Defaults
will return all the measurement setup parameters to the
Meas Setup, then Restore Meas Defaults. Restore
factory defaults, but only for the currently selected measurement. The
Restore Meas Defaults key may not appear on the first page of the Meas
Setup
menu. If not, press More until the key is available.
Making Measurements
48 Chapter 2

Making Measurements
Setting up and Making a Measurement
The 3 Steps to Set Up and Make Measurements
All measurements need to be set up in 3 steps: first at the Mode level,
second at the Measurement level, then finally the result display may be
adjusted.
1. Select and Set Up the Mode
Press
Press
MODE - All licensed, installed Modes available are shown.
EDGE w/ GSM, GSM, or select Basic mode to make
measurements of signals with non-standard formats.
Press
Mode Setup - Make any required adjustments to the mode
settings. These settings apply to all measurement in the mode.
2. Select and Set Up the Measurement
Press
example.
MEASURE - Select a specific measurement to be performed (for
ACP, Spectrum or Waveform). The measurement begins as
soon as any required trigger conditions are met. The resulting data
is shown on the display or is available for export.
Press
Meas Setup - Make any adjustments as required to the selected
measurement settings. The settings only apply to this measurement.
3. Select and Set Up a View of the Results
Press
Trace/View - Select a display format for the current
measurement data. Depending on the mode and measurement
selected, other graphical and tabular data presentations may be
available.
X-Scale and Y-Scale adjustments may also be made now.
NOTE A setting may be reset at any time, and will be in effect on the next
measurement cycle or View.
Step Primary Key Setup Keys Related Keys
1. Select & set up
a Mode
2. Select & set up
a Measurement
3. Select & set up
a View of the
Results
Chapter 2 49
MODE Mode Setup,
Input (E4406A),
Input/Output (PSA),
FREQUENCY Channel
MEASURE Meas Setup Meas Control,
View/Trace (E4406A),
Trace/View (PSA)
SPAN X Scale,
AMPLITUDE Y Scale
Display
Next Window, Zoom
,
System
Restart
File, Save, Print,
,
Print Setup, Marker,
Search (E4406A),
Peak Search (PSA)
Making Measurements

Making Measurements
EDGE Power vs. Time (PVT) Measurements
EDGE Power vs. Time (PVT) Measurements
This section explains how to make an EDGE Power versus Time (PvT)
measurement on an EDGE base station. Good PvT measurement
results verify that the transmitter output power has the correct
amplitude, shape, and timing for the EDGE format.
NOTE This measurement is designed for EDGE. For the GSM PvT
measurement see “GMSK Power vs. Time (PvT) Measurements” on
page 94.
Configuring the Measurement System
This example shows a base station (BTS) under test set up to transmit
RF power, and being controlled remotely by a system controller. The
transmitting signal is connected to the analyzer RF input port. Connect
the equipment as shown.
Figure 2-1 EDGE Pwr vs Time Measurement System
1. Using the appropriate cables, adapters, and circulator, connect the
output signal of the BTS to the RF input of the instrument.
2. Connect the base transmission station simulator or signal generator
to the BTS through a circulator to initiate a link constructed with
sync and pilot channels, if required.
Making Measurements
3. Connect a BNC cable between the 10 MHz OUT port of the signal
generator and the EXT REF IN port of the instrument.
4. Connect the system controller to the BTS through the serial bus
cable to control the BTS operation.
50 Chapter 2

EDGE Power vs. Time (PVT) Measurements
Setting the BTS (Example)
From the base transmission station simulator and the system
controller, set up a call using loopback mode for the BTS to transmit the
RF power as follows:
BTS: Symbol Rate: 270.833kbps
Frequency: 935.2000 MHz (ARFCN number 1)
Output Power: −3 dBW (0.5 W)
Measurement Procedure
Step 1. Press the Preset key to preset the instrument.
Making Measurements
Step 2. Press the
MODE, GSM (w/EDGE) keys to enable the GSM with EDGE
mode measurements.
Step 3. Press the
Mode Setup, Trigger keys to select a trigger source as described
in the section titled “EDGE Power vs. Time Measurement Keys” on
page 177.
Step 4. Press the
Radio, Band keys to select the desired band. This determines
the frequency and band-related presets. Our example uses the default
setting,
Step 5. Press the
P-GSM.
FREQUENCY Channel key to select the desired center
frequency or ARFCN as described in the section titled “FREQUENCY
Channel Key Menu” on page 143.
Step 6. Press the
Burst Type key to select the desired burst type as described in
the section titled “FREQUENCY Channel Key Menu” on page 143.
Step 7. If your signal of interest contains more than 1 Training Sequence, press
TSC key, and select a standard Training Sequence (numbered 0-7) to
the
which the measurement will synchronize. The default setting for
Auto, which automatically correlates to any one of the standard
TSC is
Training Sequences numbered 0-7. See “FREQUENCY Channel Key
Menu” on page 143.
Step 8. Press the
vs. Time measurement.
Step 9. Press the
control level. The following example uses the default setting
Chapter 2 51
MEASURE, EDGE Pwr vs Time keys to initiate the EDGE Power
Meas Setup, More, Pwr Ctrl Lvl keys to select the desired power
0.
Making Measurements

Making Measurements
EDGE Power vs. Time (PVT) Measurements
Results
The views available under the View/Trace menu are Burst, Rise & Fall,
Multi-Slot. For more information see “EDGE Power vs. Time
and
Measurement Keys” on page 177.
Information shown in the left margin of the displays include:
MaxP - This is total input power allowed for the measurement. This
value is coupled to the internal RF
Input Atten setting.
ExtAt - This value reflects the
Sync - The
Trig - The
Burst Sync setting used in the current measurement.
Trigg e r So ur c e setting used in the current measurement.
External RF Atten setting.
The Mean Transmit Power is displayed at the bottom left of the
Burst and Rise & Fall views:
Mean Transmit Power - This is the RMS average power across the
“useful” part of the burst, or the 147 bits centered on the transition
from bit 13 to bit 14 (the “T0” time point) of the 26 bit training
sequence. An RMS calculation is performed and displayed regardless
of the averaging mode selected for the trace data.
If Averaging = ON, the result displayed is the RMS average power of
all bursts measured. If Averaging = OFF, the result is the RMS
average power of the single burst measured. This is a different
measurement result from Mean Transmit Pwr, below.
The Current Data displayed at the bottom of the Burst and Rise &
Fall views include:
Mean Transmit Pwr - This result appears only if Averaging = ON.
It is the RMS average of power across the “useful” part of the burst,
for the current burst only. If a single measurement of “n” averages
has been completed, the result indicates the Mean Transmit Pwr of
the last burst. The RMS calculation is performed and displayed
regardless of the averaging mode selected for the trace data. This is
a different measurement result from Mean Transmit Power, above.
Making Measurements
Max Pt. - Maximum signal power point in dBm.
Min Pt. - Minimum signal power point in dBm.
Burst Width - Time duration of burst at −3 dB power point
(half-power).
Mask Ref Pwr Midamble - The Mask Reference Power is the
average power in dBm of the middle 16 symbols in the midamble.
The times displayed are the corresponding start and stop times of
the middle 16 symbols.
1st Error Pt - (Error Point) The time (displayed in ms or µs)
52 Chapter 2

EDGE Power vs. Time (PVT) Measurements
indicates the point on the X Scale where the first failure of a signal
was detected. Use a marker to locate this point in order to examine
the nature of the failure.
Figure 2-2 EDGE Power vs. Time Result - Burst View
Making Measurements
Figure 2-3 EDGE Power vs. Time Result - Rise & Fall View
Making Measurements
Chapter 2 53

Making Measurements
EDGE Power vs. Time (PVT) Measurements
Figure 2-4 EDGE Result - Multi-Slot View
The table in the lower portion of the multi-slot view shows the output
power in dBm for each timeslot, as determined by the integer (1 to 8)
entered in the
Meas Setup, Meas Time setting. Output power levels are
presented for the active slots, and a dashed line appears for any slot
that is inactive. The timeslot that contains the burst of interest is
highlighted in blue.
Use the
eight slots. Use the
menu to select the slot you wish to activate. Setting
Meas Time key located in the Meas Setup menu to select up to
Timeslot and TSC keys in the Frequency/Channel
Timeslot to ON and
selecting a specific slot results in activating a measurement of that slot
only (
Timeslot On can be used to isolate a failure to a specific slot). When
Timeslot is set to OFF, all active slots are tested against the mask.
Using a signal generator you can synchronize the multi-slot view so the
frame (or portion of the frame) you are viewing starts with the slot you
have selected. See “EDGE Power vs. Time Measurement Concepts” on
page 542.
You can switch from the multi-slot view directly to the burst or rise and
fall views of the slot that is currently active. The
the
Span/Y Scale menu can be used to enlarge your view of this signal.
Scale/Div key under
Making Measurements
54 Chapter 2

Making Measurements
EDGE Power vs. Time (PVT) Measurements
Figure 2-5 EDGE PvT Result - Custom Limit Mask Example of Two
Consecutive Bursts
For more information on making measurements of two consecutive
bursts, including the SCPI commands used to make the measurement,
refer to the section in the Programming Commands chapter. See
“EDGE PvT Custom Limit Mask Example of Two Consecutive Bursts”
on page 428.
For More Information
For more details about changing measurement parameters, see “EDGE
Power vs. Time Measurement Concepts” on page 542.
If you have a problem, and get an error message, see “Interpreting
Error Codes” on page 137.
Troubleshooting Hints
If a transmitter fails the EDGE Power vs. Time measurement this
usually indicates a problem with the units output amplifier or leveling
loop.
Making Measurements
Chapter 2 55

Making Measurements
EDGE Error Vector Magnitude (EVM) Measurements
EDGE Error Vector Magnitude (EVM)
Measurements
This section explains how to make an EDGE Error Vector Magnitude
(EVM) measurement on an EDGE base station. EVM provides a
measure of modulation accuracy. The EDGE 8 PSK modulation pattern
uses a rotation of 3π/8 radians to avoid zero crossing, thus providing a
margin of linearity relief for amplifier performance.
NOTE This is an EDGE only measurement.
Configuring the Measurement System
This example shows a base station (BTS) under test set up to transmit
RF power, and being controlled remotely by a system controller. The
transmitting signal is connected to the analyzer RF input port. Connect
the equipment as shown.
Figure 2-6 EDGE EVM Measurement System
1. Using the appropriate cables, adapters, and circulator, connect the
output signal of the BTS to the RF input of the instrument.
2. Connect the base transmission station simulator or signal generator
to the BTS through a circulator to initiate a link constructed with
sync and pilot channels, if required.
Making Measurements
3. Connect a BNC cable between the 10 MHz OUT port of the signal
generator and the EXT REF IN port of the instrument.
4. Connect the system controller to the BTS through the serial bus
cable to control the BTS operation.
56 Chapter 2

EDGE Error Vector Magnitude (EVM) Measurements
Setting the BTS (Example)
From the base transmission station simulator and the system
controller, set up a call using loopback mode for the BTS to transmit the
RF power as follows:
BTS: Symbol Rate: 270.833kbps
Frequency: 935.2000 MHz (ARFCN number 1)
Output Power: −3 dBW (0.5 W)
Measurement Procedure
Step 1. Press the Preset key to preset the instrument.
Making Measurements
Step 2. Press the
MODE, GSM (w/EDGE) keys to enable the GSM with EDGE
mode measurements.
Step 3. Press the
Mode Setup, Trigger keys to select a trigger source as described
in the section titled “EDGE EVM (Error Vector Magnitude)
Measurement Keys” on page 156.
Step 4. Press the
FREQUENCY Channel key to select the desired center
frequency or ARFCN as described in the section titled “FREQUENCY
Channel Key Menu” on page 143.
Step 5. Press the
Burst Type key to select the desired burst type as described in
the section titled “FREQUENCY Channel Key Menu” on page 143.
Step 6. If your signal of interest contains more than 1 Training Sequence, press
TSC key, and select a standard Training Sequence (numbered 0-9) to
the
which the measurement will synchronize. The default setting for
Auto, which automatically correlates to any one of the standard
TSC is
Training Sequences numbered 0-9. See “FREQUENCY Channel Key
Menu” on page 143.
Step 7. Press the
MEASURE, EDGE EVM keys to initiate the EDGE Error Vector
Magnitude measurement.
Chapter 2 57
Making Measurements
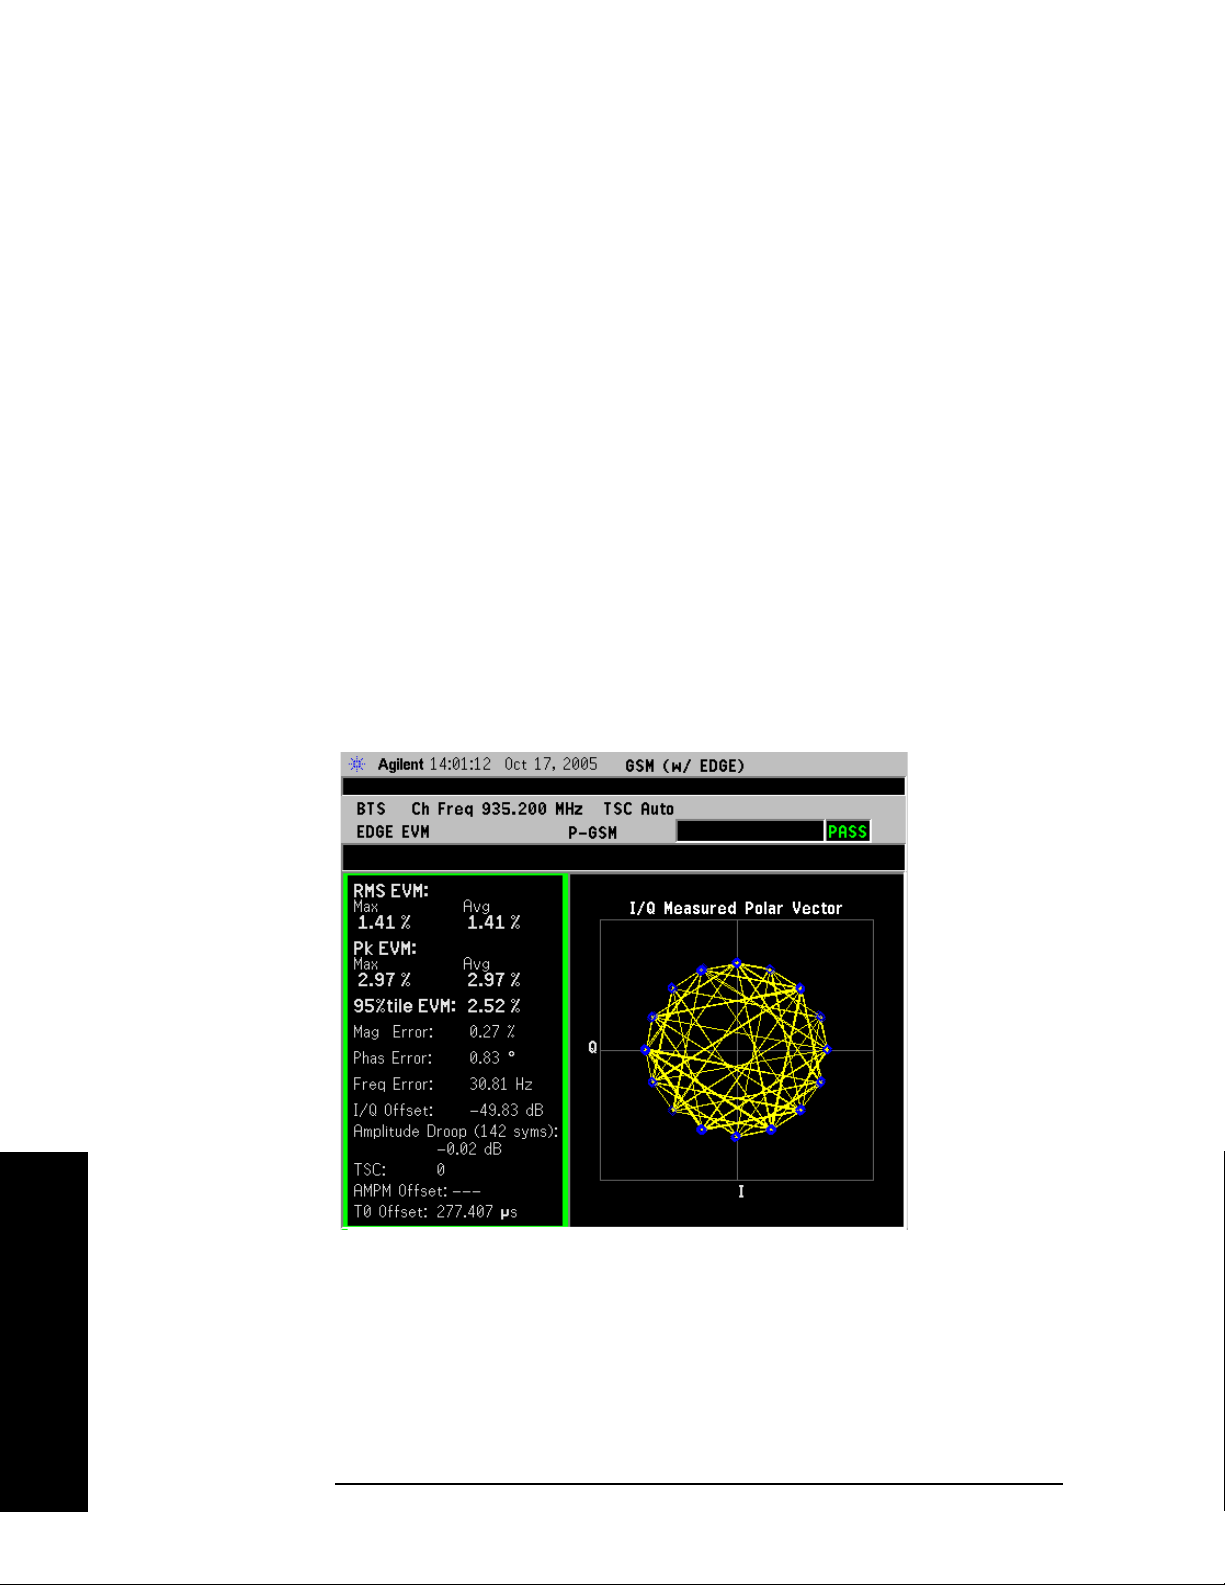
Making Measurements
EDGE Error Vector Magnitude (EVM) Measurements
Step 8. (Optional for Device = MS only.) Perform Polar modulation Analysis:
Press
Meas Setup, Burst Sync, Polar Mod Sync.
The instrument searches the training sequence on the amplitude path
and phase path and try to sync. Polar modulation analysis measures
the time delay adjustment between the Amplitude path and Phase path
for Polar modulation. When
Polar Mod Sync is selected, the timing offset
of amplitude path to phase path is always calculated.
The displayed time delay values are called AMPM Offset and T0
Offset. They are shown in the Polar Vector view, Polar Constln view
and Data bits view. You can select time (seconds) or symbols as the
display unit using
Polar Mod Align On/Off key located in the Meas Setup menu. The
The
Polar Mod Align setting determines whether the timing offsets are used
ON) for compensation in the EVM calculation.
(
Time Offset Unit in the Display key menu.
The next figure shows an example of measurement result with the
graphic and text windows. The measured summary data is shown in the
left window and the dynamic vector trajectory of the I/Q demodulated
signal is shown as a polar vector display in the right window.
Figure 2-7 EDGE EVM Result - Polar Vector View
Step 9. Press
View/Trace, Polar Constellation to view a plot of constellation “dots”
or states without the vector lines.
Making Measurements
58 Chapter 2
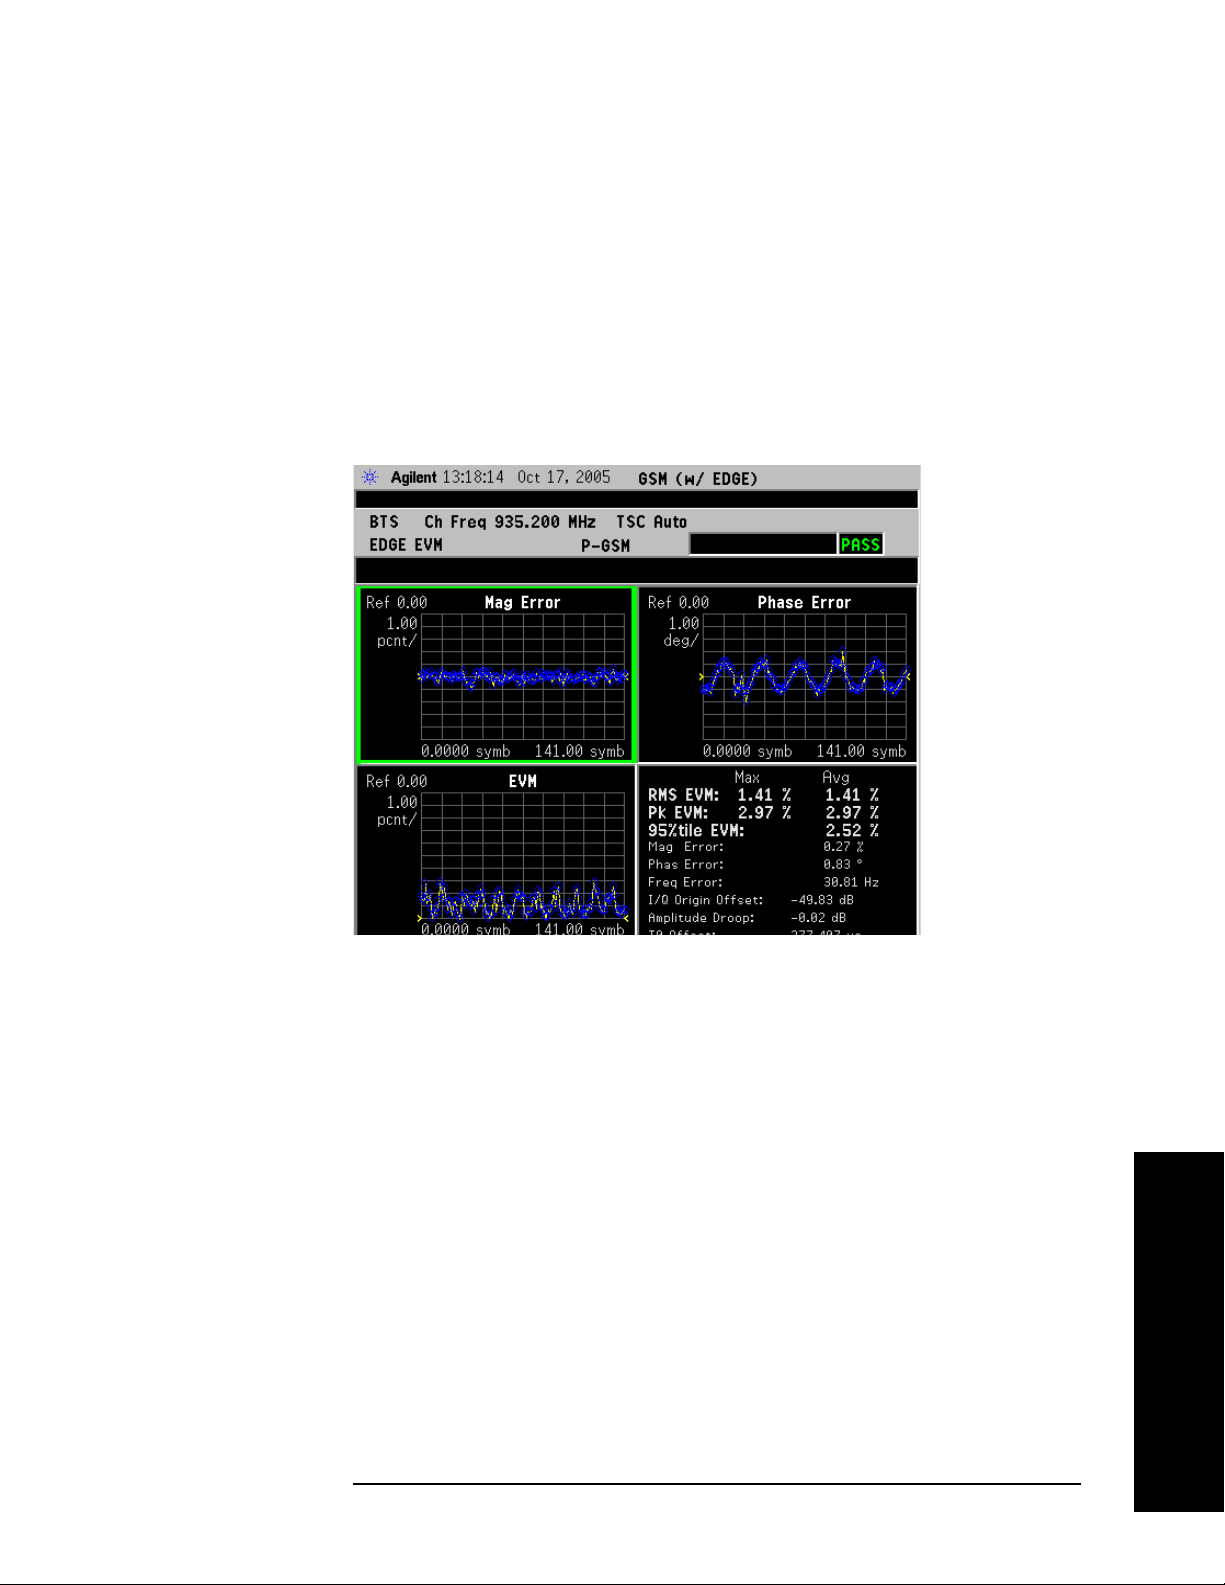
EDGE Error Vector Magnitude (EVM) Measurements
Step 10. Press View/Trace, I/Q Error (Quad-View) to display a four-pane view of the
Magnitude Error, Phase Error, and EVM graphs, along with a summary
of the measurement data. You can select any of the graph windows for
individual display or adjustment by pressing
Next WIndow and moving
the green selection box to the desired window. Press
window to full screen, or to go back to the Quad-View.
In the example below, a sine modulation is apparent in the EVM and
Phase Error data. This could due to an FM impairment that is not
discernible in the other EVM views.
Figure 2-8 EDGE EVM Result - I/Q Error (Quad-View)
Making Measurements
Zoom to expand the
Chapter 2 59
Making Measurements

Making Measurements
EDGE Error Vector Magnitude (EVM) Measurements
Step 11. Press View/Trace, Data Bits to display a summary of measurement data
along with the symbol state bits. The training sequence is highlighted
in blue, and remains constant with repeated measurement updates.
Figure 2-9 EDGE EVM Result - Data Bits View
Making Measurements
NOTE The data bits in this display are Symbol State bits, and do not represent
encoded message data.
For More Information
For more details about changing measurement parameters, see “EDGE
EVM Measurement Concepts” on page 544.
If you have a problem, and get an error message, see “Interpreting
Error Codes” on page 137.
Troubleshooting Hints
Use the spectrum (frequency domain) measurement to verify that the
signal is present and approximately centered on the display.
The data used for testing can have a detrimental effect on the EVM
results, causing erratic or falsely high EVM, especially in the case of
sending all 0 bits with the Trigger Source set to RF Burst. In that
unique situation, better results may be obtained using Free Run or
Video triggers.
Poor EVM indicates a problem at the I/Q baseband generator, filters,
and/or modulator in the transmitter circuitry. The output amplifier in
the transmitter can also create distortion that causes unacceptably
60 Chapter 2

Making Measurements
EDGE Error Vector Magnitude (EVM) Measurements
high EVM. In a real system, poor EVM reduces the ability of a receiver
to correctly demodulate the signal, especially in marginal signal
conditions. Poor EVM may also indicate that a measurement restart
was not performed after the signal level was changed. Press
Restart
after a change in the input signal to ensure that an auto-attenuation
adjustment is performed.
The I/Q Error Quad View display may be used to determine where
modulation or demodulation errors are introduced into the complex
modulated path.
Chapter 2 61
Making Measurements
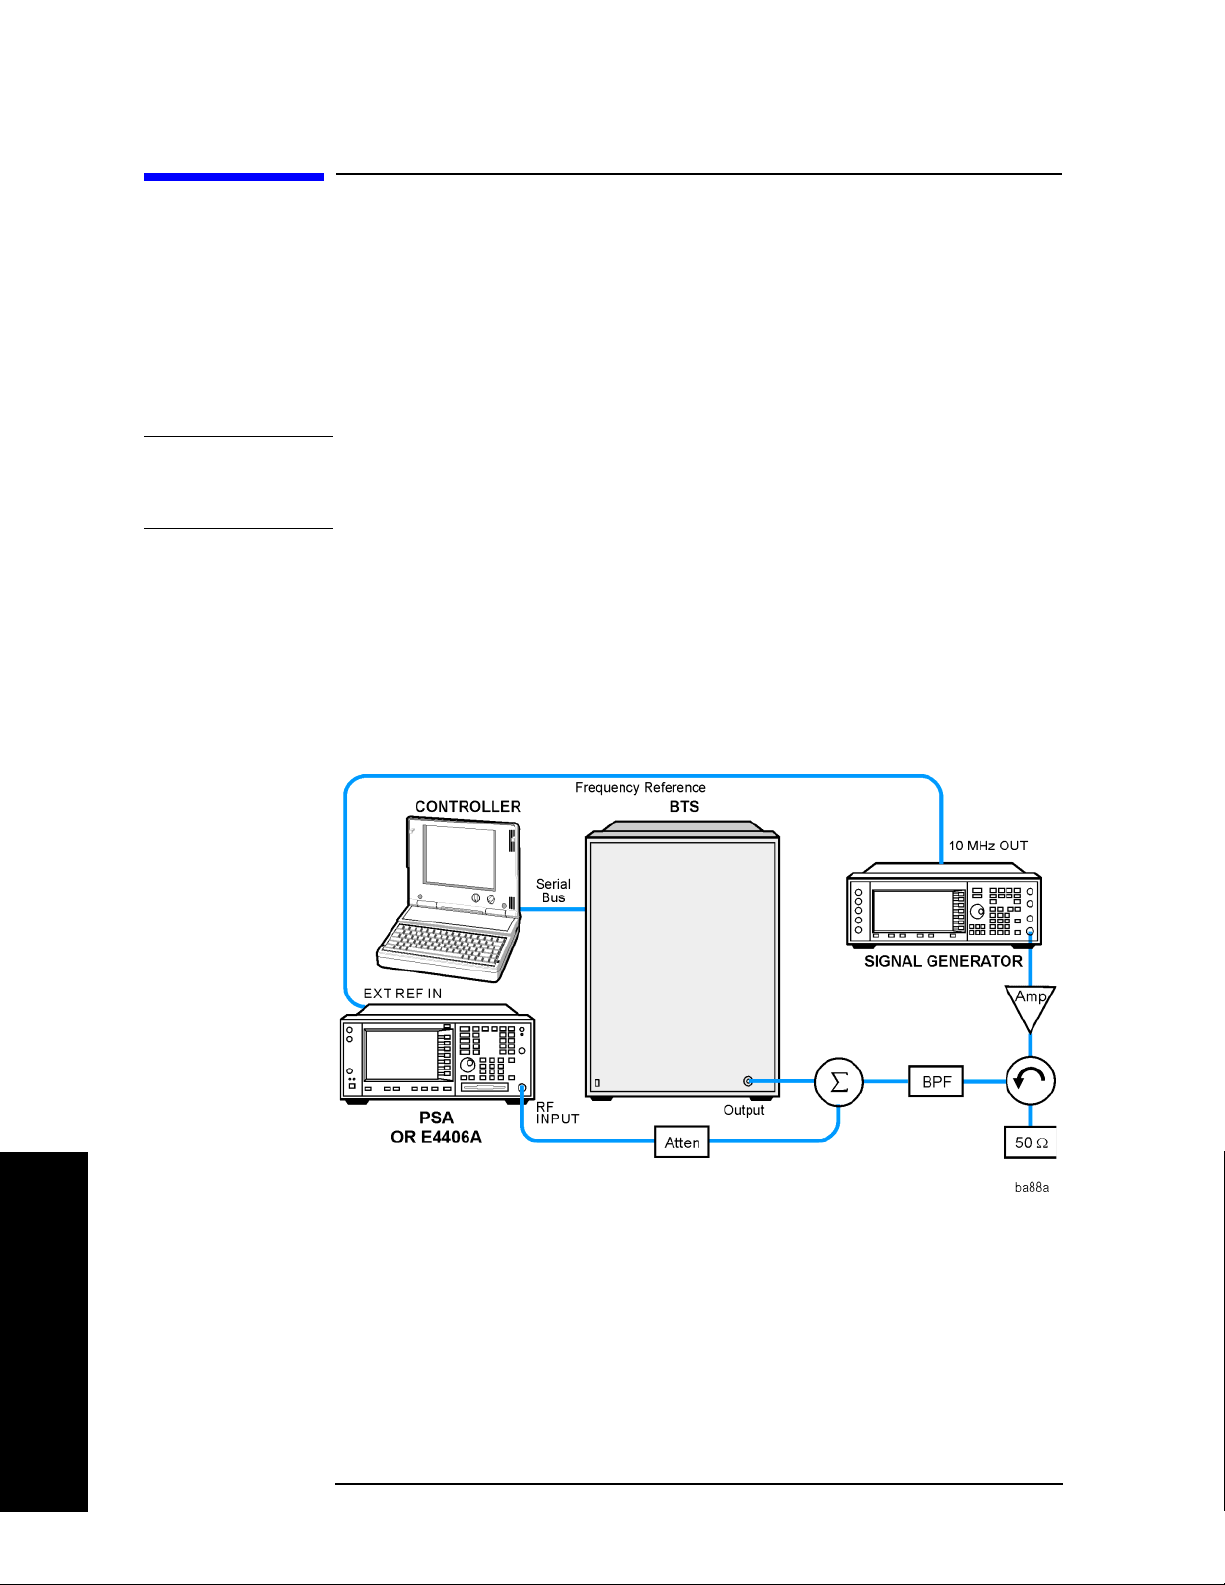
Making Measurements
EDGE Output RF Spectrum (ORFS) Measurements
EDGE Output RF Spectrum (ORFS)
Measurements
This section explains how to make an EDGE Output RF Spectrum
measurement on an EDGE base station. This test verifies that the
modulation, wideband noise, and power level switching spectra are
within limits and do not produce significant interference in the adjacent
base transceiver station (BTS) channels.
NOTE This measurement is designed for EDGE. For the GSM Output RF
Spectrum measurement see “GMSK Output RF Spectrum (ORFS)
Measurements” on page 77.
Configuring the Measurement System
This example shows a base transceiver station (BTS) under test set up
to transmit RF power, and being controlled remotely by a system
controller. The transmitting signal is connected to the analyzer RF
input port. Connect the equipment as shown.
Figure 2-10 EDGE ORFS Measurement System
1. Using the appropriate cables, adapters, and circulator, connect the
output signal of the BTS to the RF input of the instrument.
2. Connect the base transmission station simulator or signal generator
to the BTS through a circulator to initiate a link constructed with
sync and pilot channels, if required.
Making Measurements
3. Connect a BNC cable between the 10 MHz OUT port of the signal
generator and the EXT REF IN port of the instrument.
62 Chapter 2

Making Measurements
EDGE Output RF Spectrum (ORFS) Measurements
4. Connect the system controller to the BTS through the serial bus
cable to control the BTS operation.
NOTE If the signal being measured has more than one active slot in a frame,
the default RF Burst trigger must be changed, and an external event
trigger must be provided to synchronize the frame. Otherwise the
measurement may trigger randomly on any burst in an active slot. This
is true for all ORFS time domain measurements.
Setting the BTS (Example)
From the base transmission station simulator and the system
controller, set up a call using loopback mode for the BTS to transmit the
RF power as follows:
BTS: Symbol Rate: 270.833kbps
Frequency: 935.2000 MHz (ARFCN number 1)
Output Power: −3 dBW (0.5 W)
Measurement Procedure
Step 1. Press the Preset key to preset the instrument.
Step 2. Press the
measurements.
Step 3. Press the
in the section titled “EDGE Output RF Spectrum Measurement Keys”
on page 166.
Step 4. Press the
Bit Offset
Step 5. Press the
frequency or ARFCN as described in the section titled “FREQUENCY
Channel Key Menu” on page 143.
Step 6. Press the
the section titled “FREQUENCY Channel Key Menu” on page 143.
Step 7. If your signal of interest contains more than 1 Training Sequence, press
TSC key, and select a standard Training Sequence (numbered 0-9) to
the
which the measurement will synchronize. The default setting for
Auto, which automatically correlates to any one of the standard
Training Sequences numbered 0-9. See “FREQUENCY Channel Key
Menu” on page 143.
MODE, GSM (w/EDGE) keys to enable the EDGE mode
Mode Setup, Trigger keys to select a trigger source as described
Demod, Burst Align keys to toggle the burst alignment to 1/2
.
FREQUENCY Channel key to select the desired center
Burst Type key to select the desired burst type as described in
TSC is
Making Measurements
Chapter 2 63

Making Measurements
EDGE Output RF Spectrum (ORFS) Measurements
Step 8. Press Meas Setup and select the Meas Type and Meas Method for your
measurement:
Meas Type - Accesses a menu to choose the measurement that is
•
optimized for the type of spectral distortion being investigated.
Mod & Switch - Performs both Modulation and Switching
measurements, which measures the spectrum due to the 0.3
GMSK modulation and noise, and also measures Switching
(transient) spectrum measurements.
Modulation - Measures the spectrum optimized for distortion due
to the 0.3 GMSK modulation and noise.
Switching - Measures the spectrum optimized for distortion due to
switching transients (burst ramping).
Full Frame Modulation (FAST)- Improves measurement speed by
acquiring a full frame of data prior to performing the FFT
calculation. This feature can only be used when all slots in the
transmitted frame are active. Use of an external trigger can
enhance measurement speed when this feature is used. When
Frame Modulation (FAST)
is selected the current measurement
defaults to the multi-offset measurement method. Therefore, the
Meas Method key is grayed out and the Single Offset feature is not
available.
Full
Making Measurements
•
Meas Method
Multi-Offset
frequencies in the selected list (
Press the
measure.
Multi-Offset measurements may be made with either Modulation or
Switching measurement types.
Offset measurement results are displayed as tabular data, and
may be viewed as either absolute powers in the Modulation Power
and Switching Power views, or as powers relative to the margins
and limit settings in the Modulation Margin and Limit and
Switching Margin and Limit views. See “Trace/View Key Menu”
on page 160, and Figure 2-11 on page 65.
Single Offset (Examine) - makes a measurement at a single offset
frequency as set by the
Single Offset (Examine) measurements may be made with either
Modulation or Switching measurement types.
Single offset measurement results are displayed in a time domain
plot, with the measurement offset shown as a gate by white
vertical lines. See Figure 2-15 on page 69.
- Automatically makes measurements at all offset
Standard, Short, or Custom).
Multi-Offset Freq List key to select a list of offsets to
Single Offset Freq softkey.
64 Chapter 2
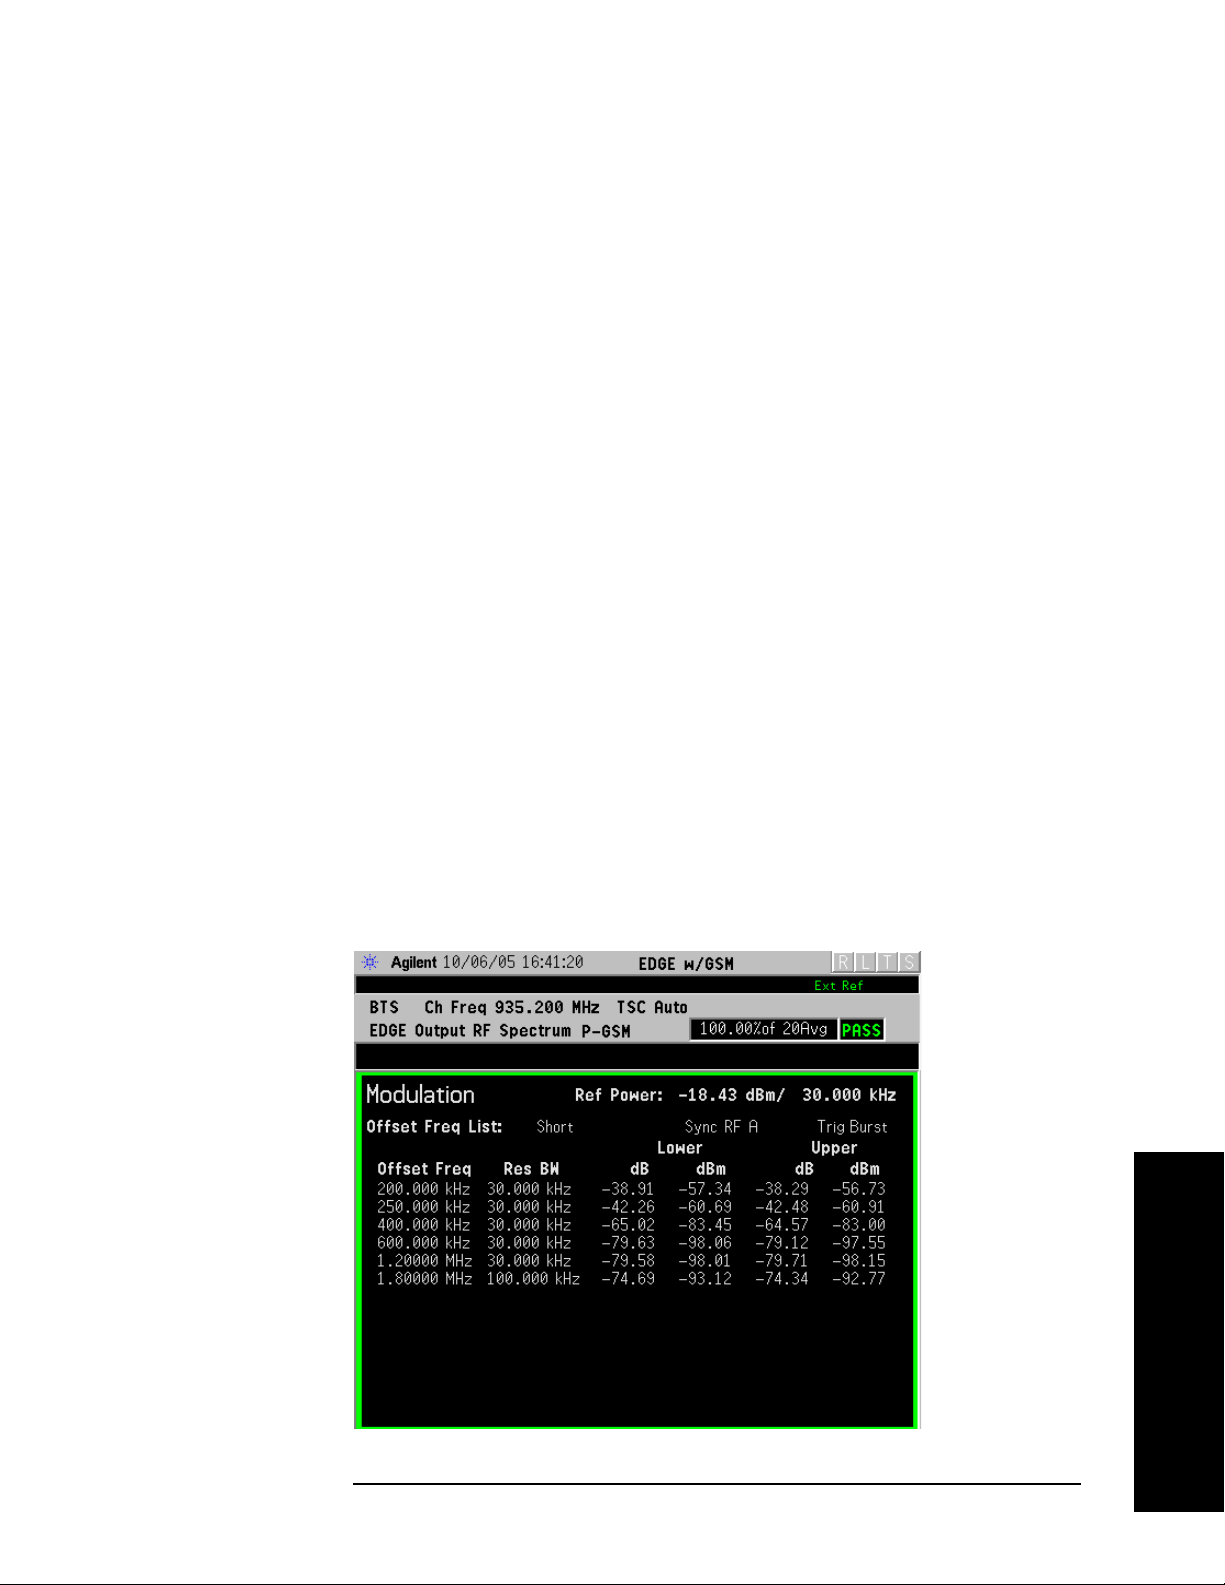
Making Measurements
EDGE Output RF Spectrum (ORFS) Measurements
Swept - makes a measurement using time-gated spectrum
analysis to sweep the analyzer with the gate turned on for the
desired portion of the burst only, as set by the
(offsets)
& Limits menu. The limits mask is applied to the
Modulation Ofs
spectrum plot, and the Worst Frequency parameters are
displayed. This selection is only available if
Modulation. See Figure 2-18 on page 72.
Meas Type is set to
- Accesses a menu to choose the measurement mode.
Step 9. Press the
change the
Measure Cont for continuous measurements.
Restart key to re-initiate an EDGE ORFS measurement if you
Meas Type or Meas Method. You can also set Meas Control to
For more details about changing measurement parameters, see “EDGE
Output RF Spectrum Measurement Keys” on page 166 and “EDGE
Output RF Spectrum Measurement Concepts” on page 549.
If you have a problem, and get an error message, see “Interpreting
Error Codes” on page 137.
EDGE ORFS Measurement Results
• Modulation Power - When Meas Method is set to Multi-Offset, and Meas
Type
is set to Modulation, or Mod and Switch, measurement results
may be viewed as absolute powers in tabular form. The data displays
offsets from any of the
Custom. The Modulation Power view is the default view for ORFS
and
measurements. You can select the
View/Trace, then Modulation Power.
Figure 2-11 EDGE ORFS - Example (Short List) Modulation Power View
Multi-Offset Freq List settings: Standard, Short,
Modulation Power view by pressing
Chapter 2 65
Making Measurements

Making Measurements
EDGE Output RF Spectrum (ORFS) Measurements
• Modulation Margin & Limits- When Meas Method is set to Multi-Offset,
Meas Type is set to Modulation, or Mod and Switch, measurement
and
results may be viewed as relative powers in tabular form. The data
displays offsets from any of the
Standard, Short, and Custom, and shows the limit values selected by
Multi-Offset Freq List settings:
frequency, with the corresponding measurement result deltas.
You can select the
View/Trace, then Modulation Margin and Limits.
Modulation Margin and Limits view by pressing
Figure 2-12 EDGE ORFS Result - Example (Short List)
Modulation Margin & Limits View
Making Measurements
For more details about changing measurement parameters, see
“EDGE Output RF Spectrum Measurement Keys” on page 166 and
“EDGE Output RF Spectrum Measurement Concepts” on page 549.
If you have a problem, and get an error message, see “Interpreting
Error Codes” on page 137.
66 Chapter 2

Making Measurements
EDGE Output RF Spectrum (ORFS) Measurements
• Switching Power - When Meas Method is set to Multi-Offset, and Meas
Type
is set to Switching, or Mod and Switch, measurement results may
be viewed as absolute powers in tabular form. The data displays
offsets from any of the
and
Custom.
Multi-Offset Freq List settings: Standard, Short,
You can select the
Switching Power.
Switching Power view by pressing View/Trace, then
Figure 2-13 EDGE ORFS Result - Example (Short List)
Switching Power View
For more details about changing measurement parameters, see
“EDGE Output RF Spectrum Measurement Keys” on page 166 and
“EDGE Output RF Spectrum Measurement Concepts” on page 549.
If you have a problem, and get an error message, see “Interpreting
Error Codes” on page 137.
Chapter 2 67
Making Measurements

Making Measurements
EDGE Output RF Spectrum (ORFS) Measurements
• Switching Margin & Limits - When Meas Method is set to Multi-Offset,
and
Meas Type is set to Switching or Mod and Switch, measurement
results may be viewed as relative powers in tabular form. The data
displays offsets from any of the
Standard, Short, and Custom, and shows the limit values selected by
Multi-Offset Freq List settings:
frequency, with the corresponding measurement result deltas.
You can select the
View/Trace, then Switching Margin & Limits.
Switching Margin & Limits view by pressing
Figure 2-14 EDGE ORFS Result - Switching Margin & Limits View
Making Measurements
For more details about changing measurement parameters, see
“EDGE Output RF Spectrum Measurement Keys” on page 166 and
“EDGE Output RF Spectrum Measurement Concepts” on page 549.
If you have a problem, and get an error message, see “Interpreting
Error Codes” on page 137.
68 Chapter 2

Making Measurements
EDGE Output RF Spectrum (ORFS) Measurements
Single Offset (Examine) - makes a measurement at a single offset
frequency as set by the
Single Offset Freq softkey.
Single offset measurement results are displayed as a power
waveform in a time domain plot, with the measurement offset
shown as a gate by white vertical lines. The red vertical lines
represent the additional effective measurement window when
Fast Avg is ON (default setting).
NOTE The signal being displayed below is the useful part of slot 1, which in
this example, is the only active slot in the frame. If any other slots are
active, the default RF Burst trigger must be changed, and an external
event trigger must be provided to synchronize the frame. Otherwise the
measurement may trigger randomly on any burst in an active slot. This
is true for all ORFS measurements.
Figure 2-15 EDGE ORFS Result - Modulation Single Offset (Examine) View
For more details about changing measurement parameters, see
“EDGE Output RF Spectrum Measurement Keys” on page 166
and “EDGE Output RF Spectrum Measurement Concepts” on
page 549.
If you have a problem, and get an error message, see
“Interpreting Error Codes” on page 137.
Chapter 2 69
Making Measurements

Making Measurements
EDGE Output RF Spectrum (ORFS) Measurements
Switching Single Offset measurement results are displayed in a
time domain plot, but the waveform of the entire frame is
displayed. In this example, slots 1 and 4 are active. Use the
external trigger to maintain frame synchronization.
Fast Avg is
not available for this measurement.
Figure 2-16 EDGE ORFS Result - Switching Single Offset (Examine) View
Making Measurements
For more details about changing measurement parameters, see
“EDGE Output RF Spectrum Measurement Keys” on page 166
and “EDGE Output RF Spectrum Measurement Concepts” on
page 549.
If you have a problem, and get an error message, see
“Interpreting Error Codes” on page 137.
70 Chapter 2

Combination Modulation and Switching (Mod & Switch) Single
Offset measurement results are displayed in a time domain plot,
but the waveform of the entire frame is displayed. The blue trace
is the Switching data and the yellow trace is the Modulation data,
with the measurement gates shown.
In this example, slots 1 and 4 are active. Use the external trigger
to maintain frame synchronization.
this measurement.
Figure 2-17 EDGE ORFS Result -
Mod & Switch Single Offset (Examine) View
Making Measurements
EDGE Output RF Spectrum (ORFS) Measurements
Fast Avg is not available for
For more details about changing measurement parameters, see
“EDGE Output RF Spectrum Measurement Keys” on page 166
and “EDGE Output RF Spectrum Measurement Concepts” on
page 549.
If you have a problem, and get an error message, see
“Interpreting Error Codes” on page 137.
Chapter 2 71
Making Measurements

Making Measurements
EDGE Output RF Spectrum (ORFS) Measurements
• Swept - When Meas Type is set to Modulation and Meas Method is set to
Swept, measurement results may be viewed in the spectrum domain,
with the limit mask applied to the spectrum plot, and the Worst
Frequency parameters displayed. This selection is only available if
Meas Type is set to Modulation.
Figure 2-18 EDGE ORFS Result - Example Modulation Swept View
Making Measurements
For more details about changing measurement parameters, see
“EDGE Output RF Spectrum Measurement Keys” on page 166 and
“EDGE Output RF Spectrum Measurement Concepts” on page 549.
If you have a problem, and get an error message, see “Interpreting
Error Codes” on page 137.
72 Chapter 2

Making Measurements
EDGE Output RF Spectrum (ORFS) Measurements
• Full Frame Mode (FAST) - When Meas Method is set to Multi-Offset, and
Meas Type is set to Full Frame Mode (FAST), measurement results may
be viewed as relative and absolute powers in tabular form. The data
displays offsets from any of the
Standard, Short, and Custom.
Multi-Offset Freq List settings:
To m e as ure
Full Frame Mode (FAST), all slots in the frame must be
active. In the example below, slots 6 and 7 were inactive.
Figure 2-19 EDGE ORFS Result - Full Frame Modulation (FAST) View
For more details about changing measurement parameters, see
“EDGE Output RF Spectrum Measurement Keys” on page 166 and
“EDGE Output RF Spectrum Measurement Concepts” on page 549.
If you have a problem, and get an error message, see “Interpreting
Error Codes” on page 137.
Chapter 2 73
Making Measurements

Making Measurements
EDGE Tx Band Spur Measurements
EDGE Tx Band Spur Measurements
This section explains how to make an EDGE Tx Band Spur
measurement on an EDGE base station (BTS). Good measurement
results verify that the transmitter does not transmit undesirable
energy into the transmit band. This energy may cause interference for
other users of the EDGE system.
NOTE This measurement is designed for EDGE BTS testing only. For the
GSM Output RF Spectrum measurement see “GMSK Transmitter Band
Spurious Signal (Tx Band Spur) Measurements” on page 101.
Configuring the Measurement System
This example shows a base station (BTS) under test set up to transmit
RF power, and being controlled remotely by a system controller. The
transmitting signal is connected to the analyzer RF input port. Connect
the equipment as shown.
Figure 2-20 EDGE Transmitter Band Spurious Measurement System
1. Using the appropriate cables, adapters, and circulator, connect the
output signal of the BTS to the RF input of the instrument.
2. Connect the base transmission station simulator or signal generator
to the BTS through a circulator to initiate a link constructed with
sync and pilot channels, if required.
Making Measurements
3. Connect a BNC cable between the 10 MHz OUT port of the signal
generator and the EXT REF IN port of the instrument.
4. Connect the system controller to the BTS through the serial bus
74 Chapter 2

cable to control the BTS operation.
Setting the BTS (Example)
From the base transmission station simulator and the system
controller, set up a call using loopback mode for the BTS to transmit the
RF power as follows:
BTS: Symbol Rate: 270.833kbps
Frequency: 935.2000 MHz (ARFCN number 1)
Output Power: −3 dBW (0.5 W)
Measurement Procedure
Step 1. Press the Preset key to preset the instrument.
Making Measurements
EDGE Tx Band Spur Measurements
Step 2. Press the
MODE, GSM (w/EDGE) keys to enable the GSM with EDGE
mode measurements.
Step 3. Press the
Mode Setup, Trigger keys to select a trigger source as described
in the section titled “EDGE Tx Band Spur Measurement Keys” on
page 184.
Step 4. Press the
FREQUENCY Channel key to select the desired center
frequency or ARFCN as described in the section titled “FREQUENCY
Channel Key Menu” on page 143.
Step 5. Press the
Burst Type key to select the desired burst type as described in
the section titled “FREQUENCY Channel Key Menu” on page 143.
Step 6. If your signal of interest contains more than 1 Training Sequence, press
TSC key, and select a standard Training Sequence (numbered 0-9) to
the
which the measurement will synchronize. The default setting for
Auto, which automatically correlates to any one of the standard
TSC is
Training Sequences numbered 0-9. See “FREQUENCY Channel Key
Menu” on page 143.
Step 7. Press the
MEASURE, Tx Band Spur keys to initiate the EDGE
Transmitter Band Spurious products measurement.
For more details about changing measurement parameters, see “EDGE
Tx Band Spur Measurement Concepts” on page 554.
If you have a problem, and get an error message, see “Interpreting
Error Codes” on page 137.
Chapter 2 75
Making Measurements

Making Measurements
EDGE Tx Band Spur Measurements
Results
Figure 2-21 EDGE Tx Band Spur Result - Upper Adj Segment
Troubleshooting Hints
Almost any fault in the transmitter circuits can manifest itself in
spurious results of one kind or another. Make sure the transmit band is
correctly selected and the frequency is either the Bottom, Middle, or Top
channel. The “Unexpected carrier frequency (BMT only)” message
usually indicates the transmit band and/or carrier frequency is not
correct. The “ADC overload -- unexpected carrier frequency”
message usually indicates the selected channel frequency does not
match the carrier frequency of the signal.
Making Measurements
76 Chapter 2
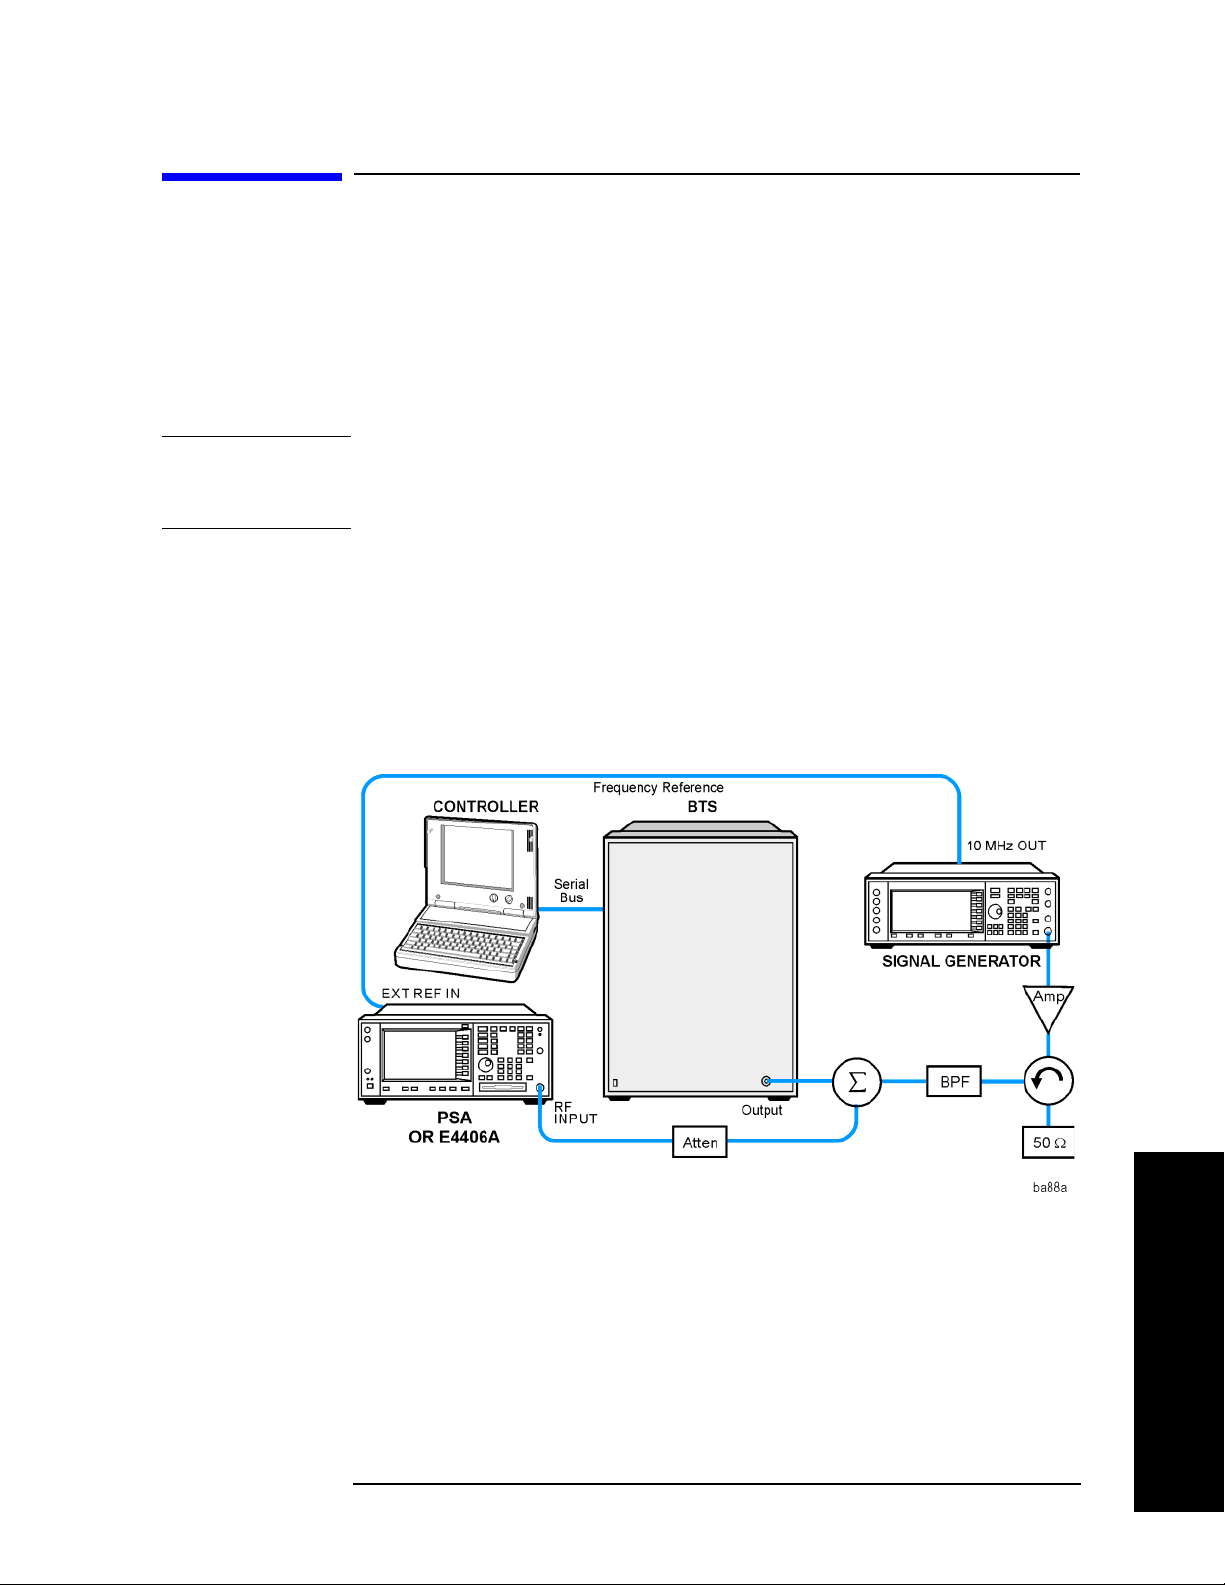
Making Measurements
GMSK Output RF Spectrum (ORFS) Measurements
GMSK Output RF Spectrum (ORFS)
Measurements
This section explains how to make a GSM Output RF Spectrum
measurement on an EDGE base station. This test verifies that the
modulation, wideband noise, and power level switching spectra are
within limits and do not produce significant interference in the adjacent
base transceiver station (BTS) channels.
NOTE This measurement is designed for GSM. For the EDGE Output RF
Spectrum measurement see “EDGE Output RF Spectrum (ORFS)
Measurements” on page 62.
Configuring the Measurement System
This example shows a base station (BTS) under test set up to transmit
RF power, and being controlled remotely by a system controller. The
transmitting signal is connected to the analyzer RF input port. Connect
the equipment as shown.
Figure 2-22 GMSK ORFS Measurement System
1. Using the appropriate cables, adapters, and circulator, connect the
output signal of the BTS to the RF input of the instrument.
2. Connect the base transmission station simulator or signal generator
to the BTS through a circulator to initiate a link constructed with
sync and pilot channels, if required.
Making Measurements
3. Connect a BNC cable between the 10 MHz OUT port of the signal
generator and the EXT REF IN port of the instrument.
Chapter 2 77

Making Measurements
GMSK Output RF Spectrum (ORFS) Measurements
4. Connect the system controller to the BTS through the serial bus
cable to control the BTS operation.
NOTE If the signal being measured has more than one active slot in a frame,
the default RF Burst trigger must be changed, and an external event
trigger must be provided to synchronize the frame. Otherwise the
measurement may trigger randomly on any burst in an active slot. This
is true for all ORFS time domain measurements.
Setting the BTS (Example)
From the base transmission station simulator and the system
controller, set up a call using loopback mode for the BTS to transmit the
RF power as follows:
BTS: Symbol Rate: 270.833kbps
Frequency: 935.2000 MHz (ARFCN number 1)
Output Power: −3 dBW (0.5 W)
Measurement Procedure
Step 1. Press the Preset key to preset the instrument.
Step 2. Press the
measurements.
Step 3. Press the
in the section titled “EDGE Output RF Spectrum Measurement Keys”
on page 166.
Step 4. Press the
frequency or ARFCN as described in the section titled “FREQUENCY
Channel Key Menu” on page 143.
Step 5. Press the
the section titled “FREQUENCY Channel Key Menu” on page 143.
Step 6. If your signal of interest contains more than 1 Training Sequence, press
TSC key, and select a standard Training Sequence (numbered 0-9) to
the
which the measurement will synchronize. The default setting for
Auto, which automatically correlates to any one of the standard
Training Sequences numbered 0-9. See “FREQUENCY Channel Key
Menu” on page 143.
MODE, GSM or GSM (w/EDGE) keys to enable the GSM mode
Mode Setup, Trigger keys to select a trigger source as described
FREQUENCY Channel key to select the desired center
Burst Type key to select the desired burst type as described in
TSC is
Making Measurements
78 Chapter 2

Making Measurements
GMSK Output RF Spectrum (ORFS) Measurements
Step 7. Press Meas Setup and select the Meas Type and Meas Method for your
measurement:
Meas Type - Accesses a menu to choose the measurement that is
•
optimized for the type of spectral distortion being investigated.
Mod & Switch - Performs both Modulation and Switching
measurements, which measures the spectrum due to the 0.3
GMSK modulation and noise, and Switching (transient)
measurements.
Modulation - Measures the spectrum optimized for distortion due
to the 0.3 GMSK modulation and noise.
Switching - Measures the spectrum optimized for distortion due to
switching transients (burst ramping).
Full Frame Modulation (FAST)- Improves measurement speed by
acquiring a full frame of data prior to performing the FFT
calculation. This feature can only be used when all slots in the
transmitted frame are active. Use of an external trigger can
enhance measurement speed when this feature is used. When
Frame Modulation (FAST)
is selected the current measurement
defaults to the multi-offset measurement method. Therefore, the
Meas Method key is grayed out and the Single Offset feature is not
available.
Full
Meas Method - Accesses a menu to choose the measurement mode.
•
Multi-Offset - Automatically makes measurements at all offset
frequencies in the selected list (
Press the
Multi-Offset Freq List key to select a list of offsets to
Standard, Short, or Custom).
measure.
Multi-Offset measurements may be made with either Modulation or
Switching measurement types.
Offset measurement results are displayed as tabular data, and
may be viewed as either absolute powers in the Modulation Power
and Switching Power views, or as powers relative to the margins
and limit settings in the Modulation Margin and Limit and
Switching Margin and Limit views. See “Trace/View Key Menu”
on page 160, and Figure 2-11 on page 65.
Single Offset (Examine) - Makes a measurement at a single offset
frequency as set by the
Single Offset (Examine) measurements may be made with either
Modulation or Switching measurement types.
Single Offset Freq softkey.
Single offset measurement results are displayed in a time domain
plot, with the measurement offset shown as a gate by white
vertical lines. See Figure 2-15 on page 69.
Making Measurements
Chapter 2 79
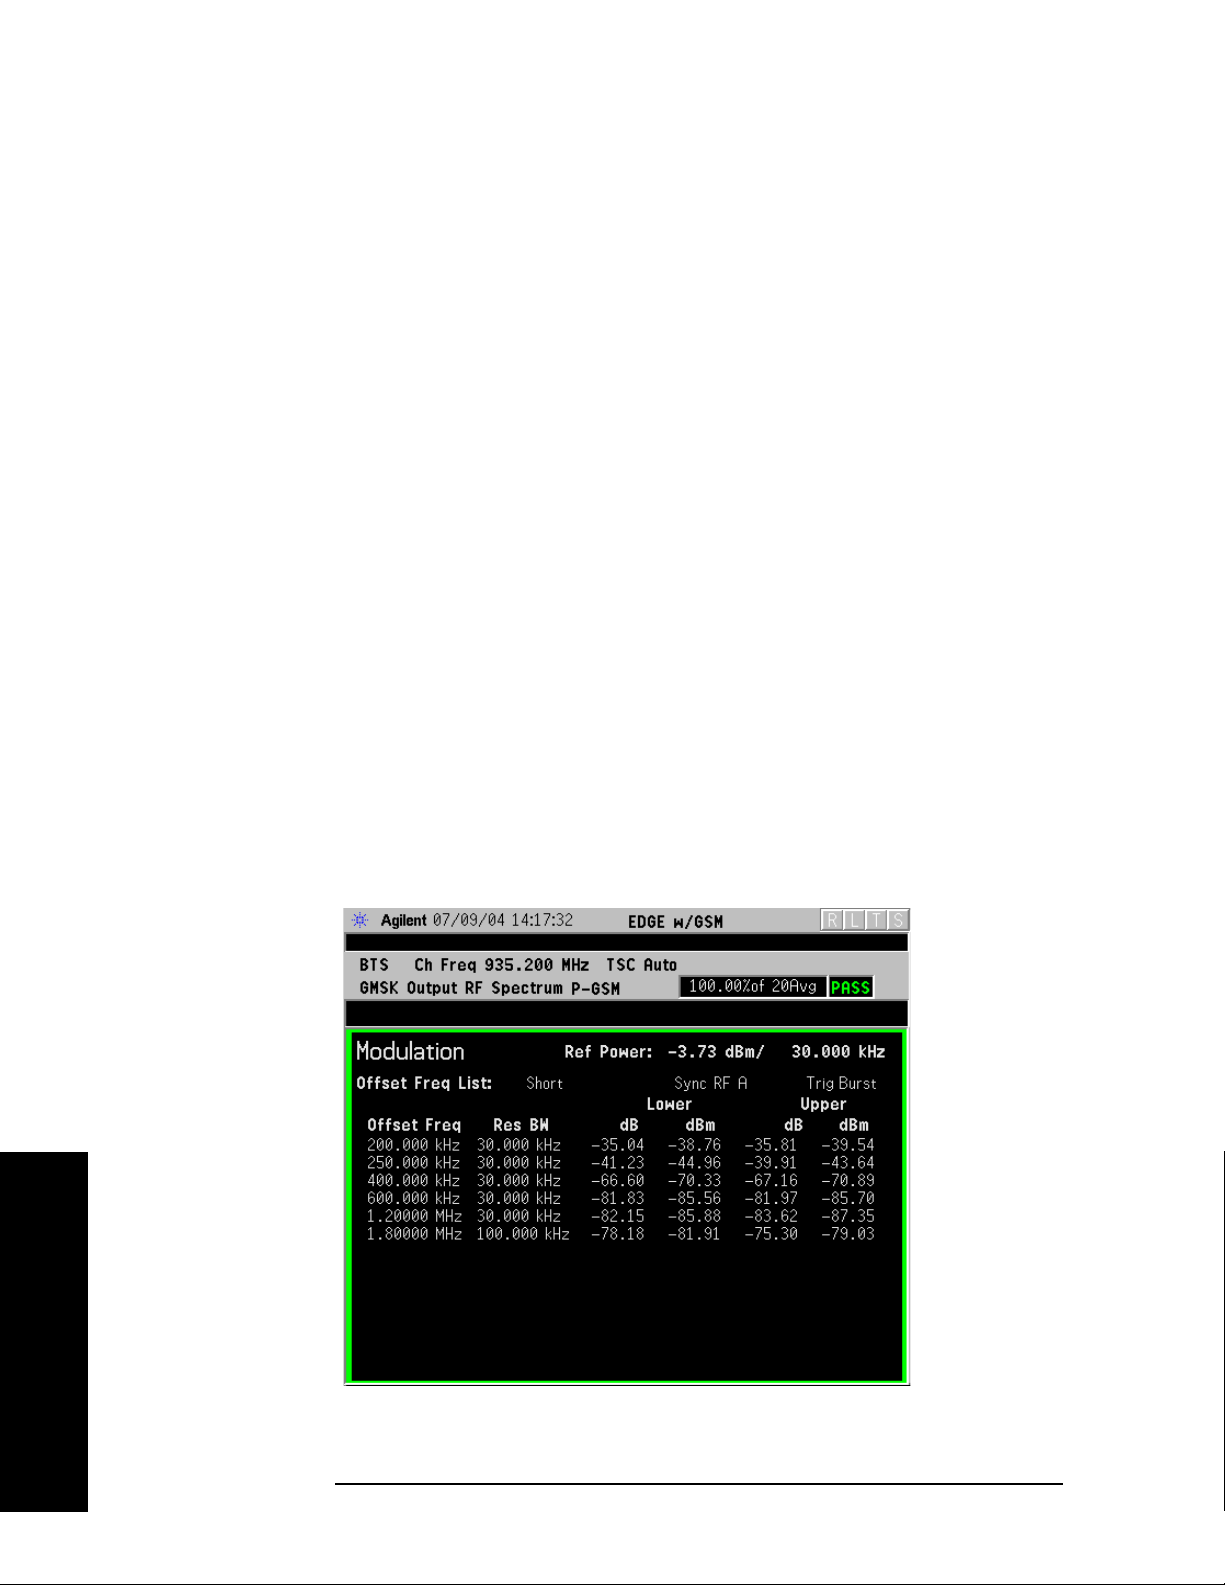
Making Measurements
GMSK Output RF Spectrum (ORFS) Measurements
Swept - Makes a measurement using time-gated spectrum
analysis to sweep the analyzer with the gate turned on for the
desired portion of the burst only, as set by the
(offsets)
& Limits menu. The limits mask is applied to the
spectrum plot, and the Worst Frequency parameters are
displayed. This selection is only available if
Modulation. See Figure 2-18 on page 72.
Modulation Ofs
Meas Type is set to
Step 8. Press the
change the
Measure Cont for continuous measurements.
Restart key to re-initiate a GMSK ORFS measurement if you
Meas Type or Meas Method. You can also set Meas Control to
For more details about changing measurement parameters, see “GMSK
Output RF Spectrum Measurement Keys” on page 187 and “GMSK
Output RF Spectrum Measurement Concepts” on page 536.
If you have a problem, and get an error message, see “Interpreting
Error Codes” on page 137.
GMSK ORFS Measurement Results
• Modulation Power - When Meas Method is set to Multi-Offset, and Meas
Type
is set to Modulation, or Mod and Switch, measurement results
may be viewed as absolute powers in tabular form. The data displays
offsets from any of the
and
Custom. The Modulation Power view is the default view for ORFS
measurements. You can select the
View/Trace, then Modulation Power.
Figure 2-23 GMSK ORFS - Example (Short List) Modulation Power View
Multi-Offset Freq List settings: Standard, Short,
Modulation Power view by pressing
Making Measurements
80 Chapter 2

Making Measurements
GMSK Output RF Spectrum (ORFS) Measurements
• Modulation Margin & Limits- When Meas Method is set to Multi-Offset,
and
Meas Type is set to Modulation, or Mod and Switch, measurement
results may be viewed as relative powers in tabular form. The data
displays offsets from any of the
Standard, Short, and Custom, and shows the limit values selected by
Multi-Offset Freq List settings:
frequency, with the corresponding measurement result deltas.
You can select the
View/Trace, then Modulation Margin and Limits.
Modulation Margin and Limits view by pressing
Figure 2-24 GMSK ORFS Result - Example (Short List)
Modulation Margin & Limits View
For more details about changing measurement parameters, see
“GMSK Output RF Spectrum Measurement Keys” on page 187 and
“GMSK Output RF Spectrum Measurement Concepts” on page 536.
If you have a problem, and get an error message, see “Interpreting
Error Codes” on page 137.
Chapter 2 81
Making Measurements

Making Measurements
GMSK Output RF Spectrum (ORFS) Measurements
• Switching Power - When Meas Method is set to Multi-Offset, and Meas
Type
is set to Switching, or Mod and Switch, measurement results may
be viewed as absolute powers in tabular form. The data displays
offsets from any of the
and
Custom.
Multi-Offset Freq List settings: Standard, Short,
You can select the
Switching Power.
Switching Power view by pressing View/Trace, then
Figure 2-25 GMSK ORFS Result - Example (Short List)
Switching Power View
Making Measurements
For more details about changing measurement parameters, see
“GMSK Output RF Spectrum Measurement Keys” on page 187 and
“GMSK Output RF Spectrum Measurement Concepts” on page 536.
If you have a problem, and get an error message, see “Interpreting
Error Codes” on page 137.
82 Chapter 2

Making Measurements
GMSK Output RF Spectrum (ORFS) Measurements
• Switching Margin & Limits - When Meas Method is set to Multi-Offset,
and
Meas Type is set to Switching or Mod and Switch, measurement
results may be viewed as relative powers in tabular form. The data
displays offsets from any of the
Standard, Short, and Custom, and shows the limit values selected by
Multi-Offset Freq List settings:
frequency, with the corresponding measurement result deltas.
You can select the
View/Trace, then Switching Margin & Limits.
Switching Margin & Limits view by pressing
Figure 2-26 GMSK ORFS Result - Switching Margin & Limits View
For more details about changing measurement parameters, see
“GMSK Output RF Spectrum Measurement Keys” on page 187 and
“GMSK Output RF Spectrum Measurement Concepts” on page 536.
If you have a problem, and get an error message, see “Interpreting
Error Codes” on page 137.
Chapter 2 83
Making Measurements

Making Measurements
GMSK Output RF Spectrum (ORFS) Measurements
Single Offset (Examine) - Makes a measurement at a single offset
frequency as set by the
Offset Freq softkey.
Single offset measurement results are displayed as a power
waveform in a time domain plot, with the measurement offset
shown as a gate by white vertical lines. The red vertical lines
represent the additional effective measurement window when
Fast Avg is ON (default setting).
NOTE The signal being displayed below is the useful part of slot 1, which in
this example, is the only active slot in the frame. If any other slots are
active, the default RF Burst trigger must be changed, and an external
event trigger must be provided to synchronize the frame. Otherwise the
measurement may trigger randomly on any burst in an active slot. This
is true for all ORFS time domain measurements.
Figure 2-27 GMSK ORFS Result - Modulation Single Offset (Examine) View
Making Measurements
For more details about changing measurement parameters, see
“GMSK Output RF Spectrum Measurement Keys” on page 187
and “GMSK Output RF Spectrum Measurement Concepts” on
page 536.
If you have a problem, and get an error message, see
“Interpreting Error Codes” on page 137.
84 Chapter 2

Making Measurements
GMSK Output RF Spectrum (ORFS) Measurements
Switching Single Offset measurement results are displayed in a
time domain plot, but the waveform of the entire frame is
displayed. In this example, slots 1 and 4 are active. Use the
external trigger to maintain frame synchronization.
Fast Avg is
not available for this measurement.
Figure 2-28 GMSK ORFS Result - Switching Single Offset (Examine) View
For more details about changing measurement parameters, see
“GMSK Output RF Spectrum Measurement Keys” on page 187
and “GMSK Output RF Spectrum Measurement Concepts” on
page 536.
If you have a problem, and get an error message, see
“Interpreting Error Codes” on page 137.
Making Measurements
Chapter 2 85

Making Measurements
GMSK Output RF Spectrum (ORFS) Measurements
Combination Modulation and Switching (Mod & Switch) Single
Offset measurement results are displayed in a time domain plot,
but the waveform of the entire frame is displayed. The blue trace
is the Switching data and the yellow trace is the Modulation data,
with the measurement gates shown.
In this example, slots 1 and 4 are active. Use the external trigger
to maintain frame synchronization.
this measurement.
Figure 2-29 GMSK ORFS Result -
Mod & Switch Single Offset (Examine) View
Fast Avg is not available for
Making Measurements
For more details about changing measurement parameters, see
“GMSK Output RF Spectrum Measurement Keys” on page 187
and “GMSK Output RF Spectrum Measurement Concepts” on
page 536.
If you have a problem, and get an error message, see
“Interpreting Error Codes” on page 137.
86 Chapter 2

Making Measurements
GMSK Output RF Spectrum (ORFS) Measurements
• Swept - When Meas Type is set to Modulation and Meas Method is set to
Swept, measurement results may be viewed in the spectrum domain,
with the limit mask applied to the spectrum plot, and the Worst
Frequency parameters displayed. This selection is only available if
Meas Type is set to Modulation.
Figure 2-30 GMSK ORFS Result - Example Modulation Swept View
For more details about changing measurement parameters, see
“GMSK Output RF Spectrum Measurement Keys” on page 187 and
“GMSK Output RF Spectrum Measurement Concepts” on page 536.
If you have a problem, and get an error message, see “Interpreting
Error Codes” on page 137.
Making Measurements
Chapter 2 87
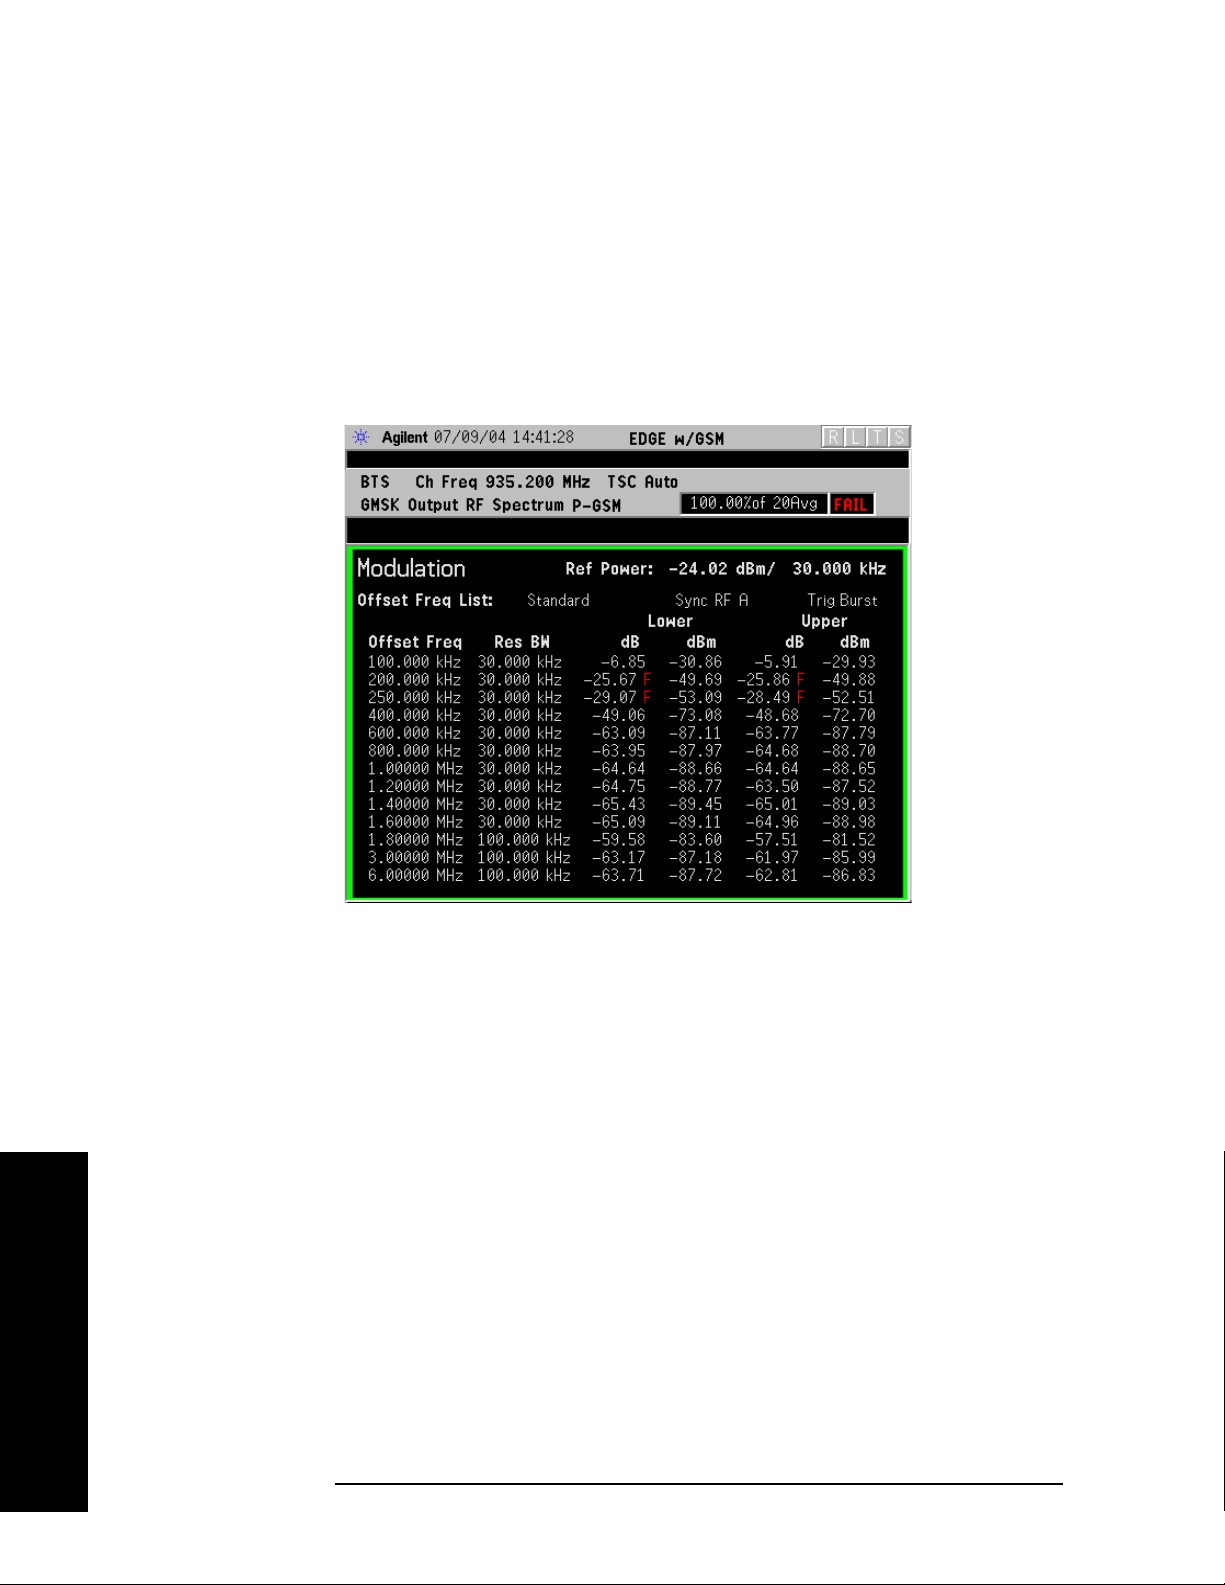
Making Measurements
GMSK Output RF Spectrum (ORFS) Measurements
• Full Frame Mode (FAST) - When Meas Method is set to Multi-Offset, and
Meas Type is set to Full Frame Mode (FAST), measurement results may
be viewed as relative and absolute powers in tabular form. The data
displays offsets from any of the
Standard, Short, and Custom.
Multi-Offset Freq List settings:
To m e as ure
Full Frame Mode (FAST), all slots in the frame must be
active. In the example below, slots 6 and 7 were inactive.
Figure 2-31 GMSK ORFS Result - Full Frame Modulation (FAST) View
Making Measurements
For more details about changing measurement parameters, see
“GMSK Output RF Spectrum Measurement Keys” on page 187 and
“GMSK Output RF Spectrum Measurement Concepts” on page 536.
If you have a problem, and get an error message, see “Interpreting
Error Codes” on page 137.
88 Chapter 2

GMSK Phase and Frequency Error Measurements
GMSK Phase and Frequency Error
Measurements
This section explains how to make a GMSK Phase and Frequency Error
measurement on a GSM base station (BTS). Good measurement results
Verify modulation quality of the 0.3 GMSK signal for GSM systems.
The modulation quality indicates the carrier to noise performance of the
system, which is critical for mobiles with low signal levels, at the edge
of a cell, or under difficult fading or Doppler conditions.
NOTE This measurement is designed for GSM only.
Configuring the Measurement System
This example shows a base station (BTS) under test set up to transmit
RF power, and being controlled remotely by a system controller. The
transmitting signal is connected to the analyzer RF input port. Connect
the equipment as shown.
Making Measurements
Figure 2-32 GMSK Phase and Frequency Measurement System
1. Using the appropriate cables, adapters, and circulator, connect the
output signal of the BTS to the RF input of the instrument.
2. Connect the base transmission station simulator or signal generator
to the BTS through a circulator to initiate a link constructed with
sync and pilot channels, if required.
Making Measurements
3. Connect a BNC cable between the 10 MHz OUT port of the signal
generator and the EXT REF IN port of the instrument.
4. Connect the system controller to the BTS through the serial bus
Chapter 2 89

Making Measurements
GMSK Phase and Frequency Error Measurements
cable to control the BTS operation.
Setting the BTS (Example)
From the base transmission station simulator and the system
controller, set up a call using loopback mode for the BTS to transmit the
RF power as follows:
BTS: Symbol Rate: 270.833kbps
Frequency: 935.2000 MHz (ARFCN number 1)
Output Power: −3 dBW (0.5 W)
Measurement Procedure
Step 1. Press the Preset key to preset the instrument.
Step 2. Press the
MODE, GSM (w/EDGE) keys to enable the GSM with EDGE
mode measurements.
Step 3. Press the
Mode Setup, Trigger keys to select a trigger source as described
in the section titled “GMSK Phase and Frequency Error Measurement
Keys” on page 197.
Step 4. Press the
FREQUENCY Channel key to select the desired center
frequency or ARFCN as described in the section titled “FREQUENCY
Channel Key Menu” on page 143.
Step 5. Press the
Burst Type key to select the desired burst type as described in
the section titled “FREQUENCY Channel Key Menu” on page 143.
Step 6. If your signal of interest contains more than 1 Training Sequence, press
TSC key, and select a standard Training Sequence (numbered 0-9) to
the
which the measurement will synchronize. The default setting for
Auto, which automatically correlates to any one of the standard
TSC is
Training Sequences numbered 0-9. See “FREQUENCY Channel Key
Menu” on page 143.
Step 7. Press the
MEASURE, GMSK Phase & Freq keys to initiate the Phase and
Frequency Error measurement.
Making Measurements
90 Chapter 2

Making Measurements
GMSK Phase and Frequency Error Measurements
Figure 2-33 GMSK Phase and Frequency Error Result - Quad View (Default)
Step 8. Press the
Next Window, Zoom keys to expand the Phase Error with
Frequency graph.
Figure 2-34 GMSK Phase and Frequency Error Result - Phase Error View
Making Measurements
Chapter 2 91

Making Measurements
GMSK Phase and Frequency Error Measurements
Step 9. Press the Next Window key to expand the RF Envelope graph. The
horizontal scale in this graph is Time, not bits, as in previous graphs.
Figure 2-35 GMSK Phase and Frequency Error Result - RF Envelope View
Step 10. Press the
View/Trace, I/Q Measured Polar Vector key to view the Polar plot
of vector data and the Phase and Frequency Error summaries.
Figure 2-36 GMSK Phase and Frequency Error Result - Polar View
Making Measurements
92 Chapter 2
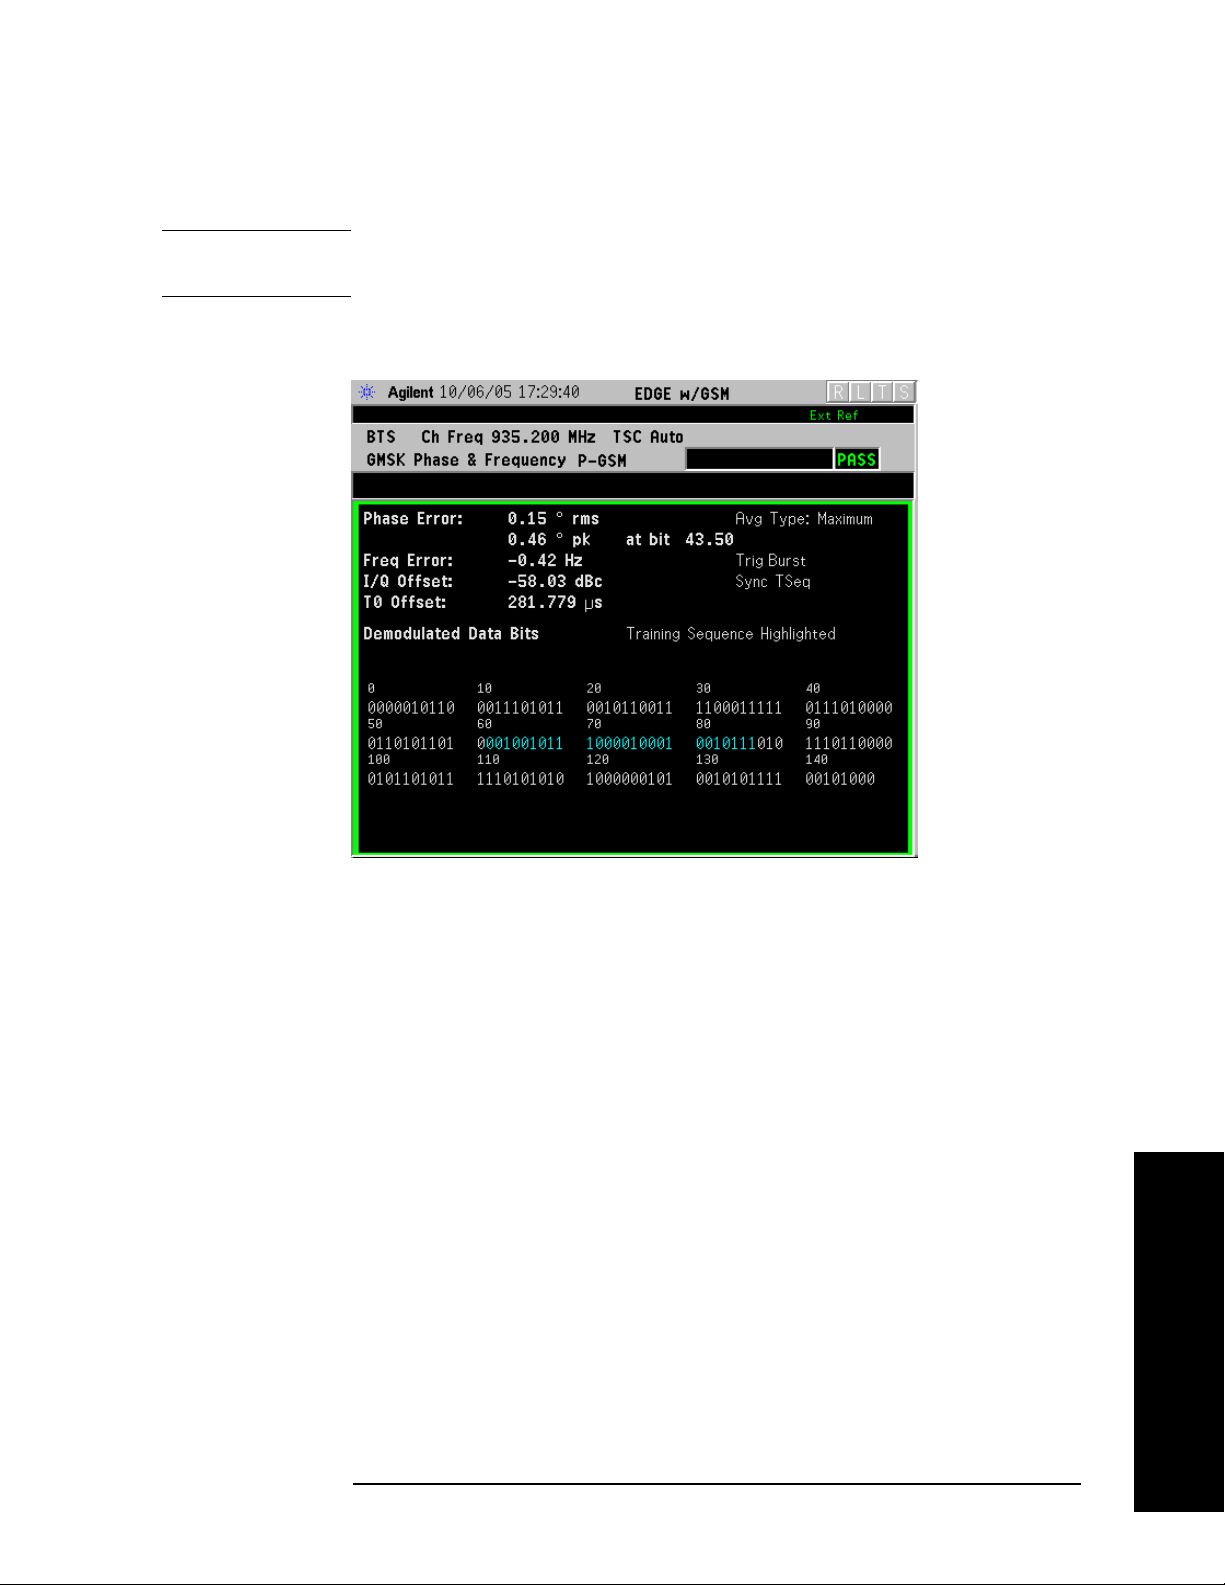
Making Measurements
GMSK Phase and Frequency Error Measurements
Step 11. Press the View/Trace, GMSK Phase Error, Zoom key to the Phase Error vs.
Frequency graph.
NOTE The demodulated bits in this display are Symbol State bits, and do not
represent encoded message data.
Figure 2-37 GMSK Phase and Frequency Error Result - Data Bits
For More Information
For more details about changing measurement parameters, see “GMSK
Phase and Frequency Error Measurement Concepts” on page 533.
If you have a problem, and get an error message, see “Interpreting
Error Codes” on page 137.
Troubleshooting Hints
Poor phase error indicates a problem with the I/Q baseband generator,
filters, or modulator in the transmitter circuitry. The output amplifier
in the transmitter can also create distortion that causes unacceptably
high phase error. In a real system. poor phase error reduces the ability
of a receiver to correctly demodulate, especially in marginal signal
conditions. This ultimately affects range.
Occasionally, a Phase and Frequency Error measurement may fail the
prescribed limits at only one point in the burst, for example at the
beginning. This could indicate a problem with the transmitter power
ramp or some undesirable interaction between the modulator and
power amplifier.
Making Measurements
Chapter 2 93
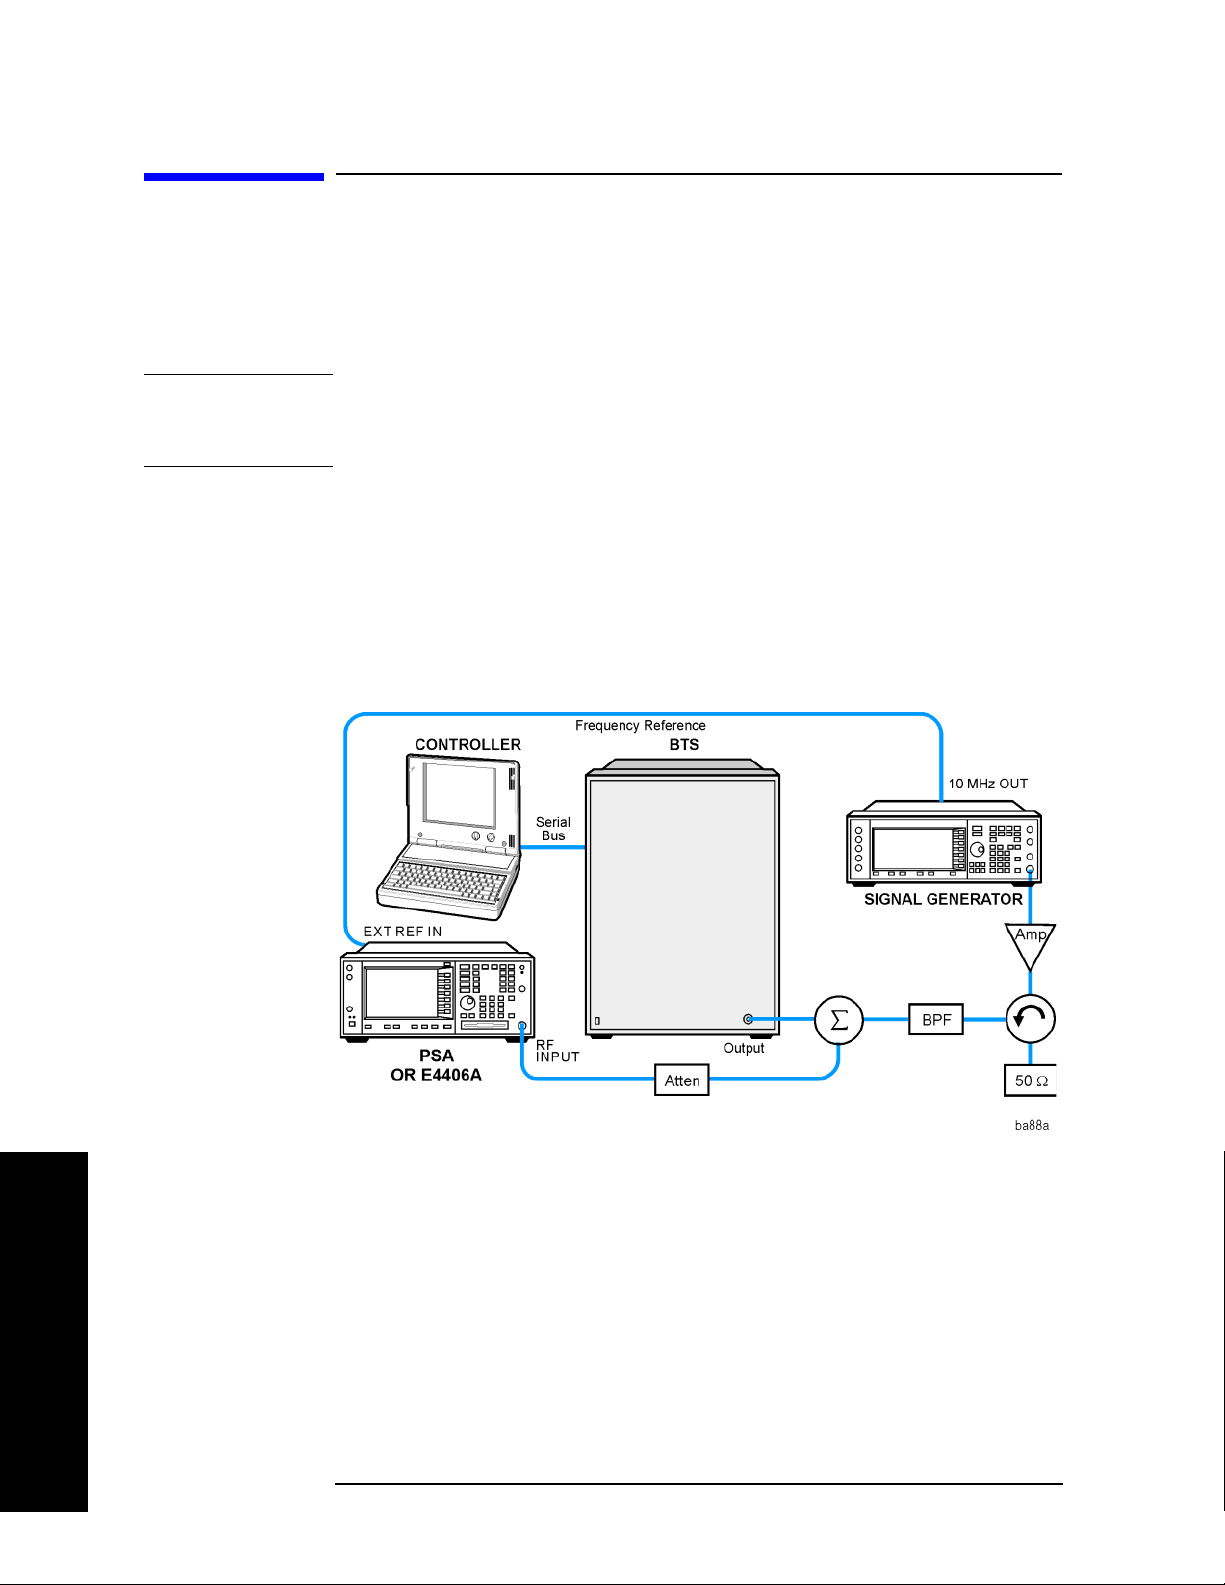
Making Measurements
GMSK Power vs. Time (PvT) Measurements
GMSK Power vs. Time (PvT) Measurements
This section explains how to make a GMSK Power versus Time (PvT)
measurement on a GSM base station (BTS). Good PvT measurement
results verify that the transmitter output power has the correct
amplitude, shape, and timing for the GSM format.
NOTE This measurement is designed for GSM. For the EDGE PvT
measurement see “EDGE Power vs. Time (PVT) Measurements” on
page 50.
Configuring the Measurement System
This example shows a base station (BTS) under test set up to transmit
RF power, and being controlled remotely by a system controller. The
transmitting signal is connected to the analyzer RF input port. Connect
the equipment as shown.
Figure 2-38 GMSK Pwr vs Time Measurement System
1. Using the appropriate cables, adapters, and circulator, connect the
output signal of the BTS to the RF input of the instrument.
2. Connect the base transmission station simulator or signal generator
to the BTS through a circulator to initiate a link constructed with
sync and pilot channels, if required.
Making Measurements
3. Connect a BNC cable between the 10 MHz OUT port of the signal
generator and the EXT REF IN port of the instrument.
4. Connect the system controller to the BTS through the serial bus
cable to control the BTS operation.
94 Chapter 2

GMSK Power vs. Time (PvT) Measurements
Setting the BTS (Example)
From the base transmission station simulator and the system
controller, set up a call using loopback mode for the BTS to transmit the
RF power as follows:
BTS: Symbol Rate: 270.833kbps
Frequency: 935.2000 MHz (ARFCN number 1)
Output Power: −3 dBW (0.5 W)
Measurement Procedure
Step 1. Press the Preset key to preset the instrument.
Making Measurements
Step 2. Press the
MODE, GSM (w/EDGE) keys to enable the EDGE mode
measurements.
Step 3. Press the
Mode Setup, Trigger keys to select a trigger source as described
in the section titled “GMSK Power vs. Time Measurement Keys” on
page 204.
Step 4. Press the
Radio, Band keys to select the desired band. This determines
the frequency and band-related presets. Our example uses the default
setting,
Step 5. Press the
P-GSM.
FREQUENCY Channel key to select the desired center
frequency or ARFCN as described in the section titled “FREQUENCY
Channel Key Menu” on page 143.
Step 6. Press the
Burst Type key to select the desired burst type as described in
the section titled “FREQUENCY Channel Key Menu” on page 143.
Step 7. If your signal of interest contains more than 1 Training Sequence, press
TSC key, and select a standard Training Sequence (numbered 0-7) to
the
which the measurement will synchronize. The default setting for
Auto, which automatically correlates to any one of the standard
TSC is
Training Sequences numbered 0-7. See “FREQUENCY Channel Key
Menu” on page 143.
Step 8. Press the
Power vs Time measurement.
Step 9. Press the
control level. Our example uses the default setting
For more details about changing measurement parameters, see “GMSK
Power vs. Time Measurement Concepts” on page 527
If you have a problem, and get an error message, see “Interpreting
Error Codes” on page 137.
Chapter 2 95
MEASURE, GMSK Pwr vs Time keys to initiate the EDGE
Meas Setup, More, Pwr Ctrl Lvl keys to select the desired power
0.
Making Measurements

Making Measurements
GMSK Power vs. Time (PvT) Measurements
Results
The views available under the View/Trace menu are Burst, Rise & Fall,
Multi-Slot.
and
Information shown in the left margin of the displays include:
• MaxP - This is total input power allowed for the measurement. This
value is coupled to the internal RF
Input Atten setting.
• ExtAt - This value reflects the
• Sync - The
• Trig - The
Burst Sync setting used in the current measurement
Trigg e r So ur c e setting used in the current measurement
External RF Atten setting.
The Mean Transmit Power is displayed at the bottom left of the
Burst and Rise & Fall views:
• Mean Transmit Power - This is the RMS average power across the
“useful” part of the burst, or the 147 bits centered on the transition
from bit 13 to bit 14 (the “T0” time point) of the 26 bit training
sequence. An RMS calculation is performed and displayed regardless
of the averaging mode selected for the trace data.
If Averaging = ON, the result displayed is the RMS average power of
all bursts measured. If Averaging = OFF, the result is the RMS
average power of the single burst measured. This is a different
measurement result from Mean Transmit Pwr, below.
The Current Data displayed at the bottom of the Burst and Rise &
Fall views include:
• Mean Transmit Pwr - This result appears only if Averaging = ON.
It is the RMS average of power across the “useful” part of the burst,
for the current burst only. If a single measurement of “n” averages
has been completed, the result indicates the Mean Transmit Pwr of
the last burst. The RMS calculation is performed and displayed
regardless of the averaging mode selected for the trace data. This is
a different measurement result from Mean Transmit Power, above.
Making Measurements
• Max Pt. - Maximum signal power point in dBm
• Min Pt. - Minimum signal power point in dBm
• Burst Width - Time duration of burst at −3 dB power point
(half-power)
• Mask Ref Pwr Midamble - The Mask Reference Power is the
average power in dBm of the middle 16 symbols in the midamble.
The times displayed are the corresponding start and stop times of
the middle 16 symbols.
• 1st Error Pt - (Error Point) The time (displayed in ms or µs)
indicates the point on the X Scale where the first failure of a signal
96 Chapter 2

GMSK Power vs. Time (PvT) Measurements
was detected. Use a marker to locate this point in order to examine
the nature of the failure.
The table in the lower portion of the multi-slot view shows the output
power in dBm for each timeslot, as determined by the integer (1 to 8)
entered in the
Meas Setup, Meas Time setting. Output power levels are
presented for the active slots. A dashed line appears for any slot that is
inactive. The timeslot that contains the burst of interest is highlighted
in blue.
Figure 2-39 GMSK Power vs. Time Result - Burst View
Making Measurements
Chapter 2 97
Making Measurements

Making Measurements
GMSK Power vs. Time (PvT) Measurements
Figure 2-40 GMSK Power vs. Time Result - Rise & Fall View
Figure 2-41 GMSK Power vs. Time Result - Multi-Slot View
(5 slots shown)
Making Measurements
98 Chapter 2

GMSK Power vs. Time (PvT) Measurements
Figure 2-42 GPRS Power vs. Time Result - Multi-Slot View
(2 slots shown)
Making Measurements
Figure 2-43 GMSK PvT Result - Custom Limit Mask Example of Two
Consecutive Bursts
For more information on making measurements of two consecutive
bursts, including the SCPI commands used to make the measurement,
refer to the section in the Programming Commands chapter. See the
section “GMSK PvT Custom Limit Mask Example of Two Consecutive
Bursts” on page 473.
Making Measurements
Chapter 2 99

Making Measurements
GMSK Power vs. Time (PvT) Measurements
Troubleshooting Hints
If a transmitter fails the Power vs. Time measurement this usually
indicates a problem with the units output amplifier or leveling loop.
Making Measurements
100 Chapter 2
 Loading...