


Data Sheet
Agilent
E4416A/E4417A EPM-P Series
Power Meters and E-Series E9320
Peak and Average Power Sensors

2
EPM-P power meter specifications
Specifications describe the instrument’s warranted performance and apply after a 30 minute warm-up. These
specifications are valid over its operating and environmental range unless otherwise stated and after performing a zero and calibration procedure.
Supplemental characteristics are intended to provide
additional information; useful in applying the instrument by giving typical (expected), but not warranted
performance parameters. These characteristics are
shown in italics or labeled as ‘typical’, ‘nominal’ or
‘approximate’.
Measurement uncertainties information can be found
in, Fundamentals of RF and Microwave Power
Measurements - Application Note 64-1, literature number 5965-6630E.
Compatibility, the EPM-P series power meters operate
with the E-series E9320 family of power sensors for
peak, average and time-gated power measurements. The
EPM-P series also operates with the existing 8480
series, E-series CW and the E9300 range of power
sensors for average power measurements. For specifications pertaining to the 8480 and E-series CW and
E9300 power sensors, please refer to the, EPM Series
Power Meters E-Series and 8480 Series Power
Sensors, Technical Specifications, literature number
5965-6382E.
Measurement modes, the EPM-P series power meters
have two measurement modes:
1. Normal mode (default mode using E9320 sensors)
for peak, average and time-related measurements,
and
2. Average only mode. This mode is primarily for
average power measurements on low-level signals,
when using E9320 sensors, and is the mode used
with 8480 series sensors, E-series CW sensors and
E-series E9300 sensors.
Frequency range: 9 kHz to 110 GHz,
sensor dependent
Power range: -70 to +44 dBm,
sensor dependent
Single sensor dynamic range
E-series E9320 peak and average power sensors:
70 dB maximum (normal mode);
85 dB maximum (average only mode)
E-series CW power sensors: 90 dB
E-series E9300 average power sensors:
80 dB maximum
8480 series sensors: 50 dB maximum
Display units
Absolute: Watts or dBm
Relative: Percent or dB
Display resolution: Selectable resolution of 1.0,
0.1, 0.01, 0.001 dB in loga
rithmic mode, or 1 to 4 sig
nificant digits in linear mode.
Offset range: ±100 dB in 0.001 dB incre
ments, to compensate for
external loss or gain
Video bandwidth: 5 MHz (set by meter and is
sensor dependent)
Note that the video bandwidth represents the ability of
the power sensor and meter to follow the power envelope of the input signal. The power envelope of the
input signal is, in some cases, determined by the signal's modulation bandwidth, and hence video bandwidth is sometimes referred to as modulation bandwidth.
Video bandwidth/
dynamic range optimization
The power measurement system, comprising the sensor
and meter, has its maximum video bandwidth defined
by the E9320 sensor. To optimize the system’s dynamic
range for peak power measurements, the video band-
width in the meter can be set to High, Medium and
Low, as detailed in the following table. The filter video
bandwidths stated i n the table are not the 3 dB bandwidths as the video bandwidths are corrected for optimal flatness. Refer to figures 6 to 8 for information on
the sensor’s peak flatness response. A filter OFF mode
is also provided.
Table 1. Video bandwidth versus peak power dynamic range
Sensor model Video bandwidth/maximum peak power dynamic range
OFF High Medium Low
E9321A 300 kHz/ 300 kHz/ 100 kHz/ 30 kHz/
E9325A -40 dBm to +20 dBm -42 dBm to +20 dBm -43 dBm to +20 dBm -45 dBm to +20 dBm
E9322A 1.5 MHz/ 1.5 MHz/ 300 kHz/ 100 kHz/
E9326A -36 dBm to +20 dBm -37 dBm to +20 dBm -38 dBm to +20 dBm -39 dBm to +20 dBm
E9323A 5 MHz/ 5 MHz/ 1.5 MHz/ 300 kHz/
E9327A -32 dBm to +20 dBm -32 dBm to +20 dBm -34 dBm to +20 dBm -36 dBm to +20 dBm

3
Accuracy
Instrumentation
Please add the corresponding power sensor linearity
percentage; see Tables 6a and 6b for the E9320 sensors.
Average only mode:
Absolute
Logarithmic: ±0.02 dB
Linear: ±0.5%
Relative Logarithmic: ±0.04 dB
Linear: ±1.0%
Normal mode:
Time Base Accuracy 0.01%
1 mW power reference
Power output: 1.00 mW (0.0 dBm).
Factory
set to ±0.4% traceable to the
National Physical Laboratories
(NPL), UK
2
Accuracy: For two years
±0.5% (23 ± 3 °C)
±0.6% (25 ± 10 °C)
±0.9% (0 to 55 °C)
Frequency: 50 MHz nominal
SWR: 1.06 maximum (1.08 maximum
for Option E41xA-003)
Connector type: Type N (f), 50 ohms
Measurement characteristics:
Measurements: Average power
Peak power
Peak-to- average ratio
Measurements between two
time offsets (time-gating)
Averaging: Averaging over 1 to 1024 read-
ings is available for reducing noise
Measurement speed (GPIB)
Over the GPIB, three measurement speeds are available
(normal, x 2 and fast). The typical maximum speed is
shown in the table below.
Table 2. Measurement speed for different sensor types
Channel functions A, B, A/B, B/A, A-B, B-A and
Relative
Storage registers 10 instrument states can be
saved via the Save/Recall
menu.
Predefined setups
For common wireless standards (GSM900, EDGE, NADC,
iDEN, Bluetooth, IS-95 CDMA, W-CDMA and
cdma2000), predefined setups are provided.
Calibration temperature1Temperature
±5 °C 0 to 55 °C
Absolute accuracy (log) ±0.04 dB ±0.08 dB
Absolute accuracy (linear) ±0.8% ±1.7%
Relative accuracy (log) ±0.08 dB ±0.16 dB
Relative accuracy (linear) ±1.6% ±3.4%
1. Power meter is within ±5 °C of its calibration temperature.
2. National metrology institutes of member states of the Metre Convention, such as the
National Institute of Standards and Technology in the USA, are signatories to the
ComitÈ International des Poids et Mesures Mutual Recognition Arrangement. Further
information is available from the Bureau International des Poids et Mesures, at
http://www.bipm.fr/
3. Fast speed is not available for 8480 series sensors.
4. Maximum measurement speed is obtained by using binary output in free run trigger.
5. For E9320 sensors, maximum speed is achieved using binary output in free run
acquisition.
Sensor type Measurement speed
(readings/second)
Normal x 2 Fast
3,4
E-Series E9320 Average only mode 20 40 400
peak and average
sensors Normal mode
5
20 40 1000
E-Series CW and E9300 average power 20 40 400
sensors
8480 Series sensors 20 40 N.A.

4
Trigger
Sources: Internal, External TTL,
GPIB, RS232/422,
Time resolution: 50 ns
Delay range: ±1.0 s
Delay resolution: 50 ns for delays < ±50 ms;
otherwise 200 ns
Hold-off:
Range: 1 us to 400 ms
Resolution: 1% of selected value
(minmum of 100 ns)
Internal trigger:
Range: -20 to +20 dBm
Level accuracy: ±0.5 dB
Resolution: 0.1 dB
Latency: 500 ns ± 100 ns
Latency is defined as the delay between the applied
RF crossing the trigger level and the meter switching
into the triggered state.
External trigger range: High > 2.0 V, Low < 0.8 V;
BNC connector; rising or falling edge triggered; input
impedance > 1 kW.
Trigger out: Output provides TTL compatible levels
(high > 2.4 V, low < 0.4 V) and uses a BNC connec-
tor
Sampling characteristics
Sampling rate: 20 Msamples/second
Sampling technique: Continuous sampling
Rear panel inputs/outputs
Recorder output(s): Analog 0 to 1 V, 1 kW output
impedance, BNC connector. Two outputs are available
on E4417A (channels A and B).
Remote input/output:
TTL output: used to signal when mea
surement has exceeded a
defined limit.
TTL input: initiates zero and calibration
cycle.
Connector type: RJ-45 series shielded modu
lar jack assembly.
TTL output: high = 4.8 V max;
low = 0.2 V max.
TTL input: high = 3.5 V min, 5 V max;
low = 1 V max, -0.3 V min.
RS-232/422 interface: Serial interface for commu-
nication with an external controller. Male plug 9-pin
D-subminiature connector.
Trigger in: Accepts a TTL signal for initiating mea-
surements, BNC connector.
Trigger out: Outputs a TTL signal for synchronizing
with external equipment, BNC connector.
Ground: Binding post accepts 4 mm plug or bare
wire connection
Line power
Input voltage range 85 to 264 Vac,
automatic selection
Input frequency range 47 to 440 Hz
Power requirement approximately 50 VA
(14 Watts)
Remote programming
Interface: GPIB interface operates to IEEE 488.2
and IEC-625. RS-232 and RS-422 serial interfaces
supplied as standard
Command language: SCPI standard interface
commands
GPIB compatibility: SH1, AH1, T6, TE0, L4, LE0,
SR1, RL1, PP1, DC1, DT1, C0.
Environmental specifications
Operating environment
Temperature 0° to 55 °C
Maximum humidity 95% at 40 °C,
(non-condensing)
Minimum humidity 15% at 40 °C
Maximum altitude 3,000 meters
(9,840 feet)
Storage conditions:
Storage temperature -20 to +70°C
Non-operating maximum
humidity: 90% at 65 °C
(non-condensing)
Non-operating maximum
altitude: 15,420 meters
(50,000 feet)
Regulatory information
Electromagnetic compatibility: This product
conforms with the protection requirements of
European Council Directive 89/336/EEC for
Electromagnetic Compatibility (EMC). The conformity
assessment requirements have been met using the
technical Construction file route to compliance, using
EMC test specifications EN 55011:1991 (Group 1,
Class A) and EN 50082-1:1992. In order to preserve
the EMC performance of the product, any cable
which becomes worn or damaged must be replaced
with the same type and specification.
Product safety: This product conforms to the
requirements of European Council Directive
73/23/EEC, and meets the following safety standards:
IEC 61010-1(1990) + A1 (1992) + A2 (1995) /
EN 61010-1 (1993)
IEC 825-1 (1993) / EN 60825-1 (1994)
Canada / CSA C22.2 No. 1010.1-93

5
Physical specifications
Dimensions: The following dimensions exclude front
and rear panel protrusions: 212.6 mm W x 88.5 mm
H x 348.3 mm D (8.5 in x 3.5 in x 13.7 in)
Weight
Net:
E4416A: 4.0 kg (8.8 lbs) approximate
E4417A: 4.1 kg (9.0 lbs) approximate
Shipping:
E4416A: 7.9 kg (17.4 lbs) approximate
E4417A: 8.0 kg (17.6 lbs) approximate
Ordering information
Accessories supplied
Power sensor cable
E9288A 1.5 meter (5 ft). One per E4416A, two
per E4417A
Power cord
One 2.4 meter (7.5 ft) cable. Power plug matches
destination requirements.
ANSI/NCSL Z540-1-1994 certificate of calibration
supplied as standard.
Installation guide
Users Guide and Programming Guide (CD-ROM format)
Power meter options
Connectors
E441xA-002 Parallel rear panel sensor input
connector(s) and front panel reference
calibrator connector
E441xA-003 Parallel rear panel sensor input
connector(s) and rear panel reference
calibrator connector
Calibration documentation
E441xA-A6J ANSI Z540 compliant calibration test
data including measurement uncertain
ties
Documentation
A hard copy of the Installation Guide and CD1 of the
English language User’s Guide and Programming
Guide is provided with the EPM-P power meter as
standard. A selection can be made to delete the hard
copy.
E441xA-0B0 Delete manual set
Additional documentation
Selections can be made for the localization of the
User’s Guide, an English language Programming Guide
and Service Manual.
E441xA-0B3 English language Service Manual
E441xA-0BK English language manual set (hardcopy
User’s Guide and English Programming
Guide)
E441xA-ABD German localization (hard copy User’s
Guide and English Programming Guide)
E441xA-ABE Spanish localization (hard copy User’s
Guide and English Programming Guide)
E441xA-ABF French localization (hard copy User’s
Guide and English Programming Guide)
E441xA-ABJ Japanese localization (hard copy User’s
Guide and English Programming Guide)
E441xA-ABZ Italian localization (hard copy User’s
Guide and English Programming Guide)
Power sensor cables
E441xA-004 Delete p ower sensor cable
For operation with the E9320 power sensors:
E9288A Power sensor cable, length 5 ft (1.5 m)
E9288B Power sensor cable, length 10 ft (3 m)
E9288C Power sensor cable, length 31 ft (10 m)
Note: The E9288A, B, and C sensor cables will also
operate with 8480 and E-series power sensors.
For operation with 8480, E-series CW and E9300
power sensors:
11730A Power sensor and SNS noise sourc e
cable, length 5 ft (1.5 m)
11730B Power sensor and SNS noise source
cable, length 10 ft (3 m)
11730C Power sensor and SNS noise source
cable, length 20 ft (6.1 m)
11730D Power sensor cable, length 50 ft (15.2
m)
11730E Power sensor cable, length 100 ft (30.5
m)
11730F Power sensor cable, length 200 ft (61.0
m)
Other sensor cable lengths can be supplied on request.
Accessories
E441xA-908 Rack mount kit (one instrument)
E441xA-909 Rack mount kit (two instruments)
34131A Transit case for half-rack 2U high instru-
ments
34141A Yellow soft carr y / operating case
34161A Accessory pouch
Service options
Warranty
Included with each EPM-P series power meter is a
standard 36-month, return- to- Agilent warranty and
service plan. For warranty and service of 5 years,
please order 60 months of R-51B.
1. CD includes EPM-P analyzer software.

6
R-51B Return- to-Agilent warranty and service
plan
Calibration
1
For 3 years, order 36 months of the appropriate calibration plan shown below. For 5 years, specify 60
months.
R-50C-001 Standard calibration plan
R-50C-002 Standard compliant calibration plan
E-series E9320 power sensor
specifications
The E9320 peak and average power sensors are
designed for use with the EPM-P series power
meters. The E9320 sensors have two measurement
modes:
Normal mode (default mode for E9320 sensors) for
peak, average and time-related measurements
Average only mode is designed primarily for average
power measurements on low-level signals. This mode
is the only mode used with 8480 series sensors, E
series CW sensors and E-series E9300 sensors.
The following specifications are valid after zero and
calibration of the power meter.
Note: E9320 power sensors MUST be used with an
E9288A, B or C cable.
Table 3. Sensor specifications
Sensor
model
E9321A
E9325A
E9322A
E9326A
E9323A
E9327A
Video
bandwidth
300 kHz
1.5 MHz
5 MHz
Frequency range
50 MHz to 6 GHz
50 MHz to 18 GHz
50 MHz to 6 GHz
50 MHz to 18 GHz
50 MHz to 6 GHz
50 MHz to 18 GHz
Power range
Average only mode Normal mode
2
-65 dBm to +20 dBm -50 dBm to +20 dBm
-60 dBm to +20 dBm -45 dBm to +20 dBm
-60 dBm to +20 dBm -40 dBm to +20 dBm
Maximum power
+23 dBm average;
+30 dBm peak
(< 10 msec duration)
Connector
type
Type N (m)
1. Options not available in all countries.
2. For average power measurements, free run acquisition.

7
The E9320 power sensors have two measurement
ranges (lower and upper) as detailed in Table 4.
Table 4. Lower and upper measurement ranges
Lower range
(min. power)
Lower range
(max. power)
Lower to upper
auto range point
Upper to lower
auto range point
Upper range
(min. power)
Upper range
(max. power)
E9321A/E9325A
Normal Average only
-50 dBm -65 dBm
+0.5 dBm -17.5 dBm
1
-9.5 dBm -18.5 dBm
-35 dBm -50 dBm
+20 dBm +20 dBm
1
E9322A/E9326A
Normal Average only
-45 dBm -60 dBm
-5 dBm -13.5 dBm
1
-15 dBm -14.5 dBm
-35 dBm -45 dBm
+20 dBm +20 dBm
1
E9323A/E9327A
Normal Average only
-40 dBm -60 dBm
-5 dBm -10.5 dBm
1
-15 dBm -11.5 dBm
-30 dBm -35 dBm
+20 dBm +20 dBm
1
1. Applies to CW and constant amplitude signals only above –20 dBm.
Table 5. Power sensor maximum SWR
Sensor model
E9321A,
E9325A
E9322A,
E9326A
E9323A,
E9327A
Maximum SWR (< = 0 dBm)
50 MHz to 2 GHz: 1.12
2 GHz to 10 GHz: 1.16
10 GHz to 16 GHz: 1.23
16 GHz to 18 GHz: 1.28
50 MHz to 2 GHz: 1.12
2 GHz to 12 GHz: 1.18
12 GHz to 16 GHz: 1.21
16 GHz to 18 GHz: 1.27
50 MHz to 2 GHz: 1.14
2 GHz to 16 GHz: 1.22
16 GHz to 18 GHz: 1.26
Figure 2. Typical SWR for the E9322A and E9326A sensors at various power
levels
Figure 1. Typical SWR for the E9321A and E9325A sensors at various power
levels
Figure 3. Typical SWR for the E9323A and E9327A sensors at various power
levels

8
Sensor linearity
If the sensor temperature changes after calibration, and
the meter and sensor is not re-calibrated, then the fol-
lowing additional linearity errors should be added to
the linearity figures in Tables 6a and 6b.
Figure 5 shows the typical uncertainty in making a
relative power measurement, using the same power
meter channel and the same power sensor to obtain
the reference and the measured values. It also assumes
that negligible change in frequency and mismatch error
occurs when transitioning from the power level used as
the reference to the power level measured.
Table 6a. Power sensor linearity, normal mode
(upper and lower range).
Sensor model Temperature Temperature
( 25 ± 10 °C) (0 to 55 °C)
E9321A and E9325A ±4.2% ±5.0%
E9322A and E9326A ±4.2% ±5.0%
E9323A and E9327A ±4.2% ±5.5 %
Table 6b. Power sensor linearity, average only mode
(upper and lower range).
Sensor model Temperature Temperature
( 25 ± 10 °C) (0 to 55 °C)
E9321A and E9325A ±3.7% ±4.5%
E9322A and E9326A ±3.7% ±4.5%
E9323A and E9327A ±3.7% ±5.0 %
Table 6c. Additional linearity error (normal and average only modes).
Sensor model Temperature Temperature
( 25 ± 10 °C) (0 to 55 °C)
E9321A and E9325A ±1.0% ±1.0%
E9322A and E9326A ±1.0% ±1.5%
E9323A and E9327A ±1.0% ±2.0 %
Figure 4. Typical power linearity at 25 °C for the E9323A and
E9327A 5 MHz bandwidth sensors, after zero and calibration, with
associated measurement uncertainty.
Power range –30 to –20 to –10 to 0 to +10 to
–20 dBm –10 dBm 0 dBm +10 dBm +20 dBm
Measurement ±0.9% ±0.8% ±0.65% ±0.55% ±0.45%
uncertainty
Figure 5. Relative mode power measurement linearity with an
EPM-P series power meter, at 25 °C (typical).
+20 dBm
-60 dBm
-65 dBm
-60 dBm
-65 dBm
20 dBm
0 dBm
0 dBm
±
2 %
±
2 %
±
4.0 %
±
4.0 %
9
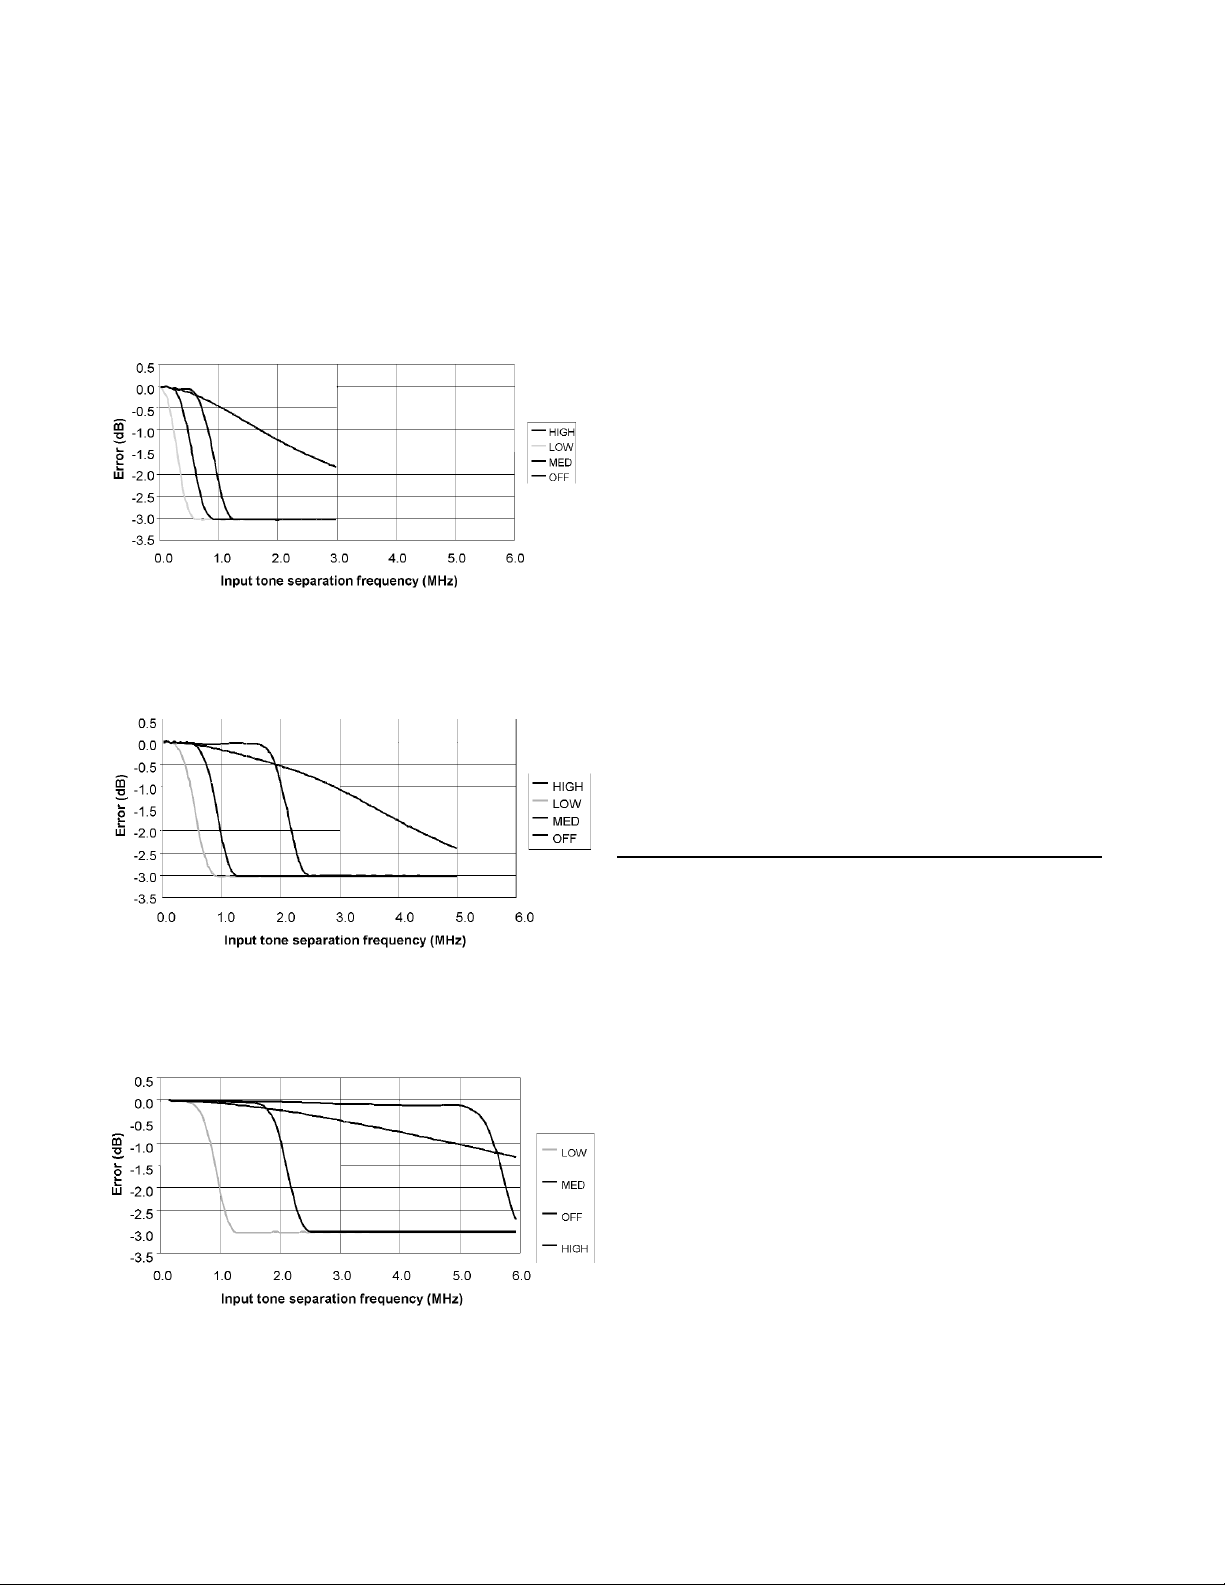
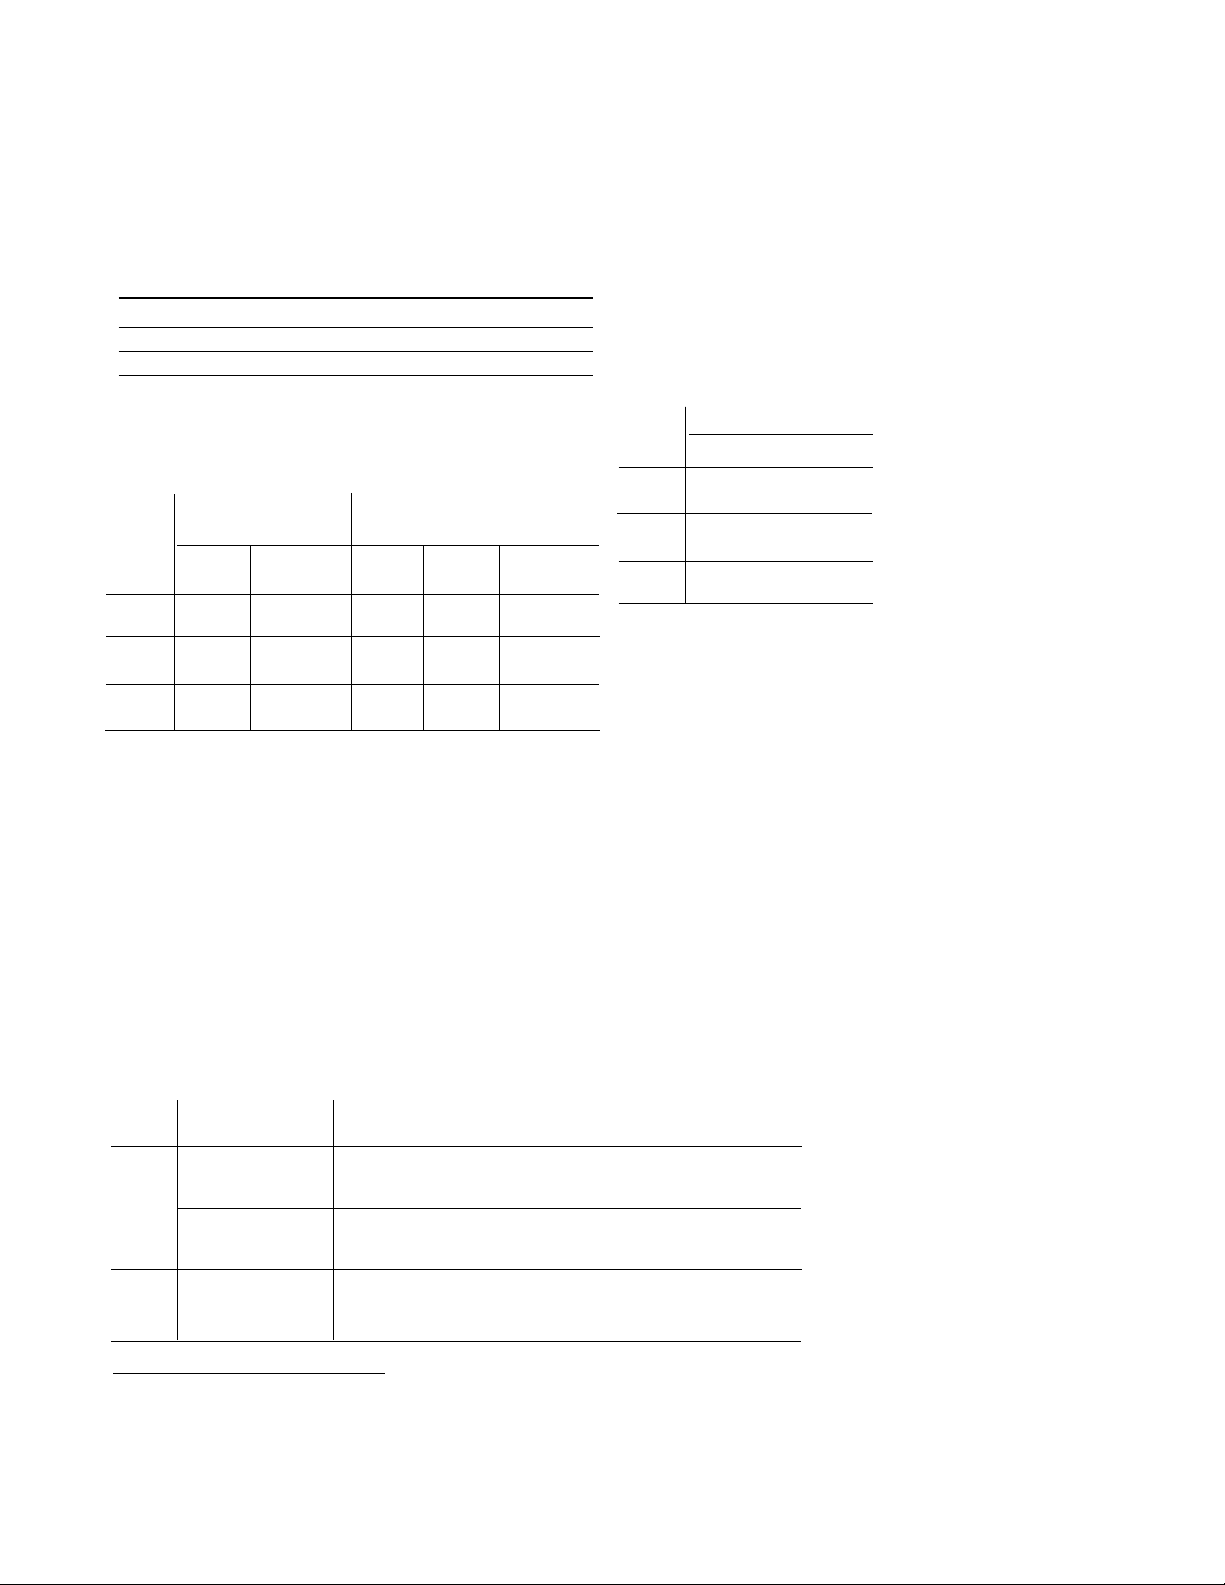
Peak flatness
The peak flatness is the flatness of a peak-to-average
ratio measurement for various tone-separations for an
equal magnitude two-tone RF input. Figures 6, 7 and 8
refer to the relative error in peak- to-average measurement as the tone separation is varied. The measurements were per- formed at –10 dBm average power
using an E9288A sensor cable (1.5 m).
Calibration Factor (CF) and
Reflection Coefficient (Rho)
Calibration Factor and Reflection Coefficient data are
provided at frequency intervals on a data sheet included with the power sensor. This data is unique to each
sensor. If you have more than one sensor, match the
serial number on the data sheet with the serial number of the power sensor you are using. The CF corrects for the frequency response of the sensor. The
EPM-P series power meter automatically reads the CF
data stored in the sensor and uses it to make corrections.
For power levels greate r than 0 dBm, add to the calibration factor uncertainty specification:
±0.1%/dB (for E9321A and E9325A sensors),
±0.15%/dB (for E9322A and E9326A sensors) and
±0.2%/dB (for E9323A and E9327A sensors).
Reflection Coefficient (Rho) relates to the SWR according to the formula:
SWR = (1 + Rho) / (1 – Rho)
Maximum uncertainties of the CF data are listed in
Table 7. The uncertainty analysis for the calibration of
the sensors was done in accordance with the ISO
Guide. The uncertainty data, reported on the calibration certificate, is the expanded uncertainty with a
95% confidence level and a coverage factor of 2.
Figure 6. E9321A and E9325A Error in peak-to-average measurements for a
two-tone input (high, medium, low and off filters).
Figure 7. E9322A and E9326A error in peak-to-average measurements for a
two-tone input (high, medium, low and off filters).
Figure 8. E9323A and E9327A error in peak-to-average measurements for a
two-tone input (high, medium, low and off filters).
Table 7. Calibration factor uncertainty at 0.1 mW (-10 dBm).
Frequency
50 MHz
100 MHz
300 MHz
500 MHz
800 MHz
1.0 GHz
1.2 GHz
1.5 GHz
2.0 GHz
3.0 GHz
4.0 GHz
5.0 GHz
6.0 GHz
7.0 GHz
8.0 GHz
9.0 GHz
10.0 GHz
11.0 GHz
12.0 GHz
12.4 GHz
13.0 GHz
14.0 GHz
15.0 GHz
16.0 GHz
17.0 GHz
18.0 GHz
Uncertainty (%)
(25 ±10°C)
Reference
±1.8
±1.8
±1.8
±1.8
±2.1
±2.1
±2.1
±2.1
±2.1
±2.1
±2.1
±2.1
±2.3
±2.3
±2.3
±2.3
±2.3
±2.3
±2.3
±2.3
±2.5
±2.5
±2.5
±2.5
±2.5
Uncertainty (%)
(0 to 55°C)
Reference
±2.0
±2.0
±2.0
±2.0
±2.3
±2.3
±2.3
±2.3
±2.3
±2.3
±2.3
±2.3
±2.5
±2.5
±2.5
±2.5
±2.5
±2.5
±2.5
±2.5
±2.8
±2.8
±2.8
±2.8
±2.8
Zero set
This specification applies to a ZERO performed when
the sensor input is not connected to the POWER REF.
Zero drift and measurement noise
Effect of averaging on noise: Averaging over 1 to
1024 readings is available for reducing noise. Table 9
provides the measurement noise for a particular sensor. Use the noise multipliers in Table 10, for the
appropriate speed (normal or x 2) or measurement
mode (normal or average only) and the number of
averages, to determine the total measurement noise
value.
In addition, for x 2 speed (in normal mode) the total
measurement noise should be multiplied by 1.2, and
for fast speed (in normal mode), the multiplier is 3.4.
Note that in fast speed, no additional averaging is
implemented.
Example:
E9321A power sensor, number of averages = 4, free
run acquisition, normal mode, x 2 speed.
Measurement noise calculation:
(< 6 nW x 0.88 x 1.2) = < 6.34 nW
Effect of video bandwidth setting: The noise per
sample is reduced by applying the meter video bandwidth reduction filter setting (High, Medium or Low).
If averaging is implemented, this will dominate any
effect of changing the video bandwidth.
Example:
E9322A power sensor, triggered acquisition, video
bandwidth = High.
Noise per sample calculation:
(< 180 nW x 0.80) = < 144 nW
Effect of time-gating on measurement noise
The measurement noise will depend on the time gate
length, over which measurements are made. Effectively
20 averages are carried out every 1 us of gate length.
Table 8. Zero set
Sensor model Zero set Zero set
(normal mode) (average only mode)
E9321A, E9325A 5 nW 0.17 nW
E9322A, E9326A 19 nW 0.5 nW
E9323A, E9327A 60 nW 0.6 nW
Table 9. Zero drift and measurement noise.
Sensor
model
E9321A
E9325A
E9322A
E9326A
E9323A
E9327A
Zero drift
1
Normal Average only
mode mode
< ±5 nW < ±60 pW
< ±5 nW < ±100 pW
< ±40 nW < ±100 pW
Measurement noise
2
Normal Normal Average only
mode
3
mode
4
mode
< 6 nW < 75 nW < 165 pW
< 12 nW < 180 nW < 330 pW
< 25 nW < 550 nW < 400 pW
1. Within 1 hour after zero set, at a constant temperature, after a 24 hour warm-up of the power meter.
2. Measured over a one-minute interval, at a constant temperature, two standard deviations, with averaging set to 1
(for normal mode), 16 (for average only mode, normal speed) and 32 (for average only mode, x 2 speed).
3. In free run acquisition mode.
4. Noise per sample, video bandwidth set to OFF with no averaging (i.e. averaging set to 1) - see the note “Effect of
Video Bandwidth Setting” and Table 11.
Table 10. Noise multipliers
Mode
Average
-only
Normal
Number of
averages
Noise multiplier
(normal speed)
Noise multiplier
(x 2 speed)
Noise multiplier
(normal speed;
free run acquisition)
1
5.5
6.5
1.0
2
3.89
4.6
0.94
4
2.75
3.25
0.88
8
1.94
2.3
0.82
16
1.0
1.63
0.76
32
0.85
1.0
0.70
64
0.61
0.72
0.64
128
0.49
0.57
0.58
256
0.34
0.41
0.52
512
0.24
0.29
0.46
1024
0.17
0.2
0.40
Table 11. Effect of video bandwidth on noise per sample.
Sensor
E9321A
E9325A
E9322A
E9326A
E9323A
E9327A
Low
0.32
0.50
0.40
Medium
0.50
0.63
0.63
High
0.63
0.80
1.0
Noise multipliers
10

11
Settling times
Average-only mode:
In normal and x 2 speed, manual filter, 10 dB decreasing power
step refer to Table 12.
In fast speed, within the range –50 to +20 dBm, for a 10 dB
decreasing power step, the settling time is 10 ms (for the E4416A)
and 20 ms (for the E4417A).
When a power step crosses the power sensor’s auto-range switch point,
add 25 ms.
Normal mode:
In normal, free run acquisition mode, within the range –20 to +20 dBm,
for a 10 dB decreasing power step, the settling time is dominated by
the measurement update rate and is listed in Table 13 for various filter settings.
In normal mode, measuring in continuous or single acquisition mode,
the performance of rise times, fall times and 99% settled results are shown
in Table 14. Rise time and fall time specifications are for a 0.0 dBm pulse,
with the rise time and fall time measured between 10% to 90% points and
upper range selected.
Overshoot in response to power steps with fast rise times, i.e. less than the
sensor rise time, is < 10%. When a power step crosses the power sensor’s
auto-range switch point, add 10 µs.
Table 12. Settling time (average only mode)
Number of average 1 2 4 8 16 32 64 128 256 512 1024
Settling time(s) normal 0.08 0.13 0.24 0.45 1.1 1.9 3.5 6.7 14 27 57
Settling time(s) x 2 0.07 0.09 0.15 0.24 0.45 1.1 1.9 3.5 6.7 14 27
Table 13. Settling time (normal mode)
Number of averages 1 2 4 8 16 32 64 128 256 512 1024
Settling time free run 0.1 0.15 0.25 0.45 0.9 1.7 3.3 6.5 13.0 25.8 51.5
acquisition, normal speed (s)
Settling time free run 0.08 0.1 0.15 0.25 0.45 0.9 1.7 3.3 6.5 13.0 25.8
acquisition, X2 speed (s)
Table 14. Rise and fall times versus sensor bandwidth
1
Sensor model Parameter Video bandwidth setting
Low Medium High Off
E9321A, Rise time (< µs) 2.6 1.5 0.9 0.3
E9325A Fall time (< µs) 2.7 1.5 0.9 0.5
Settling Time (rising) (< µs) 5.1 5.1 4.5 0.6
Settling Time (falling) (< µs) 5.1 5.1 4.5 0.9
E9322A, Rise time (< µs) 1.5 0.9 0.4 0.2
E9326A Fall time (< µs) 1.5 0.9 0.4 0.3
Settling Time (rising) (< µs) 5.3 4.5 3.5 0.5
Settling Time (falling) (< µs) 5.3 4.5 3.5 0.9
E9323A, Rise time (< µs) 0.9 0.4 0.2 0.2
E9327A Fall time (< µs) 0.9 0.4 0.2 0.2
Settling Time (rising) (< µs) 4.5 3.5 1.5 0.4
Settling Time (falling) (< µs) 4.5 3.5 2 0.4
1. Rise and fall time specifications are only valid when used with the E9288A sensor cable (1.5 meters).

Physical specifications
Dimensions: 150 mm L x 38 mm W x 30 mm H
(5.9 in x 1.5 in x 1.2 in)
Weight: Net: 0.2 kg (0.45 lbs)
Shipping: 0.55 kg (1.2 lbs)
Ordering information
E9321A 50 MHz to 6 GHz; 300 kHz BW
E9322A 50 MHz to 6 GHz; 1.5 MHz BW
E9323A 50 MHz to 6 GHz; 5 MHz BW
E9325A 50 MHz to 18 GHz; 300 kHz BW
E9326A 50 MHz to 18 GHz; 1.5 MHz BW
E9327A 50 MHz to 18 GHz; 5 MHz BW
Accessories supplied
Operating and Service Guide (multi-language)
ANSI/NCSL Z540-1-1994 Certificate of Calibration
supplied as standard
Power sensor options
E932xA-A6J Supplies ANSI/NCSL Z540-1-1994
test data including measurement
uncertainties
E932xA-0B1 Add manual set
12

www.agilent.com/find/emailupdates
Get the latest information on the products and
applications you select.
Agilent Email Updates
Agilent Direct
www.agilent.com/find/agilentdirect
Quickly choose and use your test equipment
solutions with confidence.
Agilent
Open
www.agilent.com/find/open
Agilent Open simplifies the process of
connecting and programming test systems
to help engineers design, validate and
manufacture electronic products. Agilent
offers open connectivity for a broad range
of system-ready instruments, open industry
software, PC-standard I/O and global support, which are combined to more easily
integrate test system development.
Remove all doubt
Our repair and calibration services will get
your equipment back to you, performing
like new, when promised. You will get
full value out of your Agilent equipment
throughout its lifetime. Your equipment will
be serviced by Agilent-trained technicians
using the latest factory calibration procedures, automated repair diagnostics and
genuine parts. You will always have the
utmost confidence in your measurements.
Agilent offers a wide range of additional
expert test and measurement services for
your equipment, including initial start-up
assistance onsite education and training,
as well as design, system integration, and
project management.
For more information on repair and
calibration services, go to
www.agilent.com/find/removealldoubt
www.agilent.com
For more information on Agilent
Technologies’ products, applications
or services, please contact your local
Agilent office. The complete list is
available at:
www.agilent.com/find/contactus
Phone or Fax
United States:
(tel) 800 829 4444
(fax) 800 829 4433
Canada:
(tel) 877 894 4414
(fax) 800 746 4866
China:
(tel) 800 810 0189
(fax) 800 820 2816
Europe:
(tel) 31 20 547 2111
Japan:
(tel) (81) 426 56 7832
(fax) (81) 426 56 7840
Korea:
(tel) (080) 769 0800
(fax) (080) 769 0900
Latin America:
(tel) (305) 269 7500
Taiwan:
(tel) 0800 047 866
(fax) 0800 286 331
Other Asia Pacific Countries:
(tel) (65) 6375 8100
(fax) (65) 6755 0042
Email: tm_ap@agilent.com
Product specifications and descriptions
in this document subject to change
without notice.
© Agilent Technologies, Inc.2002 – 2007
Printed in USA, February 7, 2007
5980-1469E
is the US registered trademark
of the LXI Consortium.
 Loading...