

Page 1

Agilent EPM-P Series
Peak and Average
Power Meters
User’s Guide
Agilent Technologies
Page 2

Notices
CAUTION
WARNING
© Agilent Technologies, Inc. 2000, 2001-2008
No p art o f this manual may b e rep roduc ed in
any form or by any means (including electronic storage and retrieval or translation
into a foreign language) without prior agreement and written consent from Agilent
Technologies, Inc. as governed by United
States and international copyright laws.
Manual Part Number
E4416-90023
Edition
Third Edition, June 06, 2008
Printed in Malaysia
Agilent Technologies, Inc.
3501 Stevens Creek Blvd.
Santa Clara, CA 95052 USA
Notices
Warranty
The material contained in this document is provided “as is,” and is subject to being changed, without notice,
in future editions. Further, to the maximum extent permitted by applicable
law, Agilent disclaims all warranties,
either express or implied, with regard
to this manual and any information
contained herein, including but not
limited to the implied warranties of
merchantability and fitness for a particular purpose. Agilent shall not be
liable for errors or for incidental or
consequential damages in connection with the furnishing, use, or performance of this document or of any
information contained herein. Should
Agilent and the user have a separate
written agreement with warranty
terms covering the material in this
document that conflict with these
terms, the warranty terms in the separate agreement shall control.
Technology Licenses
The hardware and/or software described in
this document are furnished under a license
and may be used or copied only in accordance with the terms of such license.
Restricted Rights Legend
U.S. Government Restricted Rights. Software and technical data rights granted to
the federal government include only those
rights customarily provided to end user customers. Agilent provides this customary
commercial license in Software and technical data pursuant to FAR 12.211 (Technical
Data) and 12.212 (Computer Software) and,
for the Department of Defense, DFARS
252.227-7015 (Technical Data - Commercial
Items) and DFARS 227.7202-3 (Rights in
Commercial Computer Software or Computer Software Documentation).
Safety Notices
A CAUTION notice denotes a haz-
ard. It calls attention to an operating procedure, practice, or the like
that, if not correctly performed or
adhered to, could result in damage
to the product or loss of important
data. Do not proceed beyond a
CAUTION notice until the indicated
conditions are fully understood and
met.
A WARNING notice denotes a
hazard. It calls attention to an
operating procedure, practice, or
the like that, if not correctly performed or adhered to, could result
in personal injury or death. Do not
proceed beyond a WARNING
notice until the indicated conditions are fully understood and
met.
ii EPM-P Series Peak and Average Power Meters User’s Guide
Page 3

Certification
Warranty
Agilent Technologies certifies that this product met its published
specifications at the time of shipment from the factory. Agilent
Technologies further certifies that its calibration measurements are
traceable to the United States National Institute of Standards and
Technology, to the extent allowed by the Institute’s calibration facility, and
to the calibration facilities of other International Standards Organization
members.
This Agilent Technologies instrument product is warranted against defects
in material and workmanship for a period of one year from date of
shipment. During the warranty period, Agilent Technologies will at its
option, either repair or replace products which prove to be defective. For
warranty service or repair, this product must be returned to a service
facility designated by Agilent Technologies. Buyer shall prepay shipping
charges to Agilent Technologies and Agilent Technologies shall pay
shipping charges, duties, and taxes for products returned to Aglent
Technologies from another country. Agilent Technologies warrants that its
software and firmware designated by Agilent Technologies for use with an
instrument will execute its programming instructions when properly
installed on that instrument. Agilent Technologies does not warrant that
the operation of the instrument, or firmware will be uninterrupted or error
free.
Limitation of Warranty
The foregoing warranty shall not apply to defects resulting from improper
or inadequate maintenance by Buyer, Buyer-supplied software or
interfacing, unauthorized modification or misuse, operation outside of the
environmental specifications for the product, or improper site preparation
or maintenance. NO OTHER WARRANTY IS EXPRESSED OR IMPLIED.
AGILENT TECHNOLOGIES SPECIFICALLY DISCLAIMS THE IMPLIED
WARRANTIES OF MERCHANTABILITY AND FITNESS FOR A PARTICULAR
PURPOSE.
EPM-P Series Peak and Average Power Meters User’s Guide iii
Page 4

Exclusive Remedies
WARNING
CAUTION
Warnings and Cautions
THE REMEDIES PROVIDED HEREIN ARE BUYER’S SOLE AND EXCLUSIVE
REMEDIES. AGILENT TECHNOLOGIES SHALL NOT BE LIABLE FOR ANY
DIRECT, INDIRECT, SPECIAL, INCIDENTAL, OR CONSEQUENTIAL
DAMAGES, WHETHER BASED ON CONTRACT, TORT, OR ANY OTHER
LEGAL THEORY.
This guide uses warnings and cautions to denote hazards.
A warning calls attention to a procedure, practice or the like, which, if
not correctly performed or adhered to, could result in injury or the loss of
life. Do not proceed beyond a warning until the indicated conditions are
fully understood and met.
A caution calls attention to a procedure, practice or the like which, if not
correctly performed or adhered to, could result in damage to or the
destruction of part or all of the equipment. Do not proceed beyond a
caution until the indicated conditions are fully understood and met.
iv EPM-P Series Peak and Average Power Meters User’s Guide
Page 5

Safety Symbols
The following symbol on the instrument and in the documentation
indicates precautions that must be taken to maintain safe operation of the
instrument.
Caution, risk of danger.
The Instruction Documentation Symbol. The product is marked with this
symbol when it is necessary for the user to refer to the instructions in the
supplied documentation.
Alternating current (AC).
This symbol indicates the operating switch for ‘Stand-by’ mode. Note, the
instrument is NOT isolated from the mains when the switch is pressed.
To isolate the instrument, the mains coupler (mains input cord) should be
removed from the power supply.
This symbol indicates the operating switch for ‘On’ mode.
EPM-P Series Peak and Average Power Meters User’s Guide v
Page 6

General Safety Considerations
The following general safety precautions must be observed during all
phases of operation, service, and repair of this instrument. Failure to
comply with these precautions or with specific warnings elsewhere in this
manual violates safety standards of design, manufacture, and intended
use of the instrument. Agilent Technologies assumes no liability for the
customer’s failure to comply with these requirements.
vi EPM-P Series Peak and Average Power Meters User’s Guide
Page 7

WARNING
This is a Safety Class I instrument (provided with a protective earthing
ground, incorporated in the power cord). The mains plug shall only be
inserted in a socket outlet provided with a protective earth contact. Any
interruption of the protective conductor inside or outside of the
instrument is likely to make the instrument dangerous. Intentional
interruption is prohibited.
• DO NOT operate the product in an explosive atmosphere or in the
presence of flammable gasses or fumes.
• DO NOT use repaired fuses or short-circuited fuseholders: For
continued protection against fire, replace the line fuse(s) only with
fuse(s) of the same voltage and current rating and type.
• DO NOT perform procedures involving cover or shield removal unless
you are qualified to do so: Operating personnel must not remove
equipment covers or shields. Procedures involving the removal of
covers and shields are for use by service-trained personnel only.
• DO NOT service or adjust alone: Under certain conditions, dangerous
voltages may exist even with the equipment switched off. To avoid
dangerous electrical shock, service personnel must not attempt
internal service or adjustment unless another person, capable of
rendering first aid and resuscitation, is present.
• DO NOT operate damaged equipment: Whenever it is possible that
the safety protection features built into this product have been
impaired, either through physical damage, excessive moisture, or
any other reason, REMOVE POWER and do not use the product until
safe operation can be verified by service-trained personnel. If
necessary, return the product to a Agilent Sales and Service Office
for service and repair to ensure the safety features are maintained.
• DO NOT substitute parts or modify equipment: Because of the danger
of introducing additional hazards, do not install substitute parts or
perform any unauthorized modification to the product. Return the
product to a Agilent Sales and Service Office for service and repair to
ensure the safety features are maintained.
EPM-P Series Peak and Average Power Meters User’s Guide vii
Page 8

viii EPM-P Series Peak and Average Power Meters User’s Guide
Page 9

Contents
Notices ii
Certification iii
Warranty iii
Limitation of Warranty iii
Exclusive Remedies iv
Warnings and Cautions iv
Safety Symbols v
General Safety Considerations vi
1 Introduction
Welcome 2
Conventions Used in this Guide 4
Power Meter and Sensor Capability 5
1 Not applicable for N8480 Series power sensors with Option CFT 5
Front Panel Keys and Connections 6
The Display Layout 10
Window Symbols 17
Confirmation Pop-Up 17
Wait Symbol 18
One of Many Entry Pop-Up 18
Configuration Conflict Pop-Up 18
Numeric or Alphanumeric Entry Pop-Up 19
2 General Power Meter Functions
Zeroing and Calibrating 22
Zeroing 22
Calibration 23
Calibration with E-Series Power Sensors and N8480 Series Power Sensors (Excluding Option
CFT) 24
Calibration with 8480 Series Power Sensors and N8480 Series Power Sensors with Option
CFT 25
Zero/Cal Lockout 29
Zeroing and Calibrating Using TTL Inputs 30
Setting the Units of Measurement 34
Selecting Units of Measurement from the Softkeys 35
EPM-P Series Peak and Average Power Meters User’s Guide ix
Page 10

Setting the Resolution 36
Making Relative Measurements 37
Setting Offsets 39
Setting Channel Offsets 39
Setting Display Offsets 41
Setting Frequency Dependent Offsets 43
Setting Averaging 49
Step Detection 51
Setting Measurement Limits 52
Setting Limits 53
Checking for Limit Failures 57
Setting the Range 59
Scaling the Analog Display 60
Recorder Output 62
Saving and Recalling Power Meter Configurations 65
Measuring Pulsed Signals 67
Presetting the Power Meter 70
Preset Conditions 70
3 Using E9320 E-Series Power Sensors
Introduction 76
Power Meter Configuration 78
Default Channel Setup 78
Measurement Method 79
Measurement Display 80
Configuring a Peak Power Measurement 82
The Set Up Process 83
Setting Up Using Data Entry 83
Setting Up Using Trace Markers 103
Measurement Example 109
Using Preinstalled Measurement Setups 114
Measuring GSM 115
Measuring EDGE 118
Measuring NADC 121
Measuring iDEN 125
Measuring Bluetooth 128
x EPM-P Series Peak and Average Power Meters User’s Guide
Page 11

Measuring cdmaOne 132
Measuring W-CDMA 135
Measuring cdma2000 138
4 Using E9300 E-Series Power Sensors
Introduction 142
Power Meter Configuration 143
Default Channel Setup 144
Measurement Accuracy 145
Measuring Spread Spectrum and Multitone Signals 147
CDMA Signal Measurements 148
Multitone Signal Measurements 149
Measuring TDMA Signals 150
Power Meter and Sensor Operation 150
Achieving Stable Results with TDMA Signals 150
Achieving Stable Results with GSM Signals 151
Electromagnetic Compatibility (EMC) Measurements 152
Measurement Accuracy and Speed 153
Setting the Range 153
Measurement Considerations 154
5 Using E4410 E-Series Power Sensors
Introduction 158
Power Meter Configuration 159
Default Channel Setup 160
Measurement Accuracy 161
6 Using 8480 Series Power Sensors
Introduction 164
Power Meter Configuration 165
Default Channel Setup 165
Measurement Accuracy 167
Frequency Specific Calibration Factors 168
Sensor Calibration Tables 174
Editing/Generating Sensor Calibration Tables 178
Preinstalled Calibration Table Contents 182
7 Using N8480 Series Power Sensors
Introduction 186
EPM-P Series Peak and Average Power Meters User’s Guide xi
Page 12

Power Meter Configuration 187
Default Channel Setup 188
Measurement Accuracy 189
N8480 Series Power Sensors (excluding Option CFT) 189
N8480 Series Power Sensors with Option CFT 191
Frequency Specific Calibration Factors 192
Sensor Calibration Tables 195
Editing/Generating Sensor Calibration Tables 199
8 Maintenance
Self Test 204
Power On Self Test 204
Front Panel Selection of Self Tests 205
Remote Testing 207
Tes t D es c ri p ti o n s 208
Error Messages 211
Introduction 211
Error Message List 213
Operator Maintenance 222
Replacing the Power Line Fuse 222
Contacting Agilent Technologies 224
Before calling Agilent Technologies 224
Check the Basics 224
Instrument serial numbers 225
Sales and Service Offices 227
Returning Your Power Meter for Service 228
9 Specifications and Characteristics
Introduction 230
Power Meter Specifications 231
Video Bandwidth/ Dynamic Range Optimization 232
Accuracy 233
1 mW Power Reference 234
Measurement Characteristics 235
Sampling Characteristics 237
Rear Panel Inputs/Outputs 237
Remote Programming 238
xii EPM-P Series Peak and Average Power Meters User’s Guide
Page 13

Physical Specifications 238
Environmental Specifications 239
Operating Environment 239
Storage Conditions 239
Regulatory Information 240
Electromagnetic Compatibility 240
Product Safety 240
EPM-P Series Peak and Average Power Meters User’s Guide xiii
Page 14

Figures
Figure 2-1 Reference Calibration Factor Pop-Up Window 25
Figure 2-2 Rmt I/O Port TTL Inputs 30
Figure 2-3 Rel Indicator 37
Figure 2-4 Simplified Measurement Path 39
Figure 2-5 Offset Applied 40
Figure 2-6 Offset Applied 40
Figure 2-7 Offset applied 42
Figure 2-8 Offset Tables 44
Figure 2-9 Frequency Dependent Offset Table Selected 45
Figure 2-10Frequency Dependent Offset Configured 45
Figure 2-11 “Edit Offset” Screen with Some Added Data 47
Figure 2-12 Averaged Readings 49
Figure 2-13 Filter Length Pop-Up 50
Figure 2-14 Limits Checking Application 52
Figure 2-15 Limits Checking Results 53
Figure 2-16 Setting Maximum Limit 54
Figure 2-17 Remote I/O TTL Outputs 55
Figure 2-18 TTL Output Pop-up 56
Figure 2-19 Example of TTL Disconnect Warning Message 56
Figure 2-20 TTL Limits Pop-Up 57
Figure 2-21 Limit Failures 58
Figure 2-22 Channel Setup - Range 59
Figure 2-23 Analog Display in Lower Window 60
xiv EPM-P Series Peak and Average Power Meters User’s Guide
Page 15

Figure 2-24 Meter Maximum Pop-Up 60
Figure 2-25 Meter Minimum Pop-Up 61
Figure 2-26 Recorder Maximum Pop-Up 63
Figure 2-27 Recorder Minimum Pop-Up 63
Figure 2-28 Save/Recall Screen 65
Figure 2-29 “Save” Pop-Up 66
Figure 2-30 “Recall” Pop-Up 66
Figure 2-31 Pulsed Signal 68
Figure 2-32 Duty Cycle: Off 68
Figure 2-33 Duty Cycle Pop-Up 69
Figure 2-34 Duty Cycle: On, 50% 69
Figure 3-1 E-Series E9320 Power Sensor Default Channel Setup 78
Figure 3-2 Measurement Gates 79
Figure 3-3 Twelve Measurements per Channel 80
Figure 3-4 E-Series E9320 Power Sensor Default Channel Setup 84
Figure 3-5 Bandwidth Filter Shapes 87
Figure 3-6 Gates screen 88
Figure 3-7 Time Gating Start Pop-Up 88
Figure 3-9 Trigger Menu - Free Run Mode 90
Figure 3-10 Trigger Setting Menu 1 of 2 91
Figure 3-11 Trigger Level Pop-Up 92
Figure 3-12 Trigger Delay Pop-Up 93
Figure 3-13 Trigger Setting Menu 2 of 2 93
Figure 3-14 Trigger Holdoff Pop-Up 94
Figure 3-15 Trigger Hysteresis Pop-Up 95
Figure 3-16 Display Type Menu 96
EPM-P Series Peak and Average Power Meters User’s Guide xv
Page 16

Figure 3-17 Lower Window/Lower Measurement Setup 98
Figure 3-18 Measurement Set-Up Example 99
Figure 3-19 Measurement Example Display 99
Figure 3-20 Analog Display in Lower Window 100
Figure 3-21 Meter Maximum Pop-Up 100
Figure 3-22 Meter Minimum Pop-Up 101
Figure 3-23 Tra c e Di s play i n L o we r W in d ow 102
Figure 3-24 Tra c e M a x im u m P o p -Up 102
Figure 3-25 Gate Control Menu and Display 103
Figure 3-26 E-Series E9320 Power Sensor Default Channel Setup 104
Figure 3-27 Trigger Menu - Free Run Mode 105
Figure 3-28 Gate Control Menu and Display 105
Figure 3-29 Trigger Marker - Negative Delay 106
Figure 3-30 Tra c e Co n tro l Dis p lay 107
Figure 3-31 Bluetooth Signal with Markers Shown 108
Figure 3-32 Measurement Example Measurement Display 113
Figure 3-33 Preset Selection Display 114
Figure 3-34 GSM Measurement Display 115
Figure 3-35 EDGE Measurement Display 118
Figure 3-36 Full Rate Frame 121
Figure 3-37 NADC Measurement Display 122
Figure 3-38 Bluetooth Measurement Display 128
Figure 3-39 Markers on a Bluetooth Measurement 131
Figure 3-40 cdmaOne Measurement Display 132
Figure 3-41 W-CDMA Measurement Display 135
Figure 3-42 Typical cdma2000 Measurement Display 138
xvi EPM-P Series Peak and Average Power Meters User’s Guide
Page 17

Figure 4-1 E9300 E-Series Auto-Averaging Settings 143
Figure 4-2 E9300 E-Series Sensor Default Channel Setup 144
Figure 4-3 Frequency Pop-Up Window 146
Figure 4-4 Spread Spectrum Signal 147
Figure 4-5 Wideband CDMA Error of E-Series E9300 power sensor versus corrected CW
sensor. 148
Figure 4-6 CDMA (IS-95A): 9Ch Fwd 148
Figure 4-7 Calibration Factors versus Frequency 149
Figure 5-1 E-Series CW sensor Auto-averaging settings 159
Figure 5-2 E-Series CW sensor default Channel Setup 160
Figure 5-3 Frequency Pop-up Window 162
Figure 6-1 8480 Series Auto-Averaging Settings 165
Figure 6-2 8480 Series Sensor Default Channel Setup 166
Figure 6-3 Reference Calibration Factor Pop-Up Window 169
Figure 6-4 Calibration Factor Pop-Up Window 170
Figure 6-5 Calibration Factor Displayed 171
Figure 6-6 Sensor Table Selected 175
Figure 6-7 Frequency Pop-Up Window 176
Figure 6-8 Frequency/Calibration Table Display 177
Figure 6-9 “Sensor Tbls” Screen 179
Figure 6-10 “Edit Cal” Screen 180
Figure 7-1 N8480 Series Auto-Averaging Settings 187
Figure 7-2 N8480 Series Sensor (excluding Option CFT) Default Channel Setup 188
Figure 7-3 N8480 Series Sensor with Option CFT Default Channel Setup 188
Figure 7-4 Frequency Pop-Up Window 190
Figure 7-5 Reference Calibration Factor Pop-Up Window 193
EPM-P Series Peak and Average Power Meters User’s Guide xvii
Page 18

Figure 7-6 Calibration Factor Pop-Up Window 194
Figure 7-7 Calibration Factor Displayed 194
Figure 7-8 Sensor Table Selected 197
Figure 7-9 Frequency Pop-Up Window 197
Figure 7-10 Frequency/Calibration Table Display 198
Figure 7-11 “Sensor Tbls” Screen 200
Figure 7-12 “Edit Cal” Screen 201
Figure 8-1 Self Test in Progress 206
Figure 8-2 Error Indicator Position 211
Figure 8-3 Error Queue Message 212
Figure 8-4 Replacing the Fuse 223
xviii EPM-P Series Peak and Average Power Meters User’s Guide
Page 19

Ta b l e s
Ta b l e 2 - 1 Power Sensor Connection Requirements 27
Ta b l e 2 - 2 TTL Input Control Logic 30
Ta b l e 2 - 3 TTL Inputs Timing Diagram 1 31
Ta b l e 2 - 4 TTL Inputs Timing Diagram 2 33
Ta b l e 2 - 5 Measurement Units - Single Channel Meters 34
Ta b l e 2 - 6 Measurement Units - Dual Channel Meters 34
Ta b l e 2 - 7 Range of Values for Window Limits 53
Ta b l e 3 - 1 Sensor Bandwidth 76
Ta b l e 3 - 2 Measurement Example Channel Setup 109
Ta b l e 3 - 3 Measurement Example Gate Configurations 110
Ta b l e 3 - 4 Measurement Example Trigger Configurations 111
Ta b l e 3 - 5 Trace Setup Parameters 113
Ta b l e 3 - 6 GSM900 Configurations 116
Ta b l e 3 - 7 EDGE Configurations 119
Ta b l e 3 - 8 NADC Configurations 123
Ta b l e 3 - 9 iDEN Configuration 126
Ta b l e 3 - 1 0 Bluetooth Configurations 129
Ta b l e 3 - 1 1 cdmaOne Configurations 133
Ta b l e 3 - 1 2 W-CDMA Configurations 136
Ta b l e 4 - 1 Power Sensor Connection Requirements 145
Ta b l e 6 - 1 8480 Series Connection Requirements 171
Ta b l e 6 - 2 Installed Power Sensor Models 178
Ta b l e 7 - 1 Power Range in Power Meter Range Setting 186
Ta b l e 7 - 2 N8480 Series Power Sensors Connection Requirements 189
Ta b l e 7 - 3 Installed Power Sensor Models 199
Ta b l e 9 - 1 Video Bandwidth vs. Peak Power Dynamic Range 233
EPM-P Series Peak and Average Power Meters User’s Guide xix
Page 20

xx EPM-P Series Peak and Average Power Meters User’s Guide
Page 21

EPM-P Series Peak and Average Power Meters
User’s Guide
1 Introduction
Welcome 2
Conventions Used in this Guide 4
Power Meter and Sensor Capability 5
Front Panel Keys and Connections 6
The Display Layout 10
Window Symbols 17
Agilent Technologies
1
Page 22

1Introduction
NOTE
Welcome
Welcome to the EPM-P Series power meter user's guide! Together with the
E9320 E-Series power sensors, the EPM- P Series power meters can measure
complex modulation formats such as TDMA, CDMA and W- CDMA.
Preinstalled measurement setups for GSM900, EDGE, NADC, iDEN, Bluetooth,
cdmaOne, W- CDMA, and cdma2000 help reduce the time required to measure
these common wireless communications formats. Power measurements
include peak, peak- to- average ratio and average power of RF and microwave
signals. Extensive triggering features such as continuous, level, external TTL,
and GPIB, are available for making time gated measurements. In addition, the
EPM- P power meters are compatible with E9300 E- Series, E- Series E4410,
8480 Series, and N8480 Series power sensors giving you additional choice for
conventional, average power measurements.
The N8480 Series power sensors used in this user’s guide is refering to all sensors from the
N8480 Series unless otherwise stated.
Documentation Information
As shown in the installation guide, this guide is only part of the information
supplied. The documentation consists of:
• The installation guide – Shows you how to check your power meter, switch
it on and connect it to an Agilent power sensor. This information is
presented in English, French, German, Italian, Japanese, and Spanish
languages.
• The user's guide – Shows you how to operate your power meter from the
front panel interface to make measurements using the Agilent E- Series
E9320, E- Series E9300, E- Series E4410, 8480 Series, and N8480 Series
power sensors. You can find the user’s guide as Adobe Acrobat PDF
(Portable Document Format) file on the supplied CD- ROM in English,
French, German, Italian, Japanese, and Spanish languages.
• The programming guide – Shows you how to operate your power meter
using the remote interfaces. You can find the programming guide as an
Adobe Acrobat PDF file on the supplied CD- ROM in English language only.
2 EPM-P Series Peak and Average Power Meters User’s Guide
Page 23

Introduction 1
NOTE
Printed Guides available by ordering the following options:
• English language user's guide – Option OBK
• French language user's guide – Option ABF
• German language user's guide – Option ABD
• Italian language user's guide – Option ABZ
• Japanese language user's guide – Option ABJ
• Spanish language user's guide – Option ABE
The programming guide is supplied in english language only.
What You’ll Find in this Guide
This user's guide shows you how to operate your EPM- P Series power meter
using the front panel interface to make measurements with the E9320
E- Series, E9300 E- Series, E4410 E- Series, 8480 Series, and N8480 Series
power sensors.
Some EPM- P Series power meter features and capabilities depend on the type
of power sensor connected. Other features are general and independent of the
power sensor. This user's guide is there for divided into three main blocks.
• Chapters 1 and 2 show you the main EPM- P power meter functions. These
functions are typically independent of the connected sensor type.
• Chapters 3, 4, 5, 6, and 7 show you how to use the EPM- P power meters
with each of the five sensor families.
• Chapters 8 and 9 describe general maintenance and specifications.
For remote programming information, refer to the EPM- P Series Power Meter
Programming Guide.
EPM-P Series Peak and Average Power Meters User’s Guide 3
Page 24

1Introduction
Softkey
Message
Parameter
Channel
Channel A
Channel B
Softkey
Conventions Used in this Guide
The following conventions are used throughout this guide.
This symbol and text represents a labeled key on the
power meter front panel.
This symbol and text represents a labeled softkey and
is used to indicate you should press the unmarked key
beside the displayed text.
This symbol and text represents a displayed message.
This is used to represent a parameter, value, or title.
''Channel'' This user's guide describes the operation for both the
single channel E4416A and the dual channel E4417A.
To identify channels on a dual channel meter, a
softkey on an E4416A meter becomes
and to an E4417A.
When you are asked to press ''the channel'' in
a procedure, make sure you select the relevant
channel.
4 EPM-P Series Peak and Average Power Meters User’s Guide
Page 25

Power Meter and Sensor Capability
Your E4416A or E4417A power meter is compatible with E9320 E- Series,
E9300 E- Series, E4410 E- Series, 8480 Series, and N8480 Series power
sensors. However, not all sensor and meter combinations have the same
features or capabilities. The main differences are:
Introduction 1
Features E9320
E-Series
Average Power of CW Signal •••••
Cal Factors on EEPROM ••• •
>200 Readings per second •••
Average Power of modulated signal •• ••
Peak/Burst Average Power •
Time Gated Measurements •
1
Not applicable for N8480 Series power sensors with Option CFT
E9300
E-Series
E-4410
E-Series
8480
Series
N8480
Series
Specifications
The specifications for the power meter are listed in Chapter 1.
1
EPM-P Series Peak and Average Power Meters User’s Guide 5
Page 26
1Introduction
Front Panel Keys and Connections
This section briefly describes the functions of the front panel keys and
connectors. The user's guide shows you how to use them in more detail.
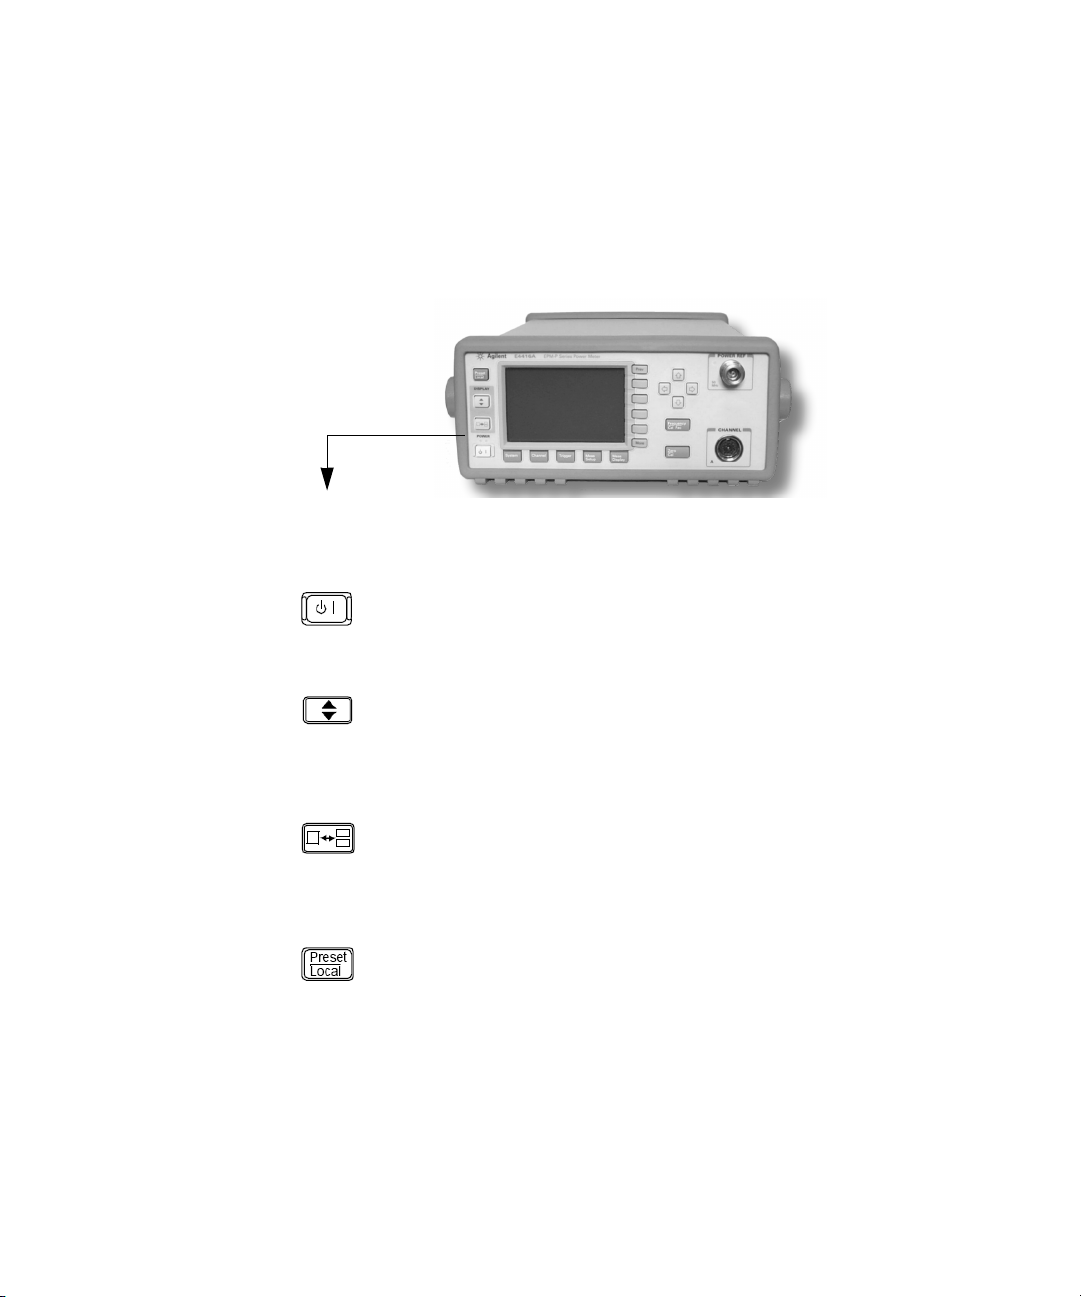
These keys are located to the left of the display.
Key Function
Press this key to switch the meter between on and standby.
When power is supplied, the orange LED above the key is lit.
Press the key to switch on the meter. The green LED lights.
Press this key to select the upper or lower measurement
window. The selected window is highlight ed by a shadowed
box. Any measurement setup you create is implemented in the
selected window.
Press this key to choose windowed, expanded, or full screen
display of a numeric measurement. It also provides quick
access to the Gate Control screen and menu when a trace
window is selected.
Press this key to preset the power meter when it is operating in
local mode (front panel operation) or to select a preinstalled
measurement configuration. A pop- up window is displayed
asking you to confirm the command. It also enables you to take
control of the meter from the front panel when operating via
the remote interfaces (when Local Lock Out is not enabled).
6 EPM-P Series Peak and Average Power Meters User’s Guide
Page 27
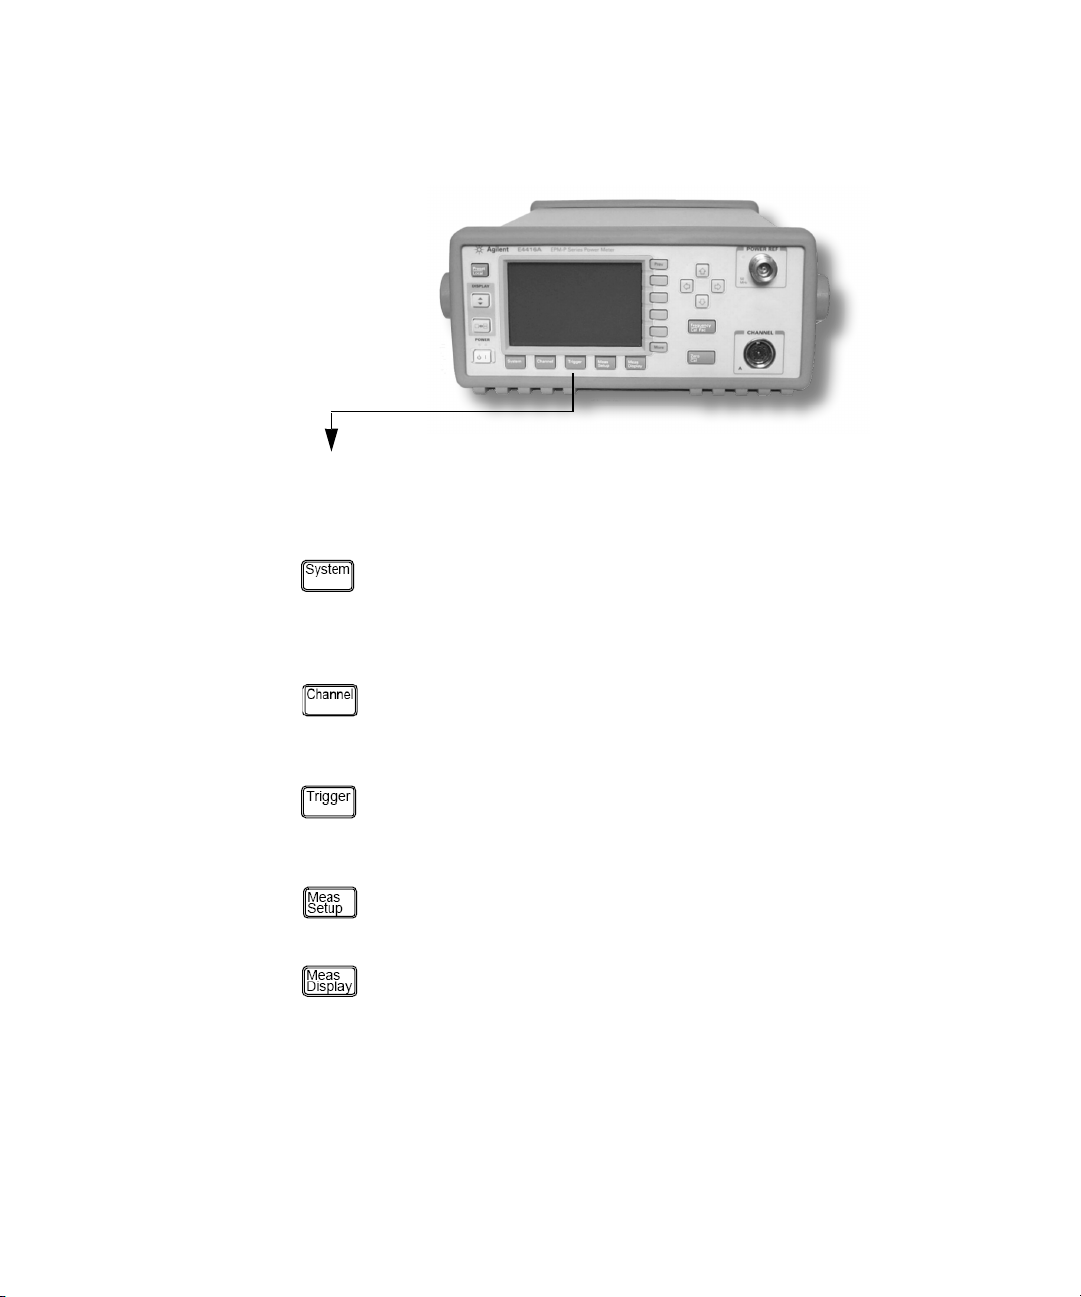
These keys are located along the lower edge of the display.
Key Function
Press this key to access general configuration menus, such
as GPIB address. You can also access some measurement
configuration menus. The measurement screen remains
visible.
Introduction 1
Press this key to access the channel configuration tables
and menus. Channel parameters such as averaging and
offsets are configured from this menu.
Press this key to access the triggering menu. Unless an
E9320A E- Series senso r is connected, all the men u keys are
disabled (greyed out).
Press this key to setup relative measurements or set display
offsets.
Press this key to access the measurement display menu. You
can choose the displayed measurement resolution, units
and display format.
EPM-P Series Peak and Average Power Meters User’s Guide 7
Page 28

1Introduction
Confirm
Cancel
These keys are all associated with the menu labels and data entry. They
are located to the right of the display.
Key Function
Press this key to access the next pages of a menu. For
example, 1 of 2 displayed beside the key indicates
page one of a two page menu is displayed. Press to
access the second page. (2 of 2 is displayed.)
Press this key to access the previous pages of a menu. For
example, 2 of 2 displayed beside the key indicates
page two of a two page menu is displayed. Press to
access the previous page. (1 of 2 is displayed).
These unmarked keys are called ‘softkeys’ and are referred
to by the text on the display beside them. For example,
during a Preset, a pop- up window asks you to confirm the
command. Press to continue, that is, press the
softkey beside the displayed word ‘confirm’. Similarly,
pressing (the softkey beside the word ‘cancel’)
stops the Preset.
The arrow keys are used to select and change parameters
such as instrument state names and offset values.
8 EPM-P Series Peak and Average Power Meters User’s Guide
Page 29
Introduction 1
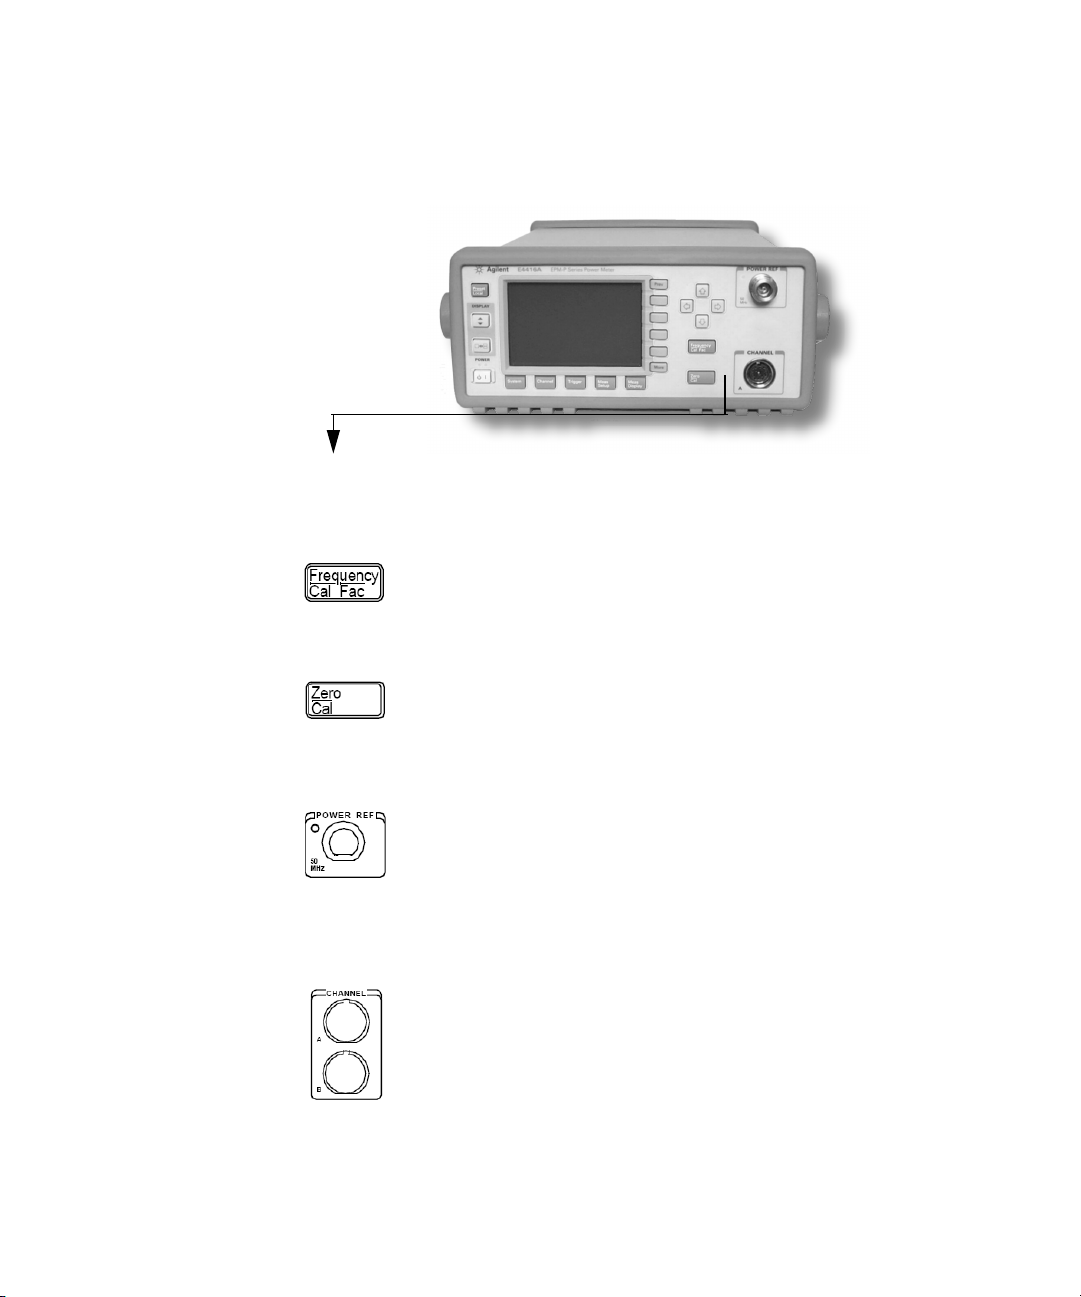
These keys and connectors are associated with the measurement
channels and are located on the right- hand side of the front panel.
Key Function
Press this key to access the input frequency, and sensor
calibration factor menus. Use these functions to improve
the accuracy of your measurement.
Press this key to access the zero and calibration menus. Use
these functions to improve the accuracy of your
measurement.
Connector Function
The power reference is a 1 mW (0 dBm) 50 MHz signal
available from a 50 Ω type- N connector. It is used for
calibrating the sensor and meter system. If the meter is
configured with Option 003, the connector is fitted to the
rear panel. The Green LED beside the connector is lit when
the calibrator is turned on.
The sensor input connectors. The E4417A has two inputs,
the E4416A has one input as shown in the photograph. If
the meter is configured with Option 002 or Option 003, the
connectors are fitted to the rear panel.
EPM-P Series Peak and Average Power Meters User’s Guide 9
Page 30
1Introduction
Disp Type
1
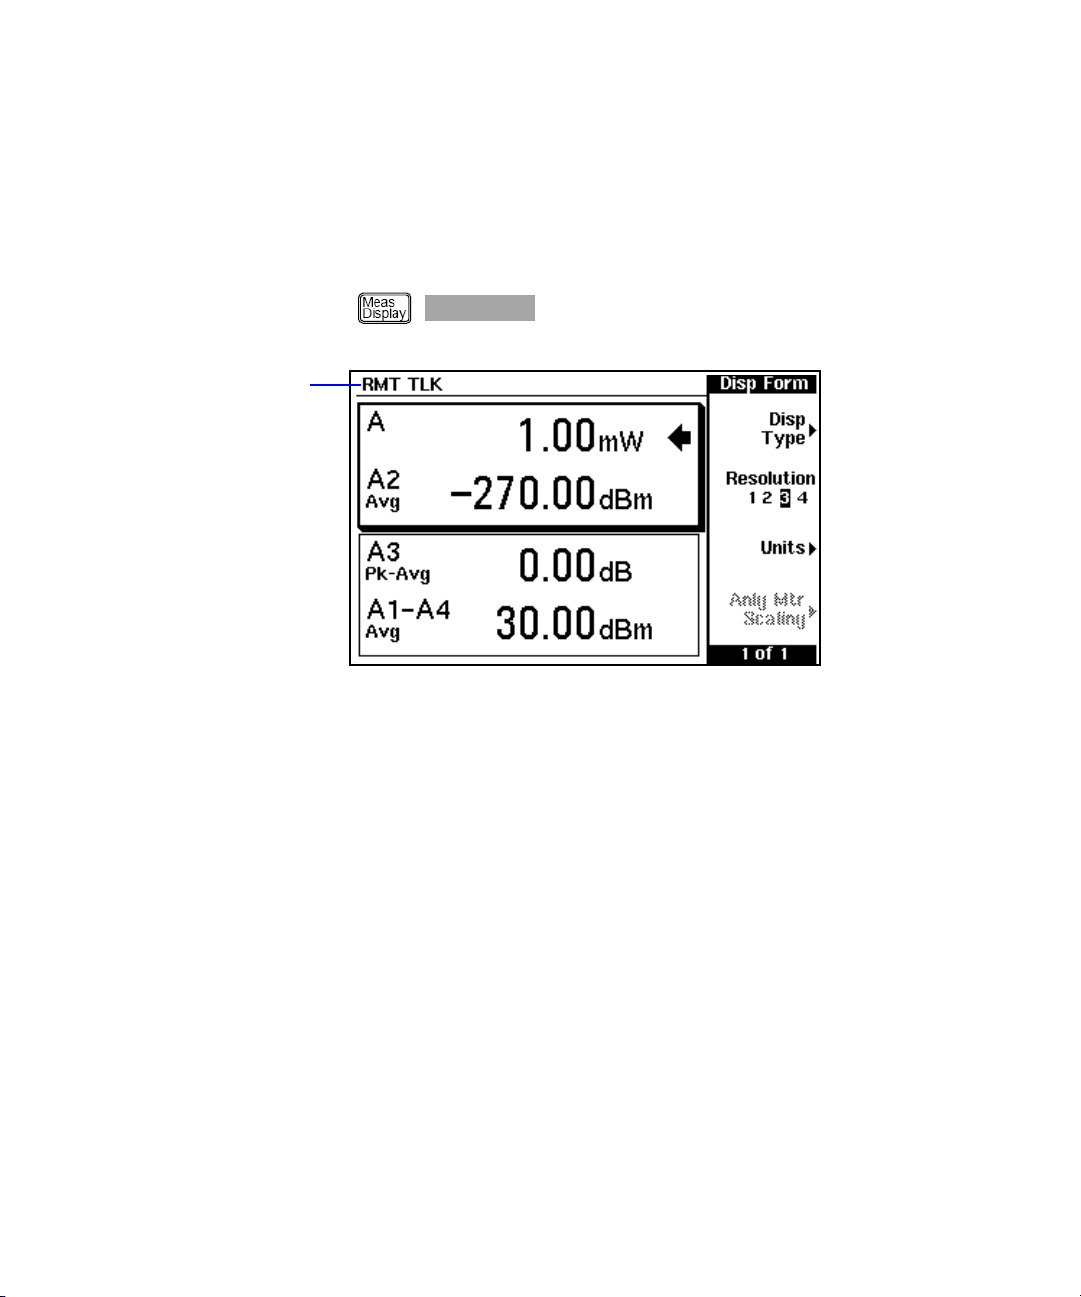
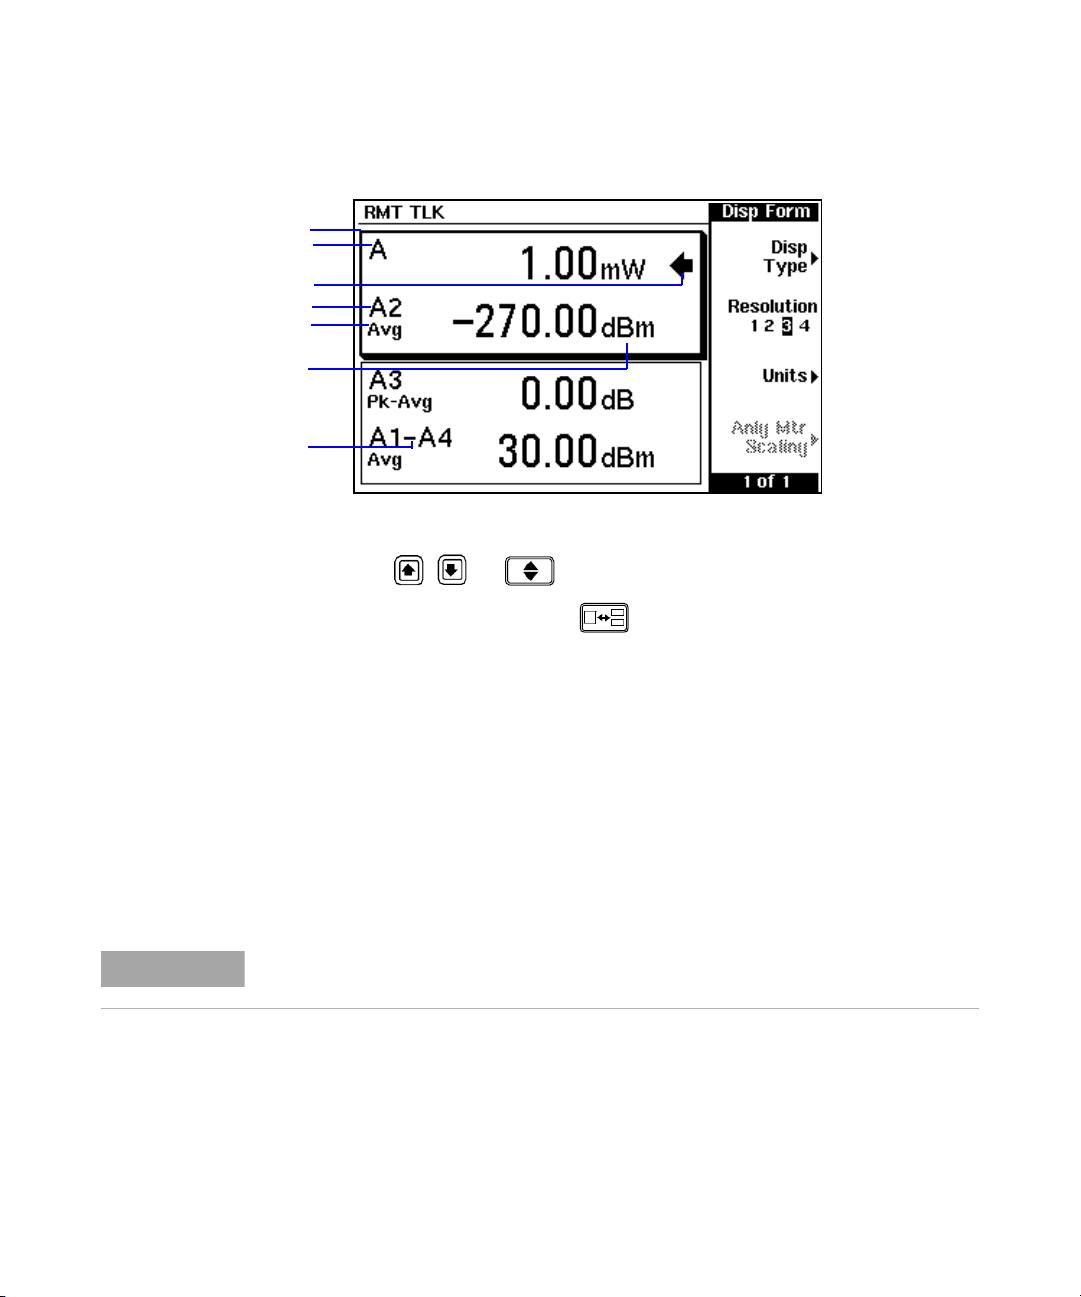
The Display Layout
The following figure details the display layout when the two windows are
configured in the dual numeric mode. Other display formats are available by
pressing , .
1 The status reporting line displays five fields, three associated with either
GPIB, RS232 or RS422 status and two associated with error and warning
conditions. The first field displays either RMT (remote, GPIB, RS232 or
RS422 operation) or LCL (local, front panel operation).
For GPIB operation, the second field displays TLK if the power meter is
addressed to talk or LSN if it is addressed to listen. The third field indicates
an SRQ (service request).
For RS232 and RS422 operation, the second field displays RX when data is
being received. The third field displays TX when the power meter is
transmitting data.
The fourth field indicates ERR for any error conditions. The last field is
used to report error and warning messages.
10 EPM-P Series Peak and Average Power Meters User’s Guide
Page 31
Introduction 1
2
3
4
5
6
7
8
NOTE
2 There are two measurement windows. This is the upper measurement
window. The shading around the window indicates it has been selected
(using the , or keys). With numeric measurement results, you
can choose either two rectangular windows, a single enlarged window, or a
full screen display by pressing . The display style is applied to the
currently selected window or measurement line.
3 This field displays the channel being measured. This measurement line is
the Upper Window/Upper Measurement.
4 The arrow indicates the currently selected measurement display line.
5 With an E- Series E9320 power sensor connected, the channel and
associated gate number are shown.
6 With an E- Series E9320 power sensor connected, the associated
measurement type is shown below the channel and gate number.
7 This field displays the measurement units, either dBm, dB, Watts, or
percent (%).
With an E-Series E9320 power sensor connected, a measurement result of –270 dBm
indicates the input power level is outwith the sensitivity of the sensor.
8 With an E- Series E9320 power sensor connected, you can make combined
measurements with a single channel meter. A dual channel meter extends
this feature across both channels.
EPM-P Series Peak and Average Power Meters User’s Guide 11
Page 32

1Introduction
9
10
11
12
14
13
1516171819
9 This window is configured to show a single numeric display.
10 This window is configured to show an analog meter which displays the
measurement result and the meter scaling.
11 This field displays the number of pages in the current menu. For example, 1
of 2 indicates that there are two pages in the menu and the first page is
currently displayed. Pressing displays the next page, indicated by 2
of 2. ( displays the previous menu page.)
12 The available softkey labels are displayed in these four fields. Additionally,
settings associated with the labelled function are displayed.
12 EPM-P Series Peak and Average Power Meters User’s Guide
Page 33

Introduction 1
NOTE
21
20
13 This field displays the menu title. For example, when the power meter is
initially switched on, the Contrast menu is displayed, and if for example,
you press , the Zero/Cal menu is displayed.
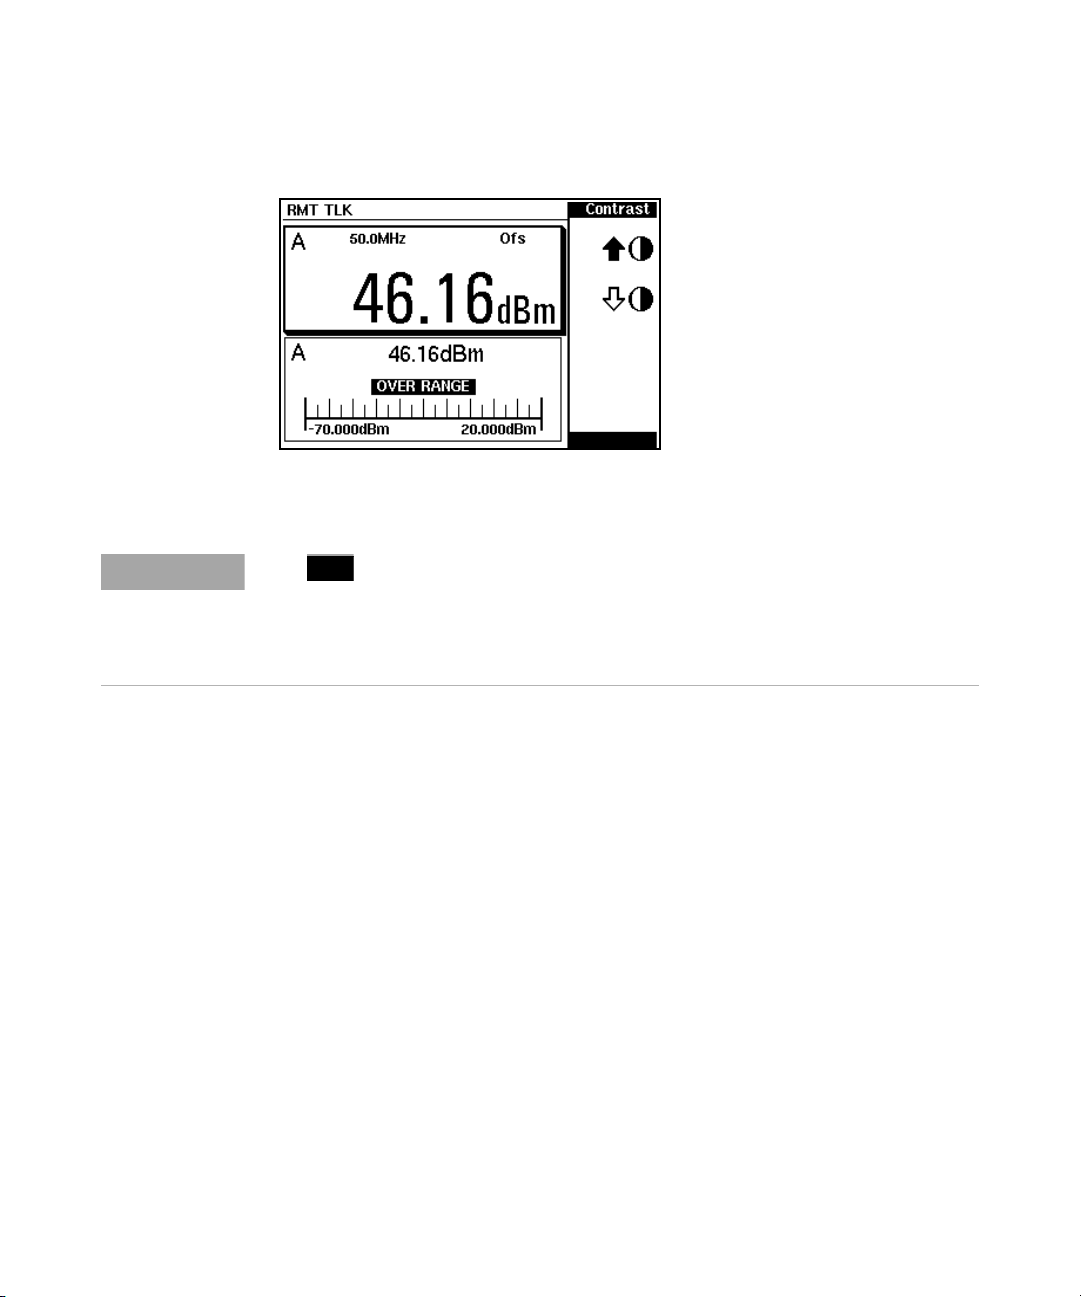
14 This field indicates the measurement result is out with any configured
upper or lower limits. If the measurement is within the limits, this field is
empty. If the measurement result is less than the minimum limit set, Undr
Lmt is displayed. If the measurement result is more than the maximum
limit set, Over Lmt is displayed.
15 This field displays Rel if relative mode is on.
16 This field displays Ofs if an offset is set.
17 This field displays Rng Hld if a range is selected.
18 This field displays Dty Cyc if a duty cycle is set. With an E- Series E9320
power sensor connected, the field shows , , , or , depending
on the trigger state.
19 The information in this field is displayed on two lines and depends on the
sensor type, sensor calibration table, frequency dependent offset table
currently selected, and the measurement frequency.
The following trace displays are only available when an E-Series E9320 power sensor is
connected.
EPM-P Series Peak and Average Power Meters User’s Guide 13
Page 34

1Introduction
NOTE
Sing Trig
Cont Trig
Acqn
Trace
Free Run
25
23
24
22
Gate Control
Gate Control
Gate
Marker 1 2
20 This window is configured to show a trace display. This is only available
with an E- Series E9320 power sensor connected. The captured trace and
scaling are displayed.
21 The indicates the point on the trace where trigger event occurs.
Single or continuous triggering ( or ) must be selected from the
Acqn menu to view a trace window. The Acqn menu is accessed by pressing ,
. is disabled when is selected.
This display shows the Gate Ctrl menu, associated tables and markers. The
Gate Ctrl screen is accessed by pressing from the Trace Ctrl
menu or by pressing from the Gates menu.
22 Pressing scrolls through the four gates available for each channel.
The selected gate number is repeated in the upper left corner of the
window.
23 The markers 1 and 2, indicate the start and end points of the selected gate.
Pressing toggles between the two markers. You can use the
and keys to move the active marker along the trace.
24 This table shows the time (Time:) from the configured trigger point and the
instantaneous power level (Pow:) for both markers. A negative time value
indicates a measurement before the trigger point.
14 EPM-P Series Peak and Average Power Meters User’s Guide
Page 35

Introduction 1
NOTE
26
Select TgDel
Select TgDel
Gate timing parameters are all related to your chosen trigger point. This may be different
from the timing of the triggering event if you have configured a trigger delay. Refer to item
26 for more information.
25 This table shows the width of the gate (time between the markers), and
the average, peak, and peak-to- average ratio power measurements within
the gate.
26 Pressing hides the gate markers and displays the trigger
marker(s). indicates when the trigger event occurs, whilst shows the
delayed trigger point. When the two points coincide, only the delayed
trigger is shown.
In the example displayed, the appears ahead of the as a trigger delay
of –70.00 μs has been configured, placing the measurement trigger before
the trigger event. You can configure the trigger delay by pressing
and entering a numeric value or by pressing the or
keys.
Gate and trigger markers are moved one pixel when the or keys are
pressed and released. They are moved up to five pixels at a time when the
keys are pressed and held. To reduce the time interval represented by one
pixel, decrease the length of the displayed trace.
EPM-P Series Peak and Average Power Meters User’s Guide 15
Page 36

1Introduction
NOTE
27
28
29
30
Trace Control
Trace Control
Gate
To indicate an off- screen trigger event, or is displayed. To indicate
an off- screen trigger point, or is displayed.
Gate timing parameters are all related to your chosen trigger point. This may be different
from the timing of the triggering event if you have configured a trigger delay. Refer to item
26 for more information.
16 EPM-P Series Peak and Average Power Meters User’s Guide
The T race Ctrl screen is accessed by pressing from the Gate
Ctrl menu or by pressing from the T r ace Setup menu.
27 Pressing scrolls through the four gates available for each channel.
The selected gate number is repeated in the upper left corner of the
window.
28 The markers 1 and 2, indicate the start and end points of the selected gate.
29 The vertical table shows the amplitude scaling of the trace display. The
horizontal table shows the scale and start point, relative to the
measurement trigger of the trace.
30 You can change any of the horizontal or vertical trace values using the
or softkeys having first selected the parameter using the , , ,
and keys.
Page 37

Window Symbols
Confirm
There are a number of different graphic symbols and pop- up windows that
can occur on the power meter display. These can occur for a variety of reasons
such as when:
• an error or warning occurs.
• a confirmation is required.
• you are required to wait while the power meter carries out a procedure.
• you are required to select an entry from a list.
• you are required to enter an alphanumeric value.
Warning Symbol
The warning symbol is displayed either directly in the
measurement window or in a pop- up window when
such an event occurs. A pop- up window is displayed
for approximately two seconds. The text in the pop- up
window gives details of the warning type. This symbol
may also appear on a measurement window,
for example, to indicate that a power sensor is not connected.
Introduction 1
Confirmation Pop-Up
This pop- up window is displayed when you are required to press
to verify your previous
selection. For example, prior to
a (Preset) being carried out.
EPM-P Series Peak and Average Power Meters User’s Guide 17
Page 38

1Introduction
Wait Symbol
One of Many Entry Pop-Up
The wait symbol is displayed when the power meter is carrying
out a procedure but no action is required from you. The symbol
appears in a pop- up window. It may appear, for example, during
zeroing or calibration.
This pop- up window is displayed when
you are required to select an entry
using and from the list.
Configuration Conflict Pop-Up
This pop- up window is displayed
when you make a configuration that
conflict with a previous setup. The
previous setup is lost
18 EPM-P Series Peak and Average Power Meters User’s Guide
Page 39

Numeric or Alphanumeric Entry Pop-Up
This pop- up window is displayed when
you are required to modify numeric or
alphanumeric data.
The and keys move the position
of the cursor. The and keys
increment and decrement the
alphanumeric digit on which the cursor
is currently positioned.
Introduction 1
EPM-P Series Peak and Average Power Meters User’s Guide 19
Page 40

1Introduction
20 EPM-P Series Peak and Average Power Meters User’s Guide
Page 41

EPM-P Series Peak and Average Power Meters
User’s Guide
2 General Power Meter Functions
Zeroing and Calibrating 22
Setting the Units of Measurement 34
Setting the Resolution 36
Making Relative Measurements 37
Setting Offsets 39
Setting Averaging 49
Step Detection 51
Setting Measurement Limits 52
Setting the Range 59
Scaling the Analog Display 60
Recorder Output 62
Saving and Recalling Power Meter Configurations 65
Measuring Pulsed Signals 67
Presetting the Power Meter 70
Agilent Technologies
21
Page 42

2 General Power Meter Functions
Zero
Zeroing
Zero Both
Zeroing and Calibrating
This section describes how to zero and calibrate the power meter and sensor
combination. You should always zero the power meter prior to calibrating it.
Zeroing
Zeroing adjusts the power meter for a zero power reading with no power
applied to the power sensor. During zeroing, the wait symbol is displayed.
To zero the power meter and sensor:
Press and the channel softkey. The message and
wait symbol are displayed. On dual channel meters, you can zero both
channels sequentially by pressing . During zeroing, the wait symbol
is displayed.
When to zero?
Zeroing of the power meter is recommended:
o
•when a 5
• when you change the power sensor.
•every 24 hours.
• prior to measuring low level signals. For example, 10 dB above the lowest
specified power for your power sensor.
22 EPM-P Series Peak and Average Power Meters User’s Guide
C change in temperature occurs.
Page 43

General Power Meter Functions 2
NOTE
Calibration
Calibration sets the gain of each power meter channel and sensor combination
using a 50 MHz 1 mW (0 dBm) signal. Use the power meter’s POWER REF as a
traceable power reference or a suitable external reference signal. An essential
part of calibrating is setting the correct reference calibration factor for the
power sensor you are using. You must manually enter the reference calibration
factor for an 8480 Series power sensor or N8480 Series power sensor with
Option CFT. The reference calibration factor is automatically set for all
E- Series sensors and N8480 Series sensors (excluding Option CFT).
During calibration, the wait symbol is displayed. Offset, relative, and duty
cycle settings are ignored during calibration. Some power sensors require
adaptors or attenuator pads to enable connection to the POWER REF output.
Refer to Table 2- 1 on page 27 for details.
During calibration, the power meter automatically switches the power reference calibrator
on (if it is not already on). After calibration, it switches it back to the state it was in prior to
calibration.
EPM-P Series Peak and Average Power Meters User’s Guide 23
Page 44

2 General Power Meter Functions
Ref CF %
Cal Fac %
Zero
Zeroing
Cal
Calibrating
Zero + Cal
Zero + Cal
Zero + Cal A
Zero + Cal B
NOTE
Calibration with E-Series Power Sensors and N8480 Series Power Sensors (Excluding Option CFT)
This section describes the calibration procedure for E- Series power sensors
and N8480 Series power sensors (excluding Option CFT). The power meter
identifies that an E- Series power sensors and N8480 Series power sensors
(excluding Option CFT) is connected and automatically downloads the
calibration table. Since there is no requirement to enter any calibration
factors, the channel and softkeys are disabled. (These
softkey labels are still visible but appear grayed out.)
Procedure
Zero and calibrate the power meter/sensor combination as follows:
1 Ensure the power sensor is disconnected from any signal source.
2 Refer to the connection requirements in Table 2- 1 and ensure the sensor is
ready for connection to the power reference.
3 Press and the channel softkey to zero the channel. The
4 Connect the power sensor to the POWER REF output.
5 Press the channel softkey to start the calibration routine. The
message and wait symbol are displayed.
message and wait symbol are displayed.
The power meter and sensor are now ready for use.
TIP You can reduce the steps required to carry out the zero and
calibration procedure as follows:
– Connect the power sensor to the POWER REF output.
– Press and . (For dual channel meters, press
, , or as required.)
Following calibration, ensure you remove/reattach any attenuators or adaptors before
making a measurement.
24 EPM-P Series Peak and Average Power Meters User’s Guide
Page 45

General Power Meter Functions 2
NOTE
Ref CF %
Ref CF
%
Calibration with 8480 Series Power Sensors and N8480 Series Power Sensors with Option CFT
This section describes the calibration procedure for Agilent 8480 Series power
sensors and N8480 Series power sensors with Option CFT. The reference
calibration factor is entered manually.
For most 8480 Series sensors, the correct (A type or D type) linearity correction table is
automatically selected. “V8486A and W8486A sensors” on page 26 show you how to
change the linearity configuration.
Procedure
1 Ensure the power sensor is disconnected from any signal source.
2 Refer to the connection requirements in Table 2- 1 and ensure the sensor is
ready for connection to the Power Reference.
3 Check the current reference calibration factor setting by pressing ,
. The value is displayed under the channel softkey.
Does this setting match the value for the sensor? (The power sensor reference
calibration factor can normally be found above the calibration factors table on
the power sensor body.)
4 If required, change this setting by pressing the channel . The
reference calibration factor pop- up window is displayed as shown in
Figure 2- 1.
Figure 2-1 Reference Calibration Factor Pop-Up Window
Use the , , , and keys to select and change the values as
required.
5 Confirm your choice by pressing .
EPM-P Series Peak and Average Power Meters User’s Guide 25
Page 46

2 General Power Meter Functions
Zero
Zeroing
Cal
Calibrating
NOTE
Linearity Override
May be Required
Tables
Linearity
Atyp
Dtyp
Tables
B Linearity
Dtyp
6 Press and the channel softkey to zero the channel. The
7 Connect the power sensor to the POWER REF output.
8 Press the channel softkey to start the calibration routine. The
Following calibration, ensure you remove/reattach any attenuators or adaptors before
making a measurement.
V8486A and W8486A sensors
V8486A and W8486A sensors require that you manually select D type linearity
correction. Subsequent connection of another A type sensor will result in a
warning message . You must then
manually select A type correction.
message and wait symbol are displayed.
message and wait symbol are displayed.
Select the linearity to be applied as follows:
Press , and press the channel softkey to highlight
or .
Linearity can be manually configured for each channel. For example, to set
D type linearity on channel B:
Press , and press to highlight .
26 EPM-P Series Peak and Average Power Meters User’s Guide
Page 47

Ta b l e 2- 1 Power Sensor Connection Requirements
Sensor Connection requirements
General Power Meter Functions 2
8481A
8481H
8482A
8482H
N8481A
N8482A
E4412A
E930xA
E930xH
E9304 H18
E9304 H19
E932xA
8481D
8484A
8483A This power sensor requires a 75 Ω (f) to 50 Ω (m) N-Type adapter
R8486A
Q8486A
V8486A
W8486A
R8486D
Q8486D
These power sensors connect directly to the reference calibrator.
Prior to the power meter calibration, an Agilent 11708A 30 dB
reference attenuator should be connected between the power sensor
and the reference calibrator. Remove this attenuator from the power
sensor input before making measurements.
(1250-0597) to connect to the POWER REF. Remove this adapter from
the power sensor input before making measurements.
These waveguide power sensors have two connectors. Use the
N-Type connector to calibrate the power meter.
8481B
8482B
E930xB
8485A
N8485A
E4413A
E9300A H24
E9300A H25
These power sensors are configured with an attenuator. Prior to
calibration, this attenuator must be removed. The attenuator must be
reconnected prior to making measurements.
This power sensor requires an APC 3.5 (f) to 50 Ω (m) N-Type adapter
(08485-60005) to connect to the reference calibrator. Remove this
adapter before making measurements.
EPM-P Series Peak and Average Power Meters User’s Guide 27
Page 48

2 General Power Meter Functions
Ta b l e 2- 1 Power Sensor Connection Requirements
Sensor Connection requirements
8485D Prior to calibration, an Agilent 11708A 30 dB reference attenuator
8487A This sensor requires an APC 2.4 (f) to 50 Ω (m) N-Type adapter
8487D Prior to the power meter calibration, an Agilent 11708A 30 dB
and an APC 3.5 (f) to 50 Ω (m) N-Type adapter (08485-60005) should
be connected between the power sensor and the reference calibrator.
Remove this attenuator from the power sensor input before making
measurements.
(08487-60001) to connect to the power meter. Remove this attenuator
before making measurements.
reference attenuator and an APC 2.4 (f) to 50 Ω (m) N-Type adapter
(08487-60001) should be connected between the power sensor and
the reference calibrator. Remove this attenuator from the power
sensor input before making measurements.
28 EPM-P Series Peak and Average Power Meters User’s Guide
Page 49

General Power Meter Functions 2
Please Zero and Cal
Please Cal
Please Zero
Must Cal
Off
On
Must Cal
Off
On
Zero/Cal Lockout
The Zero/Cal Lockout facility can help you make sure that a measurement
cannot be made until the power meter/sensor combination has been zeroed
and calibrated.
When the Zero/Cal Lockout facility is enabled and a sensor is first connected,
the message is displayed.
When you zero the sensor, the message changes to . If you calibrate
the sensor before zeroing it, the message changes to .
Dual Channel
Dual channel meters display channel specific messages when a sensor is
connected. The Zero/Cal Lockout configuration is applied to both channels - it
cannot be applied to one channel only.
You can enable and disable the Zero/Cal Lockout facility from the System
menu or the Zero/ Cal menu as follows:
Press , , or .
Similarly,
press , , or .
EPM-P Series Peak and Average Power Meters User’s Guide 29
Page 50

2 General Power Meter Functions
1 2 3 4 5 6 7 8
Pin
number
Connection
1none
2Ground
3Upper Window
TTL Output
4 Lower Window
TTL Output
5TTL Input 1
6TTL Input 2
7Ground
8Ground
Zeroing and Calibrating Using TTL Inputs
You can use the TTL inputs on the rear panel Rmt I/O port to initiate zero and
calibration cycles on the power meter. The connector is an RJ- 45 Series
shielded modular jack with the TTL input pins connected as shown in
Figure 2- 2.
Figure 2-2 Rmt I/O Port TTL Inputs
The TTL inputs are active low and control the zero and calibration functions as
shown in Table 2- 2.
Ta b l e 2- 2 TTL Input Control Logic
Input 1 Input 2 Single channel Dual channel
1 1 None None
10CALCAL A
0 1 ZERO ZERO BOTH
00CALCAL B
30 EPM-P Series Peak and Average Power Meters User’s Guide
Page 51

General Power Meter Functions 2
T1
T2
T3
T4
Input
Operation
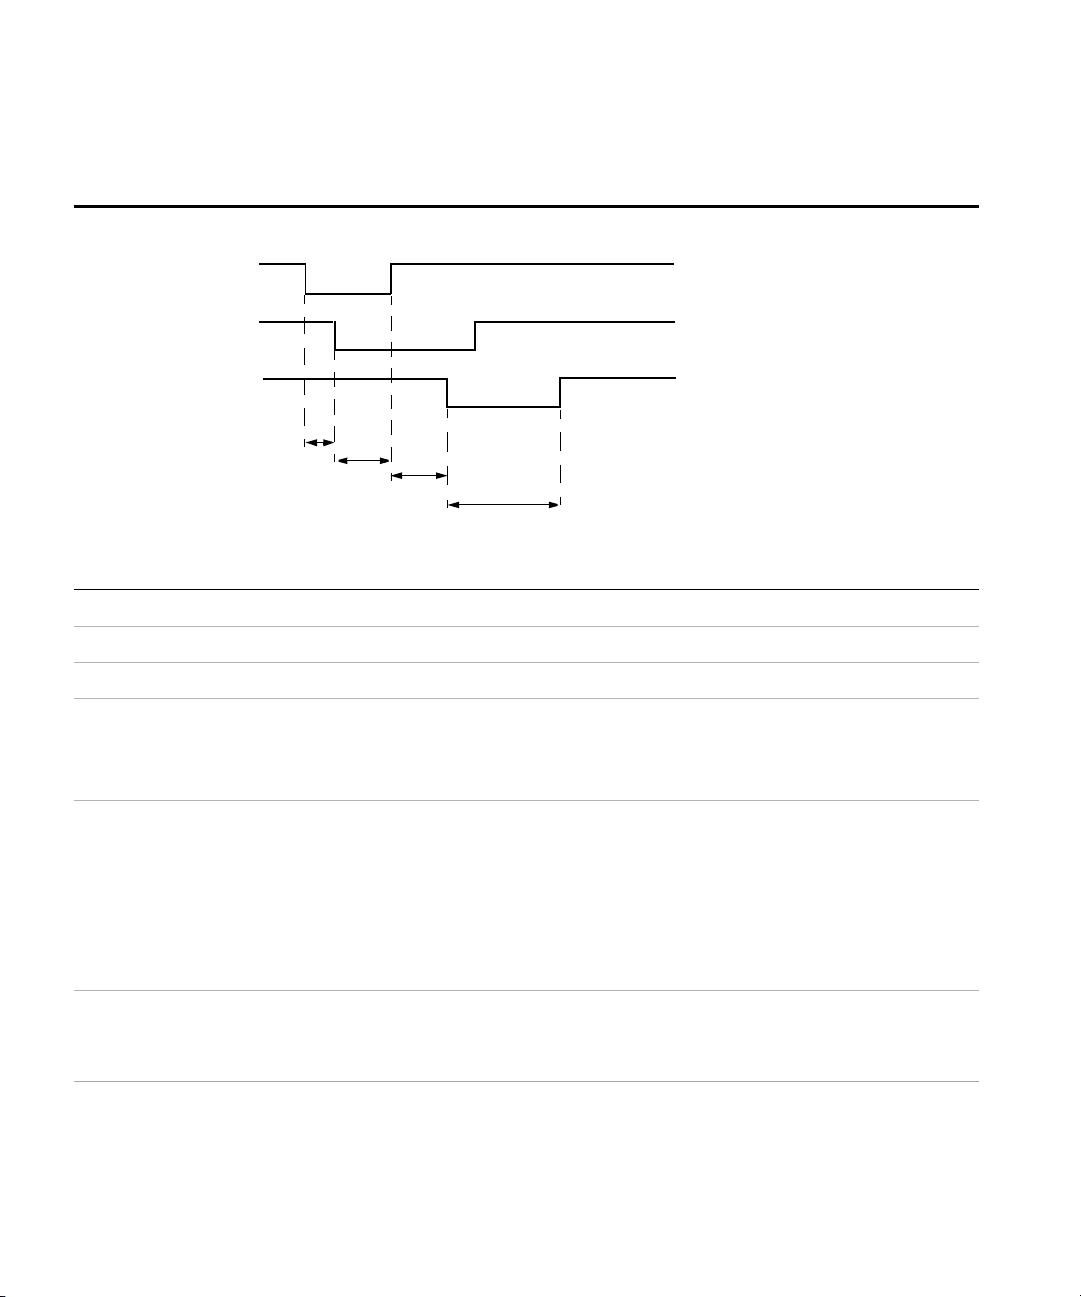
Effective control of the zero and calibration cycles using the TTL inputs
depends on correct timing of the input signals as shown in Table 2- 3 and
Table 2- 4.
Ta b l e 2- 3 TTL Inputs Timing Diagram 1
Timing of zero/cal inputs for conditions “01” and “10”.
Time Descrip tion Value
T1 Minimum width of input 300 ms
T2 Time between input detection and start of zero/cal cycle. This is determined by the
number of averages x sample rate, or if there is an existing zero/cal operation in progress,
Max: 50 ms (typical)
Min.: 0 ms
the time for this current operation to complete. Note that the worst case is 1024 averages
x 50 ms = 51.2 s. For front panel operation (in free run mode), the time is 1 x 50 ms.
T3 Maximum width of input. Longer inputs may cause a subsequent zero/cal operation
4 s
some time after the current one is complete.
T4 Time for zero/cal operation to complete.
Zero Both (dual channel meters) is a sequential operation and requires double that of
single channel meters.
Zero: 10 s (8480 Series)
12 s (E-Series)
45 s (E9320 Series)
22 s (N8480 Series
excluding Option
CFT)
8 s (N8480 Series
with Option CFT
EPM-P Series Peak and Average Power Meters User’s Guide 31
Page 52

2 General Power Meter Functions
T1
T2
T3
T4
Input
Operation
Ta b l e 2- 3 TTL Inputs Timing Diagram 1
Timing of zero/cal inputs for conditions “01” and “10”.
Cal: 6 s (8480 Series)
7 s (E-Series)
15 s (E9320 Series)
10 s (N8480 Series
excluding Option
CFT)
7 s (N8480 Series
with Option CFT)
All timings based on 100 ms firmware polling.
32 EPM-P Series Peak and Average Power Meters User’s Guide
Page 53
General Power Meter Functions 2
Inputs
Operation
T5
T6
T7
T8
Ta b l e 2- 4 TTL Inputs Timing Diagram 2
Timing of zero/cal inputs for condition “00”.
Time Description Value
T5 Maximum time between inputs going low. 100 ms
T6 Minimum overlap of low inputs. 200 ms
T7 Time between input detection and start of zero/cal cycle. This is determined by the
4 s
number of averages x sample rate, or if there is an existing zero/cal operation in progress,
the time for this current operation to complete. Note that the worst case is 1024 averages
x 50 ms = 51.2 s. For front panel operation (in free run mode), the time is 1 x 50 ms.
T8 Time for cal operation to complete. Cal: 6 s (8480 Series)
7 s (E-Series)
30 s (E9320 Series)
10 s (N8480 Series
excluding Option
CFT)
7 s (N8480 Series
with Option CFT)
All timings based on 100 ms firmware polling.
If both TTL inputs are simultaneously low under any circumstances other than those shown above, the
operation is undefined.
EPM-P Series Peak and Average Power Meters User’s Guide 33
Page 54

2 General Power Meter Functions
Units
dBm
W
dB
%
NOTE
Setting the Units of Measurement
The Units menu is used to select the measurement units for the currently
selected window. These can either be logarithmic (dBm or dB) or linear (Watt
or %) units. Presetting ( ) the power meter sets the measurement units to
dBm (logarithmic units). Table 2- 5 and Table 2- 6 show the units applicable to
each measurement mode.
Press , . Select the unit of measurement from , , ,
and . Softkeys which cannot be selected in your particular mode of
operation are grayed out.
When the unit of measurement is set to Watt, it is possible that negative power
measurements may be displayed when measuring low power levels.
Ta b l e 2- 5 Measurement Units - Single Channel Meters
Measurement mode Relative mode off Relative mode on
Log dBm dB
Linear Watt %
Ta b l e 2- 6 Measurement Units - Dual Channel Meters
Measurement mode Relative mode off Relative mode on
Ratio Log dB dB
Linear %%
Difference Log dBm dB
Linear Watt %
34 EPM-P Series Peak and Average Power Meters User’s Guide
Page 55

General Power Meter Functions 2
Increment
Decrement
Multiplier
Multiplier
W
Cancel
mW
Cancel
mW
nW
Prev
More
NOTE
Increment Multiplier
Decrement Multiplier
W
W
Selecting Units of Measurement from the Softkeys
In some menus, you are required to enter the units of measurement for power.
In some cases, due to the wide power range available, the following menu is
displayed:
EPM-P Series Peak and Average Power Meters User’s Guide 35
Some softkeys may be grayed out so that an invalid value cannot be entered.
Pressing or increases or decreases the
multiplier shown in front of . Pressing after the correct multiplier has been selected
confirms the entry.
Page 56

2 General Power Meter Functions
Resolution
Resolution
Setting the Resolution
The resolution of each of the power meter’s windows can be set to four
different levels (1, 2, 3 or 4).
These four levels represent:
• 1, 0.1, 0.01, 0.001 dB respectively if the measurement suffix is dBm or dB.
• 1, 2, 3 or 4 significant digits respectively if the measurement suffix is W or
%.
The default value is 0.01 dB (three digits).
To set the resolution on the currently selected window:
1 Press . The current setting of the resolution is highlighted under the
2 To change this setting, press until the required resolution
setting is highlighted.
softkey.
36 EPM-P Series Peak and Average Power Meters User’s Guide
Page 57
Making Relative Measurements
Rel/Offset
Rel
Rel Off On
On
Rel
Units
dB%Rel/Offset
Rel
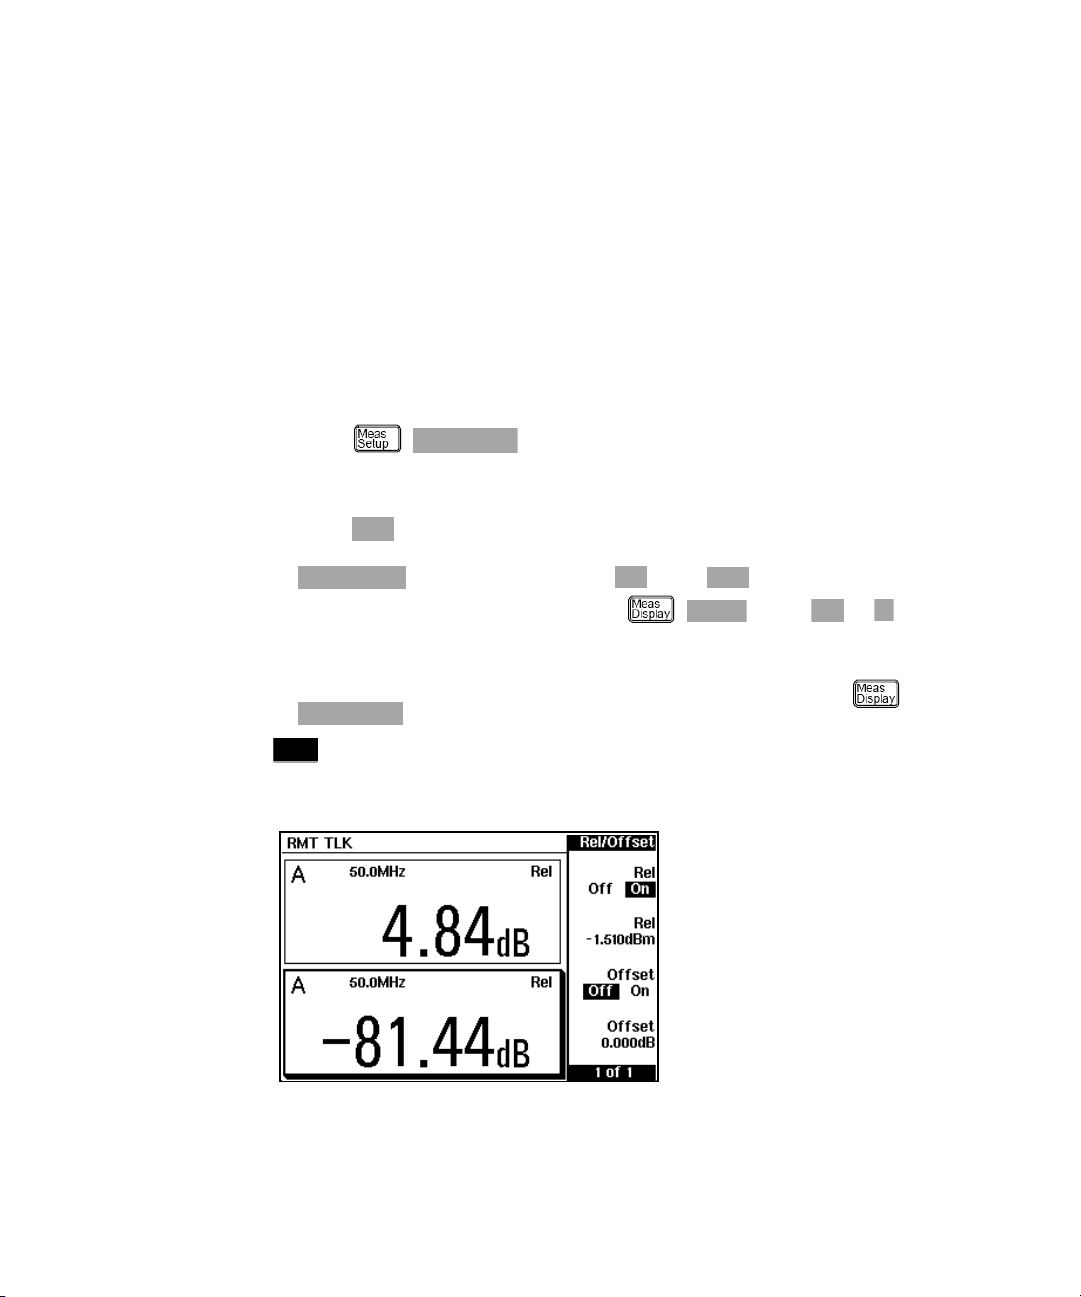
Relative mode enables comparison of a measurement result to a reference
value. The relative reading, or difference, can be displayed in either dB or %
terms. When the measurement result is displayed in % a prefix multiplier may
be shown.
Procedure
To set a reference value on the currently selected window:
1 Press , to display the Rel/Offset menu.
2 Confirm the power meter is measuring the signal you want to use as the
reference.
3 Press to use the current reading as the reference value. You can
compare the measurement result in dB or percentage (%).
is automatically set to when is pressed.
4 To change the measurements, press , . Press or as
required.
5 Successive measurements are now displayed relative to the reference value.
The relative mode can be disabled and reenabled by pressing ,
, to select Off.
General Power Meter Functions 2
is displayed in the window when the measurement line it is applied to is
displayed (see Figure 2- 3)
Figure 2-3 Rel Indicator
EPM-P Series Peak and Average Power Meters User’s Guide 37
Page 58

2 General Power Meter Functions
NOTE
Rel
The symbol is not displayed when the associated measurement is displayed in Dual
Numeric or Analog format.
38 EPM-P Series Peak and Average Power Meters User’s Guide
Page 59
Setting Offsets
Channel Functions
Window Functions
Display
Relative
Offset
Channel A
Upper Window
Lower Window
Display
Relative
Offset
Display
Relative
Offset
Display
Relative
Offset
Measurement Highway
Freq Dep
Offset
Channel
Offset
Cal
Factor
Channel B
Freq Dep
Offset
Channel
Offset
Cal
Factor
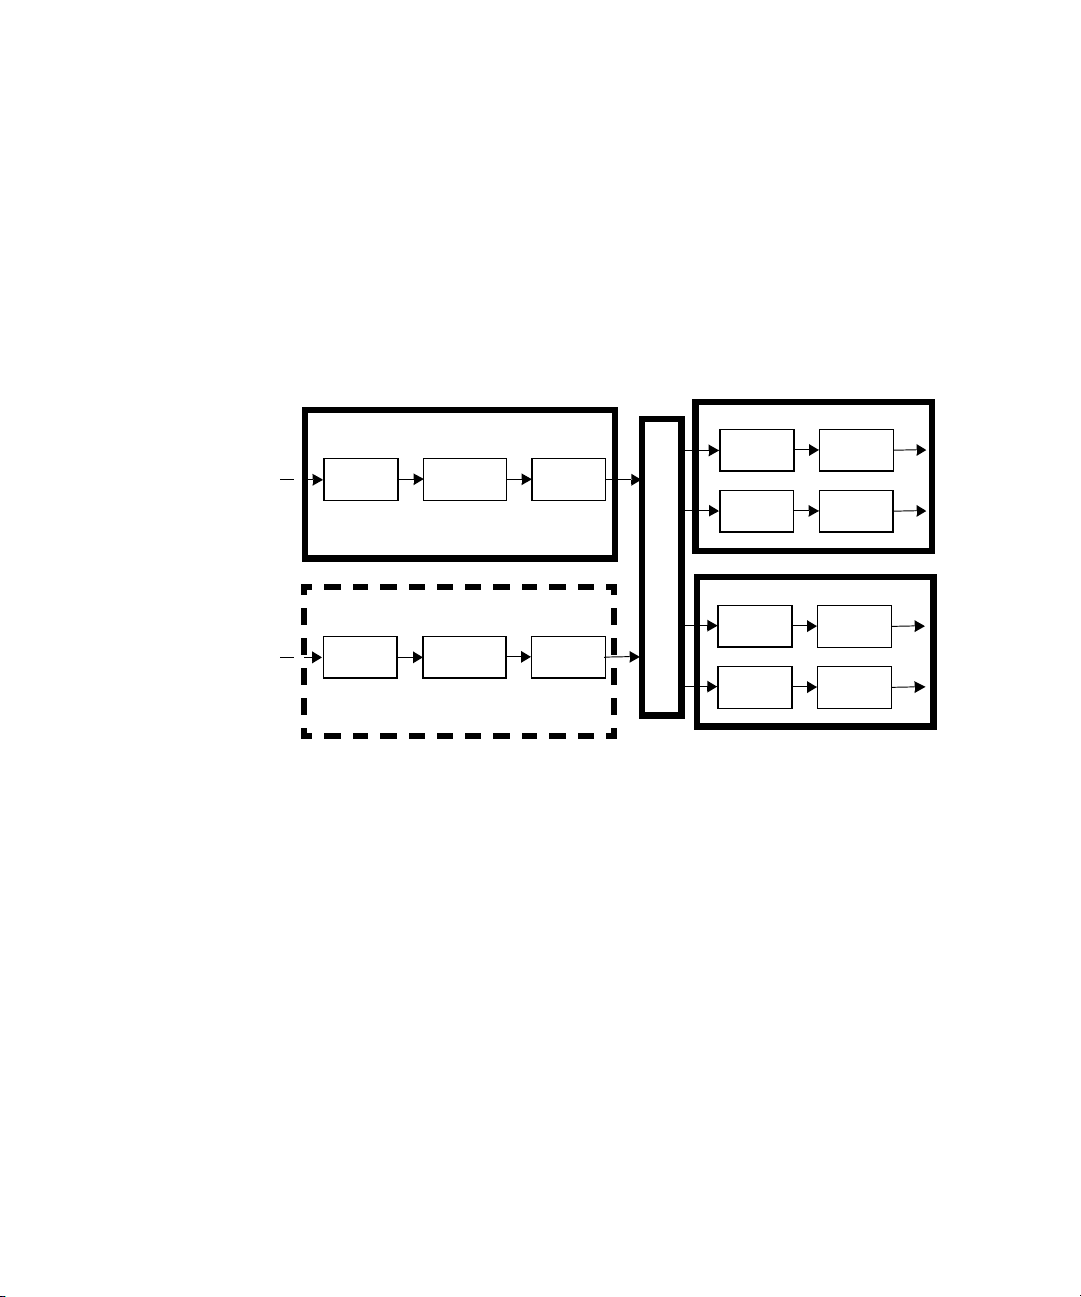
The power meter can be configured to compensate for a signal loss or gain in
your test setup. The power meter allows you to apply offsets at three different
points in the measurement path as shown in Figure 2- 4.
General Power Meter Functions 2
Figure 2-4 Simplified Measurement Path
Applying a Channel Offset or a Frequency Dependent Offset allows you to
compensate each channel individually prior to any mathematical functions.
An overall offset can then be applied if required using the Display Offset.
Setting Channel Offsets
This gain or loss is applied to the measured power before any mathematical
functions, display offsets or relative functions are included.
Offsets are entered in dB. The allowable range of values is –100 dB to +100 dB.
A positive value compensates for a loss, and a negative value compensates for
EPM-P Series Peak and Average Power Meters User’s Guide 39
a gain.
Page 60

2 General Power Meter Functions
Channel Ch.
Change
On
Change
dB
Done
Ofs
NOTE
Ofs
To enter a channel offset:
1 Press to display the Channel Setup screen. Confirm the required
channel setup is displayed. Press to change channel if
required.
2 Use the and keys to highlight the Offset: setting.
3 Press to select .
Press to highlight the Offset: value and press to display the
Offset pop- up. Use the , , , and keys to select and change the
values as required.
4 Confirm your choice by pressing .
5 Press to complete the offset entry.
If either a channel or a display offset is set, is displayed.
Figure 2-5 Offset Applied
The symbol is not displayed when the associated measurement is displayed in Dual
Numeric or Analog format.
40 EPM-P Series Peak and Average Power Meters User’s Guide
Page 61

General Power Meter Functions 2
Rel/Offset
Offset
On
Offset
Offset
dB
Done
Ofs
Setting Display Offsets
This gain or loss is applied to the measured power after any channel offsets or
mathematical functions have been included.
Offsets are entered in dB. The allowable range of values is –100 dB to +100 dB.
A positive value compensates for a loss, and a negative value compensates for
a gain.
Procedure
Enter a display offset on the currently selected window:
1 Press , to display the Rel/Offset menu.
2 Press to highlight .
3 Press to display the Offset pop- up. (The current offset value is
shown below the softkey.)
Figure 2-6 Offset Pop-Up
Use the , , , and keys to select and change the values as
required.
4 Confirm your choice by pressing .
5 Press to complete the offset entry.
If either a channel or a display offset is set, is displayed.
EPM-P Series Peak and Average Power Meters User’s Guide 41
Page 62
2 General Power Meter Functions
NOTE
Ofs
Figure 2-7 Offset applied
The symbol is not displayed when the associated measurement is displayed in Dual
Numeric, Trace, or Analog format.
The display offset is a function of the window. Any of the four measurement display lines
can have its own offset.
42 EPM-P Series Peak and Average Power Meters User’s Guide
Page 63

General Power Meter Functions 2
Setting Frequency Dependent Offsets
Frequency dependent offset tables provide a quick and convenient method of
compensating for frequency related changes in the response of your test
system. Note that when selected, frequency dependent offset corrections are
applied IN ADDITION to any correction for sensor frequency response.
The power meter is capable of storing 10 frequency dependent offset tables of
up to 80 frequency points each.
To use frequency dependent offset tables:
1 Select the table to be applied to a channel. Refer to “Selecting a Frequency
Dependent Offset Table” on page 44 for further information. If you require
to edit the table refer to “Editing Frequency Dependent Offset Tables” on
page 46 for further information.
2 Zero and calibrate the power meter. The reference calibration factor used
during the calibration is automatically set by the power meter from the
sensor calibration table (if selected).
3 Specify the frequency of the signal you want to measure. The calibration
factor/offset is automatically set by the power meter from the sensor
calibration table (if selected) and the frequency dependent offset table.
Refer to “Procedure” on page 44 for further information.
4 Make the measurement.
EPM-P Series Peak and Average Power Meters User’s Guide 43
Page 64

2 General Power Meter Functions
Tables
Freq.Dep.Offset
Change
Table
On
NOTE
Table
Done
Selecting a Frequency Dependent Offset Table
You can select a frequency dependent offset table from the key menu or
the . The State column indicates if any frequency dependent offset tables
are currently selected. The Offset Tbls screen is shown in Figure 2- 8.
Figure 2-8 Offset Tables
Procedure
44 EPM-P Series Peak and Average Power Meters User’s Guide
Select an offset table as follows:
1 Ensure the power meter/sensor combination has been zeroed and
calibrated.
2 Press:
• , , or,
• press and after selecting the required channel, use the
and keys to select FDO Table, and press .
The Offset Tbls screen is displayed.
3 Use the and keys to highlight one of the 10 table titles and press
to highlight .
When no data is contained in the highlighted table, the key is disabled (greyed
out).
4 Press to complete the selection of the offset table.
Page 65

General Power Meter Functions 2
Done
Freq
Freq
Figure 2-9 Frequency Dependent Offset Table Selected
5 Press again to display the measurement screen.
6 Press . The current setting of the frequency is displayed under the
channel softkey.
7 To change the frequency, press the channel softkey. The frequency is
displayed in a pop- up window. Use the , , , and keys to
select and change the values as required.
8 To confirm your choice, press the appropriate unit softkey.
9 Connect the power sensor to the signal to be measured.
10 The measurement result, including offset, is now displayed.
Figure 2-10 Frequency Dependent Offset Configured
EPM-P Series Peak and Average Power Meters User’s Guide 45
Page 66

2 General Power Meter Functions
NOTE
Tables
Freq.Dep.Offset
Tables
Freq.Dep.Offset
Edit table
Change
If the measurement frequency does not correspond directly to a frequency in the sensor
calibration table (if selected) and the frequency dependent offset table being used, the
power meter calculates the calibration factor and offset using linear interpolation.
If you enter a frequency outside the frequency range defined in the sensor calibration table
or the frequency dependent offset table, the power meter uses the highest or lowest
frequency point in the appropriate table to set the calibration factor and offset.
Editing Frequency Dependent Offset Tables
There are ten frequency dependent offset tables named CUSTOM_A through
CUSTOM_J. They do not contain any data when the power meter is shipped
from the factory.
You cannot delete any of the 10 existing frequency dependent offset tables or
create any additional tables. However, you can enter values into the 10
existing tables. Each frequency dependent offset table can contain a maximum
of 80 frequency points.
To view the frequency dependent offset t ables currently stored in the power
meter, press , , . The Offset Tbls screen is
displayed as shown in Figure 2- 8 on page 44.
46 EPM-P Series Peak and Average Power Meters User’s Guide
Creating frequency dependent offset tables requires the following steps:
1 Identify and select the table you want to edit.
2 Rename the table.
3 Enter the frequency and calibration factor data pairs.
4 Save the table.
Procedure
First select the table you want to edit as follows:
1 Press , , to display the Offset Tbls screen.
2 Choose the table you want to edit using the and keys. Press
to display the Edit Offset screen as shown in Figure 2- 11.
3 Highlight the table title using the and keys. Press and use
the , , , and keys to select and change the characters to
create the name you want to use.
Page 67

General Power Meter Functions 2
Insert Char
Delete Char
Enter
NOTE
Insert
Change
GHz
MHz
• Pressing adds a new character to the right of the
selected character.
• Pressing removes the selected character.
4 Press to complete the entry.
A frequency in the range of 0.001 MHz to 999.999 GHz can be entered. A calibration factor
in the range of 1% to 150% can be entered. The following rules apply to naming sensor
calibration tables:
• The name must consist of no more than 12 characters.
• All characters must be upper or lower case alphabetic characters, or
numeric (0 to 9), or an underscore (_).
• No other characters are allowed.
• No spaces are allowed in the name.
Figure 2-11 “Edit Offset” Screen with Some Added Data
Enter (or edit) the frequency and offset pairs as follows:
5 Press to add a new frequency value or use the , , , and
keys to select the frequency value in the table.
6 Enter the value or press and use the , , , and keys
to enter the required frequency. Complete the entry by pressing the ,
keys.
EPM-P Series Peak and Average Power Meters User’s Guide 47
Page 68

2 General Power Meter Functions
%
Done
NOTE
7 Enter the offset using the , , , and keys. Complete the entry
by pressing the key.
Continue adding/editing values until you have entered all the data you
require.
8 When you have finished editing the table, press to save the table.
Both single and dual channel power meters with variety of rear panel configurations have
been used for the illustrations in this guide. Your power meter may differ in detail to those
shown.
48 EPM-P Series Peak and Average Power Meters User’s Guide
Page 69

Setting Averaging
10 dB
10 dB
Minimum Sensor Power
Maximum Sensor Power
Power Sensor
Dynamic Range
10 dB
10 dB
1234
1 8 128 128
Resolution Setting
Number of Averages
1116256
11232
11116
1118
The power meter uses a digital filter to average power readings. The number of
readings average d can range from 1 to 1024. This filter is used to red uce noise,
obtain the desired resolution and to reduce the jitter in the measurement
results. Increasing the value of the filter length reduces measurement noise.
However, the time to take the measurement is increased. You can select the
filter length or you can set the power meter to auto filter mode. The default is
AUTO.
When the auto filter mode is enabled, the power meter automatically sets the
number of readings averaged together to satisfy the filtering requirements for
most power measurements. The number of readings averaged together
depends on the resolution and the power level currently being measured.
General Power Meter Functions 2
EPM-P Series Peak and Average Power Meters User’s Guide 49
Figure 2-12 Averaged Readings
Figure 2- 12 shows the typical number of readings averaged for each range and
resolution when the power meter is in auto filter mode and is set to normal
speed mode. The EPM- P Series power meters recognize different sensor types
when they are connected and configure suitable averaging automatically.
Page 70

2 General Power Meter Functions
Change
Change
Enter
Done
Resolution is a measurement display function and not a channel function. In
the case where a channel is set up in both the upper and lower window and
the resolution settings are different, the highest resolution setting is taken to
calculate the averaging number.
These four resolution levels represent:
• 1, 0.1, 0.01, 0.001 dB respectively if the measurement suffix is dBm or dB.
• 1, 2, 3 or 4 significant digits respectively if the measurement suffix is W or
%.
Procedure
Set averaging as follows:
1 Press and select the channel you want to set up. The current Filter:
setting (AUTO, MAN, or OFF) is shown on the Channel Setup screen.
2 Use the , , , and keys to select the Filter: setting.
3 Press to step through the available settings.
If you have selected AUTO or OFF proceed at st ep 7. If you have selected MAN
proceed as follows:
4 Use the , , , and keys to select the Filter: value.
5 Press to display the Filter Length pop- up.
Figure 2-13 Filter Length Pop-Up
6 Use the , , , and keys to enter the required value and press
.
7 Press to close the Channel Setup screen.
50 EPM-P Series Peak and Average Power Meters User’s Guide
Page 71

Step Detection
Change
Done
To reduce the filter settling time after a significant step in the measured power
the filter can be set to reinitialize upon detection of a step increase/decrease
in the measured power. Step detection can be set in both manual and
automatic filter modes.
Procedure
Set step detection as follows:
1 Press . On dual channel meters, select the required channel.
2 Use the and keys to select the Step Detect setting.
3 Press to set step detection On or Off as required.
4 Press .
General Power Meter Functions 2
EPM-P Series Peak and Average Power Meters User’s Guide 51
Page 72

2 General Power Meter Functions
Swept Source
Out
Out
Power Meter
Device Under
Te s t
Setting Measurement Limits
You can configure the power meter to detect when a measurement is out with
a predefined upper and/or lower limit value.
Limits are windows or measurement display line based and can be applied to
power, ratio or difference measurements. In addition, the limits can be set to
output a TTL logic level at the rear panel Rmt I/O port when the predefined
limits are exceeded.
Figure 2-14 Limits Checking Application
In this application, a swept frequency signal is applied to the input of the
Device Under Test. The power meter measures the output power. The limits
have been set at +4 dBm and +10 dBm. A fail occurs each time the output
power is outside these limits as shown in Figure 2- 15.
52 EPM-P Series Peak and Average Power Meters User’s Guide
Page 73

Figure 2-15 Limits Checking Results
+4 dBm
+10 dBm
Amplitude
Frequency
o
o
o
o
o
o
o
Fail
Fail
Setting Limits
General Power Meter Functions 2
The power meter can be configured to verify the current measurement in any
measurement line against predefined upper and/or lower limit values. The
range of values that can be set for the upper and lower limits and the default
values depends on the measurement units in the currently selected
measurement line, see Table 2- 7.
Ta b l e 2- 7 Range of Values for Window Limits
Default
Window units Max Min
dB + 200 dB – 180 dB 60 dB – 120 dB
dB m + 230 dBm – 150 dBm 90 dBm – 90 dBm
% 10.0 Z% 100.0 a% 100.0 M% 100.0 p%
W 100.000 XW 1.000 aW 1.000 MW 1.000 pW
Max Min
EPM-P Series Peak and Average Power Meters User’s Guide 53
Page 74
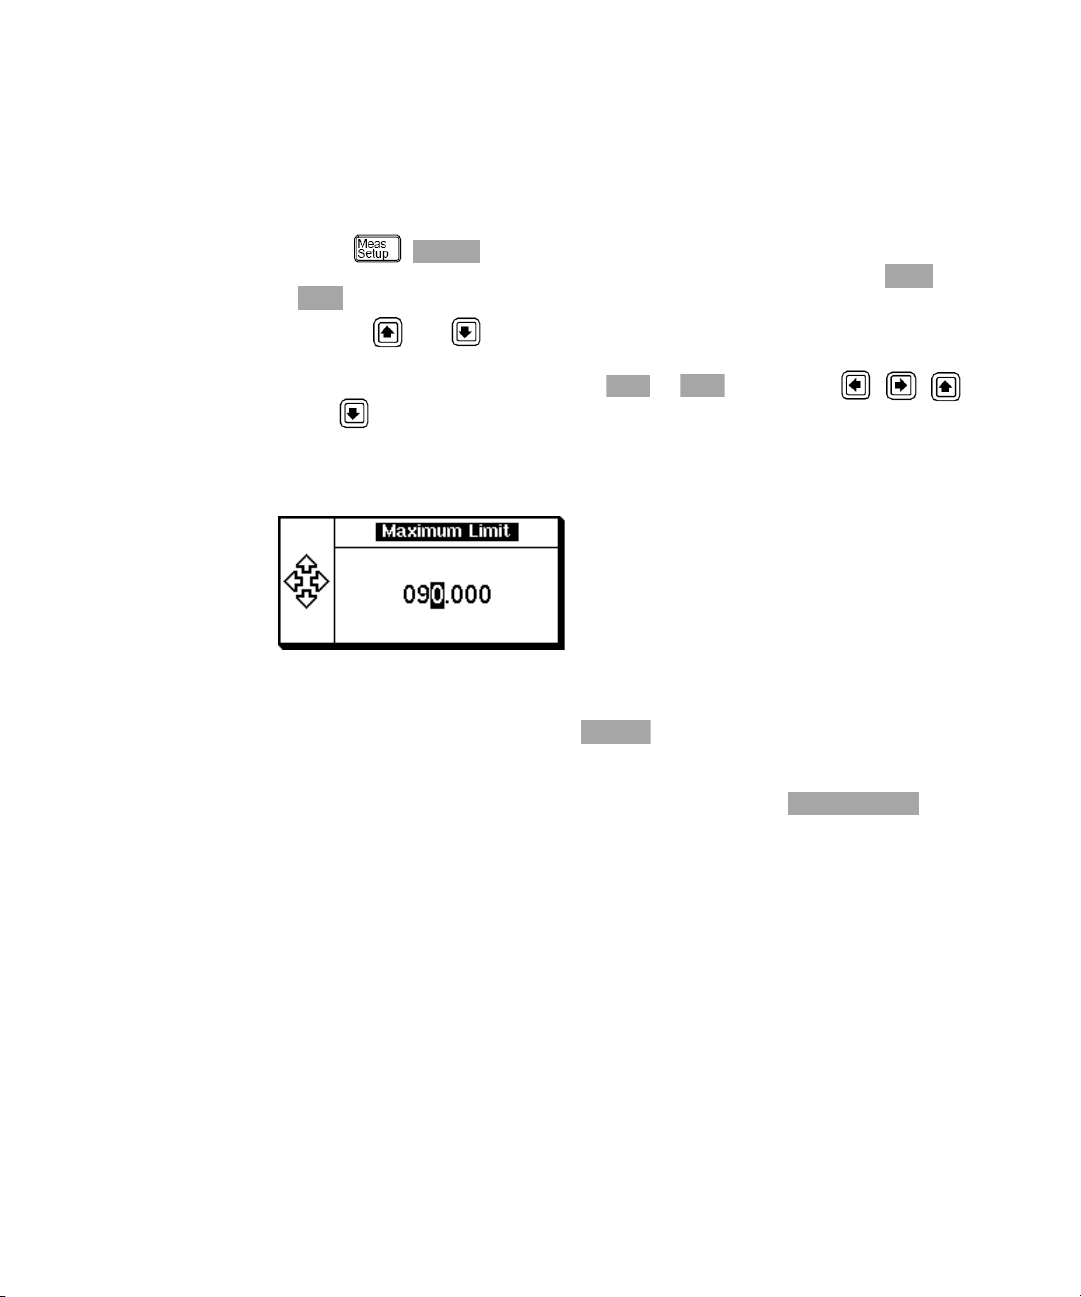
2 General Power Meter Functions
Limits
Max
Min
Max
Min
Limits
Limits Off On
Procedure
Set the limits as follows:
1 Press , . The current setting of the maximum and minimum
limits for the selected measurement line are displayed under the and
softkeys respectively.
2 Use the and keys to select the measurement line you want to
configure.
3 Change these settings by pressing or and use the , , ,
and keys to set the required values in the pop- up
Complete the entry by pressing the required power unit softkey.
windows.
Figure 2-16 Setting Maximum Limit
4 To enable limit checking, press to select On.
5 Repeat this process for each required measurement line.
Limits can be disabled and reenabled simply by pressing .
54 EPM-P Series Peak and Average Power Meters User’s Guide
Page 75
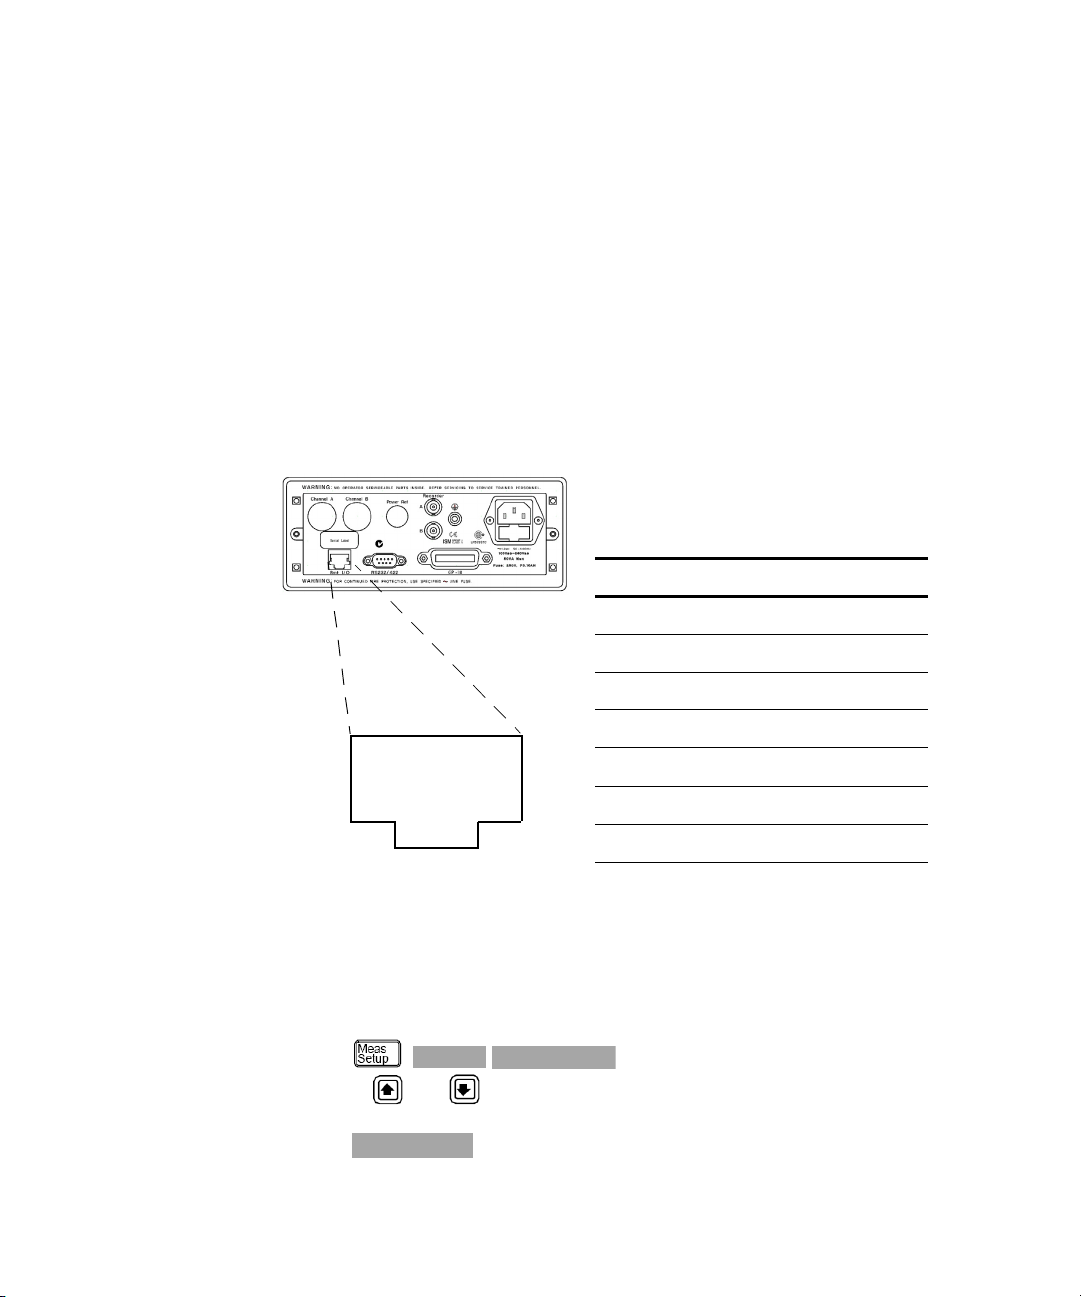
General Power Meter Functions 2
Pin number Connection
1None
2Ground
3TTL Output 1
4TTL Output 2
5TTL Input 1
6TTL Input 2
7Ground
8Ground
1 2 3 4 5 6 7 8
Limits
TTL Output
TTL Output
TTL outputs
The limits can also be set to output a TTL logic level at the rear panel Rmt I/O
port when the predefined limits are exceeded. You can switch the rear panel
TTL outputs on or off; set the TTL output level to active high or low; and
determine whether the TTL output represents an over limit condition, under
limit condition or both. Any two of the four measurement line limit conditions
can be connected to either TTL output line.
The TTL connector is an RJ- 45 Series shielded modular jack assembly with
the TTL output pins connected as shown in Figure 2- 17.
Figure 2-17 Remote I/O TTL Outputs
Procedure
Set the TTL Output as follows:
1 Press , .
2 Use the and keys to select the measurement line you want to
configure.
3 Press .
EPM-P Series Peak and Average Power Meters User’s Guide 55
Page 76

2 General Power Meter Functions
Enter
TTL Output
NOTE
Limits
Enter
Figure 2-18 TTL Output Pop-up
4 Use the and keys to select TTL Output line 1, 2, or Off. Press
to confirm your choice. The new setting appears under the
If you have selected a TTL Output line previously configured for another measurement, a
warning message is displayed
softkey.
Figure 2-19 Example of TTL Disconnect Warning Message
Your new connection overrides the previous configuration which is now
disconnected.
5 Press . The TTL output can indicate an over limit condition, under
limit condition or both. Use the and keys to select your choice
from the pop- up. Press
56 EPM-P Series Peak and Average Power Meters User’s Guide
to confirm your choice.
Page 77
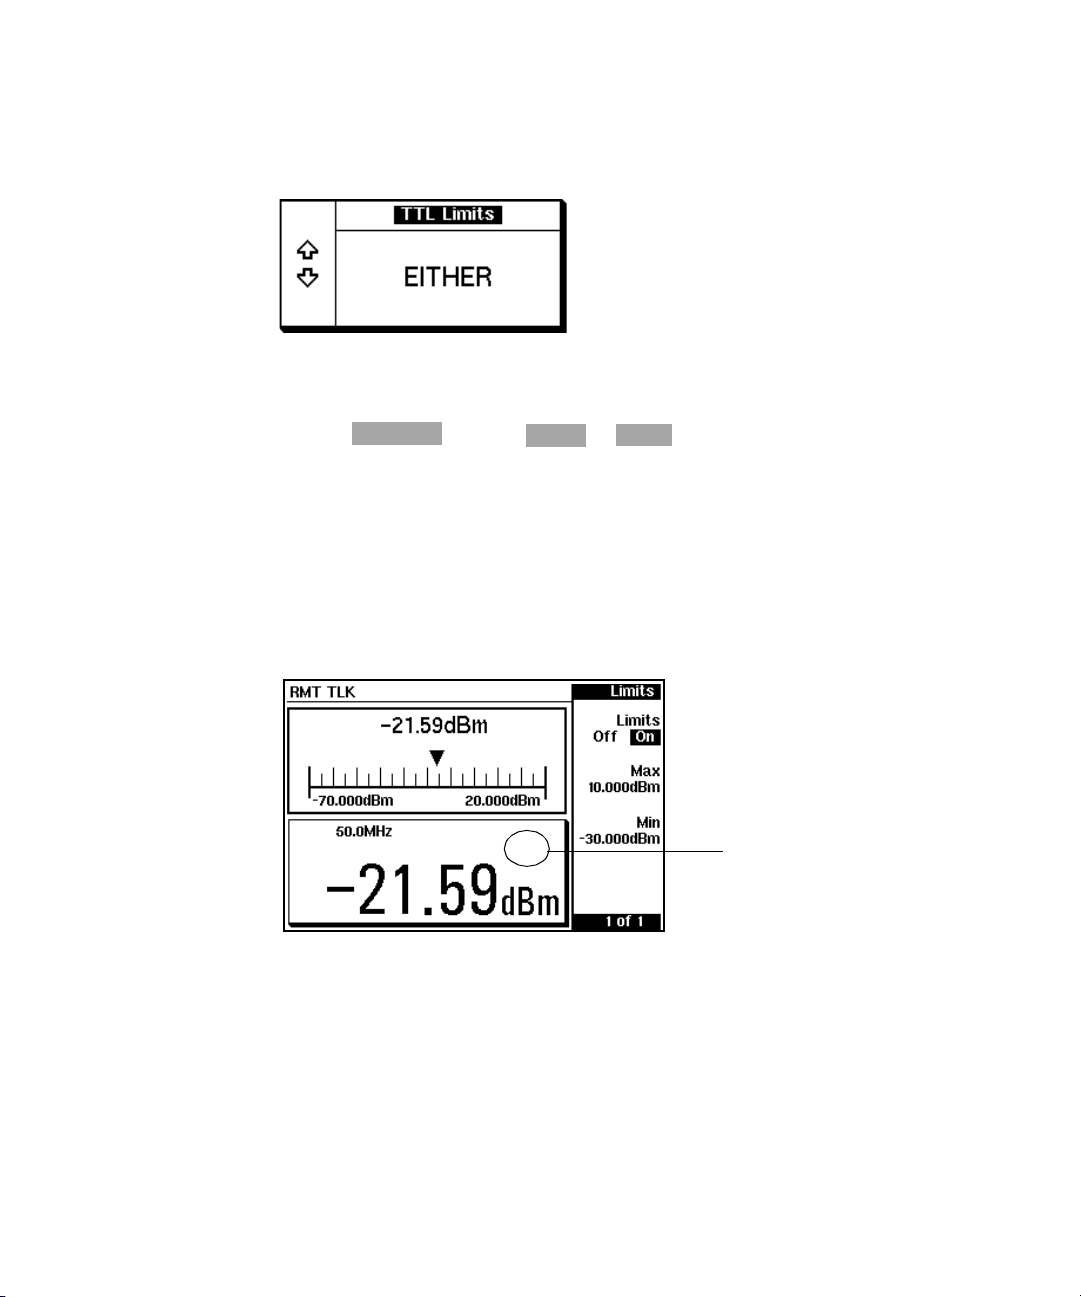
General Power Meter Functions 2
Fail O/P
High
Low
This measurement has
passed. This is indicated
by the empty limit field.
Figure 2-20 TTL Limits Pop-Up
6 You can choose a high or low level TTL output to represent a limits failure.
Press to select or to set a logical ‘1’ or logical ‘0’ for
a limits failure.
Checking for Limit Failures
Limit failures are displayed in the appropriate field in the measurement
window on the power meter’s display as shown in Figure 2- 21.
EPM-P Series Peak and Average Power Meters User’s Guide 57
Page 78
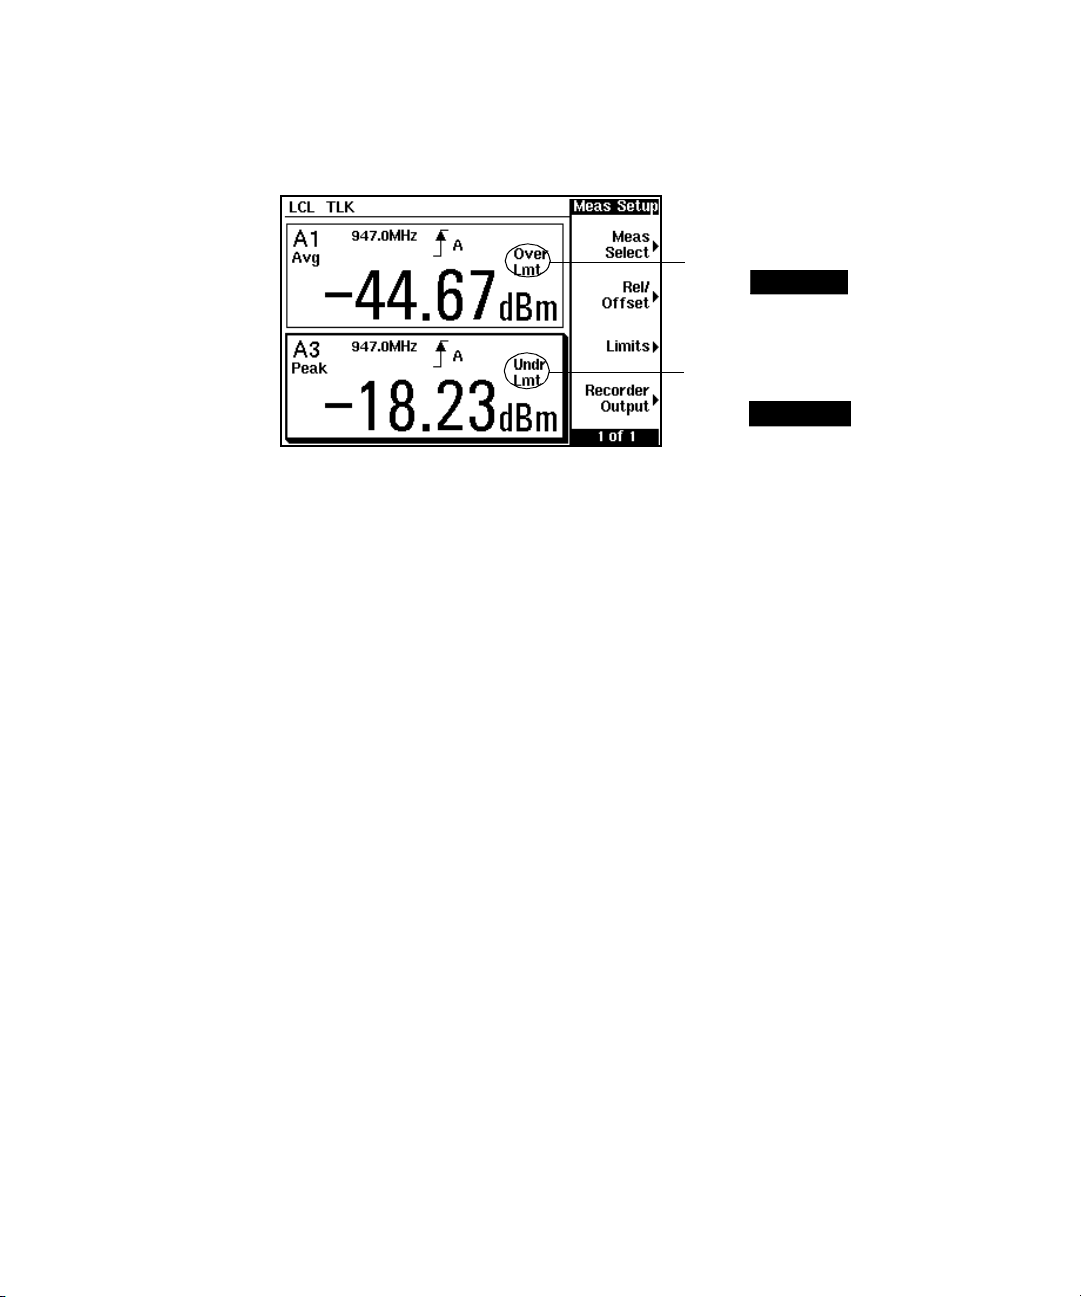
2 General Power Meter Functions
This measurement has failed as
the result is greater than the set
limit level. This is indicated with
the text .
Over Lmt
This measurement has failed as
the result is less than the set
limit level. This is indicated with
the text .
Undr Lmt
Figure 2-21 Limit Failures
58 EPM-P Series Peak and Average Power Meters User’s Guide
Page 79
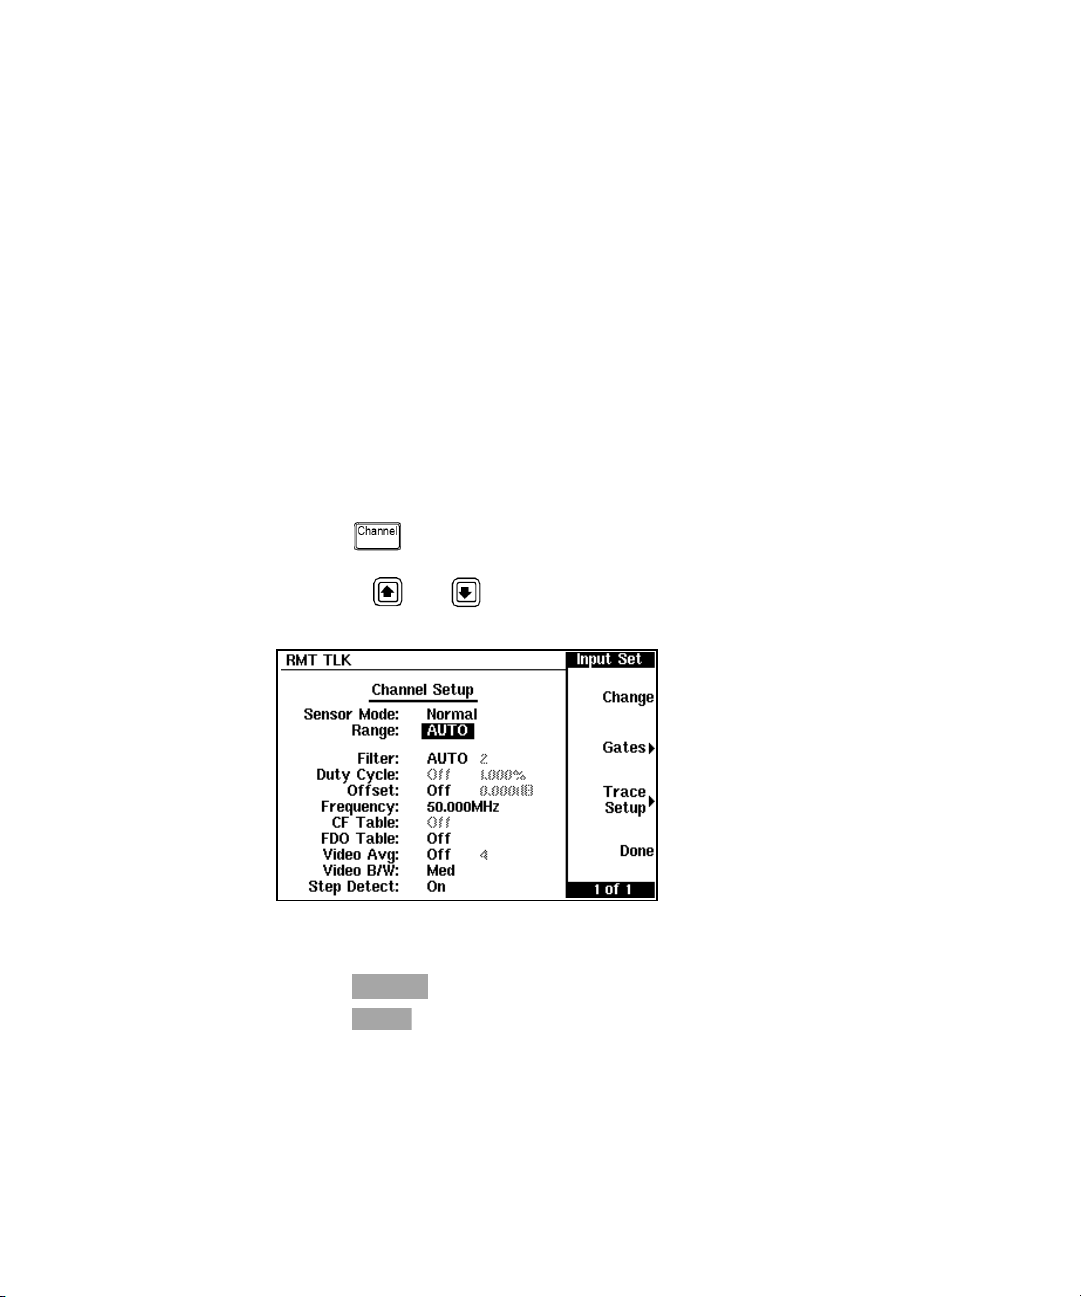
Setting the Range
Change
Done
The power meter has no internal ranges. The only ranges that can be set are
those of the E- Series and N8480 Series power sensors. With an E- Series or
N8480 Series power sensor (excluding Option CFT), the range can be set either
automatically or manually. There are two manual settings, LOWER and
UPPER. The lower range is more sensitive than the higher range. Use
autorange when you are not sure of the power level you will be measuring. Use
a manually configured range when you want to ensure there is no range
switching during the measurement. The default is AUTO.
Procedure
Set the range as follows:
1 Press to display the Channel Setup screen. The current Range:
setting is displayed.
2 Use the and keys to select the Range: setting.
General Power Meter Functions 2
Figure 2-22 Channel Setup - Range
3 Press and choose AUTO, LOWER, or UPPER as required.
4 Press to confirm your choice.
EPM-P Series Peak and Average Power Meters User’s Guide 59
Page 80

2 General Power Meter Functions
Analog
Anlg Mtr Scaling
Max
Min
Max
dBm
mWuWnW
Scaling the Analog Display
Configure a measurement displayed in format as follows:
1 Press .
2 Use the , , and keys to select the analog measurement window.
3 Press .
Figure 2-23 Analog Display in Lower Window
The and scale values are shown on the analog display and adjacent
to the softkey labels.
4 Press and use the , , , and keys to configure the
required value in the Meter Maximum pop- up window. Press , ,
, or , to complete the entry.
Figure 2-24 Meter Maximum Pop-Up
60 EPM-P Series Peak and Average Power Meters User’s Guide
Page 81

General Power Meter Functions 2
Min
dBm
mWuWnW
Increment Multiplier
Decrement Multiplier
xW
Press the keys to select the units required
5 Similarly, press and use the , , , and keys to configure
the required value in the Meter Minimum pop- up window. Press ,
, , or , to complete the entry.
Figure 2-25 Meter Minimum Pop-Up
TIP If you have selected linear scaling for the analog measurement and
the units you require are outwith the range of the displayed menu,
an additional menu is available. When the pop- up is displayed,
you can press to access the increment/decrement multiplier
menu. Use the or
to display the required units. Press the units softkey ( ) to
complete the entry.
EPM-P Series Peak and Average Power Meters User’s Guide 61
Page 82

2 General Power Meter Functions
Recorder Output
Max Power
Min Power
Recorder Output
Output
Max Power
Min Power
dBm
mWuWnW
Recorder Output
The rear panel Recorder Output connectors (A and B) produce a DC voltage
that corresponds to the power level in Watts of the channel, depending on the
measurement mode. This DC voltage ranges from 0 to +1 Vdc. The output
impedance is typically 1 kW. Channel and display offsets, and duty cycle have
no effect on the Recorder Outputs.
For example, the Recorder Outputs can be used to:
• record swept measurements
• level an output from a source using external leveling, or
• monitor the output power
To access the Recorder menu, press , . This menu
allows you to switch the Recorder Output signal either on or off. The
represent the 1 Vdc maximum and 0 Vdc minimum output voltage of the
Recorder Output.
Procedure
and softkeys allow you to scale the power levels to
Configure the recorder output as follows:
1 From a measurement display screen, use the , , and keys to
select the measurement window or measurement display line you want to
connect to the recorder output.
2 Press , and to select On.
3 Press and use the , , , and keys to
enter the power level you want to generate a 1 Vdc output in the Recorder
Maximum pop- up. Press , , , or , to complete the entry.
62 EPM-P Series Peak and Average Power Meters User’s Guide
Page 83

General Power Meter Functions 2
Min Power
dBm
mW
uW
nW
NOTE
Figure 2-26 Recorder Maximum Pop-Up
4 Similarly, press and use the , , , and keys to
enter the power level you want to generate a 0 Vdc output in the Recorder
Minimum pop- up. Press , , , or , to complete the entry.
Figure 2-27 Recorder Minimum Pop-Up
The highest power you are going to measure is used to determine the value which you
should set for the Recorder Output maximum setting. For example, if you are measuring a
power less than 1 mW and greater than 100 mW, then set the recorder maximum value to
1mW.
Log 50 40 30 20 10 0
Lin 100 W 10 W 1 W 100 mW 10 mW 1 mW
Log – 10 –20 –30 –40 –50 –60
Lin 100 mW 10 mW 1 mW 100 nW 10 nW 1 nW
EPM-P Series Peak and Average Power Meters User’s Guide 63
Page 84

2 General Power Meter Functions
Increment Multiplier
Decrement Multiplier
xW
Press these keys to select the units required
TIP If you have selected linear scaling for the analog measurement and
the units you require are outwith the range of the displayed menu,
an additional menu is available. When the pop- up is displayed,
you can press to access the increment/decrement multiplier
menu. Use the or
to display the required units. Press the units softkey ( ) to
complete the entry.
64 EPM-P Series Peak and Average Power Meters User’s Guide
Page 85

General Power Meter Functions 2
Save/Recall
NOTE
Save
Confirm
Saving and Recalling Power Meter Configurations
To reduce repeated setup sequences, up to ten power meter configurations can
be stored in nonvolatile memory.
The save/recall functions are part of the Sys/Inputs menu, accessed by
pressing the key.
To save a measurement setup:
1 Press , to display the Save/Recall screen as shown in
Figure 2- 28.
Figure 2-28 Save/Recall Screen
Your power meter has been shipped with measurement configurations suitable for
common wireless communication formats already saved as Instrument States. These
require E9320 E-Series power sensors. Refer to Chapter 3 for more information.
2 Using the and keys, select an available name from the displayed list.
To change the name of a register, proceed from step 4, otherwise press
.
3 The power meter prompts you to press to proceed.
EPM-P Series Peak and Average Power Meters User’s Guide 65
Page 86

2 General Power Meter Functions
Save/Recall
Edit Name
Insert Char
Delete Char
Enter
Save/Recall
NOTE
Confirm
Figure 2-29 “Save” Pop-Up
If you need to modify a name:
4 If you have not already done so, press , .
5 Use the and keys to select the required register and press
this as required:
• Use and keys to modify the character on which the cursor is
currently positioned.
• Use or to move to other characters.
• Use and as required.
6 To confirm your choice, press .
. The selected name is displayed in a pop- up window. Modify
To recall a measurement setup:
1 Press , .
2 Use the and keys to select the required register and press .
The key is disabled (greyed out) when an unused register is selected.
3 Press .
Figure 2-30 “Recall” Pop-Up
66 EPM-P Series Peak and Average Power Meters User’s Guide
Page 87

Measuring Pulsed Signals
Dty Cyc
NOTE
TIP The E- Series E9320 power sensors are best suited for peak and
pulse power measurement.
However, the E9300 E- Series, 8480 Series and N8480 Series power
sensors can be used to measure the power of a pulsed signal.
The measurement result is a mathematical representation of the
pulse power rather than an actual measurement (assumes
constant peak power). The power meter measures the average
power of the pulsed input signal and then divides the
measurement result by the duty cycle value to obtain the pulse
power reading. The allowable range of values is 0.001% to 100%.
The default value is 1.000%.
If duty cycle is enabled and the channel is setup in single numeric
display format, the message is displayed.
Pulse measurements are not recommended using Agilent E4412A and E4413A power
sensors.
General Power Meter Functions 2
EPM-P Series Peak and Average Power Meters User’s Guide 67
Page 88

2 General Power Meter Functions
Power
Time
B
A
Duty Cycle = A
B
Change
An example of a pulsed signal is shown in Figure 2- 31.
Figure 2-31 Pulsed Signal
Procedure
Set the duty cycle as follows:
1 Press . Select the channel you want to configure. The current setting
of the duty cycle is displayed in the channel setup table.
2 Use the , , , and keys to select the duty cycle setting and
press to select On.
Figure 2-32 Duty Cycle: Off
68 EPM-P Series Peak and Average Power Meters User’s Guide
Page 89

General Power Meter Functions 2
Change
%
Done
NOTE
3 Use the , , , and keys to select the duty cycle value and
press .
Figure 2-33 Duty Cycle Pop-Up
4 Again use the , , , and keys to select and change the values
as required. Complete the entry by pressing .
Figure 2-34 Duty Cycle: On, 50%
5 Press .
Pulse power averages out any aberrations in the pulse such as overshooting or ringing. For
this reason, it is called pulse power and not peak power or peak pulse power.
In order to ensure accurate pulse power readings, the input signal must be pulsed with a
rectangular pulse. Other pulse shapes (such as triangle, chirp or Gaussian) will cause
erroneous results.
The pulse power on/off ratio must be much greater than the duty cycle ratio.
EPM-P Series Peak and Average Power Meters User’s Guide 69
Page 90

2 General Power Meter Functions
Select Interface
GBIP Addr
Baud Rate
Word Size
Stop Bits
Parity
Pacing
Echo
Sensor Cal Tables
Table
Freq.Dep.Offset
Table
Linearity
Power Ref
Must Cal
Presetting the Power Meter
This section details the power meter’s preset conditions.
The GPIB address, the data stored in the sensor calibration tables, and the
zeroing and calibration data are not affected by a (Preset). The
calibration table selected is not affected.
Preset Conditions
The number of windows displayed is two.
is not affected.
is not affected.
is not affected.
is not affected.
is not affected.
is not affected.
is not affected.
is not affected.
channel is not affected.
channel is not affected.
is set to Atype.
is set to Off.
is not affected
70 EPM-P Series Peak and Average Power Meters User’s Guide
Page 91

General Power Meter Functions 2
Gates
Trace Setup
Sensor Mode: Is active and set to Normal mode only when an E9320A
E- Series sensor is connected, otherwise inactive and greyed
out in AVG only setting.
Range: Is active and set to Auto only when an E9320A E- Series,
E9300 E- Series sensor or N8480 Series sensor (excluding
Option CFT) is connected, otherwise inactive and greyed out
in Auto setting.
Filter: Is set to Auto.
Duty Cycle: Is set to Off. Is inactive and greyed out when an E9320
E- Series sensor is connected and in normal mode.
Offset: Is set to Off.
Frequency: Is only available when an E- Series sensor or N8480 Series
sensor (excluding Option CFT) is connected and is set to
50.000 MHz.
Cal Fac: Is only available when an 8480 Series sensor or N8480 Series
sensor with Option CFT is connected and is set to 100%.
CF Table: Is not affected when an 8480 Series sensor or N8480 Series
sensor with Option CFT is connected, otherwise inactive and
greyed out in the Off setting.
FDO Table: Is not affected.
Video Avg: Is set to Off when and E9320A E- Series sensor is connected
otherwise greyed out in the Off setting.
Video B/W: Is set to Off when and E9320A E- Series sensor is connected
otherwise greyed out in the Off setting.
Step Detect: Is set to On.
Is only available when an E9320A E- Series power sensor is
connected.
Gate Start: All gates are set to 0.0000 s.
Gate Length: Gate 1 is set to 100.00 μs. Gates 2, 3, and 4 are set to 0.0000 s.
Is only available when an E9320A E- Series power sensor is
connected.
Start: Is set to 0.0000 s.
Length: Is set to 100.00 μs.
Max: Is set to 20.000 dBm.
Min: Is set to –50.000 dBm.
Min: Is set to dBm.
EPM-P Series Peak and Average Power Meters User’s Guide 71
Page 92

2 General Power Meter Functions
Acqn
Stop Run
Source
Mode
Delay
Slope
Holdoff
Hysteresis
Output
Function
Rel
Rel
Offset
Offset
Limits
Max
Min
TTL Output
Disp Type
Resolution
Unit
Is set to –90.000 dBm.
All Trigger configurations are inactive and greyed
out unless an E9320A E- Series power sensor is
connected.
Is set to Free Run.
Is set to Run.
Is set to Int.
Is set to AutoLvl.
Is set to 0.0000 s.
Is set to +.
Is set to 1.0000 μs.
Is set to 0.000 dB.
Is set to Off.
Chan, Gate, and Meas are all inactive and greyed
out, regardless of sensor type.
Is set to Single.
Is set to Off.
Is set to 0.000 dBm.
Is set to Off.
Is set to 0.000 dB.
Is set to Off.
Is set to 90.000 dBm.
Is set to Off.
Upper window is set to Single Numeric and the Lower
window to Analog.
Is set to 3.
Is set to dBm.
72 EPM-P Series Peak and Average Power Meters User’s Guide
Page 93

General Power Meter Functions 2
Freq
Cal Fac
Power Ref
Is only available when an E- Series sensor or N8480
Series sensor (excluding Option CFT) is connected
and is set to 50.000 MHz
Is only available when an 8480 Series sensor or N8480
Series sensor with Option CFT is connected and is set
to 100%
Is set to Off.
EPM-P Series Peak and Average Power Meters User’s Guide 73
Page 94

2 General Power Meter Functions
74 EPM-P Series Peak and Average Power Meters User’s Guide
Page 95

EPM-P Series Peak and Average Power Meters
User’s Guide
3 Using E9320 E-Series Power Sensors
Introduction 76
Power Meter Configuration 78
Configuring a Peak Power Measurement 82
The Set Up Process 83
Measurement Example 109
Using Preinstalled Measurement Setups 114
Agilent Technologies
75
Page 96

3 Using E9320 E-Series Power Sensors
NOTE
Introduction
The E9320 E- Series power sensors have dual modes of operation.
• The normal mode is optimized for a wider bandwidth but with reduced
dynamic range. The instantaneous power of an RF signal can be detected
with, depending on the sensor type, up to 5 MHz of video bandwidth
(modulation bandwidth). Use this mode to measure the peak and average
power of pulsed or modulated signals.
• The average-only mode is optimized for high accuracy and wide dynamic
range. Use this mode to measure the average power of signals below the
dynamic range of normal mode.
The term ‘video’ is applied here to a signal that has been amplitude demodulated from an
RF carrier but contains components in the RF part of the spectrum. For a power meter it
refers to the output of the sensor diodes in normal mode.
In normal mode the EPM- P Series power meters and E9320 E- Series power
sensors continuously sample the RF signal at a 20 Msample/s rate. A trigger
can be taken from a rising or falling edge of an RF signal pulse or controlled
externally via GPIB or TTL input.
Ta b l e 3- 1 Sensor Bandwidth
Video bandwidth setting
Sensor Low Medium High Off
E9321A
E9325A
E9322A
E9326A
E9323A
E9327A
* The Low, Medium, and High settings provide flat filter responses with very sharp cutoff points by
applying digital signal processing techniques. The Off setting removes all signal conditioning.
Refer to Figure 3-5.
30 kHz 100 kHz 300 kHz 300 kHz*
100 kHz 300 kHz 1.5 MHz 1.5 MHz*
300 kHz 1.5 MHz 5 MHz
76 EPM-P Series Peak and Average Power Meters User’s Guide
5 MHz*
Page 97

Using E9320 E-Series Power Sensors 3
NOTE
Maximum dynamic range is related to the maximum sensor bandwidth. Please refer to the
documentation supplied with your E-Series E9320 power sensor for specification
information.
EPM-P Series Peak and Average Power Meters User’s Guide 77
Page 98

3 Using E9320 E-Series Power Sensors
Power Meter Configuration
The EPM-P Series power meters automatically recognize an E-Series E9320
power sensor when it is connected. The sensor calibration data, characterizing
the sensor output versus input power, frequency, and temperature, is
automatically read by the power meter.
Default Channel Setup
When an E- Series E9320 power sensor is connected, the following Channel
Setup is automatically configured. Carrying out a Preset returns the power
meter to this configuration.
Any changes made to the Channel Setup are retained after a power cycle.
Figure 3-1 E-Series E9320 Power Sensor Default Channel Setup
78 EPM-P Series Peak and Average Power Meters User’s Guide
Page 99

Measurement Method
Gate 3
Trigger
Gate 2
Gate 4
Gate 1
The E4416A meter and E9320 E- Series power sensors continuously sample
the RF signal at a 20 MHz rate. Similarly, the E4417A samples both channels at
the same rate. Various trigger methods enable the measurement of
continuously modulated signals or single events.
Measurement Gates
A system of gates, controlled by and referenced to a trigger point, is used to
extract measurement data from the captured trace. The trace data within each
gate period is subsequently used for the individual measurement calculations.
Up to four gates can be set up for each channel (Refer to Figure 3- 2.)
Using E9320 E-Series Power Sensors 3
Figure 3-2 Measurement Gates
With the gates setup as shown in Figure 3- 2 for example, you can
simultaneously measure:
• The average power level of the pulse: Gate 1, average measurement
• The Peak to average ratio: Gate 1, peak-to- average measurement
EPM-P Series Peak and Average Power Meters User’s Guide 79
• The Pulse droop: Gate 3, average measurement, minus Gate 4, average
measurement
• The average ''off'' power level ahead of the pulse: Gate 2, average
measurement.
Page 100

3 Using E9320 E-Series Power Sensors
Gates 1 to 4
Peak
Aver age
Pk-to-Avg
Gate 1
Peak
Aver age
Pk-to-Avg
Peak
Average
Pk-to-Avg
Peak
Average
Pk-to-Avg
Feed 1
Feed 2
Feed 1
Feed 2
Feed 1
Feed 2
Feed 1
Feed 2
Gate 2
Gate 3
Gate 4
12 measurements per channel
Measurement Display
Average, peak, and peak-to- average ratio measurements are made within each
gate period generating 12 possible measurement results per channel as shown
in Figure 3- 3.
Figure 3-3 Twelve Measurements per Channel
The EPM-P power meters cannot display all 12 (or 24) measurements
simultaneously. However, up to four measurements or a combination of
measurements and traces can be shown on the display. Any of the four
measurement display lines can show any of the measurement results from any
of the four gates allowing you complete control of the displayed information.
Each displayed line has a measurement feed. Each measurement feed has two
independent inputs, Feed 1 and Feed 2. The two Feeds, 1 and 2, can carry any
of the 12 measurement results from the 4 gates.
(24 measurements from eight gates in the dual channel E4417A.) Only Feed 1
80 EPM-P Series Peak and Average Power Meters User’s Guide
can be displayed in Single M ode. In Combined Mode, Feed 1 – Feed 2 or Fee d 1
/ Feed 2 can be displayed.
 Loading...