


GSM Measurement Guide
Agilent Technologies E4406A VSA Series
Transmitter Tester
Manufacturing Part Number: E4406-90131
Printed in USA
July 2000
© Copyright 1999 - 2000 Agilent Technologies, Inc.

The information contained in this document is subject to change
without notice.
Agilent Technologiesmakesnowarrantyofanykindwithregard to this
material, including but not limited to, the implied warranties of
merchantability and fitness for a particular purpose. Agilent
Technologies shall not be liable for errors contained herein or for
incidental or consequential damages in connection with the furnishing,
performance, or use of this material.
2

Contents
1. Understanding GSM
What Is GSM?. . . . . . . . . . . . . . . . . . . . . . . . . . . . . . . . . . . . . . . . . . . . . . . . . . . . . . . . . . . . . . . . 8
Mobile Stations and Base Transceiver Stations . . . . . . . . . . . . . . . . . . . . . . . . . . . . . . . . . . 10
Uplink and Downlink . . . . . . . . . . . . . . . . . . . . . . . . . . . . . . . . . . . . . . . . . . . . . . . . . . . . . . .10
What Is an ARFCN? . . . . . . . . . . . . . . . . . . . . . . . . . . . . . . . . . . . . . . . . . . . . . . . . . . . . . . . .10
What are Timeslots? . . . . . . . . . . . . . . . . . . . . . . . . . . . . . . . . . . . . . . . . . . . . . . . . . . . . . . . . 10
What Does the Agilent Technologies E4406A VSA Series Transmitter Tester Do?. . . . . . . . 11
Other Sources of Measurement Information . . . . . . . . . . . . . . . . . . . . . . . . . . . . . . . . . . . . . . 12
Instrument Updates at www.agilent.com/find/vsa . . . . . . . . . . . . . . . . . . . . . . . . . . . . . . . . 12
2. Setting Up the GSM Mode
Accessing the Mode . . . . . . . . . . . . . . . . . . . . . . . . . . . . . . . . . . . . . . . . . . . . . . . . . . . . . . . . . . 14
How to Make a Measurement . . . . . . . . . . . . . . . . . . . . . . . . . . . . . . . . . . . . . . . . . . . . . . . . . . 15
Changing the Mode Setup . . . . . . . . . . . . . . . . . . . . . . . . . . . . . . . . . . . . . . . . . . . . . . . . . . . . .16
Radio . . . . . . . . . . . . . . . . . . . . . . . . . . . . . . . . . . . . . . . . . . . . . . . . . . . . . . . . . . . . . . . . . . . . 16
Input . . . . . . . . . . . . . . . . . . . . . . . . . . . . . . . . . . . . . . . . . . . . . . . . . . . . . . . . . . . . . . . . . . . . 17
Trigger . . . . . . . . . . . . . . . . . . . . . . . . . . . . . . . . . . . . . . . . . . . . . . . . . . . . . . . . . . . . . . . . . . . 19
Demod . . . . . . . . . . . . . . . . . . . . . . . . . . . . . . . . . . . . . . . . . . . . . . . . . . . . . . . . . . . . . . . . . . . 21
Changing the Frequency Channel. . . . . . . . . . . . . . . . . . . . . . . . . . . . . . . . . . . . . . . . . . . . . . . 22
GSM Measurement Key Flow . . . . . . . . . . . . . . . . . . . . . . . . . . . . . . . . . . . . . . . . . . . . . . . . . . 24
Installing Optional
Measurement Personalities. . . . . . . . . . . . . . . . . . . . . . . . . . . . . . . . . . . . . . . . . . . . . . . . . . . .36
Available Personality Options . . . . . . . . . . . . . . . . . . . . . . . . . . . . . . . . . . . . . . . . . . . . . . . . 37
License Key Numbers. . . . . . . . . . . . . . . . . . . . . . . . . . . . . . . . . . . . . . . . . . . . . . . . . . . . . . .37
Installing a License Key Number. . . . . . . . . . . . . . . . . . . . . . . . . . . . . . . . . . . . . . . . . . . . . . 38
Using the Uninstall Key. . . . . . . . . . . . . . . . . . . . . . . . . . . . . . . . . . . . . . . . . . . . . . . . . . . . .39
3. Making GSM Measurements
GSM Measurements. . . . . . . . . . . . . . . . . . . . . . . . . . . . . . . . . . . . . . . . . . . . . . . . . . . . . . . . . . 42
Preparing for Measurements. . . . . . . . . . . . . . . . . . . . . . . . . . . . . . . . . . . . . . . . . . . . . . . . . . . 43
Initial Setup. . . . . . . . . . . . . . . . . . . . . . . . . . . . . . . . . . . . . . . . . . . . . . . . . . . . . . . . . . . . . . . 43
How to Make a Measurement. . . . . . . . . . . . . . . . . . . . . . . . . . . . . . . . . . . . . . . . . . . . . . . 43
Measurement Control. . . . . . . . . . . . . . . . . . . . . . . . . . . . . . . . . . . . . . . . . . . . . . . . . . . . . . .44
Measurement Setup . . . . . . . . . . . . . . . . . . . . . . . . . . . . . . . . . . . . . . . . . . . . . . . . . . . . . . . .45
Averaging. . . . . . . . . . . . . . . . . . . . . . . . . . . . . . . . . . . . . . . . . . . . . . . . . . . . . . . . . . . . . . . 45
Trig Source. . . . . . . . . . . . . . . . . . . . . . . . . . . . . . . . . . . . . . . . . . . . . . . . . . . . . . . . . . . . . . 47
Burst Sync . . . . . . . . . . . . . . . . . . . . . . . . . . . . . . . . . . . . . . . . . . . . . . . . . . . . . . . . . . . . . . 48
Making the Transmit Power Measurement . . . . . . . . . . . . . . . . . . . . . . . . . . . . . . . . . . . . . . . 49
Purpose . . . . . . . . . . . . . . . . . . . . . . . . . . . . . . . . . . . . . . . . . . . . . . . . . . . . . . . . . . . . . . . . . . 49
Measurement Method. . . . . . . . . . . . . . . . . . . . . . . . . . . . . . . . . . . . . . . . . . . . . . . . . . . . . . . 49
Making the Measurement . . . . . . . . . . . . . . . . . . . . . . . . . . . . . . . . . . . . . . . . . . . . . . . . . . . 50
Results. . . . . . . . . . . . . . . . . . . . . . . . . . . . . . . . . . . . . . . . . . . . . . . . . . . . . . . . . . . . . . . . . . . 51
Changing the Measurement Setup . . . . . . . . . . . . . . . . . . . . . . . . . . . . . . . . . . . . . . . . . . . . 52
Troubleshooting Hints . . . . . . . . . . . . . . . . . . . . . . . . . . . . . . . . . . . . . . . . . . . . . . . . . . . . . .53
Making the Power vs. Time Measurement. . . . . . . . . . . . . . . . . . . . . . . . . . . . . . . . . . . . . . . . 54
Purpose . . . . . . . . . . . . . . . . . . . . . . . . . . . . . . . . . . . . . . . . . . . . . . . . . . . . . . . . . . . . . . . . . . 54
Measurement Method. . . . . . . . . . . . . . . . . . . . . . . . . . . . . . . . . . . . . . . . . . . . . . . . . . . . . . . 54
Making the Measurement . . . . . . . . . . . . . . . . . . . . . . . . . . . . . . . . . . . . . . . . . . . . . . . . . . . 55
3

Contents
Results . . . . . . . . . . . . . . . . . . . . . . . . . . . . . . . . . . . . . . . . . . . . . . . . . . . . . . . . . . . . . . . . . . .56
Changing the Measurement Setup . . . . . . . . . . . . . . . . . . . . . . . . . . . . . . . . . . . . . . . . . . . . .57
Power vs. Time Custom Masks . . . . . . . . . . . . . . . . . . . . . . . . . . . . . . . . . . . . . . . . . . . . . .57
Changing the View. . . . . . . . . . . . . . . . . . . . . . . . . . . . . . . . . . . . . . . . . . . . . . . . . . . . . . . . . .58
Changing the Display. . . . . . . . . . . . . . . . . . . . . . . . . . . . . . . . . . . . . . . . . . . . . . . . . . . . . . . .58
Troubleshooting Hints . . . . . . . . . . . . . . . . . . . . . . . . . . . . . . . . . . . . . . . . . . . . . . . . . . . . . . .58
Making the Phase and Frequency Error Measurement . . . . . . . . . . . . . . . . . . . . . . . . . . . . . .59
Purpose . . . . . . . . . . . . . . . . . . . . . . . . . . . . . . . . . . . . . . . . . . . . . . . . . . . . . . . . . . . . . . . . . .59
Measurement Method . . . . . . . . . . . . . . . . . . . . . . . . . . . . . . . . . . . . . . . . . . . . . . . . . . . . . . .59
Making the Measurement . . . . . . . . . . . . . . . . . . . . . . . . . . . . . . . . . . . . . . . . . . . . . . . . . . . .60
Results . . . . . . . . . . . . . . . . . . . . . . . . . . . . . . . . . . . . . . . . . . . . . . . . . . . . . . . . . . . . . . . . . . .61
Changing the Measurement Setup . . . . . . . . . . . . . . . . . . . . . . . . . . . . . . . . . . . . . . . . . . . . .64
Changing the View. . . . . . . . . . . . . . . . . . . . . . . . . . . . . . . . . . . . . . . . . . . . . . . . . . . . . . . . . .64
Changing the Display. . . . . . . . . . . . . . . . . . . . . . . . . . . . . . . . . . . . . . . . . . . . . . . . . . . . . . . .65
Troubleshooting Hints . . . . . . . . . . . . . . . . . . . . . . . . . . . . . . . . . . . . . . . . . . . . . . . . . . . . . . .65
Making the Output RF Spectrum Measurement. . . . . . . . . . . . . . . . . . . . . . . . . . . . . . . . . . . .66
Purpose . . . . . . . . . . . . . . . . . . . . . . . . . . . . . . . . . . . . . . . . . . . . . . . . . . . . . . . . . . . . . . . . . .66
Measurement Method . . . . . . . . . . . . . . . . . . . . . . . . . . . . . . . . . . . . . . . . . . . . . . . . . . . . . . .67
Making the Measurement . . . . . . . . . . . . . . . . . . . . . . . . . . . . . . . . . . . . . . . . . . . . . . . . . . . .70
Results . . . . . . . . . . . . . . . . . . . . . . . . . . . . . . . . . . . . . . . . . . . . . . . . . . . . . . . . . . . . . . . . . . .71
Changing the Measurement Setup . . . . . . . . . . . . . . . . . . . . . . . . . . . . . . . . . . . . . . . . . . . . .72
Changing the View. . . . . . . . . . . . . . . . . . . . . . . . . . . . . . . . . . . . . . . . . . . . . . . . . . . . . . . . . .77
Troubleshooting Hints . . . . . . . . . . . . . . . . . . . . . . . . . . . . . . . . . . . . . . . . . . . . . . . . . . . . . . .77
Making the Spectrum (Frequency Domain) Measurement. . . . . . . . . . . . . . . . . . . . . . . . . . . .78
Purpose . . . . . . . . . . . . . . . . . . . . . . . . . . . . . . . . . . . . . . . . . . . . . . . . . . . . . . . . . . . . . . . . . .78
Measurement Method . . . . . . . . . . . . . . . . . . . . . . . . . . . . . . . . . . . . . . . . . . . . . . . . . . . . . . .78
Making the Measurement . . . . . . . . . . . . . . . . . . . . . . . . . . . . . . . . . . . . . . . . . . . . . . . . . . . .78
Results . . . . . . . . . . . . . . . . . . . . . . . . . . . . . . . . . . . . . . . . . . . . . . . . . . . . . . . . . . . . . . . . . . .78
Changing the Measurement Setup . . . . . . . . . . . . . . . . . . . . . . . . . . . . . . . . . . . . . . . . . . . . .80
Changing the View . . . . . . . . . . . . . . . . . . . . . . . . . . . . . . . . . . . . . . . . . . . . . . . . . . . . . . . . .84
Windows Available for Spectrum Measurements. . . . . . . . . . . . . . . . . . . . . . . . . . . . . . . .84
Using the Markers . . . . . . . . . . . . . . . . . . . . . . . . . . . . . . . . . . . . . . . . . . . . . . . . . . . . . . . . . .84
Band Power. . . . . . . . . . . . . . . . . . . . . . . . . . . . . . . . . . . . . . . . . . . . . . . . . . . . . . . . . . . . . .85
Troubleshooting Hints . . . . . . . . . . . . . . . . . . . . . . . . . . . . . . . . . . . . . . . . . . . . . . . . . . . . . . .85
Making the Waveform (Time Domain) Measurement . . . . . . . . . . . . . . . . . . . . . . . . . . . . . . . .86
Purpose . . . . . . . . . . . . . . . . . . . . . . . . . . . . . . . . . . . . . . . . . . . . . . . . . . . . . . . . . . . . . . . . . .86
Measurement Method . . . . . . . . . . . . . . . . . . . . . . . . . . . . . . . . . . . . . . . . . . . . . . . . . . . . . . .86
Making the Measurement . . . . . . . . . . . . . . . . . . . . . . . . . . . . . . . . . . . . . . . . . . . . . . . . . . . .86
Results . . . . . . . . . . . . . . . . . . . . . . . . . . . . . . . . . . . . . . . . . . . . . . . . . . . . . . . . . . . . . . . . . . .87
Changing the Measurement Setup . . . . . . . . . . . . . . . . . . . . . . . . . . . . . . . . . . . . . . . . . . . . .88
Changing the View . . . . . . . . . . . . . . . . . . . . . . . . . . . . . . . . . . . . . . . . . . . . . . . . . . . . . . . . .91
Windows Available for Waveform Measurements. . . . . . . . . . . . . . . . . . . . . . . . . . . . . . . .91
Using the Markers . . . . . . . . . . . . . . . . . . . . . . . . . . . . . . . . . . . . . . . . . . . . . . . . . . . . . . . . . .91
Band Power. . . . . . . . . . . . . . . . . . . . . . . . . . . . . . . . . . . . . . . . . . . . . . . . . . . . . . . . . . . . . .92
Troubleshooting Hints . . . . . . . . . . . . . . . . . . . . . . . . . . . . . . . . . . . . . . . . . . . . . . . . . . . . . . .92
Making the Tx Band Spur Measurement. . . . . . . . . . . . . . . . . . . . . . . . . . . . . . . . . . . . . . . . . .93
Purpose . . . . . . . . . . . . . . . . . . . . . . . . . . . . . . . . . . . . . . . . . . . . . . . . . . . . . . . . . . . . . . . . . . .93
Measurement Method . . . . . . . . . . . . . . . . . . . . . . . . . . . . . . . . . . . . . . . . . . . . . . . . . . . . . . .93
Making the Measurement . . . . . . . . . . . . . . . . . . . . . . . . . . . . . . . . . . . . . . . . . . . . . . . . . . . .94
4

Contents
Results. . . . . . . . . . . . . . . . . . . . . . . . . . . . . . . . . . . . . . . . . . . . . . . . . . . . . . . . . . . . . . . . . . . 95
Changing the Measurement Setup . . . . . . . . . . . . . . . . . . . . . . . . . . . . . . . . . . . . . . . . . . . . 95
Changing the View . . . . . . . . . . . . . . . . . . . . . . . . . . . . . . . . . . . . . . . . . . . . . . . . . . . . . . . . . 96
Troubleshooting Hints . . . . . . . . . . . . . . . . . . . . . . . . . . . . . . . . . . . . . . . . . . . . . . . . . . . . . .96
5

Contents
6

1 Understanding GSM
7

Understanding GSM
What Is GSM?
What Is GSM?
The Global System for Mobile communication (GSM) digital
communications standard defines a voice and data over-air interface
between a mobile radio and the system infrastructure. This standard
was designed as the basis for a radio communications system. A base
station control center (BSC) is linked to multiple base transceiver
station (BTS) sites which provide the required coverage.
GSM 900, GSM 450, GSM 480, GSM 850, DCS 1800, and PCS 1900 are
GSM-defined frequency bands. The term GSM 900 is used for any GSM
system operating in the 900 MHz band, which includes P-GSM,
E-GSM, and R-GSM. Primary (or standard) GSM 900 band (P-GSM) is
the original GSM band. Extended GSM 900 band (E-GSM) includes all
the P-GSM band plus an additional 50 channels. Railway GSM 900
band (R-GSM) includes all the E-GSM band plus additional channels.
DCS 1800 is an adaptation of GSM 900, created to allow for smaller cell
sizes for higher system capacity. PCS 1900 is intended to be identical to
DCS 1800 except for frequency allocation and power levels. The term
GSM 1800 is sometimes used for DCS 1800, and the term GSM 1900 is
sometimesusedforPCS1900.Forspecificsonthebands,refertoTable
1-1.
The GSM digital communications standard employs an 8:1 Time
Division Multiple Access (TDMA) allowing eight channels to use one
carrier frequency simultaneously. The 270.833 kbits/second raw bit rate
is modulated on the RF carrier using Gaussian Minimum Shift
Keying (GMSK).
The standard includes multiple traffic channels (TCH), a control
channel (CCH), and a broadcast control channel (BCCH). The GSM
specification defines a channel spacing of 200 kHz.
8 Chapter1

Table 1-1 GSM Band Data
Understanding GSM
What Is GSM?
P-GSM
(GSM 900)
Uplink
(MS Transmit)
Downlink
(BTS Transmit)
Range
(ARFCN)
TX/RX Spacing
(Freq.)
TX/RX Spacing
(Time)
Modulation
Data Rate
GMSK (kbits/s):
8PSK (kbits/s):
Frame Period 4.615 ms 4.615 ms 4.615 ms 4.615 ms 4.615 ms
Timeslot Period 576.9 µs 576.9 µs 576.9µs 576.9 µs 576.9 µs
Bit Period 3.692 µs 3.692 µs 3.692 µs 3.692 µs 3.692 µs
Modulation 0.3 GMSK
890 to 915
MHz
935 to 960
MHz
1 to 124 0 to 124
45 MHz 45 MHz 45 MHz 95 MHz 80 MHz
3 timeslots 3 timeslots 3 timeslots 3 timeslots 3 timeslots
270.833
812.499
3π/8 8PSK
E-GSM
(GSM 900)
880 to 915
MHz
925 to 960
MHz
and
975 to 1023
270.833
812.499
0.3 GMSK
3π/8 8PSK
R-GSM
(GSM 900)
876 to 915
MHz
921 to 960
MHz
1 to 124
and
955 to1023
270.833
812.499
0.3 GMSK
3π/8 8PSK
DCS 1800
(GSM 1800)
1710 to 1785
MHz
1805 to 1880
MHz
512 to 885 512 to 810 259 to 293 306 to 340 128 to 251
270.833
812.499
0.3 GMSK
3π/8 8PSK
PCS 1900
(GSM 1900)
1850to1910
MHz
1930to1990
MHz
270.833
812.499
0.3 GMSK
3π/8 8PSK
GSM 450 GSM 480 GSM 850
450.4 to
457.6 MHz
460.4 to
467.6 MHz
45 MHz 45 MHz 45 MHz
3 timeslots 3 timeslots 3 timeslots
270.833
812.499
4.615 ms 4.615 ms 4.615 ms
576.9 µs 576.9 µs 576.9 µs
3.692 µs 3.692 µs 3.692 µs
0.3 GMSK
3π/8 8PSK
478.8 to
486 MHz
488.8 to
496 MHz
270.833
812.499
0.3 GMSK
3π/8 8PSK
824 to 849
MHz
869 to 894
MHz
270.833
812.499
0.3 GMSK
3π/8 8PSK
Channel Spacing 200 kHz 200 kHz 200 kHz 200 kHz 200 kHz
TDMA Mux 88888
MS Max Power 20 W(8 Wis
max in use)
MS Min Power 13 dBm 5 dBm 0 dBm 0 dBm 0 dBm 5 dBm 5 dBm 5 dBm
MS Power
Control Steps
Voice Coder
Bit Rate
0 to 15 2 to 19 2 to 19 0 to 15
13 kbits/s 13 kbits/s,
20 W 20 W 20 W 20 W
0 to 15
29,30,31
13 kbits/s 13 kbits/s 13 kbits/s
5.6 kbits/s
30, 31,
200 kHz 200 kHz 200 kHz
888
20 W 20 W 20 W
2 to 19 2 to 19 2 to 19
13 kbits/s 13 kbits/s 13 kbits/s
The GSM framing structure is based on a hierarchical system
consisting of timeslots, TDMA frames, multiframes, superframes, and
hyperframes. One timeslot is 156.25 (157) bit periods including tail,
training sequence, encryption, guard time, and data bits. Eight of these
timeslots make up one TDMA frame. Either 26 or 51 TDMA frames
make up one multiframe. Frames 13 and 26 in the 26 frame multiframe
are dedicated to control channel signaling.
Chapter 1 9

Understanding GSM
What Is GSM?
Mobile Stations and Base Transceiver Stations
The cellular system includes the following:
• base transceiver stations, referred to as BTS
(frequency ranges dependent on the standard; refer to Table 1-1)
• mobile stations, referred to as MS
(frequency ranges dependent on the standard; refer to Table 1-1)
Uplink and Downlink
Uplink is defined as the path from the mobile station to the base
transceiver station. Downlink is the path from the base transceiver
station to the mobile station.
What Is an ARFCN?
An ARFCN is the Absolute Radio Frequency Channel Number used in
the GSM system. Each RF channel is shared by up to eight mobile
stations using Time Division Multiple Access (TDMA). The ARFCN is
aninteger(inarangedependentonthechosenstandard,refertoTable
1-1) which designates the carrier frequency.
What are Timeslots?
GSM utilizes Time Division Multiple Access (TDMA) with eight time
slots per RF channel which allows eight users to use a single carrier
frequency simultaneously. Users avoid one another by transmitting in
series. The eight users can transmit once every 4.62 ms for 1 timeslot
which is 577 µs long. The eight user timeslots are numbered from 0 to 7.
Typically, each 577 µs timeslot has a length of 156.25 bit periods, which
consists of 148 data bits and 8.25 guard bits. The 4.62 ms required to
cycle through eight timeslots is called a frame. In a TDMA system, the
shape of each transmitted burst must be controlled carefully to avoid
over-lapping bursts in time.
10 Chapter1

Understanding GSM
What Does the Agilent Technologies E4406A VSA Series Transmitter Tester Do?
What Does the Agilent Technologies E4406A
VSA Series Transmitter Tester Do?
The E4406A VSA Series Transmitter Tester makes measurements that
conform to the GSM 5.04, 5.05, 11.10, 11.21, and ANSI J-STD-007
specifications.
These documents define complex, multi-part measurements used to
maintain an interference-free environment. For example, the
documents include measuring the power of a carrier. The E4406A
automatically makes these measurements using the measurement
methods and limits defined in the standards. The detailed results
displayed by the measurements allow you to analyze GSM system
performance. You may alter the measurement parameters for
specialized analysis.
This instrument was primarily developed for making measurements on
digital transmitter carriers. These measurements can help determine if
a GSM transmitter is working correctly. The E4406A is capable of
measuring the continuous carrier of a base station transmitter.
For infrastructure test, the instrument will test base station
transmitters in a non-interfering manner by means of a coupler or
power splitter.
This instrument makes the following measurements:
• Transmit Power
• Power versus Time
• Phase and Frequency Error
• Output RF Spectrum
• Spectrum (Frequency Domain)
• Waveform (Time Domain)
• Tx Band Spur
Chapter 1 11

Understanding GSM
Other Sources of Measurement Information
Other Sources of Measurement Information
Additional measurement application information is available through
your local Agilent Technologies sales and service office. The following
application notes treat digital communications measurements in much
greater detail than discussed in this measurement guide.
• Application Note 1298
Digital Modulation in Communications Systems - An Introduction
part number 5965-7160E
• Application Note 1312
Understanding GSM Transmitter Measurements for Base
Transceiver Stations and Mobile Stations
part number 5966-2833E
Instrument Updates at www.agilent.com/find/vsa
This web location can be used to access the latest information about the
transmitter tester.
12 Chapter1

2 Setting Up the GSM Mode
13

Setting Up the GSM Mode
Accessing the Mode
Accessing the Mode
At initial power up, the transmitter tester will come up in the Basic
mode, with the Spectrum (Frequency Domain) measurement selected
and the Measure menu displayed.
To access the GSM measurement personality, press the
select the
GSM key.
MODE key and
If you want to set the mode to a known factory default state, press
Preset. This will preset the mode setup and all of the measurements to
the factory default parameters.
NOTE Note that pressing the Preset key does not switch instrument modes.
You may want to install a new personality, reinstall a personality that
you have previously uninstalled, or uninstall a personality option.
Instructions can be found in “Installing Optional Measurement
Personalities” in this section.
14 Chapter2

Setting Up the GSM Mode
How to Make a Measurement
How to Make a Measurement
Follow the three-step process shown in the table below:
Step Primary Key Setup Keys Related Keys
1. Select &
setup a mode
2. Select &
setup a measurement
3. Select &
setup view
Mode Mode Setup, Input,
Frequency Channel
Measure Meas Setup Meas Control,
View/Trace Span X Scale,
Amplitude Y Scale
Next Window, Zoom
, Display,
System
Restart
File
, Save,
Print, Print Setup,
Marker, Search
Chapter 2 15

Setting Up the GSM Mode
Changing the Mode Setup
Changing the Mode Setup
Numerous settings can be changed at the mode level by pressing the
Mode Setup key. This will access a menu with the selections listed below.
These settings affect all the measurements in the GSM mode.
Radio
The Radio key accesses a menu to select:
Band - Select the GSM band (P-GSM, E-GSM, R-GSM, GSM 450,
•
GSM 480, GSM 850, DCS 1800, or PCS 1900). Refer to the table in
the previous section for GSM band data.
•
Device - Select the device to test BTS (Base Transceiver Station) or
MS (Mobile Station).
• BTS Type - Select the type of BTS (Base Transceiver Station) to be
tested (Normal, Micro, or Pico).
• Freq Hopping - Turn frequency hopping on or off. If frequency
hopping is turned on, the instrument will ignore the bursts when the
frequency is hopped off the selected channel frequency. Thus only
valid data is included in the results. Only the Power vs. Time, and
the Phase and Frequency Error measurements can be made on
hopping GSM signals.
•
Carrier - Select the type of carrier to measure (Burst or Continuous).
Radio Default Settings
Band E-GSM
Device BTS
BTS Type Normal
Freq Hopping Off
Carrier Burst
16 Chapter2

Setting Up the GSM Mode
Changing the Mode Setup
Input
The Input key accesses a menu to select the following. (You can also
access this menu from the front-panel key
Input Port - Choose between RF, I/Q, I Only, 50 MHz Ref, and IF Align.
•
RF Input Range - To set the RF input range, choose Auto or Manual. If
•
Auto is chosen, the instrument automatically sets the attenuator
based on the power level of the carrier (where the instrument is
tuned). If there are multiple carriers present, the total power might
overdrive the front end. In this case you need to set the
Range to Manual and enter the expected Max Total Pwr. Manual is also
used if you want to hold the input attenuation constant (for the best
relative power accuracy). For single carriers it is generally
recommended to set the
Max Total Pwr - To set the maximum total power at the UUT (Unit
•
RF Input Range to Auto.
Under Test). This is the maximum expected value of the mean
carrier power referenced to the output of the UUT (may include
multiple carriers). The
Atten setting. If RF Input Range is set to Auto, and Max Total Pwr is
changed,
RF Input Range is switched to Manual.
Max Total Pwr setting is coupled to the Input
Input.)
RF Input
Input Atten - To set the input attenuator setting. The Input Atten
•
setting is coupled to the Max Total Pwr setting. The Input Atten key
reads out the actual hardware value that will be used for the current
measurement. If more than one input attenuator value is used in a
single measurement, the value used at the carrier frequency will be
displayed. If
RF Input Range is switched to Manual.
NOTE The Max Total Pwr and Input Atten settings are coupled together. When
you switch to a different measurement, the
constant, but the
RF Input Range is set to Auto, and Input Atten is changed,
Max Total Pwr is kept
Input Atten may change if the two measurements have
different mixer margins. Thus, you can directly set the transmitter
tester input attenuation, or you can set it indirectly by specifying the
maximum expected power at the UUT (Max Total Pwr setting).
•
Ext Atten - To enter the external attenuator setting for either a BTS
or MS. This will allow the instrument to display the measurement
results referred to the output of the UUT (Unit Under Test).
Chapter 2 17

Setting Up the GSM Mode
Changing the Mode Setup
• IF Align Signal - This key has effect only when Input Port is set to IF
Align. When IF Align is activated, the RF path is switched to bring in
the same alignment signal that is automatically switched in to
perform many alignments. This selection will allow manual
adjustment of the alignment signal for diagnostic purposes:
—
Signal Rate - The signal is modulated by a digital sequence that
can be set to 1 of 13 positions (rate 0 through 12) to cause the
comb spacing (or pulse timing) of the alignment signal to widen or
narrow. The key reports the comb spacing for a given rate (0 to
12) in “kHz”.
—
Signal Amptd - This is the DAC control that changes the
amplitude of the signal. It is a 12 bit (0 to 4095) DAC. A higher
DAC number will raise the signal amplitude.
—
Signal Type - This can be CW (a tone that appears in the center of
the IF),
Comb, or Pulse.
Input Default Settings
Input Port RF
RF Input Range Auto
Max Total Power −15.00 dBm
Input Atten 0.00 dB
Ext Atten MS 0.00 dB
Ext Atten BTS 0.00 dB
IF Align Signal Rate 0 (= 468.75 kHz)
IF Align Signal Amptd DAC 500
IF Align Signal Type CW
18 Chapter2

Setting Up the GSM Mode
Changing the Mode Setup
Trigger
The Trigger key accesses the mode setup menu for the following trigger
source menus:
•
RF Burst
• Video (IF Envlp)
• Ext Front
• Ext Rear
Pressing one of the trigger source menu keys will access the trigger
mode setup menu. This menu is used to set the
for each trigger source. Note that the actual trigger source is selected
separately for each measurement (under the
Delay - For trigger delay use positive values. For pre-trigger use
negative values.
Level - For the RF Burst selection, the level is relative to the peak
level of the RF signal. For the
Video selection, the level is the value,
in dBm at the RF input, that will cause the trigger. For the
and Ext Rear selections, the level range is −5 to +5 volts.
Delay, Level, and Slope
Meas Setup key).
Ext Front
Slope Pos Neg - Choose to trigger off of the leading edge
(
Pos) or the trailing edge (Neg) of the burst.
Other keys accessed under the
Trig Holdoff - Sets the period of time before the next trigger can occur.
•
Auto Trig - Acts as a trigger timeout. If no trigger occurs by the
•
Trigger key:
specified time, a trigger is automatically generated.
• Frame Timer - Accesses the menu to manually control the frame
timer:
Period - Sets the period of the frame clock.
Offset - Sets a one-time phase adjustment of the frame clock.
Reset Offset - Resets the display of offset key to 0.
Sync Source - Selects the source used to sync the frame timer (Ext
Front, Ext Rear, or Off).
Chapter 2 19

Setting Up the GSM Mode
Changing the Mode Setup
• RF Sync Delay - In measurements that detect the GSM “T0”,
RF Sync Delay adjusts the “T0” point. This adjustment does not apply
if the
Burst Sync key is set to None,orifitissettoTraining Seq in the
Phase and Frequency Error measurement. The “T0” point is defined
as the time point of the transition from bit 13 to bit 14 of the
midamble training sequence for a given time slot.
•
Burst Search Threshold - Sets the threshold level used in the search
for GSMbursts after data is acquired. This is a relative level based
on the peak “on” power.
20 Chapter2

RF Burst
Delay
Peak Level
Slope
Video
Delay
Level
Slope
Ext Front
Delay
Level
Slope
Ext Rear
Delay
Level
Slope
Setting Up the GSM Mode
Changing the Mode Setup
Trigger Default Settings
0.000 s
−20.00 dB
Pos
0.000 s
−6.00 dBm
Pos
0.000 s
2.00 V
Pos
0.000 s
2.00 V
Pos
Trig Holdoff 0.000 s
Auto Trig 100.0 ms Off
Frame Timer
Period
Offset
Reset Offset
Sync Source
RF Sync Delay 0.000 s
Burst Search Threshold −40.00 dB
4.615383 ms
0.000 s
Display
Off
Demod
• Burst Align - Select the burst alignment between:
GSM- Uses the burst alignment as defined in the GSM
specifications.
1/2 Bit Offset - Shifts the burst alignment by 1/2 bit. This selection
applies to the Power vs. Time and the Phase and Frequency Error
measurements.
Demod Default Settings
Demod Burst Align
Chapter 2 21
GSM

Setting Up the GSM Mode
Changing the Frequency Channel
Changing the Frequency Channel
After selecting the desired mode setup, you will need to select the
desired ARFCN, center frequency, BMT frequency, burst type, and TSC
(Training Sequence Code). The selections made here will apply to all
measurements in the mode. Press the
the following menu:
ARFCN Allows you to select the desired RF channel to be
measured. Refer to the table in the previous section for
the ARFCN range for a specific GSM band.
Center Freq This is the current instrument center frequency. Use
this key to input a frequency that corresponds to the
desired RF channel to be measured.
BMT Freq Allows you to select the Bottom, Middle, or Top
frequencies of the
measured. This will automatically select a specific
center frequency and ARFCN. Refer to the following
table.
Frequency Channel key to access
GSM selected radio band to be
Band Tx Band Edge
(MHz)
Low High Freq
P-GSM 935 960 935.200 1 947.600 63 959.800 124
E-GSM 925 960 925.200 975 942.600 38 959.800 124
R-GSM 921 960 921.200 955 940.600 28 959.800 124
DCS 1800 1805 1880 1805.20 512 1842.60 699 1879.80 885
PCS 1900 1930 1990 1930.20 512 1960.00 661 1989.80 810
GSM 450 460.4 467.6 460.600 259 464.000 276 467.400 293
GSM 480 488.8 496.0 489.000 306 492.400 323 495.800 340
GSM 850 869 894 869.200 128 881.600 190 893.800 251
BOTTOM MIDDLE TOP
(MHz)
ARFCN Freq
(MHz)
ARFCN Freq
(MHz)
ARFCN
22 Chapter2

Setting Up the GSM Mode
Changing the Frequency Channel
Timeslot Allows you to select the timeslot to be measured.
Timeslot numbers in the range of 0 to 7 can be selected.
Selection of the Timeslot is based on the position on the
screen−that is Timeslot 0 is defined to be at the start of
the data, and the data is divided into 8 timeslots (0 to
7). This key will be unavailable (grayed out) if a burst
type other than
Burst Type Choose a GSM burst type from the following selections:
Normal (TCH & CCH) - Burst length = 142 symbols
•
•
Sync (SCH) - Burst length = 142 symbols
•
Access (RACH) - Burst length = 88 symbols
TSC Allows you to select the Training Sequence Code that
Normal is selected.
determines which burst is tobemeasured.Thiskeywill
be unavailable (grayed out) if a burst type other than
Normal is selected, indicating the standard TSC is used
corresponding to the burst type.
•
Auto - In auto, the measurement is made on the first
burst found to have any one of the valid TSCs in the
range of 0 to 7. The measurement may be made on
various timeslots if more than one timeslot has one
of the 8 valid TSCs.
•
When the
GSM mode is selected, the instrument will default to the
following settings.
Function Factory Default Setting
ARFCN >251
Center Frequency 942.600 MHz
Timeslot 0 Off
Burst Type Normal
TSC (Std) 0 Auto
Man - In manual, the measurement is made on the
first burst found to have the selected TSC. TSC
numbers in the range of 0 to 7 can be selected. The
measurement may be made on various timeslots if
more than one timeslot has this same TSC.
(TCH & CCH)
Chapter 2 23

Setting Up the GSM Mode
GSM Measurement Key Flow
GSM Measurement Key Flow
The key flow diagrams, shown in a hierarchical manner on the
following pages, will help the user to grasp the overall functional
relationships for the front-panel keys and the softkeys displayed at the
extreme right side of the screen. The diagrams are:
“Mode Setup / Frequency Channel Key Flow” on page 25
“Transmit Power Measurement Key Flow” on page 26
“Power vs. Time Measurement Key Flow” on page 27
“Phase and Frequency Error Measurement Key Flow” on page 28
“Output RF Spectrum Measurement Key Flow” on page 29
“Spectrum (Freq Domain) Measurement Key Flow (1 of 3)” on
page 30
“Waveform (Time Domain) Measurement Key Flow (1 of 2)” on
page 33
View/Trace
QPSK EVM
<for EVM>
Avg Number 10 On|Off
“Tx Band Spur Measurement Key Flow” on page 35
Use these flow diagrams as follows:
• There are some basic conventions:
An oval represents one of the front-panel keys.
This box represents one of the softkeys displayed.
This represents an explanatory description on its specific key.
This box represents one of the default condition softkeys displayed.
Default conditions are shown as much as possible with underlined
parameters or values displayed on those softkey labels.
• Follow the measurement diagram from left to right and top to
bottom.
• A single softkey may allow multiple choices. For example; the
softkey reveals two choices, BTS or MS. The underlined choice is the
current state of the instrument. To change choices, press the softkey
one time.
• When entering a numeric value of
Frequency, for example, use the
numeric keypad and terminate the entry with the appropriate unit
selection from the softkeys displayed.
Device
• When entering a numeric value of
numeric keypad and terminate with the
Slot (Std), for example, use the
Enter front-panel key.
• Instead of using the numeric keypad to enter a value, it may be
easier to use the RPG knob or Up/Down keys.
24 Chapter2

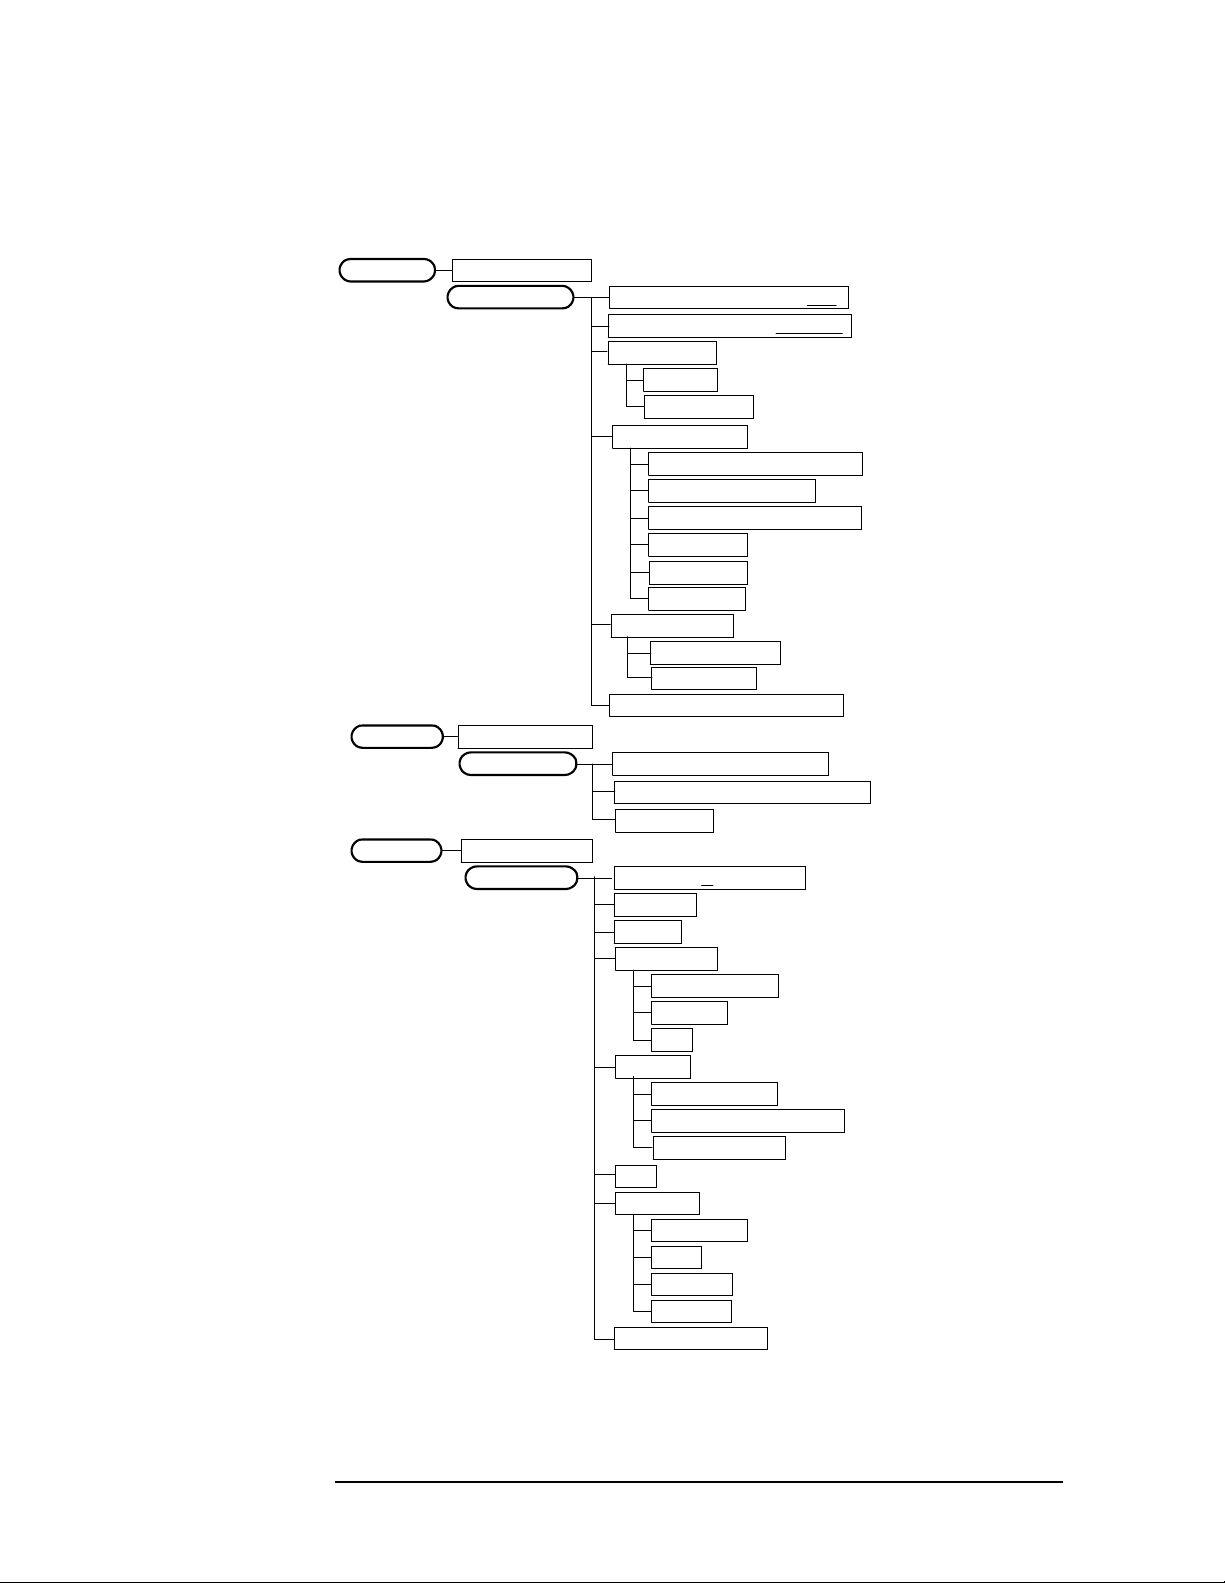
Figure 2-1 Mode Setup / Frequency Channel Key Flow
GSM or EDGE w/GSMMode
Mode Setup
Frequency Channel
Radio
Band P-GSM, E-GSM, R-GSM, DCS 1800, PCS 1900, GSM 450, GSM 480, GSM 850
Device BTS | MS
BTS Type Normal, Micro, Pico
Freq Hopping On |Off
Carrier Burst | Cont
Input
Input Port RF, I/Q, I only, 50 MHz Ref, IF Align
RF Input Range Auto| Man
Max Total Pwr
Input Atten
Ext Atten
MS 0.00 dB
BTS 0.00 dB
IF Align Signal
Signal Rate
Signal Amptd
Signal Type CW, Comb, Pulse
Trigger
RF Burst
Delay
Peak Level
Slope Pos| Neg
Video (IF Envlp)
Delay
Level
Slope Pos| Neg
Ext Front
Delay
Level
Slope Pos| Neg
Ext Rear
Delay
Level
Slope Pos| Neg
Trig Holdoff
Auto Trig 100.0 ms On | Off
Frame Timer
Period
Offset
Reset Offset Display
Sync Source Off, Ext Front, Ext Rear
RF Sync Delay
Burst SearchThreshold
Demod
Burst Align
GSM
1/2 Bit Offset
ARFCN
Center Freq
BTM Freq Top, Middle, Bottom
Timeslot On | Off
Burst Type Normal, Sync, Access
TSC (Std) 0 Auto | Man
<Available for RF only>
<Available for RF and 50 MHz Ref only>
<Auto not for Spectrum>
<for EVM when Device is MS>
Setting Up the GSM Mode
GSM Measurement Key Flow
Chapter 2 25

Setting Up the GSM Mode
GSM Measurement Key Flow
Figure 2-2 Transmit Power Measurement Key Flow
Measure
Transmit Pwr
Meas Setup
Transmit PwrMeasure
Marker
Averages 50 On | Off
Avg Mode Exp | Repeat
Avg Type
Pwr Avg (RMS)
Log-Pwr Avg (Video)
Maximum
Minimum
Threshold Lvl -6.00 dB Abs |Rel
Trig Source
Free Run (Immediate)
Video (IF Envlp)
RF Burst (Wideband)
Ext Front
Ext Rear
Frame
Burst Sync None
Meas Time 1 Slot
Restore Meas Defaults
Advanced
RBW Filter Gaussian | Flat
Res BW 500.000 kHz
Select 1 | 2 | 3 | 4
Normal
Delta
Function
Band Power
Noise
Off
Trace
RF Envelope
I/Q Waveform
Off
Shape
Diamond
Line
Square
Cross
Marker All Off
26 Chapter2

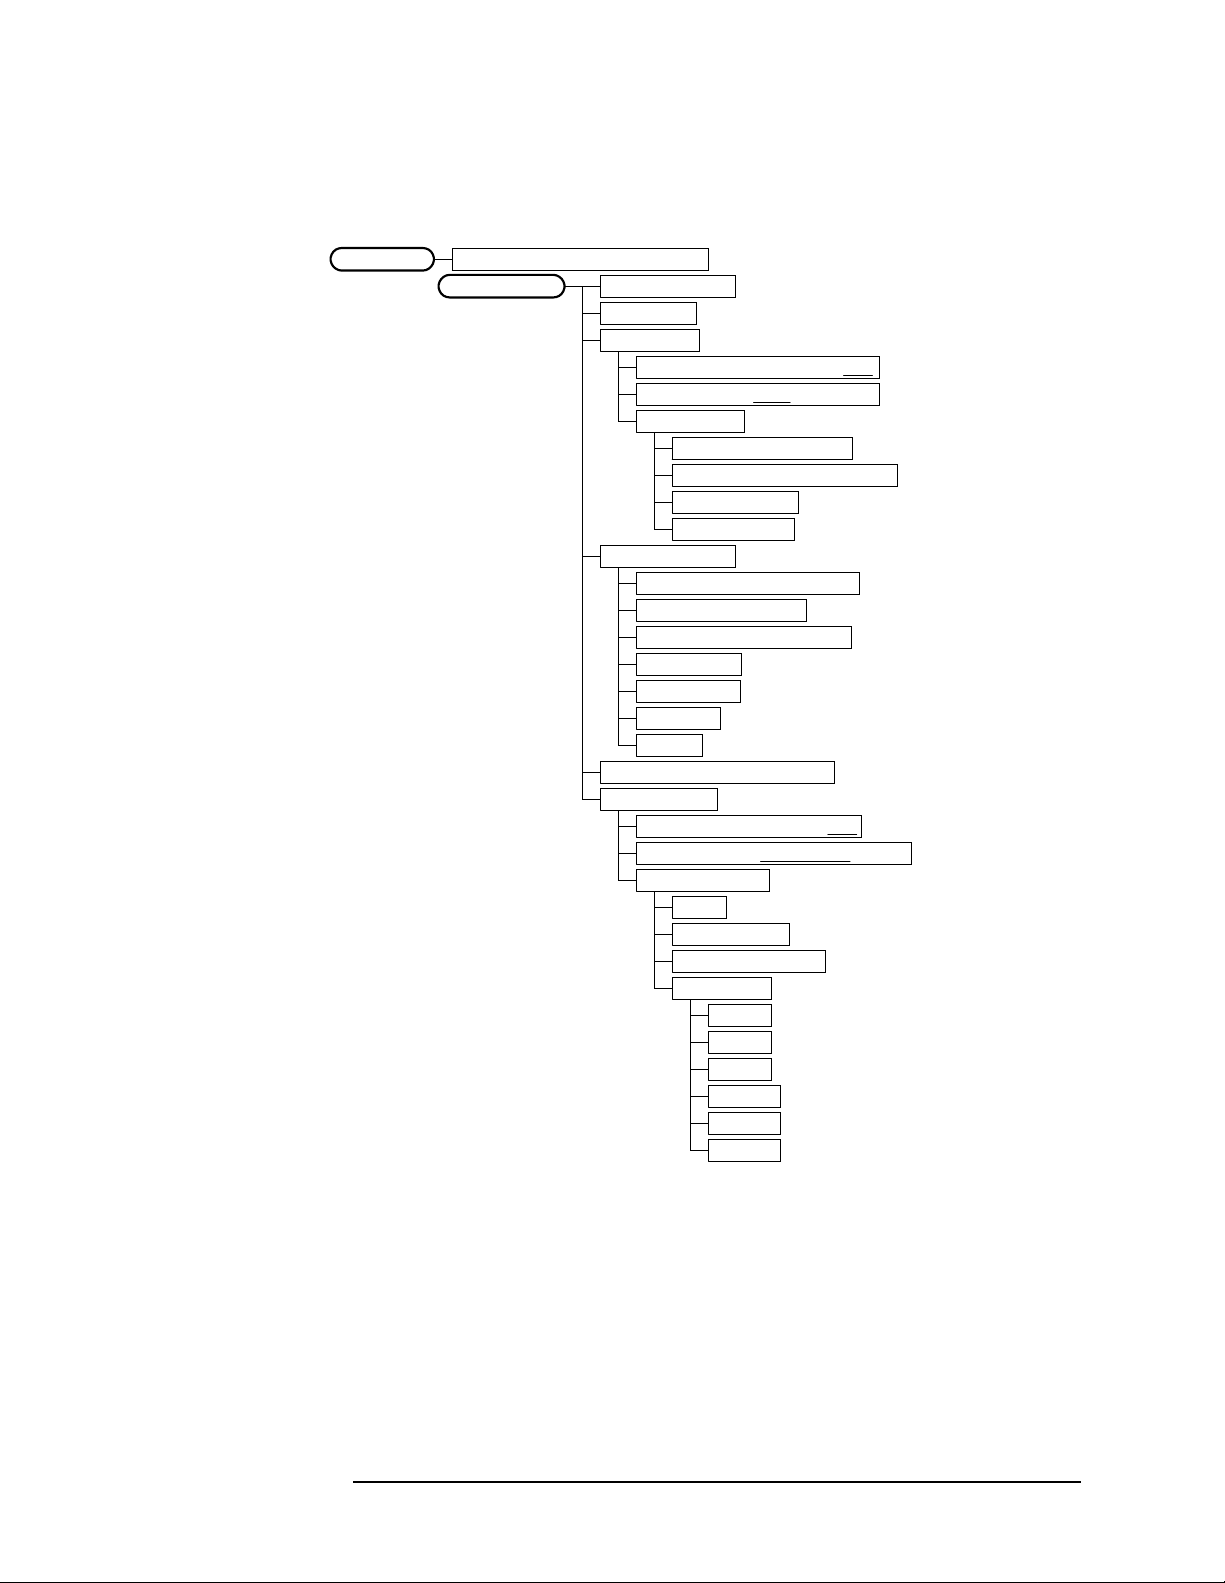
Figure 2-3 Power vs. Time Measurement Key Flow
Setting Up the GSM Mode
GSM Measurement Key Flow
Measure
Pwr vs Time
Meas Setup
Pwr vs TimeMeasure
View/Trace
Avg Bursts 10On | Off
Avg Mode Exp | Repeat
Avg Type
Pwr Avg (RMS)
Log-Pwr Avg (Video)
Maximum
Minimum
Meas Time 1 Slot
Trig Source
Free Run (Immediate)
Video (IF Envlp)
RF Burst (Wideband)
Ext Front
Ext Rear
Frame
Burst Sync
Training Seq
RF Amptd
Restore Meas Defaults
Advanced
RBW Filter Gaussian | Flat
Res BW 508.000 kHz
Burst
Rise & Fall
Pwr vs TimeMeasure
Marker
Select 1 | 2 | 3 | 4
Normal
Delta
Function
Band Power
Noise
Off
Trace
RF Envelope
Upper Mask
Lower Mask
Off
Shape
Diamond
Line
Square
Cross
Marker All Off
Chapter 2 27
Setting Up the GSM Mode
GSM Measurement Key Flow
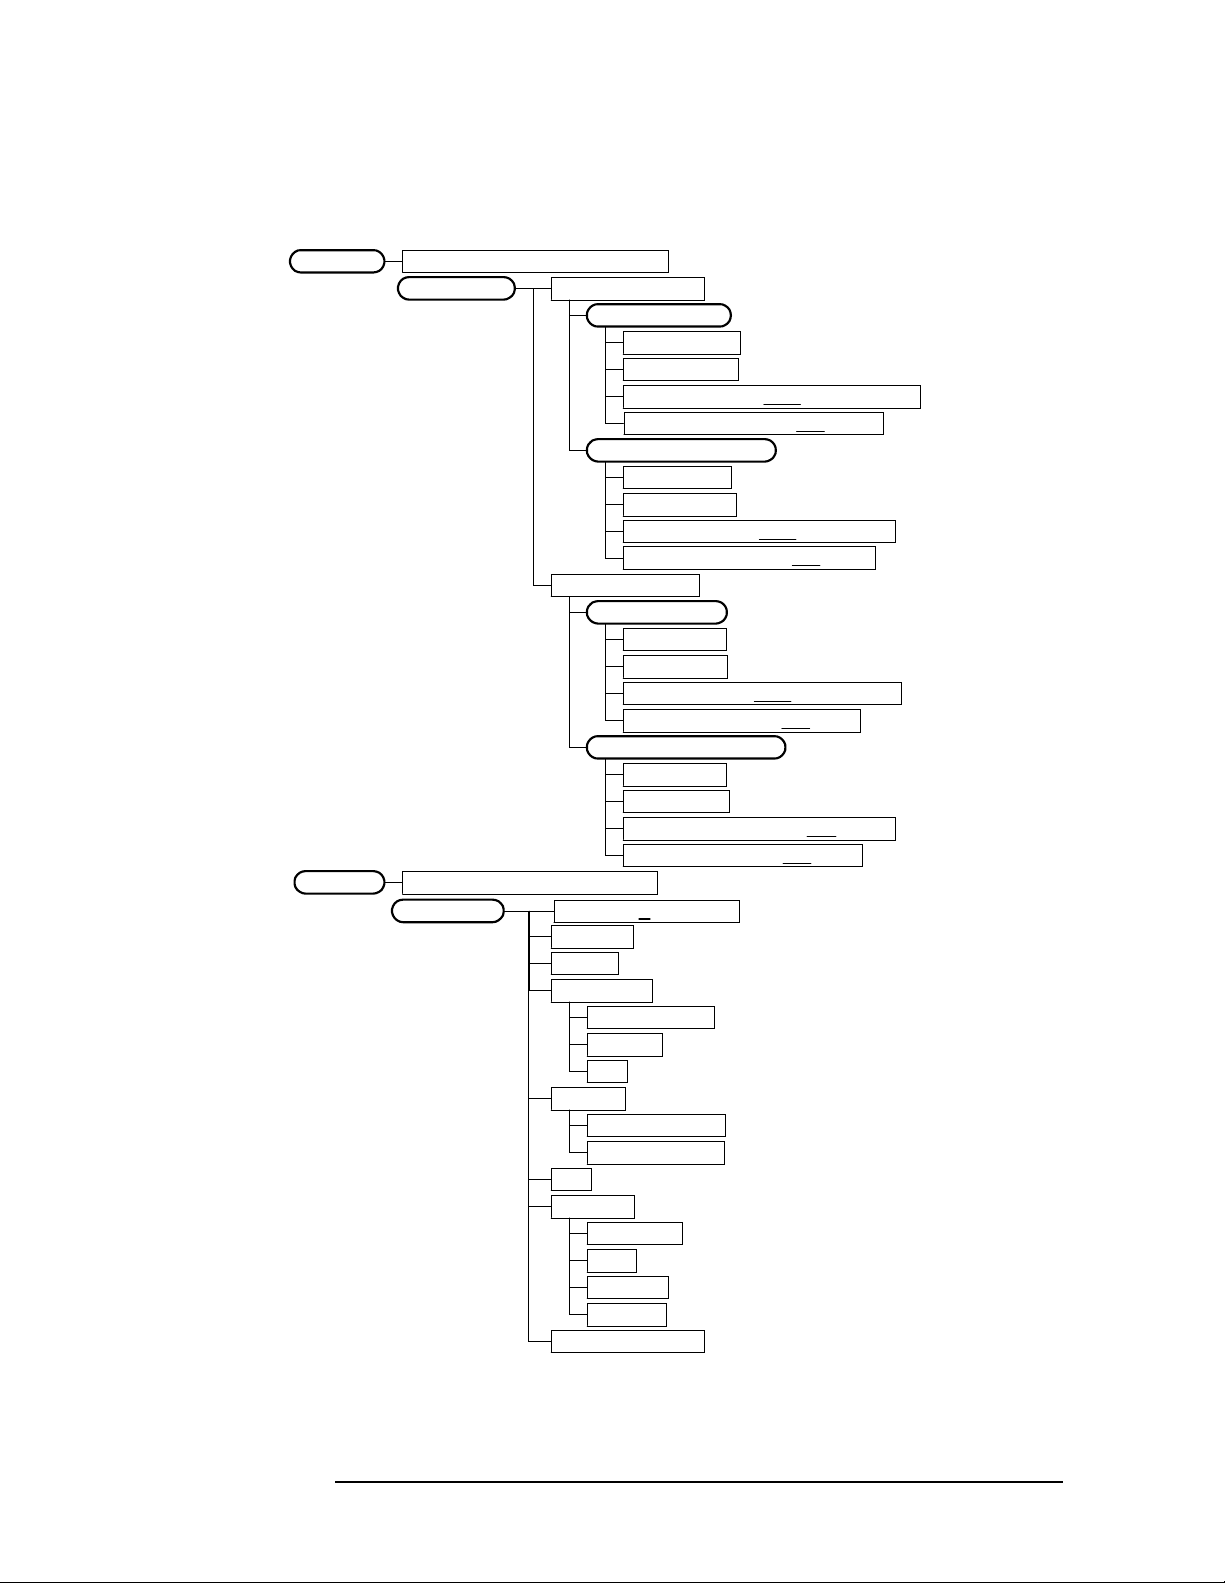
Figure 2-4 Phase and Frequency Error Measurement Key Flow
Measure
Phase & Freq
Meas Setup
Phase & FreqMeasure
View/Trace
Phase & FreqMeasure
Marker
Avg Bursts 10On | Off
Avg Mode Exp | Repeat
Avg Type
Mean
Maximum
Trig Source
Free Run (Immediate)
Video (IF Envlp)
RF Burst (Wideband)
Ext Front
Ext Rear
Frame
Burst Sync
Training Seq
RF Amptd
Restore Meas Defaults
I/Q Error (Quad-View)
I/Q Measured Polar Vector
Data Bits
Select 1 | 2 | 3 | 4
Normal
Delta
Function
Band Power
Noise
Off
Trace
Phase Error
Phase Error w/Freq
RF Envelope
Off
Shape
Diamond
Line
Square
Cross
Marker All Off
28 Chapter2

Figure 2-5 Output RF Spectrum Measurement Key Flow
Setting Up the GSM Mode
GSM Measurement Key Flow
Measure
Output RF Spectrum
Meas Setup
Output RF SpectrumMeasure
View/Trace
Avg Bursts 20 On | Off
Avg Mode Exp | Repeat
Meas Method
Meas Type
Ofs Freq List
Fast Avg On Off
Restore Meas Defaults
Advanced
Modulation Numeric
Multi-Offset
Single Offset (Examine)
Mod & Switch
Modulation
Switching
Standard
Short
Custom
Mod Avg
Pwr Avg (RMS)
Log-Pwr Avg (Video)
Modulation Meas BWs
Carrier RBW 30.000 kHz
< 1800 kHz Offset RBW 30.000 kHz
>= 1800 kHz Offset RBW 100.000 kHz
Switching Meas BWs
Carrier RBW 300 kHz
< 1800 kHz Offset RBW 30.000 kHz
>= 1800 kHz Offset RBW 30.000 kHz
Direct Time Break Freq 600.000 kHz
Output RF SpectrumMeasure
Marker
Select 1 | 2 | 3 | 4
Normal
Delta
Function
Band Power
Noise
Off
Trace
RF Envelope Modulation
RF Envelope Switching
Off
Shape
Diamond
Line
Square
Cross
Marker All Off
Chapter 2 29

Setting Up the GSM Mode
GSM Measurement Key Flow
Figure 2-6 Spectrum (Freq Domain) Measurement Key Flow (1 of 3)
Measure
Spectrum (Freq Domain)
Meas Setup
Span 1.00000 MHz
Res BW 20.0000 kHz Auto| Man
Average
Trig Source
Restore Meas Defaults
Advanced
Avg Number 25 On| Off
Avg Mode Exp | Repeat
Avg Type
Pwr Avg (RMS)
Log-Pwr Avg (Video)
Voltage Avg
Maximum
Minimum
Free Run (Immediate)
Video (IF Envlp)
RF Burst (Wideband)
Ext Front
Ext Rear
Frame
Line
Pre-ADC BPF On | Off
Pre-FFT Fltr Gaussian |Flat
Pre-FFT BW 1.55000 MHz Auto| Man
FFT Window Flat Top (High Amptd Acc)
Flat Top (High Amptd Acc)
Uniform
Hanning
Hamming
Gaussian (Alpha 3.5)
Blackman
Blackman-Harris
K-B 70 dB (Kaiser-Bessel)
K-B 90 dB (Kaiser-Bessel)
K-B 110 dB (Kaiser-Bessel)
FFT Size
Length Ctrl Auto | Man
Min Pnts/RBW
(a)
30 Chapter2

Setting Up the GSM Mode
GSM Measurement Key Flow
Figure 2-7 Spectrum (Freq Domain) Measurement Key Flow (2 of 3)
(a)
ADC Range
Auto
Auto Peak
AutoPeakLock
Manual
-6 dB
0 dB
+6 dB
+12 dB
+18 dB
+24 dB
Data Packing Auto, Short, Medium, Long
ADC Dither Auto On Off
Decimation 0 Auto Man
IF Flatness On Off
Spectrum (Freq Domain)Measure
View/Trace
Spectrum
Span X Scale
Span
Amplitude Y Scale
Scale/Div
Ref Value
Ref Position Top| Ctr | Bot
Scale Coupling On | Off
I/Q Waveform
Span X Scale
Scale/Div
Ref Value
Ref Position Left | Ctr | Right
Scale Coupling On | Off
Amplitude Y Scale
Scale/Div
Ref Value
Ref Position Top | Ctr | Bot
Scale Coupling On |Off
Trace Display
All
Average (or Max & Min)
Current
Chapter 2 31

Setting Up the GSM Mode
GSM Measurement Key Flow
Figure 2-8 Spectrum (Freq Domain) Measurement Key Flow (3 of 3)
Spectrum (Freq Domain)Measure
Marker
Select 1 | 2 | 3 | 4
Normal
Delta
Function
Band Power
Noise
Off
Trace
Spectrum
Spectrum Avg
I/Q Waveform
Off
Shape
Diamond
Line
Square
Cross
Marker All Off
32 Chapter2
Setting Up the GSM Mode
GSM Measurement Key Flow
Figure 2-9 Waveform (Time Domain) Measurement Key Flow (1 of 2)
Measure
Waveform (Time Domain)
Meas Setup
Sweep Time
Res BW
Average
Avg Number 10 On| Off
Avg Mode Exp | Repeat
Avg Type
Trig Source
Free Run (Immediate)
Video (IF Envlp)
RF Burst (Wideband)
Ext Front
Ext Rear
Frame
Line
Restore Meas Defaults
Advanced
Pre-ADC BPF On | Off
RBW Filter Gaussian | Flat
ADC Range
Pwr Avg (RMS)
Log-Pwr Avg (Video)
Maximum
Minimum
Auto
Auto Peak
AutoPeakLock
Manual
-6 dB
0 dB
+6 dB
+12 dB
+18 dB
+24 dB
Chapter 2 33
Setting Up the GSM Mode
GSM Measurement Key Flow
Figure 2-10 Waveform (Time Domain) Measurement Key Flow (2 of 2)
Waveform (Time Domain)Measure
View/Trace
Waveform (Time Domain)Measure
Marker
RF Envelope
Span X Scale
Scale/Div
Ref Value
Ref Position Left| Ctr | Right
Scale Coupling On | Off
Amplitude Y Scale
Scale/Div
Ref Value
Ref Position Top| Ctr| Bot
Scale Coupling On | Off
I/Q Waveform
Span X Scale
Scale/Div
Ref Value
Ref Position Left| Ctr | Right
Scale Coupling On | Off
Amplitude Y Scale
Scale/Div
Ref Value
Ref Position Top |Ctr | Bot
Scale Coupling On | Off
Select 1 | 2 | 3 | 4
Normal
Delta
Function
Band Power
Noise
Off
Trace
RF Envelope
I/Q Waveform
Off
Shape
Diamond
Line
Square
Cross
Marker All Off
34 Chapter2
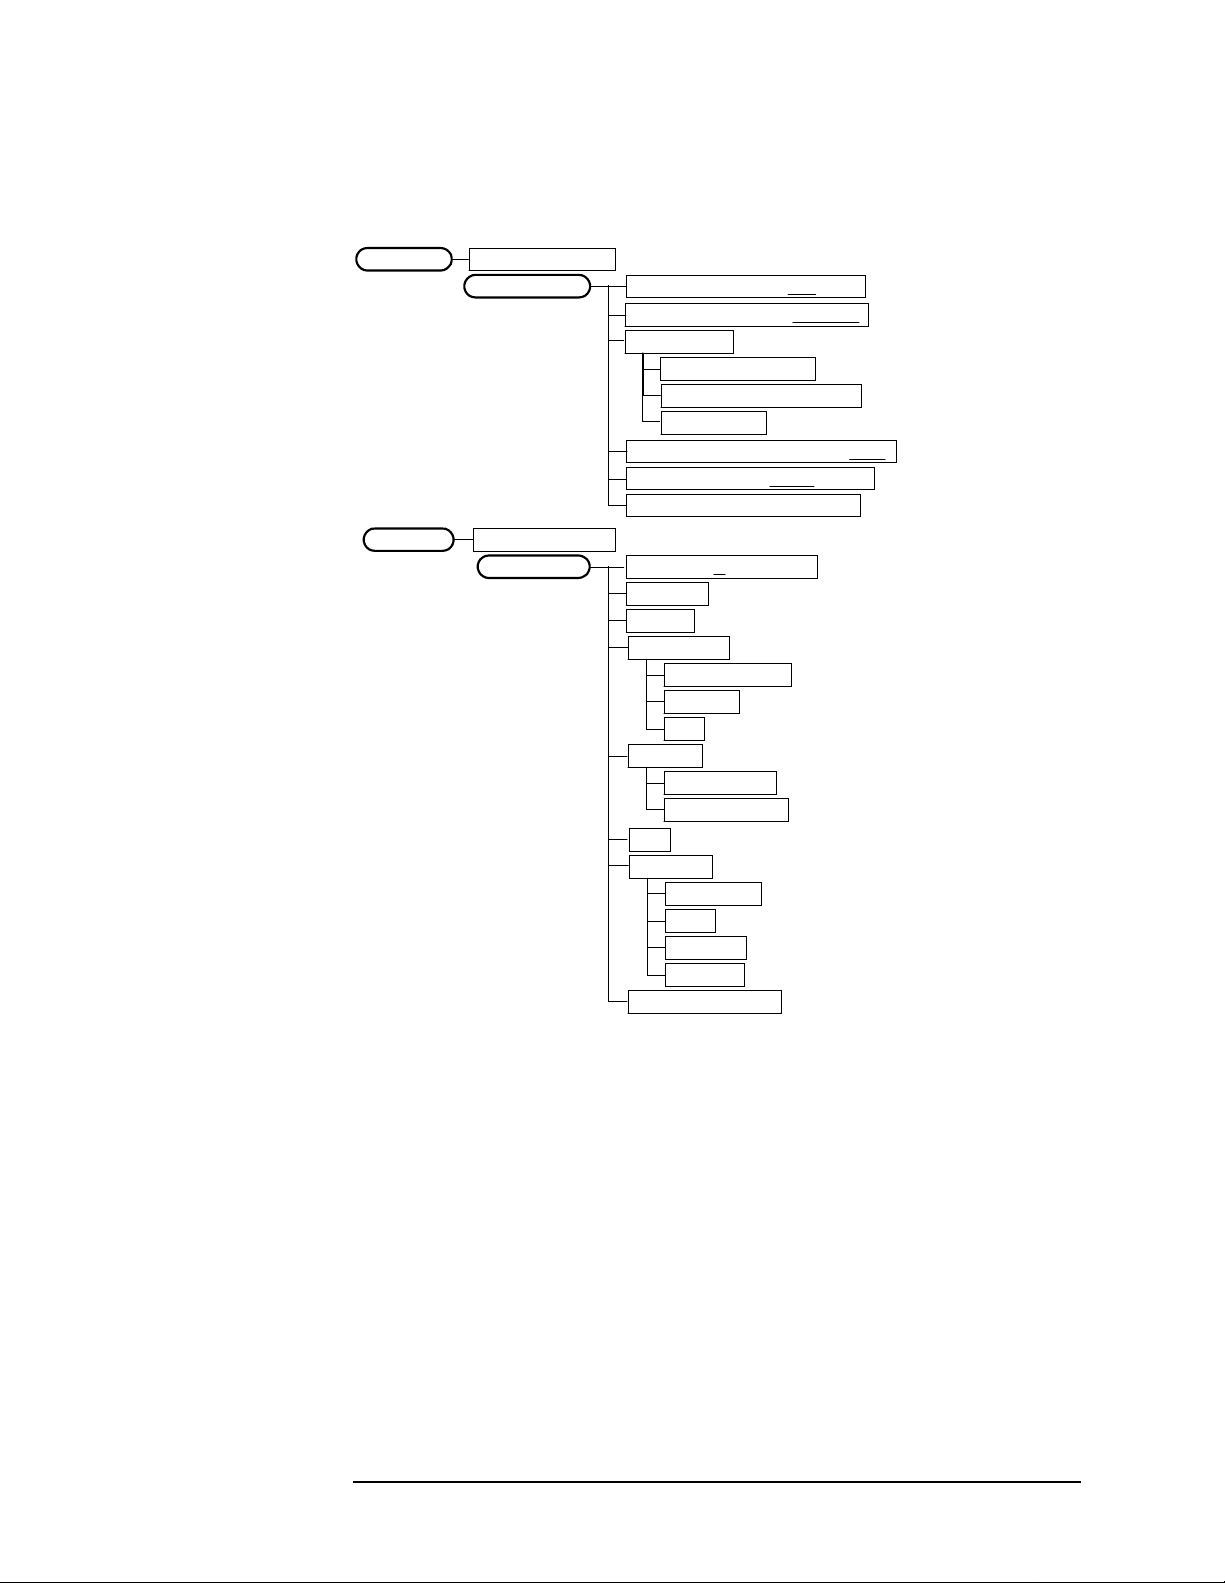
Figure 2-11 Tx Band Spur Measurement Key Flow
Setting Up the GSM Mode
GSM Measurement Key Flow
Measure
Tx Band Spur
Meas Setup
Tx Band SpurMeasure
Marker
Avg Number 30 On| Off
Avg Mode Exp | Repeat
Avg Type
Pwr Avg (RMS)
Log-Pwr Avg (Video)
Maximum
Meas Type Examine Full
Limit -36.00 dBm dBc
Restore Meas Defaults
Select 1 | 2 | 3 | 4
Normal
Delta
Function
Band Power
Noise
Off
Trace
Spectrum
Upper Limit
Off
Shape
Diamond
Line
Square
Cross
Marker All Off
Chapter 2 35

Setting Up the GSM Mode
Installing Optional Measurement Personalities
Installing Optional
Measurement Personalities
When you Install a measurement personality, you follow a two step
process.
1. Install the measurement personality firmware into the instrument.
(See the supplied installation instructions.)
2. Enter a license key number to enable the measurement personality.
(Refer to the “License Key Numbers” section below.)
Adding additional measurement personalities requires purchasing a
retrofit kit for the desired option. The retrofit kit contains the
measurement personality firmware. A license key certificate is also
included in the kit. It documents the license key number that is for your
specific option and instrument serial number. Installation instructions
are included with the retrofit kit.
The installation instructions require you to know three pieces of
information about your instrument: the amount of memory installed,
the Host ID, and the instrument serial number.
Required information: Key Path:
Instrument
Memory:
__________________
Host ID:
__________________
Instrument
Serial Number:
__________________
System, File System
(the amount of memory in your
instrument will be the sum of the
memory and the Free memory)
System, Show System, Host ID
System, Show System, Serial Number
Used
The Exit Main Firmware key is used during the firmware installation
process. This key is only for use when you want to update firmware
using a LAN connection. The
Exit Main Firmware key halts the operation
of the instrument firmware so you can install an updated version of
firmware using a LAN connection. Instructions for loading future
firmware updates are available at the following URL:
www.agilent.com/find/vsa/
36 Chapter2

Setting Up the GSM Mode
Installing Optional Measurement Personalities
Available Personality Options
The option designation consists of three characters, as shown in the
Option column of the table below.
Available Personality Options
GSM measurement personality BAH
EDGE (with GSM) measurement personality
cdmaOne measurement personality BAC
NADC, PDC measurement personalities BAE
iDEN measurement personality HN1
W-CDMA measurement personality BAF
cdma2000 measurement personality B78
a
b
Option
202
a. Available as of the print date of this guide.
b. For instruments that already have Option BAH licensed,
order E4406AU Option 252 to add EDGE (with GSM).
License Key Numbers
Measurement personalities purchased with your instrument have been
installed and enabled at the factory. You will receive a unique License
Key number with every measurement personality purchased. The
license key number is a hexadecimal number that is for your specific
measurement personality and instrument serial number. It enables you
to install, or reactivate that particular personality.
Follow these steps to display the unique license key number for the
measurement personality that is installed in your instrument:
1. Press
System, Install, Choose Option. The Choose Option key accesses
the alpha editor. Use the alpha editor to enter letters (upper-case)
and the front-panel numeric keys to enter digits for a personality
option that is already installed in the instrument.
2. Press the
number for your instrument will now appear on the
Done key on the alpha editor menu. The unique license key
License Key
softkey.
Chapter 2 37

Setting Up the GSM Mode
Installing Optional Measurement Personalities
You will want to keep a copy of your license key number in a secure
location. Please enter your license key numbers below for future
reference. If you should lose your license key number, call your nearest
Agilent Technologies service or sales office for assistance.
License Key Numbers for Instrument with Serial # ________
For Option______________ the license key number is _____________________
For Option______________ the license key number is _____________________
For Option______________ the license key number is _____________________
For Option______________ the license key number is _____________________
For Option______________ the license key number is _____________________
For Option______________ the license key number is _____________________
If you purchase an option later, you will receive a certificate that
indicates the unique license key number that you will need to install
that option on your particular serial number instrument.
NOTE You will need to enter a license key number only if you purchase an
additional measurement personality at a later date, or if you want to
reactivate a measurement personality that has been deactivated.
Installing a License Key Number
NOTE Follow this procedure to reinstall a license key number which has been
deleted during the uninstall process, or lost due to a memory failure.
Toinstall a license key number for the selected option, use the following
procedure:
1. Press
the alpha editor menu. Use the alpha editor to enter letters
(upper-case) and the front-panel numeric keys to enter numbers for
the option designation. Then press the
option, you will see your entry in the active function area of the
display.
Note: that you must already have entered the license key for the
GSM option BAH before you can enter the license key for the EDGE
retrofit option 252.
System, Install, Choose Option. The Choose Option key accesses
Done key. As you enter the
2. Press License Key. Use the alpha editor to enter letters and the
front-panel numeric keys to enter digits. You will see your entry in
the active function area of the display. When you have completed
entering the license key number, press the
38 Chapter2
Done key.

Setting Up the GSM Mode
Installing Optional Measurement Personalities
3. Press the Install Now key after you have entered the personality
option number and the license key number. On some instruments, a
message may appear in the function area of the display which reads,
“Insert disk and power cycle the instrument”. Disregard
this message. If you want to proceed with the installation, press the
Yes key and cycle the instrument power off and then on. Press the No
key if you wish to cancel the installation process.
Using the Uninstall Key
The following procedure removes the license key number for the
selected option. This will make the option unavailable for use, and the
message “Application Not Licensed” will appear in the Status/Info
bar at the bottom of the display. Please write down the 12-digit license
key number for the option before proceeding. If that measurement
personality is to be used at a later date you will need the license key
number to reactivate the personality firmware.
NOTE Using the Uninstall key does not remove the personality from the
instrument memory, and does not free memory to be available to install
another option. If you need to free memory to install another option,
refer to the instructions for loading firmware updates located at
www.agilent.com/find/vsa/
1. Press
Pressing the
System, More(1 of 3), More(2 of 3), Uninstall, Choose Option.
Choose Option key will activate the alpha editor menu.
Use the alpha editor to enter the letters (upper-case) and the
front-panel numeric keyboard to enter the digits (if required) for the
option, then press the
Done key. As you enter the option, you will see
your entry in the active function area of the display.
2. Press the Uninstall Now key after you have entered the personality
option. Press the
process. Press the
Yes key if you want to continue the uninstall
No key to cancel the uninstall process.
3. Cycle the instrument power off and then on to complete the uninstall
process.
Chapter 2 39

Setting Up the GSM Mode
Installing Optional Measurement Personalities
40 Chapter2

3 Making GSM Measurements
41

Making GSM Measurements
GSM Measurements
GSM Measurements
Once in the mode, the following measurements for the GSM 450, GSM
480, GSM 850, GSM 900, DCS 1800, and PCS 1900 bands are available
by pressing the
❏ Transmit Power on page 49
❏ Power vs. Time on page 54
❏ Phase and Frequency Error on page 59
❏ Output RF Spectrum on page 66
❏ Spectrum (Frequency Domain) on page 78
❏ Waveform (Time Domain) on page 86
❏ Tx Band Spur on page 93
These are referred to as one-button measurements. When you press the
key to select the measurement it will become the active measurement,
using settings and a display unique to that measurement. Data
acquisitions will automatically begin provided trigger requirements, if
any, are met.
Measure key.
42 Chapter3

Making GSM Measurements
Preparing for Measurements
Preparing for Measurements
If you want to set the GSM mode to a known, factory default state,
press
Preset. This will preset the mode setup and all of the
measurements to the factory default parameters.
NOTE Pressing the Preset key does not switch instrument modes.
To preset only the settings that are specific to the selected
measurement, press
set the measure setup parameters, for the currently selected
measurement only, to the factory defaults.
Initial Setup
Before making a measurement, make sure the mode setup and
frequency/channel parameters are set to the desired settings. Refer to
the sections “Changing the Mode Setup” and “Changing the Frequency
Channel” in the previous chapter.
Meas Setup, More, Restore Meas Defaults. This will
How to Make a Measurement
Follow the three-step process shown in the table below:
Step Primary Key Setup Keys Related Keys
1. Select &
setup a mode
2. Select &
setup a measurement
3. Select &
setup view
Mode Mode Setup, Input,
Frequency Channel
Measure Meas Setup Meas Control,
View/Trace Span X Scale,
Amplitude Y Scale
Next Window, Zoom
, Display,
System
Restart
File
, Save,
Print, Print Setup,
Marker, Search
Chapter 3 43

Making GSM Measurements
Preparing for Measurements
Measurement Control
The Meas Control front panel menu key controls processes that affect
the running of the current measurement.
•
Measure softkey. Press Meas Control,Measure (nottobe confused with
the front panel
between Single and Cont (for continuous) measurement states.
When set to Single, the measurement will continue until it has
reached the specified number of averages set by the average counter.
When set to Continuous, the measurement will run continuously,
and perform averaging according to the current average type (repeat
or exponential). The default setting is continuous.
•
Pause key. Press Meas Control, Pause to pause the current
measurement. Once toggled, the label of the
read
Resume. The Resume key, once pressed, continues the active
measurement from the point at which it was paused.
• Restart key. The Restart front panel key repeats the current
measurement from the beginning, while retaining the current
measurement settings.
Measure key which has a different function) to toggle
Pause key changes to
44 Chapter3

Making GSM Measurements
Preparing for Measurements
Measurement Setup
The Meas Setup key accesses features that enable you to adjust
parameters of the current measurement, such as resolution bandwidth.
You will also use the
and
Advanced measure setup feature menus.
The following measure setup features can be used with many or all
measurements.
Res BW key. Press Meas Setup, Res BW to change the resolution of a
•
given measurement. Selection of a narrower bandwidth will result in
a longer data acquisition time.
•
Restore Meas Defaults key. To preset only the settings that are
specific to the selected measurement, press
Restore Meas Defaults. This will set the measure setup parameters,
for the currently selected measurement only, to the factory defaults.
Averaging
Meas Setup menutoaccesstheAverage, Trig Source,
Meas Setup, More,
Selecting one of the averaging keys in the
Meas Setup menu will allow
you to modify the number, averaging mode, and type of averaging you
use for the currently selected measurement.
•
Averages, or Avg Number - Allows you to change the number of N
averages to be made.
• Avg Mode Exp Repeat - Allows you to choose either exponential or
repeat averaging. This selection only effects the averaging after the
number of N averages is reached (set using the
Avg Bursts, or Avg Number key).
Averages,
— Normal averaging: Normal (linear) averaging is always used
until the specified number of N averages is reached. When
Measure is set at Single, data acquisitions are stopped when the
number of averages is reached - thus
Avg Mode has no effect on
single measurements.
— Exponential averaging: When Measure is set at Cont, data
acquisitions will continue indefinitely. After N averages,
exponential averaging is used with a weighting factor of N (the
displayed average count stops at N). Exponential averaging
weights new data more than old data, which allows tracking of
slow-changing signals. The weighting factor N is set using the
Averages, Avg Bursts, or Avg Number key.
— Repeat averaging: When
Measure is set at Cont, data
acquisitions will continue indefinitely. After N averages is
reached, all previous result data is cleared and the average count
is set back to 1. This is equivalent to being in
pressing the
Restart key each time the Single measurement
Measure Single and
finishes.
Chapter 3 45

Making GSM Measurements
Preparing for Measurements
• Avg Type - Select the averaging type from the following selections:
(Not all of the selections are available for all measurements)
Pwr Avg (RMS) - The true power averaging, and is equivalent to
taking the RMS of the voltage. It is the most accurate type.
Log-Pwr Avg(Video) - Simulates the traditional spectrum analyzer
type of averaging by averaging the log of the power.
Mean - Averages the mean values.
Voltage Avg - Averages the voltage values.
Maximum - Keeps track of the maximum values.
Minimum - Keeps track of the minimum values.
Max & Min - Keeps track of the maximum and minimum values.
46 Chapter3

Trig Source
Making GSM Measurements
Preparing for Measurements
Changing the selection in the
Trig Source menu alters the trigger source
for the selected measurement only. Not all of the selections are
available for all measurements. Note that the
Video (IF Envlp), Ext Front, and Ext Rear menu keys found in the Trigger
RF Burst (Wideband),
menu enable you to change settings to modify the delay, level, and slope
for each of these trigger sources. Choose one of the following trigger
sources:
•
Free Run (Immediate) - The trigger occurs at the time the data is
requested, completely asynchronous to the RF or IF signal.
• RF Burst (Wideband) - An internal wideband RF burst trigger that
has an automatic level control for burst signals. It triggers on a level
that is relative to the peak of the signal passed by the RF.
•
Video (IF Envlp) - An internal IF envelope trigger. It triggers on an
absolute threshold level of the signal passed by the IF.
• Ext Front - Activates the front panel external trigger input (EXT
TRIGGER INPUT). The external trigger must be a signal between −5
and +5 volts.
• Ext Rear - Activates the rear panel external trigger input (TRIGGER
IN). The external trigger must be a signal between −5 and +5 volts.
Frame - Uses the internal frame clock to generate a trigger signal.
•
The clock parameters are controlled under the
Mode Setup key or the
measurement firmware, not both. See the specific measurement for
details.
•
Line - activates an internal line trigger. Sweep triggers occur at
intervals synchronized to the line frequency.
Rear panel TRIGGER 1 OUT and TRIGGER 2 OUT connectors are coupled
to the selected trigger source. These trigger outputs are always on the
rising edge with a pulse width of at least 1 µs.
Chapter 3 47

Making GSM Measurements
Preparing for Measurements
Burst Sync
Pressing the
Burst Sync key allows you to choose the source used to
synchronize the measurement to the “T0” point of the GSM burst. The
“T0” point is defined as the time point of the transition from bit 13 to bit
14 of the midamble training sequence for a given time slot. The
Burst Search Threshold setting (in the Mode Setup keys under Trigger)
applies to both
Pressing the
Training Seq and RF Amptd. It is described on page 20.
Burst Sync key will bring up a menu with some or all of the
following choices:
•
Training Seq - Synchronizes the measurement to the timing of the
demodulated training sequence in the GSM burst. This is the most
precise method, but requires a GSM burst with a valid TSC
(Training Sequence Code). The “T0” point is determined by
demodulation of the burst and successful identification of the TSC.
“T0” is then found to within 1/10 bit.
•
RF Amptd - Synchronizes the measurement to the burst transition of
the measured RF carrier. “T0” is set to the 50% point between the
start and end of the burst.
•
None - Use the start of the time record as the start of the useful part.
“T0” is set to the middle of the useful part.
• Ext - Use the external trigger plus delay as the start of the useful
part. “T0” is set to the middle of the useful part.
48 Chapter3

Making GSM Measurements
Making the Transmit Power Measurement
Making the Transmit Power Measurement
Purpose
Transmit Power is the measure of in-channel power for GSM systems.
Mobile stations and base transceiver stations must transmit enough
power, with sufficient modulation accuracy, to maintain a call of
acceptable quality without leaking into frequency channels or timeslots
allocated for others. GSM systems use dynamic power control to ensure
that each link is maintained with minimum power. This gives two
fundamental benefits: overall system interference is kept to a minimum
and, in the case of mobile stations, battery life is maximized.
The Transmit Power measurement determines the average power for
an RF signal burst at or above a specified threshold value. The
threshold value may be absolute, or relative to the peak value of the
signal.
At the base transceiver station, the purpose of the Transmit Power
measurement is to determine the power delivered to the antenna
system on the radio-frequency channel under test. The Transmit Power
measurement verifies the accuracy of the mean transmitted RF carrier
power. This can be done across the frequency range and at each power
step.
Measurement Method
The instrument acquires a GSM signal in the time domain. The average
power level above the threshold is then computed and displayed. This
measurement uses the “power-above-threshold” method instead of the
“useful part of the burst” method defined in the GSM standards. The
measured Transmit Carrier Power will be very nearly the same for
these two methods. The power-above-threshold method has the
advantages of being faster and allows power measurements to be made
at somewhat lower power levels. It also has the advantage of not
requiring the carrier to have a valid TSC (Training Sequence Code).
Note that this measurement does not provide a way to specify which
timeslot is to be measured. Therefore if multiple timeslots are on, they
should all be set at the same power level, or the levels of those timeslots
to be excluded need to be kept below the threshold level. If you want to
measure Transmit Carrier Power using the GSM specified useful part
of the burst method, use the Power vs. Time measurement, which also
measures the power ramping of the burst.
Chapter 3 49

Making GSM Measurements
Making the Transmit Power Measurement
Making the Measurement
NOTE The factory default settings provide a GSM compliant measurement.
For special requirements, you may need to change some of the settings.
Press
return all parameters for the current measurement to their default
settings.
Select the desired ARFCN, center frequency, timeslot, burst type, and
TSC (Training Sequence Code) as described in the section titled
“Changing the Frequency Channel” on page 22.
Meas Setup, More (1 of 2), Restore Meas Defaults at any time to
Press
Measure, Transmit Pwr to immediately make Transmit Power the
active measurement.
Tochange any of the measurement parameters from the factory default
values, refer to the “Changing the Measurement Setup” section for this
measurement.
50 Chapter3
Making the Transmit Power Measurement
Results
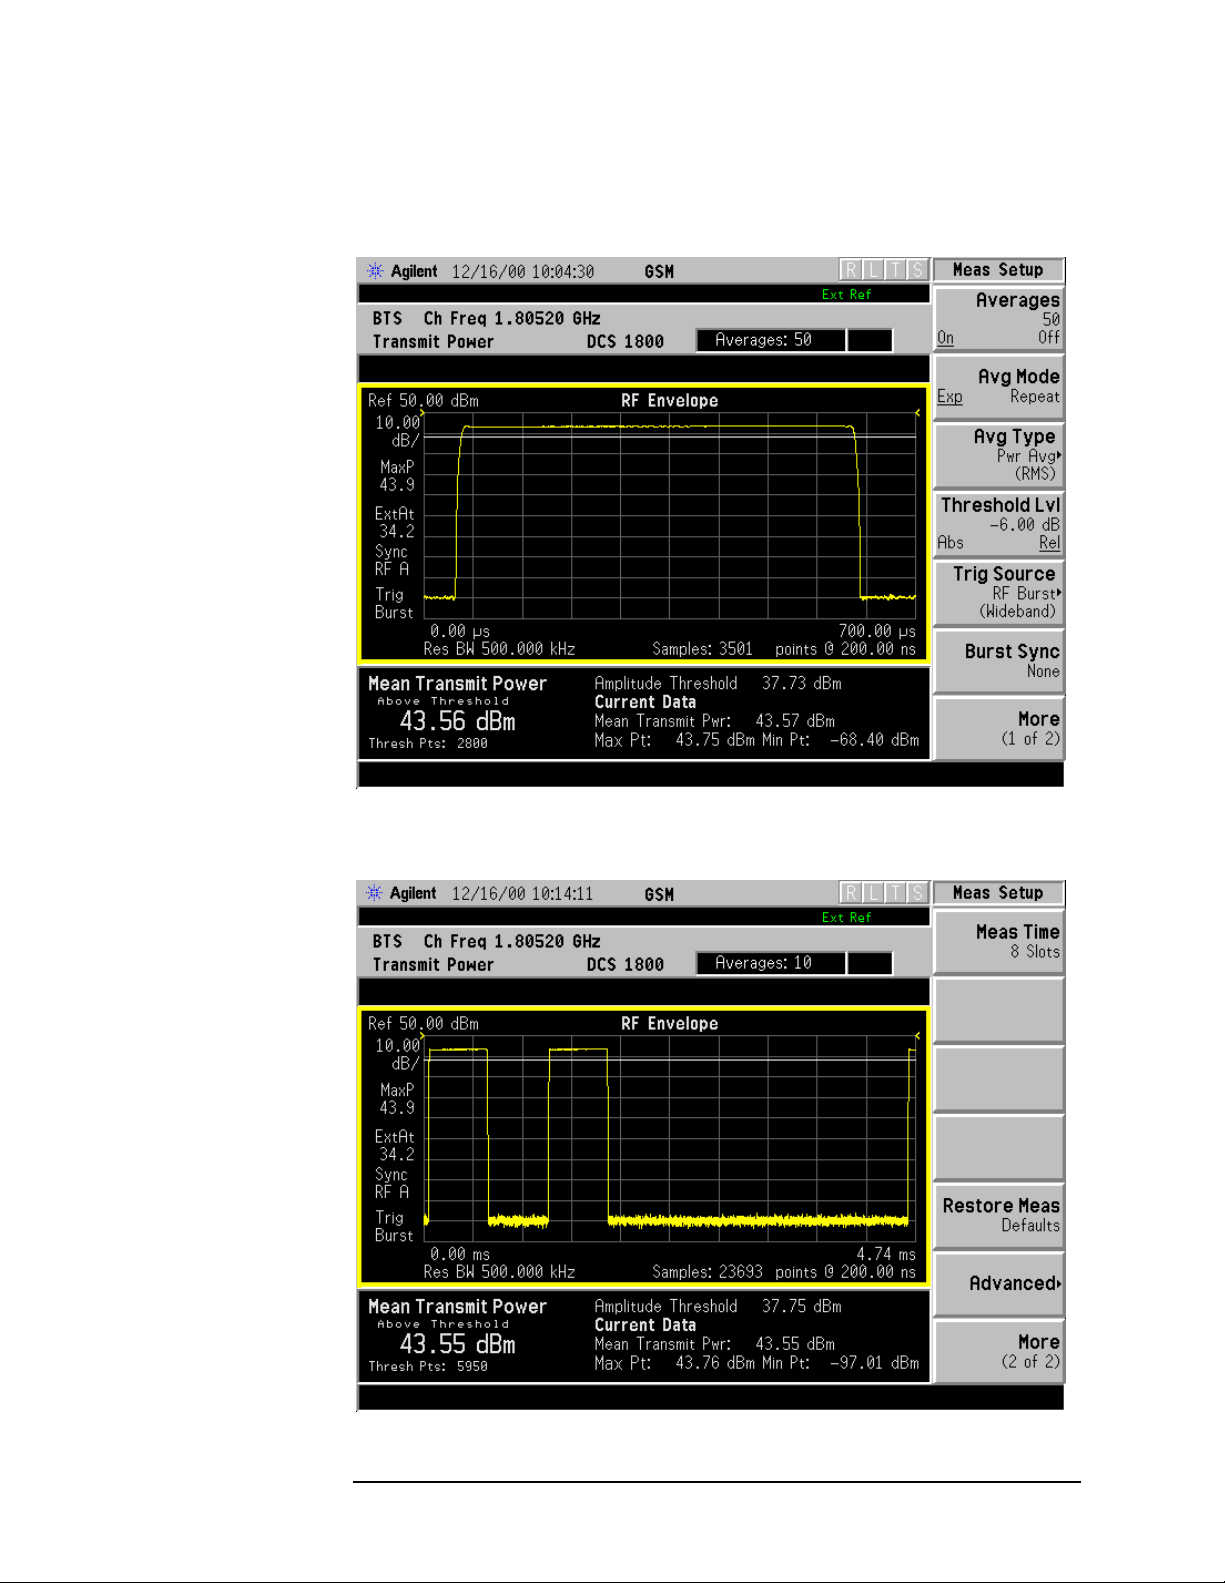
Figure 3-1 Transmit Power Result - Single Burst
Making GSM Measurements
Figure 3-2 Transmit Power Result - Multiple Bursts
Chapter 3 51

Making GSM Measurements
Making the Transmit Power Measurement
Changing the Measurement Setup
Table 3-1 Transmit Power Measurement Defaults
Measurement Parameter Factory Default Condition
Averages 50 On
Avg Mode Exp
Avg Type Pwr Avg (RMS)
Threshold Lvl −6.00 dB Rel (to peak)
Trig Source RF Burst (Wideband)
Burst Sync None
Meas Time 1 slot
Advanced
RBW Filter Gaussian
Res BW 500.000 kHz
NOTE Parameters that are under the Advanced key seldom need to be
changed. Any changes from the factory default values may result in
invalid measurement data.
Make sure the Transmit Power measurement is selected under the
Measure menu. Press the Meas Setup key to access a menu which allows
you to modify the averaging, trigger source, and burst sync for this
measurement (as described in the “Measurement Setup” section at the
beginning of this chapter). In addition, the following transmit power
measurement parameters can be modified:
•
Threshold Lvl Abs Rel - choose absolute or relative and enter a value
for the threshold level. The absolute value sets the threshold line at
that power level. The relative value will set the threshold line at a
specified level relative to the peak of the burst. The measurement
will determine the average power of all data above this threshold.
•
Burst Sync - an information only key. The selection cannot be
changed for this measurement.
• Meas Time - allows you to measure more than one timeslot. Enter an
integer value in increments of “slots” with a range of 1 to 50. The
actual measure time is set somewhat longer than the specified
number of slots in order to view the complete burst.
52 Chapter3

Making GSM Measurements
Making the Transmit Power Measurement
• Advanced - accesses a menu to change the following parameters:
RBW Filter - this key toggles to select a Flat Top or a Gaussian (the
default filter) resolution bandwidth filter. A Gaussian filter
provides more even time domain response,particularlyforbursts.
A Flat Top filter provides a flatter bandwidth but is less accurate
for pulse responses. A Flat Top filter also requires less memory
and allows longer data acquisition times.
Res BW - sets the resolution bandwidth.
Troubleshooting Hints
Low output power can lead to poor coverage and intermittent service
for phone users. Out of specification power measurements indicate a
fault usually in the power amplifier circuitry. They can also provide
early indication of a fault with the power supply, i.e. the battery in the
case of mobile stations.
Chapter 3 53

Making GSM Measurements
Making the Power vs. Time Measurement
Making the Power vs. Time Measurement
Purpose
Power vs. Time measures the mean transmit power during the “useful
part” of GSM bursts and verifies that the power ramp fits the within
the defined mask. Power vs. Time also lets you view the rise, fall, and
“useful part” of the GSM burst.
GSM is a Time Division Multiple Access (TDMA) scheme with eight
time slots, or bursts, per RF channel. If the burst does not occur at
exactly the right time, or if the burst is irregular, then other adjacent
timeslots can experience interference. Because of this, the industry
standards specify a tight mask for the fit of the TDMA burst.
The Power vs. Time measurement provides masks for both BTS (Base
Transceiver Station) and MS (mobile station). The timings are
referenced to the transition from bit 13 to bit 14 of the midamble
training sequence. The 0 dB reference is determined by measuring the
mean transmitted power during the “useful part” of the burst. You can
also define a user configurable limit mask to apply to the measured
burst using SCPI commands (refer to the “Changing the Measurement
Setup” section).
The GSM specifications defines the “useful part” of the normal GSM
burst as being the 147 bits centered on the transition from bit 13 to bit
14 (the “T0” time point).
Measurement Method
The instrument acquires a GSM signal in the time domain. The “T0”
point and the useful part are computed. If Burst Sync is set to
Seq, a GSM demodulation is performed to find “T0”. If Burst Sync is set
to
RF Amptd, an approximation of “T0” will be used without performing
a demodulation. The average power in the useful part is then computed
and displayed, and the GSM limit mask is applied. The measurement
displays Pass when the burst fits within the bounds of the mask.
Training
54 Chapter3

Making GSM Measurements
Making the Power vs. Time Measurement
Making the Measurement
NOTE The factory default settings provide a GSM compliant measurement.
For special requirements, you may need to change some of the settings.
Press
return all parameters for the current measurement to their default
settings.
Select the desired ARFCN, center frequency, timeslot, burst type, and
TSC (Training Sequence Code) as described in the section titled
“Changing the Frequency Channel” on page 22.
Timeslot is available when Burst Sync is either Training Sequence or
RFAmptd.
The timeslots are determined by taking the acquired data and dividing
it into timeslots 0 to 7. An active timeslot burst must be within
approximately 25% of the expected timeslot position, otherwise the
E4406A may think the burst is an adjacent timeslot and may not detect
it. The trigger delay can be used to position the signal if it is not
aligning in the timeslots as desired.
Meas Setup, More (1 of 2), Restore Meas Defaults at any time to
Press
Measure, Pwr vs Time to immediately make Power vs. Time the
active measurement.
Tochange any of the measurement parameters from the factory default
values, refer to the “Changing the Measurement Setup” section for this
measurement.
Chapter 3 55
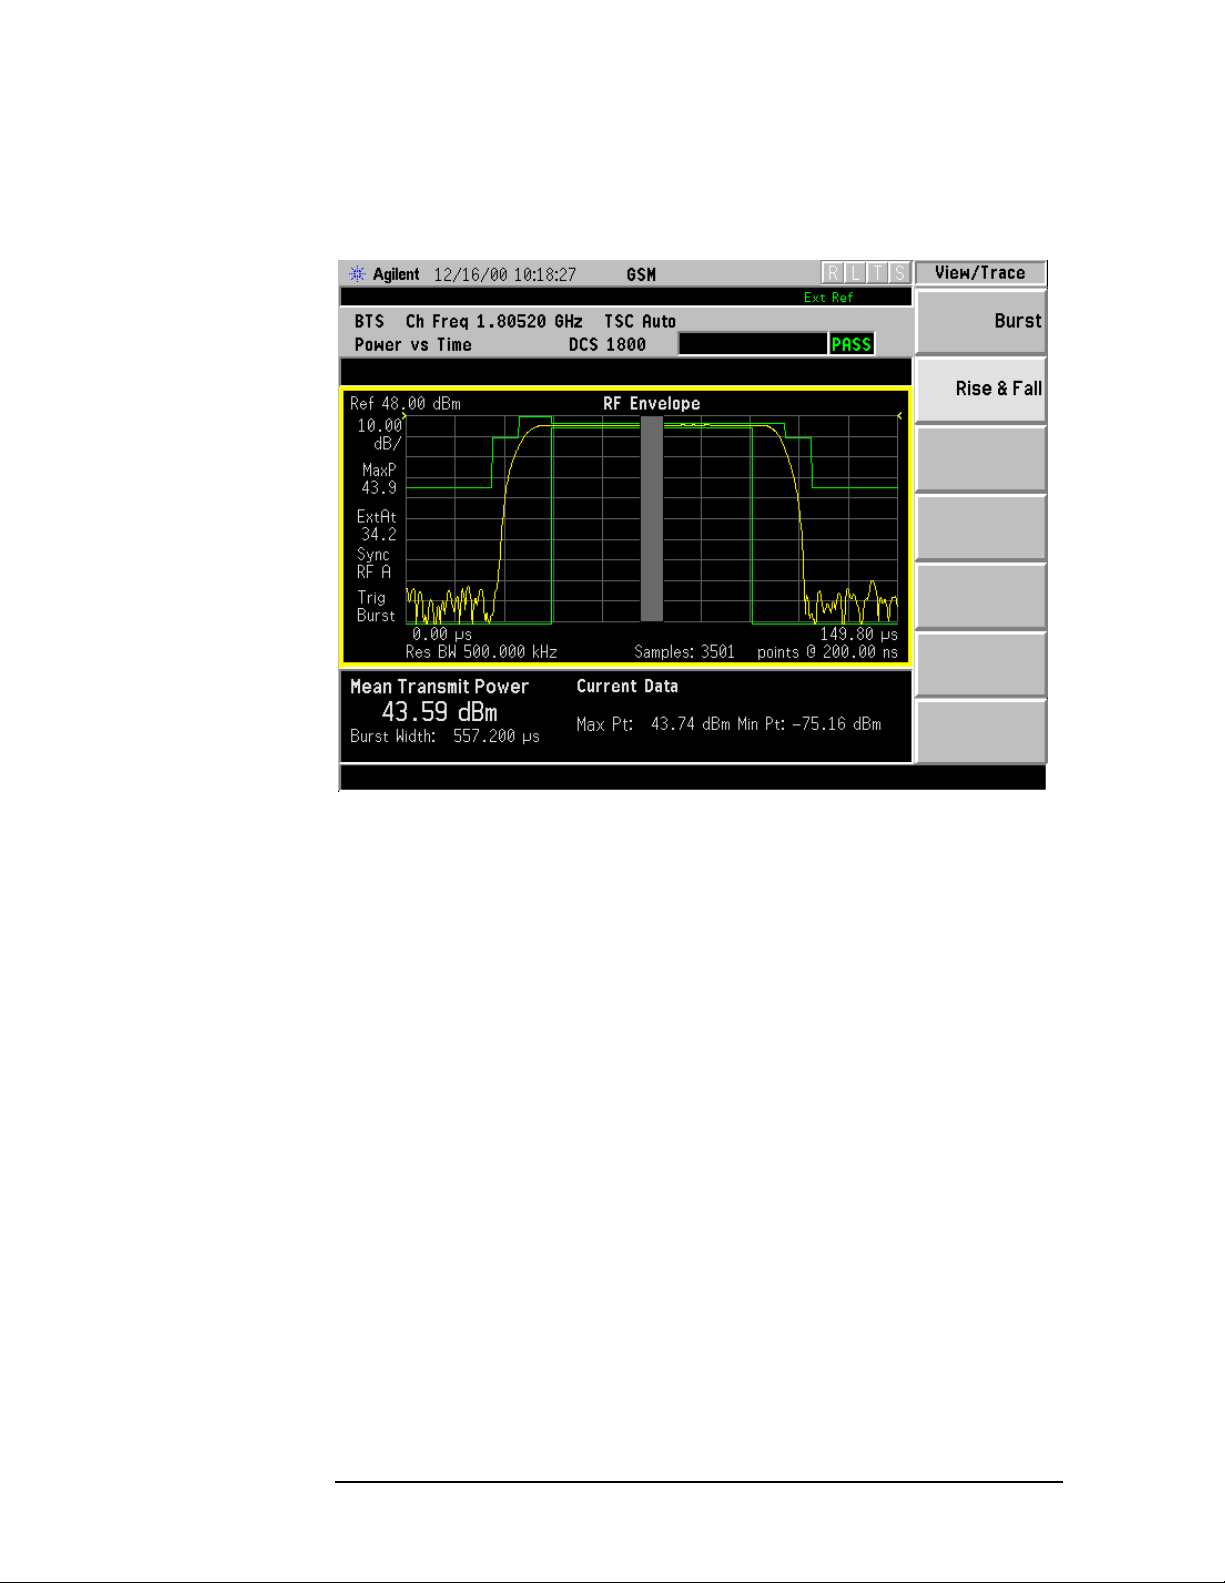
Making GSM Measurements
Making the Power vs. Time Measurement
Results
Figure 3-3 Power vs. Time Measurement Result - Burst View
56 Chapter3

Making the Power vs. Time Measurement
Changing the Measurement Setup
Table 3-2 Power vs. Time Measurement Defaults
Measurement Parameter Factory Default Condition
Avg Bursts 10 Off
Avg Mode Exp
Avg Type Pwr Avg (RMS)
Meas Time 1 Slot
Trig Source RF Burst (Wideband)
Burst Sync Training Seq
Advanced
RBW Filter Gaussian
Res BW 500.000 kHz
Making GSM Measurements
NOTE Parameters that are under the Advanced key seldom need to be
changed. Any changes from the default values may result in invalid
measurement data.
Make sure the Power vs. Time measurement is selected under the
Measure menu. The Meas Setup key will access a menu which allows you
to modify the averaging, trigger source, and burst sync for this
measurement (as described in the “Measurement Setup” section at the
beginning of this chapter). In addition, the following power vs. time
measurement parameters can be modified:
•
Meas Time - allows you to measure more than one timeslot. Enter a
value in integer increments of “slots” with a range of 1 to 50. The
actual measure time in µs is set somewhat longer than the specified
number of slots in order to view the complete burst.
•
Advanced - accesses a menu to change the following parameters:
RBW Filter - chooses the type of filter, either Gaussian or Flat
(Flatop). Gaussian is the best choice when looking at the overall
burst or the rising and falling edges, as it has excellent pulse
response. If you want to precisely examine just the useful part of
the burst, choose
Res BW - sets the resolution bandwidth.
Flat.
Power vs. Time Custom Masks
For the Power vs. Time measurement, you can define a user
configurable limit mask to apply to the measured burst. This feature
can only be accessed via SCPI commands. Refer to the programming
manual for further information.
Chapter 3 57

Making GSM Measurements
Making the Power vs. Time Measurement
Changing the View
The View/Trace key will access a menu which allows you to select the
desired view of the measurement from the following selections:
•
Burst - views the entire sweep as specified by the meas time.
Rise & Fall - zooms in on the rising and falling portions of the
•
burst being tested.
NOTE The limit test will still be performed on the entire burst, (viewed using
the Burst menu), when Rise & Fall is selected.
Changing the Display
The Display key will allow you to turn the limit mask on and off. This
also disables the mask limit test, but still calculates the power in the
useful part.
Troubleshooting Hints
If a transmitter fails the Power vs. Time measurement this usually
indicates a problem with the units output amplifier or leveling loop.
58 Chapter3

Making GSM Measurements
Making the Phase and Frequency Error Measurement
Making the Phase and Frequency Error
Measurement
Purpose
Phase and frequency error are the measures of modulation quality for
GSM systems. Since GSM systems use relative phase to transmit
information, the phase and frequency accuracy of the GSM transmitter
are critical to the systems performance and ultimately affect range.
GSM receivers rely on the phase and frequency quality of the 0.3
GMSK signal in order to achieve the expected carrier to noise
performance. A transmitter with high phase and frequency error will
often still be able to support phone calls during a functional test.
However, it will tend to provide difficulty for mobiles trying to maintain
service at the edges of the cell, with low signal levels or under difficult
fading and Doppler conditions.
Measurement Method
The phase error of the test signal is measured by computing the
difference between the phase of the transmitted signal and the phase of
a theoretically perfect signal.
The instrument samples the transmitter output in order to capture the
actual phase trajectory. This is then demodulated and the ideal phase
trajectory is mathematically derived. Subtracting one from the other
results in an error signal.
This measurement allows you to display these errors numerically and
graphically on the analyzer display. It also allows you to view a binary
representation of the demodulated data bits.
Chapter 3 59

Making GSM Measurements
Making the Phase and Frequency Error Measurement
Making the Measurement
NOTE The factory default settings provide a GSM compliant measurement.
For special requirements, you may need to change some of the settings.
Press
return all parameters for the current measurement to their default
settings.
Select the desired ARFCN, center frequency, timeslot, burst type, and
TSC (Training Sequence Code) as described in the section titled
“Changing the Frequency Channel” on page 22.
Meas Setup, More (1 of 2), Restore Meas Defaults at any time to
Select the type of carrier to measure. Press
Mode Setup, Radio, Carrier
and select Burst to measure a burst carrier, or Cont to measure a
continuous carrier from a non-bursting base station.
When Training Sequence is selected as the burst sync for this
measurement, set the
measure. For example, if
Timeslot selection to determine which timeslot to
Timeslot is set to 2, the measurement will be
made on the timeslot number 2. Be careful when adding delay in the
Trigger setup, as this measurement does not take into account trigger
delay when checking for a valid burst. If there is sufficient delay added
(usually more than 25% of a timeslot), the burst might not be detected.
Press
Measure, Phase & Freq to immediately make Phase and Frequency
Error the active measurement.
Tochange any of the measurement parameters from the factory default
values, refer to the “Changing the Measurement Setup” section for this
measurement.
60 Chapter3

Making GSM Measurements
Making the Phase and Frequency Error Measurement
Results
Figure 3-4 Phase and Frequency Error Result - Quad View
Chapter 3 61

Making GSM Measurements
Making the Phase and Frequency Error Measurement
Figure 3-5 Phase and Frequency Error Result - Phase Error View
Figure 3-6 Phase and Frequency Error Result - RF Envelope View
62 Chapter3

Making GSM Measurements
Making the Phase and Frequency Error Measurement
Figure 3-7 Phase and Frequency Error Result - Polar View
Figure 3-8 Phase and Frequency Error Result - Data Bits
Chapter 3 63

Making GSM Measurements
Making the Phase and Frequency Error Measurement
Changing the Measurement Setup
Table 3-3 Phase and Frequency Error Measurement Defaults
Measurement Parameter Factory Default Condition
Avg Bursts 10 Off
Avg Mode Repeat
Avg Type Maximum
Trig Source RF Burst (Wideband)
Burst Sync Training Sequence
NOTE Parameters that are under the Advanced key seldom need to be
changed. Any changes from the default values may result in invalid
measurement data.
Make sure the Phase and Frequency Error measurement is selected
under the
which allows you to modify the averaging, trigger source, and burst
sync for this measurement (as described in the “Measurement Setup”
section at the beginning of this chapter).
Measure menu. Press the Meas Setup key to access a menu
Changing the View
The View/Trace key will allow you to select the desired view of the
measurement from the following:
•
I/Q Error (Quad-View) - See Figure 3-4. Provides a combination view
including:
Window 1: Phase Error
Window 2: Phase Error with Freq
Window 3: RF Envelope
Window 4: Numeric Results
Any of these windows can be selected (using the
and made full size (using the
Zoom key). See Figure 3-5 and
Figure 3-6.
• I/Q Measured Polar Vector - See Figure 3-7. Provides a view of numeric
results and a polar vector graph.
Window 1: Numeric Results
Window 2: Polar Vector Graph
Data Bits - See Figure 3-8. Provides a view of the numeric results and
•
data bits with the sync word (TSC) highlighted.
Next Window key)
64 Chapter3

Making GSM Measurements
Making the Phase and Frequency Error Measurement
The menus under the Span X Scale and Amplitude Y Scale keys are
context dependent upon the selected window (graph type). The
Scale parameters will be in units of time or bits, dependent on the view
selected. The
Amplitude Y Scale parameters will be in units of dB or
Span X
degrees, dependent on the view selected. All of the softkey labels are
blank when
I/Q Measured Polar Vector, or Data Bits are selected.
Changing the Display
The Display key will allow you to turn the bit dots on and off.
Troubleshooting Hints
Poor phase error indicates a problem with the I/Q baseband generator,
filters, or modulator in the transmitter circuitry. The output amplifier
in the transmitter can also create distortion that causes unacceptably
high phase error. In a real system poor phase error will reduce the
ability of a receiver to correctly demodulate, especially in marginal
signal conditions. This ultimately affects range.
Occasionally, a Phase and Frequency Error measurement may fail the
prescribed limits at only one point in the burst, for example at the
beginning. This could indicate a problem with the transmitter power
ramp or some undesirable interaction between the modulator and
power amplifier.
Chapter 3 65

Making GSM Measurements
Making the Output RF Spectrum Measurement
Making the Output RF Spectrum
Measurement
Purpose
The Output RF Spectrum measurement is the GSM version of adjacent
channel power (ACP). Either a single offset is measured with
corresponding traces or up to 15 offsets are measured and a table is
displayed.
The output RF spectrum measurements determine the spectral energy
emitted into the adjacent channels. Excessive amounts of energy
spilling into an adjacent frequency channel could interfere with signals
being transmitted to other MS or BTS. The measurements are divided
into two main groups: spectrum due to the 0.3 GMSK modulation and
noise, and spectrum due to switching transients (burst ramping).
Since GSM is a TDMA format, RF power is being switched on and off
depending on whether the actual burst is being transmitted. The
switching of power causes spectral splatter at frequencies other than
that being transmitted by the carrier. Fast transitions in the time
domain causes switching transients that have high frequency content
associated with them.
NOTE The default output RF spectrum measurements do not perform tests at
frequency offsets greater than 1800 kHz from the carrier.
66 Chapter3

Making GSM Measurements
Making the Output RF Spectrum Measurement
Measurement Method
In this measurement, the transmitter (source) is set to transmit a GSM
frame at a given channel (frequency). The instrument acquires a time
record at a particular offset from the channel being transmitted. The
method of acquiring the time record is either a FFT/Inverse-FFT
method, or a direct time domain (DTD) method, depending on the
offset. These two methods and when they are used, will be described
below. When the offset is zero, the instrument is said to be measuring
the carrier. For a given offset frequency from the carrier, the
transmitter must not exceed a certain power level relative to the
carrier. The GSM specification defines the offsets and their maximum
absolute and relative power levels.
The general steps in making the measurement are as follows:
• Acquire time record (using either FFT or DTD methods, described
below)
• Synchronize for gating on the carrier - finds 50% and 90% portion of
burst for Spectrum Due to Modulation portion of the test
• Measure power of the carrier
• Compare each offset power to reference to get relative power level
The method of acquiring the time record is dependent on accuracy and
dynamic range. With no pre-ADC filter (infinite bandwidth), the entire
IF bandwidth of the IF signal is hitting the analog to digital converter
(ADC). The ADC gain is set based on the peak level at its input. The
dynamic range (noise floor) of the ADC is dependent on the gain
selected. For the type of signals being measured, the highest energy
within the IF bandwidth is at the carrier. Therefore, the lowestdynamic
range (highest noise floor) of the ADC occurs when the full energy of the
carrier is input to the ADC.
All offsets measured using the FFT method are done with the
instrument tuned such that the carrier is at the center of the IF
bandwidth. Therefore, the dynamic range of the offsets measured using
the FFT method is the same as that for the carrier. The dynamic range
requirement generally increases astheoffsetfrequencyincreases. If the
dynamic range requirement exceeds what is available by FFT method,
the direct time domain (DTD) method utilizing the pre-ADC filter is
used.
Chapter 3 67

Making GSM Measurements
Making the Output RF Spectrum Measurement
The Direct Time Break Freq key setting is the first offset frequency
which is measured using the DTD method. Its range is determined by
assuring no aliasing occurs on FFT offsets and that the dynamic range
requirements are met.
The FFT method acquires a wideband signal (1.55 MHz) in a flattop
filter. An FFT is performed to get the spectrum of the GSM signal. The
resolution bandwidth filter can now be applied mathematically to the
spectrum at multiple offsets, with an inverse-FFT performed on the
data which passes the filter. In this way, multiple offsets are acquired
from one time record and LO setting. Since the resolution bandwidth
filter is a mathematical formula, it can be any shape and size, and is
perfect. The VSA uses the 5-pole synchronously tuned filter that the
GSM standard specifies.
The primary disadvantage to the FFT method is that the acquisition
must include the carrier.Thehigh energy of the carrier causes the ADC
to range down, thus lowering the dynamic range. At large offsets, the
dynamic range requirement is very challenging so the direct time
domain (DTD) method is used. The LO is tuned to the particular offset
and the pre-ADC filter is used to reduce the carrier. This allows the
ADC to range up, giving higher dynamic range. The disadvantage to
this method is that each offset measured has its own time record
acquisition and LO tune position, and this causes the measurement to
slow down compared to FFT offsets. The 5-pole synchronously tuned
filter is approximated by utilizing a digital Gaussian filter and setting
its equivalent noise bandwidth to that of the 5-pole synchronously
tuned filter. For these DTD offset frequencies, the filter has
closer-to-ideal 5-pole behavior (<1% tolerance) than does a 10%
tolerance, 5-pole analog filter.
Regardless of how the time record is obtained for a particular offset, the
power must be measured and compared to the reference power. There
are two measurements being made for the test: output RF spectrum
due to modulation and the output RF spectrum due to switching
transients. The GSM standard specifies which offsets get which tests.
In these two modes, the following conditions are met:
• In the output RF spectrum due to modulation measurement, the
average value during at least 40 bits between bit 87 and 132
(approximately equivalent to the 50% to 90% portion of the burst,
excluding midamble) is retained. The vertical lines mark the section
of the burst over which the measurement is made. If multiple bursts
are examined, an average of the average values is calculated. The
relative power (difference between the average power of the burst at
zero offset and the average power of the burst at the indicated offset)
and the absolute power are displayed.
68 Chapter3
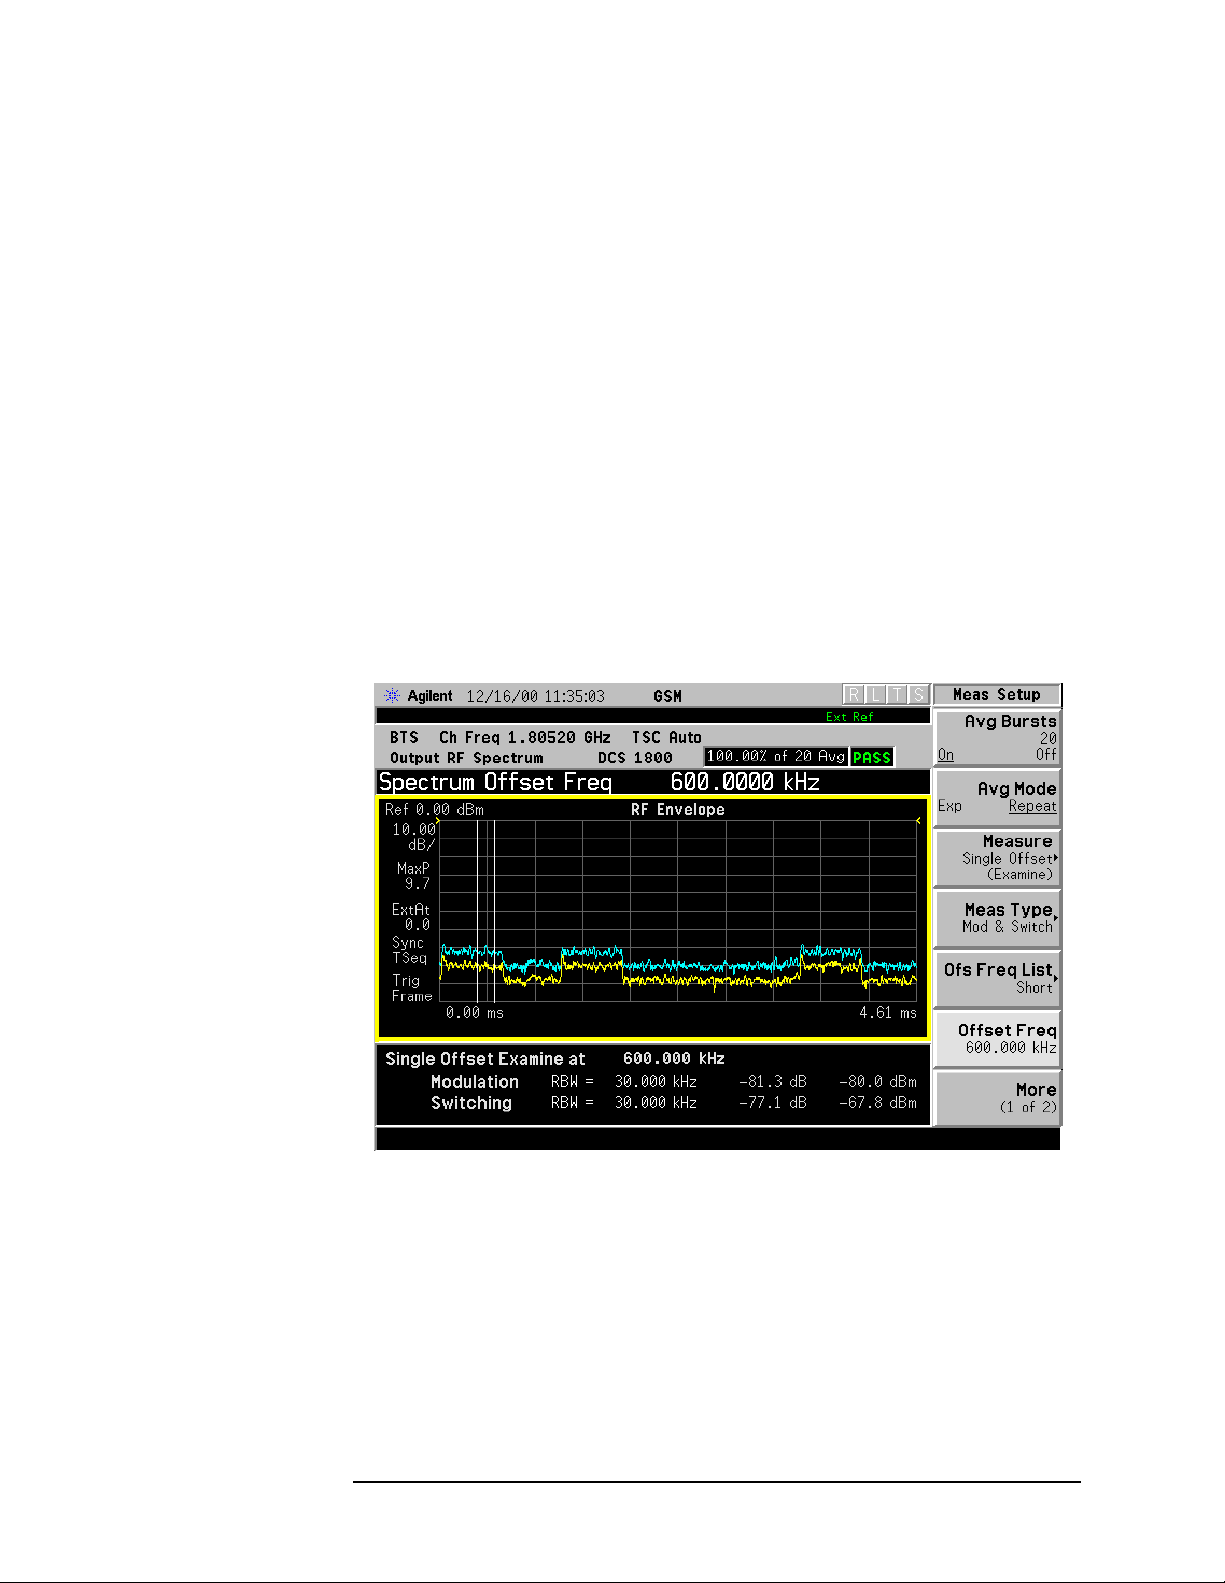
Making the Output RF Spectrum Measurement
• In the output RF spectrum due to switching transients, the peak
value of the burst is retained. If multiple bursts are examined, then
the maximum of the peak values is retained. The relative power
(difference between the peak power of the burst at zero offset and
the peak power of the burst at the indicated offset) and the absolute
power are displayed.
The GSM standard specifies the tests are run on specified offsets from
the carrier. The instrument identifies this as single offset or multiple
offset modes. The measurement made in these two modes is the same,
except that the multiple offset mode automatically makes the
measurement at all the specified offsets frequencies and lists the
results in a table at the end of the measurement.
Figure 3-9 shows a single-offset (Examine) trace for an entire GSM
frame with timeslots 0, 2, and 6 turned on and timeslots 1, 3, 4, 5, and 7
turned off. The vertical bars show the portion used to measure power
due to modulation.
Figure 3-9 GSM Frame in Single-Offset (Examine)
Making GSM Measurements
The RF envelope trace is displayed. If averaging is turned on, the trace
is then averaged with previous traces. For the modulation
measurement, the user may select the type of trace averaging, either
log-power averaged (Video) or power averaged (RMS). Forthe switching
transients measurement, the peak of the traces is used. For
modulation, the displayed value is the average of points within the
vertical bars. For transients,thedisplayedvalue is the max of all points
for all traces (Max of Peak) over the entire frame.
Chapter 3 69

Making GSM Measurements
Making the Output RF Spectrum Measurement
Making the Measurement
NOTE The factory default settings provide a GSM compliant measurement.
For special requirements, you may need to change some of the settings.
Press
return all parameters for the current measurement to their default
settings.
Select the desired ARFCN, center frequency, timeslot, burst type, and
TSC (Training Sequence Code) as described in the section titled
“Changing the Frequency Channel” on page 22.
When
measurement, set the
measure. For example, if
made on the timeslot number 2. Be careful when adding delay in the
Trigger setup, as this measurement does not take into account trigger
delay when checking for a valid burst. If there is sufficient delay added
(usually more than 25% of a timeslot), the burst might not be detected.
Meas Setup, More (1 of 2), Restore Meas Defaults at any time to
Training Sequence is selected as the burst sync for this
Timeslot selection to determine which timeslot to
Timeslot is set to 2, the measurement will be
Press
Measure, Output RF Spectrum to immediately make Output RF
Spectrum the active measurement.
Tochange any of the measurement parameters from the factory default
values, refer to the “Changing the Measurement Setup” section for this
measurement.
70 Chapter3
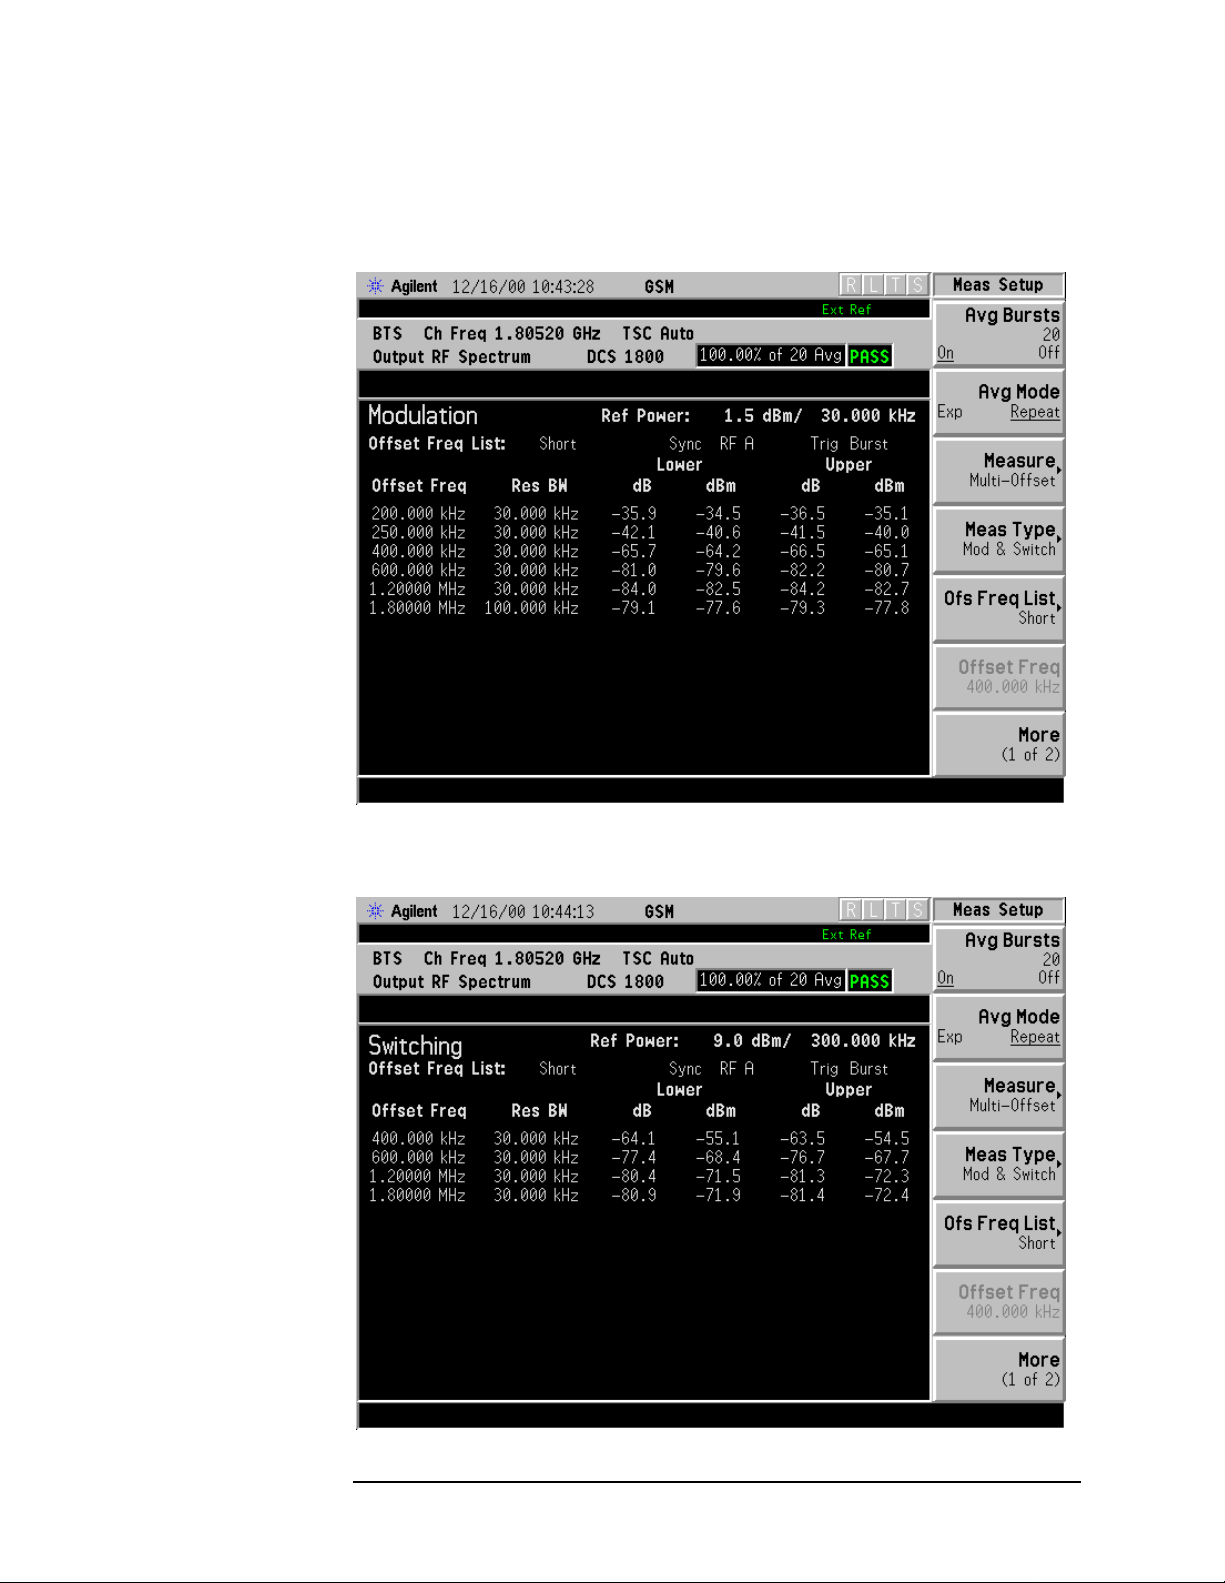
Making GSM Measurements
Making the Output RF Spectrum Measurement
Results
Figure 3-10 Output RF Spectrum Result Example (Short List)
Modulation View
Figure 3-11 Output RF Spectrum Result Example (Short List)
Switching View
Chapter 3 71

Making GSM Measurements
Making the Output RF Spectrum Measurement
Changing the Measurement Setup
Table 3-4 Output RF Spectrum Measurement Defaults
Measurement Parameter Factory Default Condition
Avg Bursts 20 On
Avg Mode Repeat
Meas Method Multi-Offset
Meas Type Modulation
Ofs Freq List Short
Offset Freq
(when single offset is selected)
Trig Source RF Burst
Burst Sync
(information only)
Fast Avg On
Advanced
Mod Avg Log-Pwr Avg (Video)
Switching Avg
(information only)
Direct Time Break Freq 600.000 kHz
Modulation Meas BWs
Carrier RBW 30.000 kHz
<1800 kHz Offset RBW 30.000 kHz
≥1800 kHz Offset RBW 100.000 kHz
VBW/RBW Ratio
(information only)
250.000 kHz
RF Amptd
Max of Peak
1
Switching Meas BWs
Carrier RBW 300.000 kHz
<1800 kHz Offset RBW 30.000 kHz
≥1800 kHz Offset RBW 30.000 kHz
VBW/RBW Ratio
(information only)
72 Chapter3
3

Making GSM Measurements
Making the Output RF Spectrum Measurement
NOTE Parameters that are under the Advanced key seldom need to be
changed. Any changes from the default values may result in invalid
measurement data.
Make sure the Output RF Spectrum measurement is selected under the
Measure menu. Press the Meas Setup key to access a menu which allows
you to modify the averaging and trigger source for this measurement
(as described in the “Measurement Setup” section at the beginning of
this chapter). In addition, the following output RF spectrum
measurement parameters can be modified:
❏
Measure - accesses a menu to choose the measurement mode.
Multi-Offset - automatically makes measurements at all offset
frequencies in the selected list (
(See table below.) Press the
Standard, Short, or Custom).
Ofs Freq List key to select a list of
offsets to measure.
Single Offset (Examine) - makes a measurement at a single offset
frequency as set by the
Offset Freq softkey.
Meas Type - accesses a menu to choose the measurement type.
❏
Mod & Switch - will perform both Modulation and Switching
measurements.
Modulation - measures the spectrum due to the 0.3 GMSK
modulation and noise.
Switching - measures the spectrum due to switching transients
(burst ramping).
Chapter 3 73

Making GSM Measurements
Making the Output RF Spectrum Measurement
❏ Ofs Freq List - accesses a menu to choose the offset frequency list.
Select a
Standard, Short, or Custom list as shown in the table below.
List Modulation Offsets
(kHz)
Standard 100, 200, 250, 400, 600,
800, 1000, 1200, 1400,
1600, 1800, 3000, 6000
Short 200, 250, 400,
600 1200, 1800
Custom User-defined list that specifies:
Offset Freq, Meas Type,
Initialized tobe the same asthe standard
list
Mod RBW, SW Trans RBW
(currently settable only by remote
commands)
Offset Freq - Only available when Measure is set to Single Offset
❏
(Examine). Offset frequencies can be entered using the RPG knob or
Switching
Transients
Offsets
(kHz)
400, 600,
1200, 1800
400, 600,
1200, 1800
400, 600,
1200, 1800
the Data Entry keys.
❏ Trig Source - in this measurement, trigger source and burst sync are
linked. Refer to the explanation under
Burst Sync.
74 Chapter3

Making GSM Measurements
Making the Output RF Spectrum Measurement
❏ Burst Sync - Synchronization is different on ORFS compared to other
measurements. Since offsets may be very low power and acquired
using very narrow filters, the burst edges are not well defined and
there certainly is not enough information to perform a
demodulation. Therefore all synchronization is performed on the
carrier. The timing reference (“T0”) is then re-used on the offsets.
Since “T0” on the carrier is determined with respect to the trigger
point, the trigger point on the offsets is very important. Once “T0” is
determined, the 50% and 90% points can be found.
Therefore, the trigger must be synchronous with respect to a rising
edge of a burst. The RF Burst trigger will do this if the offset is
within about 7 MHz of the carrier. Remember that since the RF
Burst trigger is wideband, the carrier will still cause the signal to
trigger. Assuming the trigger threshold remains constant, the
trigger with respect to the burst will remain constant. Since the
Frame Trigger uses an internal frame timer (clock), its period is set
so that it occurs synchronously with respect to the transmitting
frame. If an external trigger is used, it is important that it is
synchronous with the burst.
Because of these requirements, only the trigger source can be
selected while the measurement selects the burst sync type based on
the trigger source.
Trigger Source Measurement Defined
Burst Sync
Free Run None
RF Burst RF Amplitude
Ext Front External
Ext Rear External
Frame Training Sequence
NOTE Video trigger source is not allowed, because when the instrument is
tuned to offset frequencies away from the carrier, the video trigger
threshold will not be reached (due to the low power level of the offset.)
Chapter 3 75

Making GSM Measurements
Making the Output RF Spectrum Measurement
❏ Fast Avg - Fast averaging is a technique developed by HP/Agilent.
The GSM standard specifies 50% to 90% portion of the burst be
measured in 50 averages. Since most offsets are measured in a 30
kHz filter, there is a lot of variation from burst to burst, hence the
averaging.
❏ The fast average method makes use of the 10% to 90% portion of the
burst, excluding the midamble. The 10% to 50% portion of the burst
has statistically the same average power as the 50% to 90%.
Therefore, measuring both portions from one burst is statistically
the same as measuring 50% to 90% from two bursts. Now, two
averages are completed with one burst. When averaging is turned
on, this will double the speed of the measurement.
❏ This method is only applicable on the modulation portion of the test,
and only when averaging is enabled. The method is not available
when Modulation and Switching are done at the same time.
❏
Advanced - accesses a menu with the following keys:
Mod Avg - choose between:
•
Pwr Avg (RMS)
Log-Pwr Avg (Video)
• Switching Avg - information only. Averaging is fixed at
maximum of peak.
• Modulation Meas BWs - accesses a menu with the following
selections:
Carrier RBW
<1800 kHz Offset RBW
>=1800 kHz Offset RBW
VBW/RBW Ratio - information only. Modulation ratio is
fixed at 1.
Switching Meas BWs - accesses a menu with the following
•
selections:
Carrier RBW
<1800 kHz Offset RBW
>=1800 kHz Offset RBW
VBW/RBW Ratio - information only. Switching ratio is fixed at 3.
76 Chapter3

Making GSM Measurements
Making the Output RF Spectrum Measurement
• Direct Time Break Freq - Selects the transition frequency (the first
offset frequency) where the Direct Time Domain method is used
instead of the FFT method.The Direct Time Domain offers a high
dynamic range and is faster for measuring at a few offset
frequencies. The FFT method has a moderate dynamic range
(generally sufficient when the RBW = 30 kHz). It is much faster
for measuring at many offset frequencies.
Changing the View
If the Multi-Offset measurement has been chosen and the Meas
Type is Mod & Switch, pressing the
select the desired view of the current measurement. If the Meas
Type is Modulation, the
Meas Type is Switching, the
Switching Numeric view is unavailable. If the
Modulation Numeric view is unavailable.
View/Trace key will allow you to
If the Single Offset measurement has been chosen, the
Numeric and the Switching Numeric softkeys are unavailable (grayed
Modulation
out) as both modulation and switching results are always displayed.
Troubleshooting Hints
The Output RF Spectrum measurement, along with the Phase and
Frequency Error measurement, can reveal numerous faults in the
transmit chain, such as the I/Q baseband generator,filters& modulator.
Chapter 3 77

Making GSM Measurements
Making the Spectrum (Frequency Domain) Measurement
Making the Spectrum (Frequency Domain)
Measurement
Purpose
The spectrum measurement provides spectrum analysis capability for
the instrument. The control of the measurement was designed to be
familiar to those who are accustomed to using swept spectrum
analyzers.
This measurement is FFT (Fast Fourier Transform) based. The
FFT-specific parameters are located in the
available under basic mode spectrum measurements is an
I/Q window, which shows the I and Q signals in parameters of voltage
versus time. The advantage of having an I/Q view available while in the
spectrum measurement is that it allows you to view complex
components of the same signal without changing settings or
measurements.
Advanced menu. Also
Measurement Method
The transmitter tester uses digital signal processing to sample the
input signal and convert it to the frequency domain. With the
instrument tuned to a fixed center frequency, samples are digitized at a
high rate, converted to I and Q components with DSP hardware, and
then converted to the frequency domain with FFT software.
Making the Measurement
NOTE The factory default parameters provide a good starting point.You will
likely want to change some of the settings. Press
2), Restore Meas Defaults at any time to return all parameters for the
current measurement to their default settings.
Press
(Frequency Domain) the active measurement.
Tochange any of the measurement parameters from the factory default
values, refer to the “Changing the Measurement Setup” section for this
measurement.
Measure, Spectrum (Freq Domain) to immediately make Spectrum
Meas Setup, More (1 of
Results
A display with both a spectrum window and an I/Q Waveform window
will appear when you activate a spectrum measurement. Use the
Window key to select a window, and the Zoom key to enlarge a window.
78 Chapter3
Next

Making GSM Measurements
Making the Spectrum (Frequency Domain) Measurement
Figure 3-12 Spectrum Measurement Result- Spectrum and I/Q Waveform
Chapter 3 79

Making GSM Measurements
Making the Spectrum (Frequency Domain) Measurement
Changing the Measurement Setup
Table 1 Spectrum (Frequency Domain) Measurement Defaults
Measurement Parameter Factory Default Condition
Res BW 20.0000 kHz (Auto)
Averaging:
Avg Number
Avg Mode
Avg Type
Trigger Source RF Burst (Wideband)
25 On
Exp
Log-Pwr Avg (Video)
Measurement Time
(Service mode only)
Spectrum Window:
Span
Scale/Div - Amplitude Y Scale
I/Q Waveform Window:
Capture Time
Scale/Div - Amplitude Y Scale
Advanced
Pre-ADC BPF On
Pre-FFT Filter Flat
Pre-FFT BW 1.55000 MHz (Auto)
FFT Window Flat Top (High AmptdAcc)
FFT Size:
Length Control
Min Points/RBW
Window Length
FFT Length
ADC Range Auto Peak
1.0 ms (Auto)
1.00000 MHz
10.00 dB
188.00 µs
60 mV
Auto
1.300000
706
4096
Data Packing Auto
ADC Dither Auto
Decimation 0 (Auto)
IF Flatness On
80 Chapter3

Making GSM Measurements
Making the Spectrum (Frequency Domain) Measurement
NOTE Parameters under the Advanced key seldom need to be changed. Any
changes from the default advanced values may result in invalid
measurement data.
Make sure the
the
Measure menu. Press the Meas Setup key to access a menu which
Spectrum (Freq Domain) measurement is selected under
allows you to modify the averaging, and trigger source for this
measurement (as described in the “Measurement Setup” section). In
addition, the following parameters can be modified:
•
Span - This key allows you to modify the frequency span. Changing
the span causes the bandwidth to change automatically, and will
affect data acquisition time.
•
Res BW - This feature sets the resolution bandwidth for the FFT, and
allows manual or automatic settings. A narrower bandwidth will
result in a longer data acquisition time. In Auto mode the resolution
bandwidth is set to Span/50 (2% of the span).
•
Advanced - The following FFT advanced features should be used only
if you are familiar with their operation. Changes from the default
values may result in invalid data.
Pre-ADC BPF - This key allows you to toggle the pre-ADC
bandpass filter to On or Off states. The pre-ADC bandpass filter
is useful for rejecting nearby signals, so that sensitivity within
the span range can be improved by increasing the ADC range
gain.
Pre-FFT Fltr - Allows you to toggle between
Gaussian. The pre-FFT filter defaults to a flat top filter which has
Flat (flat top) and
better amplitude accuracy. The Gaussian filter has better pulse
response.
Pre-FFT BW - The Pre-FFT bandwidth allows you to select
between a manual or an automatic setting. The pre FFTbandwidth filter can be set between 1 Hz and 10 MHz. In Auto
mode this bandwidth is nominally 50% wider than the span. This
bandwidth determines the ADC sampling rate.
Chapter 3 81

Making GSM Measurements
Making the Spectrum (Frequency Domain) Measurement
FFT Window - Allows you to access the following selection
menu. Unless you are familiar with FFT windows, use the flat top
filter (the default filter).
• Flat Top - Selects a filter for best amplitude accuracy, by
reducing scalloping error.
• Uniform - You can select to have no window active by using
the uniform setting.
• Hanning
• Hamming
• Gaussian - Selects a gaussian filter with an alpha of 3.5.
• Blackman
• Blackman Harris
• K-B 70dB / 90dB/ 110dB (Kaiser-Bessel) - Allows selection
of Kaiser-Bessel filters with sidelobes of −70, −90, or −110 dBc.
FFT Size - This menu contains the following features:
• Length Ctrl - This feature allows you to set the FFT and
window lengths either automatically or manually.
• Min Pts in RBW - This feature allows you to set the
minimum number of data points that will be used inside the
resolution bandwidth. This adjustment is only available if the
Length Ctrl key is set to Auto.
• Window Length - This feature allows you to enter the FFT
window length ranging from 8 to 1048576. This length
represents the actual quantity of I/Q samples that are
captured for processing by the FFT. This value can only be
entered if length control is set to Manual.
• FFT Length - This feature allows you to enter the FFT length
in the number of captured samples, ranging from 4096 to
1048576. The FFT length setting is automatically limited so
that it is equal or greater than the FFT window length setting.
Any amount greater than the window length is implemented
by zero-padding. This value can be entered only if length
control is set to Man (manual).
ADC Range - Allows you to access the following selection menu
to define one of the following ADC ranging functions:
• Auto - Select this to set the ADC range automatically. For
most FFT spectrum measurements, the auto feature should
not be selected. An exception is when measuring a signal
which is “bursty”, in which case auto can maximize the time
domain dynamic range, if FFT results are less important to
you than time domain results.
• Auto Peak - Select this to set the ADC range automatically to
the peak signal level. Auto peak is a compromise that works
well for both CW and burst signals.
82 Chapter3

Making GSM Measurements
Making the Spectrum (Frequency Domain) Measurement
• AutoPeakLock - Select this to hold the ADC range
automatically at the peak signal level. Auto peak lock is more
stable than auto peak for CW signals, but should not be used
for “bursty” signals.
• Manual - Allows you to access the selection menu:
+6 dB, +12 dB, +18 dB, +24 dB, to set the ADC range level. Also
−6dB, 0dB,
note that manual ranging is best for CW signals.
Data Packing - Allows you to access the following selection
menu to define one of the following data packing methods:
• Auto - Data is automatically packed. This is the default setting
and most recommended.
• Short (16 bit) - Data is packed by every 16 bits.
Medium (24 bit) - Data is packed by every 24 bits.
•
Long (32 bit) - Data is packed by every 32 bits.
•
ADC Dither -AllowsyoutotoggletheADCdither function between
Auto, On, and Off. When set to auto (the default), ADC dither will
be activated when a narrow bandwidth is being measured, and
deactivated when a wide bandwidth is being measured. “ADC
dither” refers to the introduction of noise to the digitized steps of
the analog-to-digital converter; the result is an improvement in
amplitude accuracy. Use of the ADC dither, however, reduces
dynamic range by approximately 3 dB.
Decimation - Allows you to toggle the decimation function between
Auto and Man, and to set the decimation value. Auto is the
preferred setting, and the only setting that guarantees alias-free
FFT spectrum measurements. If you are familiar with the
decimation feature, you can change the decimation value by
setting to
Man, but be aware that aliasing can result in higher
values.
IF Flatness - Allows you to toggle between On and Off. When
toggled to
On (the default), the IF flatness feature causes
background amplitude corrections to be performed on the FFT
spectrum. The
Off setting is used for adjustment and
troubleshooting the transmitter tester.
Chapter 3 83

Making GSM Measurements
Making the Spectrum (Frequency Domain) Measurement
Changing the View
View/Trace menu keys are used to activate a view of a measurement
with preset X and Y scale parameters, called a “window”. Using the X
and Y Scale keys you can then modify these parameter settings. You
can also activate specific traces, using the
Windows Available for Spectrum Measurements
The spectrum and the I/Q windows can be viewed at the same time, or
individually. You can use the
Next Window and Zoom keys to move
between these different views.
Spectrum window Select this window if you want to view frequency
and power. Changes to frequency span or power will sometimes affect
data acquisition.
I/Q Waveform window. Select this window to view the I and Q signal
characteristics of the current measurement in parameters of voltage
and time.
Trace Display menu key.
NOTE For the widest spans the I/Q window becomes just “ADC time domain
samples”, because the I/Q down-conversion is no longer in effect.
Using the Markers
The Marker front-panel key accesses the menu to configure the markers.
If you want to use the marker function in the I/Q window, press
View/Trace, I/Q Waveform, Marker, Trace, IQ Waveform.
Select 1 2 3 4 - Allows you to activate up to four markers with the
•
corresponding numbers, respectively. The selected number is
underlined and its function is defined by pressing the
The default is 1.
• Normal - Allows you to activate the selected marker to read the
frequency and amplitude of the marker position on the spectrum
trace, for example, which is controlled by the
Delta - Allows you to read the differences in frequencies and
•
RPG knob.
amplitudes between the selected marker and the next.
• Function Off - Allows you to define the selected marker function to be
Band Power, Noise,orOff. The default is Off. If set to Band Power, you
need to select
Delta.
Function key.
Trace Spectrum - Allows you to place the selected marker on the
•
Spectrum, Spectrum Avg, or I/Q Waveform trace. The default is
Spectrum.
84 Chapter3

Making GSM Measurements
Making the Spectrum (Frequency Domain) Measurement
• Off - Allows you to turn off the selected marker.
Shape Diamond - Allows you to access the menu to define the selected
•
marker shape to be a
a
Diamond.
Marker All Off - Allows you to turn off all of the markers.
•
Diamond, Line, Square, or Cross. The default is
The front panel
Search key performs a peak search when pressed. A
marker will automatically be activated at the highest peak.
Band Power
A band power measurement using the markers calculates the average
power between two adjustable markers. To make a band power
measurement:
Press the
Press
spectrum signal. Press the
Marker key.
Trace, Spectrum to activate a marker on the instantaneous
Spectrum Avg key to activate a marker on
the average spectrum trace.
Press Function, Band Power.
Two marker lines are activated at the extreme left side of the
horizontal scale. Press Normal and move marker 1 to the desired
place by rotating the
Press
Delta to bring marker 2 to the same place as marker 1.
Move marker 1 to the other desired position by rotating the
RPG knob.
RPG
knob. Band power measures the average power between the two
markers. When the band power markers are active, the results are
shown in the results window as Mean Pwr(BetweenMks). Whenthe
band power function is off the results window reads Mean Pwr
(Entire Trace).
Troubleshooting Hints
Changes made by the user to advanced spectrum settings, particularly
to ADC range settings, can inadvertently result in spectrum
measurements that are invalid and cause error messages to appear.
Care needs to be taken when using advanced features.
Chapter 3 85

Making GSM Measurements
Making the Waveform (Time Domain) Measurement
Making the Waveform (Time Domain)
Measurement
Purpose
The waveform measurement is a generic measurement for viewing
waveforms in the time domain. This measurement is how the
instrument performs the zero span functionality found in traditional
spectrum analyzers. Also available under basic mode waveform
measurements is an I/Q window, which shows the I and Q signal in
parameters of voltage and time. The advantage of having an I/Q view
available while in the waveform measurement is that it allows you to
view complex components of the same signal without changing settings
or measurements.
The waveform measurement can be used to perform general purpose
power measurements to a high degree of accuracy.
Measurement Method
The transmitter tester makes repeated power measurements at a set
frequency, similar to the way a swept-tuned spectrum analyzer makes
zero span measurements. The input analog signal is converted to a
digital signal, which then is processed into a representation of a
waveformmeasurement.Thetransmittertesterreliesonahighratesof
sampling to create an accurate representation of a time domain signal.
Making the Measurement
NOTE The factory default parameters provide a good starting point.You will
likely want to change some of the settings. Press
2), Restore Meas Defaults at any time to return all parameters for the
current measurement to their default settings.
Press
Waveform (Time Domain) the active measurement.
Tochange any of the measurement parameters from the factory default
values, refer to the “Changing the Measurement Setup” section for this
measurement.
Measure, Waveform (Time Domain) to immediately make
Meas Setup, More (1 of
86 Chapter3
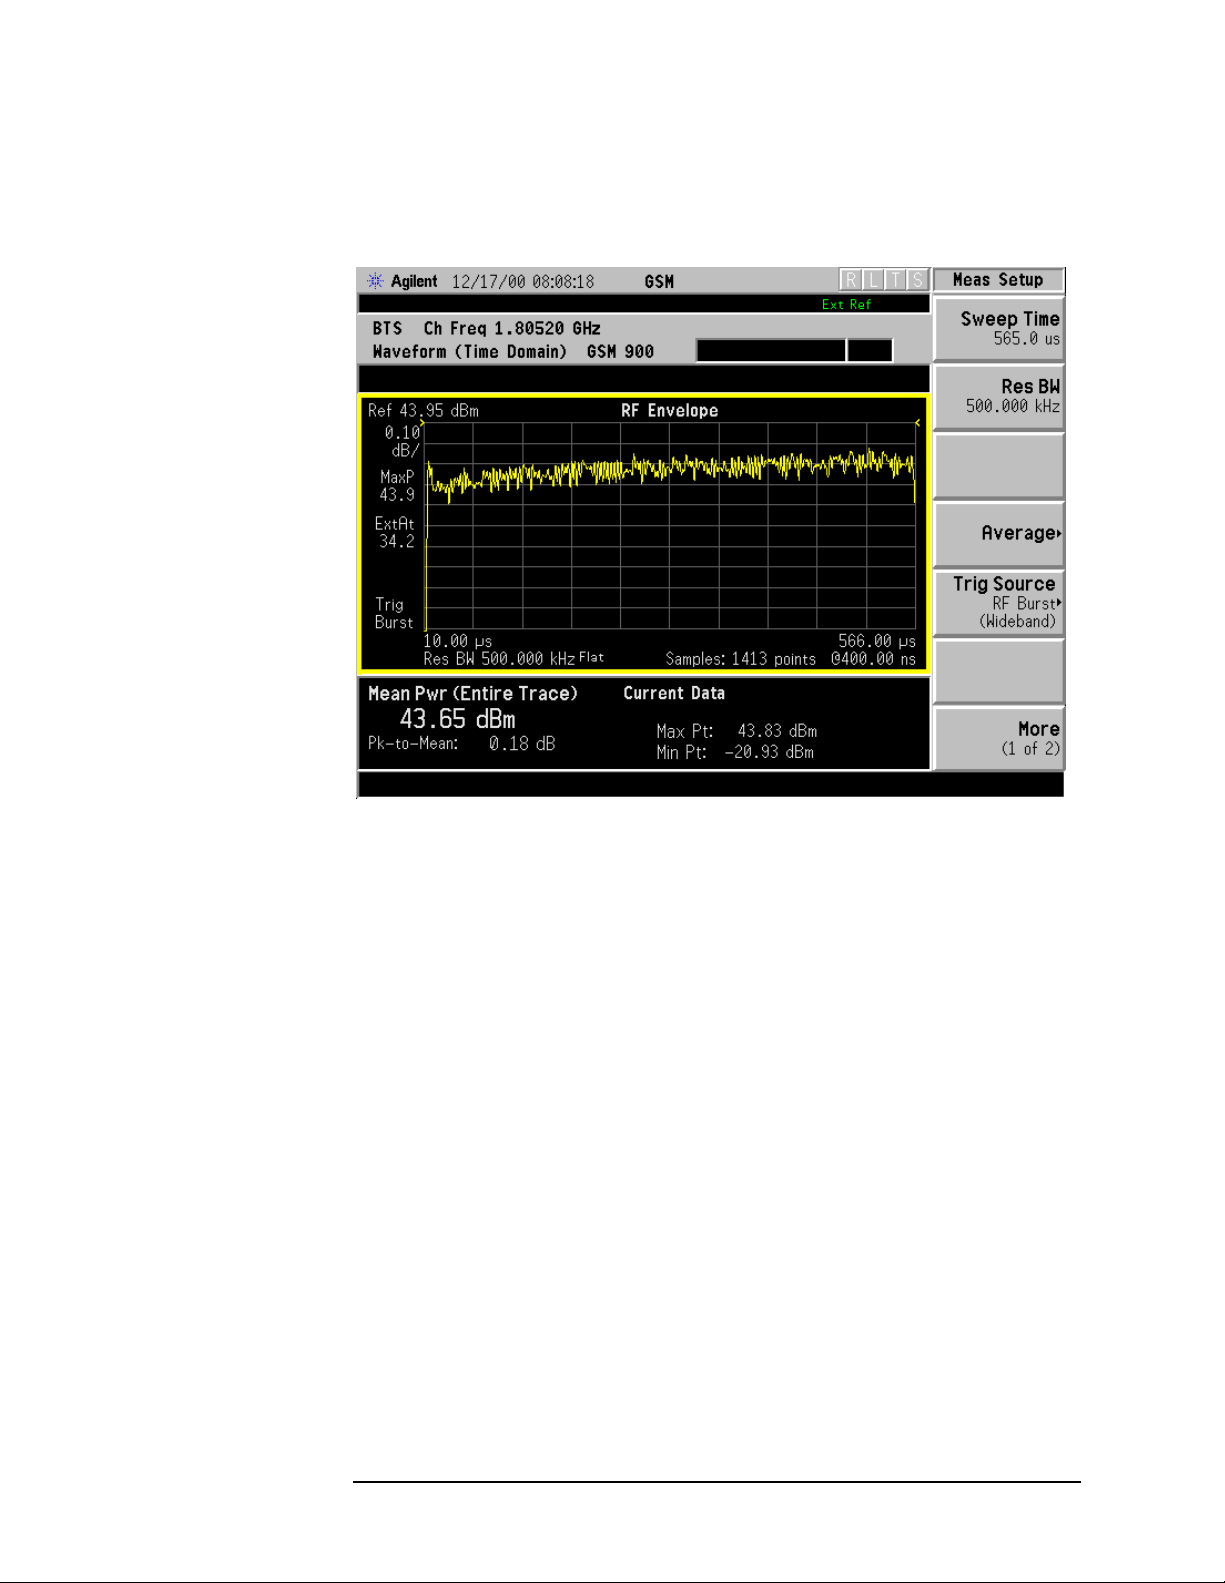
Making GSM Measurements
Making the Waveform (Time Domain) Measurement
Results
Figure 3-13 Waveform Measurement Results- RF Envelope Window
Chapter 3 87

Making GSM Measurements
Making the Waveform (Time Domain) Measurement
Changing the Measurement Setup
Table 2 Waveform (Time Domain) Measurement Defaults
Measurement Parameter Factory Default Condition
View/Trace RF Envelope
Sweep Time 2.000 ms
Res BW 500.000 kHz
Averaging:
Avg Number
Avg Mode
Avg Type
Trigger Source RF Burst
RF Envelope Window:
Amplitude Y Scale
Scale/Div
Reference
10 Off
Exp
Pwr Avg (RMS)
10.00 dB
0.00 dBm (Top)
I/Q Waveform Window:
Amplitude Y Scale
Scale/Div
Reference
Advanced
Pre-ADC BPF Off
RBW Filter Gaussian
ADC Range Auto
Data Packing Auto
ADC Dither Off
Decimation Off
NOTE Parameters that are under the Advanced key seldom need to be
100.0 mv
0.00 V (Ctr)
changed. Any changes from the default values may result in invalid
measurement data.
88 Chapter3

Making GSM Measurements
Making the Waveform (Time Domain) Measurement
Make sure the Waveform (Time Domain) measurement is selected under
the
Measure menu. Press the Meas Setup key to access a menu which
allows you to modify the averaging, and trigger source for this
measurement (as described in the “Measurement Setup” section). In
addition, the following parameters can be modified:
•
Sweep Time - This key allows you to select the measurement
acquisition time. It is used to specify the length of the time capture
record. Values between 10 µs and 50 s can be entered, depending
upon the resolution bandwidth setting.
•
Res BW - This key sets the measurement bandwidth. A larger
bandwidth results in a larger number of acquisition points and
reduces the maximum allowed for sweep time. You can enter values
between 10 Hz. and 7.5 MHz.
•
Advanced menu key. This key accesses the features listed below.
Pre-ADC BPF - This key allows you to toggle the pre-ADC
bandpass filter to On or Off states. The pre-ADC bandpass filter
is useful for rejecting nearby signals, so that sensitivity within
the span range can be improved by increasing the ADC range
gain
RBW Filter - This key toggles to select a flat top or a Gaussian
resolution bandwidth filter. A Gaussian filter provides more even
time domain response, particularly for bursts. A flat top filter
provides a flatter bandwidth but is less accurate for pulse
responses. A flat top filter also requires less memory and allows
longer data acquisition times. For most waveform applications,
the Gaussian filter is recommended, and it is the default filter for
waveform measurements.
ADC Range -.Allows you to access the following selection menu to
define one of the following ADC ranging functions:
•
Auto - This key causes the instrument to automatically adjust
the signal range for optimal measurement results.
•
AutoPeak - This key causes the instrument to continuously
seek the highest peak signal.
•
AutoPeakLock - This key causes the instrument to adjust the
range for the highest peak signal it identifies, and retains the
range settings determined by that peak signal, even when the
peak signal is no longer present.
•
Manual - Allows you to access the selection menu: −6 dB, 0 dB,
+6 dB, +12 dB, +18 dB, +24 dB, to set the ADC range level. Also
note that manual ranging is best for CW signals.
Chapter 3 89

Making GSM Measurements
Making the Waveform (Time Domain) Measurement
Data Packing - Allows you to access the following selection menu to
define one of the following data packing methods:
•
Auto - Data is automatically packed. This is the default setting
and most recommended.
• Short (16 bit) - Data is packed by every 16 bits.
• Medium (24 bit) - Data is packed by every 24 bits.
• Long (32 bit) - Data is packed by every 32 bits.
ADC Dither - Allows you to toggle the ADC dither function
between
On and Off. Activation of the ADC dither results in better
amplitude linearity and resolution in low level signals. However,
it also results in reduced dynamic range. ADC dither is set to Off
by default.
Decimation - Allows you to toggle the decimation function
between
On and Off and to set the decimation value. Decimation
allows longer acquisition times for a given bandwidth by
eliminating data points. Long time captures can be limited by the
transmitter tester data acquisition memory. Decimation numbers
1 to 4 describe the factor by which the number of points are
reduced. A decimation figure of 1, which results in no data point
reduction, is the default.
90 Chapter3

Making GSM Measurements
Making the Waveform (Time Domain) Measurement
Changing the View
The View/Trace menu keys are used to activate a view of a measurement
with preset X and Y scale parameters; this view is called a “window.”
Using the X and Y scale keys, you can then modify these parameters.
You can also activate traces, using the
Traces Display menu key.
Windows Available for Waveform Measurements
RF Envelope window. Select this window if you want to view
power (in dBm) vs. time. Remember that data acquisition will be
affected when you change the sweep time.
I/Q Waveform window. Select this window to view the I and Q signal
characteristics of the current measurement in parameters of voltage
and time.
Using the Markers
The Marker front-panel key accesses the menu to configure the markers.
If you want to use the marker function in the I/Q window, press
View/Trace, I/Q Waveform, Marker, Trace, IQ Waveform.
Select 1 2 3 4 - Allows you to activate up to four markers with the
•
corresponding numbers, respectively. The selected number is
underlined and its function is defined by pressing the
Function key.
The default is 1.
• Normal - Allows you to activate the selected marker to read the
frequency and amplitude of the marker position on the spectrum
trace, for example, which is controlled by the
Delta - Allows you to read the differences in frequencies and
•
RPG knob.
amplitudes between the selected marker and the next.
• Function Off - Allows you to define the selected marker function to be
Band Power, Noise,orOff. The default is Off. If set to Band Power, you
need to select
Trace Spectrum - Allows you to place the selected marker on the
•
Spectrum, Spectrum Avg, or I/Q Waveform trace. The default is
Spectrum.
Off - Allows you to turn off the selected marker.
•
Shape Diamond - Allows you to access the menu to define the selected
•
marker shape to be a
a
Diamond.
Delta.
Diamond, Line, Square, or Cross. The default is
Marker All Off - Allows you to turn off all of the markers.
•
The front panel
Search key performs a peak search when pressed. A
marker will automatically be activated at the highest peak.
Chapter 3 91

Making GSM Measurements
Making the Waveform (Time Domain) Measurement
NOTE In the Waveform measurement, the Mean Pwr (Entire Trace) value
plus the Pk-to-Mean value will sum to equal the current Max Pt. value
as shown in the data window below the RF Envelope display. If you do a
marker peak search (
Search) with averaging turned off, the marker will
find the same maximum point. However, if you turn averaging on, the
Pk-to-Mean value will use the highest peak found for any acquisition
during averaging, while the marker peak will look for the peak of the
display, which is the result of n-averages. This will usually result in
differing values for the maximum point.
Band Power
A band power measurement using the markers calculates the average
power between two adjustable markers. To make a band power
measurement:
Press the
Press Function,
Marker key.
Band Power.
Two marker lines are activated at the extreme left side of the
horizontal scale. Press Normal and move marker 1 to the desired
place by rotating the
Press
Delta to bring marker 2 to the same place as marker 1.
Move marker 1 to the other desired position by rotating the
RPG knob.
RPG
knob. Band power measures the average power between the two
markers. When the band power markers are active, the results are
shown in the results window as Mean Pwr(BetweenMks). Whenthe
band power function is off the results window reads Mean Pwr
(Entire Trace).
Troubleshooting Hints
Changes made by the user to advanced waveform settings can
inadvertently result in measurements that are invalid and cause error
messages to appear. Care needs to be taken when using advanced
features.
92 Chapter3

Making GSM Measurements
Making the Tx Band Spur Measurement
Making the Tx Band Spur Measurement
Purpose
The Tx Band Spur measurement checks that the transmitter does not
transmit undesirable energy into the transmit band. This energy may
cause interference for other users of the GSM system.
Measurement Method
This is a base station only measurement. The transmitter should be set
at its maximum output power on all time slots. This measurement is
performed at RF channels B (bottom), M (middle), and T (top). Refer to
the following table.
Band Tx Band Edge
(MHz)
Low High Freq
P-GSM 935 960 935.200 1 947.600 63 959.800 124
E-GSM 925 960 925.200 975 942.600 38 959.800 124
R-GSM 921 960 921.200 955 940.600 28 959.800 124
DCS 1800 1805 1880 1805.20 512 1842.60 699 1879.80 885
PCS 1900 1930 1990 1930.20 512 1960.00 661 1989.80 810
GSM 450 460.4 467.6 460.600 259 464.000 276 467.400 293
GSM 480 488.8 496.0 489.000 306 492.400 323 495.800 340
GSM 850 869 894 869.200 128 881.600 190 893.800 251
BOTTOM MIDDLE TOP
(MHz)
ARFCN Freq
(MHz)
ARFCN Freq
(MHz)
ARFCN
The transmit band spectrum is measured in several frequency
segments using resolution bandwidths as specified by the standard (see
the list below).
Frequency Offset Resolution
Bandwidth
≥ 1.8 MHz and < 6 MHz
and inside Tx band
≥ 6 MHz
and inside Tx band
Chapter 3 93
30 kHz
100 kHz

Making GSM Measurements
Making the Tx Band Spur Measurement
The mean transmit power is measured first using the
“power-above-threshold” method (see the Transmit Power
measurement for detail), and then used as a reference for the
measurement limit lines if limits are used. The spectrums, which are
below or above the carrier frequency and within the transmit band, are
measured.
For each spectrum segment, the measurement looks for the spectrum
peak closest to the limit and saves the data. The peak of all segments is
reported as the Worst Spur. The amplitude difference from the peak to
the limit line (∆ from Limit), and from the peak to the mean transmit
power (∆ from Carrier) are displayed. The frequency difference from the
peak to the carrier frequency (Offset Freq) is also displayed. If the peak
goes above the limit line, the display will indicate FAIL. If Marker is on,
the active marker is placed at the peak of the displayed segment.
Making the Measurement
NOTE The factory default settings provide a GSM compliant measurement.
For special requirements, you may need to change some of the settings.
Press
return all parameters for the current measurement to their default
settings.
Meas Setup, More (1 of 2), Restore Meas Defaults at any time to
Select the desired transmit band, (P-GSM, E-GSM, R-GSM, GSM 450,
GSM 480, GSM 850, DCS 1800, or PCS 1900), as described in the
section “Changing the Mode Setup” on page 16. Select the desired
ARFCN and center frequency as described in the section “Changing the
Frequency Channel” on page 22.
Press
Measure, Tx Band Spur to immediately make Tx Band Spur the
active measurement.
Tochange any of the measurement parameters from the factory default
values, refer to the “Changing the Measurement Setup” section for this
measurement.
94 Chapter3

Results
Figure 3-14 Tx Band Spur - Lower Segment
Making GSM Measurements
Making the Tx Band Spur Measurement
Changing the Measurement Setup
Table 3-5 Tx Band Spur Measurement Defaults
Measurement Parameter Factory Default Condition
Avg Number 30 On
Avg Mode Repeat
Avg Type Maximum
Meas Type Full
Limit −36 dBm
Chapter 3 95

Making GSM Measurements
Making the Tx Band Spur Measurement
Make sure the Tx Band Spur measurement is selected under the
Measure menu. The Meas Setup key will access a menu which allows you
to modify the averaging for this measurement. The following Tx Band
Spur measurement parameters can be modified:
•
Meas Type - select the measurement type from the following
selections:
Full - In Continuous Measure, it repeatedly does full search of all
segments.
Examine- In Continuous Measure, after doing one full search
across all segments, it parks on the worst segment and
continuously updates that segment.
•
Limit - set the absolute or relative limit. The limit range is from
-200 dBm to 100 dBm.
dBm - Absolute limit
dBc - Relative to Mean Transmit Power.
Changing the View
The View/Trace key will allow you to further examine the desired
spectrum segment. Each of these choices selects a different part of the
frequency spectrum for viewing:
Lower
Segment
Lower Adj
Segment
Upper Adj
Segment
Upper
Segment
lower Tx band edge to -6 MHz offset
from the channel frequency
-6 MHz to -1.8 MHz offset
from the channel frequency
+1.8 MHz to +6 MHz offset
from the channel frequency
+6 MHz offset from the channel frequency to
the upper Tx band edge
Troubleshooting Hints
Almost any fault in the transmitter circuits can manifest itself as
spurious of one kind or another. Make sure the transmit band is
correctly selected and the frequency is either the Bottom, Middle, or
Top channel. The “Unexpected carrier frequency (BMT only)”
message usually indicates the transmit band and/or carrier frequency
is not correct. The “ADC overload -- unexpected carrier
frequency” message usually indicates the channel frequency of the
VSA does not match the carrier frequency of the signal.
96 Chapter3
 Loading...