


W-CDMA Measurement Guide
Agilent Technologies E4406A VSA Series
Transmitter Tester
Manufacturing Part Number: E4406-90088
Printed in USA
April 2000
© Copyright 1999-2000 Agilent Technologies, Inc.

The information contained in this document is subject to change
without notice.
Agilent Technologiesmakesnowarrantyofanykindwithregard to this
material, including but not limited to, the implied warranties of
merchantability and fitness for a particular purpose. Agilent
Technologies shall not be liable for errors contained herein or for
incidental or consequential damages in connection with the furnishing,
performance, or use of this material.
2

1. Understanding W-CDMA
What Is the W-CDMA Communication System? . . . . . . . . . . . . . . . . . . . . . . . . . . . . . . . . . . . . 6
What Does the E4406A VSA Series Transmitter Tester Do? . . . . . . . . . . . . . . . . . . . . . . . . . . 7
Other Sources of Measurement Information . . . . . . . . . . . . . . . . . . . . . . . . . . . . . . . . . . . . . . . 8
Instrument Updates at www.agilent.com/find/vsa/. . . . . . . . . . . . . . . . . . . . . . . . . . . . . . . . . 8
2. Setting Up the W-CDMA Mode
W-CDMA Mode. . . . . . . . . . . . . . . . . . . . . . . . . . . . . . . . . . . . . . . . . . . . . . . . . . . . . . . . . . . . . . 10
How to Make a Measurement. . . . . . . . . . . . . . . . . . . . . . . . . . . . . . . . . . . . . . . . . . . . . . . . . 10
Changing the Mode Setup . . . . . . . . . . . . . . . . . . . . . . . . . . . . . . . . . . . . . . . . . . . . . . . . . . . 12
Changing the Frequency Channel . . . . . . . . . . . . . . . . . . . . . . . . . . . . . . . . . . . . . . . . . . . . . 17
W-CDMA Measurement Key Flow . . . . . . . . . . . . . . . . . . . . . . . . . . . . . . . . . . . . . . . . . . . . . . 18
Installing Optional
Measurement Personalities. . . . . . . . . . . . . . . . . . . . . . . . . . . . . . . . . . . . . . . . . . . . . . . . . . . .35
Available Options . . . . . . . . . . . . . . . . . . . . . . . . . . . . . . . . . . . . . . . . . . . . . . . . . . . . . . . . . . 36
License Key Numbers. . . . . . . . . . . . . . . . . . . . . . . . . . . . . . . . . . . . . . . . . . . . . . . . . . . . . . .36
Installing a License Key Number. . . . . . . . . . . . . . . . . . . . . . . . . . . . . . . . . . . . . . . . . . . . . . 37
Using the Uninstall Key. . . . . . . . . . . . . . . . . . . . . . . . . . . . . . . . . . . . . . . . . . . . . . . . . . . . .38
3. Making W-CDMA Measurements
W-CDMA Measurements . . . . . . . . . . . . . . . . . . . . . . . . . . . . . . . . . . . . . . . . . . . . . . . . . . . . . . 40
Preparing for Measurements. . . . . . . . . . . . . . . . . . . . . . . . . . . . . . . . . . . . . . . . . . . . . . . . . . . 41
Initial Setup. . . . . . . . . . . . . . . . . . . . . . . . . . . . . . . . . . . . . . . . . . . . . . . . . . . . . . . . . . . . . . . 41
Measurement Selection. . . . . . . . . . . . . . . . . . . . . . . . . . . . . . . . . . . . . . . . . . . . . . . . . . . . . .41
Measurement Control. . . . . . . . . . . . . . . . . . . . . . . . . . . . . . . . . . . . . . . . . . . . . . . . . . . . . . .43
Measurement Setup . . . . . . . . . . . . . . . . . . . . . . . . . . . . . . . . . . . . . . . . . . . . . . . . . . . . . . . .43
Making the Channel Power Measurement. . . . . . . . . . . . . . . . . . . . . . . . . . . . . . . . . . . . . . . . 46
Purpose . . . . . . . . . . . . . . . . . . . . . . . . . . . . . . . . . . . . . . . . . . . . . . . . . . . . . . . . . . . . . . . . . . 46
Measurement Method. . . . . . . . . . . . . . . . . . . . . . . . . . . . . . . . . . . . . . . . . . . . . . . . . . . . . . . 46
Making the Measurement . . . . . . . . . . . . . . . . . . . . . . . . . . . . . . . . . . . . . . . . . . . . . . . . . . . 47
Results. . . . . . . . . . . . . . . . . . . . . . . . . . . . . . . . . . . . . . . . . . . . . . . . . . . . . . . . . . . . . . . . . . . 47
Changing the Measurement Setup . . . . . . . . . . . . . . . . . . . . . . . . . . . . . . . . . . . . . . . . . . . . 48
Changing the Display . . . . . . . . . . . . . . . . . . . . . . . . . . . . . . . . . . . . . . . . . . . . . . . . . . . . . . .50
Troubleshooting Hints . . . . . . . . . . . . . . . . . . . . . . . . . . . . . . . . . . . . . . . . . . . . . . . . . . . . . .51
Making the Adjacent Channel Power Ratio (ACPR) Measurement . . . . . . . . . . . . . . . . . . . . 52
Purpose . . . . . . . . . . . . . . . . . . . . . . . . . . . . . . . . . . . . . . . . . . . . . . . . . . . . . . . . . . . . . . . . . . 52
Measurement Method. . . . . . . . . . . . . . . . . . . . . . . . . . . . . . . . . . . . . . . . . . . . . . . . . . . . . . . 52
Making the Measurement . . . . . . . . . . . . . . . . . . . . . . . . . . . . . . . . . . . . . . . . . . . . . . . . . . . 53
Results. . . . . . . . . . . . . . . . . . . . . . . . . . . . . . . . . . . . . . . . . . . . . . . . . . . . . . . . . . . . . . . . . . . 53
Changing the Measurement Setup . . . . . . . . . . . . . . . . . . . . . . . . . . . . . . . . . . . . . . . . . . . . 54
Changing the View . . . . . . . . . . . . . . . . . . . . . . . . . . . . . . . . . . . . . . . . . . . . . . . . . . . . . . . . . 57
Changing the Display . . . . . . . . . . . . . . . . . . . . . . . . . . . . . . . . . . . . . . . . . . . . . . . . . . . . . . .58
Troubleshooting Hints . . . . . . . . . . . . . . . . . . . . . . . . . . . . . . . . . . . . . . . . . . . . . . . . . . . . . .59
Making the Power Stat CCDF Measurement. . . . . . . . . . . . . . . . . . . . . . . . . . . . . . . . . . . . . . 60
Purpose . . . . . . . . . . . . . . . . . . . . . . . . . . . . . . . . . . . . . . . . . . . . . . . . . . . . . . . . . . . . . . . . . . 60
Measurement Method. . . . . . . . . . . . . . . . . . . . . . . . . . . . . . . . . . . . . . . . . . . . . . . . . . . . . . . 60
Making the Measurement . . . . . . . . . . . . . . . . . . . . . . . . . . . . . . . . . . . . . . . . . . . . . . . . . . . 61
Results. . . . . . . . . . . . . . . . . . . . . . . . . . . . . . . . . . . . . . . . . . . . . . . . . . . . . . . . . . . . . . . . . . . 61
Changing the Measurement Setup . . . . . . . . . . . . . . . . . . . . . . . . . . . . . . . . . . . . . . . . . . . . 62
Changing the View . . . . . . . . . . . . . . . . . . . . . . . . . . . . . . . . . . . . . . . . . . . . . . . . . . . . . . . . . 62
Changing the Display . . . . . . . . . . . . . . . . . . . . . . . . . . . . . . . . . . . . . . . . . . . . . . . . . . . . . . .63
Using the Markers . . . . . . . . . . . . . . . . . . . . . . . . . . . . . . . . . . . . . . . . . . . . . . . . . . . . . . . . . 63
Troubleshooting Hints . . . . . . . . . . . . . . . . . . . . . . . . . . . . . . . . . . . . . . . . . . . . . . . . . . . . . .64
Contents
3

Contents
Making the Code Domain Measurement . . . . . . . . . . . . . . . . . . . . . . . . . . . . . . . . . . . . . . . . . .65
Purpose . . . . . . . . . . . . . . . . . . . . . . . . . . . . . . . . . . . . . . . . . . . . . . . . . . . . . . . . . . . . . . . . . .65
Measurement Method . . . . . . . . . . . . . . . . . . . . . . . . . . . . . . . . . . . . . . . . . . . . . . . . . . . . . . .65
Making the Measurement . . . . . . . . . . . . . . . . . . . . . . . . . . . . . . . . . . . . . . . . . . . . . . . . . . . .67
Results . . . . . . . . . . . . . . . . . . . . . . . . . . . . . . . . . . . . . . . . . . . . . . . . . . . . . . . . . . . . . . . . . . .67
Changing the Measurement Setup . . . . . . . . . . . . . . . . . . . . . . . . . . . . . . . . . . . . . . . . . . . . .68
Changing the View. . . . . . . . . . . . . . . . . . . . . . . . . . . . . . . . . . . . . . . . . . . . . . . . . . . . . . . . . .71
Changing the Display. . . . . . . . . . . . . . . . . . . . . . . . . . . . . . . . . . . . . . . . . . . . . . . . . . . . . . . .73
Using the Markers . . . . . . . . . . . . . . . . . . . . . . . . . . . . . . . . . . . . . . . . . . . . . . . . . . . . . . . . . .77
Troubleshooting Hints . . . . . . . . . . . . . . . . . . . . . . . . . . . . . . . . . . . . . . . . . . . . . . . . . . . . . . .78
Making the QPSK EVM Measurement . . . . . . . . . . . . . . . . . . . . . . . . . . . . . . . . . . . . . . . . . . .79
Purpose . . . . . . . . . . . . . . . . . . . . . . . . . . . . . . . . . . . . . . . . . . . . . . . . . . . . . . . . . . . . . . . . . . .79
Measurement Method . . . . . . . . . . . . . . . . . . . . . . . . . . . . . . . . . . . . . . . . . . . . . . . . . . . . . . .79
Making the Measurement . . . . . . . . . . . . . . . . . . . . . . . . . . . . . . . . . . . . . . . . . . . . . . . . . . . .80
Results . . . . . . . . . . . . . . . . . . . . . . . . . . . . . . . . . . . . . . . . . . . . . . . . . . . . . . . . . . . . . . . . . . .80
Changing the Measurement Setup . . . . . . . . . . . . . . . . . . . . . . . . . . . . . . . . . . . . . . . . . . . . .81
Changing the View. . . . . . . . . . . . . . . . . . . . . . . . . . . . . . . . . . . . . . . . . . . . . . . . . . . . . . . . . .82
Changing the Display. . . . . . . . . . . . . . . . . . . . . . . . . . . . . . . . . . . . . . . . . . . . . . . . . . . . . . . .83
Using the Markers . . . . . . . . . . . . . . . . . . . . . . . . . . . . . . . . . . . . . . . . . . . . . . . . . . . . . . . . . .86
Troubleshooting Hints . . . . . . . . . . . . . . . . . . . . . . . . . . . . . . . . . . . . . . . . . . . . . . . . . . . . . . .86
Making the Modulation Accuracy (Rho) Measurement. . . . . . . . . . . . . . . . . . . . . . . . . . . . . . .87
Purpose . . . . . . . . . . . . . . . . . . . . . . . . . . . . . . . . . . . . . . . . . . . . . . . . . . . . . . . . . . . . . . . . . .87
Measurement Method . . . . . . . . . . . . . . . . . . . . . . . . . . . . . . . . . . . . . . . . . . . . . . . . . . . . . . .87
Making the Measurement . . . . . . . . . . . . . . . . . . . . . . . . . . . . . . . . . . . . . . . . . . . . . . . . . . . .88
Results . . . . . . . . . . . . . . . . . . . . . . . . . . . . . . . . . . . . . . . . . . . . . . . . . . . . . . . . . . . . . . . . . . .88
Changing the Measurement Setup . . . . . . . . . . . . . . . . . . . . . . . . . . . . . . . . . . . . . . . . . . . . .89
Changing the View. . . . . . . . . . . . . . . . . . . . . . . . . . . . . . . . . . . . . . . . . . . . . . . . . . . . . . . . . .90
Changing the Display. . . . . . . . . . . . . . . . . . . . . . . . . . . . . . . . . . . . . . . . . . . . . . . . . . . . . . . .91
Using the Markers . . . . . . . . . . . . . . . . . . . . . . . . . . . . . . . . . . . . . . . . . . . . . . . . . . . . . . . . . .94
Troubleshooting Hints . . . . . . . . . . . . . . . . . . . . . . . . . . . . . . . . . . . . . . . . . . . . . . . . . . . . . . .94
Making the Spectrum (Frequency Domain) Measurement. . . . . . . . . . . . . . . . . . . . . . . . . . . .95
Purpose . . . . . . . . . . . . . . . . . . . . . . . . . . . . . . . . . . . . . . . . . . . . . . . . . . . . . . . . . . . . . . . . . .95
Measurement Method . . . . . . . . . . . . . . . . . . . . . . . . . . . . . . . . . . . . . . . . . . . . . . . . . . . . . . .95
Making the Measurement . . . . . . . . . . . . . . . . . . . . . . . . . . . . . . . . . . . . . . . . . . . . . . . . . . . .95
Results . . . . . . . . . . . . . . . . . . . . . . . . . . . . . . . . . . . . . . . . . . . . . . . . . . . . . . . . . . . . . . . . . . .96
Changing the Measurement Setup . . . . . . . . . . . . . . . . . . . . . . . . . . . . . . . . . . . . . . . . . . . . .97
Changing the View . . . . . . . . . . . . . . . . . . . . . . . . . . . . . . . . . . . . . . . . . . . . . . . . . . . . . . . .101
Using the Markers . . . . . . . . . . . . . . . . . . . . . . . . . . . . . . . . . . . . . . . . . . . . . . . . . . . . . . . . .101
Troubleshooting Hints . . . . . . . . . . . . . . . . . . . . . . . . . . . . . . . . . . . . . . . . . . . . . . . . . . . . . .102
Making the Waveform (Time Domain) Measurement . . . . . . . . . . . . . . . . . . . . . . . . . . . . . . .103
Purpose . . . . . . . . . . . . . . . . . . . . . . . . . . . . . . . . . . . . . . . . . . . . . . . . . . . . . . . . . . . . . . . . .103
Measurement Method . . . . . . . . . . . . . . . . . . . . . . . . . . . . . . . . . . . . . . . . . . . . . . . . . . . . . .103
Making the Measurement . . . . . . . . . . . . . . . . . . . . . . . . . . . . . . . . . . . . . . . . . . . . . . . . . . .104
Results . . . . . . . . . . . . . . . . . . . . . . . . . . . . . . . . . . . . . . . . . . . . . . . . . . . . . . . . . . . . . . . . . .104
Changing the Measurement Setup . . . . . . . . . . . . . . . . . . . . . . . . . . . . . . . . . . . . . . . . . . . .105
Changing the View . . . . . . . . . . . . . . . . . . . . . . . . . . . . . . . . . . . . . . . . . . . . . . . . . . . . . . . .107
Using the Markers . . . . . . . . . . . . . . . . . . . . . . . . . . . . . . . . . . . . . . . . . . . . . . . . . . . . . . . . .108
Troubleshooting Hints . . . . . . . . . . . . . . . . . . . . . . . . . . . . . . . . . . . . . . . . . . . . . . . . . . . . . .108
4

1 Understanding W-CDMA
5

Understanding W-CDMA
What Is the W-CDMA Communication System?
What Is the W-CDMA Communication System?
Wideband code division multiple access (W-CDMA) is one of the popular
air interface technologies for the third generation RF cellular
communications systems. In this system, the cells operate
asynchronously, hence it makes the mobile synchronization more
complex, but offers the advantage of flexibility in placement of the base
stations. Both reverse and forward transmitter power controls are
implemented with 0.625 ms intervals. W-CDMA is a direct sequence
spread-spectrum digital communications techniquethatsupportswider
RF bandwidths, typically from 5 to 20 MHz. The main advantages of
W-CDMA over other types of communication schemes are:
• greater capacity
• immunity to signal loss and degradation in the presence of
high-level broadband interference
• immunity to signal loss and degradation due to multipath,
scattering, and fading
• power consumption of mobile stations is strictly minimized by both
base station and mobile controls
• supports variable data rates up to 144 kbits/second for mobile
(vehicular) data rate,up to 384 kbits/second for portable (pedestrian)
data rate, and up to 2 Mbits/second for fixed installations
• provides increased security
W-CDMA uses correlative codes to distinguish one user from another.
Frequency division is still used, as is done with Frequency Division
Multiple Access (FDMA) and Time Division Multiple Access (TDMA),
but in a much larger bandwidth such as 5 MHz or greater. An initial
baseband data rate is spread to a transmitted bit rate of 4.096 Mcps,
which is also called chip rate or spread data rate. W-CDMA realizes
increased capacity from 1:1 frequency reuse and sectored cells. The
capacity limit is soft. That is, capacity can be increased with some
degradation of the error rate or voice quality.
In W-CDMA, a single user's channel consists of a specific frequency
combined with a unique code. Correlative codes allow each user to
operate in the presence of substantial interference. The interference is
the sum of all other users on the same W-CDMA frequency, both from
within and outside of the home cell, and from delayed versions of these
signals. It also includes the usual thermal noise and atmospheric
disturbances. Delayed signals caused by multipath are separately
received and combined in W-CDMA. One of the major differences in
access is that any W-CDMA frequency can be used in all sectors of all
cells.This is possible because W-CDMA is designed to decode the proper
signal in the presence of high interference.
6 Chapter1

Understanding W-CDMA
What Does the Agilent Technologies E4406A VSA Series Transmitter Tester
Do?
What Does the Agilent Technologies E4406A VSA Series Transmitter Tester Do?
This instrument can help determine if a W-CDMA transmitter is
working correctly. When configured for W-CDMA, the instrument can
be used for the testing of a W-CDMA transmitter, according to
documents such as ARIB 1.0-1.2, Trial 1998 (the trial W-CDMA system
originated in Japan), and 3GPP (3rd Generation Partnership Project).
These documents define complex, multi-part measurements used to
maintain an interference-free environment. For example, the
documents include measuring the power of a carrier.
The E4406A Transmitter Tester automatically makes these
measurements using the measurement methods and limits defined in
the documents. The detailed results displayed by the measurements
allow you to analyze W-CDMA system performance. You may alter the
measurement parameters for specialized analysis.
For infrastructure test, the instrument will test base station
transmitters in a non-interfering manner by means of a coupler or
power splitter.
This instrument makes the following measurements:
• Channel Power
• Adjacent Channel Power Ratio (ACPR)
• Power Statistics CCDF
• Code Domain
• QPSK EVM
• Modulation Accuracy (Rho)
• Spectrum (Frequency Domain)
• Waveform (Time Domain)
Chapter 1 7

Understanding W-CDMA
Other Sources of Measurement Information
Other Sources of Measurement Information
Additional measurement application information is available through
your local Agilent Technologies sales and service office. The following
application notes treat digital communications measurements in much
greater detail than discussed in this measurement guide.
• Application Note 1298
Digital Modulation in Communications Systems - An Introduction
part number 5965-7160E
• Application Note 1311
Understanding CDMA Measurements for Base Stations and Their
Components
part number 5968-0953E
Instrument Updates at www.agilent.com/find/vsa/
This web location can be used to access the latest information about the
transmitter tester.
8 Chapter1

2 Setting Up the W-CDMA Mode
9

Setting Up the W-CDMA Mode
W-CDMA Mode
W-CDMA Mode
You may want to install a new personality, reinstall a personality that
you have previously uninstalled, or uninstall a personality. Instructions
for installing and uninstalling personality options are under “Installing
Optional Measurement Personalities” on page 35.
At initial power up, the transmitter tester will come up in the Basic
mode, with the Spectrum (frequency domain) measurement selected
and the
Measure menu displayed.
To access the W-CDMA measurement personality, press the
and select the
W-CDMA key.
If you want to set the W-CDMA mode to a known, factory default state,
press Preset. This will preset the mode setup and all of the
measurements to the factory default parameters.
NOTE Pressing the Preset key does not switch instrument modes.
How to Make a Measurement
Follow the three-step procedure shown in the table below:
Step Primary Key Setup Key Related Key
1. Select & setup
a mode.
2. Select & setup
a measurement.
3. Select & setup
a view.
Mode Mode Setup, Input,
Frequency Channel
Measure Meas Setup Meas Control,
View/Trace Span X Scale,
Amplitude Y Scale,
Display, Next Window,
Zoom
System
Restart
File, Save,
Print, Print Setup,
Marker, Search
Mode key
Step 1. Select & setup a mode as follows, for example:
• Press the
• Press the
Mode key and select W-CDMA.
Frequency Channel key and enter the channel frequency to
be measured.
• Press the
Mode Setup key and change the Radio, Input, and Trigger
conditions from those default settings.
Refer to “Changing the Mode Setup” on page 12 and “Changing the
Frequency Channel” on page 17 for further explanation.
10 Chapter2

Setting Up the W-CDMA Mode
Refer to “Mode Setup / Frequency Channel Key Flow” on page 19 for the
key flow diagrams.
Step 2. Select & setup a measurement as follows, for example:
• Press the Measure key to select either Channel Power, ACPR, Power
Stat CCDF, Code Domain, Spectrum (Freq Domain), Waveform (Time
Domain), QPSK EVM, or Mod Accuracy (Perch Only) to make its
measurement.
W-CDMA Mode
• Press the
Meas Setup key to change any of the measurement
parameters from the default settings. These parameters such as
Span, Resolution Bandwidth, Trigger Source, Average, Limit Test
and Limits, are decided according to the measurement selected.
Refer to “Channel Power Measurement Key Flow” on page 20 and to
“Waveform (Time Domain) Measurement Key Flow (1 of 2)” on page 33
for the key flow diagrams.
Step 3. Select & setup a view as follows, for example:
• Press the
View/Trace key to select the desired view for the current
measurement.
• Press the
Next Window key to select a window, then press the Zoom
key to expand the window to the full display area.
• Press the
Span X Scale, Amplitude Y Scale, Display, and/or Marker keys
for your desired display. These keys are not always availablefor each
view.
Refer to “Channel Power Measurement Key Flow” on page 20 and to
“Waveform (Time Domain) Measurement Key Flow (1 of 2)” on page 33
for the key flow diagrams.
Entering a Numeric Value
Three methods are available to enter a numeric value for an active
softkey, however, its resolution can be different depending on the
method selected and the range, if any. The highest resolutions are
described throughout this guide.
•
Numeric keys - Allows you to enter a value with the highest
resolution by pressing the numeric keys. The entry is terminated by
pressing the
Enter key or one of the unit softkeys shown.
• RPG knob - Allows you to continuously change the value shown on
the softkey with the medium or highest resolution defined to the
parameter by rotating this knob.
• Step (Up/Down arrow) keys - Allows you to change the value shown on
the softkey with the fixed-step resolution defined to the parameter
activated. While the ⇑ (up arrow) key is pressed down, for example,
the value increases in multiple steps defined to the parameter.
Chapter 2 11

Setting Up the W-CDMA Mode
W-CDMA Mode
Changing the Mode Setup
Numerous settings can be changed at the mode level by pressing the
Mode Setup key. This will access the menu with the selections listed
below. The factory default settings are shown in tables. These settings
affect only the measurements in the W-CDMA mode.
Configuring the Radio Setting
The
Radio key accesses the menu as follows:
Device - Allows you to toggle the test device between BTS (Base
•
Transmission Station) and
MS-BTS Offset - Allows you to specify the frequency space between
•
MS and BTS. The range is −500.000 MHz to 500.000 MHz with
1 kHz resolution.
•
Standard - Allows you to access the menu to select one of the
standards as follows:
ARIB 1.0-1.2 - Allows you to make measurements compliant to the
ARIB 1.0-1.2 document submitted to 3GPP.
MS (Mobile Station).
3GPP - Allows you to make measurements compliant to the
evolving third generation partnership project document.
Trial 1998 - Allows you to make measurements compliant to the
W-CDMA trial system that originated in Japan.
Radio Default Settings
Device BTS
MS-BTS Offset 190.000 MHz
Standard Trial 1998
Configuring the Input Setting
The
Input key accesses the menu as follows: (You can also access this
menu from the
RF Input Range - Allows you to toggle the RF input range control
•
between
Input front-panel key.)
Auto and Man (manual). If Auto is chosen, the instrument
automatically sets the attenuator based on the carrier power level,
where it is tuned. Once you change the
Max Total Pwr or Input Atten
value with the RPG knob, for example, the RF Input Range key is
automatically set to
Man. If there are multiple carriers present, the
total power might overdrive the front end. In this case you need to
set the
power by activating the
RF Input Range to Man and enter the expected maximum total
Max Total Pwr key. Man is also useful to hold
the input attenuation constant for the best relative power accuracy.
For single carriers it is generally recommended to set this to
Auto.
12 Chapter2

Setting Up the W-CDMA Mode
W-CDMA Mode
• Max TotalPwr - Allows you to set the maximum total power level from
the UUT (Unit Under Test). The range is −200.00 to 100.00 dBm
with 0.01 dB resolution. This is the expected maximum value of the
mean carrier power referenced to the output of the UUT; it may
include multiple carriers. The
together with the
the
Max Total Pwr value with the RPG knob, for example, the RF Input
Range key is automatically set to Man.
Input Atten - Allows you to control the internal input attenuator
•
Input Atten and Ext Atten settings. Once you change
setting. The range is 0 to 40 dB with 1 dB resolution. The
Max Total Pwr setting is coupled
Input Atten
key reads out the actual hardware value that is used for the current
measurement. If more than one input attenuator value is used in a
single measurement, the value used at the carrier frequency will be
displayed. The
Input Atten setting is coupled to the Max Total Pwr
setting. Once you change the Input Atten setting with the RPG knob,
for example, the
Ext Atten - Allows you to access the following menu to enter the
•
external attenuation values. Either of the
coupled together with the
Ext Atten does not switch the RF Input Range key to Man. This will
RF Input Range key is automatically set to Man.
Ext Atten settings is
RF Input Range setting, however, pressing
allow the instrument to display the measurement results referenced
to the output of the UUT.
MS - Allows you to set an external attenuation value for MS tests.
The range is −50.00 to +50.00 dB with 0.01 dB resolution.
BTS - Allows you to set an external attenuation value for BTS
tests. The range is −50.00 to +50.00 dB with 0.01 dB resolution.
Input Default Settings
RF Input Range
Max Total Pwr
Input Atten
Ext Atten:
MS
BTS
a
Auto
−15.00 dBm
0.00 dB
0.00 dB
0.00 dB
b
b
a. Auto is not used for Spectrum measurements.
b. This may differ if the maximum input power is
more than −15.00 dBm, or depending on the
previous measurements.
Chapter 2 13

Setting Up the W-CDMA Mode
W-CDMA Mode
NOTE The Max Total Pwr and the Input Atten settings are coupled together.
When you switch to a different measurement, the
is kept constant, but the
Input Atten setting may change if the two
Max Total Pwr setting
measurements have different mixer margins.Thus,you can directly set
the transmitter tester input attenuator, or you can set it indirectly by
specifying the expected maximum power at the UUT (Max Total Pwr
setting).
Configuring the Trigger Condition
Trigger key allows you: (1) to access the trigger selection menu to
The
specify each triggering condition, (2) to modify the default trigger
holdoff time using the
Trig Holdoff key, (3) to modify the auto trigger
time and to activate or deactivate the auto trigger feature using the
Auto Trig key, and (4) to modify the period of the frame timer using the
Frame Timer key.
NOTE The actual trigger source is selected separately for each measurement
under the Meas Setup key.
•
RF Burst, Video (IF Envlp), Ext Front and Ext Rear - Pressing one of
these trigger keys will access each triggering condition setup menu.
This menu is used to specify the
Delay, Level and Slope settings for
each trigger source as follows:
Delay - Allows you to enter a numerical value to modify the
trigger delay time. The range is −100.0 to +500.0 ms with 1 µs
resolution. For trigger delay use a positive value, and for
pre-trigger use a negative value.
Level - Allows you to enter a numerical value to adjust the trigger
level depending on the trigger source selected.
For
RF Burst selection, the key label reads as Peak Level. The
RF level range is −25.00 to 0.00 dB with 0.01 dB resolution,
relative to the peak RF signal level. The realistic range can be
down to −20 dB.
For
Video (IF Envlp) selection, the video level range is −200.00
to +50.00 dBm with 0.01 dB resolution at the RF input. The
realistic range can be down to around −50 dBm depending on
the noise floor level of the input signal.
For
Ext Front or Ext Rear selection, the level range is −5.00 to
+5.00 V with 1 or 10 mV resolution.
Slope - Allows you to toggle the trigger slope between Pos at the
positive-going edge and
Neg at the negative-going edge of the
burst signal.
There are other keys under the Trigger key as follows:
14 Chapter2

Setting Up the W-CDMA Mode
W-CDMA Mode
• Trig Holdoff - Allows you to set the period of time before the next
trigger can occur. The range is 0.000 µs to 500.0 ms with 1 µs
resolution.
•
Auto Trig - Allows you to specify a time for a trigger timeout and
toggle the auto trigger function between
On and Off. The range is
1.000 ms to 1.000 ks with 1 µs resolution. If no trigger occurs by the
specified time, a trigger is automatically generated.
•
Frame Timer - Allows you to access the menu to manually control the
frame timer:
Period - Allows you to set the period of the frame clock. The range
is 0.000 ns to 559.0000 ms with 1 ps resolution.
Offset - Allows you to set the offset of the frame clock. The range
is 0.000 to 10.00 s with 100 ns resolution over 1.000 µs range.
Reset Offset Display - Allows you to display without any offset of
the frame clock.
Sync Source - Allows you to access the menu to select one of the
sources to be synchronized with.
Off - Allows you to turn the synchronizing source off for
asynchronous tests.
RF Burst (Wideband) - Allows you to select the RF burst signal
as the synchronizing source.
Ext Front - Allows you to select the external input signal from
the front-panel input port as the synchronizing source.
Ext Rear - Allows you to select the external input signal from
the rear panel input port as the synchronizing source.
Chapter 2 15

Setting Up the W-CDMA Mode
W-CDMA Mode
Trigger Default Settings
RF Burst:
Delay
Peak Level
Slope
Video (IF Envlp):
Delay
Level
Slope
Ext Front:
Delay
Level
Slope
Ext Rear:
Delay
Level
Slope
0.000 µs
−6.00 dB
Pos
0.000 µs
−6.00 dBm
Pos
0.000 µs
2.00 V
Pos
0.000 µs
2.00 V
Pos
Trig Holdoff 0.000 ms
Auto Trig 100.0 ms, On
Frame Timer:
Period
Offset
Sync Source
10.00000 ms
0.000 ms
Off
16 Chapter2

Setting Up the W-CDMA Mode
W-CDMA Mode
Changing the Frequency Channel
After selecting the desired mode setup, you will need to select the
desired center frequency and the center frequency step. The selections
made here will apply to all measurements in the mode. Press the
Frequency Channel key to access the following menu:
Center Freq - Allows you to enter a frequency that corresponds to the
•
desired RF channel to be measured. This is the current instrument
center frequency. The range is 1.000 kHz to 4.32140 GHz with 1 Hz
resolution.
•
CF Step - Allows you to enter a center frequency step to shift the
measurement segment, and to toggle the step function between
and Man. If set to Auto, the CF Step value automatically changes
according to the selection of the standard. The range is 1.000 kHz to
1.00000 GHz with 1 Hz resolution.
Frequency Channel Default Settings
Frequency Channel:
Center Freq
CF Step
1.00000 GHz
5.00000 MHz, Auto
Auto
Chapter 2 17

Setting Up the W-CDMA Mode
W-CDMA Measurement Key Flow
W-CDMA Measurement Key Flow
The key flow diagrams, shown in a hierarchical manner on the
following pages, will help grasp the overall functional relationships for
the front-panel keys and the softkeys displayed at the extreme right
side of the screen. The diagrams are:
“Mode Setup / Frequency Channel Key Flow” on page 19,
“Channel Power Measurement Key Flow” on page 20,
“ACPR Measurement Key Flow” on page 21,
“Power Stat CCDF Measurement Key Flow” on page 22
“Code Domain Measurement Key Flow (1 of 3)” on page 23
“QPSK EVM Measurement Key Flow (1 of 2)” on page 26
“Modulation Accuracy Measurement Key Flow (1 of 2)” on page 28
View/Trace
QPSK EVM
<for EVM>
Avg Number 10 On|Off
“Spectrum (Freq Domain) Measurement Key Flow (1 of 3)” on page
30
“Waveform (Time Domain) Measurement Key Flow (1 of 2)” on page
33
Use these flow diagrams as follows:
• There are some basic conventions:
An oval represents one of the front-panel keys.
This box represents one of the softkeys displayed.
This represents an explanatory description on its specific key.
This box shows how the softkey default condition is displayed.
Default parameters or values are underlined wherever possible.
• Start from the extreme upper left corner of each measurement
diagram to the right direction, and go from the top to the bottom.
• When defining a key from auto with underline to manual, for
example, just press that key one time.
• When entering a numeric value of
Frequency, for example, use the
numeric keypad by terminating with the appropriate unit selection
from the softkeys displayed.
• When entering a numeric value of
numeric keypad by terminating with the
Avg Number, for example, use the
Enter front-panel key.
• Instead of using the numeric keypad to enter a value, it may be
easier to use the RPG knob or Up/Down keys depending on the input
field of a parameter.
18 Chapter2

Setting Up the W-CDMA Mode
W-CDMA Measurement Key Flow
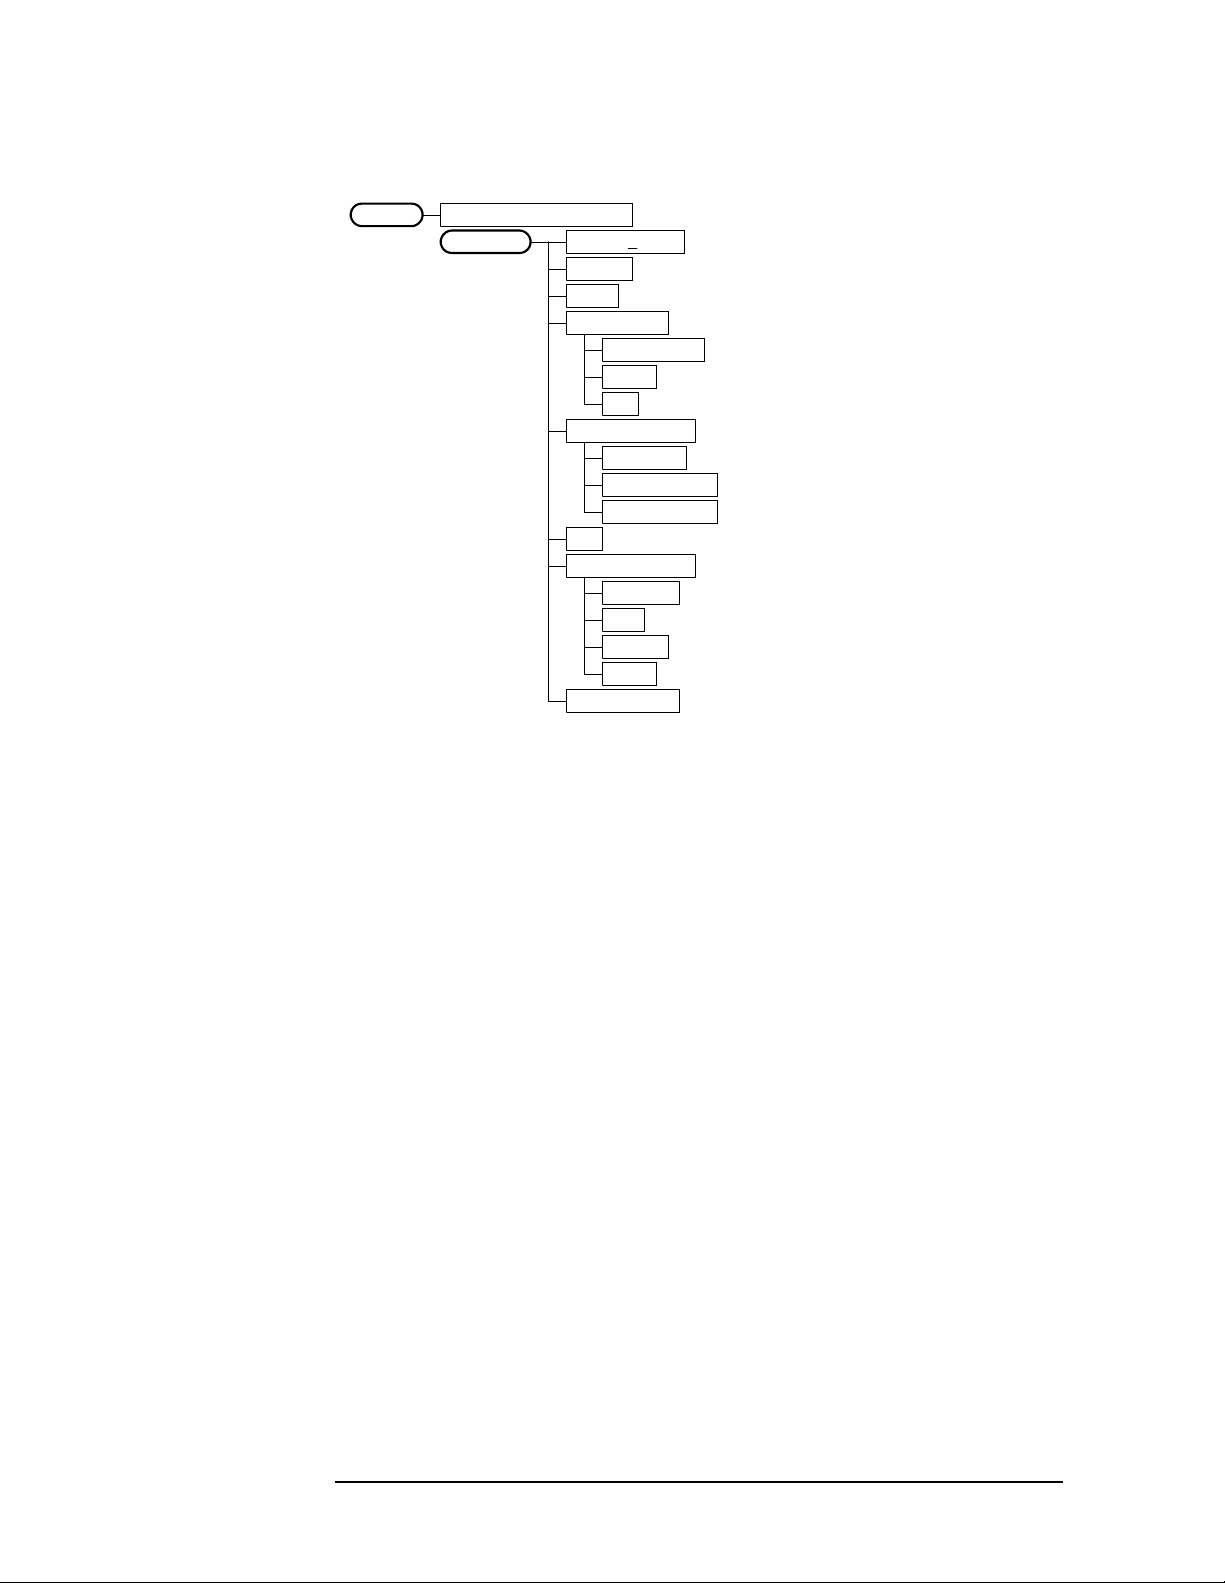
Figure 2-1 Mode Setup / Frequency Channel Key Flow
W-CDMAMode
Mode Setup
Radio
Device BTS|MS
MS-BTS Offset 190.000 MHz
Standard Trial 1998
ARIB 1.0-1.2
3GPP
Trial 1998
Input
RF Input Range Auto|Man
Max Total Pwr -15.00 dBm
Input Atten 0.00 dB
Ext Atten
MS 0.00 dB
BTS 0.00 dB
Trigger
RF Burst
Delay 0.000 us
Peak Level -6.00 dB
Slope Pos|Neg
Video (IF Envlp)
Delay 0.000 us
Level -6.00 dBm
Slope Pos|Neg
Ext Front
Delay 0.000 us
Level 2.00 V
Slope Pos|Neg
Ext Rear
Delay 0.000 us
Level 2.00 V
Slope Pos|Neg
Trig Holdoff 0.000 ms
Auto Trig 100.0 ms On|Off
Frame Timer
Period 10.00000 ms
Offset 0.000 ms
Reset Offset Display
Sync Source
Off
RF Burst (Wideband)
Ext Front
Ext Rear
<Auto not for Spectrum>
Frequency Channel
Center Freq 1.00000 GHz
CF Step 5.00000 MHz Auto|Man
<wcd_mode.vsd>
Chapter 2 19

Setting Up the W-CDMA Mode
W-CDMA Measurement Key Flow
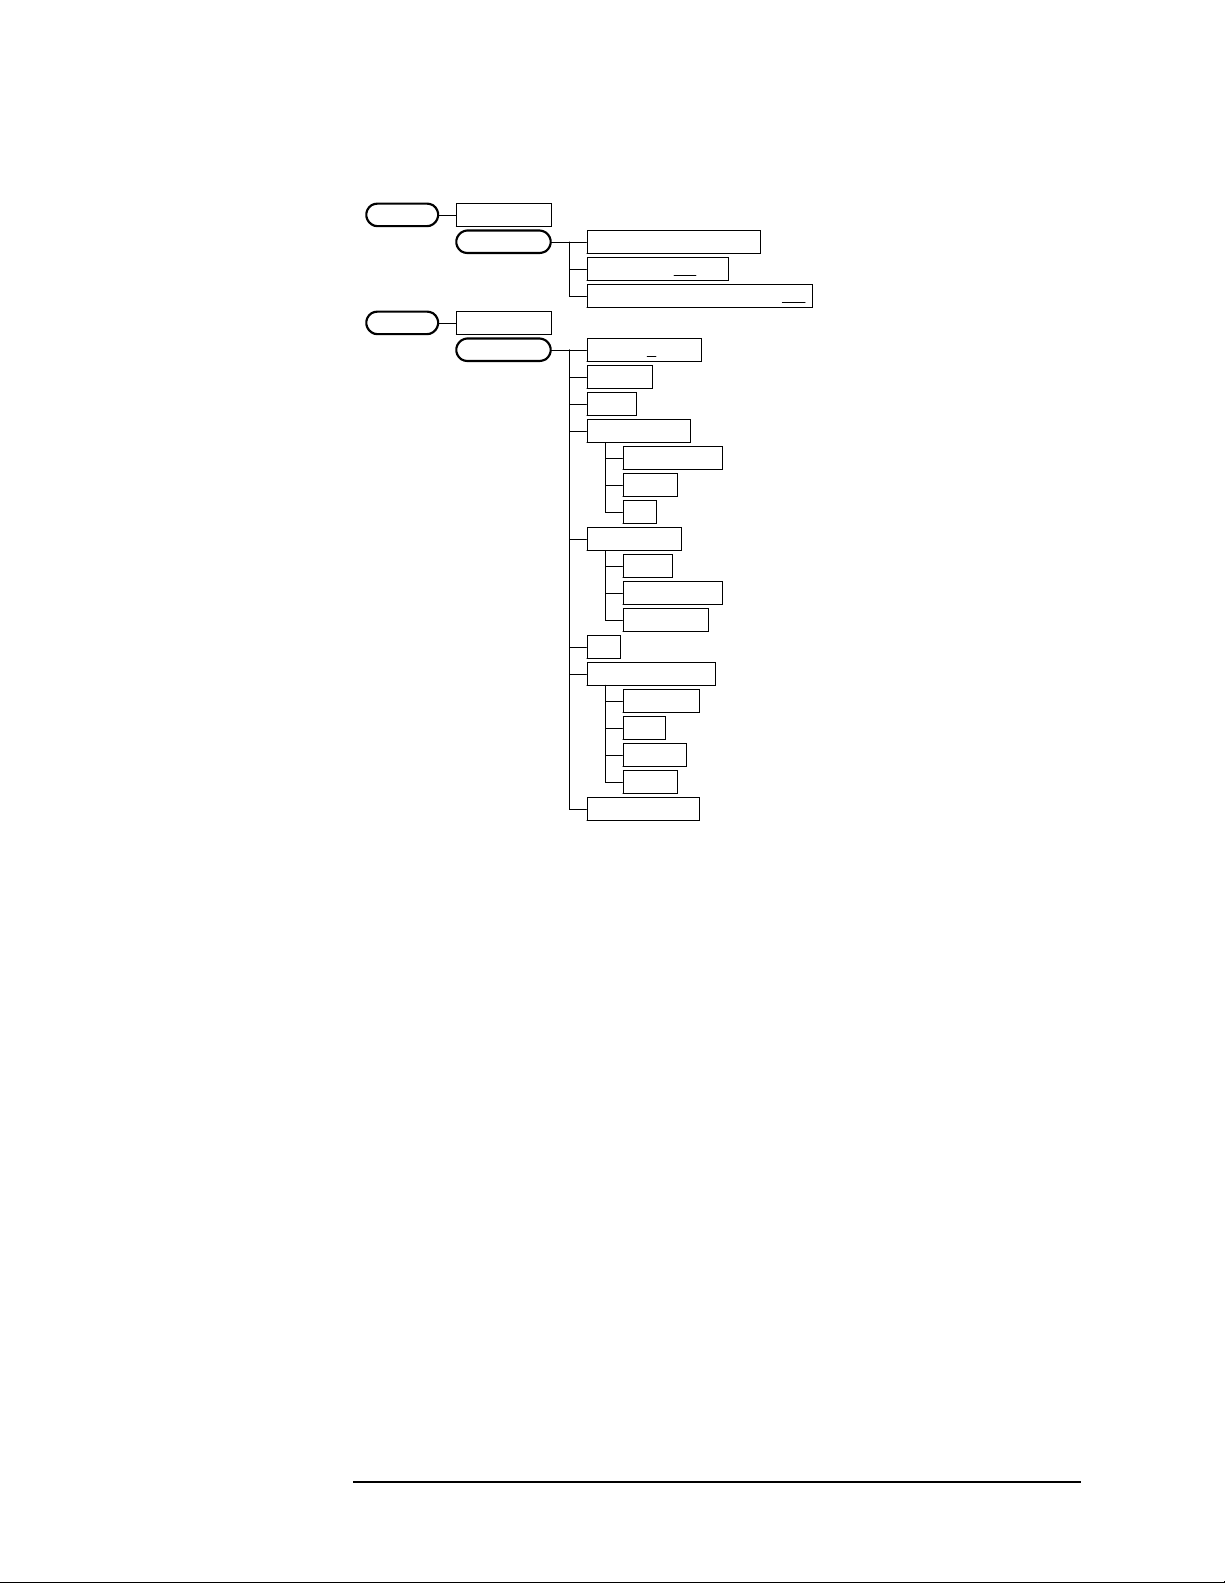
Figure 2-2 Channel Power Measurement Key Flow
Measure
Channel Power
Meas Setup
Channel PowerMeasure
Amplitude Y Scale
Avg Number 10 On|Off
Avg ModeExp| Repeat
Integ BW 5.00000 MHz
Chan Power Span 6.00000 MHz
Restore Meas Defaults
Advanced
Sweep Time 17.07 us Auto |Man
Data Points 512 Auto|Man
Res BW 111.429 kHz
Trig Source Free Run (Immediate)
Free Run (Immediate)
Ext Front
Ext Rear
Scale/Div 10.00 dB
Ref Value 10.00 dBm
Ref Position Top |Ctr|Bot
Scale CouplingOn|Off
<information only>
<wcd_chpj.vsd>
20 Chapter2
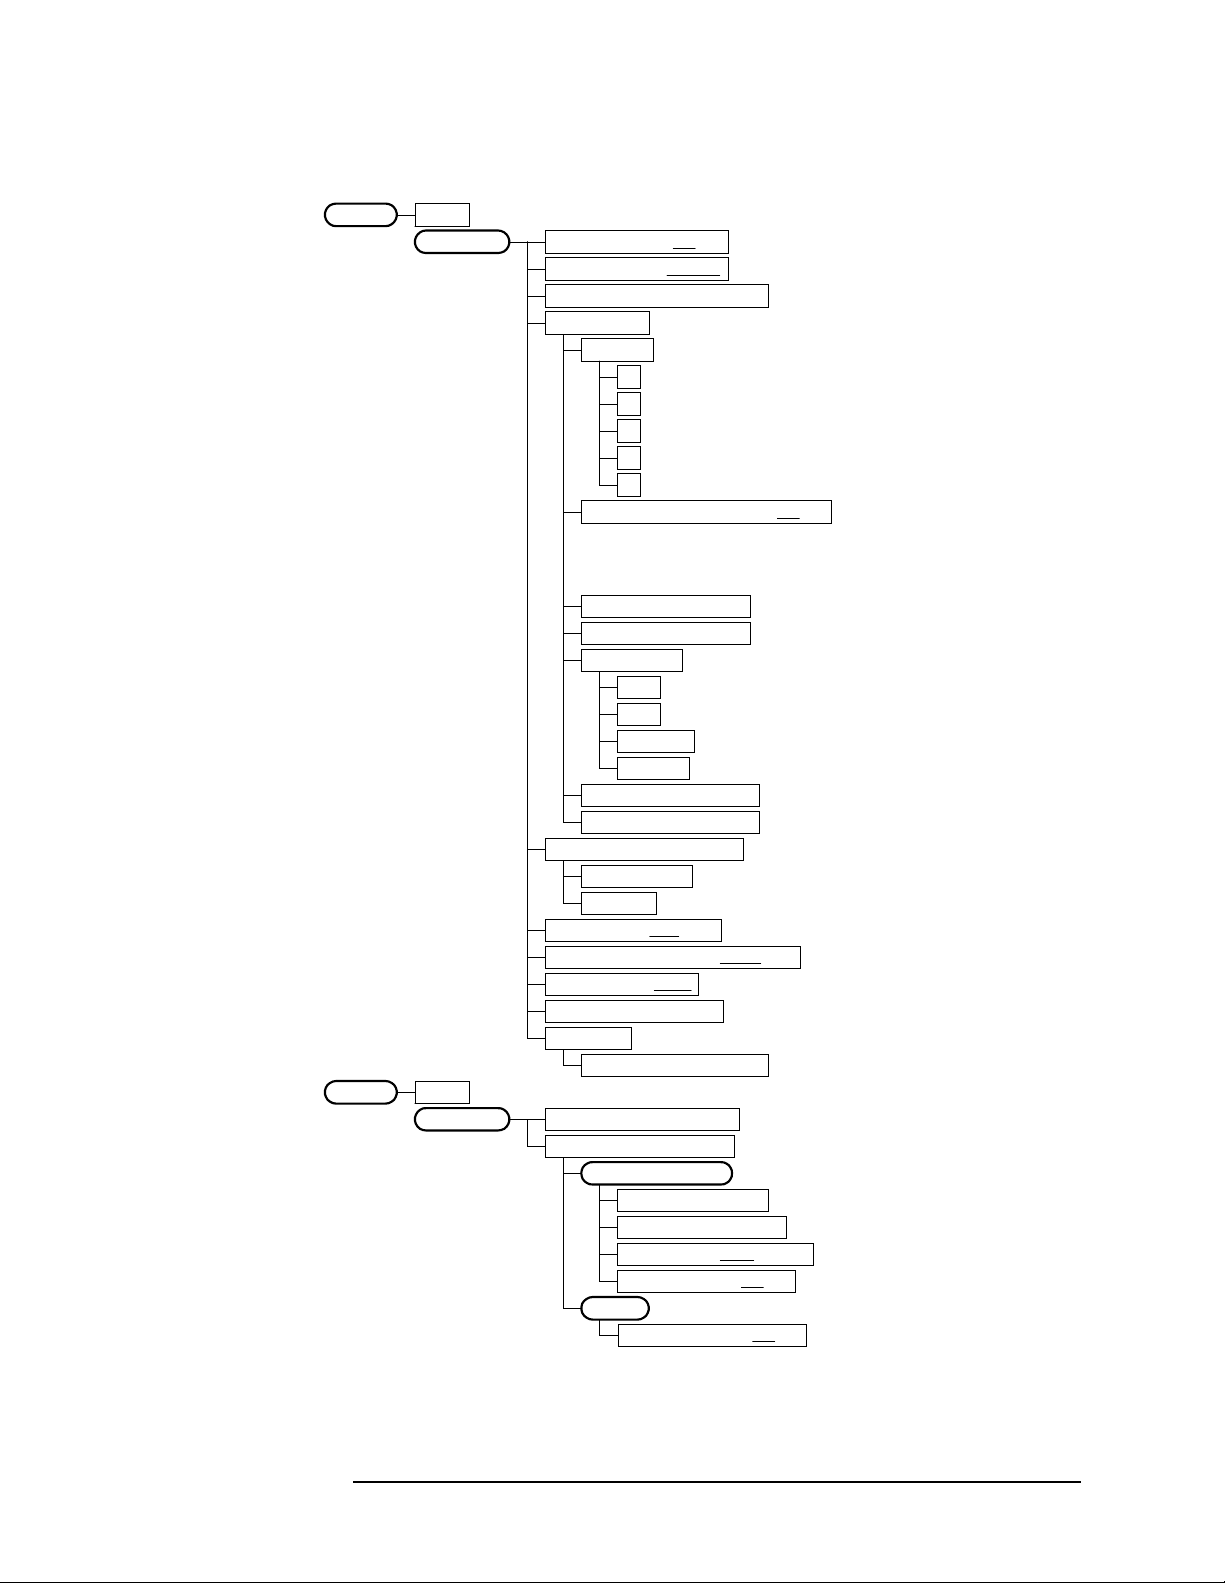
Figure 2-3 ACPR Measurement Key Flow
Setting Up the W-CDMA Mode
W-CDMA Measurement Key Flow
Measure
ACPR
Meas Setup
ACPRMeasure
View/Trace
Avg Number 10 On|Off
Avg ModeExp| Repeat
Chan Integ BW 4.09600 MHz
Ofs & Limits
Offset A
A
B
C
D
E
Offset Freq 5.00000 MHz On|Off
Ref BW 4.09600 MHz
Abs Limit 50.00 dBm
Fail Relative
AND
OR
Absolute
Relative
Rel Lim (Car) 0.00 dBc
Rel Lim (PSD) 0.00 dB <default for A to E: 0.0 dB>
Meas Type Total Pwr Ref
Total Pwr Ref
PSD Ref
Sweep Type FFT|Swp
Swp RBW 41.667 kHz Auto|Man
Swp Det Avg|Peak
Restore Meas Defaults
Advanced
Swp Acq Time 625.0 us
Bar Graph Total Pwr Ref
Spectrum Total Pwr Ref
Amplitude Y Scale
Scale/Div 10.00 dB
Ref Value 10.00 dBm
Ref Position Top |Ctr|Bot
Scale CouplingOn|Off
Display
Ref BW Markers On|Off
<default selection: A>
<default: A = 5.0 MHz, On
B = 10.0 MHz, On
C = 15.0 MHz, Off
D = 20.0 MHz, Off
E = 25.0 MHz, Off>
<default for A to E: 4.096 MHz>
<default for A to E: 50.0 dBm>
<default for A to E>
<default for A to E: 0.0 dBc>
<if Sweep Type = Swp>
<if Sweep Type = Swp>
<if Sweep Type = Swp>
<if Sweep Type = FFT>
<if Sweep Type = Swp>
<wcd_acpj.vsd>
Chapter 2 21

Setting Up the W-CDMA Mode
W-CDMA Measurement Key Flow
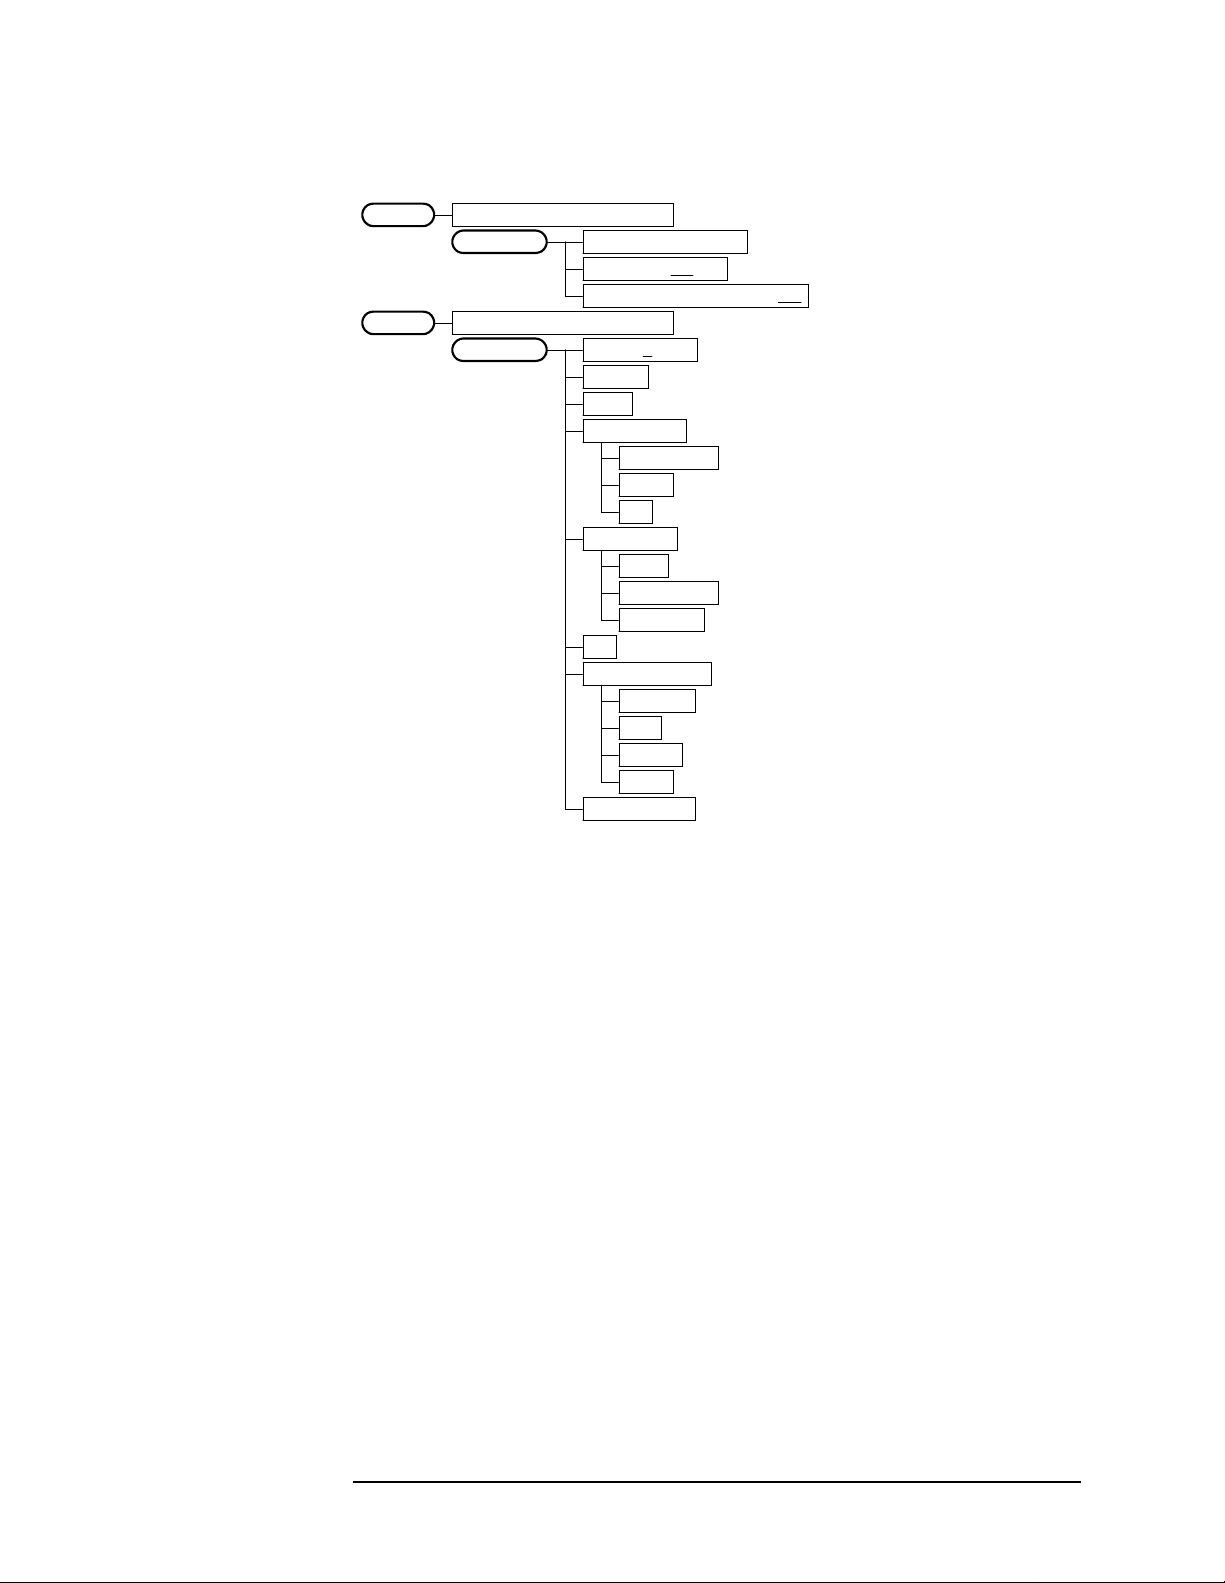
Figure 2-4 Power Stat CCDF Measurement Key Flow
Measure
Power Stat CCDF
Meas Setup
Power Stat CCDFMeasure
Span X Scale Scale/Div 2.00 dB
Power Stat CCDFMeasure
Display
Power Stat CCDFMeasure
Marker
Meas BW 5.00000 MHz
Counts 10.0000 Mpoints
Meas Interval 1.000 ms
Trig Source Free Run (Immediate)
Free Run (Immediate)
Video (IF Envlp)
RF Burst (Wideband)
Ext Front
Ext Rear
Frame
Restore Meas Defaults
Store Ref Trace
Ref Trace On|Off
Gaussian Line On|Off
Select 1|2|3|4
Normal
Delta
Function Off
Band Power
Noise
Off
Trace Measured
Measured
Gaussian
Reference
Off
Shape Diamond
Diamond
Line
Square
Cross
Marker All Off
<not available>
<not available>
<wcd_cdfj.vsd>
22 Chapter2

Setting Up the W-CDMA Mode
W-CDMA Measurement Key Flow
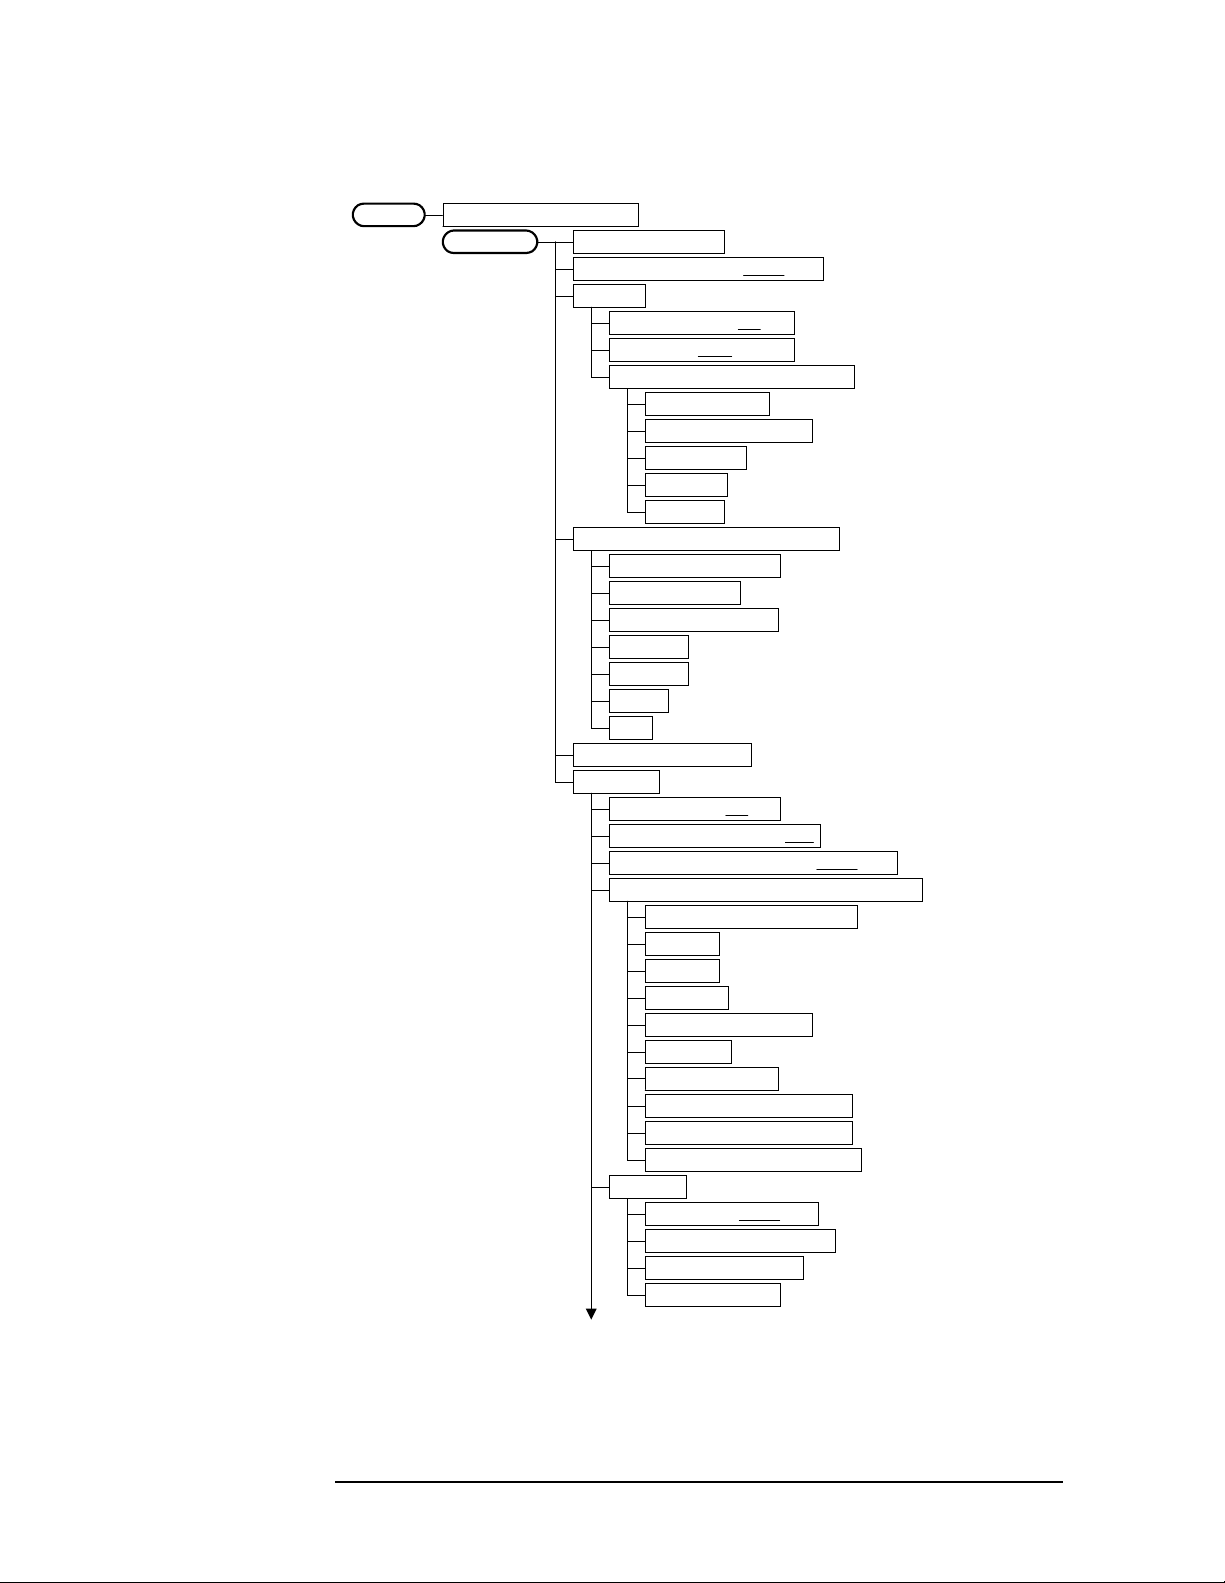
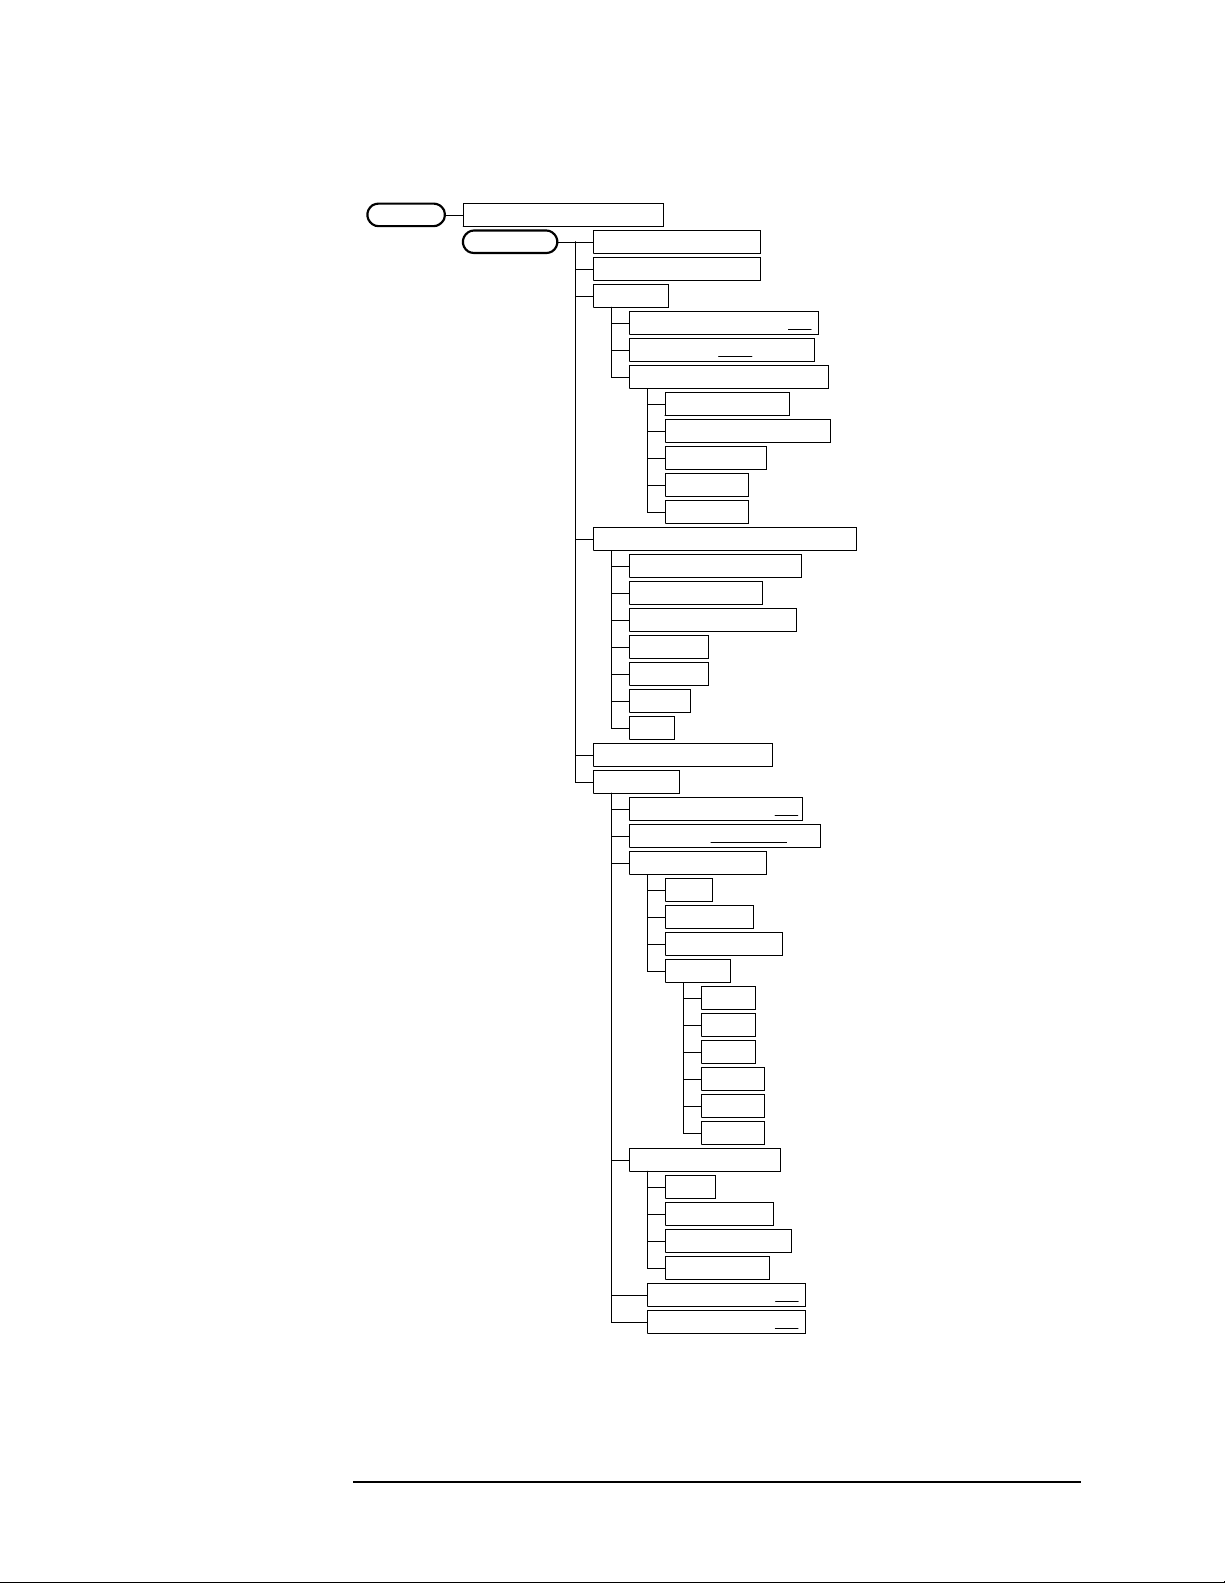
Figure 2-5 Code Domain Measurement Key Flow (1 of 3)
Measure
Code Domain
Meas Setup
Code DomainMeasure
View/Trace
<for ARIB & Trial 1998 BTS tests>
Symbol Rate 16 ksps
Code Number 0
Meas Interval 1 slots
Meas Offset 0 slots
Scramble Code 1
A
:
F
Done
Trig Source Free Run (Immediate)
Free Run (Immediate)
Video (IF Envlp)
RF Burst (Wideband)
Ext Front
Ext Rear
Frame
Spectrum Normal|Invert
Restore Meas Defaults
Advanced
Power Offset
Alpha 0.220
Chip Rate 4.09600 MHz
Power Graph & Metrics
Span X Scale
Ref Value 0.000
Ref Position Left|Ctr|Right
Amplitude Y Scale
<to enter a hexadecimal value>
Ref Set Auto|Man
PO1 (Pilot) 0.00 dB
PO2 (TPC) 0.00 dB
PO3 (TFCI) 0.00 dB
Scale/Div 511.0
Expand On|Off
Scale/Div 5.00 dB
Ref Value 0.00 dB
Ref Position Top |Ctr|Bot
Scale CouplingOn|Off
<for symbol EVM>
<for symbol EVM>
<for ARIB 1.0-1.2>
(a)
<wcd_cdp1.vsd>
Chapter 2 23

Setting Up the W-CDMA Mode
W-CDMA Measurement Key Flow
Figure 2-6 Code Domain Measurement Key Flow (2 of 3)
(a)
I/Q Error (Quad View)
Span X Scale
Scale/Div 1.900 symb
Ref Value 0.000 symb
Ref Position Left|Ctr|Right
Scale CouplingOn|Off
Amplitude Y Scale
Scale/Div 5.00 pcnt
Ref Value 0.00 pcnt
Ref Position Top|Ctr|Bot
Scale CouplingOn|Off
Amplitude Y Scale
Scale/Div 5.00 deg
Ref Value 0.00 deg
Ref Position Top|Ctr |Bot
Scale CouplingOn|Off
Amplitude Y Scale
Scale/Div 5.00 pcnt
Ref Value 0.00 pcnt
Ref Position Top|Ctr |Bot
Scale CouplingOn|Off
Code Domain (Quad View)
Span X Scale
Scale/Div 511.0
Ref Value 0.000
Ref Position Left|Ctr|Right
Expand On|Off
Amplitude Y Scale
Scale/Div 5.00 dB
Ref Value 0.00 dB
Ref Position Top |Ctr|Bot
Scale CouplingOn|Off
Span X Scale
Scale/Div 11.90 symb
Ref Value 0.000 symb
Ref Position Left|Ctr|Right
Scale CouplingOn|Off
Amplitude Y Scale
Scale/Div 10.00 dB
Ref Value 0.00 dB
Ref Position Top|Ctr |Bot
Scale CouplingOn|Off
<for EVM>
<for Phase Error>
<for Mag Error>
<for Code Domain Power>
<for Code Domain Power>
<for Symbol EVM vs Time>
<for Symbol EVM vs Time>
<wcd_cdp2.vsd>
24 Chapter2

Setting Up the W-CDMA Mode
W-CDMA Measurement Key Flow
Figure 2-7 Code Domain Measurement Key Flow (3 of 3)
Code DomainMeasure
Marker
<wcd_cdp3.vsd>
Select 1|2|3|4
Normal
Delta
Function Off
Band Power
Noise
Off
Trace Code Domain Power
Code Domain Power
Symbol Power
EVM
Phase Error
Mag Error
Off
Shape Diamond
Diamond
Line
Square
Cross
Marker All Off
Mkr->Despread <for Symbol Power & EVM>
<not available>
<not available>
Chapter 2 25

Setting Up the W-CDMA Mode
W-CDMA Measurement Key Flow
Figure 2-8 QPSK EVM Measurement Key Flow (1 of 2)
Measure
QPSK EVM
Meas Setup
QPSK EVMMeasure
View/Trace
Avg Number 10 On|Off
Avg Mode Exp|Repeat
Meas Interval 256 chips
Trig Source Free Run (Immediate)
Free Run (Immediate)
Video (IF Envlp)
RF Burst (Wideband)
Ext Front
Ext Rear
Frame
Restore Meas Defaults
Advanced
Alpha 0.220
Chip Rate 4.09600 MHz
I/Q Measured Polar Vector
I/Q Measured Polar Constln
I/Q Error (Quad View)
Span X Scale
Scale/Div 25.50 chip
Ref Value 0.000 chip
Ref Position Left|Ctr|Right
Scale CouplingOn|Off
Amplitude Y Scale
Scale/Div 5.00 pcnt
Ref Value 0.00 pcnt
Ref Position Top|Ctr|Bot
Scale CouplingOn|Off
Amplitude Y Scale
Scale/Div 5.00 deg
Ref Value 0.00 deg
Ref Position Top|Ctr |Bot
Scale CouplingOn|Off
Amplitude Y Scale
Scale/Div 5.00 pcnt
Ref Value 0.00 pcnt
Ref Position Top|Ctr |Bot
Scale CouplingOn|Off
<for EVM>
<for Phase Error>
<for Mag Error>
<wcd_evmj.vsd>
26 Chapter2
Setting Up the W-CDMA Mode
W-CDMA Measurement Key Flow
Figure 2-9 QPSK EVM Measurement Key Flow (2 of 2)
QPSK EVMMeasure
I/Q Points 1280 pointsDisplay
Chip Dots On|Off
+45 Degree Rotation On|Off
QPSK EVMMeasure
Marker
Select 1|2|3|4
Normal
Delta
Function Off
Band Power
Noise
Off
Trace EVM
EVM
Phase Error
Mag Error
Off
Shape Diamond
Diamond
Line
Square
Cross
Marker All Off
<not available>
<not available>
<wcd_evm2.vsd>
Chapter 2 27

Setting Up the W-CDMA Mode
W-CDMA Measurement Key Flow
Figure 2-10 Modulation Accuracy Measurement Key Flow (1 of 2)
Measure
Mod Accuracy (Perch Only)
Meas Setup
Mod Accuracy (Perch Only)Measure
View/Trace
Avg Number 10 On|Off
Avg Mode Exp| Repeat
Trig Source Free Run (Immediate)
Free Run (Immediate)
Video (IF Envlp)
RF Burst (Wideband)
Ext Front
Ext Rear
Frame
Scramble Code 1
A
:
F
Done
Spectrum Normal|Invert
Restore Meas Defaults
Advanced
Alpha 0.220
Chip Rate 4.09600 MHz
I/Q Measured Polar Vector
I/Q Measured Polar Constln
I/Q Error (Quad View)
Span X Scale
Amplitude Y Scale
Amplitude Y Scale
Amplitude Y Scale
<for ARIB & Trial 1998 BTS tests>
<to enter a hexadecimal value>
Scale/Div 230.3 chip
Ref Value 0.000 chip
Ref Position Left|Ctr|Right
Scale CouplingOn|Off
Scale/Div 5.00 pcnt
Ref Value 0.00 pcnt
Ref Position Top|Ctr|Bot
Scale CouplingOn|Off
Scale/Div 5.00 deg
Ref Value 0.00 deg
Ref Position Top|Ctr |Bot
Scale CouplingOn|Off
Scale/Div 5.00 pcnt
Ref Value 0.00 pcnt
Ref Position Top|Ctr |Bot
Scale CouplingOn|Off
<for EVM>
<for Phase Error>
<for Mag Error>
<wcd_mdac.vsd>
28 Chapter2
Setting Up the W-CDMA Mode
W-CDMA Measurement Key Flow
Figure 2-11 Modulation Accuracy Measurement Key Flow (2 of 2)
Mod Accuracy (Perch Only)Measure
I/Q Points 512 pointsDisplay
Chip Dots On|Off
+45 Degree Rotation On|Off
Mod Accuracy (Perch Only)Measure
Marker
Select 1|2|3|4
Normal
Delta
Function Off
Band Power
Noise
Off
Trace EVM
EVM
Phase Error
Mag Error
Off
Shape Diamond
Diamond
Line
Square
Cross
Marker All Off
<not available>
<not available>
<wcd_mda2.vsd>
Chapter 2 29
Setting Up the W-CDMA Mode
W-CDMA Measurement Key Flow
Figure 2-12 Spectrum (Freq Domain) Measurement Key Flow (1 of 3)
Measure
Spectrum (Freq Domain)
Meas Setup
Span 1.00000 MHz
Res BW 20.0000 kHz Auto|Man
Average
Trig Source Free Run (Immediate)
Restore Meas Defaults
Advanced
Avg Number 25 On|Off
Avg Mode Exp |Repeat
Avg Type Log-Pwr Avg (Video)
Pwr Avg (RMS)
Log-Pwr Avg (Video)
Voltage Avg
Maximum
Minimum
Free Run (Immediate)
Video (IF Envlp)
RF Burst (Wideband)
Ext Front
Ext Rear
Frame
Line
Pre-ADC BPF On|Off
Pre-FFT Fltr Gaussian|Flat
Pre-FFT BW 1.55000 MHz Auto|Man
FFT Window Flat Top (High Amptd Acc)
Flat Top (High Amptd Acc)
Uniform
Hanning
Hamming
Gaussian (Alpha 3.5)
Blackman
Blackman-Harris
K-B 70 dB (Kaiser-Bessel)
K-B 90 dB (Kaiser-Bessel)
K-B 110 dB (Kaiser-Bessel)
FFT Size
Length CtrlAuto|Man
Min Pnts/RBW 1.300000
Window Length 706
FFT Length 4096
<if Length Ctrl = Auto>
<if Length Ctrl = Man>
<if Length Ctrl = Man>
(a)
<wcd_spct.vsd>
30 Chapter2

Setting Up the W-CDMA Mode
W-CDMA Measurement Key Flow
Figure 2-13 Spectrum (Freq Domain) Measurement Key Flow (2 of 3)
(a)
ADC Range Auto Peak
Auto
Auto Peak
AutoPeakLock
Manual
-6 dB
0 dB
+6 dB
+12 dB
+18 dB
+24 dB
Data Packing Auto
Auto
Short (16 bit)
Medium (24 bit)
Long (32 bit)
ADC Dither Auto|On|Off
Decimation 0 Auto|Man
IF Flatness On |Off
Spectrum (Freq Domain)Measure
View/Trace
Spectrum
Span X Scale
Span 1.00000 MHz
Amplitude Y Scale
Scale/Div 10.00 dB
Ref Value 0.00 dBm
Ref Position Top |Ctr|Bot
Scale CouplingOn|Off
I/Q Waveform
Span X Scale
Scale/Div 18.8 us
Ref Value 0.00 s
Ref Position Left|Ctr|Right
Scale CouplingOn|Off
Amplitude Y Scale
Scale/Div 60.0 mV
Ref Value 0.00 V
Ref Position Top|Ctr|Bot
Scale Coupling On| Off
Trace Display All
All
Average (or Max & Min)
Current
<wcd_spc2.vsd>
Chapter 2 31
Setting Up the W-CDMA Mode
W-CDMA Measurement Key Flow
Figure 2-14 Spectrum (Freq Domain) Measurement Key Flow (3 of 3)
Spectrum (Freq Domain)Measure
Marker
Select 1|2|3|4
Normal
Delta
Function Off
Band Power
Noise
Off
Trace Spectrum
Spectrum
Spectrum Avg
I/Q Waveform
Off
Shape Diamond
Diamond
Line
Square
Cross
Marker All Off
<wcd_spc3.vsd>
32 Chapter2
Setting Up the W-CDMA Mode
W-CDMA Measurement Key Flow
Figure 2-15 Waveform (Time Domain) Measurement Key Flow (1 of 2)
Measure
Waveform (Time Domain)
Meas Setup
<wcd_wvf.vsd>
Sweep Time 2.00 ms
Res BW 100.000 kHz
Average
Avg Number 10 On| Off
Avg Mode Exp |Repeat
Avg Type Pwr Avg (RMS)
Trig Source Free Run (Immediate)
Free Run (Immediate)
Video (IF Envlp)
RF Burst (Wideband)
Ext Front
Ext Rear
Frame
Line
Restore Meas Defaults
Advanced
Pre-ADC BPF On| Off
RBW Fltr Gaussian|Flat
ADC Range Auto
Data Packing Auto
Pwr Avg (RMS)
Log-Pwr Avg (Video)
Voltage Avg
Maximum
Minimum
Auto
Auto Peak
AutoPeakLock
Manual
-6 dB
0 dB
+6 dB
+12 dB
+18 dB
+24 dB
Auto
Short (16 bit)
Medium (24 bit)
Long (32 bit)
ADC Dither On|Off
Decimation On|Off
Chapter 2 33

Setting Up the W-CDMA Mode
W-CDMA Measurement Key Flow
Figure 2-16 Waveform (Time Domain) Measurement Key Flow (2 of 2)
Waveform (Time Domain)Measure
View/Trace
Waveform (Time Domain)Measure
Marker
<wcd_wvf2.vsd>
RF Envelope
Span X Scale
Scale/Div 200.0 us
Ref Value 0.00 s
Ref Position Left|Ctr|Right
Scale CouplingOn|Off
Amplitude Y Scale
Scale/Div 10.00 dB
Ref Value 0.00 dBm
Ref Position Top |Ctr|Bot
Scale CouplingOn|Off
I/Q Waveform
Span X Scale
Scale/Div 200.0 us
Ref Value 0.00 s
Ref Position Left|Ctr|Right
Scale CouplingOn|Off
Amplitude Y Scale
Scale/Div 100.0 mV
Ref Value 0.00 V
Ref Position Top|Ctr|Bot
Scale CouplingOn|Off
Select 1|2|3|4
Normal
Delta
Function Off
Band Power
Noise
Off
Trace Envelope
RF Envelope
I/Q Waveform
Off
Shape Diamond
Diamond
Line
Square
Cross
Marker All Off
34 Chapter2

Setting Up the W-CDMA Mode
Installing Optional Measurement Personalities
Installing Optional
Measurement Personalities
Installing a measurement personality is a two step process.
1. The measurement personality firmware must be installed into the
instrument.
2. A license key number must be entered which enables the
measurement personality to run. (Refer to the “License Key
Numbers” section.)
Adding additional measurement personalities requires purchasing a
retrofit kit for the desired option. The retrofit kit includes the
measurement personality firmware, usually supplied on a zip disk. The
license key certificate, included in the kit, contains the license key
number. Every retrofit kit will have installation instructions.
The installation instructions require you to know three pieces of
information about your instrument; the amount of memory installed,
the Host ID, and the instrument serial number.
To find: Key Path:
Instrument
Memory:
__________________
Host ID:
__________________
Instrument
Serial Number:
__________________
Exit Main Firmware key. This key is only for use when you want to update
firmware using a LAN connection. The
System, File System
(the amount of memory in your
instrument will be the sum of the
memory and the Free memory)
System, Show System, Host ID
System, Show System, Serial Number
Exit Main Firmware key halts the
Used
operation of the resident firmware code so you can install an updated
version of firmware using a LAN connection. Instructions for loading
future firmware updates are available at the following URL:
www.agilent.com/find/vsa/
Chapter 2 35

Setting Up the W-CDMA Mode
Installing Optional Measurement Personalities
Available Options
The option designation consists of three characters, as shown in the
Option column of the table below.
Available Personality Options
GSM measurement personality BAH
cdmaOne measurement personality BAC
NADC, PDC measurement personalities BAE
iDEN measurement personality HN1
W-CDMA measurement personality BAF
cdma2000 measurement personality B78
a
Option
a. As of the print date of this measurement guide.
License Key Numbers
The measurement personality you have purchased with your
instrument has been installed and enabled at the factory. With the
purchase of the measurement personality, and with any future
purchase of a new personality, you will receive a unique license key
number. The license key number is a hexadecimal number that is for
your specific measurement personality and instrument serial number.
The license key enables you to install, or reactivate any personality you
have purchased.
Follow these steps to locate the unique license key number for the
measurement personality that has come installed in your instrument:
1. Press
you press the
System, More (1 of 3), More (2 of 3), Install, Choose Option. When
Choose Option key the alpha editor will be activated.
Use the alpha editor to enter the letters (upper-case) and the
front-panel numeric keyboard to enter the numbers (if required) for
the personality option that has been installed in the instrument.
2. Press the
number for your instrument will now appear on the
Done key on the alpha editor menu. The unique license key
License Key
softkey.
36 Chapter2

Setting Up the W-CDMA Mode
Installing Optional Measurement Personalities
You will want to keep a copy of your license key number in a
secure location. Please enter your license key numbers in the
box provided below for future reference. If you should lose your
license key number, call your nearest Agilent Technologies
service or sales office for assistance.
License Key Numbers for Instrument with Serial # ________
For Option______________ the license key number is _____________________
For Option______________ the license key number is _____________________
For Option______________ the license key number is _____________________
For Option______________ the license key number is _____________________
For Option______________ the license key number is _____________________
For Option______________ the license key number is _____________________
If you purchase an option later, you will receive a certificate which
displays the unique license key number that you will need to install
that option.
NOTE You will need to use a license key number only if you purchase an
additional measurement personality, or if you want to reactivate a
measurement personality that has been deactivated.
Installing a License Key Number
NOTE Follow this procedure to reinstall a license key number which has been
deleted during the uninstall process, or lost due to a memory failure.
Toinstall a license key number for the selected option, use the following
procedure:
1. Press
Pressing the
Use the alpha editor to enter the letters (upper-case) and the
front-panel numeric keyboard to enter the numbers (if required) for
the option designation, then press the
option, you will see your entry in the active function area of the
display.
2. Press
entry of both letters and numbers. Use the alpha editor to enter
letters. Use the front-panel numeric keyboard to enter numbers. You
will see your entry in the active function area of the display. When
you have completed entering the license key number, press the
key.
System, More(1 of 3), More(2 of 3), Install, Choose Option.
Choose Option key will activate the alpha editor menu.
Done key. As you enter the
License Key. Entering the license key number will require
Done
Chapter 2 37

Setting Up the W-CDMA Mode
Installing Optional Measurement Personalities
3. Press the Install Now key after you have entered the active license
key number and the personality option. When pressed, a message
may appearinthefunction area of the display which reads,“Insert
disk and power cycle the instrument”. Press the
No key only
if you wish to cancel the installation process. If you want to proceed
with the installation, press the
Yes key and cycle the instrument
power off and then on.
NOTE Not all personality installations require an installation disk. If the
personality upgrade kit does not include a disk, disregard the Insert
disk portion of the message that may appear in the active function area
when the Install Now key is pressed.
Using the Uninstall Key
The following procedure removes the license key number for the
selected option. This will make the option unavailable for use, and the
message “Application Not Licensed” will appear in the Status/Info
bar at the bottom of the display. Please write down the 12-digit license
key number for the option before proceeding. If that measurement
personality is to be used at a later date you will need the license key
number to reactivate the personality firmware.
NOTE Using the Uninstall key does not remove the personality from the
instrument memory, and does not free memory to be available to install
another option. If you need to free memory to install another option,
refer to the instructions for loading firmware updates located at the
URL: www.agilent.com/find/vsa/
1. Press
Pressing the
System, More(1 of 3), More(2 of 3), Uninstall, Choose Option.
Choose Option key will activate the alpha editor menu.
Use the alpha editor to enter the letters (upper-case) and the
front-panel numeric keyboard to enter the numbers (if required) for
the option, then press the
Done key. As you enter the option, you will
see your entry in the active function area of the display.
2. Press the Uninstall Now key after you have entered the personality
option. Press the
process. Press the
No key only if you wish to cancel the uninstall
Yes key if you want to continue the uninstall
process.
3. Cycletheinstrumentpower off and then on to complete the uninstall
process.
38 Chapter2

3 Making W-CDMA Measurements
39

Making W-CDMA Measurements
W-CDMA Measurements
W-CDMA Measurements
Once in the W-CDMA mode, the following measurements are available
by pressing the
• Channel Power on page 46
• ACPR (Adjacent Channel Power Ratio) on page 52
• Power Statistics CCDF (Complementary Cumulative Distribution
Function) on page 60
• Code Domain Analysis on page 65
• QPSK EVM on page 79
• Modulation Accuracy (Rho) on page 87
• Spectrum (Frequency Domain) on page 95
• Waveform (Time Domain) on page 103
Measure key:
These are referred to as one-button measurements. When you press the
key to select one measurement it will become the active measurement,
using settings and a display unique to that measurement. Data
acquisitions will automatically begin when trigger requirements, if any,
are met.
40 Chapter3

Making W-CDMA Measurements
Preparing for Measurements
Preparing for Measurements
If you want to set the W-CDMA mode to a known, factory default state,
press
Preset. This will preset the mode setup and all of the
measurements to the factory default parameters. You should often be
able to make a measurement using these defaults.
NOTE Pressing the Preset key does not switch instrument modes.
To preset only the parameter settings that are specific to the selected
measurement, press
This will reset the measurement setup parameters, for the currently
selected measurement only, to the factory defaults.
Initial Setup
Before making a measurement, make sure the mode setup and
frequency channel parameters are set to the desired settings. Refer to
the sections “Changing the Mode Setup” on page 12 and “Changing the
Frequency Channel” on page 17.
Meas Setup, More (1 of 2), Restore Meas Defaults.
Measurement Selection
The Measure front-panel key accesses the menu to select one of the
following measurements:
•
Channel Power - Press this key to make channel power
measurements. This is the in-channel power measurement. The
channel power graph is displayed in the graph window and both the
absolute channel power and mean power spectral density are shown
in the text window.
•
ACPR - Press this key to make adjacent channel power ratio (ACPR)
measurements. This is the out-of-channel measurement. The
following displays are available:
Bar graph display to show a histogram of powers within the
integration bandwidth
Spectrum display to show a power distribution curve, like a
swept-frequency spectrum analyzer, relative to the center
frequency power of the carrier signal
•
Power Stat CCDF - Press this key to make power statistics,
Complementary Cumulative Distribution Function (CCDF)
measurements. This is helpful to observe the time domain
characteristics of a spread spectrum signal that can significantly
affect the ACPR measurement results for a given UUT.
Chapter 3 41

Making W-CDMA Measurements
Preparing for Measurements
• Code Domain - Press this key to make code domain power (CDP)
measurements when
1.0-1.2, and also when Device is set to BTS. The amount of power in
Standard is set to either Trial 1998 or ARIB
each code channel is displayed. The following displays are available:
Power graph and metrics to show the code domain power and the
summary data
Quad view for the I/Q errors in graphs for the spread rate
selected, and the summary data
Quad view for the code domain power, the selected symbol power
vs. symbol rate, and the selected symbol EVM polar vector
graphs, and the summary data
•
QPSK EVM - Press this key to make QPSK error vector magnitude
(EVM) measurements. The following displays are available:
Polar vector graph of the I/Q demodulated signal and the
summary data
Polar constellation graph of the I/Q demodulated signal and the
summary data
Quad view for the I/Q errors in graphs and the summary data
Mod Accuracy (Perch Only) - Press this key to make modulation
•
accuracy (rho) measurements when
Standard issetto either Trial 1998
or ARIB 1.0-1.2, and also when Device is set to BTS. The input signal
should contain only the Perch channel. This is essentially a code
domain power measurement with one active channel. The following
displays are available:
Polar vector graph of the I/Q demodulated signal and the
summary data
Polar constellation graph of the I/Q demodulated signal and the
summary data
Quad view for the I/Q errors in graphs and the summary data
•
Spectrum (Freq Domain) - Press this key to make frequency domain
spectrum measurements. Spectrum and I/Q waveform displays are
available.
•
Waveform (Time Domain) - Press this key to make time domain
waveform measurements. RF envelope and I/Q waveform displays
are available.
42 Chapter3

Making W-CDMA Measurements
Preparing for Measurements
Measurement Control
The Meas Control front-panel key accesses the menu to control processes
that affect the running of the current measurement.
•
Restart - Press this key to repeat the current measurement from the
beginning, while retaining the current measurement settings. This
is equivalent to the
Measure - Press this key (not to be confused with the Measure
•
front-panel key which has a different function) to toggle the
measurement state between
to
Single, the measurement will continue until it has reached the
specified number of averages set by the average counter. When set to
Cont, the measurement will run continuously and execute averaging
according to the current average mode, either repeat or exponential.
The default setting is
which is defaulted to
Pause - Press this key to pause the current measurement until you
•
reactivate the measurement. Once toggled, the label of the
changes to read
the active measurement from the point at which it was paused.
Restart front-panel key.
Single and Cont (continuous). When set
Cont excepting the code domain measurement
Single.
Pause key
Resume. The Resume key, once pressed, continues
Measurement Setup
The Meas Setup key accesses the features that enable you to adjust
parameters of the current measurement, such as span and resolution
bandwidth, according to the measurement function. You will also use
the
Meas Setup menu to access the Average, Limit Test, Advanced and
other feature menus.
The following measure setup features can be used with many or all
measurements:
•
Restore Meas Defaults - Allows you to preset only the settings that are
specific to the selected measurement by pressing
of 2), Restore Meas Defaults. This will set the measure setup
parameters, for the currently selected measurement only, to the
factory defaults.
Averaging
Selecting one of the averaging keys in the
Meas Setup menu will allow
you to modify the average number and averaging mode you use for the
currently selected measurement. For spectrum (frequency domain) and
waveform (time domain) measurements the
Average key activates the
following menu:
Meas Setup, More (1
•
Avg Number - Allows you to change the number of N averages to be
made.
Chapter 3 43

Making W-CDMA Measurements
Preparing for Measurements
• Avg Mode - Allows you to toggle the averaging mode between Exp
(exponential) and Repeat. This selection only effects on the averaging
result after the number of N averages is reached. The N is set using
the
Avg Number key.
Normal averaging: Normal (linear) averaging is always used
until the specified number of N averages is reached. When the
Measure key under Meas Control is set to Single, data acquisition is
stopped when the number of N averages is reached, thus
Mode has no effect in the single measurement mode.
Avg
Exponential averaging: When
Measure is set to Cont, data
acquisition will continue indefinitely. Exponential averaging is
used with a weighting factor of N (the displayed count of averages
stops at N). Exponential averaging weights new data more
heavily than old data, which allows tracking of slow-changing
signals. The weighting factor N is set using the
Repeat averaging: When
Measure is set to Cont, data
Avg Number key.
acquisition will continue indefinitely. After the number of N
averages is reached, all previous result data is cleared and the
average count displayed is set back to 1. This is equivalent to
being in
Measure Single and pressing the Restart key each time the
single measurement finishes.
• Avg Type - Allows you to access the menu of the following average
types only for making spectrum (frequency domain) and waveform
(time domain) measurements:
Pwr Avg (RMS) - Executes the true power averaging which is
equivalent to taking the rms of the voltage. This is the most
accurate type.
Log-Pwr Avg(Video) - Simulates the traditional spectrum analyzer
type of averaging by calculating the log of the power.
Voltage Avg - Executes the voltage averaging.
Maximum - Executes the maximum voltage averaging by
capturing peak data.
Minimum - Executes the minimum voltage averaging.
44 Chapter3

Selecting a Trigger Source
Making W-CDMA Measurements
Preparing for Measurements
Changing the selection in the
Trig Source menu alters the trigger source
for the selected measurement only. Not all of the selections are always
available for all measurements. Also, some W-CDMA measurements do
not require a trigger. Choose one of the following trigger sources:
NOTE The RF Burst, Video (IF Envlp), Ext Front and Ext Rear keys found under
the
Trigger menu enable you to change the default settings of the delay,
level and slope for each of these trigger sources.
•
Free Run (Immediate) - A trigger occurs at the time the data is
requested, completely asynchronous with the RF or IF signal.
• Video (IF Envlp) - An internal IF envelope trigger that occurs at the
absolute threshold level of the IF signal level.
• RF Burst (Wideband) - An internal wideband RF burst trigger that
has the automatic level control for burst signals. It triggers at the
level that is set relative to the peak RF signal (12 MHz bandwidth)
input level.
•
Ext Front - Activates the front-panel external trigger input (EXT
TRIGGER INPUT) port. The external signal must be between −5.00
and +5.00 V with 1 or 10 mV resolution.
• Ext Rear - Activates the rear-panel external trigger input (TRIGGER
IN) port. The external signal must be between −5.00 and +5.00 V
with 1 or 10 mV resolution.
• Frame - Uses the internal frame clock to generate a trigger signal.
The clock parameters are controlled under the
Mode Setup key or the
measurement firmware, but not both. See the specific measurement
for details.
•
Line - Sets the trigger to the internal line mode. Sweep triggers occur
at intervals synchronous to the line frequency. This trigger source is
available for spectrum (frequency domain) and waveform (time
domain) measurements.
Using the Trigger Outputs
The rear panel
TRIGGER 1 OUT and TRIGGER 2 OUT connectors are
coupled to the selected trigger source. These trigger outputs are always
on at the rising edge with a pulse width of at least 1 µs.
Chapter 3 45

Making W-CDMA Measurements
Making the Channel Power Measurement
Making the Channel Power Measurement
Purpose
Channel power measurement is a common test used in the wireless
industry to measure the total transmitted power of a radio within a
defined frequency channel. This procedure measures the total power
within the defined channel for W-CDMA. This measurement can be
used to design, characterize, evaluate, and verify transmitters and
components or devices for base stations and mobile stations.
Measurement Method
The channel power measurement reports the total power within the
channel bandwidth, 4.096 MHz for the ARIB 1.0-1.2 and Trial 1998
modes or 3.840 MHz for the 3GPP mode. The transmitter tester
acquires a number of points representing the input signal in the time
domain. It transforms this information into the frequency domain using
FFT and then calculates the channel power. The effective resolution
bandwidth of the frequency domain trace is proportional to the number
of points acquired for FFT. The fastest FFT process is achieved using a
number of acquired points that is a power of 2 (for example: 64, 128,
512).
Since the measurement is optimized for speed and accuracy, you are
permitted to change only the number of acquired data points in powers
of 2, not the actual resolution bandwidth. However, if absolute sweep
time is required, sweep time can be changed to the user’s specified time
at the expense of reduced speed. At no time will both sweep time and
data points be set to manual because of conflicting parameter settings.
This flexibility is available through the
power measurement.
To improve repeatability, you can increase either the number of
averages or the number of data points with longer time record length.
The channel power graph is shown in the graph window and the
absolute channel power in dBm and the mean power spectral density in
dBm/Hz are shown in the text window.
Advanced menu of the channel
46 Chapter3

Making W-CDMA Measurements
Making the Channel Power Measurement
Making the Measurement
NOTE The factory default settings provide a good starting point. For special
requirements, you may need to change some of the settings. Press
Setup, More (1 of 2), Restore Meas Defaults at any time to return all
parameters for the current measurement to their default settings.
Select the desired center frequency as described in “Changing the
Frequency Channel” on page 17.
Meas
Press
Measure, Channel Power to immediately make a channel power
measurement.
Tochange any of the measurement parameters from the factory default
values, refer to “Changing the Measurement Setup” on page 48 for this
measurement.
Results
The next figure shows an example result of Channel Power
measurements. The channel power graph is shown in the graph
window. The absolute channel power and its mean power spectral
density are shown in the text window.
Figure 3-1 Channel Power Measurement
Chapter 3 47

Making W-CDMA Measurements
Making the Channel Power Measurement
Changing the Measurement Setup
The next table shows the factory default settings for channel power
measurements.
Table 3-1 Channel Power Measurement Defaults
Measurement Parameter Factory Default Condition
Meas Setup:
Avg Number 10, On
Avg Mode Repeat
Integ BW
Chan Power Span
Advanced
Sweep Time
Data Points
Trig Source Free Run (Immediate)
a
a
5.00000 MHz
6.00000 MHz
17.07 µs, Auto
512, Auto
b
b
a. The Integ BW setting proportionally changes the
Chan Pwr Span setting up to 10 MHz.
b. These are mutually interlinked to be set to either
Man/Auto or Auto/Man.
NOTE Parameters under the Advanced key seldom need to be changed. Any
changes from the factory default values may result in invalid
measurement data.
Make sure the
Measure menu. The Meas Setup key accesses the menu which allows you
Channel Power measurement is selected under the
to modify the average number and average mode for this measurement
as described in “Measurement Setup” on page 43.
48 Chapter3

Making W-CDMA Measurements
Making the Channel Power Measurement
The following parameters can be changed according to your
measurement requirement:
•
Integ BW - Allows you to specify the integration bandwidth in which
the power is measured. The range is 1.000 kHz to 10.0000 MHz with
1 or 10 Hz resolution. Since
Integ BW is coupled to Chan Pwr Span in
the factory default condition, if you change the integration
bandwidth setting, the channel power span setting changes by a
proportional amount until a limit value is reached.
•
Chan Power Span - Allows you to set the frequency span for the
channel power measurement. The range is 1.000 kHz to
10.0000 MHz with 1 or 10 Hz resolution. This span is used for the
current integration bandwidth setting. Since
coupled to
Integ BW in the factory default condition, if you change the
Chan Power Span is
integration bandwidth setting, the channel power span setting
changes by a proportional amount, 1.2 times the integration
bandwidth, until a limit value is reached. However, the channel
power span can be individually set.
In addition, the following parameters for channel power measurements
can be modified by pressing the
Sweep Time - Allows you to toggle the sweep time control between
•
Auto and Man (manual), and also to manually change the sweep time
if set to
resolution. If set to
Man. The range is 1.000 µs to 50.00 ms with 1 or 10 µs
Auto, the sweep time derived from the data
Advanced key:
points setting is shown on this key label regardless of the manual
entry range.
•
Data Points - Allows you to toggle the data point control between Auto
and Man (manual), and also to manually change the data points if set
to
Man. The range is 64 to 65536 with the acceptable entry in powers
of 2 (for example: 64, 128, 512). If set to
Auto, the data point derived
from the sweep time setting is shown on this key label regardless of
the manual entry range.
•
Res BW - Shows information on the resolution bandwidth derived
from the sweep time.
• Trig Source - Allows you to change the trigger source from free run
(immediate) to the external input signal supplied to either
Ext Front
or Ext Rear port.
Chapter 3 49

Making W-CDMA Measurements
Making the Channel Power Measurement
Changing the Display
The Amplitude Y Scale key accesses the menu to set the desired vertical
scale and associated parameters.
•
Scale/Div - Allows you to enter a numeric value to change the vertical
display sensitivity. The range is 0.10 to 20.00 dB with 0.01 dB
resolution. The default setting is 10.00 dB, however, since
Coupling is defaulted to On, this value is automatically determined
by the measurement result.
• Ref Value - Allows you to enter a numeric value to change the
absolute power value as the display reference. The range is −250.00
to 250.00 dBm with 0.01 dB resolution. The default setting is
10.00 dBm, however, since
Scale Coupling is defaulted to On, this
value is automatically determined by the measurement result.
• Ref Position - Allows you to set the display reference position to
either
Scale Coupling - Allows you to toggle the scale coupling function
•
between
Top, Ctr (center), or Bot (bottom). The default setting is Top.
On and Off. The default setting is On. This function
automatically determines the scale per division and reference values
by the measurement results.
Scale
50 Chapter3

Making W-CDMA Measurements
Making the Channel Power Measurement
Troubleshooting Hints
If an external attenuator is used, be sure to include its attenuation in
the measurement of the channel power. Use the
The channel power measurement can reveal degraded or defective
parts in the transmitter section of the UUT. The following examples are
those areas to be checked further.
• Some faults in the DC power supply control of the transmitter power
amplifier, RF power controller of the pre-power amplifier stage,
and/or I/Q control of the baseband stage.
• Some degradation in the gain and output power level of the amplifier
due to the degraded gain control and/or increased distortion.
• Some degradation of the amplifier linearity and other performance
characteristics.
Power amplifiers are one of the final stage elements of a base or mobile
transmitter and are a critical part of meeting the important power and
spectral efficiency specifications.Since the channel power measurement
measures the spectral response of the amplifier to a complex wideband
signal, it is a key measurement linking amplifier linearity and other
performance characteristics to the stringent system specifications.
Ext Atten key.
Chapter 3 51

Making W-CDMA Measurements
Making the Adjacent Channel Power Ratio (ACPR) Measurement
Making the Adjacent Channel Power Ratio
(ACPR) Measurement
Purpose
Adjacent Channel Power Ratio (ACPR), as it applies to W-CDMA, is the
power contained in a specified frequency channel bandwidth relative to
the total carrier power. It may also be expressed as a ratio of power
spectral densities between the carrier and the specified offset frequency.
As a composite measurement of out-of-channel emissions, ACPR
combines both in-band and out-of-band specifications to provide useful
figures-of-merit for spectral regrowth and emissions produced by
components and circuit blocks without the rigor of performing a full
spectrum emissions mask measurement.
Measurement Method
The ACPR measurement measures up to five pairs of offset channels
and relates them to the carrier power. An integration bandwidth (IBW)
method is used to measure the carrier channel power and offset powers.
The IBW method performs a time domain data acquisition and applies
FFT to get a frequency domain trace. In this process, the channel
integration bandwidth is analyzed using the automatically defined
resolution bandwidth (RBW), which is much narrower than the channel
bandwidth. The measurement computes an average power of the
channel over a specified number of data acquisitions, automatically
compensating for resolution bandwidth and noise bandwidth.
This measurement requires the user to specify measurement
bandwidths of the carrier channel and each of the offset frequency pairs
up to 5. Each pair may be defined with unique measurement
bandwidths. The results are displayed both as relative power in dBc,
and as absolute power in dBm.
52 Chapter3

Making W-CDMA Measurements
Making the Adjacent Channel Power Ratio (ACPR) Measurement
Making the Measurement
NOTE The factory default settings provide a good starting point. For special
requirements, you may need to change some of the settings. Press
Setup, More (1 of 2), Restore Meas Defaults at any time to return all
parameters for the current measurement to their default settings.
Select the desired center frequency as described in “Changing the
Frequency Channel” on page 17.
Meas
Press
Measure, ACPR to immediately make an adjacent channel power
ratio (ACPR) measurement.
Tochange any of the measurement parameters from the factory default
values, refer to “Changing the Measurement Setup” on page 54.
Results
The next figure shows an example result of ACPR-FFT Bar Graph
(Total Pwr Ref) measurements in the graph window. The absolute
and relative power levels on both sides of the carrier frequency are
displayed in the text window.
Figure 3-2 ACPR Measurement - FFT Bar Graph View
Chapter 3 53
Making W-CDMA Measurements
Making the Adjacent Channel Power Ratio (ACPR) Measurement
Changing the Measurement Setup
The next table shows the factory default settings for adjacent channel
power ratio measurements.
Table 3-2 Adjacent Channel Power Ratio Measurement Defaults
Measurement Parameter Factory Default Condition
View/Trace FFT Bar Graph (Total Pwr Ref)
Meas Setup:
Avg Number 10, On
Avg Mode Repeat
Chan Integ BW:
for ARIB & Trial 1998
for 3GPP
Ofs & Limits:
4.09600 MHz
3.84000 MHz
Offset A
Offset Freq:
A
B
C
D
E
Ref BW:
A to E
for ARIB & Trial 1998
for 3GPP
Abs Limit:
A to E 50.00 dBm
Fail:
A to E Relative
Rel Lim (Car):
A to E 0.00 dBc
Rel Lim (PSD):
A to E 0.00 dB
Meas Type Total Pwr Ref
5.00000 MHz, On
10.0000 MHz, On
15.0000 MHz, Off
20.0000 MHz, Off
25.0000 MHz, Off
4.09600 MHz
3.84000 MHz
Sweep Type FFT
Advanced
Swp Acq Time
(if Sweep Type is Swp)
54 Chapter3
625.0 µs

Making W-CDMA Measurements
Making the Adjacent Channel Power Ratio (ACPR) Measurement
Make sure the ACPR measurement is selected under the Measure menu.
The
Meas Setup key accesses the menu which allows you to modify the
average number and average mode for this measurement as described
in “Measurement Setup” on page 43. In addition, the following
parameters for adjacent channel power ratio measurements can be
modified.
•
Chan Integ BW - Allows you to specify the channel integration
bandwidth in which the carrier power is measured. The range is
300.000 kHz to 20.0000 MHz with 1 Hz resolution.
•
Ofs & Limits - Allows you to access the menu to change the following
parameters for offset frequency settings and pass/fail tests:
Offset - Allows you to access the memory selection menu from A to
E to store 5 sets of values for Offset Freq, Ref BW, Abs Limit and so
forth. Only one selection at a time (A, B, C, D, or E) is shown on
this key label.
Offset Freq - Allows you to enter an offset frequency value, and to
toggle the offset frequency functionbetween
On and Off, according
to each offset key selected. The range is 0.0 Hz to 100.000 MHz.
While this key is activated, enter an offset frequency value from
the numeric keypad by terminating with one of the frequency
unit keys shown. One offset frequency value selected from the
Offset menu is shown on this key label.
Ref BW - Allows you to enter a reference bandwidth ranging from
1.000 kHz to 20.0000 MHz with 1 Hz resolution. When this
parameter is changed, the integration bandwidth Integ BW in the
summary data window changes to that value.
Abs Limit - Allows you to enter an absolute limit value ranging
from −200.00 to +50.00 dBm with 0.01 dB resolution.
Fail - Allows you to access the following menu to select one of the
logic keys for fail conditions between the measurement results
and the test limits:
AND - Fail is shown if one of the relative ACPR measurement
results is larger than
the absolute ACPR measurement results is larger than
Limit.
OR - Fail is shown if one of the relative ACPR measurement
results is larger than
the absolute ACPR measurement results is larger than
Limit.
Absolute - Fail is shown if one of the absolute ACPR
measurement results is larger than
Rel Lim (Car) or Rel Lim (PSD) AND one of
Abs
Rel Lim (Car) or Rel Lim (PSD) OR one of
Abs
Abs Limit.
Chapter 3 55

Making W-CDMA Measurements
Making the Adjacent Channel Power Ratio (ACPR) Measurement
Relative - Fail is shown if one of the relative ACPR
measurement results is larger than
(PSD).
Rel Lim (Car) - Allows you to enter a relative limit value of the
Rel Lim (Car) or Rel Lim
carrier level ranging from −200.00 to +50.00 dBc with 0.01 dB
resolution.
Rel Lim (PSD) - Allows you to enter a relative limit value of the
power spectral density level ranging from −200.00 to +50.00 dB
with 0.01 dB resolution.
•
Meas Type - Allows you to access the menu to select one of the
measurement reference types.
Total Pwr Ref - Sets the reference to the total carrier power and the
measured data is shown in dBc and dBm.
PSD Ref - Sets the reference to the mean power spectral density of
the carrier and the measured data is shown in dB and dBm/Hz.
• Sweep Type - Allows you to toggle the sweep type between FFT and
Swp (swept). If set to Swp, the measurement is made by the swept
spectrum method like the traditional swept frequency spectrum
analysis to have better correlation to the input signal with a high
crest factor (peak/average ratio). However, it may take a longer time.
Also, only the
Spectrum view is available.
Swp RBW - Allows you to enter the sweep resolution bandwidth, and
•
to toggle this function between
Type is set to Swp. If set to Auto, the sweep resolution bandwidth is
set automatically, according to the sweep span derived from
Freq and Ref BW. If set to Man, the sweep resolution bandwidth is
Auto and Man (manual), when Sweep
Offset
manually changed. The range is 1.000 kHz to 1.00000 MHz with
1 Hz resolution. The default setting is 41.667 kHz and
Swp Det - Allows you to toggle the sweep detector type between Avg
•
Auto.
(average) and Peak, when Sweep Type is set to Swp. The default
selection is
Advanced - Allows you to access the menu to set the following
•
Peak.
parameter:
Swp Acq Time - Allows you to set the data acquisition time when
Sweep Type is set to Swp. The range is 500.0 µs to 10.00 ms with
1 µs resolution.
56 Chapter3

Making W-CDMA Measurements
Making the Adjacent Channel Power Ratio (ACPR) Measurement
Changing the View
The View/Trace key accesses the menu to select the desired view of the
measurement result as follows when
Sweep Type is set to Swp, the Bar Graph key is not available only to show
the spectrum display.
•
Bar Graph - In the factory default condition, 5 of the total integration
power levels, centered at the carrier frequency and ±5.0 MHz and
±10.0 MHz offset frequencies, are shown in the graph window. The
corresponding measured data is shown in the text window as shown
in Figure 3-2 on page 53. Depending on the
the two following displays is obtained:
Bar Graph (Total Pwr Ref) - A histogram of powers referenced
to the total carrier power
Bar Graph (PSD Ref) - A histogram of powers referenced to the
mean power spectral density of the carrier in dBm/Hz
•
Spectrum - In the factory default condition, the frequency spectrum
with the FFT sweep type is displayed with the bandwidth marker
lines in the graph window. The corresponding measured data in the
text window is the total integration power levels within the defined
bandwidth as shown in the figure below.
Sweep Type is set to FFT. When
Meas Type setting,one of
Figure 3-3 ACPR Measurement - FFT Spectrum View
Chapter 3 57

Making W-CDMA Measurements
Making the Adjacent Channel Power Ratio (ACPR) Measurement
Depending on the Meas Type setting, one of the two following
displays is obtained with either
FFT or Swp mode:
Spectrum (Total Pwr Ref) - A spectrum display referenced to
the total carrier power
Spectrum (PSD Ref) - A spectrum display referenced to the
mean power spectral density of the carrier in dBm/Hz
NOTE If Sweep Type is set to FFT, the spectrum graph does not show the actual
power level measured at each of the offsets. Select
Swp for the more
accurate spectrum graph.
While in this view, you can change the vertical scale by pressing the
Amplitude Y Scale key. You can also activate or deactivate the
reference bandwidth markers and the spectrum grid by pressing the
Display key.
Changing the Display
When the spectrum graph window is selected, the Amplitude Y Scale key
accesses the menu to set the desired measurement scale and associated
parameters:
•
Scale/Div - Allows you to enter a numeric value to change the vertical
display sensitivity. The range is 0.10 to 20.00 dB with 0.01 dB
resolution. The default setting is 10.00 dB, however, since the
Coupling is defaulted to On, this value is automatically determined
Scale
by the measurement result.
• Ref Value - Allows you to set the absolute power reference value
ranging from −250.00 to 250.00 dBm with 0.01 dB resolution. The
default setting is 10.00 dBm, however, since the
defaulted to
On, this value is automatically determined by the
Scale Coupling is
measurement result.
• Ref Position - Allows you to set the reference position to either Top,
Ctr (center), or Bot (bottom). The default setting is Top.
Scale Coupling - Allows you to toggle the scale coupling function
•
between
On and Off. The default setting is On. This function
automatically determines the scale per division and reference values
by the measurement results.
The
Display key also accesses the menu to control the markers on the
display as follows:
•
Ref BW Markers - Allows you to toggle the reference bandwidth
markers function between
On and Off. If set to On, the line markers
with the reference bandwidth are shown on the measurement result
display.
58 Chapter3

Making W-CDMA Measurements
Making the Adjacent Channel Power Ratio (ACPR) Measurement
Troubleshooting Hints
If an external attenuator is used, be sure to include its attenuation in
the ACPR measurement. Use the
This adjacent channel power ratio measurement can reveal degraded or
defective parts in the transmitter section of the UUT. The following
examples are those areas to be checked further.
• Some faults in the DC power supply control of the transmitter power
amplifier, RF power controller of the pre-power amplifier stage, or
I/Q control of the baseband stage
• Some degradation in the gain and output power level of the amplifier
due to the degraded gain control and/or increased distortion
• Some degradation of the amplifier linearity and other performance
characteristics
Power amplifiers are one of the final stage elements of a base or mobile
transmitter and are a critical part of meeting the important power and
spectral efficiency specifications. Since ACPR measures the spectral
response of the amplifier to a complex wideband signal, it is a key
measurement linking amplifier linearity and other performance
characteristics to the stringent system specifications.
Ext Atten key.
Chapter 3 59

Making W-CDMA Measurements
Making the Power Stat CCDF Measurement
Making the Power Stat CCDF Measurement
Purpose
Many of the digitally modulated signals now look noise-like in the time
and frequency domain. This means that statistical measurements of
the signals can be a useful characterization. Power Complementary
Cumulative Distribution Function (CCDF) curves characterize the
higher level power statistics of a digitally modulated signal. The curves
can be useful in determining design parameters for digital
communications systems.
The power statistics CCDF measurement can be affected by many
factors. For example, modulation filtering, modulation format,
combining the multiple signals at different frequencies, number of
active codes and correlation between symbols on different codes with
spread spectrum systems. These factors are all related to modulation
and signal parameters.External factors such as signal compression and
expansion by non-linear components, group delay distortion from
filtering, and power control within the observation interval also affect
the measurement.
Measurement Method
The power measured in power statistics CCDF curves is actually
instantaneous envelope power defined by the equation:
2
P = (I
(where I and Q are the quadrature voltage components of the waveform
and Z
is the characteristic impedance).
o
A CCDF curve is defined by how much time the waveform spends at or
above a given power level. The percent of time the signal spends at or
above the level defines the probability for that particular power level.
To make the power statistics CCDF measurement, the transmitter
tester uses digital signal processing (DSP) to sample the input signal in
the channel bandwidth.
The Gaussian distribution line as the band-limited gaussian noise
CCDF reference line, the user-definable reference trace, and the
currently measured trace can be displayed on a semi-log graph. If the
currently measured trace is above the user reference trace, it means
that the higher peak power levels against the average power are
included in the input signal.
+ Q2) / Z
o
60 Chapter3

Making W-CDMA Measurements
Making the Power Stat CCDF Measurement
Making the Measurement
NOTE The factory default settings provide a good starting point. For special
requirements, you may need to change some of the settings. Press
Setup, More (1 of 2), Restore Meas Defaults at any time to return all
parameters for the current measurement to their default settings.
Select the desired center frequency as described in “Changing the
Frequency Channel” on page 17.
Meas
Press
Measure, Power Stat CCDF to immediately make a power statistics
CCDF measurement.
Tochange any of the measurement parameters from the factory default
values, refer to “Changing the Measurement Setup” on page 62.
Results
The next figure shows an example result of Power Stat CCDF
measurements in the graph window. The average power and its
probability are shown in the text window.
Figure 3-4 Power Statistics CCDF Measurement
Chapter 3 61

Making W-CDMA Measurements
Making the Power Stat CCDF Measurement
Changing the Measurement Setup
The next table shows the factory default settings for power statistics
CCDF measurements.
Table 3-3 Power Statistics CCDF Measurement Defaults
Measurement Parameter Factory Default Condition
Meas Setup:
Meas BW 5.00000 MHz
Counts 10.0000 Mpoints
Meas Interval 1.000 ms
Trig Source Free Run (Immediate)
Display:
Ref Trace Off
Gaussian Line On
Make sure the
Measure menu. Press the Meas Setup key to access the menu which
Power Stat CCDF measurement is selected under the
allows you to modify the trigger source for this measurement as
described in “Measurement Setup” on page 43. In addition, the
following parameters can be modified.
•
Meas BW - Allows you to set the measurement bandwidth according
to the channel bandwidth. The range is 10.000 kHz to 6.70000 MHz
with 0.1 kHz resolution.
•
Counts - Allows you to set the accumulated number of sampling
points for data acquisition. The range is 1.000 kpoints to
2.000 Gpoints with 1 or 10 kpoints resolution. While this key is
activated, enter a value from the numeric keypad by terminating
with one of the unit keys shown.
•
Meas Interval - Allows you to specify the time interval over which the
measurement is made. The range is 100.0 µs to 10.00 ms with 1 µs
resolution.
Changing the View
The View/Trace key is not available for this measurement.
62 Chapter3

Making W-CDMA Measurements
Making the Power Stat CCDF Measurement
Changing the Display
The Display key allows you to control the desired trace and line displays
of the power statistics CCDF curves. The currently measured curve is
always shown.
•
Store Ref Trace - Allows you to copy the currently measured curve as
the user-definable reference trace. The captured data will remain
until the other mode is chosen. Pressing this key refreshes the
reference trace.
•
Ref Trace - Allows you to toggle the reference trace display function
between
Gaussian Line - Allows you to toggle the Gaussian line display
•
function between
Span X Scale key accesses the menu to set the desired horizontal
The
scale.
•
Scale/Div - Allows you to enter a numeric value to change the
horizontal display sensitivity. The range is 0.10 to 20.00 dB with
0.01 dB resolution. The default setting is 2.00 dB.
On and Off.
On and Off.
Using the Markers
The Marker front-panel key accesses the menu to configure the markers.
Select - Allows you to activate up to four markers with the
•
corresponding numbers, respectively. The selected number is
underlined and its function is defined by pressing the
The default selection is 1.
• Normal - Allows you to activate the selected marker to read the
power level and probability of the marker position on the selected
curve, for example, which is controlled by the RPG knob.
•
Delta - Allows you to read the differences in the power levels and
probabilities between the selected marker and the next.
• Function - Allows you to set the selected marker function to Band
Power, Noise, or Off. The default setting is Off. The Band Power and
Noise functions are not available for this measurement.
Trace - Allows you to place the selected marker on the Measured,
•
Gaussian, or Reference curve. The default setting is Measured.
Off - Allows you to turn off the selected marker.
•
Shape - Allows you to access the menu to set the selected marker
•
shape to
Diamond.
Diamond, Line, Square, or Cross. The default setting is
Function key.
Marker All Off - Allows you to turn off all of the markers.
•
Chapter 3 63

Making W-CDMA Measurements
Making the Power Stat CCDF Measurement
Troubleshooting Hints
The power statistics CCDF measurement can contribute in setting the
signal power specifications for design criteria for systems, amplifiers,
and other components. Forexample, it can help determine the optimum
operating point to adjust each code timing for appropriate peak/average
power ratio throughout the wide channel bandwidth of the transmitter
for a W-CDMA system.
As this measurement is a new method, there will be some correlations
between CCDF curve degradation and digital radio system
measurement parameters such as BER, FER, code domain power, and
ACPR. Some studies will help set standards for radio design by
specifying the maximum allowed CCDF curve degradation for specific
systems.
64 Chapter3

Making W-CDMA Measurements
Making the Code Domain Measurement
Making the Code Domain Measurement
Purpose
Since the code domain measurements despread and decode the
W-CDMA signal into its physical channels, the number of active
channels of various symbol rates (which are denoted by widths) can be
observed. The width of the channel is inversely proportional to the
Orthogonal Variable Spreading Factor (OVSF) code length in number of
bits. In the code domain, there is a fixed amount of code space for a
given chip rate. Therefore, by using the different OVSF codes, the
system can dynamically allocate the code space for lower rate voice
users versus high speed data users.
This code domain power composite view provides information about the
in-channel characteristics of the W-CDMA signal. It directly informs
the user of the active channels with their individual channel powers.
The composite view also shows which data rates are active and the
corresponding amount of code space used. The following are conditions
under which a general unlock can occur: the Perch signal is too low in
power or no Perch signal available, an incorrect long code is used for
despreading, the frequency error is too large, or a frequency inversion is
present.
When the level of the code domain noise floor is too high, relative to a
reference or an expected level, one of the possible causes might be due
to CW interference, like local oscillator feedthrough or spurs. I/Q
modulation impairments can be another source of this uncorrelated
noise. The I/Q demodulation measurements can reveal errors such as
I/Q gain imbalance or I/Q quadrature error.
Measurement Method
This procedure measures the power levels of the spread channels in a
single RF channel when
1.0-1.2 or Trial 1998, and also when Device is set to BTS. One uniqueness
from other measurements is that
defaulted to
The code domain measurement displays the power for each of the
spread channels, relative to the total power within the 4.096 MHz
channel bandwidth centered at the center frequency. Each spread
channel level is displayed as an individual vertical bar with a different
width determined by a spread rate. Because this is a relative
measurement, the unit of measure is dB (not dBm or watts). This
allows a comparison of signal levels between the Perch and Traffic
channels.
Single.
Standard in the Radio menu is set to ARIB
Measure in the Meas Control menu is
Chapter 3 65

Making W-CDMA Measurements
Making the Code Domain Measurement
The following displays are available for this measurement:
• Power Graph & Metrics - The transmitted energy associated with
each of the symbol rates and codes is shown in the graph window.
The following powers along with the total power are shown in the
text window:
— Total active channel power
— Perch channel power
— Number of active channels
— Maximum active channel power
— Average active channel power
— Maximum inactive channel power
— Average inactive channel power
• I/Q Error (Quad View) - The magnitude error, phase error, and EVM
graphs are shown in the graph window. The summary data for these
parameters are also shown in the text window.
• Code Domain (Quad View) - The graphs of the code domain power,
the symbol power for the selected spread channel, and the symbol
EVM polar vector for the symbol power range selected by the
measurement interval and measurement offset parameters, are
shown in the graph windows.Thesummarydatais also shown in the
text window.
66 Chapter3
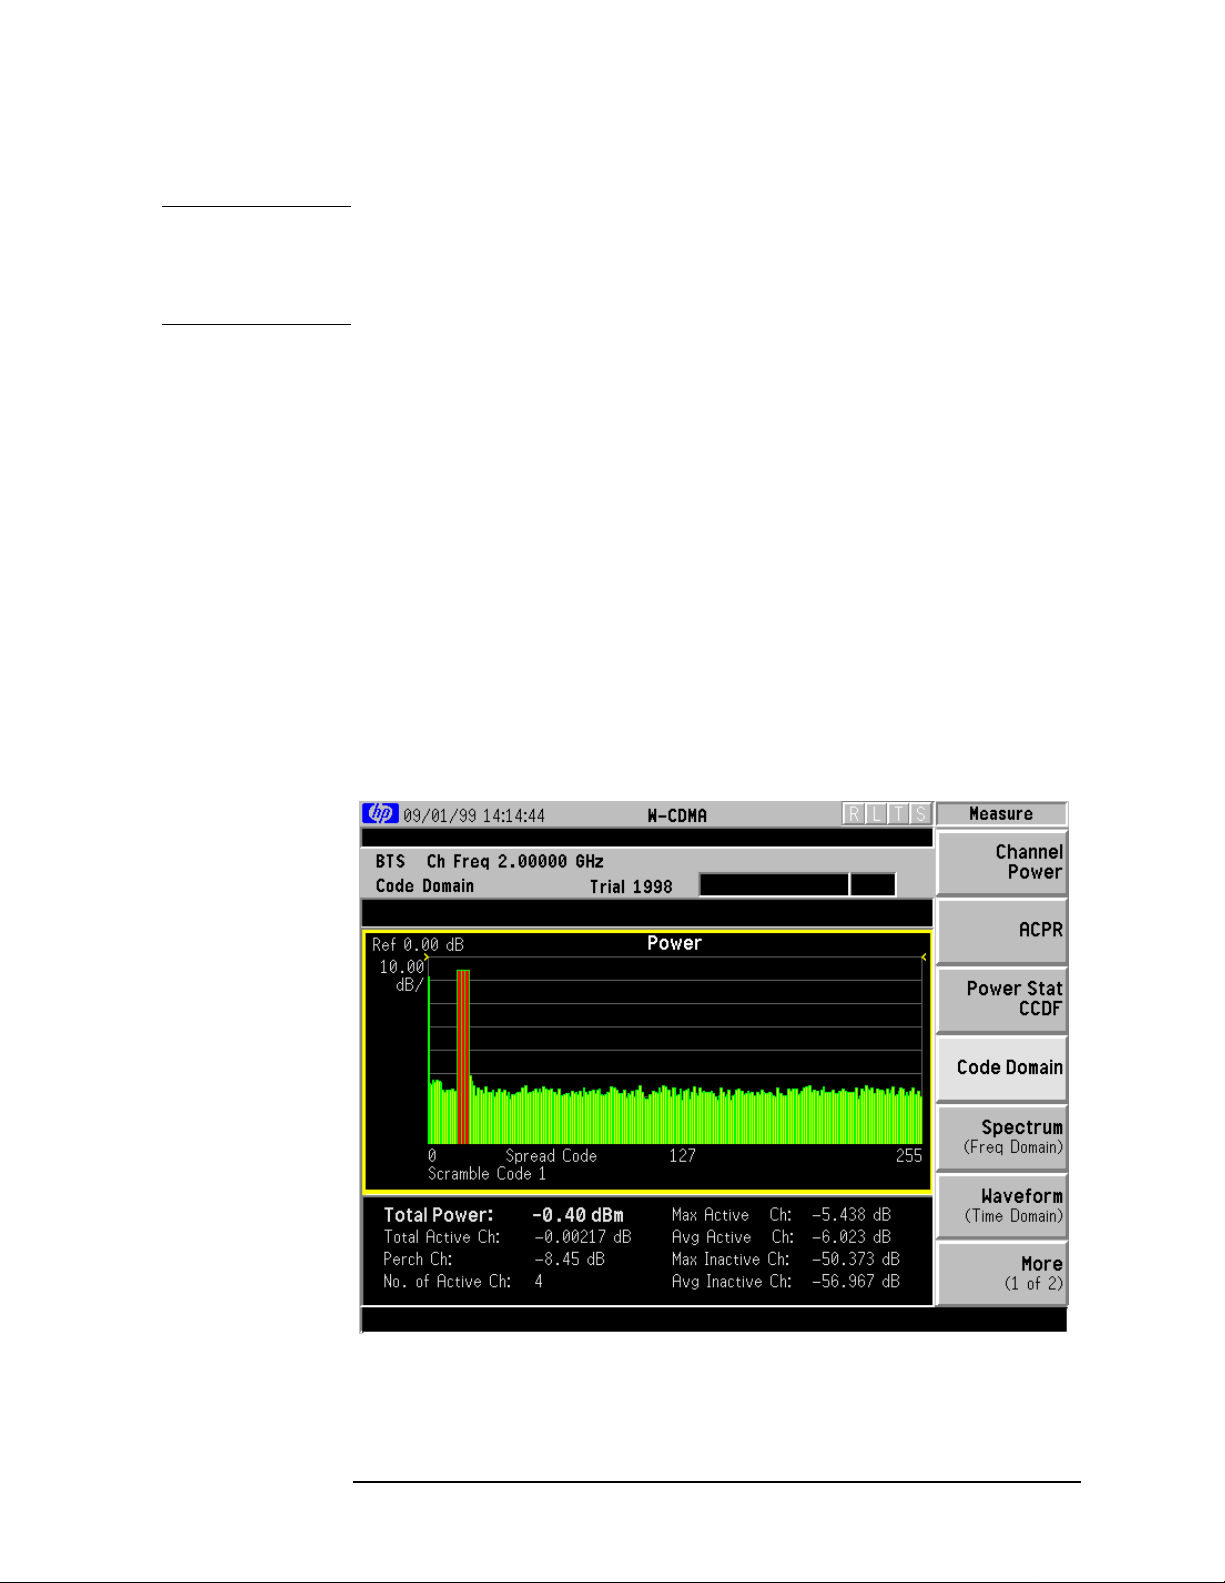
Making W-CDMA Measurements
Making the Code Domain Measurement
Making the Measurement
NOTE The factory default settings provide a good starting point. For special
requirements, you may need to change some of the settings. Press
Setup, More (1 of 2), Restore Meas Defaults at any time to return all
parameters for the current measurement to their default settings.
Select the desired center frequency as described in “Changing the
Frequency Channel” on page 17.
Meas
Press
Measure, Code Domain to immediately make a code domain power
measurement.
Tochange any of the measurement parameters from the factory default
values, refer to “Changing the Measurement Setup” on page 68.
Results
The next figure shows an example result of Code Domain Power
measurements. In the graph window, the active channel symbol rates
are shown with those widths of the bars and the measured channel
powers are shown with those heights. Also, the summary data are
shown in the text window.
Figure 3-5 Code Domain Measurement - Power Graph View
Chapter 3 67

Making W-CDMA Measurements
Making the Code Domain Measurement
Changing the Measurement Setup
The next table shows the factory default settings for code domain power
measurements.
Table 3-4 Code Domain Power Measurement Defaults
Measurement Parameter Factory Default Condition
View/Trace Power Graph & Metrics
Meas Setup:
Symbol Rate 16 ksps
Code Number 0
Meas Interval 1 slots
Meas Offset 0 slots
Scramble Code 1
Trig Source Free Run (Immediate)
Spectrum Normal
Meas Control:
Measure Single
Advanced
Power Offset: (for ARIB only)
Ref Set Auto
Alpha 0.220
Chip Rate 4.09600 MHz
Make sure the
Code Domain measurement is selected under the Measure
menu. Press the Meas Setup key to access the menu which allows you to
modify the trigger source for this measurement as described in
“Measurement Setup” on page 43. Also, press the
access the menu which allows you to change
Meas Control key to
Measure from single to
continuous as described in “Measurement Control” on page 43. In
addition, the following parameters can be modified.
•
Symbol Rate - Allows you to set the symbol rate ranging from 8 to
1024 ksps. The parameter automatically sets the maximum value
for
Code Number when appropriate. If Symbol Rate is set to 16 ksps
and
Code Number is set to 0, the Perch channel is automatically
selected as the channel type. When the channel type is set to Perch,
the search code portion is not included in the symbol EVM
calculation. In other cases, the channel type is set to DPCH which
enables power offset measurements.
68 Chapter3

Making W-CDMA Measurements
Making the Code Domain Measurement
• Code Number - Allows you to set the code number. The range is 0 to
511 depending on the
Symbol Rate Code Number Description
8 ksps 0 to 511 Not available for Trial 1998
16 ksps 0 to 255
32 ksps 0 to 127
::
512 ksps 0 to 7
1024 ksps 0 to 3
Symbol Rate setting as follows:
• Meas Interval - Allows you to set the time interval in slots over which
the symbol EVM measurement is made. The range is 32 to 1 slots in
conjunction with the
minus the
Meas Offset value. The marker lines of which width varies
Meas Offset value. The maximum value is 32
with this number of slots are displayed in the symbol power graph of
the
Code Domain (Quad View) display.
Meas Offset - Allows you to set the number of offset slots to make the
•
symbol EVM measurement. The range is 0 to 31 slots in conjunction
with the
Meas Interval value. The marker lines shift to right by this number of
slots in the symbol power graph of the
Meas Interval value. The maximum value is 32 minus the
Code Domain (Quad View)
display.
Scramble Code - Allows you to enter a hexadecimal value for the
•
scramble code. Pressing this key reveals the keys labeled
Done. The range is 0000 to 3FFFF. Use the numeric keypad and
A to F and
these keys to create a hexadecimal value by terminating with the
Done key.
Spectrum - Allows you to toggle the spectrum function between
•
Normal and Invert. This key, when set to Invert, conjugates the
spectrum, which equivalently negates the quadrature component in
demodulation. The correct setting (
Normal or Invert) depends on
whether the signal being given to the transmitter tester has a high
or low side mix.
Chapter 3 69

Making W-CDMA Measurements
Making the Code Domain Measurement
• Advanced - Allows you to access the menu to set the following
parameters.
Power Offset - Allows you to access the menu with the following
parameters. (This key is not available for the Trial 1998 mode.)
Ref Set - Allows you to toggle the power offset reference setting
function between
Auto and Man (manual). If set to Auto, the
symbol EVM is computed with the measured average power
for that power region. If set to
Man, the symbol EVM is
computed with the measured average power for data plus the
power offset specified.
PO1 (Pilot) - Allows you to specify the power offset value of the
pilot bits. The range is −20.00 to +50.00 dB with 0.01 dB
resolution.
PO2 (TPC) - Allows you to specify the power offset value of the
transmit power control bits. The range is −20.00 to +50.00 dB
with 0.01 dB resolution.
PO3 (TFCI) - Allows you to specify the power offset value of the
transport format control indicator bits. The range is −20.00 to
+50.00 dB with 0.01 dB resolution.
Alpha - Allows you to specify the alpha value of the root-raised
cosine filter. The range is 0.01 to 0.50.
Chip Rate - Allows you to change the chip rate. The range is
3.68640 to 4.50560 MHz.
70 Chapter3
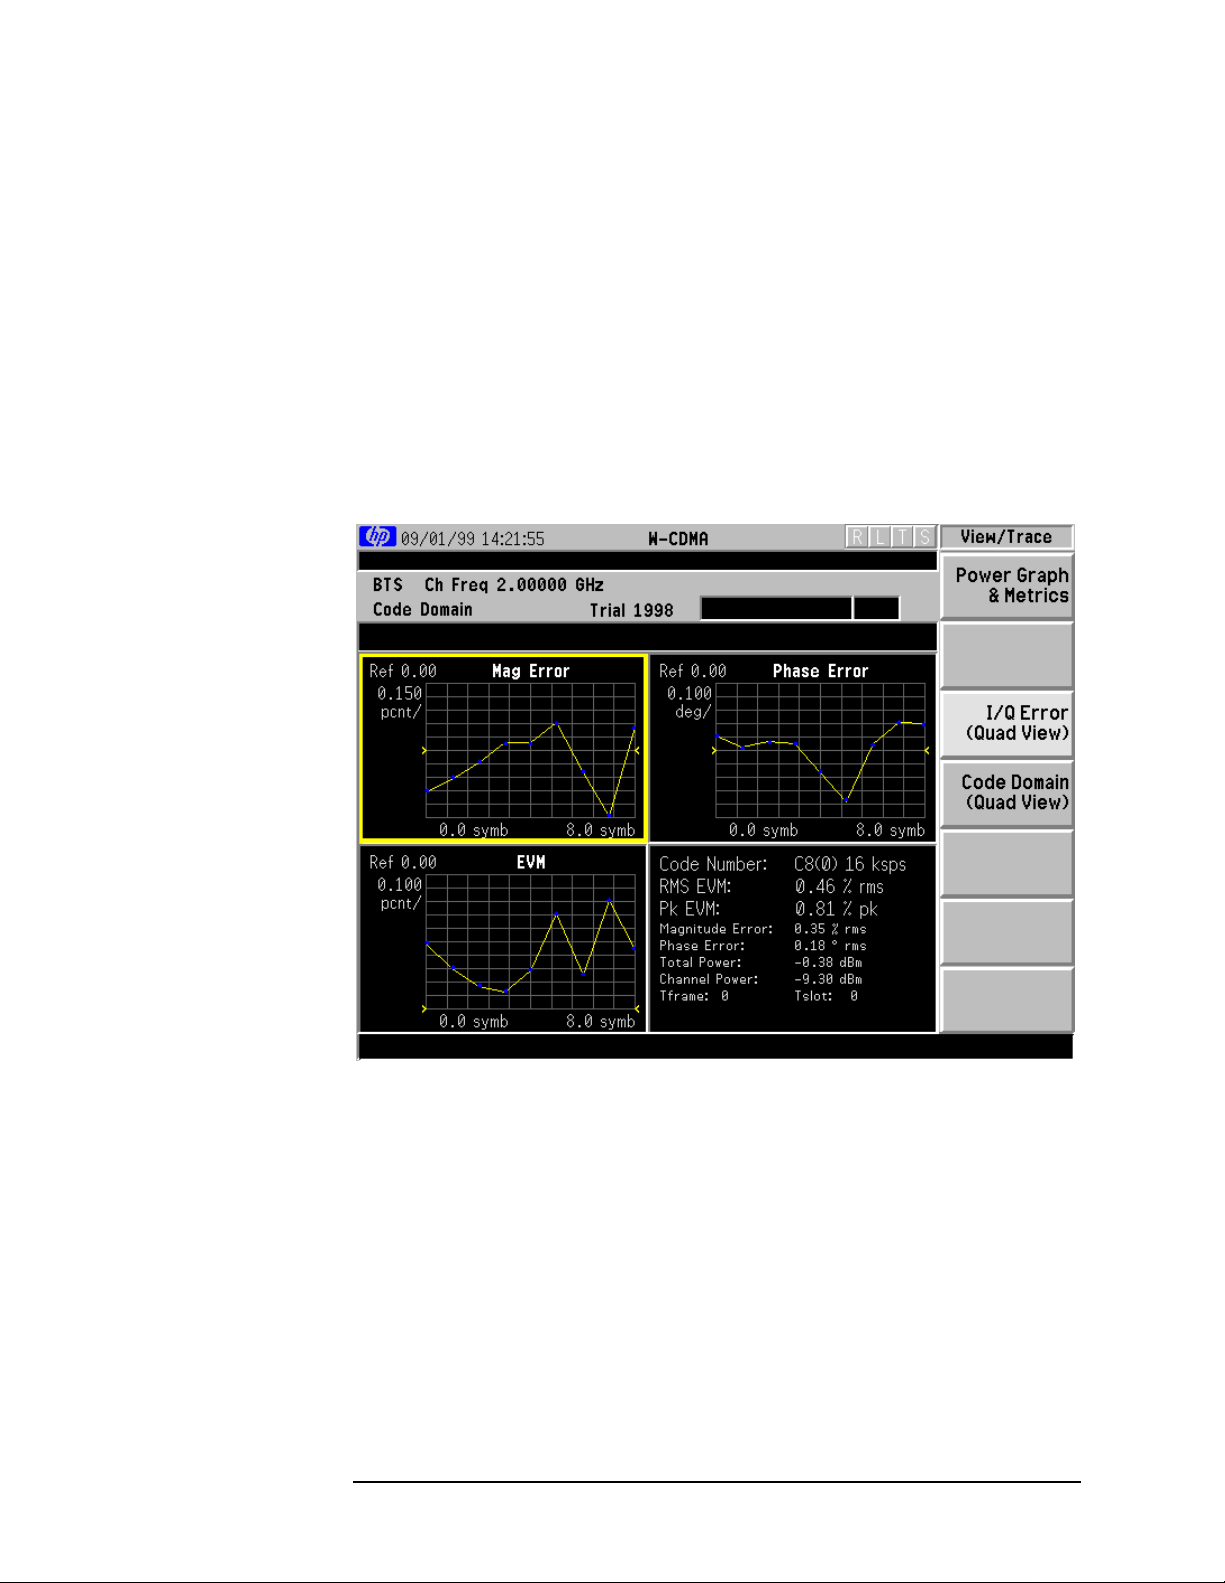
Making W-CDMA Measurements
Making the Code Domain Measurement
Changing the View
The View/Trace key will allow you to select the desired view of the
measurement from the following. Each of these views contains multiple
windows that can be selected using the
size using the
Power Graph & Metrics - Provides a combination view of the code
•
Zoom key.
domain power graph and the summary data as shown in Figure 3-5
on page 67.
•
I/Q Error (Quad View) - Provides a combination view of the magnitude
error, phase error, EVM graphs, and the summary data.
Figure 3-6 Code Domain Measurement - I/Q Error Quad View
Next Window key and made full
Chapter 3 71
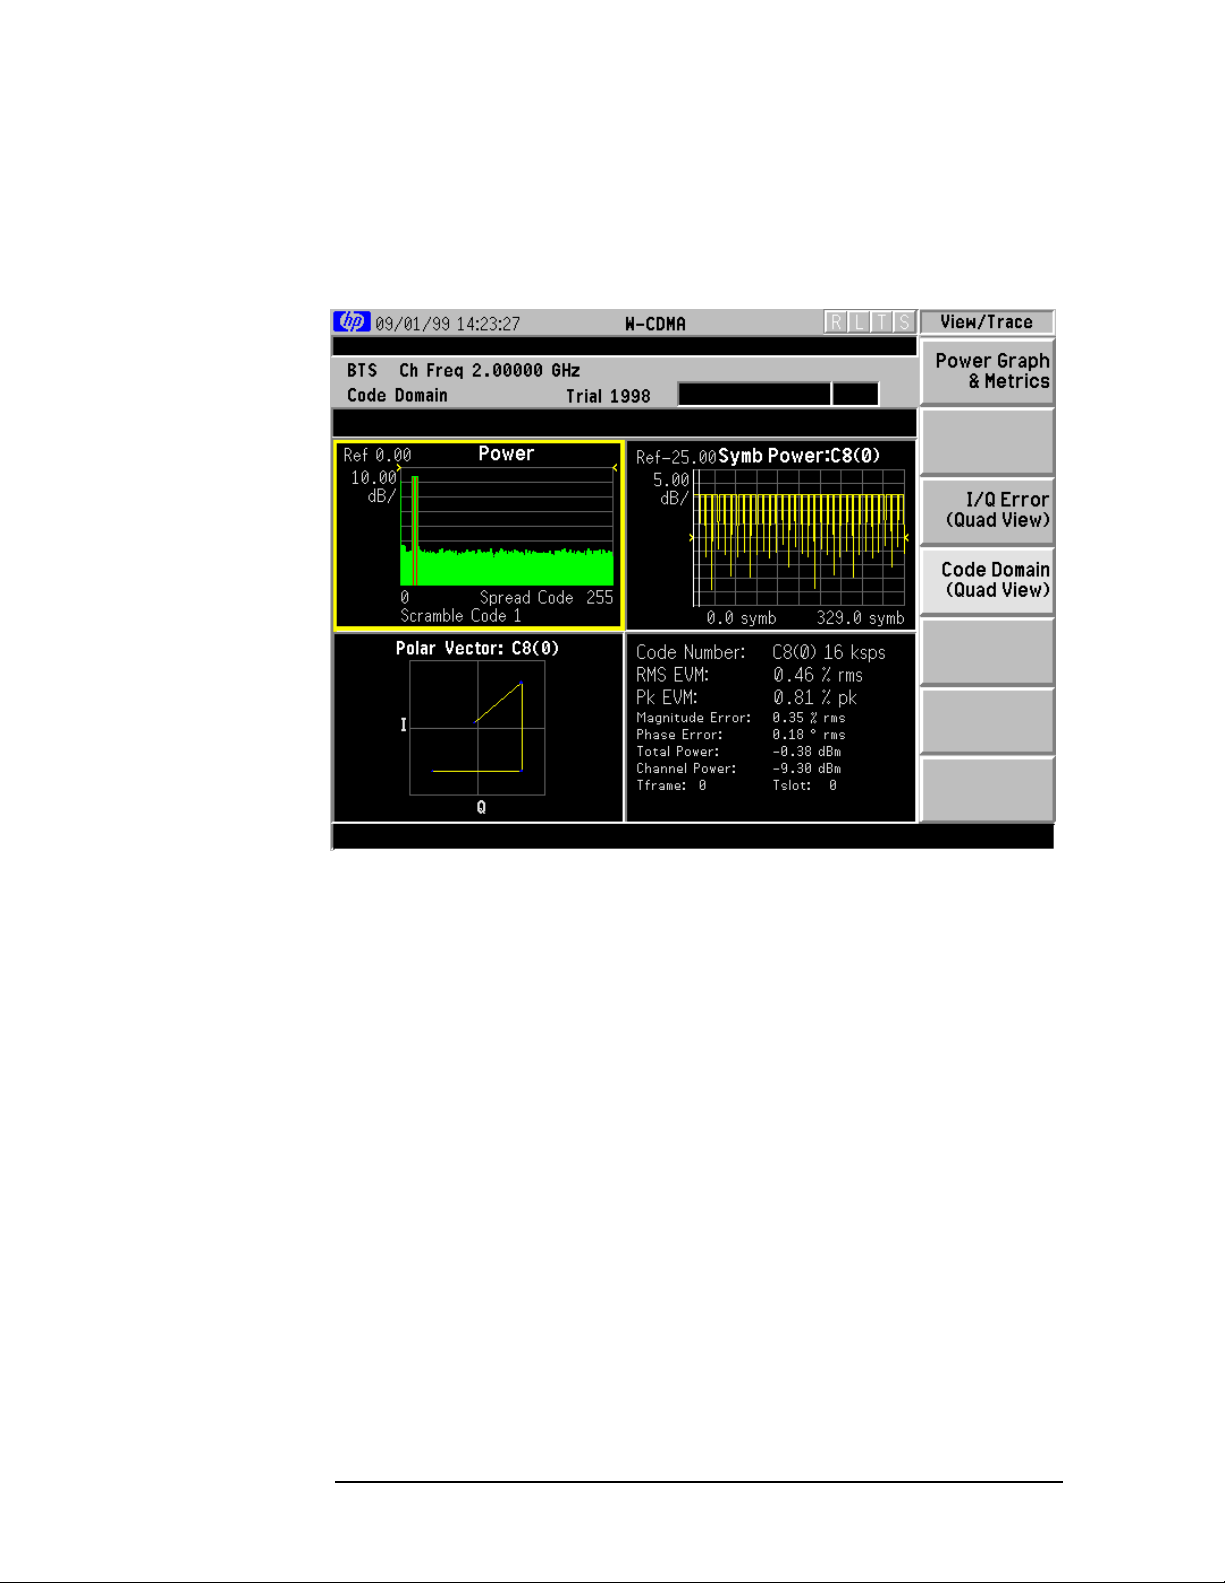
Making W-CDMA Measurements
Making the Code Domain Measurement
• Code Domain (Quad View) - Provides a combination view of the code
domain power, symbol power, symbol EVM polar vector graphs, and
the summary data.
Figure 3-7 Code Domain Measurement - Code Domain Quad View
While the Code Domain Power graph is activated, press the
Marker
key to place a marker on any active spread channel. Then, press the
Mkr->Despread key to observe the Symbol Power and the Symbol EVM
Polar Vector graphs with the spread code number for that active
channel in other graph windows. The symbol EVM polar vector
graph is displayed for the symbol power specified by the
measurement interval and measurement offset.
72 Chapter3

Making W-CDMA Measurements
Making the Code Domain Measurement
Changing the Display
The Display key is not available for the code domain measurement
because there is no meaning in phase trajectories between constellation
points for symbol EVM measurements. Therefore, the points per chip is
always set to 1 and
Chip Dots is set to On.
• While the
Power Graph & Metrics display is selected, the Span X Scale
and Amplitude Y Scale keys access the menus to allow the following
settings:
— The
Span X Scale key accesses the following menu:
Scale/Div - Allows you to set the horizontal scale by changing a
spread code value. The range is 64.00 to 256.0 (for Trial 1998),
or to 512.0 (for ARIB 1.0-1.2), spread codes with 0.01 or 0.1
spread code resolution. The default setting is 256.0 (for Trial
1998), or 512.0 (for ARIB 1.0-1.2), spread codes.
Ref Value - Allows you to set the spread code reference value.
The range is 0.000 to 192.0 (for Trial 1998), or to 448.0 (for
ARIB 1.0-1.2), spread codes with the scale at least 64 spread
codes. The default setting is 0.000 spread code.
Ref Position - Allows you to set the reference position to either
Left, Ctr (center) or Right. The default setting is Left.
Expand - Allows you to toggle the expanding function of the
code domain power graph between
On and Off. If set to On, the
CDP graph is expanded horizontally to show 64 spread codes
centered at the scale or the marker position. Upon toggling
back to
Off, the spread code range returns to the previous
setting.
— The
Amplitude Y Scale key accesses the following menu:
Scale/Div - Allows you to set the vertical scale by changing the
value per division. The range is 0.10 to 20.0 dB per division.
The default setting is 5.00 dB, however, since
defaulted to
On, this value is automatically determined by the
Scale Coupling is
measurement result.
Ref Value - Allows you to set the reference value ranging from
−250.00 to 250.00 dB. The default setting is 0.00 dB, however,
since
Scale Coupling is defaulted to On, this value is
automatically determined by the measurement results.
Ref Position - Allows you to set the reference position to either
Top, Ctr (center) or Bot (bottom). The default setting is Top.
Scale Coupling - Allows you to toggle the scale coupling
function between
On and Off. The default setting is On. This
function automatically determines the scale per division and
reference values by the measurement results.
Chapter 3 73

Making W-CDMA Measurements
Making the Code Domain Measurement
• While the I/Q Error (Quad-View) display is selected, the Span X Scale
and Amplitude Y Scale keys access the menus to allow the following
settings depending on the active window.
— If either EVM, Phase Error, or Mag Error window is active, the
Span X Scale key accesses the following menu:
Scale/Div - Allows you to set the horizontal scale by changing a
symbol value per division. The range is 1.00 to 100.00 symbols
per division with 0.01 symbol resolution. The default setting is
1.900 symbols, however, since
On, this value is automatically determined by the
Scale Coupling is defaulted to
measurement result.
Ref Value - Allows you to set the symbol reference value
ranging from 0.00 to 1000.0 symbols. The default setting is
0.00 symbol, however, since
Scale Coupling is defaulted to On,
this value is automatically determined by the measurement
results.
Ref Position - Allows you to set the reference position to either
Left, Ctr (center) or Right. The default setting is Left.
Scale Coupling - Allows you to toggle the scale coupling
function between
On and Off. The default setting is On. This
function automatically determines the scale per division and
reference values by the measurement results.
— If either EVM or Mag Error window is active, the
Amplitude Y Scale
key accesses the following menu:
Scale/Div - Allows you to set the vertical scale by changing the
value per division. The range is 0.100 to 50.0% per division.
The default setting is 5.00%, however, since
defaulted to
On, this value is automatically determined by the
Scale Coupling is
measurement result.
Ref Value - Allows you to set the reference value ranging from
−500.00 to 500.0%. The default setting is 0.00%, however, since
Scale Coupling is defaulted to On, this value is automatically
determined by the measurement results.
Ref Position - Allows you to set the reference position to either
Top, Ctr (center) or Bot (bottom). For the EVM graph, the default
setting is
Ctr.
Bot. For the Mag Error graph, the default setting is
Scale Coupling - Allows you to toggle the scale coupling
function between
On and Off. The default setting is On. This
function automatically determines the scale per division and
reference values by the measurement results.
74 Chapter3

Making W-CDMA Measurements
Making the Code Domain Measurement
— If the Phase Error window is active, the Amplitude Y Scale key
accesses the following menu:
Scale/Div - Allows you to set the vertical scale by changing the
value per division. The range is 0.0100 to 3600.0 degrees. The
default setting is 5.00 degrees,however, since
defaulted to
On, this value is automatically determined by the
Scale Coupling is
measurement result.
Ref Value - Allows you to set the reference value ranging from
−36000.0 to 36000.0 degrees. The default setting is 0.00
degrees, however, since
Scale Coupling is defaulted to On, this
value is automatically determined by the measurement
results.
Ref Position - Allows you to set the reference position to either
Top, Ctr (center) or Bot (bottom). The default setting is Ctr.
Scale Coupling - Allows you to toggle the scale coupling
function between
On and Off. The default setting is On. This
function automatically determines the scale per division and
reference values by the measurement results.
• While the
Scale and Amplitude Y Scale keys access the menus to allow the
Code Domain (Quad-View) display is selected, the Span X
following settings depending on the active window.
— If the Code Domain Power window is active, the
Span X Scale key
accesses the following menu:
Scale/Div - Allows you to set the horizontal scale by changing a
spread code value. The range is 64.00 to 256.0 (for Trial 1998),
or to 512.0 (for ARIB 1.0-1.2), spread codes with 0.01 or 0.1
spread code resolution. The default setting is 256.0 (for Trial
1998), or 512.0 (for ARIB 1.0-1.2), spread codes.
Ref Value - Allows you to set the spread code reference value.
The range is 0.000 to 192.0 (for Trial 1998), or to 448.0 (for
ARIB 1.0-1.2), spread codes with the scale at least 64 spread
codes. The default setting is 0.000 spread code.
Ref Position - Allows you to set the reference position to either
Left, Ctr (center) or Right. The default setting is Left.
Expand - Allows you to toggle the expanding function of the
code domain power graph between
On and Off. If set to On, the
CDP graph is expanded horizontally to show 64 spread codes
centered at the scale or the marker position. Upon toggling
back to
Off, the spread code range returns to the previous
setting.
Chapter 3 75

Making W-CDMA Measurements
Making the Code Domain Measurement
—IfSymbol Power window is active, the Span X Scale key accesses
the following menu:
Scale/Div - Allows you to set the horizontal scale by changing a
symbol value per division. The range is 1.000 to 100.0 symbols
per division with 0.01 symbol resolution. The default setting is
11.90 symbols, however, since
On, this value is automatically determined by the
Scale Coupling is defaulted to
measurement result.
Ref Value - Allows you to set the symbol reference value
ranging from 0.000 to 1000.0 symbols. The default setting is
0.000 symbol, however, since
Scale Coupling is defaulted to On,
this value is automatically determined by the measurement
results.
Ref Position - Allows you to set the reference position to either
Left, Ctr (center) or Right. The default setting is Left.
Scale Coupling - Allows you to toggle the scale coupling
function between
On and Off. The default setting is On. This
function automatically determines the scale per division and
reference values by the measurement results.
—IfCode Domain Power window is active, the
Amplitude Y Scale key
accesses the following menu:
Scale/Div - Allows you to set the vertical scale by changing the
value per division. The range is 0.10 to 20.0 dB per division.
The default setting is 5.00 dB, however, since
defaulted to
On, this value is automatically determined by the
Scale Coupling is
measurement result.
Ref Value - Allows you to set the reference value ranging from
−250.00 to 250.00 dB. The default setting is 0.00 dB, however,
since
Scale Coupling is defaulted to On, this value is
automatically determined by the measurement results.
Ref Position - Allows you to set the reference position to either
Top, Ctr (center) or Bot (bottom). The default setting is Top.
Scale Coupling - Allows you to toggle the scale coupling
function between
On and Off. The default setting is On. This
function automatically determines the scale per division and
reference values by the measurement results.
— If the Symbol Power window is active, the
Amplitude Y Scale key
accesses the following menu:
Scale/Div - Allows you to set the vertical scale by changing the
value per division. The range is 0.10 to 20.00 dB. The default
setting is 5.00 dB, however, since
On, this value is automatically determined by the
Scale Coupling is defaulted to
measurement result.
76 Chapter3

Making W-CDMA Measurements
Making the Code Domain Measurement
Ref Value - Allows you to set the reference value ranging from
−250.00 to 250.00 dB. The default setting is 0.00 dB, however,
since
Scale Coupling is defaulted to On, this value is
automatically determined by the measurement results.
Ref Position - Allows you to set the reference position to either
Top, Ctr (center) or Bot (bottom). The default setting is Ctr.
Scale Coupling - Allows you to toggle the scale coupling
function between
On and Off. The default setting is On. This
function automatically determines the scale per division and
reference values by the measurement results.
Using the Markers
The Marker front-panel key accesses the menu to configure the markers
depending on the display selected.
•
Select - Allows you to activate up to four markers with the
corresponding numbers, respectively. The selected number is
underlined and its function is defined by pressing the
The default setting is 1.
Function key.
• Normal - Allows you to activate the selected marker to read the
power level and symbol code with the code layer of the marker
position, for example, which is controlled by the RPG knob.
•
Delta - Allows you to read the differences in the power levels and
symbols codes between the selected marker and the next.
• Function - Allows you to set the selected marker function to Band
Power, Noise, or Off. The default setting is Off. The Band Power and
Noise functions are not available for this measurement.
Trace - Allows you to place the selected marker on the Code Domain
•
Power, Symbol Power, EVM, Phase Error, or Mag Error trace. The
default setting is
Off - Allows you to turn off the selected marker.
•
Shape - Allows you to access the menu to set the selected marker
•
shape to
Diamond.
Marker All Off - Allows you to turn off all of the markers.
•
Mkr−>Despread - While a maker is set on any active spread channel
•
Diamond, Line, Square, or Cross. The default setting is
of the code domain power graph in
Code Domain Power.
Code Domain (Quad View), allows
you to observe the Symbol Power and the Symbol EVM Polar
Vector graphs with the spread code number for that active channel
in other graph windows. The symbol EVM polar vector graph is
displayed for the symbol power specified by the measurement
interval and measurement offset.
Chapter 3 77

Making W-CDMA Measurements
Making the Code Domain Measurement
Troubleshooting Hints
Uncorrelated interference may cause CW interference like local
oscillator feedthrough or spurs. Another uncorrelated noise may be due
to I/Q modulation impairments. Correlated impairments can be due to
the phase noise on the local oscillator in the upconverter or I/Q
modulator of the UUT. These will be analyzed by the code domain
measurements along with the QPSK EVM measurements and others.
A poor phase error indicates a problem at the I/Q baseband generator,
filters, and/or modulator in the transmitter circuitry of the UUT. The
output amplifier in the transmitter can also create distortion that
causes unacceptably high phase error. In a real system, a poor phase
error will reduce the ability of a receiver to correctly demodulate the
received signal, especially in marginal signal conditions.
78 Chapter3

Making W-CDMA Measurements
Making the QPSK EVM Measurement
Making the QPSK EVM Measurement
Purpose
Phase and frequency errors are measures of modulation quality for the
W-CDMA system. This modulation quality is obtained through QPSK
Error Vector Magnitude (EVM) measurements. Since the W-CDMA
system uses the Quadrature Phase Shift Keying (QPSK) modulation
technique, the phase and frequency accuracies of the transmitter are
critical to the communications system performance and ultimately
affect range.
W-CDMA receivers rely on the phase and frequency quality of the
QPSK modulation signal in order to achieve the expected carrier to
noise ratio. A transmitter with high phase and frequency errors will
often still be able to support phone calls during a functional test.
However, it will tend to provide difficulty for mobiles trying to maintain
service at the edge of the cell with low signal levels or under difficult
fading and Doppler conditions.
Measurement Method
The phase error of the unit under test is measured by computing the
difference between the phase of the transmitted signal and the phase of
a theoretically perfect signal.
The instrument samples the transmitter output in order to capture the
actual phase trajectory. This is then demodulated and the ideal phase
trajectory is mathematically derived using detected bits and root-raised
cosine channel filtering. Subtracting one from the other results in a
phase error signal.
This measurement allows you to display these errors numerically and
graphically on the instrument display. There are graphs for EVM, Phase
Error and Mag Error in the graph windows. In the text window, there
are both maximum and average data for Evm: in % rms, in % peak, RMS
Mag Error: in %, Phase Error: in degrees, Freq Error: in Hz, and IQ
Offset: in dB.
Chapter 3 79

Making W-CDMA Measurements
Making the QPSK EVM Measurement
Making the Measurement
NOTE The factory default settings provide a good starting point. For special
requirements, you may need to change some of the settings. Press
Setup, More (1 of 2), Restore Meas Defaults at any time to return all
parameters for the current measurement to their default settings.
Select the desired center frequency as described in “Changing the
Frequency Channel” on page 17.
Meas
Press
Measure, QPSK EVM to immediately make a QPSK error vector
magnitude (EVM) measurement.
Tochange any of the measurement parameters from the factory default
values, refer to “Changing the Measurement Setup” on page 81.
Results
The next figure shows an example result of I/Q Measured Polar
Vector for the QPSK EVM measurements in the graph window. The
measured values for EVM and other parameters are shown in the text
window.
Figure 3-8 QPSK EVM Measurement - Polar Vector View
80 Chapter3

Making the QPSK EVM Measurement
Changing the Measurement Setup
The next table shows the factory default settings for QPSK EVM
measurements.
Table 3-5 QPSK EVM Measurement Defaults
Measurement Parameter Factory Default Condition
View/Trace I/Q Measured Polar Vector
Meas Setup:
Avg Number 10, On
Avg Mode Repeat
Meas Interval 256 chips
Trig Source Free Run (Immediate)
Advanced
Alpha 0.220
Making W-CDMA Measurements
Chip Rate:
for ARIB & Trial 1998
for 3GPP
Make sure the
QPSK EVM measurement is selected under the Measure
4.09600 MHz
3.84000 MHz
menu. Press the Meas Setup key to access the menu which allows you to
modify the average number, average mode, and trigger source as
described in “Measurement Setup” on page 43. In addition, the
following QPSK error vector magnitude measurement parameters can
be modified.
•
Meas Interval - Allows you to set the time interval over which the
measurement is made. The range is 128 to 512 chips.
• Advanced - Allows you to access the menu to change the following
parameters:
Alpha - Allows you to change the alpha value of the root-raised
cosine filter. The range is 0.01 to 0.50.
Chip Rate - Allows you to change the chip rate. The range is
3.68640 to 4.50560 MHz for ARIB 1.0-1.2 and Trial 1998, or
3.45600 to 4.22400 MHz for 3GPP.
Chapter 3 81

Making W-CDMA Measurements
Making the QPSK EVM Measurement
Changing the View
The View/Trace key will allow you to select the desired view of the
measurement from the following:
• I/Q Measured Polar Vector - Provides a combination view of an I/Q
measured polar vector graph and the maximum and average
summary data as shown in Figure 3-8 on page 80.
•
I/Q Measured Polar Constln - Provides a combination view of an I/Q
measured polar constellation graph and the maximum and average
summary data as shown below.
Figure 3-9 QPSK EVM Measurement - Polar Constellation View
82 Chapter3

Making W-CDMA Measurements
Making the QPSK EVM Measurement
• I/Q Error (Quad-View) - Four display windows show Mag Error, Phase
Error and EVM graphs and the maximum and average EVM
summary data in the text window as shown below.
Figure 3-10 QPSK EVM Measurement - I/Q Error Quad View
Any of these windows can be selected using the
made full size using the
Zoom key.
Next Window key and
Changing the Display
The Display key accesses the menu to allow the following selections for
changing the graph displays of I/Q Measured Polar Vector, I/Q
Measured Polar Constellation and I/Q Error (Quad-View):
•
I/Q Points - Allows you to specify the number of displayed chips for
the I/Q waveforms. The range is 1 to 2560 points with the points per
chip fixed to 5, depending on the
setting is 1280 points.
• Chip Dots - Allows you to toggle the chip dot display between On and
Off. The default setting is On.
+45 Degree Rotation - Allows you to toggle the display rotation
•
function between
On and Off. If this is set to On, the I/Q polar
constellation graph is rotated by +45 degrees to see a rectangular
display. The default setting is
Meas Interval setting. The default
Off.
Chapter 3 83

Making W-CDMA Measurements
Making the QPSK EVM Measurement
When either EVM, Phase Error, or Mag Error window is active in the
I/Q Error (Quad-View) display, the Span X Scale key accesses the menu to
allow the following settings:
•
Scale/Div - Allows you to set the horizontal scale by changing a chip
value per division. The range is 1.00 to 512.00 chips per division
with 0.01 chip resolution. The default setting is 25.50 chips per
division, however, since
Scale Coupling is defaulted to On, this value
is automatically determined by the measurement result.
• Ref Value - Allows you to set the chip reference value ranging from
0.000 to 1000.0 chips. The default setting is 0.000 chip, however,
since
Scale Coupling is defaulted to On, this value is automatically
determined by the measurement results.
• Ref Position - Allows you to set the reference position to either Left,
Ctr (center) or Right. The default setting is Left.
Scale Coupling - Allows you to toggle the scale coupling function
•
between
On and Off. The default setting is On. This function
automatically determines the scale per division and reference values
by the measurement results.
When either EVM or Mag Error window is active in the
(Quad-View) display, the Amplitude Y Scale key accesses the menu to
I/Q Error
allow the following settings:
•
Scale/Div - Allows you to set the vertical scale by changing the value
per division. The range is 0.100 to 50.0% per division. The default
setting is 5.00%, however, since
Scale Coupling is defaulted to On,
this value is automatically determined by the measurement result.
• Ref Value - Allows you to set the reference value ranging from 0.00 to
500.0%. The default setting is 0.00%, however, since
Scale Coupling
is defaulted to On, this value is automatically determined by the
measurement results.
• Ref Position - Allows you to set the reference position to either Top,
Ctr (center) or Bot (bottom). For the EVM graph, the default setting is
Bot. For the Mag Error graph, the default setting is Ctr.
Scale Coupling - Allows you to toggle the scale coupling function
•
between
On and Off. The default setting is On. This function
automatically determines the scale per division and reference values
by the measurement results.
84 Chapter3

Making W-CDMA Measurements
Making the QPSK EVM Measurement
When the Phase Error window is active in the I/Q Error (Quad-View)
display, the Amplitude Y Scale key accesses the menu to allow the
following settings:
•
Scale/Div - Allows you to set the vertical scale by changing the value
per division. The range is 0.01 to 3600 degrees. The default setting is
5.00 degrees per division, however, since
to
On, this value is automatically determined by the measurement
Scale Coupling is defaulted
result.
• Ref Value - Allows you to set the reference value ranging from −36000
to 36000 degrees. The default setting is 0.00 degrees, however, since
Scale Coupling is defaulted to On, this value is automatically
determined by the measurement results.
• Ref Position - Allows you to set the reference position to either Top,
Ctr (center) or Bot (bottom). The default setting is Ctr.
Scale Coupling - Allows you to toggle the scale coupling function
•
between
On and Off. The default setting is On. This function
automatically determines the scale per division and reference values
by the measurement results.
Chapter 3 85

Making W-CDMA Measurements
Making the QPSK EVM Measurement
Using the Markers
The Marker front-panel key accesses the menu to configure the markers
depending on the display selected.
•
Select - Allows you to activate up to four markers with the
corresponding numbers, respectively. The selected number is
underlined and its function is defined by pressing the
The default setting is 1.
• Normal - Allows you to activate the selected marker to read the
magnitude or phase error and the number of chips of the marker
position on the selected trace, for example, which is controlled by the
RPG knob.
•
Delta - Allows you to read the differences in the magnitude or phase
errors and the number of chips between the selected marker and the
next.
•
Function - Allows you to set the selected marker function to Band
Power, Noise, or Off. The default setting is Off. The Band Power and
Noise functions are not available for this measurement.
Function key.
Trace - Allows you to place the selected marker on the EVM, Phase
•
Error, or Mag Error trace. The default setting is EVM.
Off - Allows you to turn off the selected marker.
•
Shape - Allows you to access the menu to set the selected marker
•
shape to
Diamond.
Marker All Off - Allows you to turn off all of the markers.
•
Diamond, Line, Square, or Cross. The default setting is
Troubleshooting Hints
A poor phase error indicates a problem at the I/Q baseband generator,
filters, and/or modulator in the transmitter circuitry of the UUT. The
output amplifier in the transmitter can also create distortion that
causes unacceptably high phase error. In a real system, a poor phase
error will reduce the ability of a receiver to correctly demodulate the
received signal, especially in marginal signal conditions.
86 Chapter3

Making W-CDMA Measurements
Making the Modulation Accuracy (Rho) Measurement
Making the Modulation Accuracy (Rho)
Measurement
Purpose
Rho is one of the key modulation quality metrics, along with EVM and
code domain power. Rho is the ratio of the correlated power in a single
coded channel to the total signal power. This is a simplified case of code
domain power since this measurement is made on a single coded
channel. This measurement takes into account all possible error
mechanisms in the entire transmission chain including baseband
filtering, I/Q modulation anomalies, filter amplitude and phase
non-linearities, and power amplifier distortions. This provides an
overall indication of the performance level of the transmitter of the
UUT.
Measurement Method
This procedure is to measure the performance of the transmitter’s
modulation circuitry when
1.0-1.2 or Trial 1998, and when Device is set to BTS.
In a digitally modulated signal, it is possible to predict, based on the
transmitted data sequence, what the ideal magnitude and phase of the
carrier should be at any time. The transmitter’s modulated signal is
compared to an ideal signal vector. The difference between these two
vectors is sampled and processed using DSP. Rho values are in the
range of 0 to 1. A value of 1 indicates perfect correlation to the reference
(high modulation quality). The W-CDMA base station modes require
that transmitters have a Rho performance of 0.912 or greater.
With the Rho measurement, the following data is provided:
• Rho - modulation quality representing the ratio of the correlated
power in a single coded channel to the total signal power
• Frequency Error - the frequency difference between the
transmitter’s actual center frequency and the frequency (or channel)
that you entered
• EVM - peak and rms Error Vector Magnitude
Standard in the Radio menu is set to ARIB
• Mag Error - rms Magnitude Error
• Phase Error - rms Phase Error
• I/Q Origin Offset
Chapter 3 87

Making W-CDMA Measurements
Making the Modulation Accuracy (Rho) Measurement
Making the Measurement
NOTE The factory default settings provide a good starting point. For special
requirements, you may need to change some of the settings. Press
Setup, More (1 of 2), Restore Meas Defaults at any time to return all
parameters for the current measurement to their default settings.
Select the desired center frequency as described in “Changing the
Frequency Channel” on page 17.
Meas
Press
Measure, Mod Accuracy (Rho) to immediately make a modulation
accuracy measurement.
Tochange any of the measurement parameters from the factory default
values, refer to “Changing the Measurement Setup” on page 89.
Results
The next figure shows an example result of I/Q Measured Polar
Vector (Full Slot) for the modulation accuracy measurements in
the graph window. The measured values for Rho, EVM, and other
parameters are shown in the text window.
Figure 3-11 Modulation Accuracy Measurement - Polar Vector View
88 Chapter3
Making W-CDMA Measurements
Making the Modulation Accuracy (Rho) Measurement
Changing the Measurement Setup
The next table shows the factory default settings for modulation
accuracy (rho) measurements.
Table 3-6 Modulation Accuracy (Rho) Measurement Defaults
Measurement Parameter Factory Default Condition
View/Trace I/Q Measured Polar Vector
Meas Setup:
Avg Number 10, On
Avg Mode Repeat
Trig Source Free Run (Immediate)
Scramble Code 1
Spectrum Normal
Advanced
Alpha 0.220
Chip Rate 4.09600 MHz
Make sure the Mod Accuracy (Rho) measurement is selected under the
Measure menu. Press the Meas Setup key to access a menu which allows
you to modify the average number, average mode, and trigger source as
described in “Measurement Setup” on page 43. Since the rho is always
calculated from the whole Perch slot with 2304 chips excepting the
search code symbol, there is no need to set the measurement interval in
this measurement. In addition, the following modulation accuracy
measurement parameters can be modified.
•
Scramble Code - Allows you to enter a hexadecimal value for the
scramble code. Pressing this key reveals the keys labeled
Done. The range is 0000 to 3FFFF. Use the numeric keypad and
A to F and
these keys to create a hexadecimal value and terminate with the
Done key.
Spectrum - Allows you to toggle the spectrum function between
•
Normal and Invert. This key, when set to Invert, conjugates the
spectrum, which equivalently negates the quadrature component in
demodulation. The correct setting (
Normal or Invert) depends on
whether the signal being given to the transmitter tester has a high
or low side mix.
Chapter 3 89

Making W-CDMA Measurements
Making the Modulation Accuracy (Rho) Measurement
• Advanced - Allows you to access the menu to change the following
parameters:
Alpha - Allows you to change the alpha value of the root-raised
cosine filter. The range is 0.01 to 0.50.
Chip Rate - Allows you to change the chip rate ranging from
3.68640 to 4.50560 MHz.
Changing the View
The View/Trace key will allow you to select the desired measurement
view from the following selections:
•
I/Q Measured Polar Vector (Full Slot) - Provides a combination view of
an I/Q measured polar vector graph and the summary data as shown
in Figure 3-11 on page 88.
•
I/Q Measured Polar Constln (Full Slot) - Provides a combination view of
an I/Q measured polar constellation graph and the summary data as
shown below.
Figure 3-12 Modulation Accuracy Measurement - Polar Constellation View
90 Chapter3
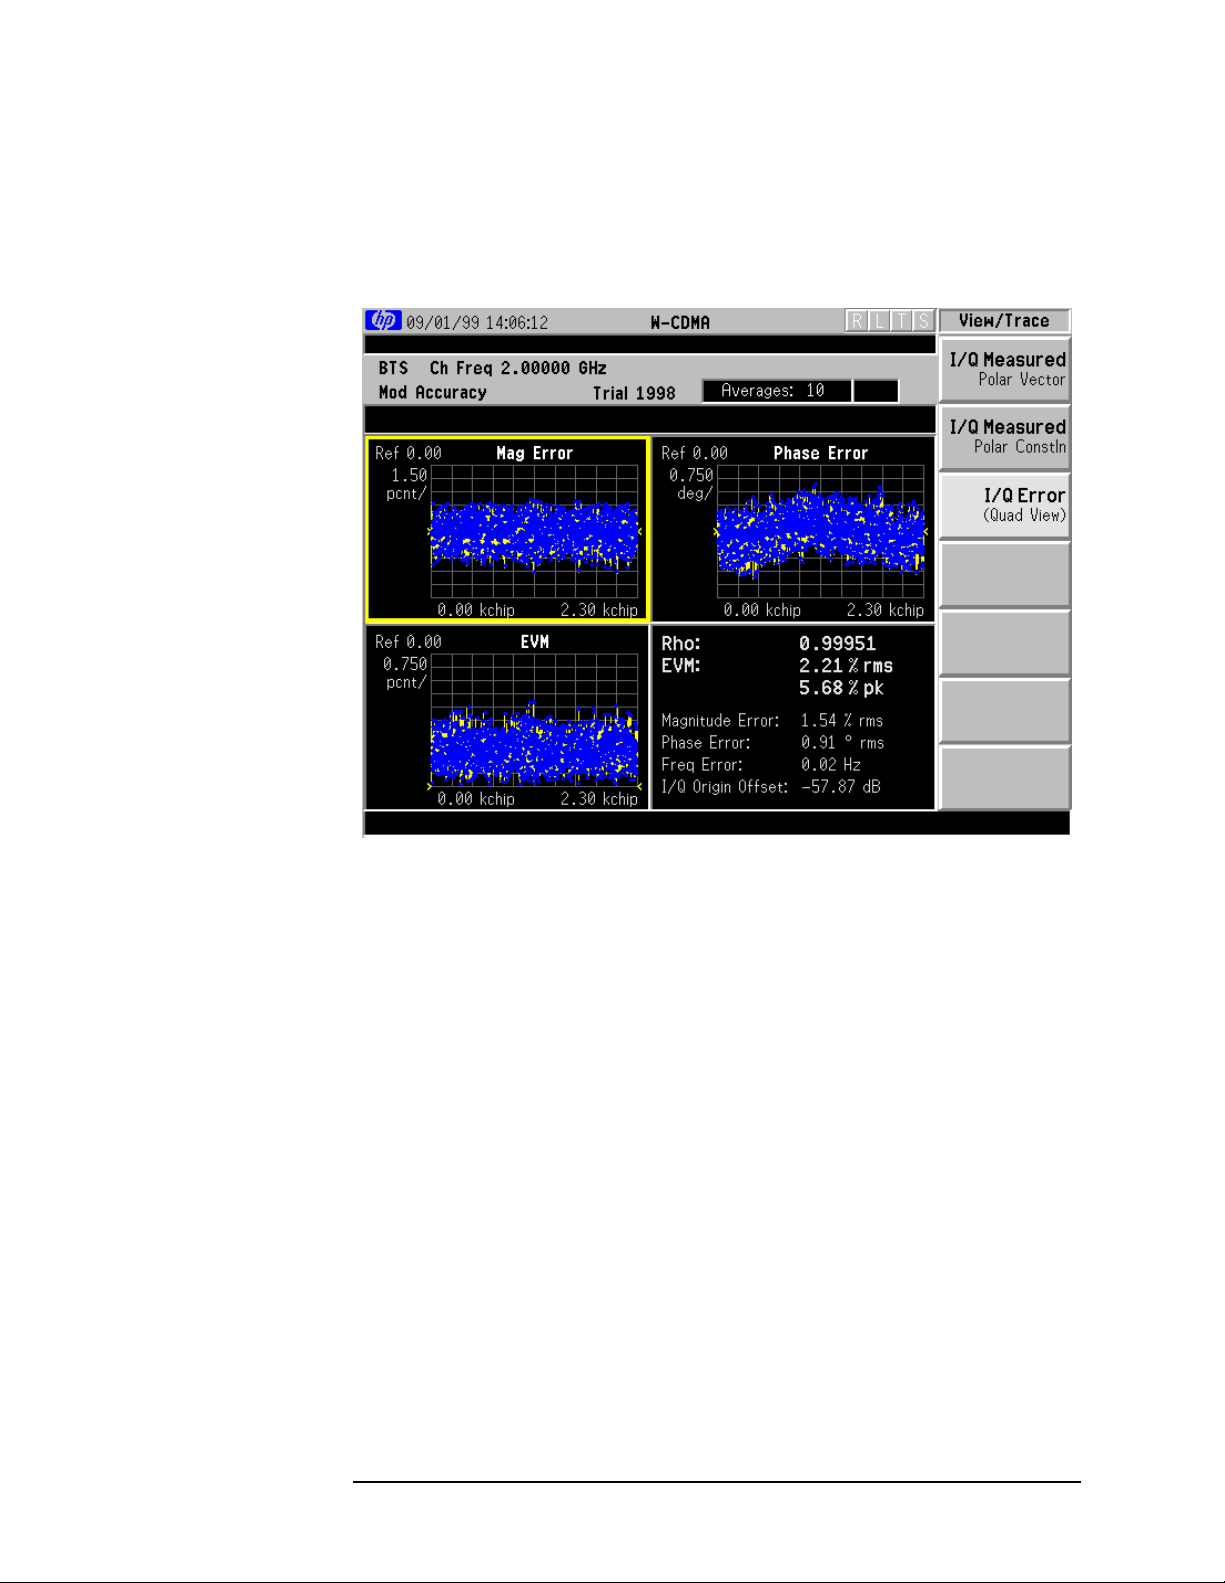
Making W-CDMA Measurements
Making the Modulation Accuracy (Rho) Measurement
• I/Q Error (Quad-View) - Four display windows show Mag Error, Phase
Error, and EVM graphs, and the modulation accuracy summary data
as shown below.
Figure 3-13 Modulation Accuracy Measurement - I/Q Error Quad View
Any one of these windows can be selected using the
and made full size using the
Zoom key.
Next Window key
Changing the Display
The Display key accesses the menu to allow the following selections for
changing the graph displays of I/Q Measured Polar Vector and I/Q
Error (Quad-View):
•
I/Q Points - Allows you to specify the number of displayed points for
the I/Q waveforms. The range is 1 to 4608 points with the points per
chip fixed to 2. The default setting is 512 points.
•
Chip Dots - Allows you to toggle the chip dot display between On and
Off. The default setting is On.
+45 Degree Rotation - Allows you to toggle the display rotation
•
function between
constellation graph is rotated by +45 degrees to see a rectangular
display. The default setting is
On and Off. If this is set to On, the I/Q polar
Off.
Chapter 3 91

Making W-CDMA Measurements
Making the Modulation Accuracy (Rho) Measurement
When either EVM, Phase Error, or Mag Error window is active in the
I/Q Error (Quad-View) display, the Span X Scale key accesses the menu to
allow the following settings:
•
Scale/Div - Allows you to set the horizontal scale by changing a chip
value per division. The range is 1.000 to 256.00 chips per division
with 0.001 chip resolution. The default setting is 230.30 chips per
division, however, since
Scale Coupling is defaulted to On, this value
is automatically determined by the measurement results.
• Ref Value - Allows you to set the chip reference value ranging from
0.000 to 2560.0 chips. The default setting is 0.000 chip, however,
since
Scale Coupling is defaulted to On, this value is automatically
determined by the measurement results.
• Ref Position - Allows you to set the reference position to either Left,
Ctr (center) or Right. The default setting is Left.
Scale Coupling - Allows you to toggle the scale coupling function
•
between
On and Off. The default setting is On. This function
automatically determines the scale per division and reference values
by the measurement results.
When either EVM or Mag Error window is active in the
(Quad-View) display, the Amplitude Y Scale key accesses the menu to
I/Q Error
allow the following settings:
•
Scale/Div - Allows you to set the vertical scale by changing the value
per division. The range is 0.100 to 50.0% per division. The default
setting is 5.00%, however, since
Scale Coupling is defaulted to On,
this value is automatically determined by the measurement result.
• Ref Value - Allows you to set the reference value ranging from 0.00 to
500.0%. The default setting is 0.00%, however, since
Scale Coupling
is defaulted to On, this value is automatically determined by the
measurement results.
• Ref Position - Allows you to set the reference position to either Top,
Ctr (center) or Bot (bottom). For the EVM graph, the default setting is
Bot. For the Mag Error graph, the default setting is Ctr.
Scale Coupling - Allows you to toggle the scale coupling function
•
between
On and Off. The default setting is On. This function
automatically determines the scale per division and reference values
by the measurement results.
92 Chapter3

Making W-CDMA Measurements
Making the Modulation Accuracy (Rho) Measurement
When the Phase Error window is active in the I/Q Error (Quad-View)
display, the Amplitude Y Scale key accesses the menu to allow the
following settings:
•
Scale/Div - Allows you to set the vertical scale by changing the value
per division. The range is 0.01 to 3600 degrees. The default setting is
5.00 degrees per division, however, since
to
On, this value is automatically determined by the measurement
Scale Coupling is defaulted
results.
• Ref Value - Allows you to set the reference value ranging from −36000
to 36000 degrees. The default setting is 0.00 degrees, however, since
Scale Coupling is defaulted to On, this value is automatically
determined by the measurement results.
• Ref Position - Allows you to set the reference position to either Top,
Ctr (center) or Bot (bottom). The default setting is Ctr.
Scale Coupling - Allows you to toggle the scale coupling function
•
between
On and Off. The default setting is On. This function
automatically determines the scale per division and reference values
by the measurement results.
Chapter 3 93

Making W-CDMA Measurements
Making the Modulation Accuracy (Rho) Measurement
Using the Markers
The Marker front-panel key accesses the menu to configure the markers
depending on the display selected.
•
Select - Allows you to activate up to four markers with the
corresponding numbers, respectively. The selected number is
underlined and its function is defined by pressing the
The default setting is 1.
• Normal - Allows you to activate the selected marker to read the
magnitude or phase error and the number of chips of the marker
position on the selected trace, for example, which is controlled by the
RPG knob.
•
Delta - Allows you to read the differences in the magnitude or phase
errors and the number of chips between the selected marker and the
next.
•
Function - Allows you to set the selected marker function to Band
Power, Noise, or Off. The default setting is Off. The Band Power and
Noise functions are not available for this measurement.
Function key.
Trace - Allows you to place the selected marker on the EVM, Phase
•
Error, or Mag Error trace. The default setting is EVM.
Off - Allows you to turn off the selected marker.
•
Shape - Allows you to access the menu to set the selected marker
•
shape to
Diamond.
Marker All Off - Allows you to turn off all of the markers.
•
Diamond, Line, Square, or Cross. The default setting is
Troubleshooting Hints
A poor phase error often indicates a problem at the I/Q baseband
generator, filters, and/or modulator in the transmitter circuitry of the
UUT. The output amplifier in the transmitter can also create distortion
that causes unacceptably high phase error. In a real system, a poor
phase error will reduce the ability of a receiver to correctly demodulate
the received signal, especially in marginal signal conditions.
94 Chapter3

Making W-CDMA Measurements
Making the Spectrum (Frequency Domain) Measurement
Making the Spectrum (Frequency Domain)
Measurement
Purpose
Excessive amounts of spectrum energy spilling into an adjacent
frequency channel could interfere with signals being transmitted to
other mobile stations or base stations.
The spectrum measurement is a generic measurement for viewing
spectrums in the frequency domain. The instrument uses Fast Fourier
Transform (FFT) to provide the spectrum measurement. The
measurement control is designed to be familiar to those who are
accustomed to using general swept frequency spectrum analyzers.
The FFT-specific parameters are located in the
98. Also available is an I/Q waveform window, which shows the I and Q
signals in parameters of voltage and time. The advantage of having an
I/Q waveform view available in spectrum measurements is that it
allows you to view complex components of the same signal without any
changing settings or measurements.
Advanced menu on page
Measurement Method
The transmitter tester uses digital signal processing (DSP) to sample
the input signal and convert it to the frequency domain. With the
instrument tuned to a fixed center frequency, samples are digitized at a
high rate, converted to I and Q components with DSP hardware, and
then converted to the frequency domain with FFT software.
Making the Measurement
NOTE The factory default settings provide a good starting point. For special
requirements, you may need to change some of the settings. Press
Setup, More (1 of 2), Restore Meas Defaults at any time to return all
parameters for the current measurement to their default settings.
Meas
Press
(frequency domain) measurement.
Tochange any of the measurement parameters from the factory default
values, refer to “Changing the Measurement Setup” on page 97 for this
measurement.
Chapter 3 95
Measure, Spectrum (Freq Domain) to immediately make a spectrum
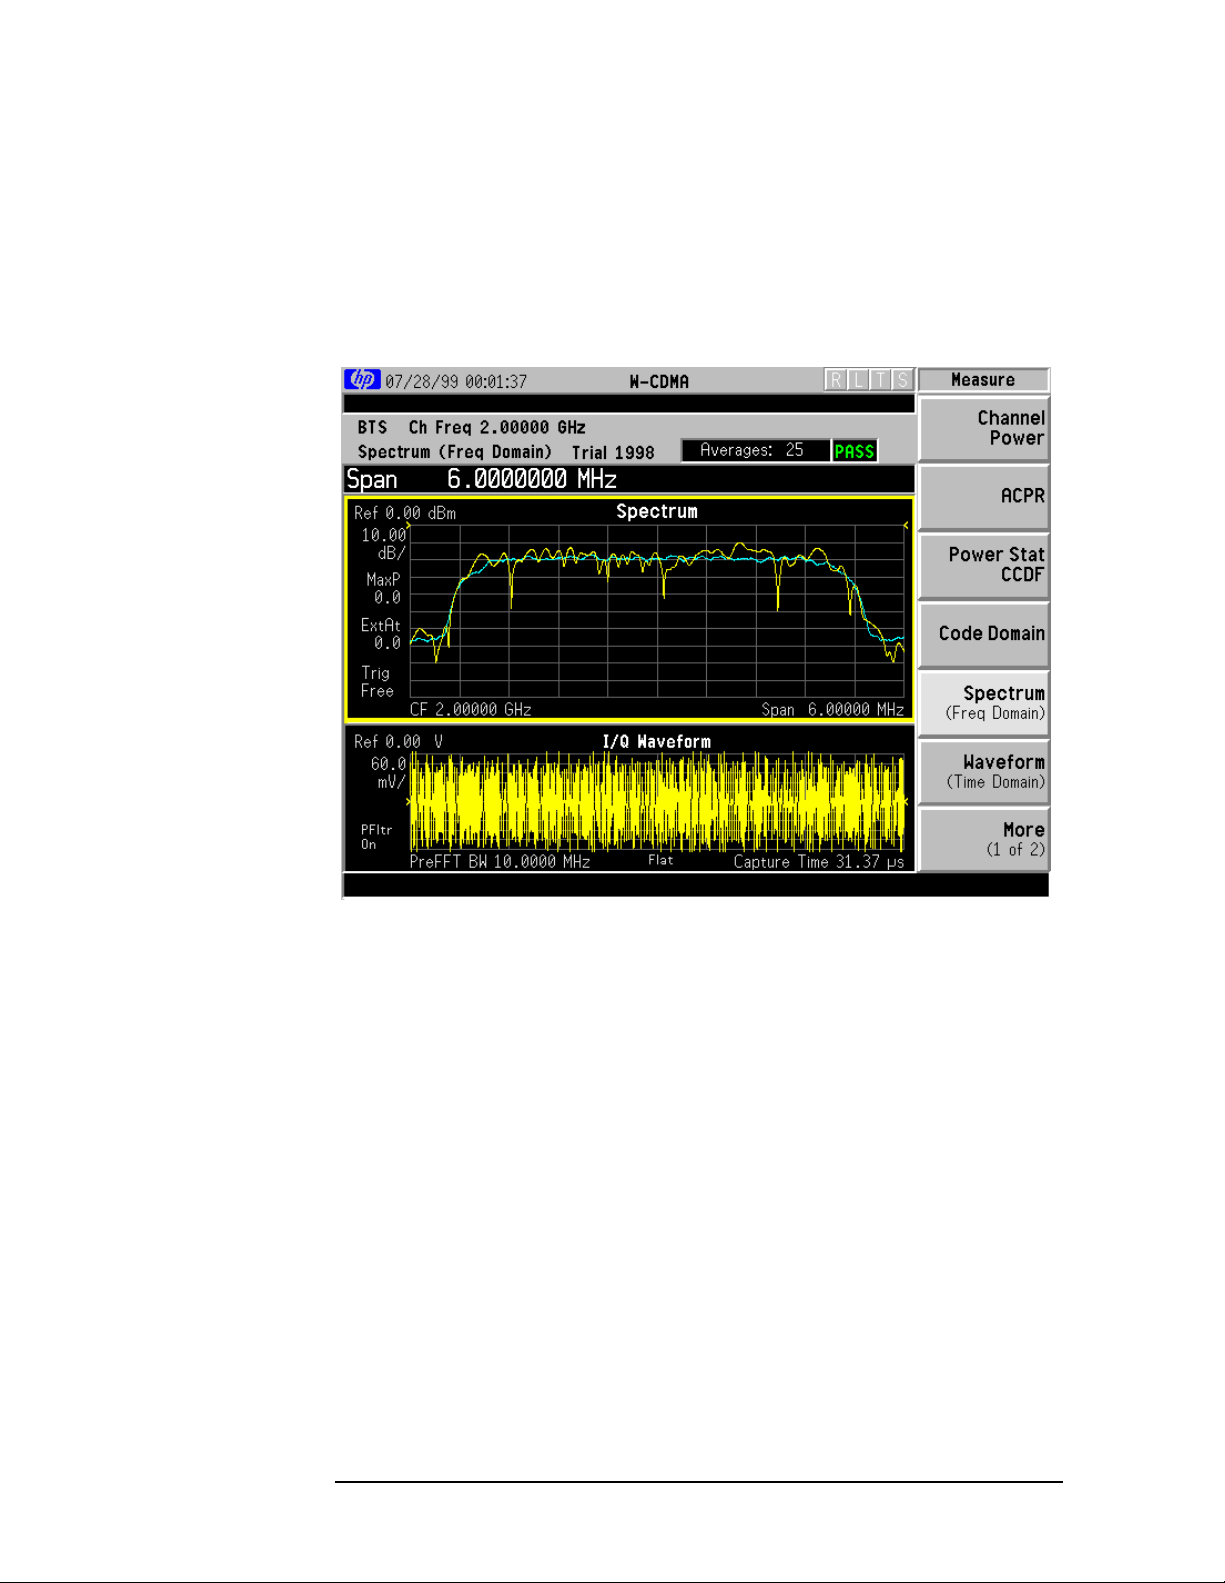
Making W-CDMA Measurements
Making the Spectrum (Frequency Domain) Measurement
Results
A display with both a Spectrum window and an I/Q Waveform window
will appear when you activate a spectrum measurement. Use the
Window key to select a window, and the Zoom key to enlarge it. Figure
3-14 shows an example of the spectrum measurement.
Figure 3-14 Spectrum Measurement - Spectrum and I/Q Waveform View
Next
96 Chapter3
Making W-CDMA Measurements
Making the Spectrum (Frequency Domain) Measurement
Changing the Measurement Setup
The next table shows the factory default settings for spectrum
(frequency domain) measurements.
Table 3-7 Spectrum (Frequency Domain) Measurement Defaults
Measurement Parameter Factory Default Condition
Meas Setup:
Res BW 20.0000 kHz, Auto
Trig Source Free Run (Immediate)
Average:
Avg Number
Avg Mode
Avg Type
Spectrum Window
Meas Setup:
Span 1.00000 MHz
25, On
Exp
Log-Pwr Avg (Video)
Amplitude Y Scale:
Scale/Div 10.00 dB
I/Q Waveform Window (major items)
Meas Setup:
Capture Time 188.00 µs
Amplitude Y Scale:
Scale/Div 60.0 mV
Advanced
Pre-ADC BPF On
Pre-FFT Fltr Flat
Pre-FFT BW 1.55000 MHz, Auto
FFT Window Flat Top (High Amptd Acc)
FFT Size:
Length Ctrl
Min Pnts/RBW
ADC Range Auto Peak
Data Packing Auto
Auto
1.300000
ADC Dither Auto
Decimation 0, Auto
IF Flatness On
Chapter 3 97

Making W-CDMA Measurements
Making the Spectrum (Frequency Domain) Measurement
NOTE Parameters under the Advanced key seldom need to be changed. Any
changes from the default advanced values may result in invalid
measurement data.
Make sure the Spectrum (Freq Domain) measurement is selected under
the
Measure menu. Press the Meas Setup key to access a menu which
allows you to modify the averaging function and trigger source for this
measurement as described in “Measurement Setup” on page 43. In
addition, the following parameters can be modified:
•
Span - Allows you to modify the frequency span in which the FFT
measurement is made. The range is 10.0 Hz to 10.0000 MHz with 1
or 10 Hz resolution. Changing the span causes the bandwidth to
change automatically, and will affect data acquisition time.
•
Res BW - Allows you to toggle the resolution bandwidth control
between
bandwidth value if set to
Auto and Man (manual), and to specify the resolution
Man. In manual, the range is 100.0 mHz to
3.00000 MHz. A narrower bandwidth will result in a longer data
acquisition time but you will be able to examine the signal more
closely. In auto, the resolution bandwidth is set to
Span/50 (2% of the
span).
• Advanced - Allows you to access the following selection menu. The
FFT advanced features should be used if you are familiar with their
operation. Changes from the default settings may result in invalid
data.
Pre-ADC BPF - Allows you to toggle the pre-ADC bandpass filter
between
On and Off. The pre-ADC bandpass filter is useful for
rejecting nearby signals, so that sensitivity within the span range
can be improved by increasing the ADC range gain.
Pre-FFT Fltr - Allows you to toggle the pre-FFT filter type between
Flat (flat top) and Gaussian. The default setting provides the best
amplitude accuracy. The Gaussian filter has better pulse
response.
Pre-FFT BW - Allows you to toggle the pre-FFT bandwidth control
between
Auto and Man. In auto, this bandwidth is nominally 50%
wider than the span. In manual, the bandwidth ranges from
1.0 Hz to 10.0000 MHz with 1 or 10 Hz resolution. This
bandwidth determines the ADC sampling rate.
FFT Window - Allows you to access the following selection menu. If
you are familiar with FFT windows, you can use other digital
filters but the use of the flat top filter is recommended.
Flat Top (High Amptd Acc) - Select this filter for best amplitude
accuracy by reducing scalloping error.
Uniform - Select this filter to have no active window.
Hanning - Press this key to activate the Hanning filter.
98 Chapter3

Making W-CDMA Measurements
Making the Spectrum (Frequency Domain) Measurement
Hamming - Press this key to activate the Hamming filter.
Gaussian (Alpha 3.5) - Press this key to activate the Gaussian
filter with an alpha of 3.5.
Blackman - Press this key to activate the Blackman filter.
Blackman-Harris - Press this key to activate the
Blackman-Harris filter.
K-B 70dB/90dB/110dB (Kaiser-Bessel) - Allows you to select one
of the Kaiser-Bessel filters with sidelobes at −70, −90, or
−110 dB.
FFT Size - Allows you to access the following selection menu to set
the FFT size:
Length Ctrl - Allows you to toggle the FFT length and window
length controls between
Min Pnts/RBW - Allows you to set the minimum number of data
Auto and Man.
points that will be used inside the resolution bandwidth. The
range is 0.10 to 100.00 points with 0.01 or 0.1 resolution. This
key is available if
Length Ctrl is set to Auto.
Window Length - Allows you to enter the FFT window length in
the number of captured samples ranging from 8 to 1048576.
The default setting is 706. This length represents the actual
quantity of I/Q samples that are captured for the FFT
processing. This key is available if
FFT Length - Allows you to enter the FFT length in the number
Length Ctrl is set to Man.
of captured samples ranging from 8 to 1048576. The default
setting is 4096. The FFT length setting is automatically
limited to equal to or greater than the FFT window length
setting. Any amount greater than the window length is
implemented by zero-padding. This key is available if
Ctrl is set to Man.
ADC Range - Allows you to access the following selection menu to
Length
set one of the ADC ranging functions.
Auto - The ADC range is automatically set. For most FFT
spectrum measurements, the auto feature should not be
selected. An exception is when measuring a “bursty” signal, in
which case auto can maximize the time domain dynamic
range, if FFT results are less important to you than time
domain results.
Auto Peak - The ADC range is automatically set to the highest
peak signal level. Auto peak is a compromise that works well
for both CW and bursted signals.
Chapter 3 99

Making W-CDMA Measurements
Making the Spectrum (Frequency Domain) Measurement
Auto Peak Lock - The ADC range is automatically adjusted to
and held at the peak signal level, even when that peak signal
is no longer present. Auto peak lock is more stable than auto
peak for CW signals, but should not be used for “bursty”
signals.
Manual - Allows you to access the selection menu: −6 dB, 0 dB,
+6 dB, +12 dB, +18 dB, +24 dB, to set the ADC range level. Also
note that manual ranging is best for CW signals.
Data Packing - Allows you to access the following selection menu to
set one of the data packing methods.
Auto - Data is automatically packed. This is the default setting
and most recommended.
Short (16 bit) - Data is packed by every 16 bits.
Medium (24 bit) - Data is packed by every 24 bits.
Long (32 bit) - Data is packed by every 32 bits.
ADC Dither - Allows you to set the ADC dither function to Auto,On,
or
Off. When set to auto, ADC dither will be activated when a
narrow bandwidth is being measured, and deactivated when a
wide bandwidth is being measured. “ADC dither” refers to the
introduction of noise to the digitized steps of the analog-to-digital
converter; the result is an improvement in amplitude accuracy.
Use of ADC dither, however, reduces the dynamic range by
approximately 3 dB.
Decimation - Allows you to toggle the decimation function between
Auto and Man, and to enter a decimation value ranging from 0 to
1000 if set to
Man. The default setting is the preferred setting,and
the only setting that guarantees aliasing-free FFT spectrum
measurements. If you are familiar with the decimation feature
you can change the decimation value by setting to
Man, but be
aware that aliasing can result in higher values.
IF Flatness - Allows you to toggle the IF flatness feature between
On and Off. When toggled to On, the IF flatness feature causes
background amplitude corrections to be performed on the FFT
spectrum. The
Off setting is used for adjustment and
troubleshooting the transmitter tester.
100 Chapter3
 Loading...