


Measurement Guide
Agilent Technologies
ESA-E Series Spectrum Analyzers
cdmaOne Measurement Personality
This manual provides documentation for the following instruments:
ESA-E Series
E4402B (9 kHz - 3.0 GHz)
E4404B (9 kHz - 6.7 GHz)
E4405B (9 kHz - 13.2 GHz)
E4407B (9 kHz - 26.5 GHz)
Manufacturing Part Number: E4401-90136
Printed in USA
March 2000
© Copyright 2000 Agilent Technologies, Inc.

Notice
The information contained in this document is subject to change
without notice.
Agilent Technologies makesno warranty of any kind with regard to this
material, including but not limited to, the implied warranties of
merchantability and fitness for a particular purpose. Agilent
Technologies shall not be liable for errors contained herein or for
incidental or consequential damages in connection with the furnishing,
performance, or use of this material.
Warranty
This Agilent Technologies instrument product is warranted against
defects in material and workmanship for a period of three years from
date of shipment. During the warranty period, Agilent Technologies
Company will, at its option, either repair or replace products that prove
to be defective.
For warranty service or repair, this product must be returned to a
service facility designated by Agilent Technologies. Buyer shall prepay
shipping charges to Agilent Technologies and Agilent Technologies
shall pay shipping charges to return the product to Buyer. However,
Buyer shall pay all shipping charges, duties, and taxes for products
returned to Agilent Technologies from another country.
Agilent Technologies warrants that its software and firmware
designated by Agilent Technologies for use with an instrument will
execute its programming instructions when properly installed on that
instrument. Agilent Technologies does not warrant that the operation
of the instrument, or software, or firmware will be uninterrupted or
error-free.
LIMITATION OF WARRANTY
The foregoing warranty shall not apply to defects resulting from
improper or inadequate maintenance by Buyer, Buyer-supplied
software or interfacing, unauthorized modification or misuse, operation
outside of the environmental specifications for the product, or improper
site preparation or maintenance.
ii

NO OTHER WARRANTY IS EXPRESSED OR IMPLIED. AGILENT
TECHNOLOGIES SPECIFICALLY DISCLAIMS THE IMPLIED
WARRANTIES OF MERCHANTABILITY AND FITNESS FOR A
PARTICULAR PURPOSE.
EXCLUSIVE REMEDIES
THE REMEDIES PROVIDED HEREIN ARE BUYER’S SOLE AND
EXCLUSIVE REMEDIES. AGILENT TECHNOLOGIES SHALL NOT
BE LIABLE FOR ANY DIRECT,INDIRECT, SPECIAL, INCIDENTAL,
OR CONSEQUENTIAL DAMAGES, WHETHER BASED ON
CONTRACT, TORT, OR ANY OTHER LEGAL THEORY.
Where to Find the Latest Information
Documentation is updatedperiodically. For the latestinformation about
Agilent ESA Spectrum Analyzers, including firmware upgrades,
software upgrades, application information, and product information,
please visit the Internet URL listed below.
http://www.agilent.com/find/esa/
iii

Safety Information
The following safety notes are used throughout this manual.
Familiarize yourself with these notes before operating this instrument.
WARNING Warning denotes a hazard. It calls attention to a procedure
which, if not correctly performed or adhered to, could result in
injury or loss of life. Do not proceed beyond a warning note
until the indicated conditions are fully understood and met.
CAUTION Caution denotes a hazard. It calls attention to a procedure that, if not
correctly performed or adhered to, could result in damage to or
destruction of the instrument. Do not proceed beyond a caution sign
until the indicated conditions are fully understood and met.
WARNING This is a Safety Class 1 Product (provided with a protective
earth ground incorporated in the power cord). The mains plug
shall be inserted only in a socket outlet provided with a
protected earth contact. Any interruption of the protective
conductor inside or outside of the product is likely to make the
product dangerous. Intentional interruption is prohibited.
WARNING No operator serviceable parts inside. Refer servicing to
qualified personnel. To prevent electrical shock do not remove
covers.
CAUTION Always use the three-prong AC power cord supplied with this product.
Failure to ensure adequate grounding may cause product damage.
iv

Contents
1. cdmaOne Use Model
Use Model . . . . . . . . . . . . . . . . . . . . . . . . . . . . . . . . . . . . . . . . . . . . . . . . . . . . . . . . . . . . . . . . .1-2
Measurement Overview . . . . . . . . . . . . . . . . . . . . . . . . . . . . . . . . . . . . . . . . . . . . . . . . . . . . . .1-3
The Fault Finding Process . . . . . . . . . . . . . . . . . . . . . . . . . . . . . . . . . . . . . . . . . . . . . . . . . . . .1-4
Identifying Interfering Signals . . . . . . . . . . . . . . . . . . . . . . . . . . . . . . . . . . . . . . . . . . . . . . . . .1-6
Examples of Interference Signals . . . . . . . . . . . . . . . . . . . . . . . . . . . . . . . . . . . . . . . . . . . . .1-8
2. Preparing to Make cdmaOne Measurements
cdmaOne Measurements . . . . . . . . . . . . . . . . . . . . . . . . . . . . . . . . . . . . . . . . . . . . . . . . . . . . . .2-2
Basic Key Use. . . . . . . . . . . . . . . . . . . . . . . . . . . . . . . . . . . . . . . . . . . . . . . . . . . . . . . . . . . . . . .2-3
3. Making Basic cdmaOne Base Station Measurements
Available Basic cdmaOne Measurements. . . . . . . . . . . . . . . . . . . . . . . . . . . . . . . . . . . . . . . . .3-2
Making the Channel Power Measurement. . . . . . . . . . . . . . . . . . . . . . . . . . . . . . . . . . . . . . . .3-3
Purpose . . . . . . . . . . . . . . . . . . . . . . . . . . . . . . . . . . . . . . . . . . . . . . . . . . . . . . . . . . . . . . . . . .3-3
Measurement Method. . . . . . . . . . . . . . . . . . . . . . . . . . . . . . . . . . . . . . . . . . . . . . . . . . . . . . .3-3
Measurement Hints . . . . . . . . . . . . . . . . . . . . . . . . . . . . . . . . . . . . . . . . . . . . . . . . . . . . . . . .3-3
Making the Measurement . . . . . . . . . . . . . . . . . . . . . . . . . . . . . . . . . . . . . . . . . . . . . . . . . . .3-4
Results. . . . . . . . . . . . . . . . . . . . . . . . . . . . . . . . . . . . . . . . . . . . . . . . . . . . . . . . . . . . . . . . . . .3-7
Troubleshooting Hints . . . . . . . . . . . . . . . . . . . . . . . . . . . . . . . . . . . . . . . . . . . . . . . . . . . . . .3-8
Making the Receive Channel Power Measurement . . . . . . . . . . . . . . . . . . . . . . . . . . . . . . . . .3-9
Purpose . . . . . . . . . . . . . . . . . . . . . . . . . . . . . . . . . . . . . . . . . . . . . . . . . . . . . . . . . . . . . . . . . .3-9
Measurement Method. . . . . . . . . . . . . . . . . . . . . . . . . . . . . . . . . . . . . . . . . . . . . . . . . . . . . . .3-9
Measurement Hints . . . . . . . . . . . . . . . . . . . . . . . . . . . . . . . . . . . . . . . . . . . . . . . . . . . . . . . .3-9
Making the Measurement . . . . . . . . . . . . . . . . . . . . . . . . . . . . . . . . . . . . . . . . . . . . . . . . . .3-10
Results. . . . . . . . . . . . . . . . . . . . . . . . . . . . . . . . . . . . . . . . . . . . . . . . . . . . . . . . . . . . . . . . . .3-13
Troubleshooting Hint . . . . . . . . . . . . . . . . . . . . . . . . . . . . . . . . . . . . . . . . . . . . . . . . . . . . . .3-14
Making the Monitor Band/Channel Measurement . . . . . . . . . . . . . . . . . . . . . . . . . . . . . . . .3-15
Purpose . . . . . . . . . . . . . . . . . . . . . . . . . . . . . . . . . . . . . . . . . . . . . . . . . . . . . . . . . . . . . . . . .3-15
Measurement Method. . . . . . . . . . . . . . . . . . . . . . . . . . . . . . . . . . . . . . . . . . . . . . . . . . . . . .3-15
Measurement Hints . . . . . . . . . . . . . . . . . . . . . . . . . . . . . . . . . . . . . . . . . . . . . . . . . . . . . . .3-16
Making the Measurement . . . . . . . . . . . . . . . . . . . . . . . . . . . . . . . . . . . . . . . . . . . . . . . . . .3-16
Results. . . . . . . . . . . . . . . . . . . . . . . . . . . . . . . . . . . . . . . . . . . . . . . . . . . . . . . . . . . . . . . . . .3-18
Troubleshooting Hints . . . . . . . . . . . . . . . . . . . . . . . . . . . . . . . . . . . . . . . . . . . . . . . . . . . . .3-19
Making the Occupied Bandwidth Measurement . . . . . . . . . . . . . . . . . . . . . . . . . . . . . . . . . .3-20
Purpose . . . . . . . . . . . . . . . . . . . . . . . . . . . . . . . . . . . . . . . . . . . . . . . . . . . . . . . . . . . . . . . . .3-20
Measurement Method. . . . . . . . . . . . . . . . . . . . . . . . . . . . . . . . . . . . . . . . . . . . . . . . . . . . . .3-20
Measurement Hints . . . . . . . . . . . . . . . . . . . . . . . . . . . . . . . . . . . . . . . . . . . . . . . . . . . . . . .3-20
Making the Measurement . . . . . . . . . . . . . . . . . . . . . . . . . . . . . . . . . . . . . . . . . . . . . . . . . .3-21
Results. . . . . . . . . . . . . . . . . . . . . . . . . . . . . . . . . . . . . . . . . . . . . . . . . . . . . . . . . . . . . . . . . .3-23
Troubleshooting Hints . . . . . . . . . . . . . . . . . . . . . . . . . . . . . . . . . . . . . . . . . . . . . . . . . . . . .3-24
Making the Manual Adjacent Channel Power Ratio (ACPR) Measurement . . . . . . . . . . . .3-25
Purpose . . . . . . . . . . . . . . . . . . . . . . . . . . . . . . . . . . . . . . . . . . . . . . . . . . . . . . . . . . . . . . . . .3-25
Measurement Method. . . . . . . . . . . . . . . . . . . . . . . . . . . . . . . . . . . . . . . . . . . . . . . . . . . . . .3-25
Making the Measurement . . . . . . . . . . . . . . . . . . . . . . . . . . . . . . . . . . . . . . . . . . . . . . . . . .3-26
Results. . . . . . . . . . . . . . . . . . . . . . . . . . . . . . . . . . . . . . . . . . . . . . . . . . . . . . . . . . . . . . . . . .3-28
Troubleshooting Hint . . . . . . . . . . . . . . . . . . . . . . . . . . . . . . . . . . . . . . . . . . . . . . . . . . . . . .3-28
Making Return Loss Measurements. . . . . . . . . . . . . . . . . . . . . . . . . . . . . . . . . . . . . . . . . . . .3-29
v

Contents
Purpose . . . . . . . . . . . . . . . . . . . . . . . . . . . . . . . . . . . . . . . . . . . . . . . . . . . . . . . . . . . . . . . . 3-29
Measurement Method . . . . . . . . . . . . . . . . . . . . . . . . . . . . . . . . . . . . . . . . . . . . . . . . . . . . . 3-29
Making the measurement . . . . . . . . . . . . . . . . . . . . . . . . . . . . . . . . . . . . . . . . . . . . . . . . . . 3-29
Results . . . . . . . . . . . . . . . . . . . . . . . . . . . . . . . . . . . . . . . . . . . . . . . . . . . . . . . . . . . . . . . . . 3-32
Troubleshooting Hints . . . . . . . . . . . . . . . . . . . . . . . . . . . . . . . . . . . . . . . . . . . . . . . . . . . . . 3-32
Making Loss/Gain Measurements . . . . . . . . . . . . . . . . . . . . . . . . . . . . . . . . . . . . . . . . . . . . .3-33
Purpose . . . . . . . . . . . . . . . . . . . . . . . . . . . . . . . . . . . . . . . . . . . . . . . . . . . . . . . . . . . . . . . . . 3-33
Measurement Method . . . . . . . . . . . . . . . . . . . . . . . . . . . . . . . . . . . . . . . . . . . . . . . . . . . . . 3-33
Measurement Hints . . . . . . . . . . . . . . . . . . . . . . . . . . . . . . . . . . . . . . . . . . . . . . . . . . . . . . . 3-33
Making the measurement . . . . . . . . . . . . . . . . . . . . . . . . . . . . . . . . . . . . . . . . . . . . . . . . . . 3-33
Results . . . . . . . . . . . . . . . . . . . . . . . . . . . . . . . . . . . . . . . . . . . . . . . . . . . . . . . . . . . . . . . . . 3-36
Troubleshooting Hints . . . . . . . . . . . . . . . . . . . . . . . . . . . . . . . . . . . . . . . . . . . . . . . . . . . . . 3-36
4. Making Advanced cdmaOne Base Station Measurements
Available Advanced cdmaOne Measurements. . . . . . . . . . . . . . . . . . . . . . . . . . . . . . . . . . . . . 4-2
Making the Code Domain Measurement
(Base Station Only) . . . . . . . . . . . . . . . . . . . . . . . . . . . . . . . . . . . . . . . . . . . . . . . . . . . . . . . . . . 4-3
Purpose . . . . . . . . . . . . . . . . . . . . . . . . . . . . . . . . . . . . . . . . . . . . . . . . . . . . . . . . . . . . . . . . . 4-3
Measurement Method . . . . . . . . . . . . . . . . . . . . . . . . . . . . . . . . . . . . . . . . . . . . . . . . . . . . . . 4-3
Measurement Hints . . . . . . . . . . . . . . . . . . . . . . . . . . . . . . . . . . . . . . . . . . . . . . . . . . . . . . . . 4-3
Making the Measurement . . . . . . . . . . . . . . . . . . . . . . . . . . . . . . . . . . . . . . . . . . . . . . . . . . . 4-4
Results . . . . . . . . . . . . . . . . . . . . . . . . . . . . . . . . . . . . . . . . . . . . . . . . . . . . . . . . . . . . . . . . . . 4-6
Troubleshooting Hints . . . . . . . . . . . . . . . . . . . . . . . . . . . . . . . . . . . . . . . . . . . . . . . . . . . . . . 4-7
Making the Modulation Accuracy (Rho) Measurement. . . . . . . . . . . . . . . . . . . . . . . . . . . . . . 4-8
Purpose . . . . . . . . . . . . . . . . . . . . . . . . . . . . . . . . . . . . . . . . . . . . . . . . . . . . . . . . . . . . . . . . . 4-8
Measurement Method . . . . . . . . . . . . . . . . . . . . . . . . . . . . . . . . . . . . . . . . . . . . . . . . . . . . . . 4-8
Measurement Hint. . . . . . . . . . . . . . . . . . . . . . . . . . . . . . . . . . . . . . . . . . . . . . . . . . . . . . . . .4-8
Making the Measurement . . . . . . . . . . . . . . . . . . . . . . . . . . . . . . . . . . . . . . . . . . . . . . . . . . . 4-8
Results . . . . . . . . . . . . . . . . . . . . . . . . . . . . . . . . . . . . . . . . . . . . . . . . . . . . . . . . . . . . . . . . . 4-11
Troubleshooting Hints . . . . . . . . . . . . . . . . . . . . . . . . . . . . . . . . . . . . . . . . . . . . . . . . . . . . . 4-12
Making the Spur Close (In Band Spurious) Measurement. . . . . . . . . . . . . . . . . . . . . . . . . . 4-13
Purpose . . . . . . . . . . . . . . . . . . . . . . . . . . . . . . . . . . . . . . . . . . . . . . . . . . . . . . . . . . . . . . . . 4-13
Measurement Method . . . . . . . . . . . . . . . . . . . . . . . . . . . . . . . . . . . . . . . . . . . . . . . . . . . . . 4-13
Making the Measurement . . . . . . . . . . . . . . . . . . . . . . . . . . . . . . . . . . . . . . . . . . . . . . . . . . 4-13
Results . . . . . . . . . . . . . . . . . . . . . . . . . . . . . . . . . . . . . . . . . . . . . . . . . . . . . . . . . . . . . . . . . 4-16
Troubleshooting Hint. . . . . . . . . . . . . . . . . . . . . . . . . . . . . . . . . . . . . . . . . . . . . . . . . . . . . .4-17
Making the Out of Band Spurious Measurement . . . . . . . . . . . . . . . . . . . . . . . . . . . . . . . . .4-18
Purpose . . . . . . . . . . . . . . . . . . . . . . . . . . . . . . . . . . . . . . . . . . . . . . . . . . . . . . . . . . . . . . . . 4-18
Measurement Method . . . . . . . . . . . . . . . . . . . . . . . . . . . . . . . . . . . . . . . . . . . . . . . . . . . . . 4-18
Measurement Hints . . . . . . . . . . . . . . . . . . . . . . . . . . . . . . . . . . . . . . . . . . . . . . . . . . . . . . . 4-18
Making the Measurement . . . . . . . . . . . . . . . . . . . . . . . . . . . . . . . . . . . . . . . . . . . . . . . . . . 4-19
Results . . . . . . . . . . . . . . . . . . . . . . . . . . . . . . . . . . . . . . . . . . . . . . . . . . . . . . . . . . . . . . . . . 4-21
Troubleshooting Hints . . . . . . . . . . . . . . . . . . . . . . . . . . . . . . . . . . . . . . . . . . . . . . . . . . . . . 4-22
Making the Receiver Spurious (Rx Spur) Measurement. . . . . . . . . . . . . . . . . . . . . . . . . . . . 4-23
Purpose . . . . . . . . . . . . . . . . . . . . . . . . . . . . . . . . . . . . . . . . . . . . . . . . . . . . . . . . . . . . . . . . 4-23
Measurement Method . . . . . . . . . . . . . . . . . . . . . . . . . . . . . . . . . . . . . . . . . . . . . . . . . . . . . 4-23
Measurement Hints . . . . . . . . . . . . . . . . . . . . . . . . . . . . . . . . . . . . . . . . . . . . . . . . . . . . . . . 4-24
Making the Measurement . . . . . . . . . . . . . . . . . . . . . . . . . . . . . . . . . . . . . . . . . . . . . . . . . . 4-24
Results . . . . . . . . . . . . . . . . . . . . . . . . . . . . . . . . . . . . . . . . . . . . . . . . . . . . . . . . . . . . . . . . . 4-27
vi

Contents
Troubleshooting Hints . . . . . . . . . . . . . . . . . . . . . . . . . . . . . . . . . . . . . . . . . . . . . . . . . . . . .4-28
Making the Spurs at Harmonics Measurement . . . . . . . . . . . . . . . . . . . . . . . . . . . . . . . . . . .4-29
Purpose . . . . . . . . . . . . . . . . . . . . . . . . . . . . . . . . . . . . . . . . . . . . . . . . . . . . . . . . . . . . . . . . .4-29
Measurement Method. . . . . . . . . . . . . . . . . . . . . . . . . . . . . . . . . . . . . . . . . . . . . . . . . . . . . .4-29
Measurement Hints . . . . . . . . . . . . . . . . . . . . . . . . . . . . . . . . . . . . . . . . . . . . . . . . . . . . . . .4-29
Making the Measurement . . . . . . . . . . . . . . . . . . . . . . . . . . . . . . . . . . . . . . . . . . . . . . . . . .4-30
Results. . . . . . . . . . . . . . . . . . . . . . . . . . . . . . . . . . . . . . . . . . . . . . . . . . . . . . . . . . . . . . . . . .4-31
Troubleshooting Hints . . . . . . . . . . . . . . . . . . . . . . . . . . . . . . . . . . . . . . . . . . . . . . . . . . . . .4-32
Making the Microwave Transmitter Power Measurement . . . . . . . . . . . . . . . . . . . . . . . . . .4-33
Purpose . . . . . . . . . . . . . . . . . . . . . . . . . . . . . . . . . . . . . . . . . . . . . . . . . . . . . . . . . . . . . . . . .4-33
Measurement Method. . . . . . . . . . . . . . . . . . . . . . . . . . . . . . . . . . . . . . . . . . . . . . . . . . . . . .4-33
Making the Measurement . . . . . . . . . . . . . . . . . . . . . . . . . . . . . . . . . . . . . . . . . . . . . . . . . .4-33
Results. . . . . . . . . . . . . . . . . . . . . . . . . . . . . . . . . . . . . . . . . . . . . . . . . . . . . . . . . . . . . . . . . .4-35
Troubleshooting Hints . . . . . . . . . . . . . . . . . . . . . . . . . . . . . . . . . . . . . . . . . . . . . . . . . . . . .4-35
Making a Microwave Spectrum Monitoring Measurement . . . . . . . . . . . . . . . . . . . . . . . . .4-36
Purpose . . . . . . . . . . . . . . . . . . . . . . . . . . . . . . . . . . . . . . . . . . . . . . . . . . . . . . . . . . . . . . . . .4-36
Measurement Method. . . . . . . . . . . . . . . . . . . . . . . . . . . . . . . . . . . . . . . . . . . . . . . . . . . . . .4-36
Measurement Hints . . . . . . . . . . . . . . . . . . . . . . . . . . . . . . . . . . . . . . . . . . . . . . . . . . . . . . .4-36
Making the Measurement . . . . . . . . . . . . . . . . . . . . . . . . . . . . . . . . . . . . . . . . . . . . . . . . . .4-36
Results. . . . . . . . . . . . . . . . . . . . . . . . . . . . . . . . . . . . . . . . . . . . . . . . . . . . . . . . . . . . . . . . . .4-38
Making the Microwave Adjacent Channel Power Measurement. . . . . . . . . . . . . . . . . . . . . .4-39
Purpose . . . . . . . . . . . . . . . . . . . . . . . . . . . . . . . . . . . . . . . . . . . . . . . . . . . . . . . . . . . . . . . . .4-39
Measurement Method. . . . . . . . . . . . . . . . . . . . . . . . . . . . . . . . . . . . . . . . . . . . . . . . . . . . . .4-39
Measurement Hints . . . . . . . . . . . . . . . . . . . . . . . . . . . . . . . . . . . . . . . . . . . . . . . . . . . . . . .4-39
Making the Measurement . . . . . . . . . . . . . . . . . . . . . . . . . . . . . . . . . . . . . . . . . . . . . . . . . .4-40
Results. . . . . . . . . . . . . . . . . . . . . . . . . . . . . . . . . . . . . . . . . . . . . . . . . . . . . . . . . . . . . . . . . .4-41
Troubleshooting Hints . . . . . . . . . . . . . . . . . . . . . . . . . . . . . . . . . . . . . . . . . . . . . . . . . . . . .4-41
vii

Contents
viii

1 cdmaOne Use Model
1-1

cdmaOne Use Model
Use Model
Use Model
Figure 1-1 Cellular Site Components
Wireless Digital communications systems are made up of five parts: a
central phone switching system, a microwave or landline link, a base
transceiver station (BTS), an antenna and preamplifier system, and the
air interface with the mobile device. The measurement personality is
designed to verify the satisfactory operation of the base station system
which includes the microwave link, the base transceiver station, the
antenna and preamplifier system, and the air interface with the mobile
device. The measurements in this guide are divided into chapters
according to the subsystems that each tests.
1-2 Chapter1

Measurement Overview
When troubleshooting a digital communications system, use the
following flow chart to help determine which test to perform on what
system subsection. System failures are generally defined as reduced
transceiver site coverage and capacity, or handoff errors.
Figure 1-2 Measurements and System Interrelationship
cdmaOne Use Model
Measurement Overview
Transmitter Tests
Cables &
Antenna Verification
Air Interface Quality
Microwave Link
Verification
Power Levels
Modulation Quality
Interference With Other
Systems
Amplitude Flatness
Reflection Responses
In-Channel Interference
In-Band Interference
Out-of-Band Interference
Power Levels
Spectrum Clutter
Channel Power
Receive Channel Power
Modulation Quality (Rho)
Code Domain
Occupied Bandwidth
Spurs at Harmonics
Adjacent Channel Power
Gain/Loss
Return Loss (VSWR)
Monitor Channel
Receiver Spurious
Spur Close (In Band)
Monitor Band
Out of Band Spurious
Channel Power
Spectrum Monitor
Mode=cdmaOne
Mode=SA
(Spectrum Analyzer)
Mode=cdmaOne
Mode=cdmaOne
Mode=SA
(Spectrum Analyzer)
Interference With Other
Systems
Adjacent Channel Power
Chapter 1 1-3

cdmaOne Use Model
The Fault Finding Process
The Fault Finding Process
Fourkey elements,shown in Figure 1-3, can contribute to degraded cell
performance. First, the transmitter is often described as the hardest
working component of the cell site. Linear power amplifiers generate
high power radio signals and run at high temperatures. Insufficient
heat dissipation in humid climates can cause the transmitters to
overheat, or extremes of cold can cause transmitter heat sinks to crack.
As a result, specified performance will be degraded, causing low power
transmissions, impaired modulation, and poor adjacent channel
performance.
Next, the cables and antenna are directly exposed to the elements.
Weather-damaged antennas, cables, and the connectors can further
degrade performance. Sometimes a low noise amplifier close to the
antenna is used to boost the signal or microwave radio transceivers are
used to link the cell site to the communications network. These
components are just as exposed to the same harsh environmental
conditions making them prone to failure.
When a mobile site transmits, other radio systems can interfere with
the propagated signal resulting in a degraded signal at the cell site
receiver. On the journey, interference from other radio systems can
degrade the signal. Tall buildings and hills can deflect the signal away
from the antenna and signal degradation can result.
Figure 1-3 System Degradation Sources
To help identify which component of the cell site is contributing to
performance problems, a fault finding process is needed. Essentially,
once the radio signal is modulated and transmitted, it is prone to
1-4 Chapter1

cdmaOne Use Model
The Fault Finding Process
degradation. The once perfect, error corrected, monitored digital signal,
now has all the characteristics of any analog radio signal. What you
want to do is ensure its transmission path is clear and presents no
barriers that will hinder its performance. Starting at the transmitter,
as indicated in Figure 1-4, you need to check that the correct signal is
being generated. You then need to ensure that it passes through the
various cables and connectors without degrading its quality. Once
transmitted through theantenna, a clear interference freeradio band is
required to ensure the handset receives the signal correctly. Then in
reverse, you need to verifythe receptionband isclear and the path from
the antenna to the receiver presents no obstacles to the radio receiver
equipment, which will decode the signal and convert it back into digital
data.
When troubleshooting, you need to ask ourselves a set of basic
questions. The first thing to question is the transmitter operation
where the signal originates. If this is operating satisfactorily, then you
need to determine that intermediate components are not attenuating
the signal. Finally, you need to ensure that maximum power is being
transferred into the antenna feed and array. On the receive side, you
again need to ensure that maximum power is being transferred from
the antenna to the BTS. You also need to ensure that intermediate
components do not over-attenuate the received signal.
Figure 1-4 Fault Finding Process
The flow chart in Figure 1-2 provides the basic system diagnostic
process for performing various test measurements to troubleshoot your
cell site base transceiver system.
Chapter 1 1-5

cdmaOne Use Model
Identifying Interfering Signals
Identifying Interfering Signals
To identify interfering signals, you must first locate them in the
cdmaOne frequency band. This is best done by using the Monitor Band
measurement. Sensitivity should be optimized to locate and view small
interfering signals. To optimize the spectrum analyzer for best
sensitivity when identifying interference signals, three main
parameters need to be understood: resolution bandwidth, internal
attenuation, and internal pre-amplification.
First, choose the lowest possible resolution bandwidth filter. The noise
floor decreases as resolution bandwidthdecreases. This isbecause noise
is a broadband signal, and as you reduce resolution bandwidth, less
noise reaches the detector. Sweep speed is inversely proportional to the
square of the resolution bandwidth and increases as resolution
bandwidth decreases. To optimize speed, the smallest span and largest
bandwidth possible should be used that still separate the signals and
allow visibility of all signals of interest. Using monitor channel reduces
the span by focusing on a specific channel instead of an entire band.
Second, set the internal input attenuator to the least possible amount
of attenuation, normally 0 dB. However, if the input signal total power
is greater than −10 dBm for 0 dB attenuation, the analyzer may
generate internal distortion. To determine if the analyzer is internally
generating the distorted signals seen on the display, increase the
attenuation and see if the displayed signals change in amplitude. If no
amplitude change is evident, the distortion is caused by the unit under
test and not the analyzer.
Finally, you can turn on the internal preamplifier (Option 1DS). This
will drop the noise floor and allow you to view the signals that were
previously below the analyzer noise floor.
Use this procedure and the following examples of interfering signals to
help you identify the source of interfering signals and achieve the best
sensitivity.
1-6 Chapter1

cdmaOne Use Model
Identifying Interfering Signals
Key Press Procedure Remarks
Step Front-Panel Key Menu Key
1 Measure More The Monitor Band function is used to
2 Monitor Band/Channel
3 Meas Setup Method Band
4 Band Setup
5 Res BW Man As the resolution bandwidth gets
6 ⇓ (Down Arrow)
7 Input/Output RF Input Range Man
identify low-level signals that may be
interfering in the up- and down-link
bands. The sensitivity of this
measurement is improved by reducing
the resolution bandwidth and removing
the analyzer attenuation through
Meas Setup.
smaller, the sweep time gets longer.
8 AMPLITUDE
Y Scale
9 ⇓ (Down Arrow)
10 Peak Search The marker is used to determine the
11 FREQUENCY
Channel
12 Meas Setup Method Channel The spectrum shape of the suspect signal
13 Chan Setup For very low level signals, use the
14 Int Preamp On
CAUTION Use a simple attenuator test to determine whether displayed distortion
Attenuation To achieve 0 dB attenuation, you must
enter the value using the numeric key
pad. This is a safe guard against
inadvertent front-end overload.
Channel Freq and enter
the marker frequency.
frequency of the suspected interference
signal.
can now be seen.
built-in preamplifier to amplify the input
so that the signals appear above the
noise floor of the spectrum analyzer.
components are true input signals or internally generated signals
caused by mixer overload. Press
AMPLITUDE, Attenuation, and ⇑ to
increase the attenuation. If the amplitude of the suspected signal
changes, then it is internally generated. Continue increasing the
attenuation until the displayed distortion does not change, then
complete the measurement.
Chapter 1 1-7

cdmaOne Use Model
Identifying Interfering Signals
Examples of Interference Signals
Use these signal examples to help you assess the bandwidth and
spectral shape of the interfering signalin order to determine the type of
transmission causing the interference. Use the settings in the following
examples to identify the various signals.
Using Monitor Band/Channel to Look for Interfering Signals
Using the Monitor Band and Channel feature can help you quickly
identify interfering signals within your transmission and reception
bands or channels. Simple visual inspection, peak hold, and markers
can help you determine the type of interference that may be causing
network problems.
Commercial AM/FM Broadcast Signal:
Press
Method Channel
MEASURE, More, Monitor Band/Channel, Meas Setup,
A narrow bandwidth signal within a channel could be caused by
AM/FM channels. In SA mode use the built-in AM or optional FM
(Option BAA) demod to determine the source of the transmission.
1-8 Chapter1

Commercial TV Broadcast Signal:
cdmaOne Use Model
Identifying Interfering Signals
Press
MEASURE, More, Monitor Band/Channel, Meas Setup, Method Band
An interfering TV signal can be quickly visually verified by its unique
spectral characteristics (two large carriers 4 to 6 MHz apart). In SA
mode, use TV Trigger and Picture on Screen, and FM Demodulation
(Options BAA and B7B) to determine the transmission source.
Chapter 1 1-9

cdmaOne Use Model
Identifying Interfering Signals
CDMA Signals:
Press
MEASURE, More, Monitor Band/Channel, Meas Setup, Method Band
Adjacent interfering CDMA signals will have this type of spectral
characteristic.
1-10 Chapter1

GSM/PCS Signal:
cdmaOne Use Model
Identifying Interfering Signals
Press
Chan Setup, Max Hold On
MEASURE, More, Monitor Band/Channel, Meas Setup, Method Band,
GSM/PCS networks can cause in-band interference. A GSM signal will
have this type of spectral characteristic.
Chapter 1 1-11

cdmaOne Use Model
Identifying Interfering Signals
Using Demodulation to Look for Interfering Signals
The Modulation Accuracy and Code Domain Power measurement help
you determine if an interfering signal is present within your CDMA
signal transmission bandwidth.
Modulation Accuracy (Rho) Measurement:
Press
MEASURE, Mod Accuracy (Rho), Display, Chip Dots 1
Circles in the constellation indicate an interfering signal. A normal
cdmaOne modulated signal will not have openings in the circles. This
also indicates a poor signal to noise ratio.
1-12 Chapter1

Code Domain Measurement:
cdmaOne Use Model
Identifying Interfering Signals
Press
MEASURE, Code Domain
High power in the inactive traffic channels (Avg IT) can indicate there
is an interfering signal present. Also, poor linear amplifier performance
can cause this type of effect.
Chapter 1 1-13

cdmaOne Use Model
Identifying Interfering Signals
1-14 Chapter1

2 Preparing to Make cdmaOne
Measurements
2-1

Preparing to Make cdmaOne Measurements
cdmaOne Measurements
cdmaOne Measurements
Once in the cdmaOne mode, the following measurements are available
by pressing the
❏ Channel Power on page 3-3
❏ Receive Channel Power on page 3-9
❏ Monitor Band/Channel on page 3-15
❏ Occupied Bandwidth on page 3-20
❏ Code Domain on page 4-3
❏ Modulation Accuracy (Rho) on page 4-8
❏ Spur Close on page 4-13
❏ Out of Band Spurious on page 4-18
❏ Receiver Spurious on page 4-23
MEASURE front panel key:
❏ Spurs at Harmonics on page 4-29
These are referred to as one-button measurements.When you press the
key to select the measurement it will become the active measurement,
using settings and a display unique to that measurement. Data
acquisitions will automatically begin if necessary trigger requirements
are met.
In addition, the following cdmaOne mode measurements are made
using the
Monitor measurement by pressing the MEASURE front panel
key:
❏ Return Loss on page 3-29
❏ Loss/Gain on page 3-33
In addition, the following spectrum analyzer mode measurements are
available by pressing the
Mode, SA, and MEASURE front panel keys:
❏ Manual Adjacent Channel Power Ratio (ACPR) on page 3-25
❏ Microwave Transmitter Power on page 4-33
❏ Microwave Spectrum Monitoring on page 4-36
❏ Microwave Adjacent Channel Power Ratio (ACPR) on page 4-39
2-2 Chapter2

Preparing to Make cdmaOne Measurements
Basic Key Use
Basic Key Use
The Mode key allows you choose basic Spectrum Analyzer or cdmaOne
functionality. Next, set global measurement defaults in the analyzer
based on your system using
J-STD008. When you select a standard, the analyzer will set
measurement parameters to meet the standard requirements.
The
Channel Frequency or RF Channel keys allow you tune the analyzer
to specific frequencies. You can do this by either setting absolute
frequencies or by setting the channel number when in cdmaOne mode.
You can select a number of previously-configured standards based
measurements to help you troubleshoot a system using the
button. Because all measurement situations are different, Meas Setup
allows you to quickly change some of the measurement parameters.
Finally, if you need to quickly start the measurement again, press
Restart or use Restart under Meas Control.
Mode Setup, for example, IS-95A or
Measure
Figure 2-1 Basic Keys
Chapter 2 2-3

Preparing to Make cdmaOne Measurements
Basic Key Use
2-4 Chapter2

3 Making Basic cdmaOne Base
Station Measurements
3-1

Making Basic cdmaOne Base Station Measurements
Available Basic cdmaOne Measurements
Available Basic cdmaOne Measurements
The following basic cdmaOne base transceiver station measurements
are described in this chapter:
❏ Channel Power on page 3-3
❏ Receive Channel Power on page 3-9
❏ Monitor Band/Channel on page 3-15
❏ Occupied Bandwidth on page 3-20
In addition, the following spectrum analyzer mode manual
measurements are described in this chapter to provide thorough
cdmaOne base transceiver station troubleshooting:
❏ Manual Adjacent Channel Power Ratio (ACPR) on page 3-25
❏ Return Loss on page 3-29
❏ Loss/Gain on page 3-33
3-2 Chapter3

Making Basic cdmaOne Base Station Measurements
Making the Channel Power Measurement
Making the Channel Power Measurement
Purpose
The Channel Power measurement is useful in determining if poor
signal quality is the result of low power levels generated by the
transmitter. Modulation accuracy can be reduced by having a lower
signal to noise ratio than required. The channel power should be
measured first to avoid attributing the effects of a low power level to
modulation accuracy errors.
Measurement Method
You can make the Channel Power measurement intrusively or
non-intrusively. To perform a non-intrusive test, connect a directional
coupler to the RF output with the main arm connected to the antenna
and the coupled port connected to the spectrum analyzer as shown in
Figure 3-1. Enter the loss due to the effect of the coupler as external
attenuation. You may also perform a non-intrusive test by making the
measurement at a test port on the transceiver unit, if available.
You can use the intrusive method by taking the measurement directly
from the RF output port of the transceiver shown in Figure 3-2.
Because you disconnect the antenna from the transceiver and disrupt
the transmission signal, this cannot be considered a non-intrusive test.
NOTE Use of a non-intrusive measurement is recommended.
CAUTION If you use the intrusive method, ensure that the power level at the RF
input of the spectrum analyzer does not exceed the damage level of
30 dBm.
Measurement Hints
• Use large resolution bandwidth for fast measurements, and a
narrow resolution bandwidth for increased sensitivity.
• If the channel power is near the noise floor, set Noise Correction to
Auto. Noise floor correction removes the effects of analyzer noise,
improving accuracy when necessary.
Chapter 3 3-3

Making Basic cdmaOne Base Station Measurements
Making the Channel Power Measurement
NOTE If Noise Correction and RF Input Range are both set to Auto, the internal
input attenuator and reference level will only be set one time and will
not automatically update. A change in the input signal level may
require an update of the internal input attenuator and reference level.
In that case, you will need to press
Restart to take a new measurement
and reset the input attenuator and reference level. This will invalidate
the noise floor calibration. You will then be prompted to perform
another Noise Floor Calibration or to set
Noise Correction to Off before
proceeding with the measurement.
Making the Measurement
1. Ensure that the base transceiver station is in service.
2. Connect the device being measured and the spectrum analyzer input
as shown in Figure 3-1 or Figure 3-2.
Figure 3-1 Measurement Setup
3-4 Chapter3

Making Basic cdmaOne Base Station Measurements
Figure 3-2 Alternative Measurement Setup
Making the Channel Power Measurement
3. If the mode has not already been set to cdmaOne, press
cdmaOne.
MODE and
4. Toimmediately make Channel Power the active measurement, press
MEASURE and Channel Power.
5. Select the desired center frequency by pressing
press the appropriate menu key
Temp Ctr Freq. Enter the desired channel number or frequency value
and press
or
Hz (for frequency values).
NOTE If the desired RF Channel or Channel Freq has been set for a previous
Enter (for channel numbers) or a units key–GHz, MHz, kHz,
RF Channel, Channel Freq, or
FREQUENCY, then
measurement, it is used for all subsequent measurements, and it does
not need to be set again.
Setting a temporary center frequency does not affect any other
measurement, and the measurement reverts to the Channel Frequency
on restart.
6. Set the measurement parameters to the default values by pressing
Meas Setup, More and Restore Meas Defaults.
NOTE The factory default settings provide a cdmaOne compliant
measurement. For special requirements, you may need to change some
of the settings. At any time, you can return all parameters for the
current measurement to the default settings by repeating this step.
Chapter 3 3-5

Making Basic cdmaOne Base Station Measurements
Making the Channel Power Measurement
7. If desired, set the measurement limits to On by pressing Meas Setup,
More, and Limits.
8. To change any of the measurement parameters from the factory
default values, press the Meas Setup key to access menus that allow
you to modify the parameters for this measurement. For additional
information on keys to access measurement parameters, refer to the
Front-Panel Key Reference section of the ESA-E Series Spectrum
Analyzers cdmaOne Measurement Personality User’s Guide or use
the on-screen help.
9. To save the measurement results, refer to ESA-E Series Spectrum
Analyzers cdmaOne Measurement Personality User’s Guide.
3-6 Chapter3

Making Basic cdmaOne Base Station Measurements
Making the Channel Power Measurement
Results
The channel power display shows numerical values for the channel
power and power spectral density below the trace display of the
cdmaOne signal frequency spectrum. Verify that the channel power is
correct for the cell site. If it is incorrect, proceed to the transmitter
troubleshooting and adjustments procedures.
Figure 3-3 Channel Power Measurement Results—Standard View
Figure 3-4 Channel Power Measurement Results—Numeric +Parameters
View
Chapter 3 3-7

Making Basic cdmaOne Base Station Measurements
Making the Channel Power Measurement
Troubleshooting Hints
• If the cdmaOne spectrum has spurious signals present in the
channel or the modulated signal is oddly shaped, it could be caused
by a base band problem. If this is observed, proceed to modulation
accuracy measurements (Code Domain Power and Modulation
Accuracy (Rho)).
• Low channel power level can be caused by loose or damaged
connectors or cables. Loss of power can also be caused by a defective
power amplifier or support circuitry. In extreme cases,no power may
be measured at the output of the transmitter. Likely causes of this
failure could be the cell site transceiver power supply.
• Check for “shoulders” or high points on either side of the spectrum
which indicate spectral regrowth. Spectral regrowth can be caused
by phase noise, system non-linearity, or power amplifier problems.
• Rounding or sloping of the top of the spectrum can indicate filter
shape problems.
• If an external attenuator or directional coupler is used, be sure to
include the attenuation value in the measurement. This can be done
by entering the
the
Input… key on the Mode Setup menu.
BS Ext Atten underthe Input/Output front panel keyor
3-8 Chapter3

Making Basic cdmaOne Base Station Measurements
Making the Receive Channel Power Measurement
Making the Receive Channel Power
Measurement
Purpose
Both the transmit and receive band affect system performance. This
measurement checks for interference in the receive band by measuring
the power level at the input of the transceiver in the receiver band.This
verifies both that the transmitter is operating correctly and that the
receiver is free from interference by checking for transmitter leakage
and the presence of external signals that cause interference present in
the receive band.
Measurement Method
This measurement first checks for carrier signals in or around the
channel being tested to ensure it is safe to set the attenuation to 0 dB.
Then the power in the receive channel is measured in the bandwidth
specified by the selected standard and tuning plan.
To improve repeatability, you can increase the number of averages.
You can make the Receive Channel Power measurement intrusively or
non-intrusively. To perform a non-intrusive test, connect a directional
coupler to the RF output with the main arm connected to the antenna
and the coupled port connected to the spectrum analyzer as shown in
Figure 3-5. Enter the loss due to the effect of the coupler as external
attenuation. You may also perform a non-intrusive test by making the
measurement at a test port on the transceiver unit, if available.
You can use the intrusive method by taking the measurement directly
from the RF output port of the transceiver as shown in Figure 3-6.
Because you disconnect the antenna from the transceiver and disrupt
the transmission signal, this can not be considered a non-intrusive test.
NOTE Use of a non-intrusive measurement is recommended.
CAUTION If you use the intrusive method, ensure that the power level at the RF
input of the spectrum analyzer does not exceed the damage level of
30 dBm.
Measurement Hints
• This measurement starts by checking the receive band for a carrier.
If a carrier is present, the measurement will continue checking until
the carrier is removed. The message, “Measurement is suspended
Chapter 3 3-9

Making Basic cdmaOne Base Station Measurements
Making the Receive Channel Power Measurement
until carrier removed.” will be displayed. If you want to make this
measurement with the transmitteron, a band pass filter can be used
to eliminate the carrier signal.
• Follow the on-screen directions to optimize for best sensitivity.
• If the channel power is near the noise floor, set Noise Correction to
Auto. Noise floor correction removes the effects of analyzer noise,
improving accuracy when necessary.
NOTE If Noise Correction and RF Input Range are both set to Auto, the internal
input attenuator and reference level will only be set one time and not
automatically update. Achange in the input signallevel may require an
update of the internal input attenuator and reference level. In that
case, you will need to press
Restart to take a new measurement and
reset the input attenuator and reference level. This will invalidate the
noise floor calibration. You will then be prompted to perform another
Noise Floor Calibration or to set
Noise Correction to Off before
proceeding with the measurement.
Making the Measurement
1. Ensure that the base transceiver station is in service.
2. Connect the device being measured and the spectrum analyzer input
as shown in Figure 3-5 or Figure 3-6.
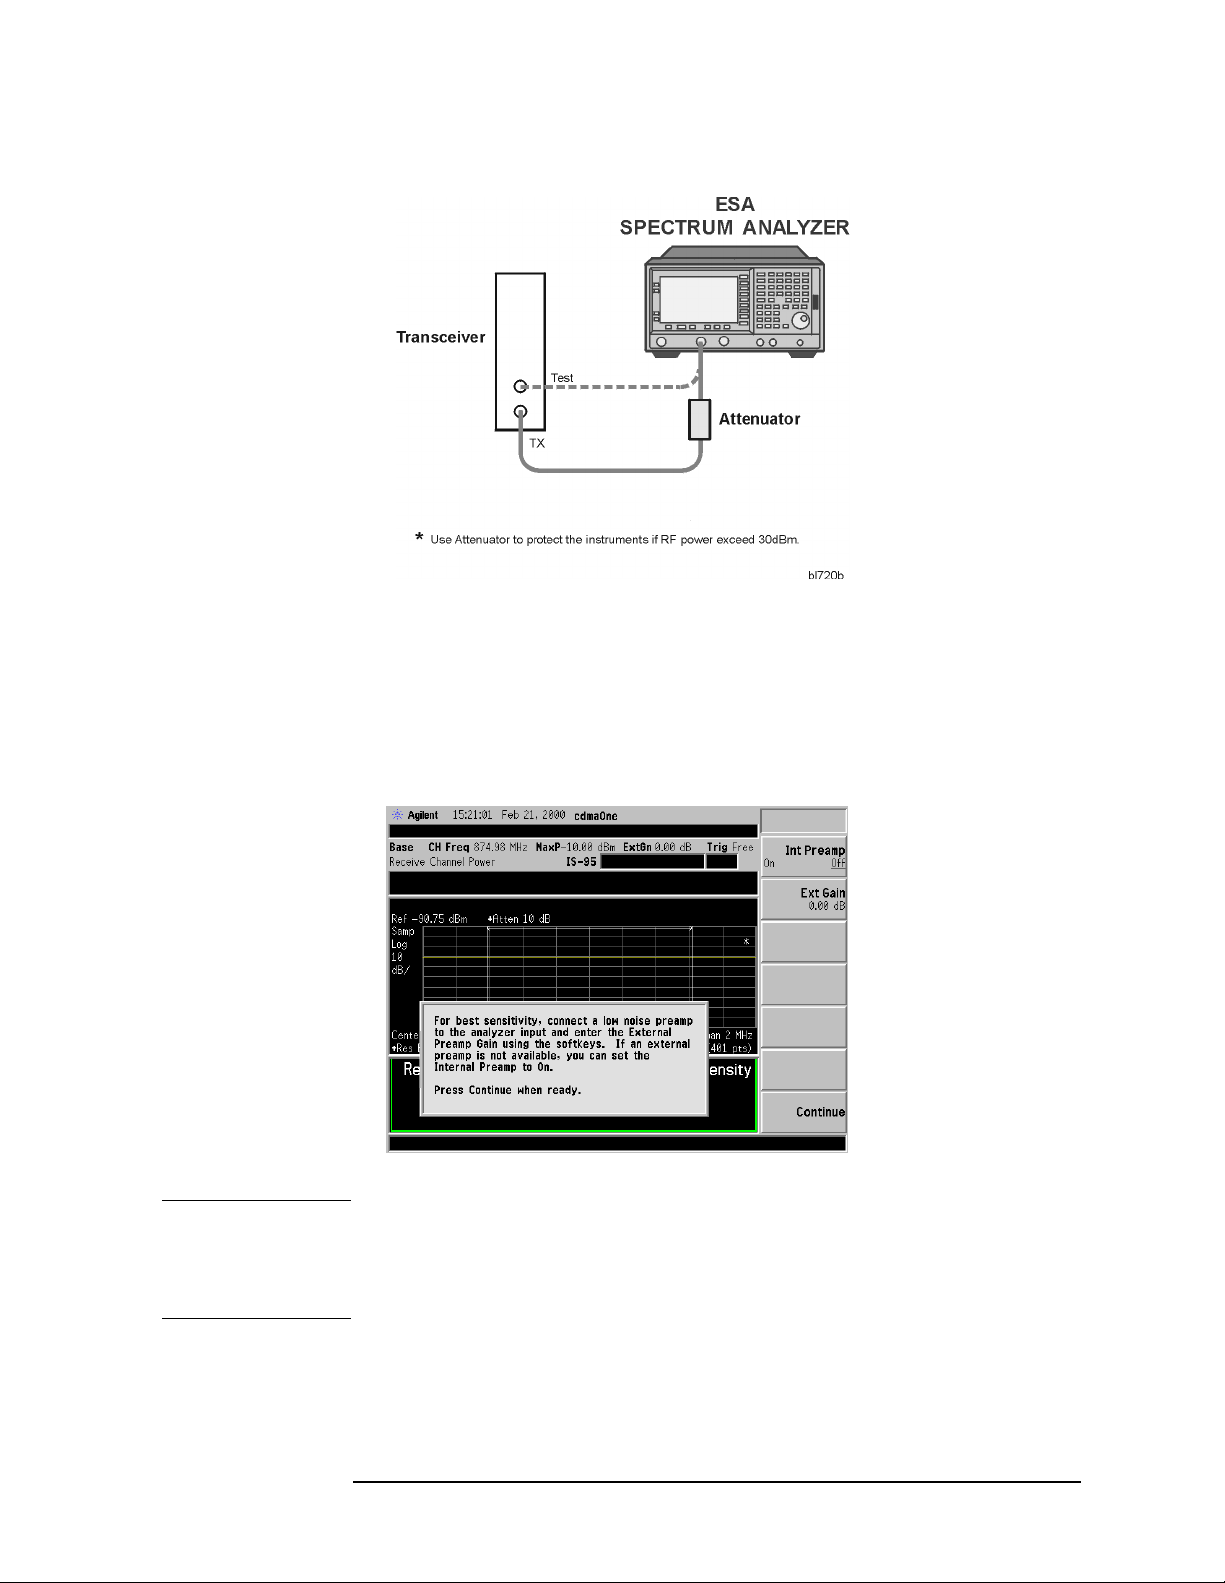
Figure 3-5 Measurement Setup
3-10 Chapter3
Making Basic cdmaOne Base Station Measurements
Making the Receive Channel Power Measurement
Figure 3-6 Alternative Measurement Setup
3. If the mode has not already been set to cdmaOne, press
cdmaOne.
4. To immediately make Receive Channel Power the active
measurement, press MEASURE and Rx Channel Power. The Preamp
dialog box shown in Figure 3-7 will be displayed.
Figure 3-7 Preamp Dialog Box
MODE and
NOTE If there is no internal preamplifier Option 1DS installed the message
will read as follows: “For best sensitivity, connect a low noise preamp to
the analyzer input. Set the External Preamp Gain using the softkeys.
Press Continue when ready.”
5. To continue, follow the instructions in the dialog box and then press
Continue. The attenuation caution dialog box shown in Figure 3-8
will be displayed.
Chapter 3 3-11

Making Basic cdmaOne Base Station Measurements
Making the Receive Channel Power Measurement
Figure 3-8 Attenuator Dialog Box
6. Set the input signal level according to the instructions in the dialog
box. Then, pressContinue to continue with themeasurement or press
Cancel to terminate the measurementwithout setting the attenuator
to 0 dB.
7. Set the measurement parameters to the default values by pressing
Meas Setup, More and Restore Meas Defaults.
NOTE The factory default settings provide a cdmaOne compliant
measurement. For special requirements, you may need to change some
of the settings. At any time, you can return all parameters for the
current measurement to the default settings by repeating this step.
8. If desired, set the measurement limits to On by pressing
More, and Limits.
9. Select the desired center frequency by pressing
press the appropriate menu key
RF Channel or Temp Ctr Freq. Enter
FREQUENCY, then
the desired channel number or frequency value and press
channel numbers) or a units key–
GHz, MHz, kHz,orHz (for frequency
Meas Setup,
Enter (for
values).
NOTE If the desired RF Channel or Channel Freq has been set for a previous
measurement, it is used for all subsequent measurements, and it does
not need to be set again. The measurement automatically shifts the
frequency to the receive frequency for the selected channel. The receive
channel frequency is displayed on the
Temp Ctr Freq menu key.
Setting a temporary center frequency does not affect any other
measurement, and the measurement reverts to the Duplex (receive)
Channel Frequency, based on the transmit channel frequency, on
restart.
3-12 Chapter3
Making Basic cdmaOne Base Station Measurements
Making the Receive Channel Power Measurement
10.To change any of the measurement parameters from the factory
default values, press the
Meas Setup key to access menus that allow
you to modify the parameters for this measurement. For additional
information on keys to access measurement parameters, refer to the
Front-Panel Key Reference section of the ESA-E Series Spectrum
Analyzers cdmaOne Measurement Personality User’s Guide or use
the on screen help.
11.To save the measurement results, refer to ESA-E Series Spectrum
Analyzers cdmaOne Measurement Personality User’s Guide.
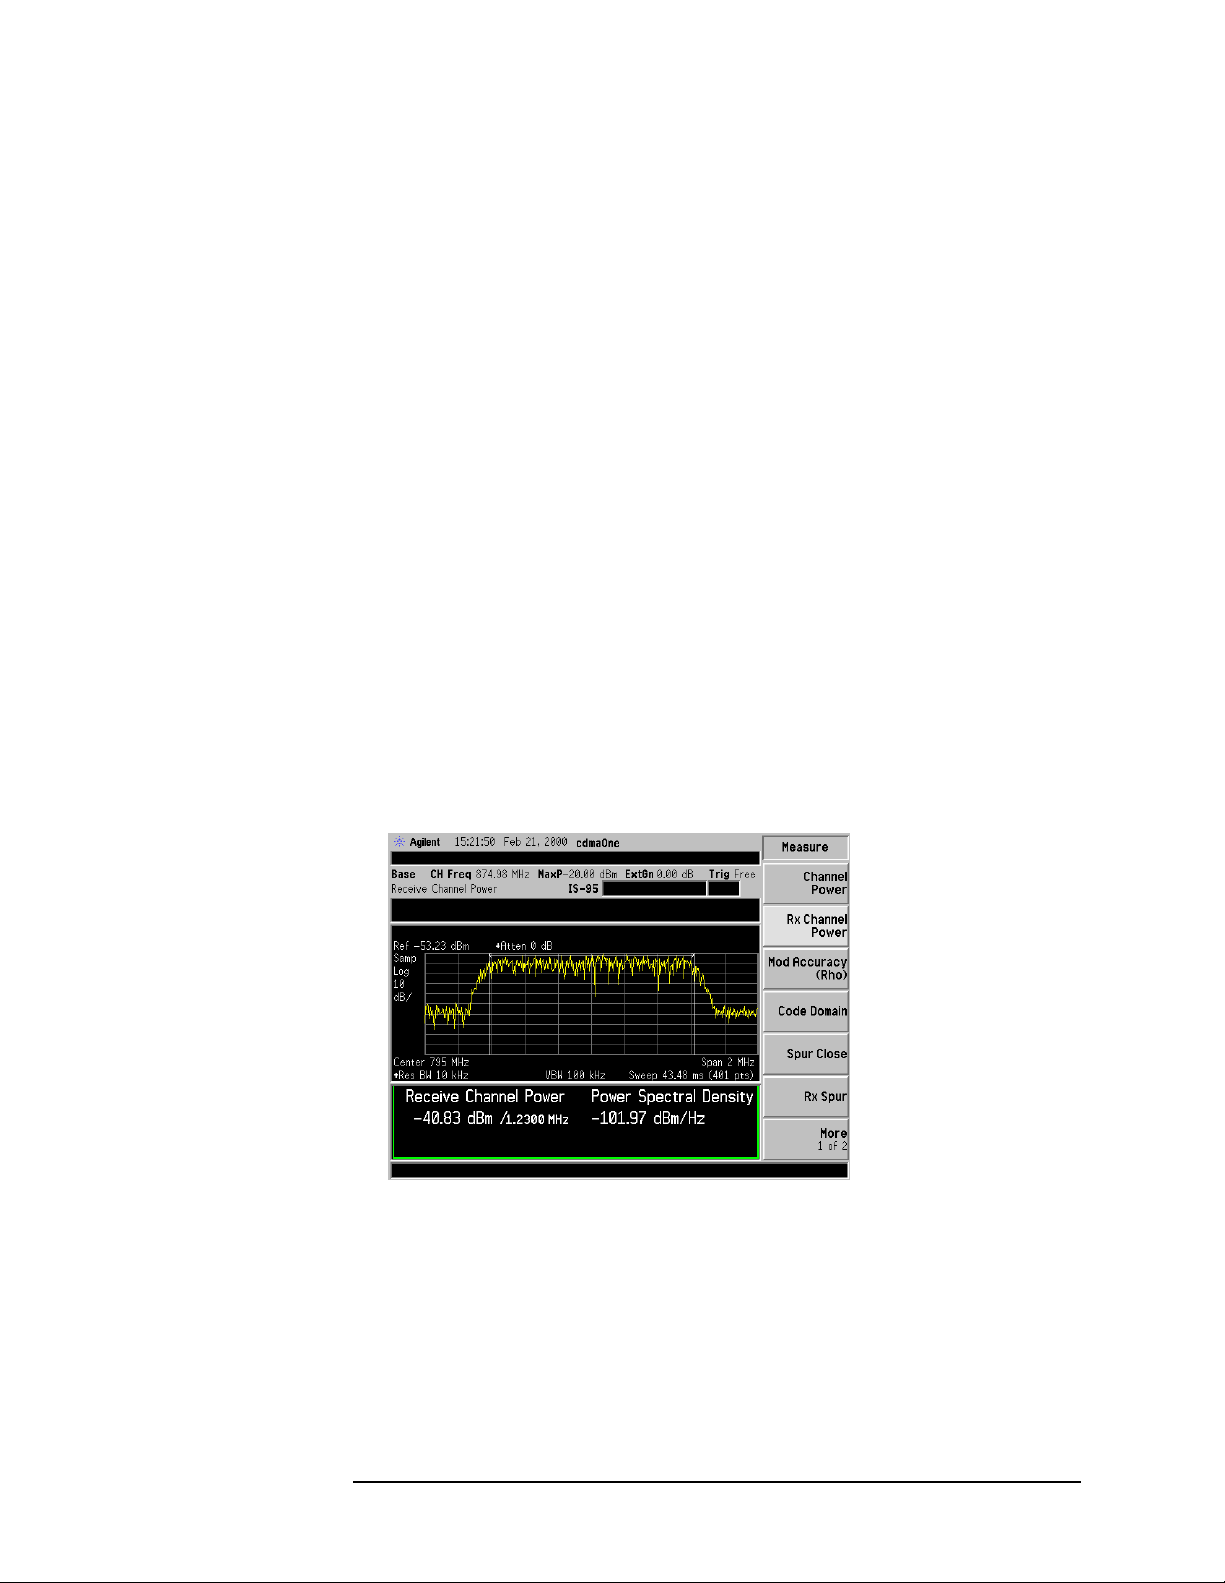
Results
The total channel power will be reported along with the power spectral
density. This measurement is similar to the channel power
measurement, but in the receive band. Base station manufacturers
often specify the performance of the receive channel. Compare the
measured results with the specification.
Figure 3-9 shows the standard view of receive channel power
measurement with a signal at the lower edge of the receive bandwidth.
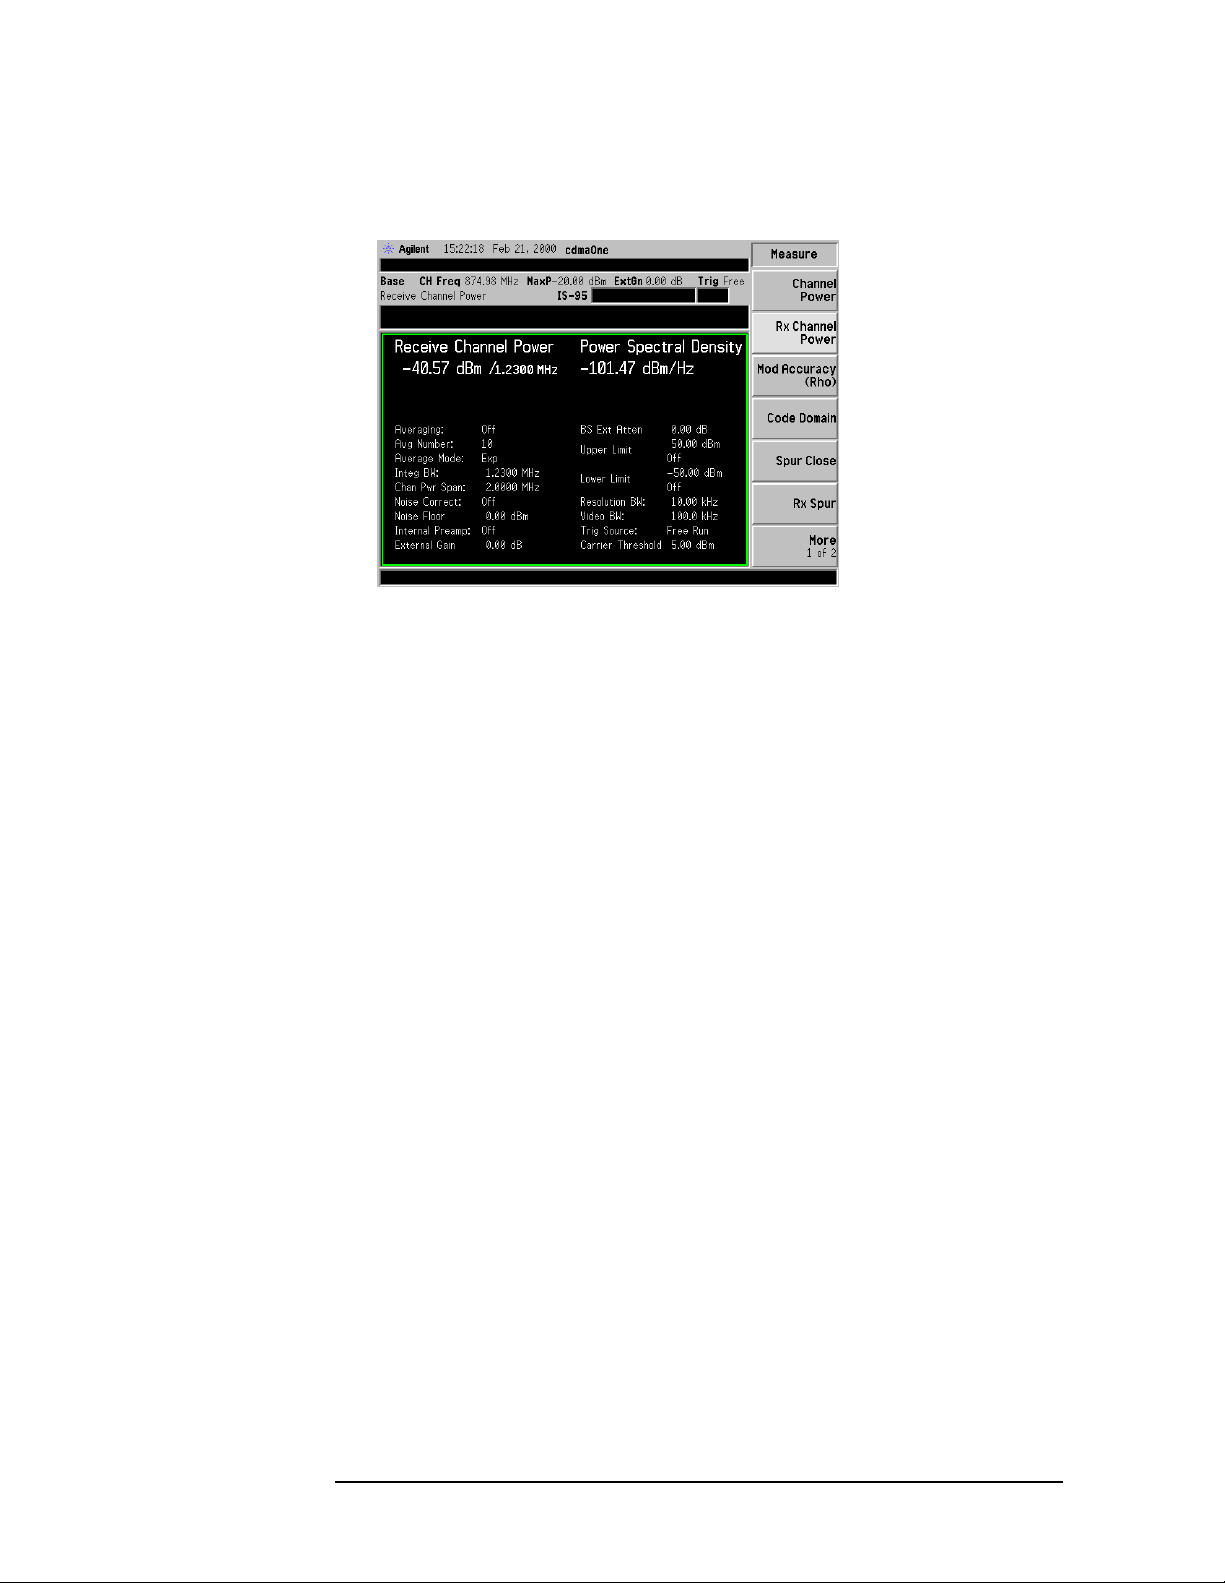
Figure 3-10 shows the numeric plus parameters view of the same
measurement results. The receive channel power, power spectral
density, and various measurement parameters are shown.
Figure 3-9 Receive Channel Power Measurement Results—Standard View
Chapter 3 3-13
Making Basic cdmaOne Base Station Measurements
Making the Receive Channel Power Measurement
Figure 3-10 Receive Channel Power Measurement Results—Numeric
+Parameters View
Troubleshooting Hint
If an external preamplifier is used, be sure to include the gain value in
the measurement. This can be done by entering the
the
Input/Output front panel key or the Input… key on the Mode Setup
External Gain under
menu.
3-14 Chapter3

Making Basic cdmaOne Base Station Measurements
Making the Monitor Band/Channel Measurement
Making the Monitor Band/Channel
Measurement
Purpose
You can use the Monitor Band/Channel Measurement to gain a rough
idea of system performance and to uncover areas of potential problems.
This measurement is especially helpful in verifying that the cdmaOne
channel or band is free of interference. By sweeping the specified
channel or band of interest, you can identify low level interfering
signals. The selected standard and tuning plan determine the band and
channel span used for the measurement.
Measurement Method
The channel measurement is a close up of a specific part of a band. In
order to focus on a specific part of the band, Press
under the
Method softkey, press Channel.
Meas Setup and,
You can make the Monitor Band/Channel measurement intrusively or
non-intrusively. To perform a non-intrusive test, connect a directional
coupler to the RF output with the main arm connected to the antenna
and the coupled port connected to the spectrum analyzer as shown in
Figure 3-11. Enter the loss due to the effect of the coupler as external
attenuation. You may also perform a non-intrusive test by making the
measurement at a test port on the transceiver unit, if available.
You can use the intrusive method by taking the measurement directly
from the RF output port of the transceiver as shown in Figure 3-12.
Because you disconnect the antenna from the transceiver and disrupt
the transmission signal, this can not be considered a non-intrusive test.
NOTE Use of a non-intrusive measurement is recommended.
CAUTION If you use the intrusive method, ensure that the power level at the RF
input of the spectrum analyzer does not exceed the damage level of
30 dBm.
Chapter 3 3-15

Making Basic cdmaOne Base Station Measurements
Making the Monitor Band/Channel Measurement
Measurement Hints
• By using the marker and a wide resolution bandwidth (3 MHz) a
quick power level check can be made on the channel of interest.
• Using the frequency readout of the marker will also give you an idea
of the carrier frequency. This carrier frequency can be entered into
the analyzer and converted into a channel number using the
FREQUENCY Channel key.
• Optimize the analyzer sensitivity by reducing attenuation and
turning on the built-in preamplifier (option 1DS). This will reduce
the noise floor of the analyzer to uncover any hidden low level
signals.
• To improve the resolution of interference signals, refer to
“Identifying Interfering Signals” on page 1-6.
Making the Measurement
1. Ensure that the base transceiver station is out of service.
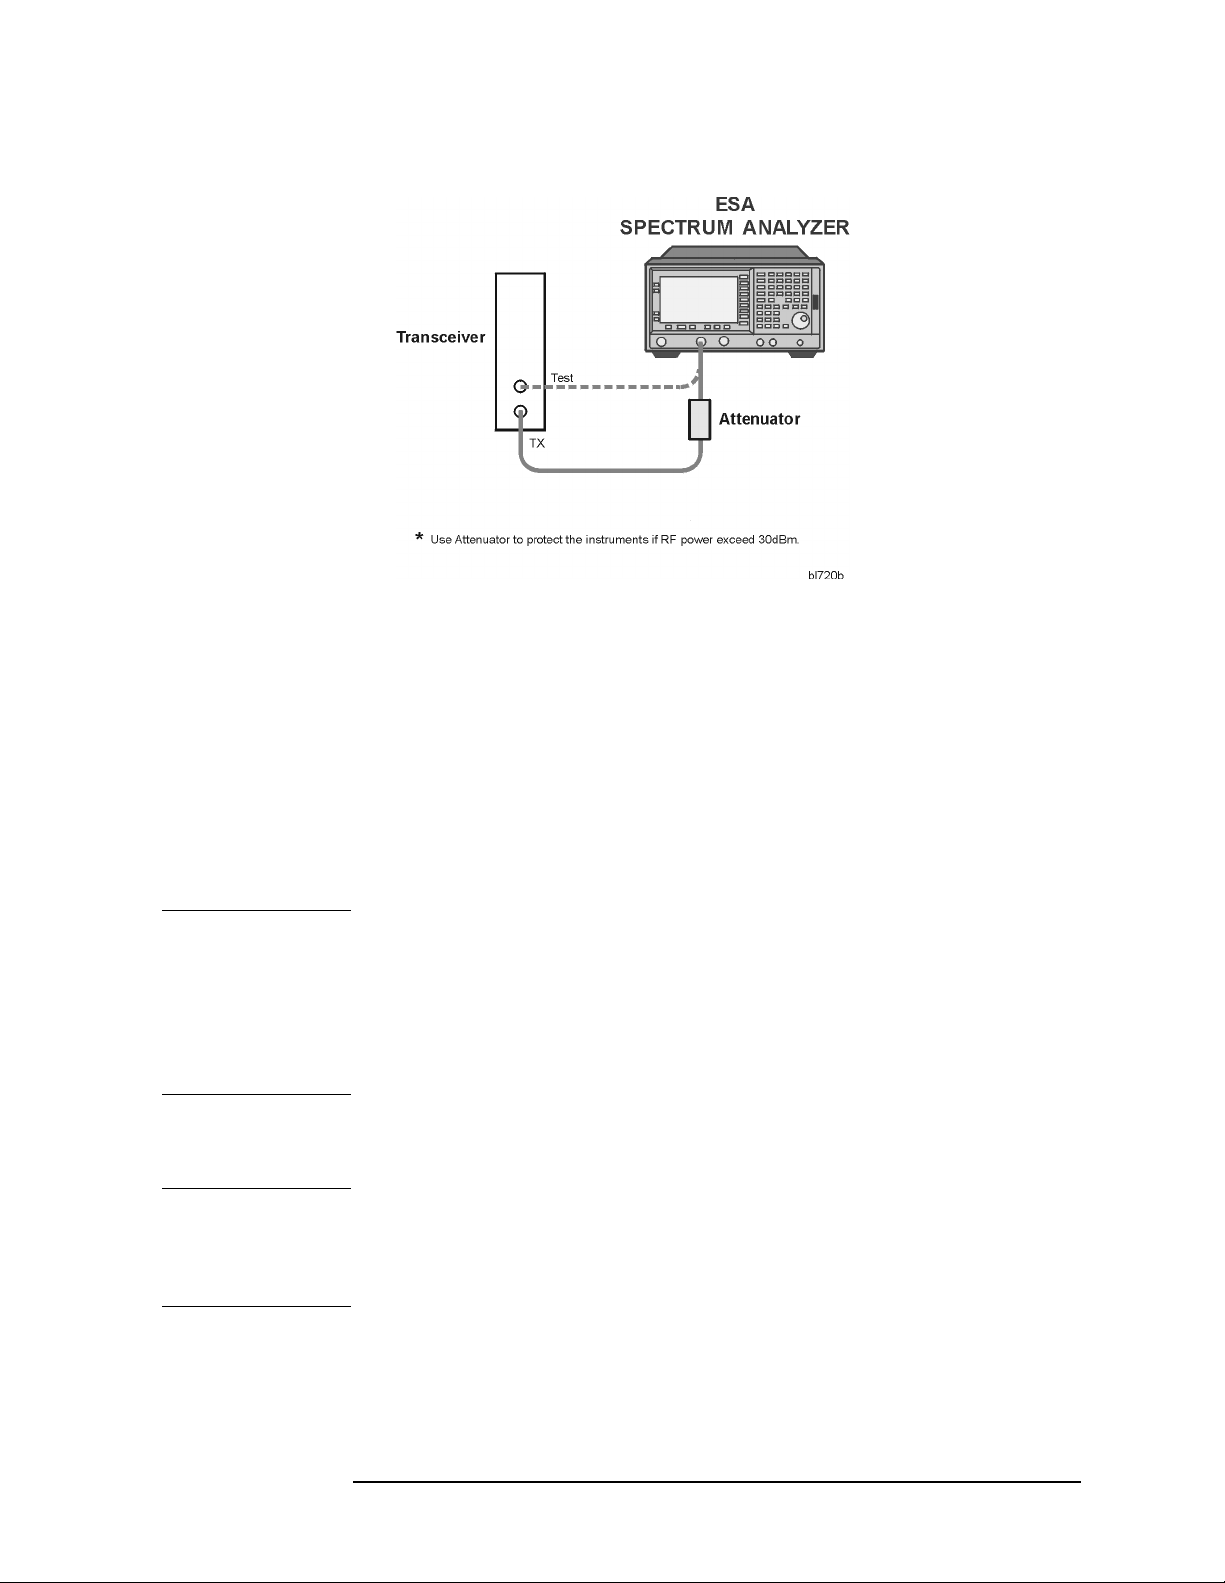
2. Connect the device being measured and the spectrum analyzer input
as shown in Figure 3-11 or Figure 3-12.
Figure 3-11 Measurement Setup
3-16 Chapter3
Making Basic cdmaOne Base Station Measurements
Figure 3-12 Alternative Measurement Setup
Making the Monitor Band/Channel Measurement
3. If the mode has not already been set to cdmaOne, press
cdmaOne.
MODE and
4. To immediately make Monitor Channel/Band the active
measurement, press MEASURE and Monitor Band/Channel.
5. Select the desired center frequency by pressing
press the appropriate menu key
Temp Ctr Freq. Enter the desired channel number or frequency value
and press
or
Hz (for frequency values).
NOTE If the desired RF Channel or Channel Freq has been set for a previous
Enter (for channel numbers) or a units key–GHz, MHz, kHz,
RF Channel, Channel Freq, or
FREQUENCY, then
measurement, it is used for all subsequent measurements, and it does
not need to be set again.
Setting a temporary center frequency does not affect any other
measurement and the measurement reverts to the Channel Frequency
on restart.
6. Set the measurement parameters to the default values by pressing
Meas Setup and Restore Meas Defaults.
NOTE The factory default settings provide a cdmaOne compliant
measurement. For special requirements, you may need to change some
of the settings. At any time, you can return all parameters for the
current measurement to the default settings by repeating this step.
7. Set the measurement method to Channel or Band by pressing
Meas Setup and Method until the desired measurement method is
underlined.
Chapter 3 3-17

Making Basic cdmaOne Base Station Measurements
Making the Monitor Band/Channel Measurement
8. To change any of the measurement parameters from the factory
default values, press the
Meas Setup key to access menus that allow
you to modify the parameters for this measurement. For additional
information on keys to access measurement parameters, refer to the
Front-Panel Key Reference section of the ESA-E Series Spectrum
Analyzers cdmaOne Measurement Personality User’s Guide or use
the on screen help.
9. To save the measurement results, refer to ESA Spectrum Analyzers
User’s Guide.
Results
This measurement provides a quick check to the health of the system. If
no problems were detected, continue on with more detailed testing. The
following figures provide examples of the measurement results
displaying various signals found in the cdmaOne Band or Channel.
Figure 3-13 shows the band method measurement with a strong
cdmaOne modulated signal; this could include the signal from your
system. Figure 3-14 shows the channel method measurement with the
same strong modulated signal seen in Figure 3-13; that signal RF
frequency has been used as the measurement center frequency.
Figure 3-13 Band Method with CDMA Modulated Signal
3-18 Chapter3

Making Basic cdmaOne Base Station Measurements
Making the Monitor Band/Channel Measurement
Figure 3-14 Channel Method with CDMA Modulated Signal
Troubleshooting Hints
• To improve the noise floor performance of the analyzer, use Res BW
under Meas Setup to decrease the resolution bandwidth, or use
Attenuation under AMPLITUDE Y Scale to increase the attenuation.
• If a large number of signals are present, the ESA may be generating
them internally. To determineif the signalsare internally generated,
use
Attenuation under AMPLITUDE Y Scale to increase the
attenuation. If the spurious signals change in amplitude or
decreases in number, then the analyzer is generating distortion.
• If interfering signals are found, they must be eliminated to ensure a
properly working network. This should be done first before moving
on to other tests.
• If the power level was suspect when measured by this method, use
the channel power measurement to get a more accurate power value.
• If an external attenuator is used, be sure to include the attenuation
value in the measurement. This can be done by entering the
BS Ext Atten under the Input/Output front panel key or the Input… key
on the
Mode Setup menu.
Chapter 3 3-19

Making Basic cdmaOne Base Station Measurements
Making the Occupied Bandwidth Measurement
Making the Occupied Bandwidth
Measurement
Purpose
Transmission bandwidth is often tightly regulated. Bandwidth
occupied by a specified percentage of the total transmit power is
determined by this measurement. Distortion in the transmitted signal
will produce power outside of the specified bandwidth. Emission
bandwidth is also reported to further help identify problems with the
transmission.
Measurement Method
This procedure measures the total linear power in the specified
measurement span. The power is then used to calculate the upper and
lower frequencies of the occupied bandwidth.
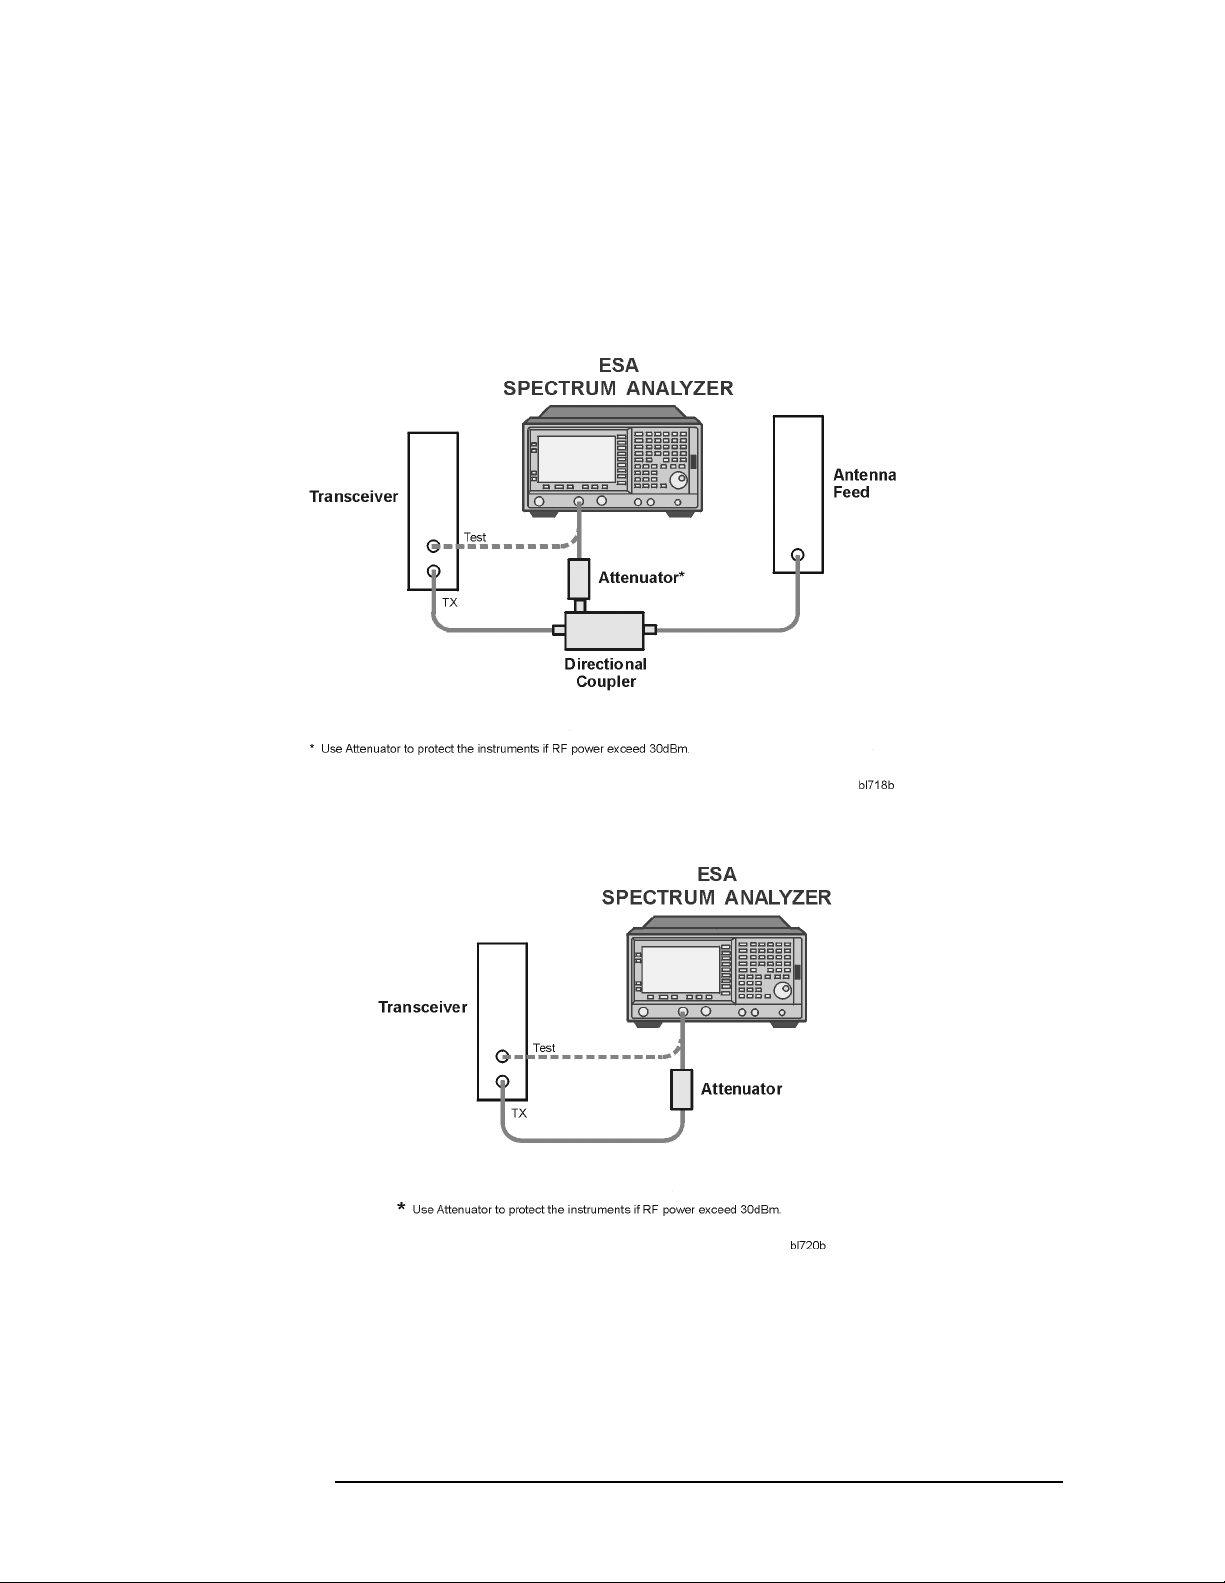
You can make the Occupied Bandwidth measurement intrusively or
non-intrusively. To perform a non-intrusive test, connect a directional
coupler to the RF output with the main arm connected to the antenna
and the coupled port connected to the spectrum analyzer as shown in
Figure 3-15. Enter the loss due to the effect of the coupler as external
attenuation. You may also perform a non-intrusive test by making the
measurement at a test port on the transceiver unit, if available.
You can use the intrusive method by taking the measurement directly
from the RF output port of the transceiver as shown in Figure 3-16.
Because you disconnect the antenna from the transceiver and disrupt
the transmission signal, this can not be considered a non-intrusive test.
NOTE Use of a non-intrusive measurement is recommended.
CAUTION If you use the intrusive method, ensure that the power level at the RF
input of the spectrum analyzer does not exceed the damage level of
30 dBm.
Measurement Hints
• The emission bandwidth indicates the total transmit power
bandwidth which gives an idea of the severity of the distortion
• The occupied bandwidth power percent can be adjusted for your
particular measurement needs.
3-20 Chapter3

Making the Measurement
1. Ensure that the base transceiver station is in service.
2. Connect the device being measured and the spectrum analyzer input
as shown in Figure 3-15 or Figure 3-16.
Figure 3-15 Measurement Setup
Making Basic cdmaOne Base Station Measurements
Making the Occupied Bandwidth Measurement
Figure 3-16 Alternative Measurement Setup
Chapter 3 3-21

Making Basic cdmaOne Base Station Measurements
Making the Occupied Bandwidth Measurement
3. If the mode has not already been set to cdmaOne, press MODE and
cdmaOne.
4. Toimmediately make Occupied Bandwidth the active measurement,
press MEASURE, More, and Occupied Bandwidth.
5. Select the desired center frequency by pressing
press the appropriate menu key
Temp Ctr Freq. Enter the desired channel number or frequency value
and press
or
Hz (for frequency values).
NOTE If the desired RF Channel or Channel Freq has been set for a previous
Enter (for channel numbers) or a units key–GHz, MHz, kHz,
RF Channel, Channel Freq, or
FREQUENCY, then
measurement, it is used for all subsequent measurements, and it does
not need to be set again.
Setting a temporary center frequency does not affect any other
measurement, and the measurement reverts to the Channel Frequency
on restart.
6. Set the measurement parameters to the default values by pressing
Meas Setup, More and Restore Meas Defaults.
NOTE The factory default settings provide a cdmaOne compliant
measurement. For special requirements, you may need to change some
of the settings. At any time, you can return all parameters for the
current measurement to the default settings by repeating this step.
7. If desired, set the measurement limits to On by pressing
More, and Limits.
Meas Setup,
8. To change any of the measurement parameters from the factory
default values, press the Meas Setup key to access menus that allow
you to modify the parameters for this measurement. For additional
information on keys to access measurement parameters, refer to the
Front-Panel Key Reference section of the ESA-E Series Spectrum
Analyzers cdmaOne Measurement Personality User’s Guide or use
the on screen help.
9. To save the measurement results, refer to ESA Spectrum Analyzers
User’s Guide.
3-22 Chapter3

Making Basic cdmaOne Base Station Measurements
Making the Occupied Bandwidth Measurement
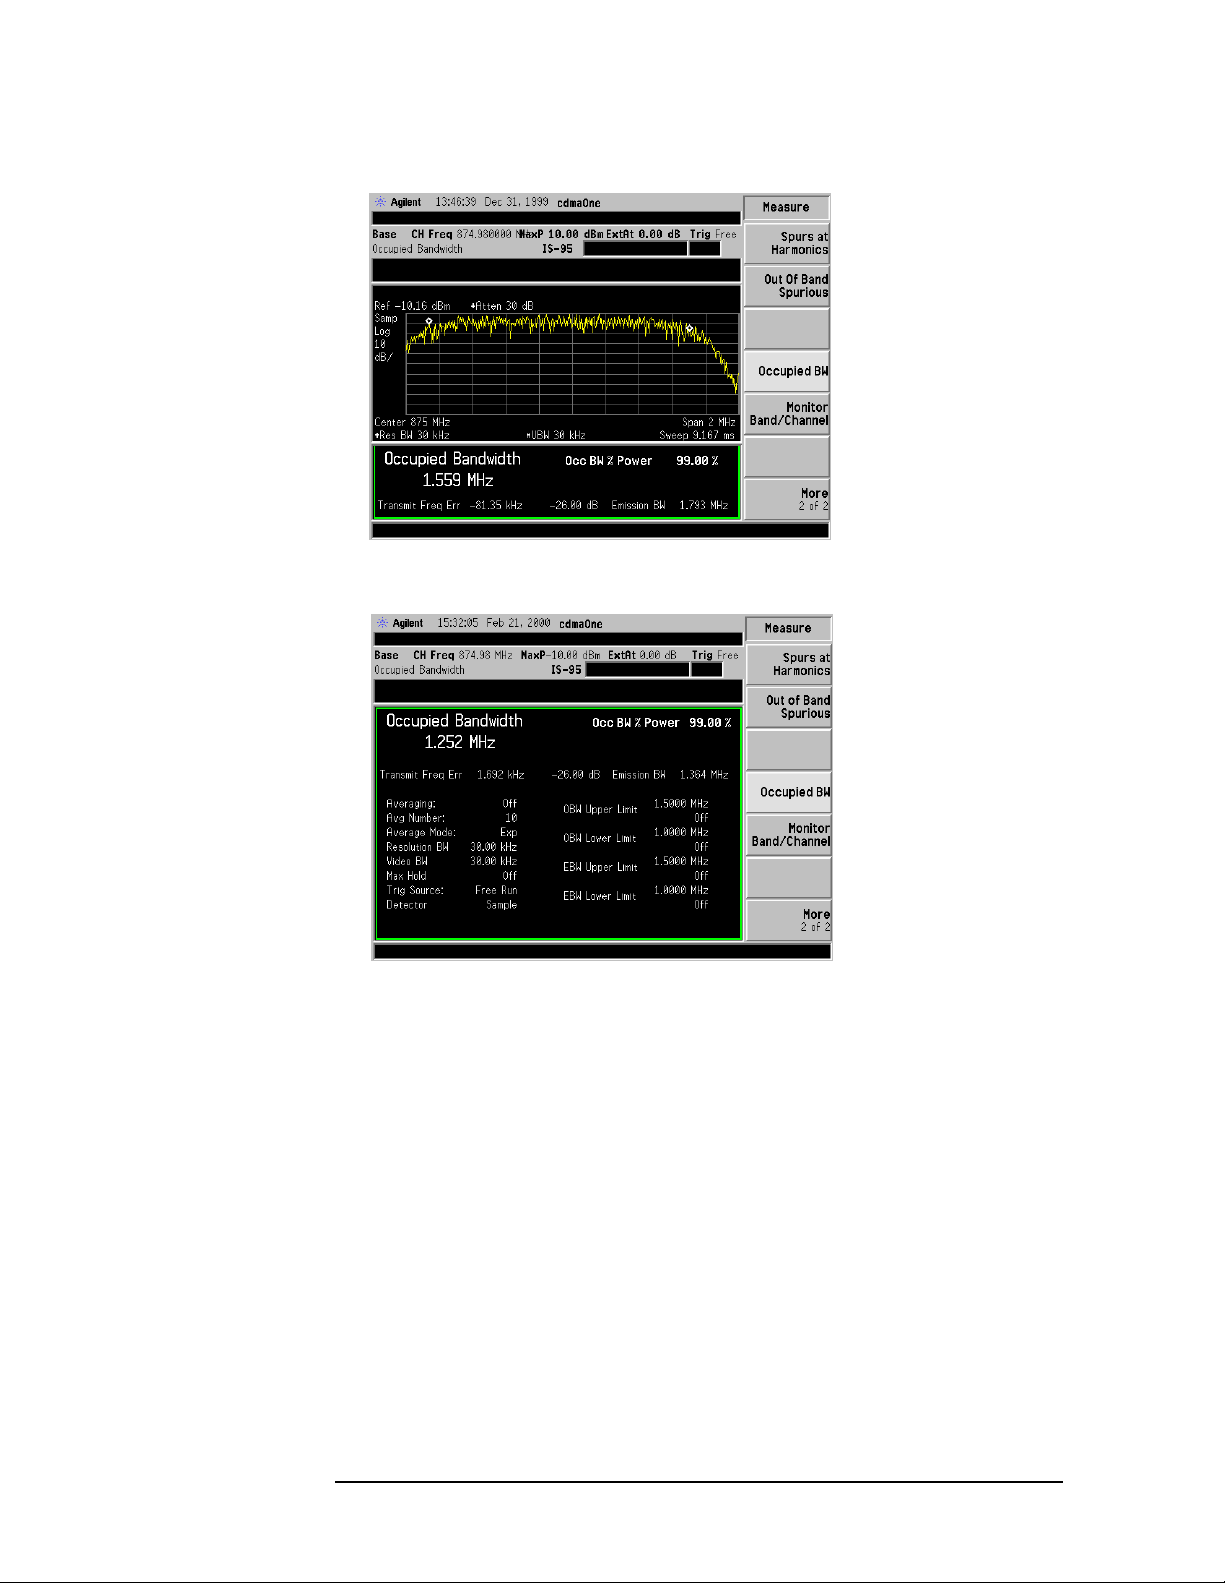
Results
If the occupied bandwidth is larger than anticipated, more analysis of
the transmitter is necessary to identify the cause of the distortion. Both
the emission bandwidth and transmit frequency error results provide
additional information that may indicate the cause of the transmission
of power outside of the designed and specified bandwidth.
Figure 3-17 shows the cdmaOne signal with ideal bandwidth power.
Figure 3-18 shows the cdmaOne signal with power high points outside
of the bandwidth spectrum; this indicates spectral regrowth. A higher
span setting has been used to more clearly show the interference in the
adjacent channels. Figure 3-19 shows the cdmaOne signal with
rounding or sloping of the top of the spectrum; this can indicate filter
shaping problems.
Figure 3-17 Standard Results View with a Good cdmaOne Signal
Figure 3-18 Standard Results View with Spectral Regrowth
Chapter 3 3-23
Making Basic cdmaOne Base Station Measurements
Making the Occupied Bandwidth Measurement
Figure 3-19 Standard Results View with Filter Shaping Problems
Figure 3-20 Numeric +Parameters View with a Good cdmaOne Signal
Troubleshooting Hints
• If an external attenuator is used, be sure to include the attenuation
value in the measurement. This can be done by entering the
BS Ext Atten under the Input/Output front panel key or the Input… key
on the
• Check for “shoulders” or high points on either side of the spectrum
which indicate spectral regrowth. Spectral regrowth can be caused
by phase noise, system non-linearity, or power amplifier problems.
• Rounding or sloping of the top of the spectrum can indicate filter
shape problems.
3-24 Chapter3
Mode Setup menu.

Making Basic cdmaOne Base Station Measurements
Making the Manual Adjacent Channel Power Ratio (ACPR) Measurement
Making the Manual Adjacent Channel Power
Ratio (ACPR) Measurement
Purpose
This is a SA mode measurement used to verify that the transmitter
meets spur close specifications at the frequencies where meeting those
specifications is most difficult. It measures the ratio of transmitted
power in an adjacent channel to the power in the transmitter channel.
Measurement Method
This procedure measures the total RMS power in the main channel and
in an upper and lower pair of adjacent channels, one pair at a time. The
ratio of the power in the adjacent channel to the power in the main
channel, in dB, is the reported result. The adjacent channels are
specified by their location (offset frequency—the difference between the
center of the adjacent channel and the center of the main channel) and
their width (adjacent channel bandwidth). The absolute power of the
main channel, in dBm, is also displayed.
You can make the Manual Adjacent Channel Power measurement
intrusively or non-intrusively. To perform a non-intrusive test, connect
a directional coupler to the RF output with the main arm connected to
the antenna and the coupled port connected to the spectrum analyzer
as shown in Figure 3-21. Enter the loss due to the effect of the coupler
as external attenuation. You may also perform a non-intrusive test by
making the measurement at a test port on the transceiver unit, if
available.
You can use the intrusive method by taking the measurement directly
from the RF output port of the transceiver as shown in Figure 3-22.
Because you disconnect the antenna from the transceiver and disrupt
the transmission signal, this can not be considered a non-intrusive test.
NOTE Use of a non-intrusive measurement is recommended.
CAUTION If you use the intrusive method, ensure that the power level at the RF
input of the spectrum analyzer does not exceed the damage level of
30 dBm.
Chapter 3 3-25
Making Basic cdmaOne Base Station Measurements
Making the Manual Adjacent Channel Power Ratio (ACPR) Measurement
Making the Measurement
1. Ensure that the base transceiver station is in service.
2. Connect the device being measured and the spectrum analyzer input
as shown in Figure 3-21 or Figure 3-22.
Figure 3-21 Measurement Setup
Figure 3-22 Alternative Measurement Setup
3. Preset the ESA Spectrum Analyzer by pressing
4. Activate the ACPR measurement by pressing
5. Set the channel carrier frequency to be measured by pressing
FREQUENCY, Center Freq, and then entering the frequency using the
numeric keys. For example, 1.9667 GHz.
PRESET.
MEASURE and ACP.
3-26 Chapter3

Making Basic cdmaOne Base Station Measurements
Making the Manual Adjacent Channel Power Ratio (ACPR) Measurement
6. Set the input attenuator as required by pressing Amplitude,
Attenuation, and then entering the value using the numeric keys.
Press
NOTE When setting the input attenuator, the resulting signal level must not
dB.
be too large or small.
• If signal power is too high, it can overload the spectrum analyzer
and cause ACP.
• If signal power is too low, the ACP measurement is degraded by the
presence of excessive noise.
Set the attenuator to the smallest available value, in dB, that is larger
than the transmitter power, in dBm, plus 10 dB.
7. Set the reference level so that the displayed signal peak is close to,
but does not exceed, the maximum screen display value as follows:
a. Press
AMPLITUDE, Ref Level, and then enter the value using the
numeric keys.
b. Press dBm or −dBm.
8. Set the Main Channel bandwidth to 1.23 MHz by pressing
Meas Setup, Main Chan BW, 1.23, and MHz.
9. Set the integration bandwidth for the selected offset as follows:
a. Press
Meas Setup, Adj Ch BW, and then enter the integration
bandwidth associated with the selected Standard and tuning
plan. Refer to Table 3-1 for the appropriate bandwidth value
starting with BW A for Offset A.
b. Press
kHz or MHz as indicated in Table 3-1.
10.Set the number of sweep points to the value recommended in
Table 3-1 as follows:
a. Press
Sweep, Points, and then enter the number for the selected
offset.
b. Press Enter.
11.Set the offset frequency for the selected offset as follows:
a. Press
Meas Setup,Chan Spacing,and then enter the selectedoffset
frequency from Table 3-1.
b. Press kHz or MHz as indicated in Table 3-1.
Chapter 3 3-27

Making Basic cdmaOne Base Station Measurements
Making the Manual Adjacent Channel Power Ratio (ACPR) Measurement
12.The Lower ACP and Upper ACP are the Adjacent Channel Power
Ratios for the selected offset. Record these values in the space
provided below.
13.Repeat steps 9. through 12. for offsets B and C.
Table 3-1 Offset Values
OFFSET LOWER UPPER
A _________dBc _________dBc
B _________dBc _________dBc
C _________dBc _________dBc
Standard Offset
A
(kHz)
IS-95A 750 1001 30.0 1.98 2001 30.0 — — —
J-STD-008 885 1001 30.0 1.26 4001 12.5 2.75 1001 1.0
Sweep
Points
BW
A
(kHz)
Offset
B
(MHz)
Sweep
Points
BW
B
(kHz)
Offset
C
(MHz)
Sweep
Points
(MHz)
Results
Figure 3-23 Adjacent Channel Power Ratio Measurement
Results—Spectrum View
BW
C
Troubleshooting Hint
If you do not obtain the expected results, repeat the setup procedure to
check the integrity of the test connections.
3-28 Chapter3
Making Basic cdmaOne Base Station Measurements
Making Return Loss Measurements
Making Return Loss Measurements
Purpose
Return loss is used to determine the health of an antenna system and
its associated cabling by measuring the amount of transmitted power
reflected back from the antenna system and not radiated from the
antenna to the mobile user.
Cables and antennae are often subjected to harsh weather conditions
resulting in a performance which deteriorates over time, leading to an
eventual failure. By monitoring return loss over time, cable and
antennae performance can be monitored and preventive action taken
when required.
Measurement Method
You can only make the Return Loss measurement intrusively. Take the
measurement directly from the antenna feed port as shown in
Figure 3-25. Because you disconnect the antenna from the transceiver
and disrupt the transmission signal, this is an intrusive test.
Making the measurement
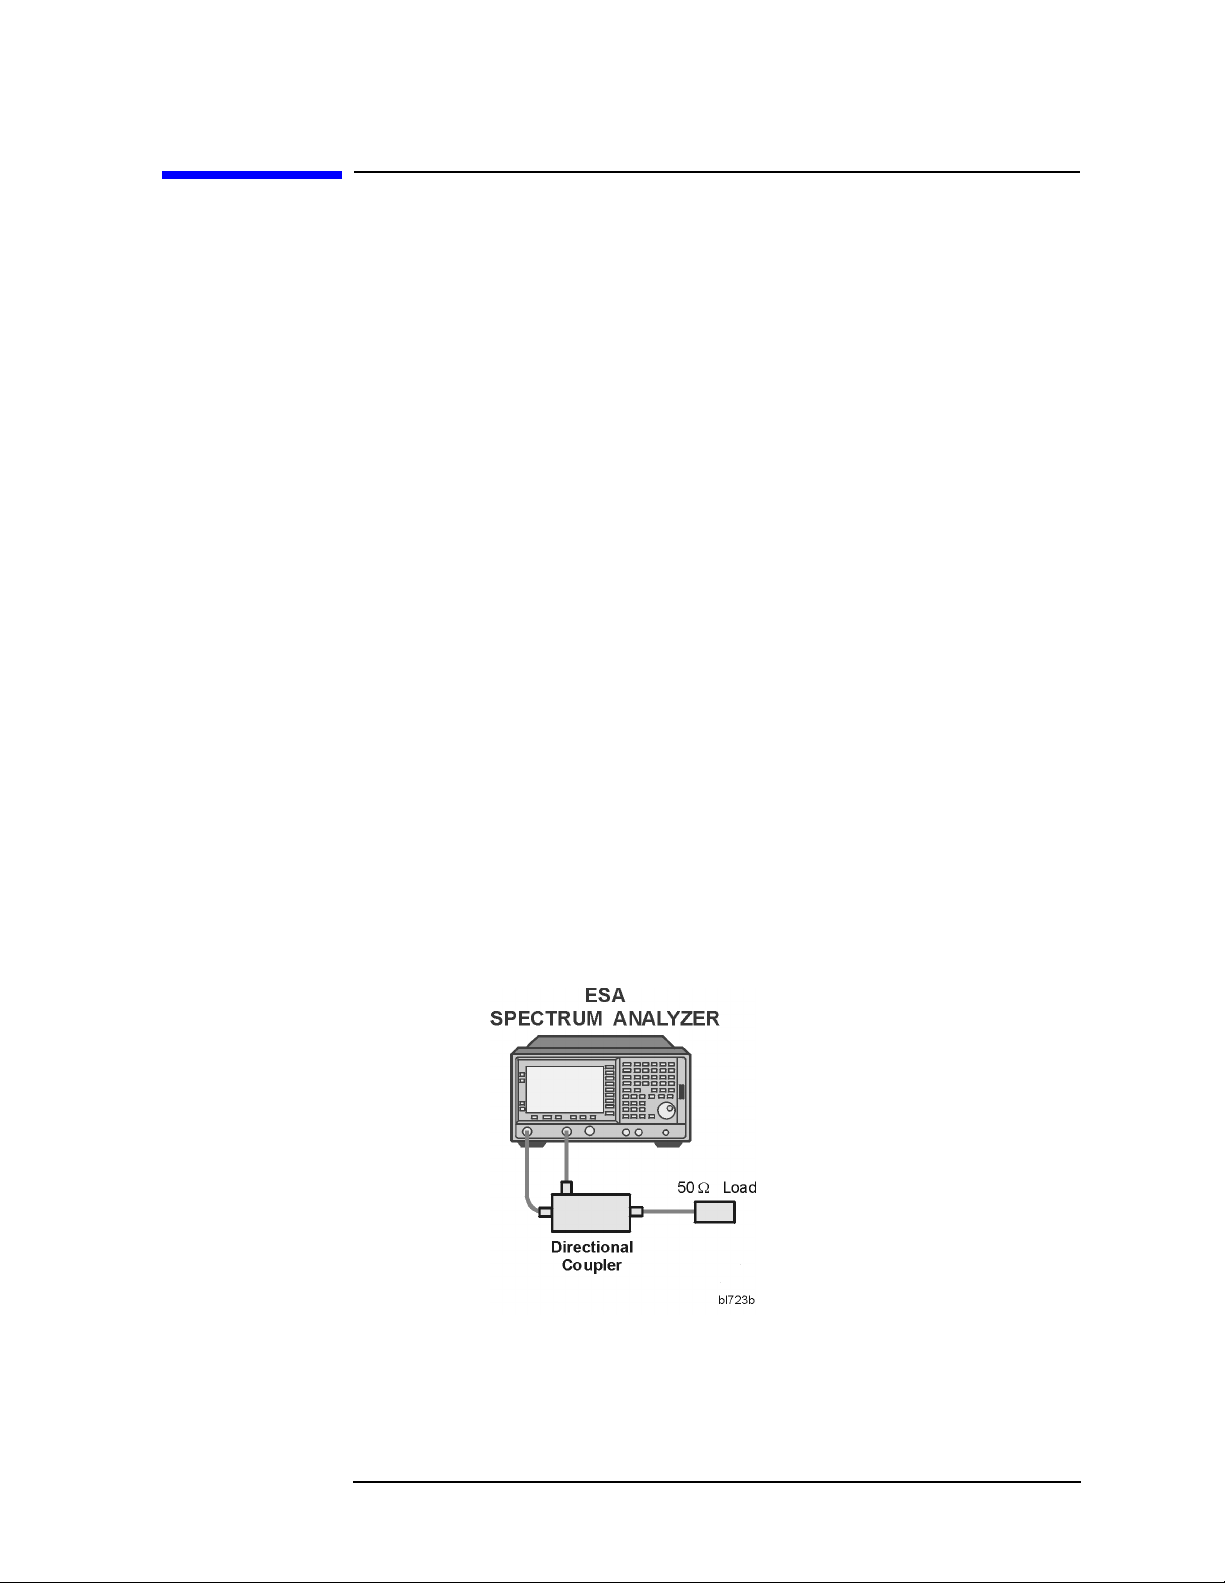
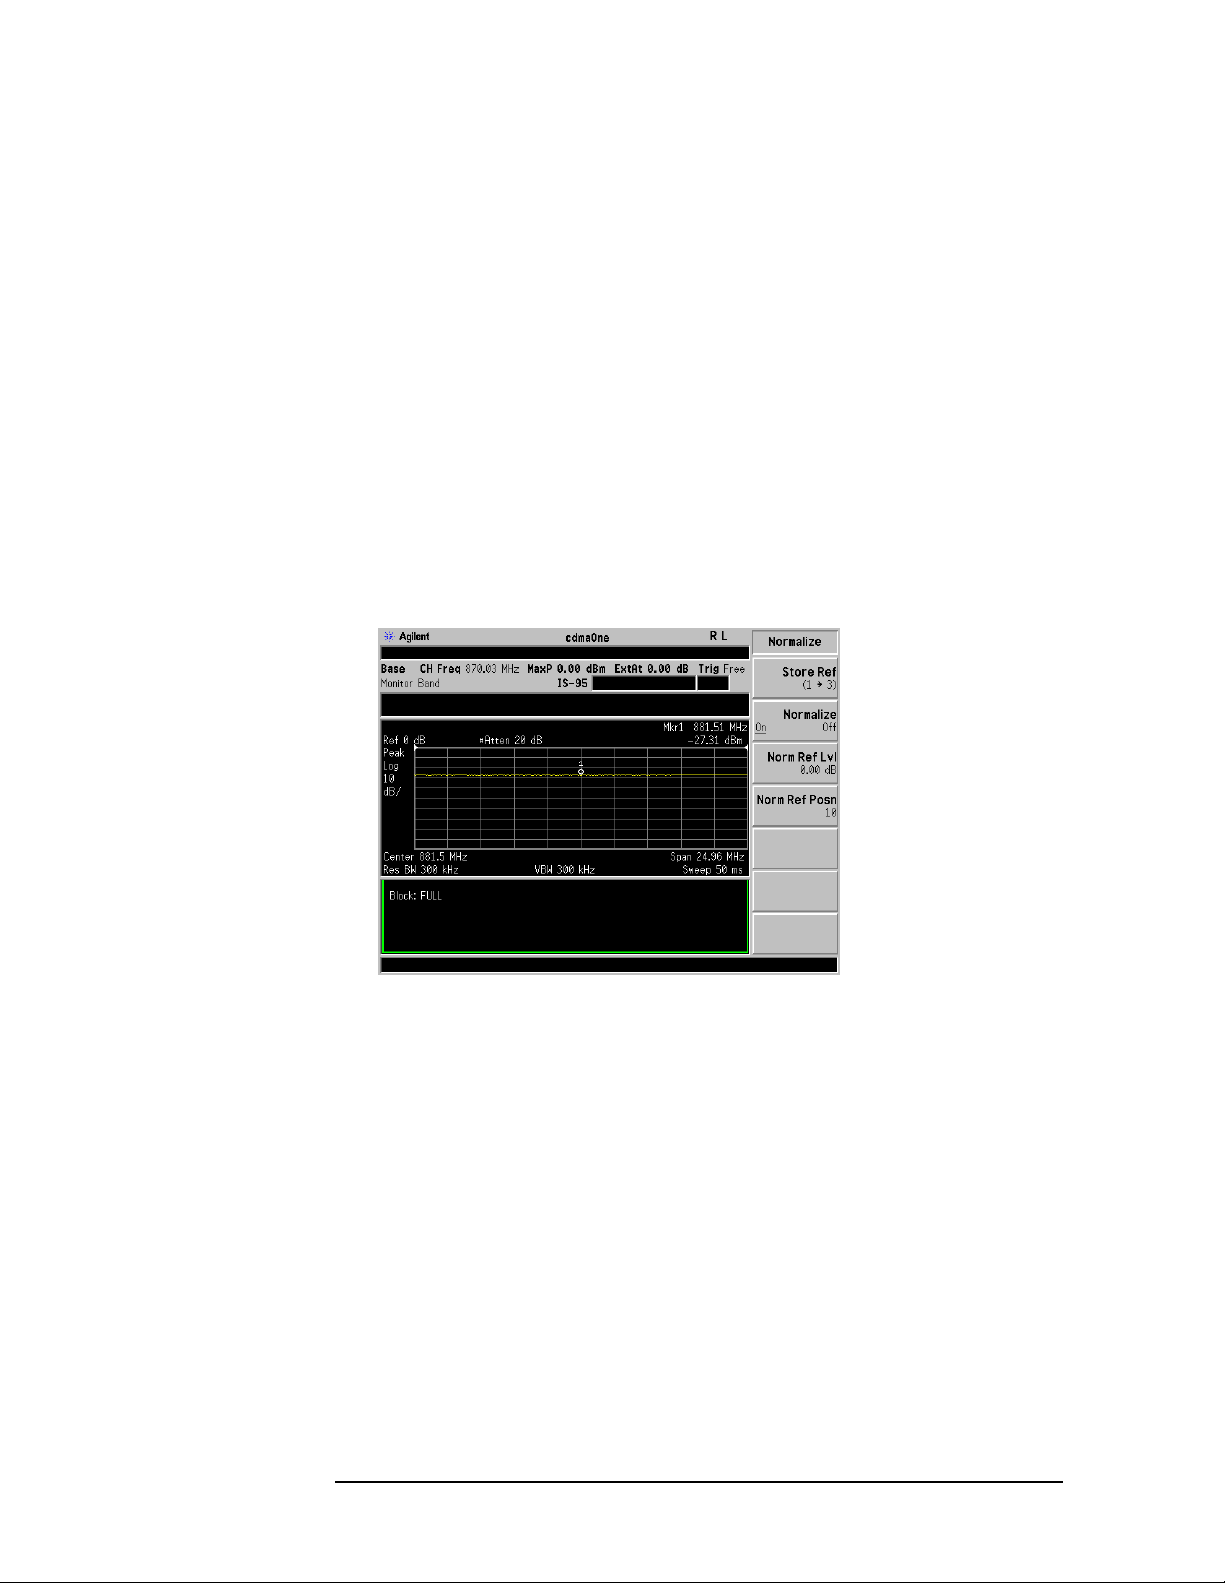
Measurement Normalization
1. Connect the tracking generator, signal separation device, 50 ohm
load, and the spectrum analyzer input as shown in Figure 3-24.
Figure 3-24 Normalizing the Measurement
2. If the mode has not already been set to cdmaOne, press
cdmaOne.
MODE and
3. Press
Chapter 3 3-29
MEASURE, More, and Monitor Band/Channel.
Making Basic cdmaOne Base Station Measurements
Making Return Loss Measurements
4. Set the measurement method to Band by pressing Meas Setup and
Method until Band is underlined.
5. Turn on the RF Tracking Generator by pressing
Amplitude until On is underlined.
a. Set an amplitude level appropriate for the device under test. The
default value is −10 dBm. For systems with higher loss, you may
use 0 dBm.
6. Make all measurements relative by pressing
Normalize, Store Ref (1→3), and then press Normalize until On is
underlined.
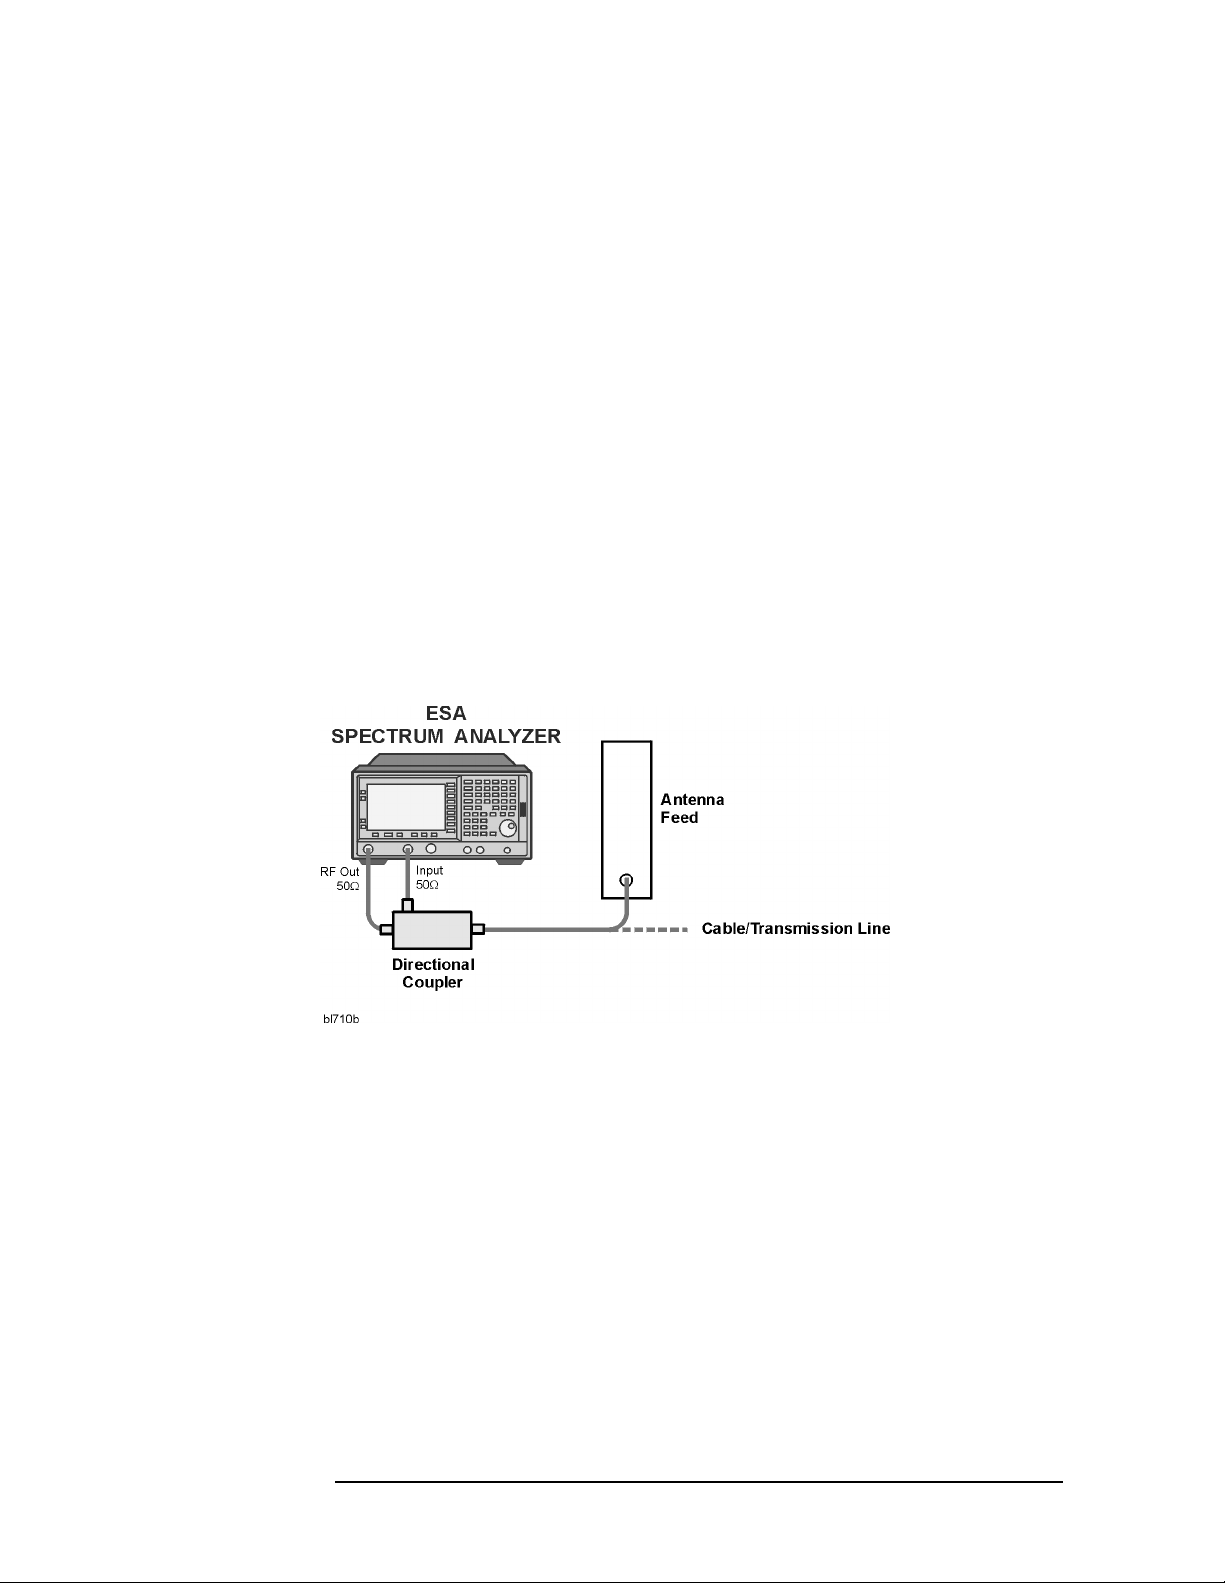
Measurement
1. Ensure that the base transceiver station is in service.
2. Connect the tracking generator, signal separation device, device
being measured, and the spectrum analyzer input as shown in
Figure 3-25.
Figure 3-25 Measurement Setup
Source and then
View/Trace, More,
3. Set the view to Trace 3 by pressing
View/Trace, Trace 3, and Blank.
4. Use the marker to locate any reflected signal by pressing
Peak Search.
Convert the peak dBm value into VSWR using Table 3-2 on page 3-31.
5.
6. To save the measurement results, refer to ESA Spectrum Analyzers
User’s Guide.
3-30 Chapter3

Converting return loss to VSWR
Return loss can be expressed as a voltage standing wave ratio (VSWR)
value using the following table or formula.
Table 3-2 Power to VSWR Conversion
Making Basic cdmaOne Base Station Measurements
Making Return Loss Measurements
Return
Loss
(dB)
4.0 4.42 14.0 1.50 18.0 1.29 28.0 1.08 38.0 1.03
6.0 3.01 14.2 1.48 18.5 1.27 28.5 1.08 38.5 1.02
8.0 2.32 14.4 1.47 19.0 1.25 29.0 1.07 39.0 1.02
10.0 1.92 14.6 1.46 19.5 1.24 29.5 1.07 39.5 1.02
10.5 1.85 14.8 1.44 20.0 1.22 30.0 1.07 40.0 1.02
11.0 1.78 15.0 1.43 20.5 1.21 30.5 1.06 40.5 1.02
11.2 1.76 15.2 1.42 21.0 1.20 31.0 1.06 41.0 1.02
11.4 1.74 15.4 1.41 21.5 1.18 31.5 1.05 41.5 1.02
11.6 1.71 15.6 1.40 22.0 1.17 32.0 1.05 42.0 1.02
11.8 1.69 15.8 1.39 22.5 1.16 32.5 1.05 42.5 1.02
12.0 1.67 16.0 1.38 23.0 1.15 33.0 1.05 43.0 1.01
12.2 1.65 16.2 1.37 23.5 1.14 33.5 1.04 43.5 1.01
12.4 1.63 16.4 1.36 24.0 1.13 34.0 1.04 44.0 1.01
VSWR Return
Loss
(dB)
VSWR Return
Loss
(dB)
VSWR Return
Loss
(dB)
VSWR Return
Loss
(dB)
VSWR
12.6 1.61 16.6 1.35 24.5 1.13 34.5 1.04 44.5 1.01
12.8 1.59 16.8 1.34 25.0 1.12 35.0 1.04 45.0 1.01
13.0 1.58 17.0 1.33 25.5 1.11 35.5 1.03 45.5 1.01
13.2 1.56 17.2 1.32 26.0 1.11 36.0 1.03 46.0 1.01
13.4 1.54 17.4 1.31 26.5 1.10 36.5 1.03 46.5 1.01
13.6 1.53 17.6 1.30 27.0 1.09 37.0 1.03 47.0 1.01
13.8 1.51 17.8 1.30 27.5 1.09 37.5 1.03 47.5 1.01
RL–
---------20
+
RL–
---------20
–
VSWR
110
-----------------------=
110
Where: RL is the measured return loss value.
Chapter 3 3-31
Making Basic cdmaOne Base Station Measurements
Making Return Loss Measurements
VSWR is the relationship of the magnitude of the reflected signal and
the forwardsignal; it is expressed as a ratio (for example: 1.2:1 VSWR).
The first number is the VSWR value taken from the table or calculated
using the formula. The second number is always 1."
Results
Some of the energy incident upon a device can be reflected back towards
the source. A return loss measurement quantifies this reflected energy.
This measurement provides a relative measure of the transmission
power that is being reflected back to the transmitter. Save the results
as a baseline measurement to compare to measurements taken in the
future. If this measurement has been made in the past. Compare this
results to the baseline values. Degeneration can be determined on a
relative basis.
Figure 3-26 Example Bandpass Filter Return Loss Measurement
Troubleshooting Hints
If you do not obtain the expected results do the following:
• Repeat the setup procedure to check the integrity of the test
connections.
• Check VSWR to verify maximum power transfer.
3-32 Chapter3

Making Basic cdmaOne Base Station Measurements
Making Loss/Gain Measurements
Making Loss/Gain Measurements
Purpose
Gain/Loss measurements are used to verify the performance of system
devices or components. The gain of an active device or losses through a
passive device can be monitored and trended to anticipate failure. For
example:
• Lower than expected base station power measurements could be
caused by faulty cables. The severity of the cable loss can be
determined by measuring the loss and comparing the result to the
expected value.
• A lower than expected amplifier gain measurement could indicate a
fault and incipient failure with the amplifier.
Measurement Method
You can only make the Loss/Gain measurement intrusively. Take the
measurement directly from the antenna feed port as shown in
Figure 3-28. Because you disconnect the antenna from the transceiver
and disrupt the transmission signal, this can not be considered a
non-intrusive test. Enter the loss due to the effect of the coupler as
external attenuation.
CAUTION Ensure that the power level at the RF input of the spectrum analyzer
does not exceed the damage level of 30 dBm.
Measurement Hints
• If making a passband-ripple measurement, the spectrum analyzer
requires a narrow span and typically < 10 dB per vertical division to
get more resolution on the display.
• If making a stop-band attenuation measurement, the spectrum
analyzer requires a wide span and a narrow RBW filter.
• Optimize the analyzer sensitivity by reducing attenuation and
turning on the preamplifier (option 1DS). This will reduce the noise
floor of the analyzer to uncover any hidden low level signals.
Making the measurement
Measurement Normalization
1. Connect the tracking generator to the spectrum analyzer 50 ohm RF
input as shown in Figure 3-27.
Chapter 3 3-33

Making Basic cdmaOne Base Station Measurements
Making Loss/Gain Measurements
Figure 3-27 Normalizing the Measurement
2. If the mode has not already been set to cdmaOne, press
cdmaOne.
MODE and
3. To immediately make Monitor Channel/Band the active
measurement, press MEASURE and Monitor Band/Channel.
4. Set the measurement parameters to the default values by pressing
Meas Setup, More and Restore Meas Defaults.
NOTE The factory default settings provide a cdmaOne compliant
measurement. You will need to change some of the settings for this
measurement.
5. Set the measurement method to Band by pressing
Method until Band is underlined.
6. Select the desired center frequency by pressing
press the appropriate menu key
Temp Ctr Freq. Enter the desired channel number or frequency value
and press
or
Hz (for frequency values).
NOTE If the desired RF Channel or Channel Freq has been set for a previous
Enter (for channel numbers) or a units key–GHz, MHz, kHz,
RF Channel, Channel Freq, or
Meas Setup and
FREQUENCY, then
measurement, it is used for all subsequent measurements, and it does
not need to be set again.
Setting a temporary center frequency does not affect any other
measurement and the measurement reverts to the Channel Frequency
on restart.
7. Turn on the RF Tracking Generator by pressing
Amplitude until On is underlined.
Source and then
8. Set an amplitude level appropriate for the device under test. The
default value is −10 dBm. For systems with higher loss, you may use
0 dBm.
9. Normalize the measurement bypressing View/Trace, More, Normalize,
Store Ref (1→3), and Normalize until On is underlined.
3-34 Chapter3

Measurement
1. Ensure that the base transceiver station is in service.
2. Connect the tracking generator, signal separation device, device
being measured, and the spectrum analyzer input as shown in
Figure 3-25.
Figure 3-28 Measurement Setup
Making Basic cdmaOne Base Station Measurements
Making Loss/Gain Measurements
3. Set the view to Trace 3 by pressing View/Trace, Trace 3, and Blank.
4. Use the marker to locate any reflected signal by pressing
Peak Search.
5. To save the measurement results, refer to ESA Spectrum Analyzers
User’s Guide.
Chapter 3 3-35
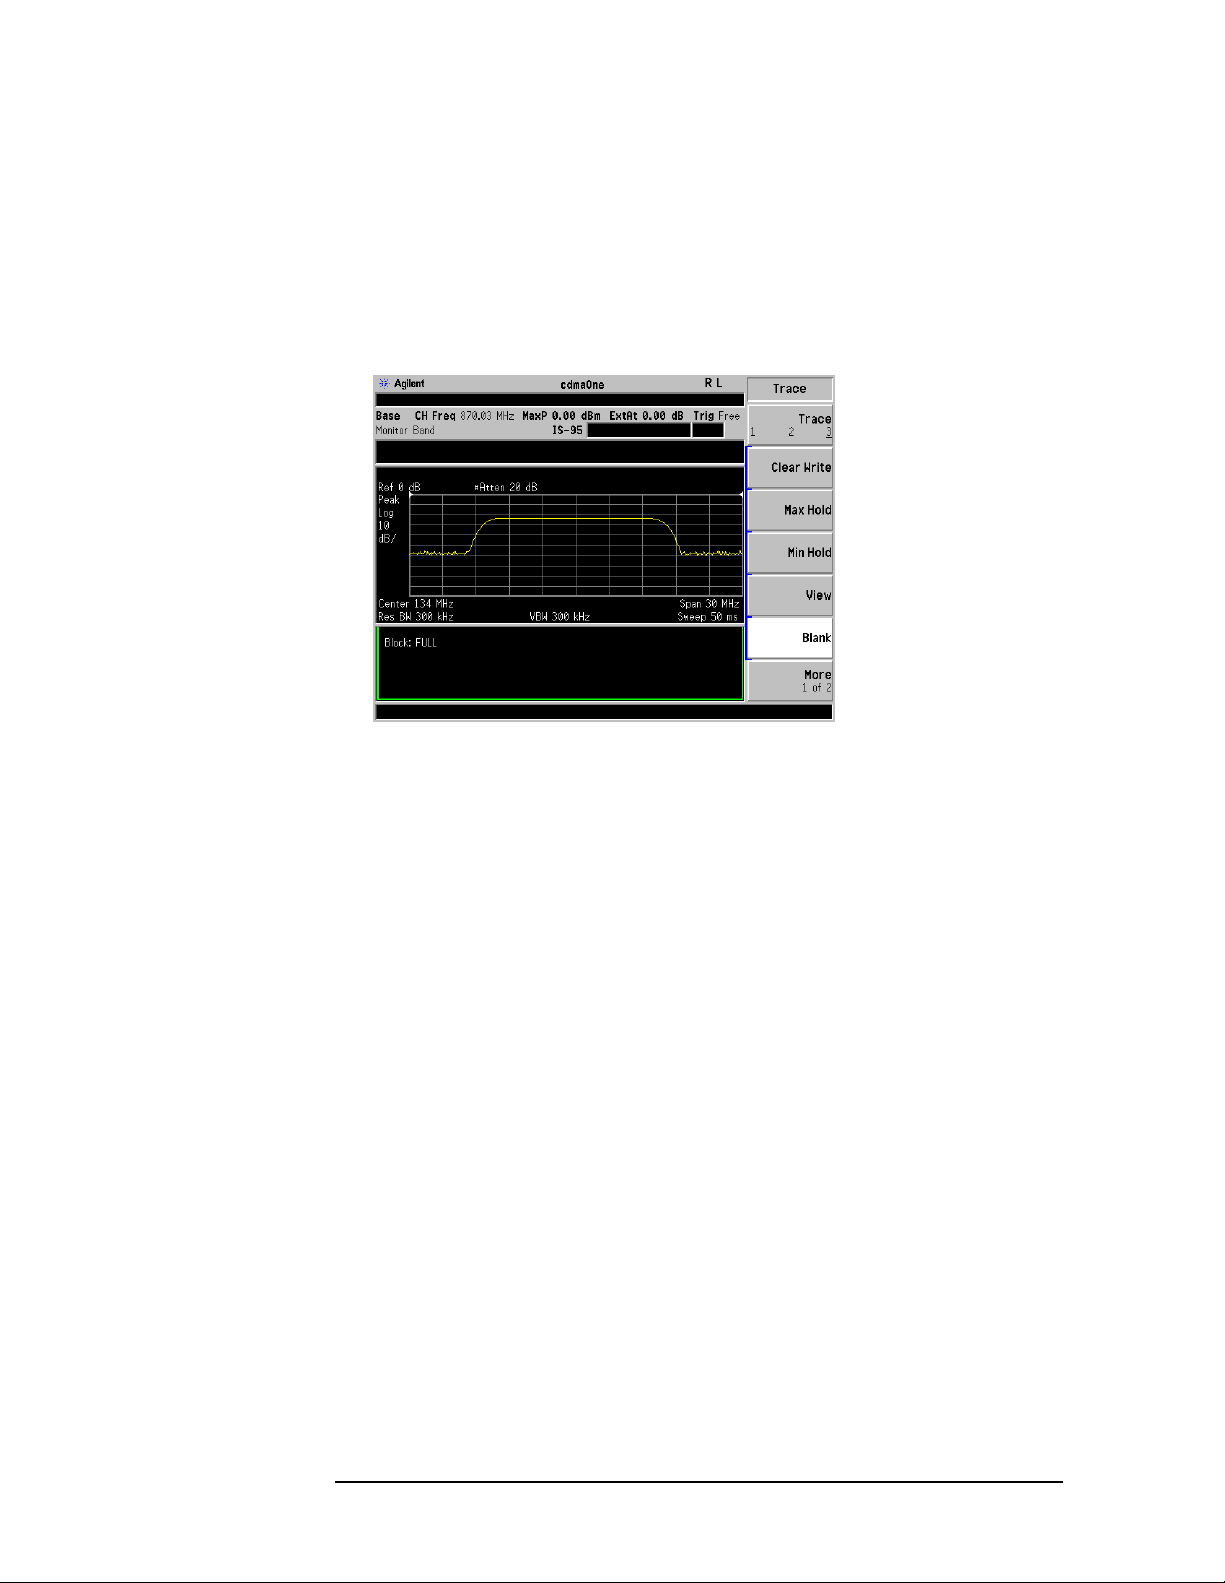
Making Basic cdmaOne Base Station Measurements
Making Loss/Gain Measurements
Results
Some of the energy incident upon a device can be reflected back towards
the source. A return loss measurement quantifies this reflected energy.
This measurement provides a relative measure of the transmission
power that is being reflected back to the transmitter.
Figure 3-29 Example loss/gain measurement for a bandpass filter
Troubleshooting Hints
If you do not obtain the expected results, repeat the setup procedure to
check the integrity of the test connections.
3-36 Chapter3

4 Making Advanced cdmaOne Base
Station Measurements
4-1

Making Advanced cdmaOne Base Station Measurements
Available Advanced cdmaOne Measurements
Available Advanced cdmaOne Measurements
The following advanced cdmaOne base transceiver station
measurements are described in this chapter:
❏ Code Domain Power on page 4-3
❏ Modulation Accuracy (Rho) on page 4-8
❏ Spur Close on page 4-13
❏ Out of Band Spurious on page 4-18
❏ Receiver Spurious on page 4-23
❏ Spurs at Harmonics on page 4-29
These are referred to as one-button measurements.When you press the
key to select the measurement it will become the active measurement,
using settings and a display unique to that measurement. Data
acquisitions will automatically begin provided trigger requirements, if
any, are met.
In addition, the following spectrum analyzer mode measurements are
described in this chapter to provide thorough cdmaOne base
transceiver station troubleshooting:
❏ Microwave Transmitter Power on page 4-33
❏ Microwave Spectrum Monitoring on page 4-36
❏ Microwave Adjacent Channel Power (ACP) on page 4-39
4-2 Chapter4

Making Advanced cdmaOne Base Station Measurements
Making the Code Domain Measurement (Base Station Only)
Making the Code Domain Measurement
(Base Station Only)
Purpose
This measurement determines the power associated with each Walsh
code (0 to 63). The traffic channel and paging channel measured powers
are given relative to the pilot channel. The power measured in the
inactive traffic channels is primarily the excess noise in the system.
This noise can either come from the power in Walsh channels that are
not correlated or from excess noise generated in the UUT. Poor code
domain performance will result in lost calls and degraded signal
quality.
Measurement Method
You can make the Code Domain measurement intrusively or
non-intrusively. To perform a non-intrusive test, connect a directional
coupler to the RF output with the main arm connected to the antenna
and the coupled port connected to the spectrum analyzer as shown in
Figure 4-1. Enter the loss due to the effect of the coupler as external
attenuation. You may also perform a non-intrusive test by making the
measurement at a test port on the transceiver unit, if available.
You can use the intrusive method by taking the measurement directly
from the RF output port of the transceiver, as shown in Figure 4-2.
Because you disconnect the antenna from the transceiver and disrupt
the transmission signal, this can not be considered a non-intrusive test.
The transceiver will not be able to communicate with users on the
system.
NOTE Use of a non-intrusive measurement is recommended.
CAUTION If you use the intrusive method, ensure that the power level at the RF
input of the spectrum analyzer does not exceed the damage level of
30 dBm.
Measurement Hints
The time bases of the base station and the spectrum analyzer should be
locked together.
Chapter 4 4-3
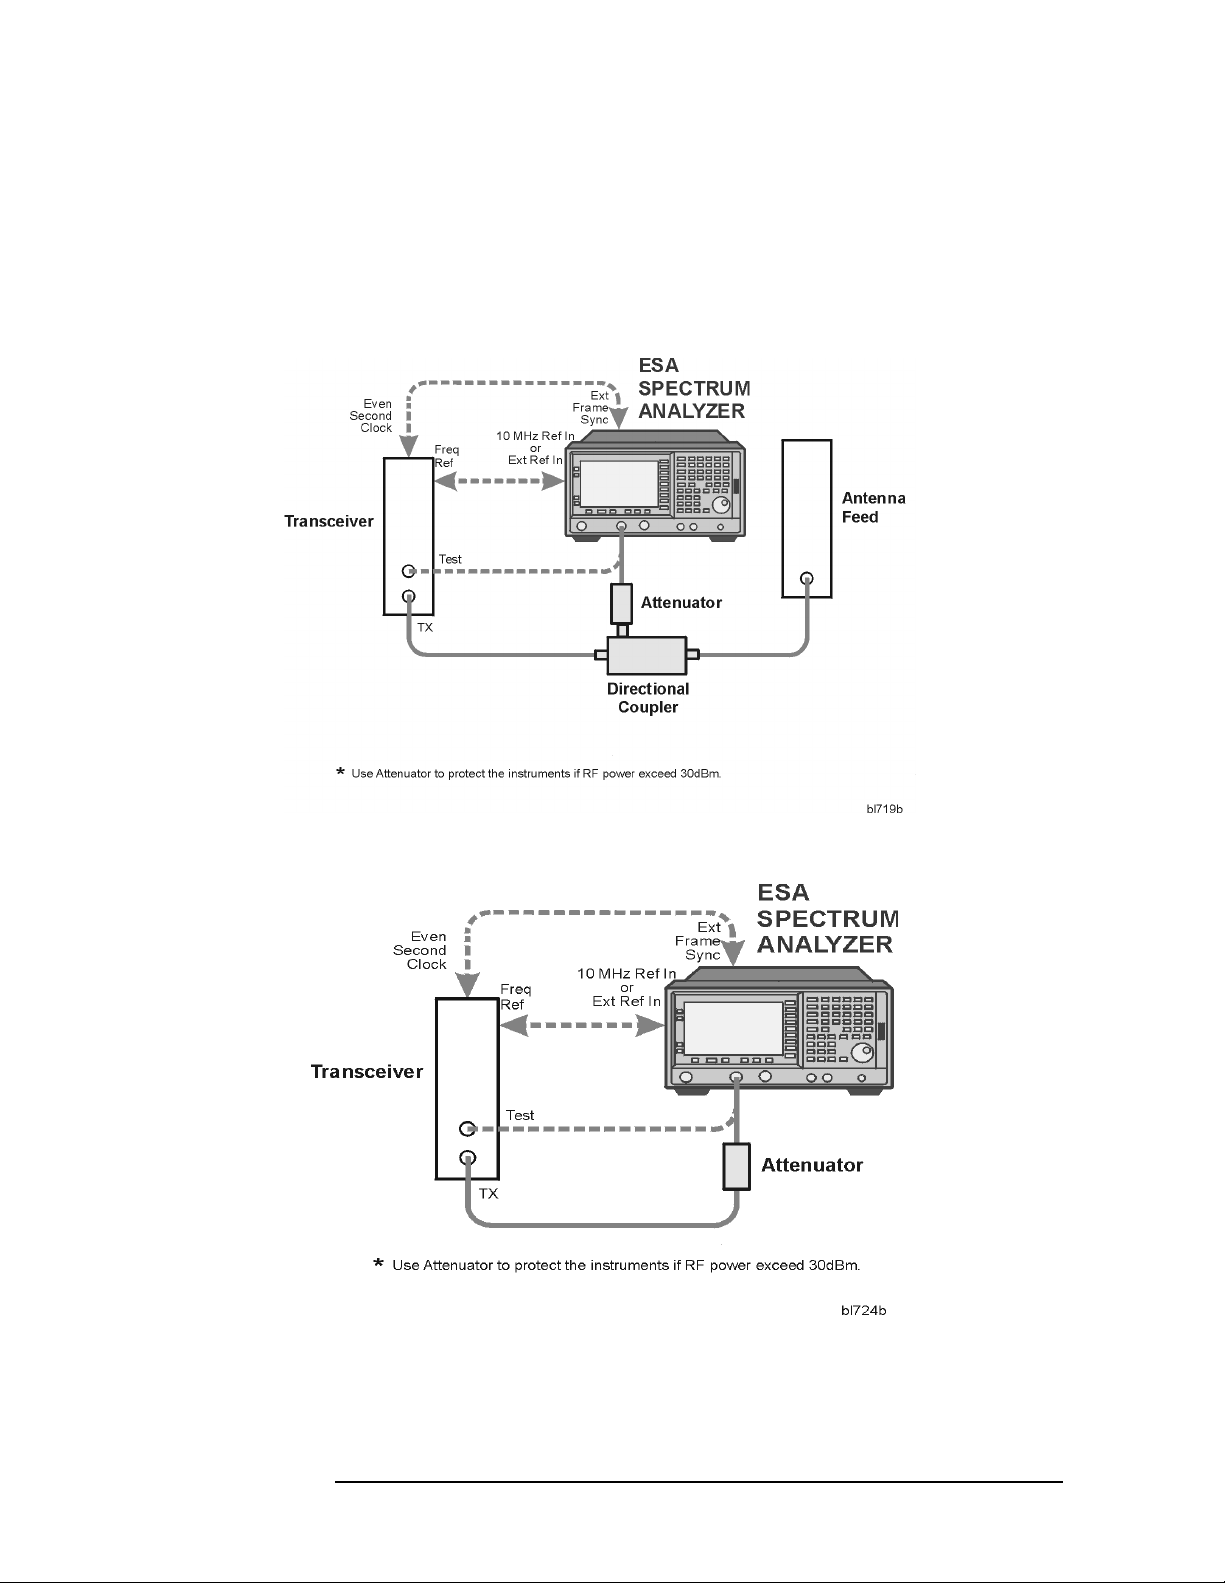
Making Advanced cdmaOne Base Station Measurements
Making the Code Domain Measurement (Base Station Only)
Making the Measurement
1. Ensure that the base transceiver station is in service.
2. Connect the device being measured and the spectrum analyzer input
as shown in Figure 4-1 or Figure 4-2.
Figure 4-1 Measurement Setup
Figure 4-2 Alternative Measurement Setup
4-4 Chapter4

Making Advanced cdmaOne Base Station Measurements
Making the Code Domain Measurement (Base Station Only)
3. If the mode has not already been set to cdmaOne, press MODE and
cdmaOne.
4. Ensure that the correct Standard is selected by pressing
Mode Setup
and Radio….
5. To immediately make Code Domain Power the active measurement,
press MEASURE and Code Domain Power.
6. Select the desired center frequency by pressing
press the appropriate menu key
Temp Ctr Freq. Enter the desired channel number or frequency value
and press
or
Hz (for frequency values).
NOTE If the desired RF Channel or Channel Freq has been set for a previous
Enter (for channel numbers) or a units key–GHz, MHz, kHz,
RF Channel, Channel Freq, or
FREQUENCY, then
measurement, it is used for all subsequent measurements, and it does
not need to be set again.
Setting a temporary center frequency does not affect any other
measurement, and the measurement reverts to the Channel Frequency
on restart.
7. Set the measurement parameters to the default values by pressing
Meas Setup, More and Restore Meas Defaults.
NOTE The factory default settings provide a measurement compliant with the
selected standard. For special requirements, you may need to change
some of the settings. At any time, you can return all parameters for the
current measurement to the default settings by repeating this step.
8. If desired, set the measurement limits to On by pressing
More, and Limits.
Meas Setup,
9. To change any of the measurement parameters from the factory
default values, press the Meas Setup key to access menus that allow
you to modify the parameters for this measurement. For additional
information on keys to access measurement parameters, refer to the
Front-Panel Key Reference section of the ESA-E Series Spectrum
Analyzers cdmaOne Measurement Personality User’s Guide or use
the on screen help.
10.To save the measurement results, refer to ESA-E Series Spectrum
Analyzers cdmaOne Measurement Personality User’s Guide.
Chapter 4 4-5
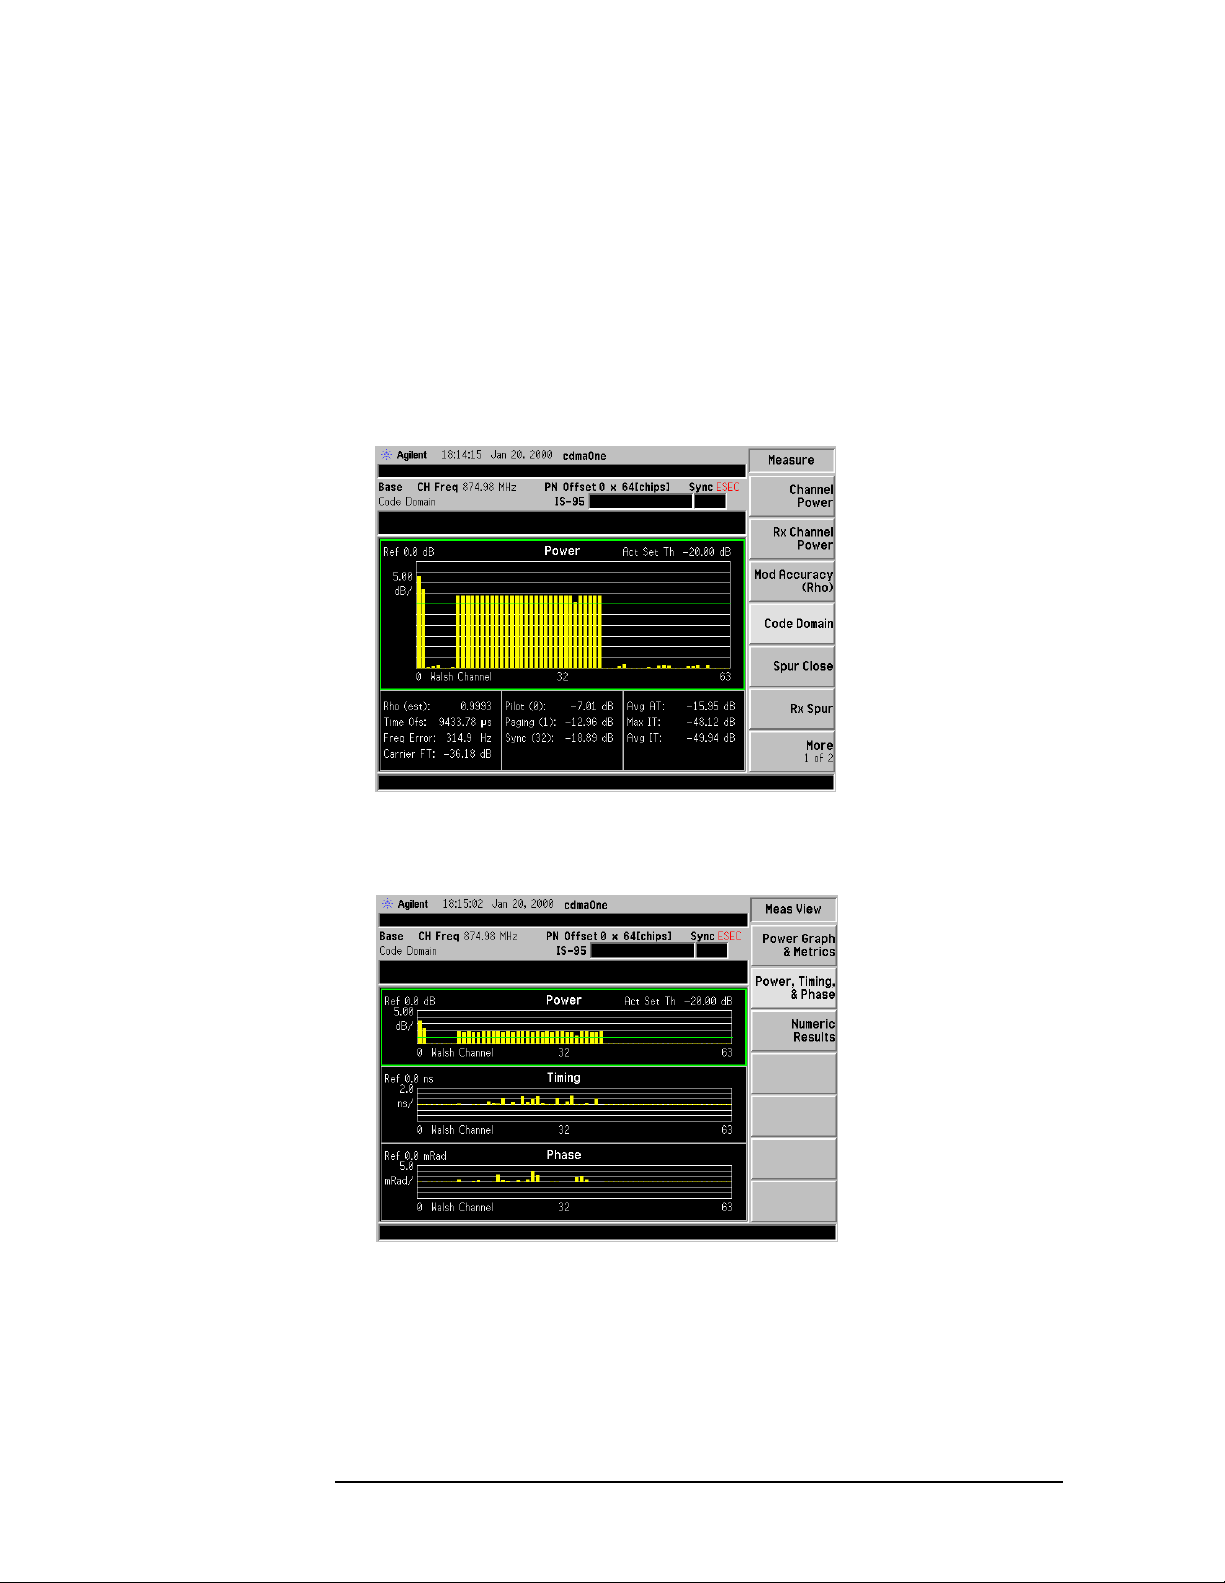
Making Advanced cdmaOne Base Station Measurements
Making the Code Domain Measurement (Base Station Only)
Results
The two results that should be observed closely are the “active traffic”
and “inactive traffic” level. If the inactive traffic levels are high relative
to the pilot channel, this could indicate excess noise in the system. This
could be caused by an I/Q problem that has the effect of not modulating
the carrier efficiently. A second cause of this could be a power amplifier
problem that results in the amplifier being driven into compression.
Figure 4-3 Code Domain Measurement Results—Power Graph and Metrics
View
Figure 4-4 Code Domain Measurement Results—Power, Timing, and Phase
View
4-6 Chapter4
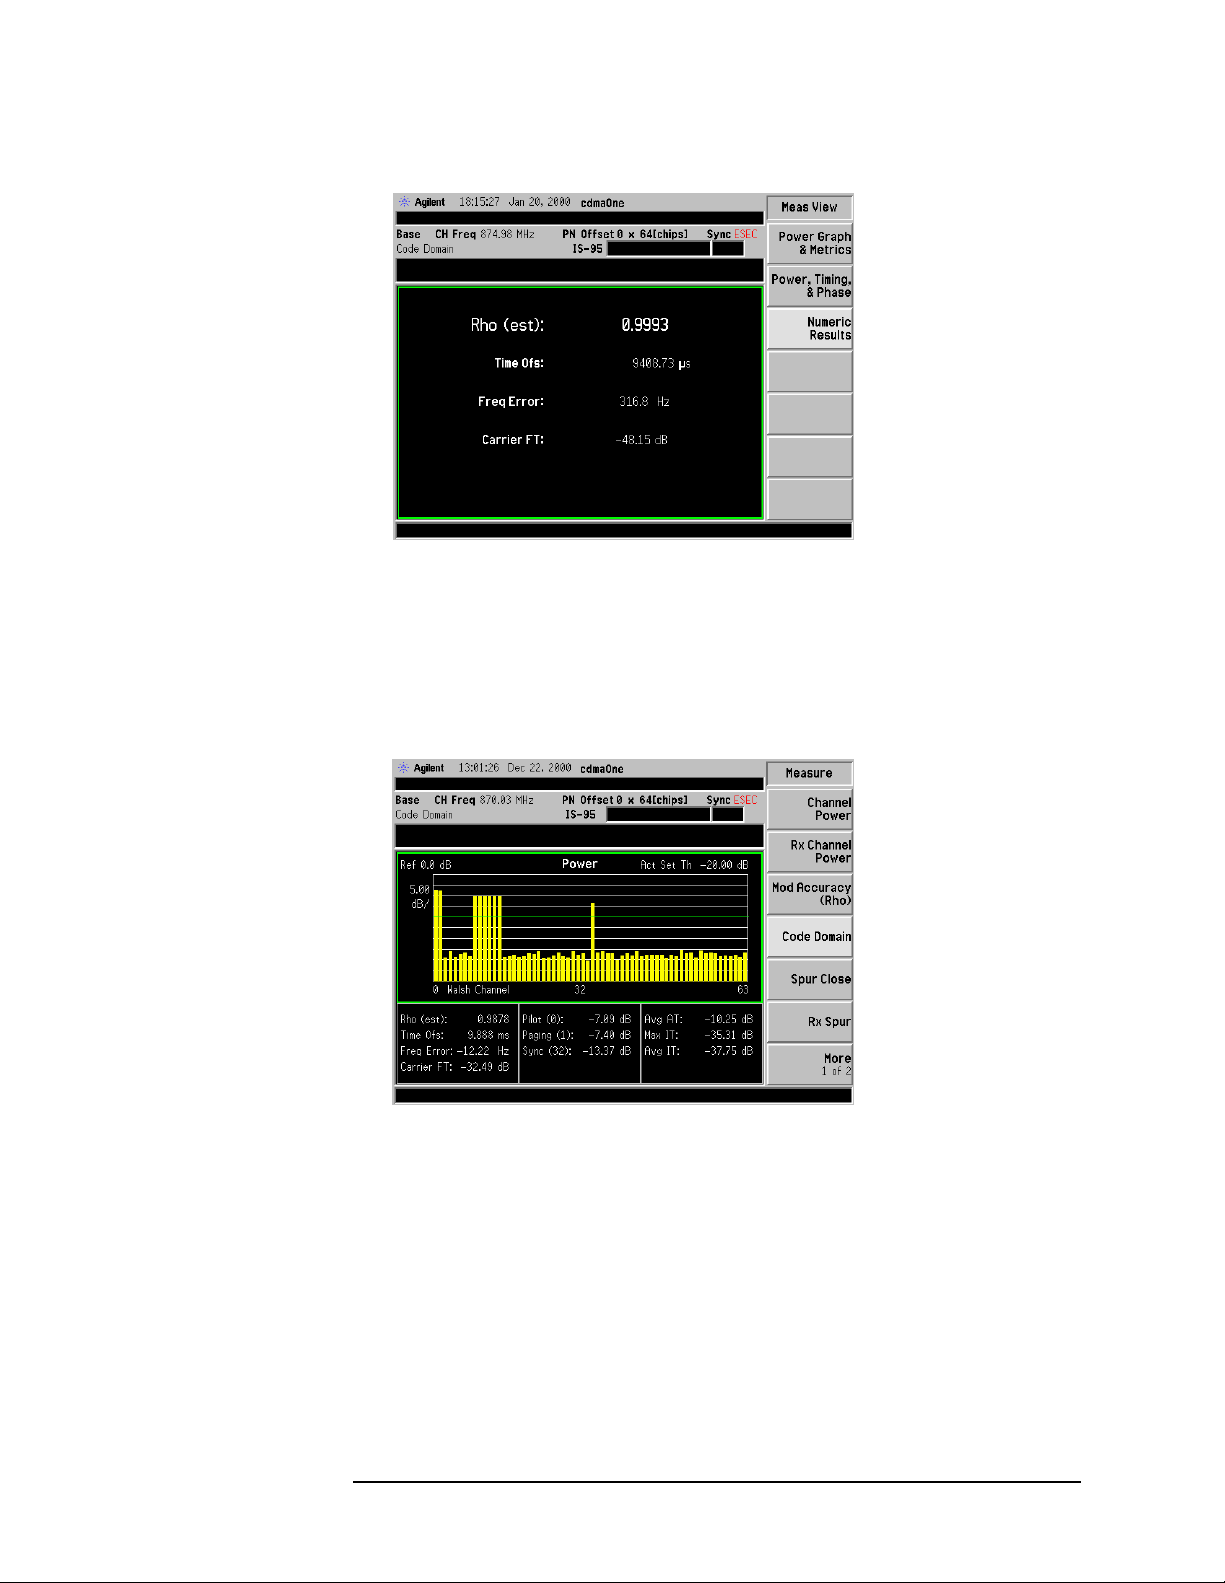
Making Advanced cdmaOne Base Station Measurements
Making the Code Domain Measurement (Base Station Only)
Figure 4-5 Code Domain Measurement Results—Numeric Results View
Troubleshooting Hints
High power in the inactive traffic channels (Avg IT) can indicate there is an
interfering signal present. Also, poor linear amplifier performance can cause
this type of effect.
Figure 4-6 Code Domain Noise
Chapter 4 4-7

Making Advanced cdmaOne Base Station Measurements
Making the Modulation Accuracy (Rho) Measurement
Making the Modulation Accuracy (Rho)
Measurement
Purpose
Rho is the ratio of correlated power to the total power transmitted. The
correlated power is computed by removing frequency phase and time
offsets, and performing a cross correlation between the corrected
measured signal and the ideal reference. If some of the transmitted
energy does not correlate, this excess appears as added noise that may
interfere with other users on the system.
Measurement Method
You can only make the rho measurementintrusively. When youperform
the rho measurement a carrier channel with a single pilot channel are
the only allowed active channels, and no other traffic channels or
paging channels may be present. (An estimated rho can be measured
non-intrusively by performing the code domain power measurement.)
The intrusive method takes the measurement directly from the RF
output port of the transceiver, as shown in Figure 4-7. Because you
disconnect the antenna from the transceiver and disrupt the
transmission signal, this can not be considered a non-intrusive test.
The transceiver will not be able to communicate with users on the
system.
You mayalso make an intrusive test byconnecting adirectional coupler
to the RF output with the main arm connected to the antenna and the
coupled port connected to the spectrum analyzer, as shown in Figure
4-8. You must ensure that only the pilot Walsh channel is active.
Because only a pilot channel will be observed, the transceiver will not
be able to communicate with users on the system.
CAUTION If you take the measurement directly from the RF output port of the
transceiver, ensurethat thepower level at the RF input of the spectrum
analyzer does not exceed the damage level of 30 dBm.
Measurement Hint
The time bases of the base station and the spectrum analyzer should be
locked together.
Making the Measurement
1. Ensure that the base transceiver station is in service with only the
pilot Walsh channel active.
4-8 Chapter4
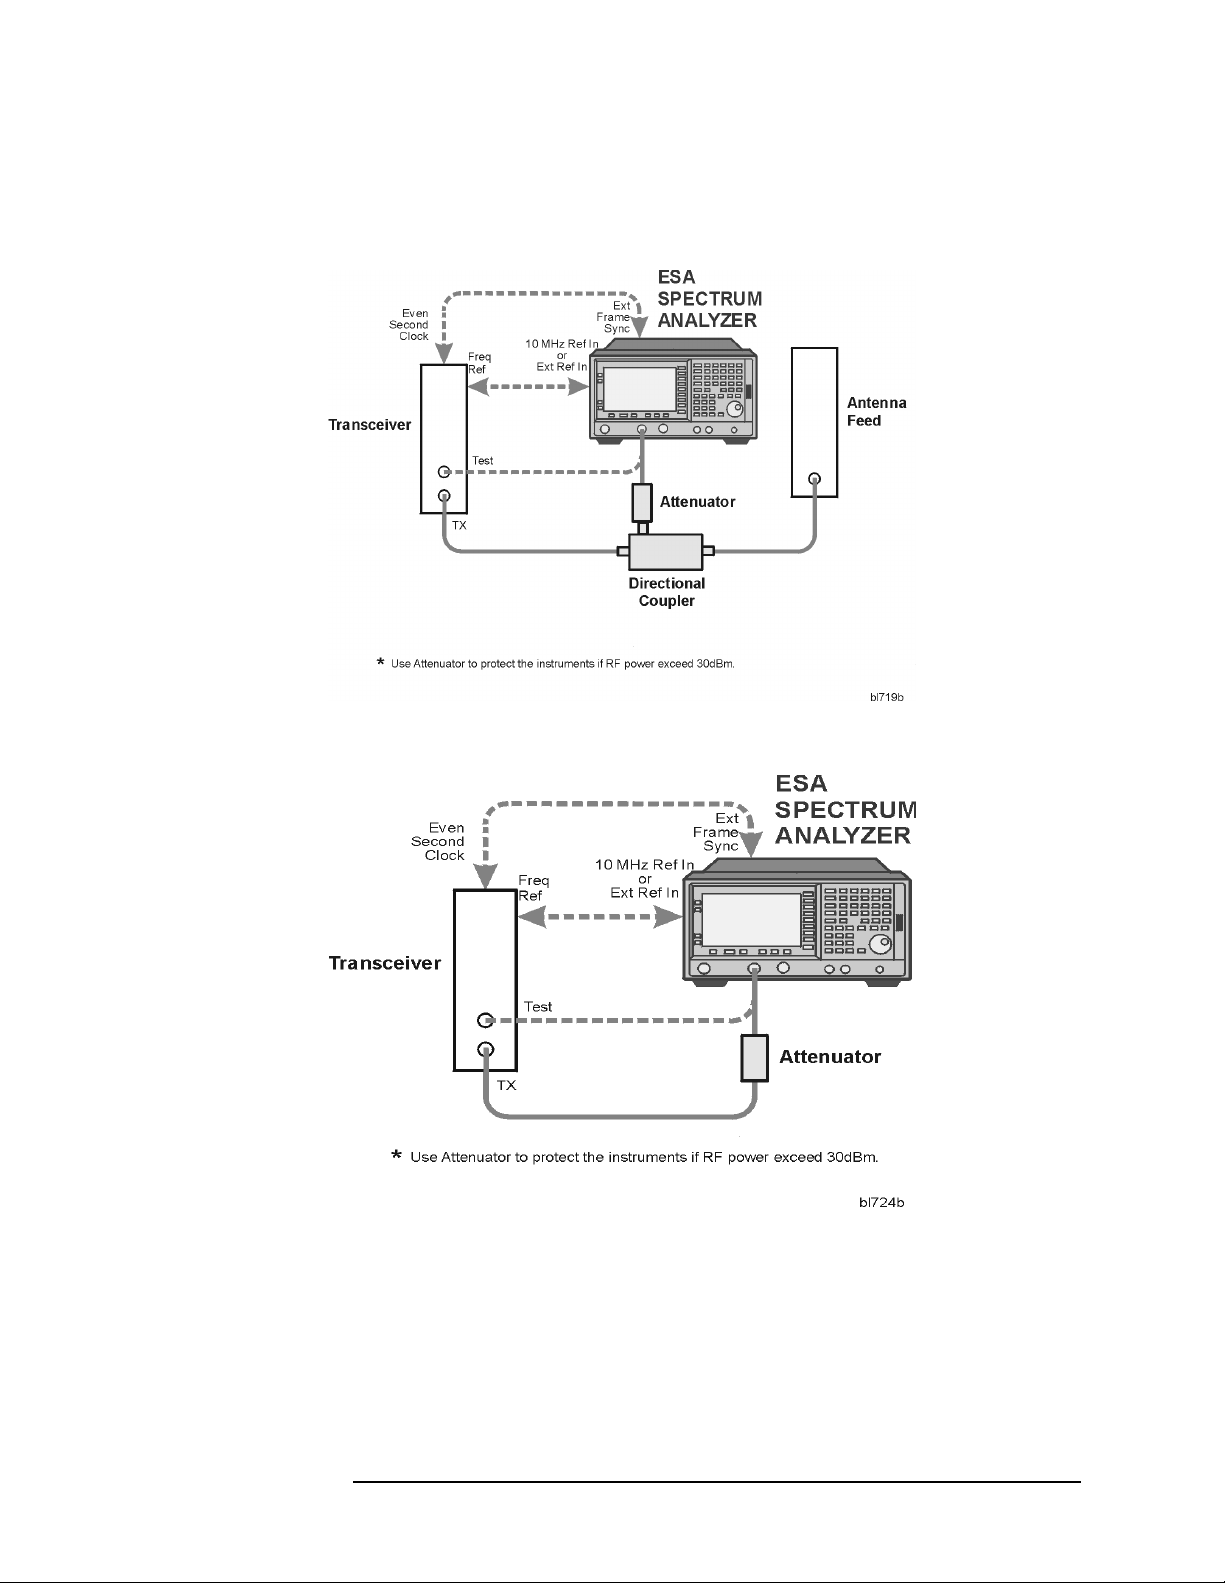
2. Connect the device being measured and the spectrum analyzer input
as shown in Figure 4-7 or Figure 4-8.
Figure 4-7 Measurement Setup
Making Advanced cdmaOne Base Station Measurements
Making the Modulation Accuracy (Rho) Measurement
Figure 4-8 Alternative Measurement Setup
3. Ensure that the correct Standard is selected by pressing
and Radio….
4. Ensure that the transmitter channel to be measured has only the
pilot Walsh channel active.
Mode Setup
Chapter 4 4-9

Making Advanced cdmaOne Base Station Measurements
Making the Modulation Accuracy (Rho) Measurement
5. If the mode has not already been set to cdmaOne, press MODE and
cdmaOne.
6. To immediately make Modulation Accuracy (Rho) the active
measurement, press MEASURE and Mod Accuracy (Rho).
7. Select the desired center frequency by pressing
press the appropriate menu key
Temp Ctr Freq. Enter the desired channel number or frequency value
and press
or
Hz (for frequency values).
NOTE If the desired RF Channel or Channel Freq has been set for a previous
Enter (for channel numbers) or a units key–GHz, MHz, kHz,
RF Channel, Channel Freq, or
FREQUENCY, then
measurement, it is used for all subsequent measurements, and it does
not need to be set again.
Setting a temporary center frequency does not affect any other
measurement, and the measurement reverts to the Channel Frequency
on restart.
8. Set the measurement parameters to the default values by pressing
Meas Setup, More and Restore Meas Defaults.
NOTE The factory default settings provide a measurement compliant with the
selected standard. For special requirements, you may need to change
some of the settings. At any time, you can return all parameters for the
current measurement to the default settings by repeating this step.
9. If desired, set the measurement limits to On by pressing
More, and Limits.
Meas Setup,
10.To change any of the measurement parameters from the factory
default values, press the Meas Setup key to access menus that allow
you to modify the parameters for this measurement. For additional
information on keys to access measurement parameters, refer to the
Front-Panel Key Reference section of the ESA-E Series Spectrum
Analyzers cdmaOne Measurement Personality User’s Guide or use
the on screen help.
11.To save the measurement results, refer to ESA-E Series Spectrum
Analyzers cdmaOne Measurement Personality User’s Guide.
4-10 Chapter4
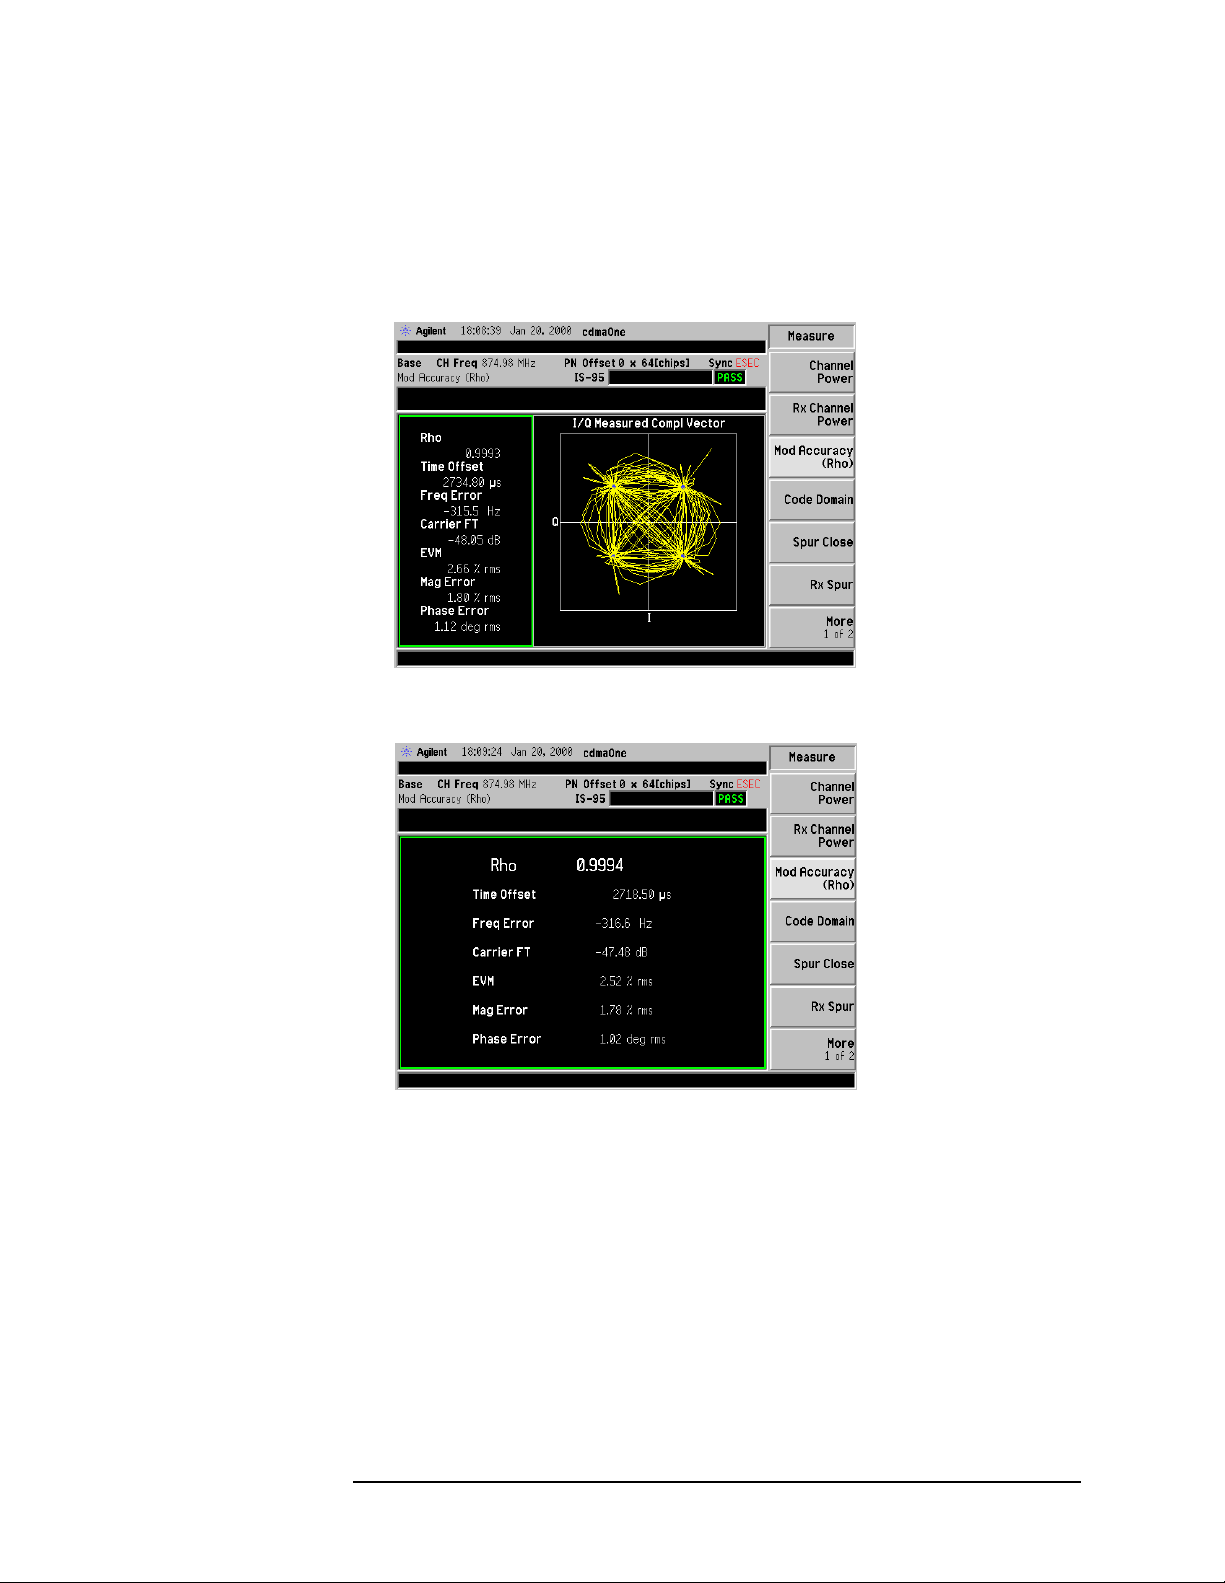
Making Advanced cdmaOne Base Station Measurements
Making the Modulation Accuracy (Rho) Measurement
Results
A poor rho result indicates that there is excess noise in the system. This
will effect the capacity of the cell and overall signal quality.
Figure 4-9 Rho Measurement Results—I/Q Measured Compl Vector View
Figure 4-10 Rho Measurement Results—Numeric Results View
Chapter 4 4-11

Making Advanced cdmaOne Base Station Measurements
Making the Modulation Accuracy (Rho) Measurement
Troubleshooting Hints
• Circles in the constellation indicate an interfering signal. If the
signal is modulated there will be no holes in the circles. This also
indicates a poor signal to noise ratio.
Figure 4-11 Modulation Interference
• An offset constellation or I/Q imbalance indicate a gain or phase
problem with the modulator.
Figure 4-12 I/Q Imbalance
4-12 Chapter4

Making Advanced cdmaOne Base Station Measurements
Making the Spur Close (In Band Spurious) Measurement
Making the Spur Close (In Band Spurious)
Measurement
Purpose
Spurious signals can be caused by different combinations of signals in
the transmitter. The spurious emissions from the transmitter that fall
within the system band (in band spurs) should be within the level
specified by the standard to guarantee minimum interference with
other frequency channels in the system.
Measurement Method
You can make the spur close measurement intrusively or
non-intrusively. To perform a non-intrusive test, connect a directional
coupler to the RF output with the main arm connected to the antenna
and the coupled port connected to the spectrum analyzer as shown in
Figure 4-13. Enter the loss due to the effect of the coupler as external
attenuation. You may also perform a non-intrusive test by making the
measurement at a test port on the transceiver unit, if available.
You can use the intrusive method by taking the measurement directly
from the RF output port of the transceiver as shown in Figure 4-14.
Because you disconnect the antenna from the transceiver and disrupt
the transmission signal, this can not be considered a non-intrusive test.
The transceiver will not be able to communicate with users on the
system.
NOTE Use of a non-intrusive measurement is recommended.
CAUTION If you use the intrusive method, ensure that the power level at the RF
input of the spectrum analyzer does not exceed the damage level of
30 dBm.
NOTE All limits are set assuming a 30 kHz RBW is used.
Making the Measurement
1. Ensure that the base transceiver station is in service.
2. Connect the device being measured and the spectrum analyzer input
as shown in Figure 4-13 or Figure 4-14.
Chapter 4 4-13

Making Advanced cdmaOne Base Station Measurements
Making the Spur Close (In Band Spurious) Measurement
Figure 4-13 Measurement Setup
Figure 4-14 Alternative Measurement Setup
3. If the mode has not already been set to cdmaOne, press
cdmaOne.
4. To immediately make Close-In Spurious the active measurement,
press MEASURE and Spur Close.
MODE and
4-14 Chapter4

Making Advanced cdmaOne Base Station Measurements
Making the Spur Close (In Band Spurious) Measurement
5. Select the desired center frequency by pressing FREQUENCY, then
press the appropriate menu key (
the desired channel number or frequency value and press
channel numbers) or a units key–
RF Channel or Channel Freq), enter
Enter (for
GHz, MHz, kHz,orHz (for frequency
values).
NOTE If the desired RF Channel or Channel Freq has been set for a previous
measurement, it is used for all subsequent measurements, and it does
not need to be set again.
6. Set the measurement parameters to the default values by pressing
Meas Setup, More and Restore Meas Defaults.
NOTE The factory default settings provide a measurement compliant with the
selected standard. For special requirements, you may need to change
some of the settings. At any time, you can return all parameters for the
current measurement to the default settings by repeating this step.
7. If desired, set the measurement limits to Off by pressing
More, and Limits.
Meas Setup,
8. To change any of the measurement parameters from the factory
default values, press the Meas Setup key to access menus that allow
you to modify the parameters for this measurement. For additional
information on keys to access measurement parameters, refer to the
Front-Panel Key Reference section of the ESA-E Series Spectrum
Analyzers cdmaOne Measurement Personality User’s Guide or use
the on screen help.
9. To save the measurement results, refer to ESA-E Series Spectrum
Analyzers cdmaOne Measurement Personality User’s Guide.
Chapter 4 4-15

Making Advanced cdmaOne Base Station Measurements
Making the Spur Close (In Band Spurious) Measurement
Results
Figure 4-15 shows an example of the channel power portion of the
measurement results with the
through the channel power, lower, upper, and center segment views
during the measurement.
Figure 4-15 Spur Close Measurement Results—IS-95A - Channel Power
Meas Type set to Full. The display cycles
Figure 4-16 shows an example of the Center Segment results. The
display cycles through the channel power, lower, upper, and center
segment views during the measurement.
Figure 4-16 Spur Close Measurement Results—IS-95A - Center
4-16 Chapter4

Making Advanced cdmaOne Base Station Measurements
Making the Spur Close (In Band Spurious) Measurement
Troubleshooting Hint
If an external attenuator is used, be sure to include the attenuation
value in the measurement. This can be done by entering the
BS Ext Atten under the Input/Output front panel key or the Input… key on
the
Mode Setup menu.
Chapter 4 4-17

Making Advanced cdmaOne Base Station Measurements
Making the Out of Band Spurious Measurement
Making the Out of Band Spurious
Measurement
Purpose
This measurement will help verify that the transmitter meets
regulatory standards for emissions and that the transmitter is not
contributing to interference outside of the specified transmit band.
Measurement Method
The table-driven measurement has the flexibility to set up custom
parameters such as frequency, span, resolution bandwidth, and video
bandwidth. Up to the top 10 spurs can be viewed
You can make the Out of Band Spurious measurement intrusively or
non-intrusively. To perform a non-intrusive test, connect a directional
coupler to the RF output with the main arm connected to the antenna
and the coupled port connected to the spectrum analyzer as shown in
Figure 4-17. Enter the loss due to the effect of the coupler as external
attenuation. You may also perform a non-intrusive test by making the
measurement at a test port on the transceiver unit, if available.
You can use the intrusive method by taking the measurement directly
from the RF output port of the transceiver as shown in Figure 4-18.
Because you disconnect the antenna from the transceiver and disrupt
the transmission signal, this can not be considered a non-intrusive test.
The transceiver will not be able to communicate with users on the
system.
NOTE Use of a non-intrusive measurement is recommended.
CAUTION If you use the intrusive method, ensure that the power level at the RF
input of the spectrum analyzer does not exceed the damage level of
30 dBm.
Measurement Hints
• Use large resolution bandwidth for fast measurements, and a
narrow resolution bandwidth for increased sensitivity.
• Generally the frequency ranges that are prone to spurious emissions
are known. If they are unknown set wide frequency ranges.
• The measured channel power value used for the relative
measurements can be viewed at the top of the display.
4-18 Chapter4
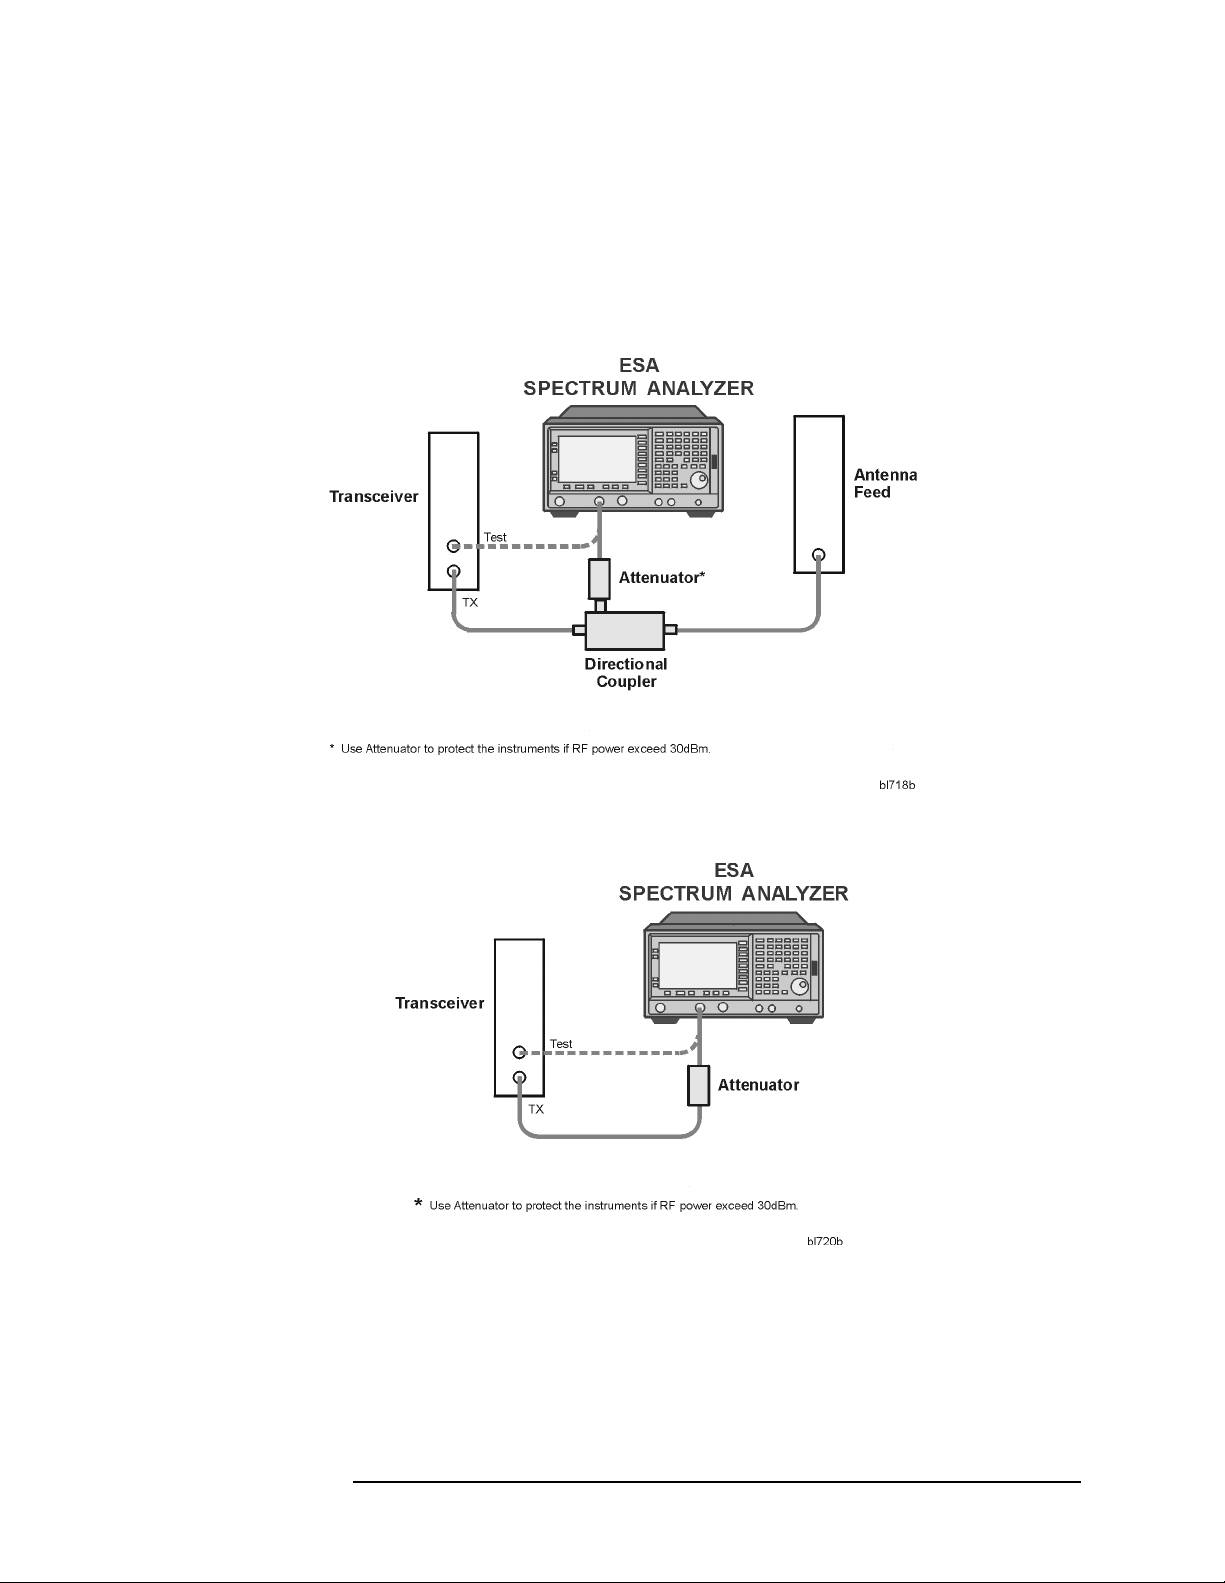
Making the Measurement
1. Ensure that the base transceiver station is in service.
2. Connect the device being measured and the spectrum analyzer input
as shown in Figure 4-17 or Figure 4-18
Figure 4-17 Measurement Setup
Making Advanced cdmaOne Base Station Measurements
Making the Out of Band Spurious Measurement
Figure 4-18 Alternative Measurement Setup
Chapter 4 4-19

Making Advanced cdmaOne Base Station Measurements
Making the Out of Band Spurious Measurement
3. If the mode has not already been set to cdmaOne, press MODE and
cdmaOne.
4. To immediately make Out of Band Spurious the active
measurement, press MEASURE, More, and Out of Band Spurious.
5. Select the desired transmit channel frequency by pressing
FREQUENCY, then press the appropriate menu key (RF Channel or
Channel Freq), enter the desired channel number or frequency value
and press
or
Hz (for frequency values).
NOTE If the desired RF Channel or Channel Freq has been set for a previous
Enter (for channel numbers) or a units key–GHz, MHz, kHz,
measurement, it is used for all subsequent measurements, and it does
not need to be set again.
6. Set the measurement parameters to the default values by pressing
Meas Setup, More and Restore Meas Defaults.
NOTE The factory default settings provide a measurement compliant with the
selected standard. For special requirements, you may need to change
some of the settings. At any time, you can return all parameters for the
current measurement to the default settings by repeating this step.
7. If desired, you may edit the spurs table or simply use the default
table.
Editing a Spurs Table
a. Press
Meas Setup, Edit Table…, and then select the range you wish
to edit.
b. Press Tab ← and → or the menu keys to navigate between data
fields.
c. Enter the desired values and press Enter.
d. To end editing and close the table, press
Return or any hard key.
The measurement will restart using the customized table.
Saving a Customized Spurs Table
a. After you complete the table edits, press
Save Table.
Loading a Customized Spurs Table
a. To load the customized table that was saved last, press
Meas Setup, Edit Table…, and Load Table.
4-20 Chapter4
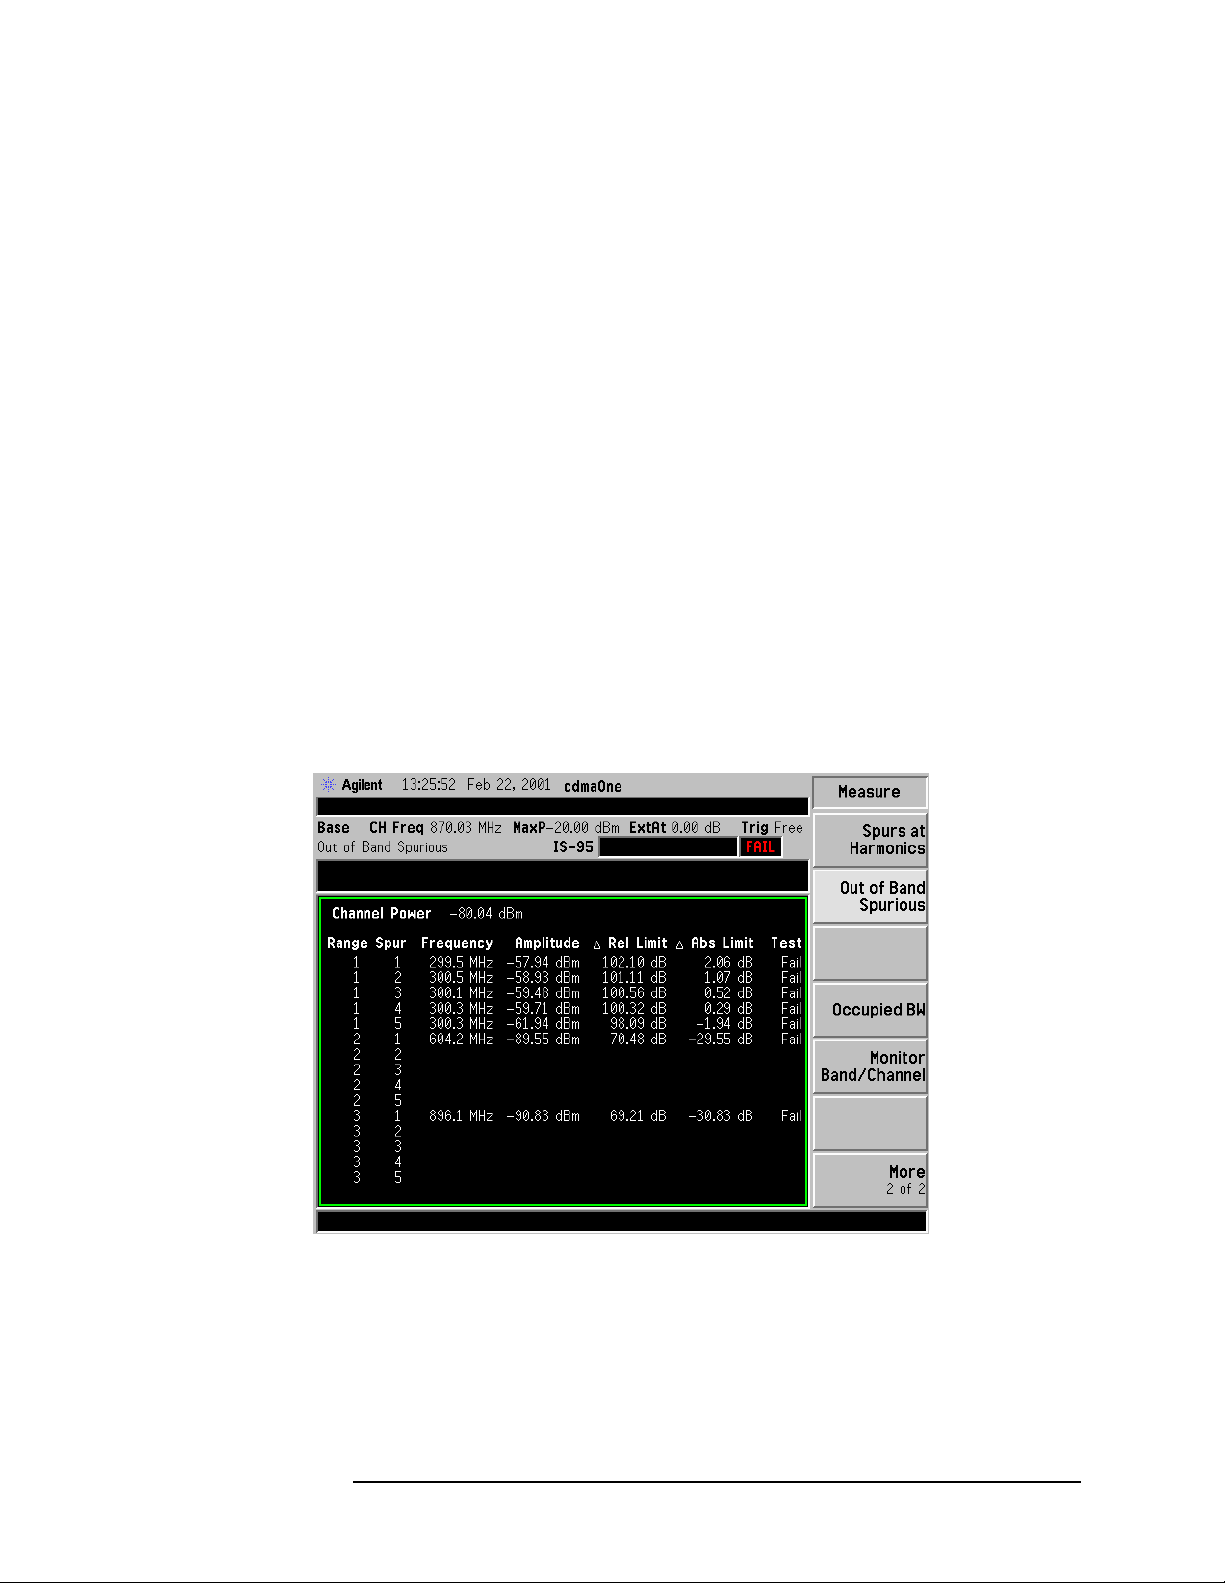
Making Advanced cdmaOne Base Station Measurements
Making the Out of Band Spurious Measurement
8. To change any of the measurement parameters from the factory
default values, press the
Meas Setup key to access menus that allow
you to modify the parameters for this measurement. For additional
information on keys to access measurement parameters, refer to the
Front-Panel Key Reference section of the ESA-E Series Spectrum
Analyzers cdmaOne Measurement Personality User’s Guide or use
the on screen help.
9. To save the measurement results, refer to ESA-E Series Spectrum
Analyzers cdmaOne Measurement Personality User’s Guide.
Results
The cdmaOne specification states that the total spurious emissions
outside the allocated system band including harmonics (in a 30 kHz
resolution bandwidth) should not exceed 60 dB below the mean output
channel bandwidth or -13 dBm, whichever is smaller. For this reason
limits can be set as both relative to the carrier or absolute values.
Figure 4-19 shows the tabular view of the Out of Band Spurious
measurement results. The test column in the data table indicates that
the range one spurs did not meet the test limit criteria.
Figure 4-19 Tabular Results View with Spur Failures
Chapter 4 4-21

Making Advanced cdmaOne Base Station Measurements
Making the Out of Band Spurious Measurement
Troubleshooting Hints
• If an external attenuator is used, be sure to include the attenuation
value in the measurement. This can be done by entering the
BS Ext Atten under the Input/Output front panel key or the Input… key
on the
• To determine if spurious signals are generated internally by the
ESA, increment the attenuator increasing the attenuation. If the
spurious signals decrease in amplitude, then the signals are
generated by the analyzer.
• In order to reduce out of band spurs, it might be necessary to reduce
the power of the transmitter.
Mode Setup menu.
4-22 Chapter4

Making Advanced cdmaOne Base Station Measurements
Making the Receiver Spurious (Rx Spur) Measurement
Making the Receiver Spurious (Rx Spur)
Measurement
Purpose
This measurement verifies that the receiver bands are free of
interference by measuring the spurious signals in the receiver channel
bandwidth specified by the selected standard and tuning plan. For
proper transceiver functionality, it is important that there is no
interference in the receive band. The receiver spurious measurement
will sweep the receive band and report the three strongest signals. This
measurement can also be used the sweep the transmet band for
spurious signals by setting the band to
Measurement Method
This procedure sweeps the specified transmitter or receiver frequency
block. If a carrier or strong signal is detected, the measurement will be
terminated until the carrier is turned off or removed. After determining
that there are no carriers present, the three higest peaks (if found) are
reported.
Tx under Meas Setup.
To improve repeatability, you can increase the number of averages.
You can make the Rx Spur measurement intrusively or non-intrusively.
To perform a non-intrusive test, connect a directional coupler to the RF
output with the main arm connected to the antenna and the coupled
port connected to the spectrum analyzer as shownin Figure4-20. Enter
the loss due to the effect of the coupler as external attenuation. You
may also perform a non-intrusive test by making the measurement at a
test port on the transceiver unit, if available.
You can use the intrusive method by taking the measurement directly
from the RF output port of the transceiver as shown in Figure 4-21.
Because you disconnect the antenna from the transceiver and disrupt
the transmission signal, this can not be considered a non-intrusive test.
The transceiver will not be able to communicate with users on the
system.
NOTE Use of a non-intrusive measurement is recommended.
CAUTION If you use the intrusive method, ensure that the power level at the RF
input of the spectrum analyzer does not exceed the damage level of
30 dBm.
Chapter 4 4-23
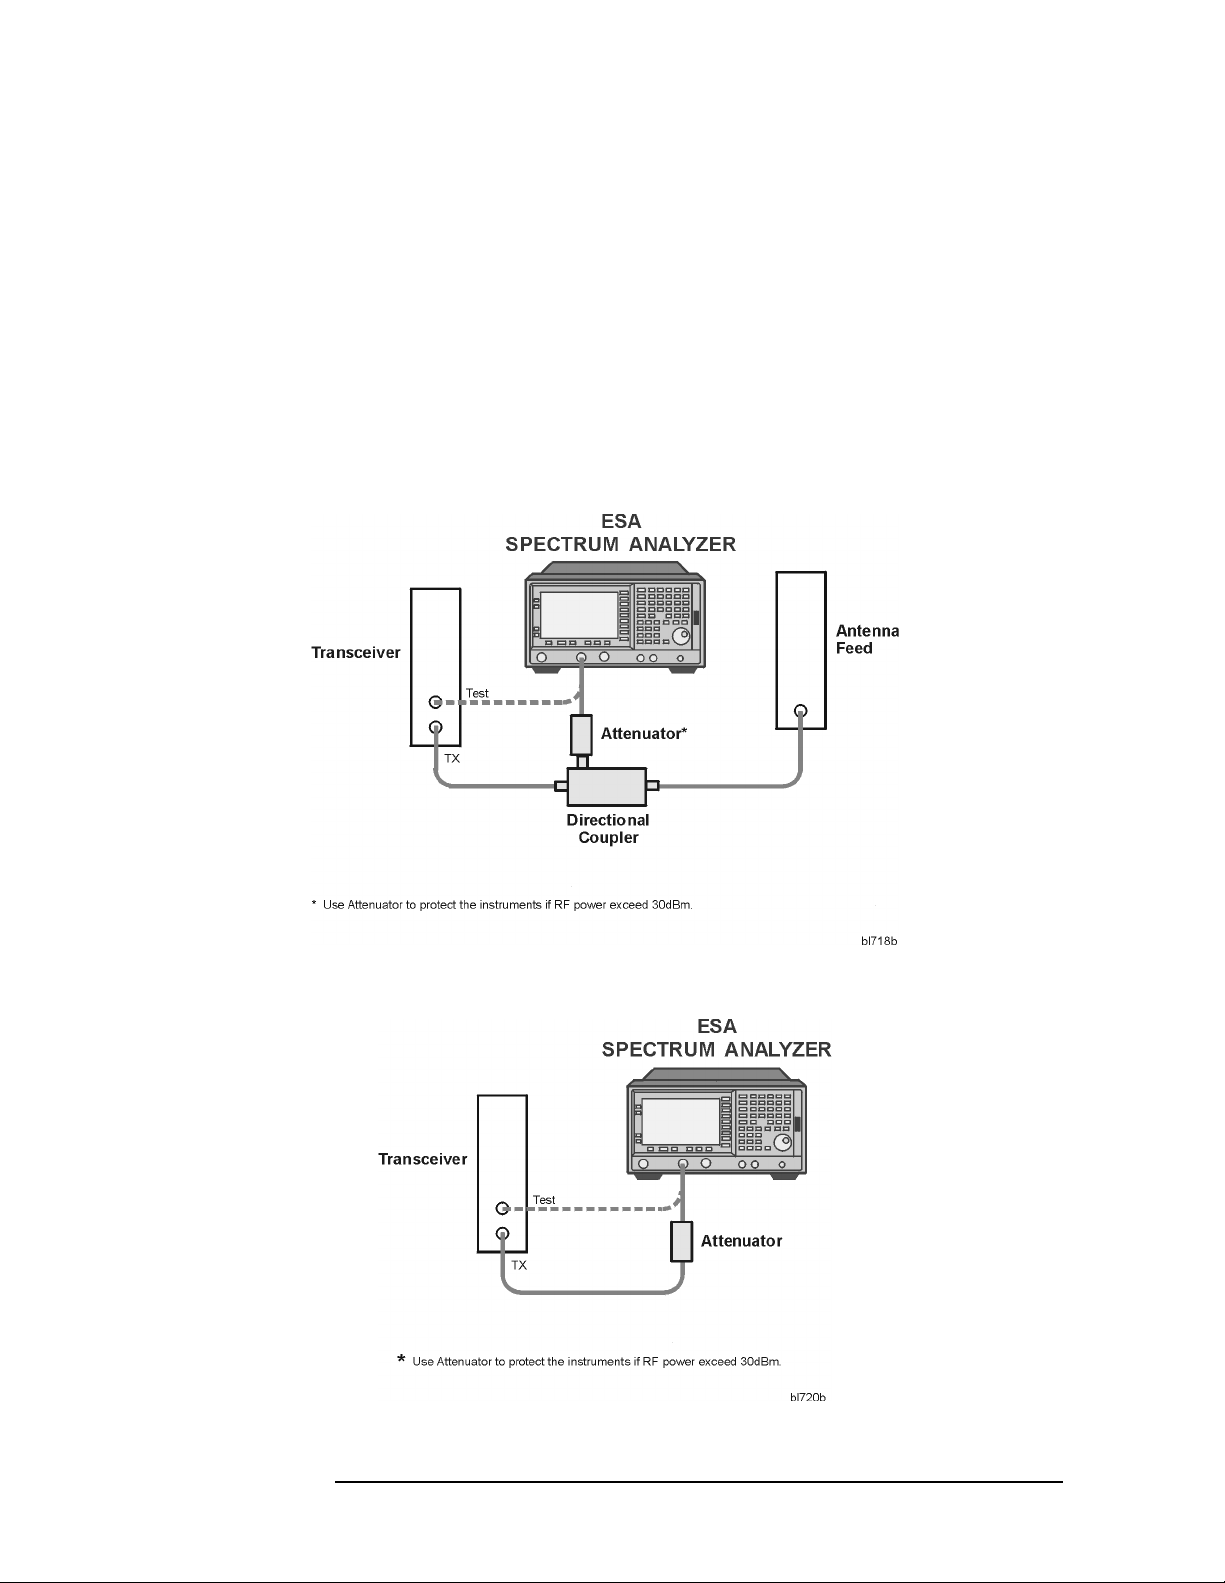
Making Advanced cdmaOne Base Station Measurements
Making the Receiver Spurious (Rx Spur) Measurement
Measurement Hints
A band pass filter can be inserted in between the transmitter and the
spectrum analyzer to filter out the carrier, this will maximize dynamic
range.
Making the Measurement
1. Ensure that the base transceiver station is out of service.
2. Connect the device being measured and the spectrum analyzer input
as shown in Figure 4-20 or Figure 4-21
Figure 4-20 Measurement Setup
Figure 4-21 Alternative Measurement Setup
4-24 Chapter4
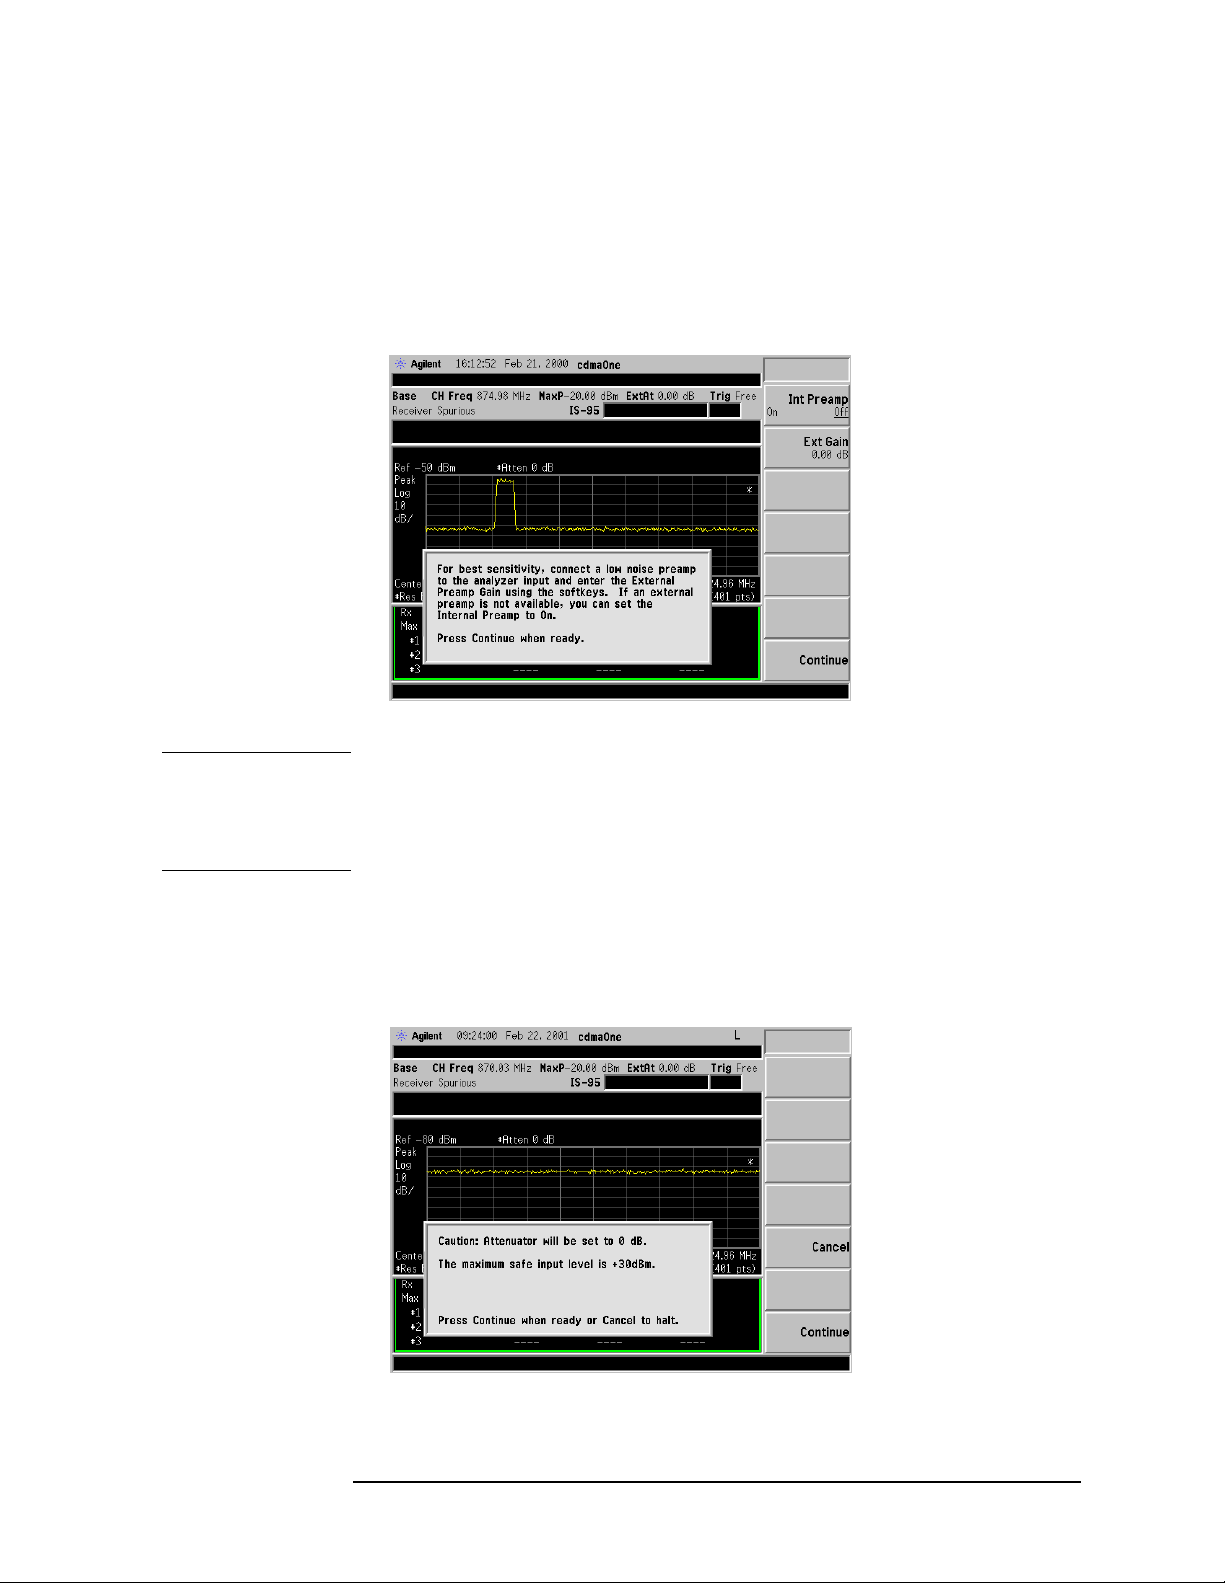
3. If the mode has not already been set to cdmaOne, press MODE and
cdmaOne.
4. To immediately make Receiver Spurious the active measurement,
press MEASURE and Rx Spur. The Preamp dialog box shown in
Figure 4-22 will be displayed.
Figure 4-22 Preamp Dialog Box
Making Advanced cdmaOne Base Station Measurements
Making the Receiver Spurious (Rx Spur) Measurement
NOTE If there is no internal preamplifier Option 1DS installed the message
will read as follows: “For best sensitivity, connect a low noise preamp to
the analyzer input. Set the External Preamp Gain using the softkeys.
Press Continue when ready.”
5. To continue follow the instructions in the dialog box and then press
Continue. The attenuation caution dialog box shown in Figure 4-23
will be displayed.
Figure 4-23 Attenuation Dialog Box
Chapter 4 4-25

Making Advanced cdmaOne Base Station Measurements
Making the Receiver Spurious (Rx Spur) Measurement
6. Set the input signal level according to the instructions in the dialog
box. Then, press
Cancel to terminate the measurement without setting the
Continue to continuewith the measurement or press
attenuation to 0 dB.
7. Select the desired center frequency by pressing FREQUENCY, then
press the appropriate menu key (
the desired channel number or frequency value and press
channel numbers) or a units key–
RF Channel or Channel Freq), enter
Enter (for
GHz, MHz, kHz,orHz (for frequency
values).
NOTE If the desired RF Channel or Channel Freq has been set for a previous
measurement, it is used for all subsequent measurements, and it does
not need to be set again.
8. Set the measurement parameters to the default values by pressing
Meas Setup, More and Restore Meas Defaults.
NOTE The factory default settings provide a measurement compliant with the
selected standard. For special requirements, you may need to change
some of the settings. At any time, you can return all parameters for the
current measurement to the default settings by repeating this step.
9. If desired, set the measurement limits to On by pressing
More, and Limits.
Meas Setup,
10.To change any of the measurement parameters from the factory
default values, press the Meas Setup key to access menus that allow
you to modify the parameters for this measurement. For additional
information on keys to access measurement parameters, refer to the
Front-Panel Key Reference section of the ESA-E Series Spectrum
Analyzers cdmaOne Measurement Personality User’s Guide or use
the on screen help.
11.To save the measurement results, refer to ESA-E Series Spectrum
Analyzers cdmaOne Measurement Personality User’s Guide.
4-26 Chapter4
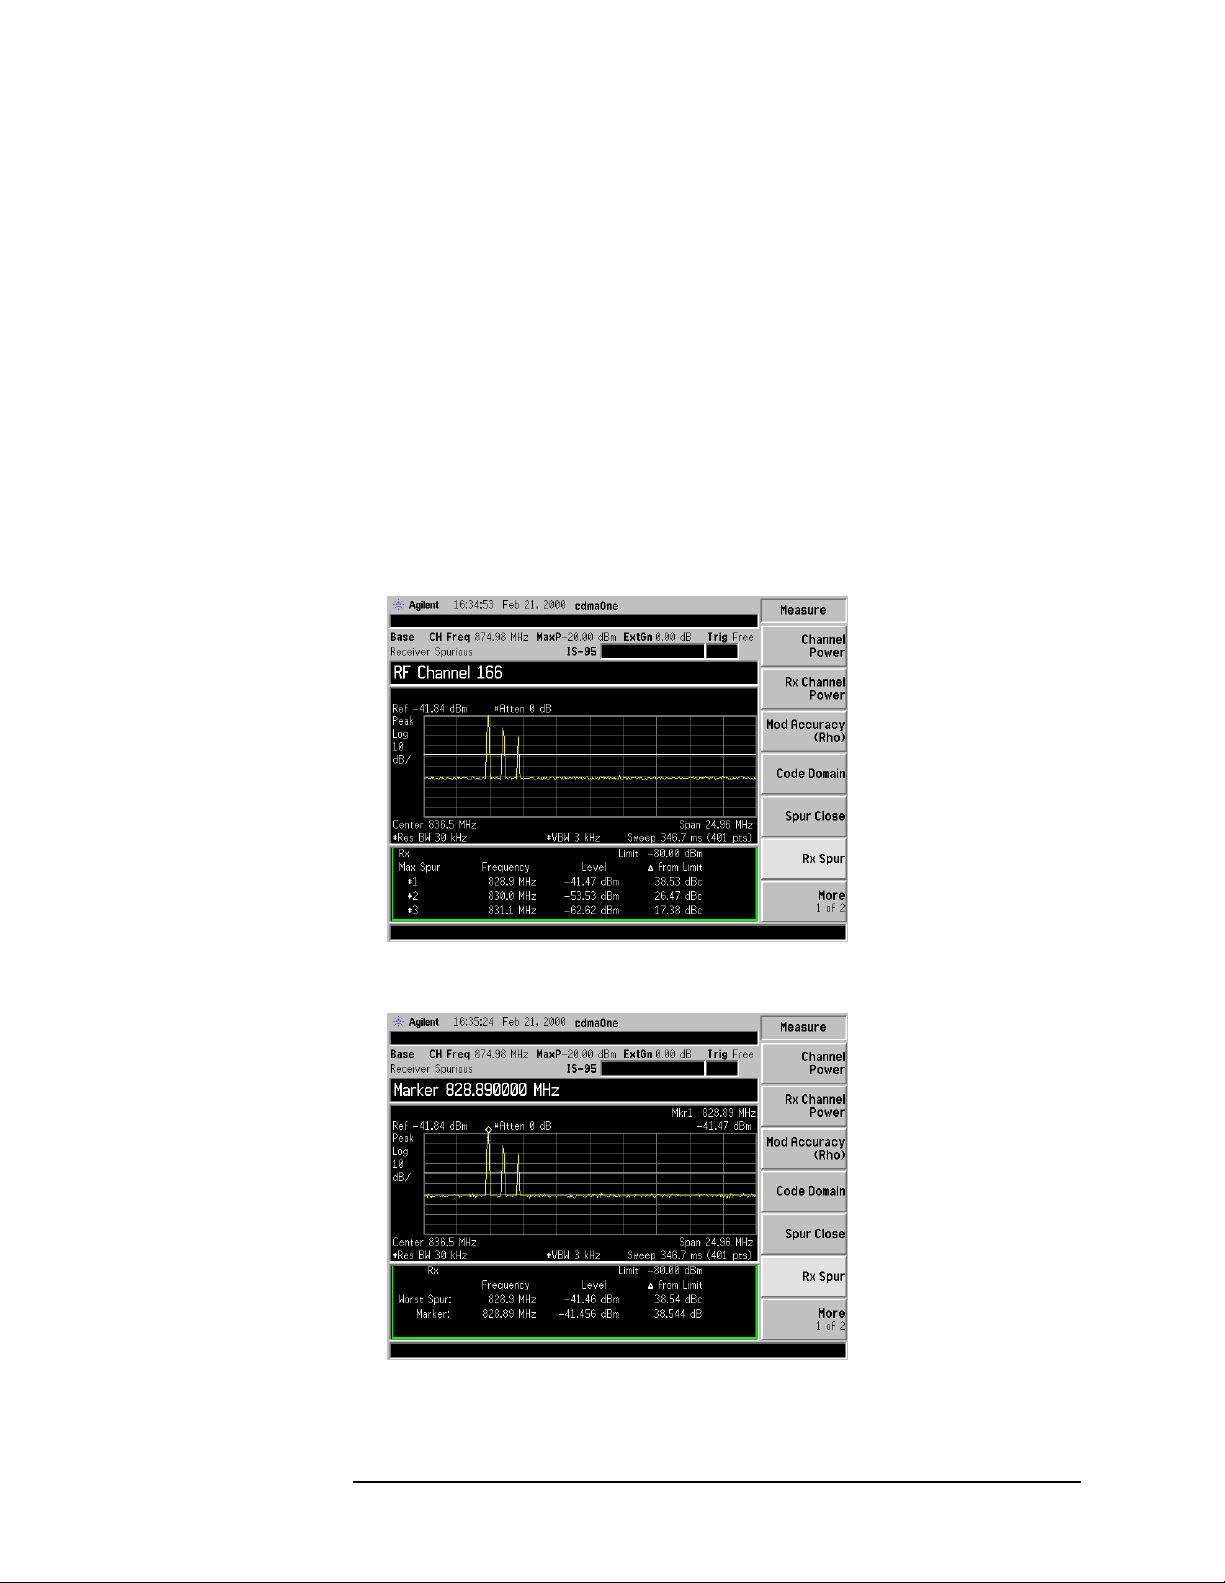
Results
The three largest spurs in the range of interest will be reported. Both
the transmit and receive band can be investigated. It is possible to
choose from a number of different blocks for a specific standard.
Figure 4-24 shows the standard view of the receiver spurious
measurement with four spurious signals in the spectrum. The
frequency, absolute power and the power relative to the measurement
limit for the three largest spurs are tabulated below the trace display.
Figure 4-25 shows the active trace view for the same measurement
results. However, the data for only the single largest spur and the
marker are tabulated below the trace display. In Figure 4-26 the
numeric measurement results data for the three largest spurs are
tabulated with the measurement parameters.
Figure 4-24 Standard Results
Making Advanced cdmaOne Base Station Measurements
Making the Receiver Spurious (Rx Spur) Measurement
Figure 4-25 Active Trace Results
Chapter 4 4-27
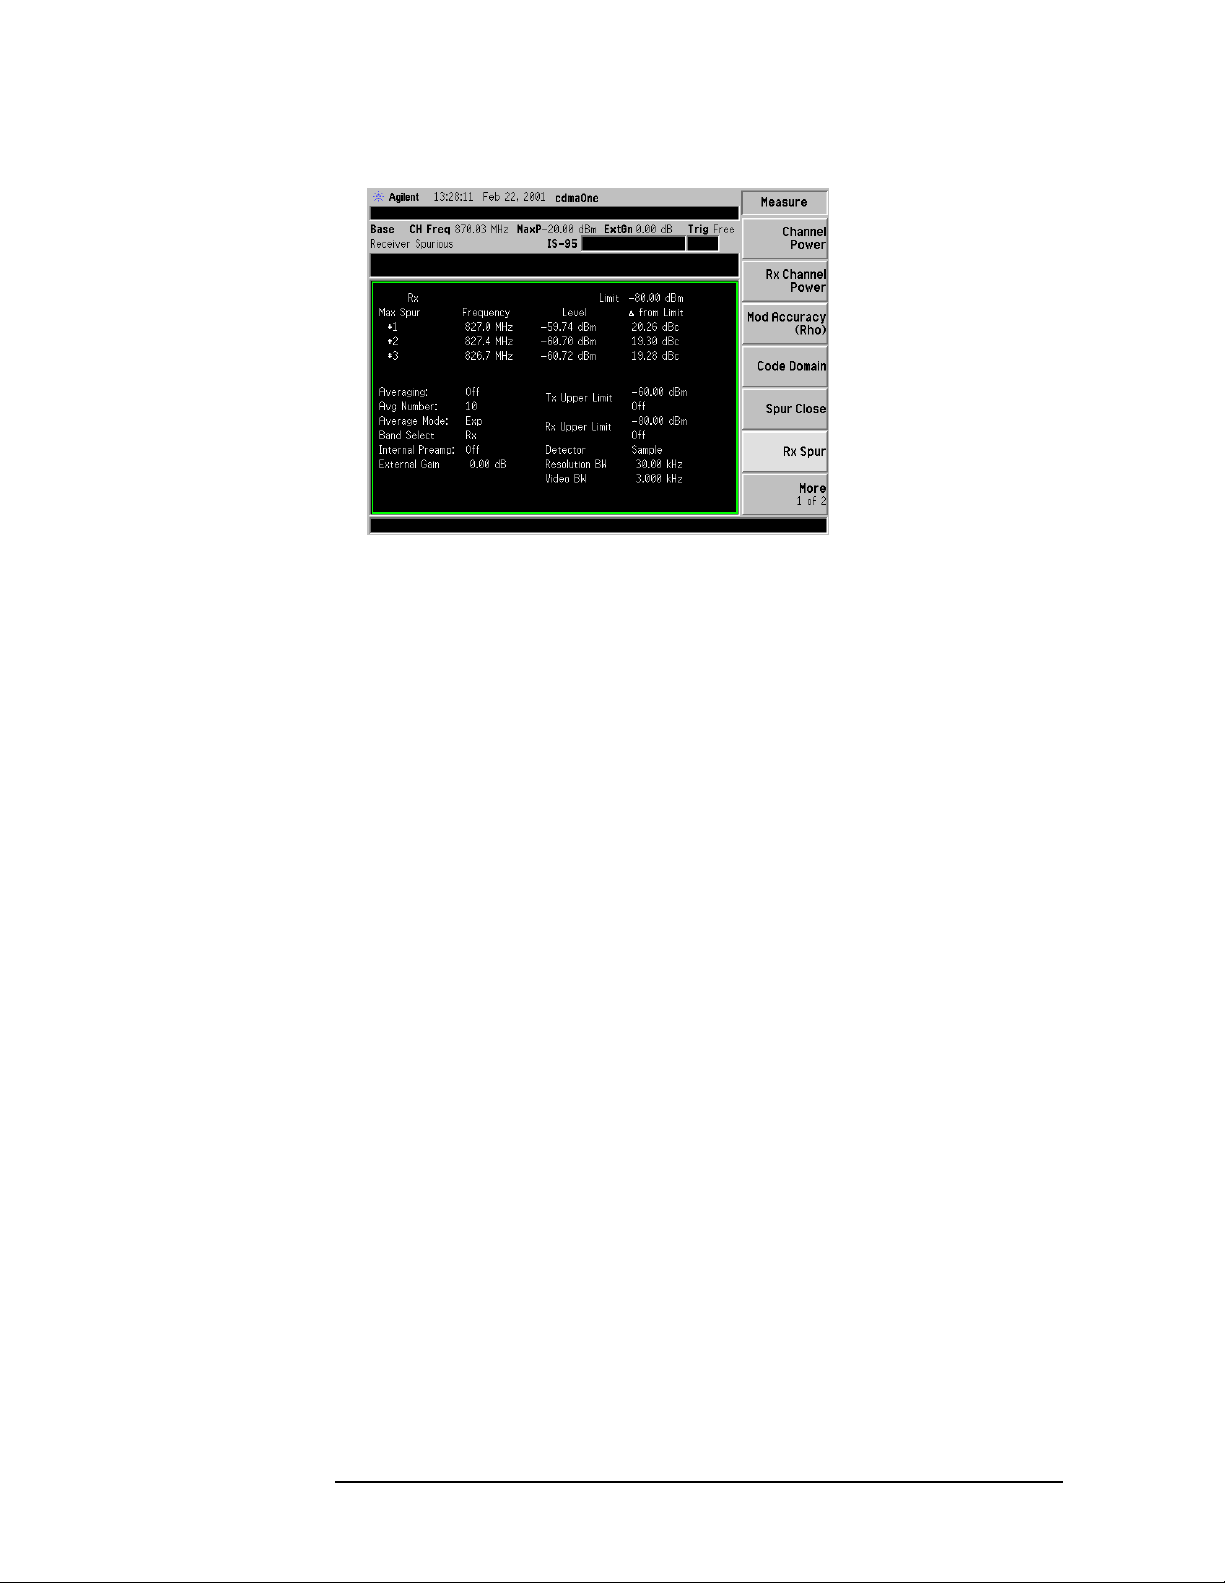
Making Advanced cdmaOne Base Station Measurements
Making the Receiver Spurious (Rx Spur) Measurement
Figure 4-26 Numeric Plus Parameters Results
Troubleshooting Hints
• Excessive interference in the receive band will cause system
problems. Minimize any interference.
• If an external preamplifier is used, be sure to include the gain value
in the measurement. This can be done by entering the
External Gain
under the Input/Output front panel key or the Input… key on the
Mode Setup menu.
• To determine if spurious signals are generated internally by the
ESA, increase the attenuation. If the spurious signals change in
amplitude, then the signals are generated by the analyzer.
4-28 Chapter4

Making Advanced cdmaOne Base Station Measurements
Making the Spurs at Harmonics Measurement
Making the Spurs at Harmonics Measurement
Purpose
Spurious signals can be caused by different combinations of signals in
the transmitter. The spurious emissions from the transmitter that fall
within the system band should be within the level specified by the
standard to guarantee minimum interference with other frequency
channels in the system. Harmonics are distortion products caused by
nonlinear behavior in the transmitter. They are integer multiples of the
transmitted signal carrier frequency.
Measurement Method
You can make the Spurs at Harmonics measurement intrusively or
non-intrusively. To perform a non-intrusive test, connect a directional
coupler to the RF output with the main arm connected to the antenna
and the coupled port connected to the spectrum analyzer as shown in
Figure 4-27. Enter the loss due to the effect of the coupler as external
attenuation. You may also perform a non-intrusive test by making the
measurement at a test port on the transceiver unit, if available.
You can use the intrusive method by taking the measurement directly
from the RF output port of the transceiver as shown in Figure 4-28.
Because you disconnect the antenna from the transceiver and disrupt
the transmission signal, this can not be considered a non-intrusive test.
The transceiver will not be able to communicate with users on the
system.
NOTE Use of a non-intrusive measurement is recommended.
CAUTION If you use the intrusive method, ensure that the power level at the RF
input of the spectrum analyzer does not exceed the damage level of
30 dBm.
Measurement Hints
• Use large resolution bandwidth for fast measurements, and a
narrow resolution bandwidth for increased sensitivity. For testing to
the specification, use a 1 MHz RBW.
• The Channel power used for the relative measurements can be
viewed at the lower left corner of the display.
Chapter 4 4-29

Making Advanced cdmaOne Base Station Measurements
Making the Spurs at Harmonics Measurement
Making the Measurement
1. Ensure that the base transceiver station is in service.
2. Connect the device being measured and the spectrum analyzer input
as shown in Figure 4-27 or Figure 4-28.
Figure 4-27 Measurement Setup
Figure 4-28 Alternative Measurement Setup
3. If the mode has not already been set to cdmaOne, press
cdmaOne.
4. To immediately make Spurs at Harmonics the active measurement,
MEASURE, More, and Spurs at Harmonics.
press
MODE and
4-30 Chapter4

Making Advanced cdmaOne Base Station Measurements
Making the Spurs at Harmonics Measurement
5. Select the desired center frequency by pressing FREQUENCY, then
press the appropriate menu key
the desired channel number or frequency value and press
channel numbers) or a units key–
RF Channel or Channel Freq. Enter
Enter (for
GHz, MHz, kHz,orHz (for frequency
values).
NOTE If the desired RF Channel or Channel Freq has been set for a previous
measurement, it is used for all subsequent measurements, and it does
not need to be set again.
6. Set the measurement parameters to the default values by pressing
Meas Setup and Restore Meas Defaults.
NOTE The factory default settings provide a measurement compliant with the
selected standard. For special requirements, you may need to change
some of the settings. At any time, you can return all parameters for the
current measurement to the default settings by repeating this step.
7. If desired, set the measurement limits to On by pressing
More, and Limits.
Meas Setup,
8. To change any of the measurement parameters from the factory
default values, press the Meas Setup key to access menus that allow
you to modify the parameters for this measurement. For additional
information on keys to access measurement parameters, refer to the
Front-Panel Key Reference section of the ESA-E Series Spectrum
Analyzers cdmaOne Measurement Personality User’s Guide or use
the on screen help.
9. To save the measurement results, refer to ESA-E Series Spectrum
Analyzers cdmaOne Measurement Personality User’s Guide.
Results
Figure 4-24 shows the standard view of Spurs at Harmonics
measurement. Spurs measured at the selected harmonic frequencies
are shown in the trace portion of the display. Below the trace in the
numeric portion of the display, the frequency and the relative and
absolute power of the measured spurs are shown. The fundamental
channel frequency is tuned and measured first, each harmonic
frequency is tuned in secession and any spur is measured. As each
frequency is measured, the trace view cycles through each frequency
trace and the data table is updated.
Chapter 4 4-31
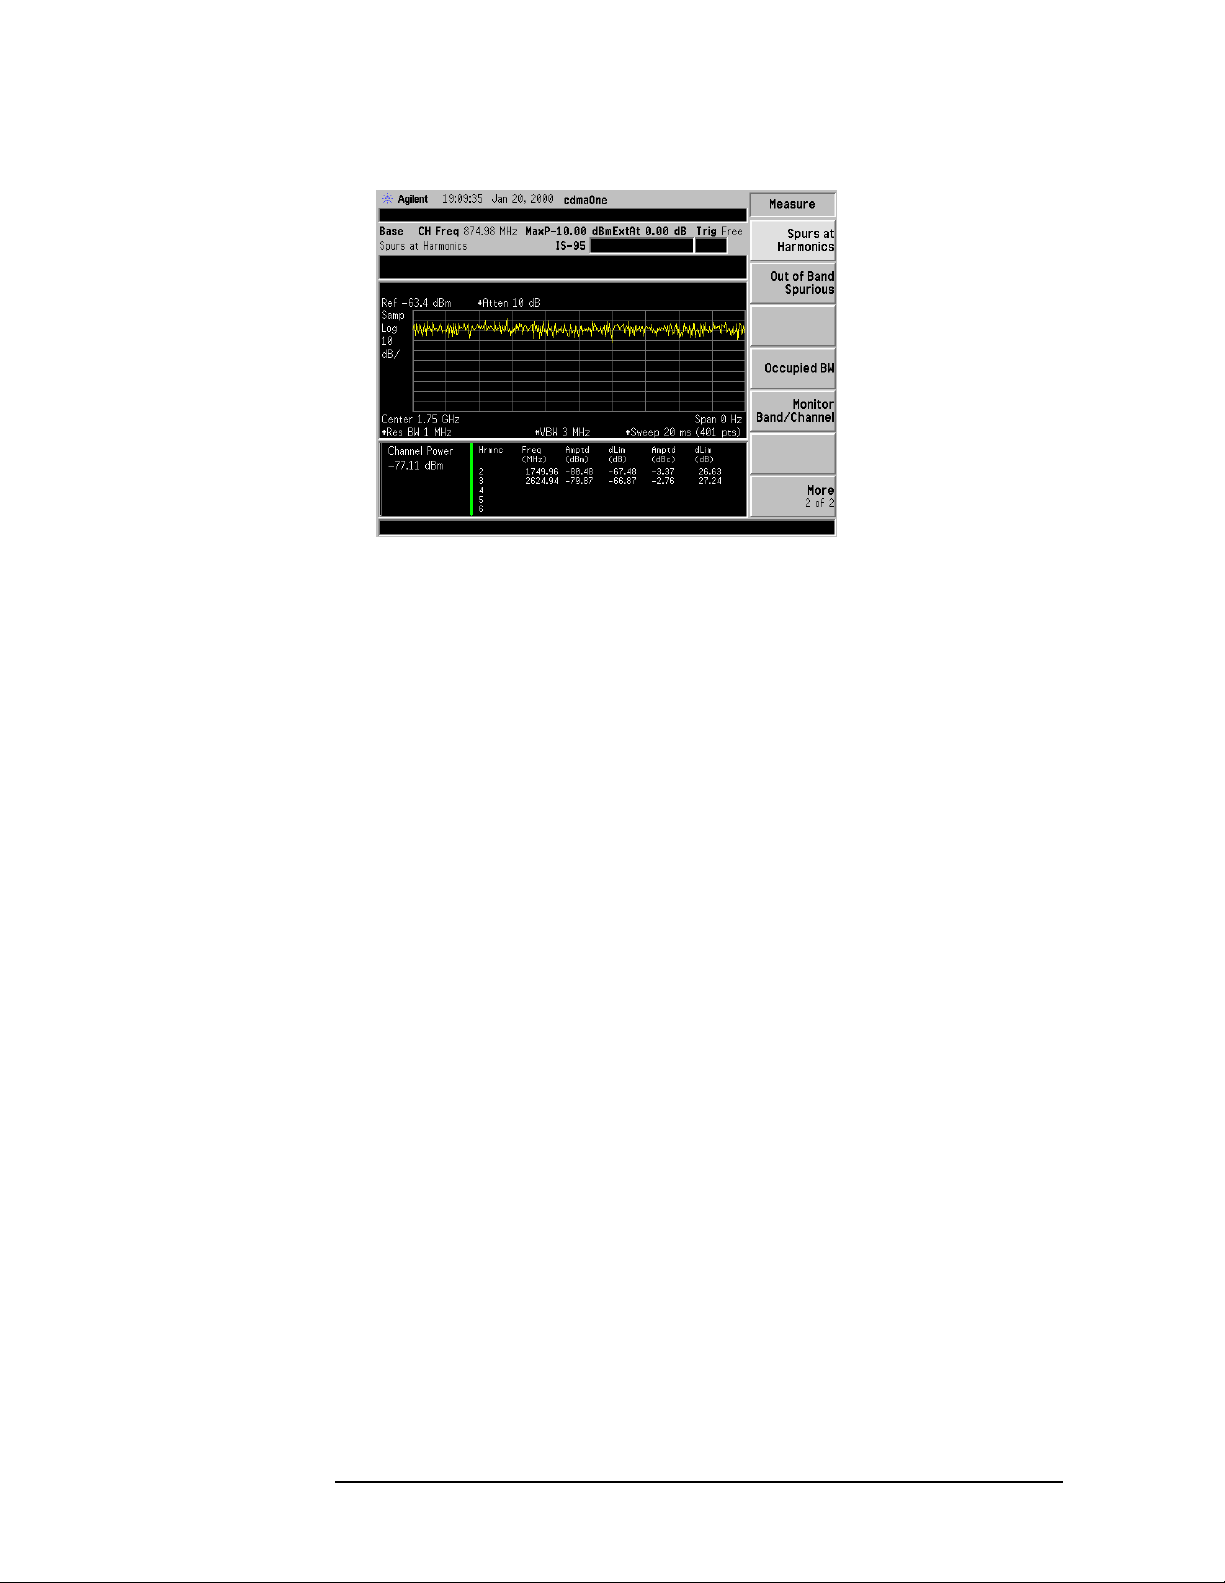
Making Advanced cdmaOne Base Station Measurements
Making the Spurs at Harmonics Measurement
Figure 4-29 Spurs at Harmonics Measurement Results—Standard View
Troubleshooting Hints
• Excess harmonics level could be caused by non-linear distortion in
the output power amplifier or too high of an output power. A second
cause of this could be a power amplifier problem that results in the
amplifier being driven into compression. Troubleshoot the output
power amplifier.
• If an external attenuator is used, be sure to include the attenuation
value in the measurement. This can be done by entering the
BS Ext Atten under the Input/Output front panel key or the Input… key
on the
Mode Setup menu.
• To determine if spurious signals are generated internally by the
ESA, increase the attenuation. If the spurious signals changes in
amplitude, then the signals are generated by the analyzer.
4-32 Chapter4

Making Advanced cdmaOne Base Station Measurements
Making the Microwave Transmitter Power Measurement
Making the Microwave Transmitter Power
Measurement
Purpose
This is a SA mode measurement used to verify the power in the
microwave transmitter channel. The total rms power in the specified
integration bandwidth is determined by this measurement.
Measurement Method
You can make the MicrowaveTransmit Power measurement intrusively
or non-intrusively. To perform a non-intrusive test, connect a
directional coupler to the RF output with the main arm connected to
the antenna and the coupled port connected to the spectrum analyzer.
Enter the loss due to the effect of the coupler as external attenuation.
You may also perform a non-intrusive test by making the measurement
at a test port on the antenna, if available.
You can use the intrusive method by taking the measurement directly
from the RF output port of the transceiver. Because you disconnect the
antenna from the transceiver and disrupt the transmission signal, this
can not be considered a non-intrusive test. The transceiver will not be
able to communicate with users on the system.
NOTE Use of a non-intrusive measurement is recommended.
CAUTION If you use the intrusive method, ensure that the power level at the RF
input of the spectrum analyzer does not exceed the damage level of
30 dBm.
Making the Measurement
1. Ensure that the base transceiverstation microwave transmitteris in
service.
2. Connect the device being measured and the spectrum analyzer input
as shown in Figure 4-30.
Chapter 4 4-33

Making Advanced cdmaOne Base Station Measurements
Making the Microwave Transmitter Power Measurement
Figure 4-30 Measurement Setup
3. Set the ESA Spectrum Analyzer to the SA mode by pressing
Mode
and SA.
4. Preset the ESA Spectrum Analyzer by pressing
5. Activate the Channel Power measurement by pressing
PRESET.
MEASURE
and Channel Power.
6. Set the transmitter channel carrier frequency to be measured by
pressing FREQUENCY, Center Freq, and then entering the frequency
using the numeric keys.
7. Set the integration bandwidth by pressing Meas Setup,
Integration BW, and then enter the bandwidth frequency.
4-34 Chapter4
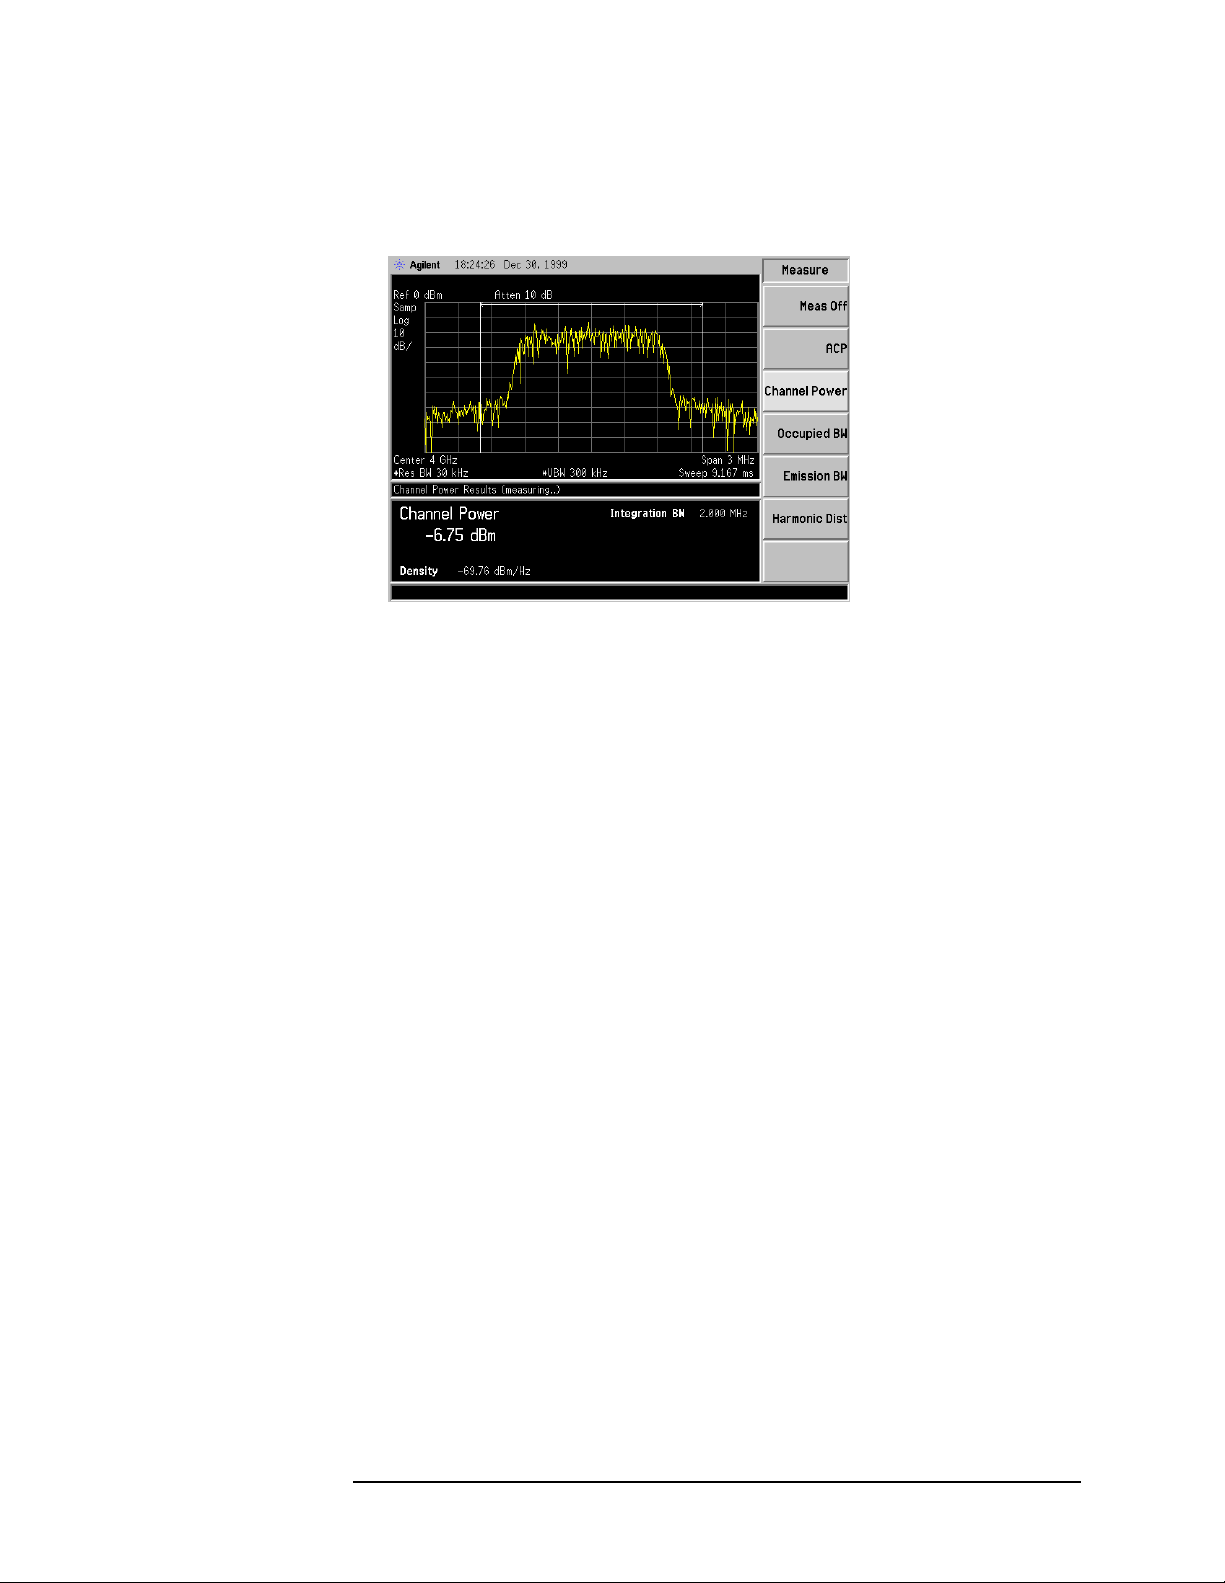
Making Advanced cdmaOne Base Station Measurements
Making the Microwave Transmitter Power Measurement
Results
Figure 4-31 Example of Channel Power Measurement Results
Troubleshooting Hints
• If an external attenuator is used, be sure to include the attenuation
value in the measurement. This can be done by entering the
Ref Lvl Offset under the AMPLITUDE Y Scale front panel key.
• If an external preamplifier is used, be sure to include the gain value
in the measurement. This can be done by entering the Ext Amp Gain
under the AMPLITUDE Y Scale front panel key.
Chapter 4 4-35

Making Advanced cdmaOne Base Station Measurements
Making a Microwave Spectrum Monitoring Measurement
Making a Microwave Spectrum Monitoring
Measurement
Purpose
This is a SA mode measurement used to monitor the microwave
receiver RF frequency spectrum for the presents of signals that may
cause interference.
Measurement Method
You can make the Microwave Spectrum Monitoring measurement
intrusively or non-intrusively. To perform a non-intrusive test, connect
a directional coupler to the RF output with the main arm connected to
the antenna and the coupled port connected to the spectrum analyzer.
Enter the loss due to the effect of the coupler as external attenuation.
You may also perform a non-intrusive test by making the measurement
at a test port on the transceiver unit, if available.
CAUTION If you use the intrusive method, ensure that the power level at the RF
input of the spectrum analyzer does not exceed the damage level of
30 dBm.
Measurement Hints
• To increase measurement sensitivity, reduce the resolution
bandwidth by pressing
bandwidth frequency. The sensitivity can also be increased by
reducing the video bandwidth by pressing
then enter the bandwidth frequency.
• Use large resolution bandwidth for fast measurements, and a
narrow resolution bandwidth for increased sensitivity. For testing to
the specification, use a 30 kHz RBW.
BW/Avg, Resolution BW, and then enter the
BW/Avg, Video BW, and
Making the Measurement
1. Ensure that the microwave link is not in service.
2. Connect the device being measured and the spectrum analyzer input
as shown in Figure 4-32.
4-36 Chapter4

Figure 4-32 Measurement Setup
Making Advanced cdmaOne Base Station Measurements
Making a Microwave Spectrum Monitoring Measurement
3. Set the ESA Spectrum Analyzer to the SA mode by pressing
Mode
and SA.
4. Turn off all measurements by pressing
MEASURE and Meas Off.
5. Set the transmitter channel carrier frequency to be measured by
pressing FREQUENCY, Center Freq, and then entering the frequency
to the transmitter using the numeric keys.
6. Set the microwave spectrum span by pressing SPAN, Span, and then
entering the frequency using the numeric keys.
7. Set the attenuation as low as possible by pressing
AMPLITUDE Y Span, Attenuation, and then entering the attenuation
value in dB using the numeric keys.
NOTE When setting the input attenuator, the resulting signal level must not
be too large or small.
• If signal power is too high, it can overload the spectrum analyzer
and cause ACP.
• If signal power is too low, the ACP measurement is degraded by the
presence of excessive noise.
Set the attenuator to the smallest available value, in dB, that is larger
than the transmitter power, in dBm, plus 10 dB.
8. Turn on the peak markers and data table by pressing
More, and Peak Table.
9. Turn on the marker display line by pressing
> Display Line.
Chapter 4 4-37
Peak Readout and
Peak Search,
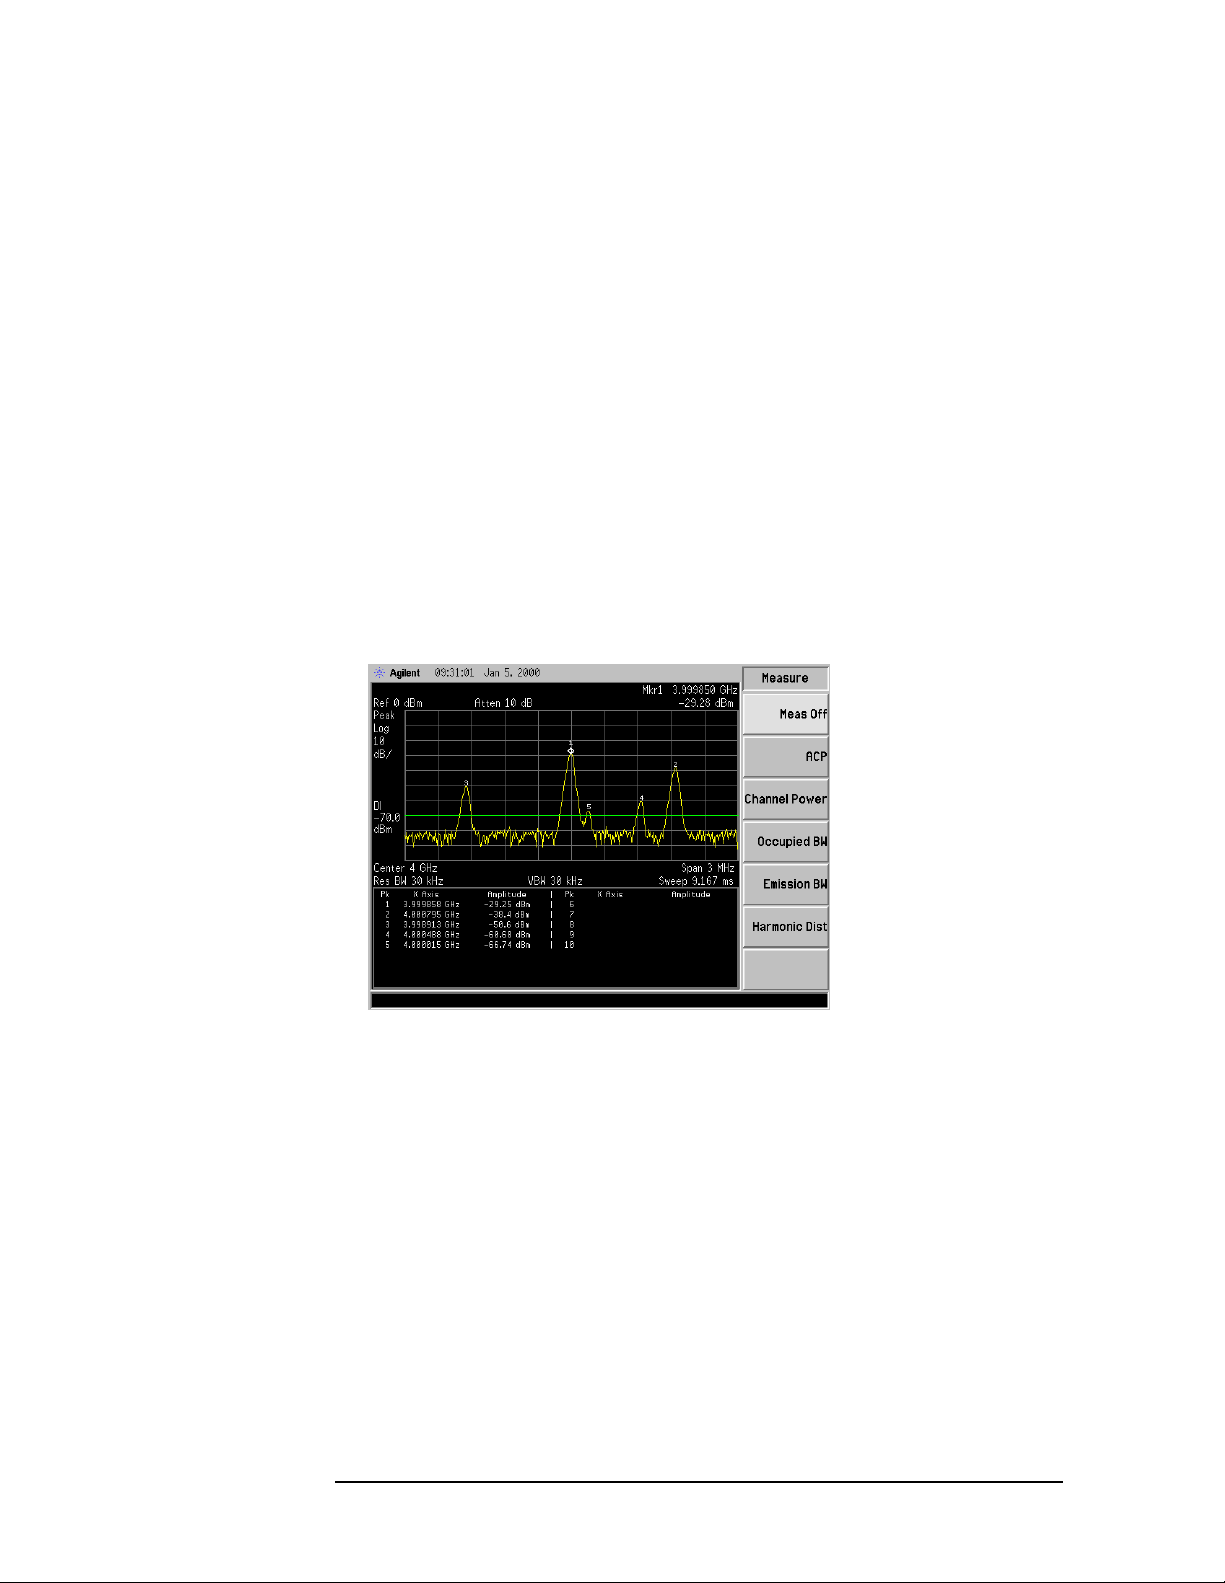
Making Advanced cdmaOne Base Station Measurements
Making a Microwave Spectrum Monitoring Measurement
10.Set the display line level by pressing Display, Display Line, and then
entering the level in dB using the numeric keys.
The trace display will show markers
11.Set the display readout mode by pressing
Frequency.
Marker, More, Readout, and
12.Repeat steps 4 through 11 using the receive channel frequency to
monitor the receiver spectrum.
Results
The trace display will show markers for any signal peaks found that
exceed the display line level. The markers will be numbered in
descending order of peak power. The source of these signals should be
located and they should be removed to prevent interference with the
microwave link signal.
Figure 4-33 Example of Microwave Spectrum Monitoring Results
4-38 Chapter4
 Loading...