

Page 1
User's/Reference Guide
HP 8509A/B LightwavePolarization
Analyzer
ABCDE
08509-90016
No.
Part
HP
Printed
in
USA
October
Supersedes:
1994
08509-90003
Page 2

Notice.
The information contained in this document is sub ject to change
without notice.
Hewlett-Packard makes no warrantyofany kind with regard to this
material, including but not limited to, the implied warranties of
merchantability and tness for a particular purpose. Hewlett-Packard
shall not be liable for errors contained herein or for incidental
or consequential damages in connection with the furnishing,
performance, or use of this material.
Microsoft, MS, MS-DOS, and the Microsoft logo are registered
trademarks, and Windows is a trademark, of Microsoft Corporation.
c
All
Cop
Righ
yrigh
ts
Reserv
without prior
cop
F
the
oun
taingro
under
1400
Hewlett-P
t
ed.
written
t
yrigh
e
v
ac
Repro
ermission
p
ws.
la
arkw
P
1992,
k
ard
Compan
y
duction, adaptation,
prohibited,
is
CA
a
,
y
Santa
Rosa,
1994
or
except
95403,
translation
allo
as
USA
ed
w
Page 3
Certification
Hewlett-Packard Company certies that this pro duct met its
published sp ecications at the time of shipment from the factory.
Hewlett-Packard further certies that its calibration measurements
are traceable to the United States National Institute of Standards
and Technology, to the extent allowed by the Institute's calibration
facility, and to the calibration facilities of other International
Standards Organization members.
Regulatory Information
Warranty
Chapter 9 contains regulatory information.
This Hewlett-Packard instrument product is warranted against
defects in material and workmanship for a perio d of one year from
date of shipment. During the warranty perio d, Hewlett-Packard
Company will, at its option, either repair or replace products which
b
to
e
v
pro
arran
w
or
F
service
shipping
shipping
shall
to
facilit
c
c
all
pay
Hewlett-P
Hewlett-P
Hewlett-P
y
b
programming
its
instrument.
instrumen
the
of
defectiv
e
y
t
y
harges
harges
shipping
ac
ard
k
ac
ac
Hewlett-Pac
e.
service
or
designated
Hewlett-P
to
return
to
from
ard
k
arran
w
for
ard
k
instructions
or
t,
repair,
harges,
c
another
ts
use
k
w
soft
Hewlett-P
y
b
ac
the
duties,
that
with
when
do
ard
are,
this
k
pro
its
es
or
ard
coun
an
duct
pro
ac
and
to Buy
duct
and
try
are
w
soft
instrumen
prop
w
not
are
w
rm
ust
m
ard.
k
Hewlett-P
er.
taxes
.
and
t
installed
erly
t
arran
will
b
Buy
Ho
for
rm
will
that
e
b
returned
e
shall prepa
er
ard
k
ac
er,
ev
w
ducts
pro
are
w
execute
on that
op
the
terrupted or
unin
to a
y
shall pa
er
Buy
returned
designated
eration
error-free.
y
Limitation of Warranty
The foregoing warranty shall not apply to defects resulting from
improper or inadequate maintenance byBuyer, Buyer-supplied
software or interfacing, unauthorized modication or misuse,
the
eration
op
pro
duct,
outside
or
NO OTHER W
of
improp
er
preparation
site
or
ARRANTY IS EXPRESSED OR
vironmental
en
the
HEWLETT-PACKARD SPECIFICALL
IMPLIED W
FITNESS F
ARRANTIES OF MER
OR A P
ARTICULAR PURPOSE.
CHANTABILITY
ecications
sp
tenance.
main
Y DISCLAIMS THE
for
IMPLIED.
AND
Exclusive Remedies
THE REMEDIES PROVIDED HEREIN ARE BUYER'S SOLE
CKARD
AMA
D
A
GES,
SPECIAL,
WHETHER
AND EX
NOT
CLUSIVE
LIABLE
BE
INCIDENT
AL,
REMEDIES.
ANY
OR
F
CONSEQUENTIAL
OR
HEWLETT-P
DIRECT,
INDIRECT,
SHALL
iii
Page 4

BASED ON CONTRACT, TORT, OR ANY OTHER LEGAL
THEORY.
Assistance
Safety Notes
Caution
W
arning
Product maintenance agreements and other customer assistance
agreements are available for Hew lett-Packardproducts.
For any assistance, contact your nearest Hewlett-Packard Sales and
ServiceOce.
The following safety notes are used throughout this manual.
Familiarize yourself with each of the notes and its meaning b efore
operating this instrument.
cedure that,
pro
a
to
tion
atten
calls
Caution
not
denotes
correctly
destruction
indicated
the
til
un
correctly
Do
life.
denotes
arning
W
not
of
conditions
erformed
p
of the
performed
proceed
not
fully
are
hazard.
a
instrumen
conditions
hazard.
a
understood
It
or adhered
t.
are
calls
It
adhered
or
ond
bey
Do
a
and
fully
w
ould result
to, w
pro
not
understo
attention
could
to,
arning
met.
ceed
to
note
ey
b
d
o
procedure
a
result
until
in damage
caution
a
ond
met.
and
injury
in
indicated
the
to
which,
loss
or
sign
if
or
if
is
duct
for
the
pro
user
to
refer
to
L
ed with
mark
instructions
the
The
instruction
this sym
the
in
b
do
ol
do
cumen
when
cumen
tation
is
it
tation.
symb
necessary
ol. The
\CE" The CE mark is a registered trademark of the European
Community. (If accompanied byayear, it is when the design was
proven.)
Industrial
an
of
ol
b
a sym
is
1
This
Class
A
pro
duct.
\ISM1-A"
Group
\CSA" The CSA mark is a registered trademark of
Scien
the Canadian
Medical
and
tic
Standards Asso ciation.
iv
Page 5

General Safety Considerations
Warning
Warning
Caution
This is a Safety Class I product (provided with a protective earthing
ground incorporated in the power cord). The mains plug shall only be
inserted in a socket outlet provided with a protective earth contact.
Any interruption of the protective conductor, inside or outside the
instrument, is likely to make the instrument dangerous. Intentional
interruption is prohibited.
No operator serviceable parts inside. Refer servicing to qualified
personnel. To prevent electrical shock, do not removecovers.
Before switching on this instrument, make sure that the line voltage
selector switch is set to the voltage of the power supply and the
correct fuse is installed.
v
Page 6

Page 7
Contents
1. Getting Started
Description of the Instrument . . . . . . . . . . 1-1
Installation . . . . . . . . . . . . . . . . . . 1-1
About This Manual Set . . . . . . . . . . . . . 1-2
This guide uses the following conventions: . . . . 1-2
HP 8509A/B User's/Reference Guide Table of
Contents (this manual) . . . . . . . . . . . 1-3
The Main Menu . . . . . . . . . . . . . . . . 1-4
The Data Displays (Power, DOP, Ellipse and Poincare
Sphere) . . . . . . . . . . . . . . . . . . 1-5
.
.
.
.
.
.
.
.
.
.
.
.
.
.
y
Ellipse
unctions
F
Mark
a
Mark
a
Mark
Sphere
the
.
.
. .
.
er
er
oin
.
.
.
.
ers
ers
. .
.
t
.
.
.
.
at
at
On
P
.
.
.
.
.
.
.
.
.
.
.
.
.
.
.
.
Curren
the
User-Sp
a
and O
.
.
.
Mark
a
on
olarization
.
. .
.
.
.
.
.
.
.
.
.
.
.
.
.
.
. .
.
ecied
.
er
.
.
.
.
.
.
.
.
.
.
.
.
.
.
.
.
P
Data
t
oin
P
.
.
.
.
.
.
Curren
or
Reference
.
.
.
.
.
.
.
.
.
.
.
.
.
.
.
.
.
.
.
.
oin
.
.
.
.
. 1-5
.
.
.
.
.
. 1-5
. .
.
.
.
.
.
.
.
.
t
. 1-7
.
.
t
.
.
.
.
.
.
t
oin
P
t
. .
.
.
.
.
. 1-10
. .
wer
Po
DOP
oincare
P
olarization
P
Mark
The
Setting
Setting
Setting
urning
T
Clearing
Cen
Tw
om and
Zo
Zoom
Displa
tering
or
o-
Display
Sphere
er
Marker
a
the
the Mark
Three-P
Rotate .
.
.
ToZoomIn . . . . . . . . . . . . . . . . 1-10
To Zoom Out . . . . . . . . . . . . . . . 1-10
The Zo om Factor Function . . . . . . . . . 1-10
Rotate . . . . . . . . . . . . . . . . . . . 1-11
To Rotate the Sphere . . . . . . . . . . . . 1-11
The
4
5
Home
4
Clea
r
4
ClearT
T
race
and
5
5
. . . . . . . . . . . . . . . . . . 1-11
race
Hold . . . . . .
45
and Cal
45
Source W
. . . . . .
. . . . . . . . . . . . . . . . .
avelength . . . . . . . . . . . . . . 1-12
Button
Hold
.
.
.
.
.
.
.
.
.
.
. .
.
.
.
. . . . . . . . . . . . . . 1-11
. 1-12
. . . . . . . . . . . . . . . 1-12
. .
.
.
.
.
.
.
.
.
.
.
Cal . . . . . . . . . . . . . . . . . . . . . 1-12
1-5
1-5
1-6
1-6
1-7
1-8
1-8
1-9
1-9
1-10
1-11
1-11
Contents-1
Page 8
2. Making Measurements
Conventions . . . . . . . . . . . . . . . . . 2-1
PMD Measurement: Jones Matrix Eigenanalysis
Method . . . . . . . . . . . . . . . . . . 2-2
Basic Measurement. . . . . . . . . . . . . . . 2-3
Setting up the System . . . . . . . . . . . . 2-3
External Source Preparation . . . . . . . . . . 2-4
Making the Measurement . . . . . . . . . . . 2-8
Manipulating the Measurement Results . . . . . . 2-13
The Measurement Summary Bar . . . . . . . . 2-13
The Measurement Annotation Area . . . . . . . 2-14
Using The Cursor . . . . . . . . . . . . . . 2-15
Changing The MeasurementFormat . . . . . . 2-15
Changing The Graph's Y-Scale . . . . . . . . . 2-16
Displaying and Printing Data in Tabular Format . 2-16
Displaying Data in a Statistical Format . . . . . 2-17
The File menu . . . . . . . . . . . . . . . 2-19
NNNNNNNNNNNNNNNNNNNNNNNNNNNNNNNNNNNNNNNNNNNNNNNNNNNNNNNNNNNNNNNNNNNNNNNNNNNNNNNNNNNNNNNNNNNNNNN
Add from Selected JME Window F2
N
N
N
Add
NN
N
Add
N
N
N
Load
N
N
N
Save Statistics...F6
N
N
N
Print Bitmap
N
N
N
Print
N
NN
Exit
The
The
The Help
The
ting
Prin
ving
Sa
Saving in Database Format . . . . . . . . . . 2-23
Specialized Measurement Metho ds . . . . . . . . 2-24
Performing a Cascade Measurement . . . . . . 2-24
Setting up the System . . . . . . . . . . . 2-24
Making
Using
Using
PMD:JME Concepts
Polarization Mo de Dispersion
Polarization modes
General eects .
Mode coupling . . . . . . . . . . . . . . . 2-29
PMD units . . . . . . . . . . . . . . . . 2-30
Fiber PMD statistics . . . . . . . . . . . . . 2-30
Fitting
Enlarging
Source
Should
N
N
N
N
N
N
N
N
N
N
N
N
N
N
N
N
from
N
N
N
N
N
N
N
N
N
N
N
N
NN
NN
from
N
N
N
N
N
N
N
N
NN
NN
N
N
N
N
Statistics...F5
N
N
NN
NN
N
N
N
N
N
N
N
N
N
N
N
N
N
N
NN
N
N
N
N
N
N
N
N
N
N
N
N
N
N
N
N
N
N
N
N
N
N
N
N
N
N
N
N
N
N
N
N
N
N
N
N
N
.
Edit
ormat
F
Annotation
the
our
y
the
oltage-T
V
a
Manually-T
a
the
ectral
sp
use
I
N
N
N
N
N
N
N
N
N
N
N
N
N
N
N
N
Database...F3
N
N
N
NN
NN
NN
NN
N
N
N
N
N
Text
NN
NN
N
N
N
N
N
N
N
N
N
N
N
N
N
N
N
N
N
N
N
N
N
N
N
N
N
N
N
N
N
N
N
N
N
N
N
N
N
N
N
N
N
N
N
N
N
N
N
N
N
N
N
N
N
N
N
N
NN
Data
.
.
u
men
Men
menu
PMD:JME
Measurement
Measuremen
uned
Maxw
sample
the
haracteristics
c
reference
the
N
N
N
N
N
N
N
N
N
N
N
N
N
N
N
N
NN
N
N
N
N
N
N
N
N
N
N
N
N
N
N
File...F4
N
N
N
N
N
N
N
N
N
N
N
N
N
N
N
N
N
N
N
N
N
N
N
N
NN
NN
N
N
N
N
N
N
.
.
.
.
.
.
.
.
.
.
.
.
u
.
.
Area
Graph
Source
uned
. . . . . . . . .
. . . . . . . .
. . . . . . . . . . . . . . 2-29
ell curv
size
N
N
N
N
N
N
N
N
N
N
N
N
N
N
N
N
NN
NN
NN
N
NN
NN
N
N
N
N
N
N
N
N
N
N
N
N
N
N
N
N
N
.
.
. .
.
.
.
.
.
. .
.
.
.
.
.
as T
t .
source
to
e
frame?
N
N
N
N
N
N
N
N
N
.
.
.
.
.
.
.
.
N
N
N
N
N
N
.
.
.
.
.
.
. .
.
.
.
.
.
.
. .
.
.
.
.
.
.
. .
.
.
.
.
.
.
.
.
.
ext .
.
.
.
. .
.
.
.
.
. . . . . . . . . 2-29
distribution
the
.
.
.
.
.
.
.
.
. . . . 2-19
.
.
.
.
.
.
. 2-19
.
.
.
.
.
.
.
.
.
.
.
.
.
.
.
.
.
.
.
.
.
.
.
.
.
.
.
.
.
.
.
.
.
.
.
.
.
. .
.
.
.
.
.
.
.
.
.
.
.
.
.
.
.
.
.
.
.
. 2-22
. .
. .
.
.
.
.
.
.
.
.
.
.
.
.
.
.
.
.
.
.
.
.
.
.
.
.
. . . . . 2-29
. . . . . 2-29
.
.
.
.
.
.
.
.
.
.
.
.
.
.
.
.
.
. .
2-19
2-19
2-19
2-20
2-20
2-20
2-20
2-20
2-21
2-21
2-22
2-25
2-28
2-28
2-30
2-30
2-31
2-31
Contents-2
Page 9
Cascade measurements . . . . . . . . . . . . 2-31
What is a cascade measurement? . . . . . . . 2-31
Typical applications . . . . . . . . . . . . 2-31
PMD Measurement: Wavelength-Scanning Method . 2-33
Basic Measurement. . . . . . . . . . . . . . . 2-34
Setting up the System . . . . . . . . . . . . 2-34
Making the Measurement . . . . . . . . . . . 2-35
Manipulating the Measurement Results . . . . . . 2-38
The Measurement Summary Bar . . . . . . . . 2-38
The Measurement Annotation Area . . . . . . . 2-39
Using The Cursor . . . . . . . . . . . . . . 2-39
Changing The MeasurementFormat . . . . . . 2-40
Displaying and Printing Data in Tabular Format . 2-41
Printing your Graph . . . . . . . . . . . . . 2-42
Saving your MeasurementasText . . . . . . . 2-43
Saving in Database Format . . . . . . . . . . 2-43
PMD:WS Concepts . . . . . . . . . . . . . . . 2-44
Polarization Mo de Dispersion . . . . . . . . . 2-44
2-44
.
.
.
.
.
.
.
.
.
.
.
.
.
.
.
.
.
for
range
.
.
size
Jones
.
.
. .
.
.
Matrix
. .
.
Jones
.
.
. .
.
.
.
.
.
.
.
.
.
.
.
.
.
.
. .
. .
.
.
.
.
.
.
.
.
.
.
.
.
.
.
.
.
. .
. .
.
.
test
t
onen
comp
or
er
b
.
.
.
.
.
.
.
.
.
.
.
.
.
.
. .
.
.
.
.
.
.
.
.
.
.
.
.
.
.
.
.
. .
.
.
.
PMD
er
b
of
Matrix
.
.
. .
t
t
Results
t
t
. . . . . . . . . . . . 2-61
. . . . . . . . . . . . 2-61
.
.
.
Matrix
.
.
Metho
. .
.
.
.
.
.
.
.
.
.
.
.
.
.
.
.
. . .
. . . . . . . . . . . 2-63
.
.
.
.
.
.
.
.
.
.
.
.
d
. .
.
.
.
.
.
.
.
.
.
.
.
.
.
. .
.
.
.
. . . . . . 2-62
.
.
.
.
.
.
.
.
.
Measuremen
.
.
.
.
.
.
.
.
.
.
.
.
.
.
.
.
.
.
.
.
.
.
.
.
.
.
.
.
.
. .
.
.
.
.
.
.
.
.
.
. .
.
.
.
.
.
.
.
.
. .
.
.
.
.
.
.
.
t
.
.
.
.
.
2-44
2-44
2-45
2-45
2-45
2-45
2-46
2-46
2-47
2-48
2-48
2-49
2-52
2-57
2-59
2-60
2-67
2-67
2-67
2-67
Polarization
General
coupling
de
Mo
units
PMD
Optimizing
elength
v
a
W
Analysis
Minim
Statistical
Measuremen
PDL
Measuremen
Basic
Setting
External
Making the
Saving the Measurement Results . . . . . . . . 2-54
PDL Measurement: Power Max-Min Metho d . . . 2-55
Basic Measurement. . . . . . . . . . . . . . . 2-56
Setting up the System . . . . . . . . . . . . 2-56
External Source Preparation . . . . . . . . . . 2-57
Making the
Sa
Jones
Basic Measuremen
Setting up the System
External Source Preparation .
Measurement Pro cedure .
Making the Measurement . . . . . . . . . . . 2-64
Concepts
The
The
Description of
up
the
ving
Matrix
Establish the Polarization Reference Frame . . 2-63
Relativ
sign
Algorithm
modes
eects
.
the setup
tuning
de
mo
feature
um
haracterization
c
t:
t
the System
Source
.
of
Preparation
Measuremen
Measuremen
Measuremen
Measuremen
t.
.
.
.
Jones
e
.
s3
the
.
Contents-3
Page 10

Application of the Jones Matrix . . . . . . . . 2-68
Timed Measurements . . . . . . . . . . . . . . 2-69
Polarization Maintaining Fib er Launch . . . . . . 2-69
Basic Measurement. . . . . . . . . . . . . . . 2-70
Setting up the System . . . . . . . . . . . . 2-70
External Source Preparation . . . . . . . . . . 2-71
Making the Measurement . . . . . . . . . . . 2-72
Concepts . . . . . . . . . . . . . . . . . . . 2-74
Explanation of Polarization Maintaining Fiber
Launch. . . . . . . . . . . . . . . . . . 2-74
Polarization Reference Frame . . . . . . . . . . 2-75
Basic Measurement. . . . . . . . . . . . . . . 2-76
Setting up the System . . . . . . . . . . . . 2-76
External Source Preparation . . . . . . . . . . 2-77
Choosing the Polarizers . . . . . . . . . . . . 2-77
Setting the Reference Frame . . . . . . . . . . 2-78
Checking Reference Frame Quality . . . . . . . 2-78
Setting a Circular State of Polarization . . . . . 2-78
Using the
Additional
2pt
Measuremen
Device
Measuremen
In
Measuring
Surface
Concepts
Explanation
Mathematics
ransmission
T
State of
Reference F
Measuremen
3pt
and
tegrated
P
.
.
of
olarization
P
olarization
P
the
of
t
.
.
. .
Output
of
t
Circuit
olarization
.
.
.
.
.
.
.
.
olarization
P
. .
.
(3pt
Ratio
Measuremen
rame .
Applications
t
Reference
Retardance
.
.
.
.
olarization
P
.
.
.
State
.
.
.
.
.
.
.
.
Reference
.
. .
Reference
.
.
.
F
an Optical
of
.
.
.
.
.
.
a Connector
at
.
.
.
.
.
.
.
.
.
rame)
F
.
.
ts
.
.
.
.
rames
.
.
of
.
.
.
.
.
.
rame
F
.
.
.
.
.
.
.
an
.
.
. .
.
.
.
.
.
.
.
.
.
.
.
.
.
.
Optical
.
. .
.
.
.
.
.
.
.
.
.
.
.
.
.
.
2-79
2-79
2-79
2-79
2-80
2-80
2-81
2-81
2-81
2-82
Basic Measurement. . . . . . . . . . . . . . . 2-83
Setting up the System . . . . . . . . . . . . 2-83
External Source Preparation . . . . . . . . . . 2-84
Making the Measurement . . . . . . . . . . . 2-85
Measurement Results . . . . . . . . . . . . . 2-85
. 2-86
.
.
.
.
.
Specialized
Measuring
Concepts
Degree of P
Measuremen
eectiv
.
.
.
olarization .
Electric Fields and P
hniques
ec
T
t
p
of
.
.
.
.
.
. . . . . . . . . . . 2-87
.
.
degree
e
.
olarization . . . . . . . . 2-87
.
olarization .
.
.
. .
.
.
.
.
.
.
.
.
2-86
2-87
Contents-4
Page 11
3. Accuracy Enhancement and Troubleshooting
Before You Proceed . . . . . . . . . . . . . . . 3-1
Symptoms . . . . . . . . . . . . . . . . . . . 3-3
Solutions . . . . . . . . . . . . . . . . . . . 3-3
4. Printing, Saving, and Recalling Measurement Results and
Instrument Congurations
. . . . . . . . . . . . . . . . . . . . . . . 4-1
Conventions . . . . . . . . . . . . . . . . . 4-2
For Additional Information . . . . . . . . . . 4-2
Printing Measurement Results . . . . . . . . . . 4-3
Standard Printing . . . . . . . . . . . . . . 4-3
Procedure . . . . . . . . . . . . . . . . . 4-3
Customized Printing . . . . . . . . . . . . . 4-4
Results . . . . . . . . . . . . . . . . . . 4-4
Procedure . . . . . . . . . . . . . . . . . 4-5
Saving and Recalling Measurements . . . . . . . . 4-7
Saving Measurements . . . . . . . . . . . . . 4-8
Pro
Recalling
HP
HP
ord
W
PMD:
PMD:
PDL:
Timed
and
ving
Sa
Recalling
cedure
Pro
a
ving
Sa
cedure
8509 File
8509
Numeric
the
User
.
Measuremen
Recall Pro
Recall
File
cessor,
Pro
File
Matrix Eigenanalysis
Jones
elength-Scanning
v
a
W
Jones
ormat
F
Matrix
.
Measurement
Recalling
Preset
.
.
.
Conguration .
.
.
.
ts
cedure .
Results
Spreadsheet
.
.
and
. .
As
.
Jones
.
T
t
ormat
F
.
.
Instrumen
Conguration
. .
.
.
.
.
. .
. .
. .
.
.
.
. .
.
.
.
.
.
Database
and
. .
.
.
.
e
v
Sa
ormat
F
e
v
Sa
Sa
.
.
.
ormat
F
e
v
ext
.
Matrix
.
Sa
Congurations
.
.
.
.
. .
. .
. .
.
.
. .
.
.
.
F
v
.
.
.
. .
.
.
.
.
.
.
ormat
.
e
.
.
.
.
.
.
.
.
.
.
. 4-10
.
.
.
.
.
.
.
.
.
.
. .
. .
.
.
.
.
.
.
.
.
.
.
.
.
Procedure . . . . . . . . . . . . . . . . . . 4-16
Recalling a User Conguration . . . . . . . . . . 4-17
Procedure . . . . . . . . . . . . . . . . . . 4-17
4-9
4-10
4-11
4-11
4-12
4-12
4-12
4-12
4-13
4-15
4-15
4-16
u
Men
y
Displa
The
5.
.
. .
.
.
.
.
.
.
F
The
Additional
or
PRESET
Information
Conguration
Displaying the Marker T
Displaying the P
Displaying the P
Exchanging the P
Ellipse .
oincare Sphere .
olarization Ellipse
oincare Sphere and the P
. . . . . . . . . . . . . . . .
able .
.
.
.
.
.
.
.
.
. .
.
. . . . . . . .
. . 5-3
. . . . . . . . . 5-4
. . . . . . . . 5-5
olarization
. . 5-6
.
Changing the Power Display Units . . . . . . . . 5-7
Marking the CurrentPoint . . . . . . . . . . . 5-8
Changing
Holding
Clearing
Setting
the
the
the
the
Data
Displa
Displa
race
T
Up
y
Displa
rom the
F
to
y
date
.
y
Refresh
requency
F
.
.
.
.
Sphere
Automatically
.
.
.
.
.
. .
.
.
.
.
.
.
.
.
.
.
.
.
.
.
.
Contents-5
5-1
5-2
5-9
5-10
5-11
5-11
Page 12
6. The System Menu
. . . . . . . . . . . . . . . . . . . . . . . 6-1
Conventions . . . . . . . . . . . . . . . . . 6-1
Optical Source . . . . . . . . . . . . . . . . . 6-2
Opening the Optical Source Setup Window . . . 6-2
Selecting an Optical Source (HP 8509A Only) . . 6-2
Selecting an Optical Source (HP 8509B Only) . . 6-3
Zero . . . . . . . . . . . . . . . . . . . . . 6-4
Initiating the Receiver Zeroing Routine . . . . . 6-4
Making Accurate Measurements . . . . . . . . 6-4
Calibration . . . . . . . . . . . . . . . . . . 6-5
Calibrating For Use With a Fixed Wavelength Source 6-7
Select the Source to be Calibrated . . . . . . 6-7
Calibrate at the Selected Wavelength . . . . . 6-8
Save and/or Apply the Calibration . . . . . . 6-10
Calibrating For Use With a Tuneable Wavelength
Source . . . . . . . . . . . . . . . . . . 6-11
Select External Source and Input Wavelength . 6-11
.
.
.
.
.
.
.
.
. .
.
.
.
.
.
.
.
.
8509B
. .
.
.
.
.
.
.
.
.
.
.
.
. .
.
y
.
.
.
.
.
.
.
.
.
.
.
.
.
.
.
.
.
Only)
.
.
.
.
.
.
.
.
. .
.
.
.
.
.
.
.
.
.
.
.
.
.
.
.
.
.
.
.
.
.
Calibrate at
ving
Sa
Applying
Applying
wto
Ho
Deleting
olarizers
P
ening
Op
Selecting
Selecting
out
Ab
Selecting
olarizer
P
Using the
elength
v
a
W
Calibration
A
Calibration
a
ell
T
Calibration
a
.
.
.
P
the
olarizer
P
a
an
ternal
In
an
Angles
utter
Sh
the Selected
Calibrations
Calibration
a
If
.
.
.
.
olarizers
Window
.
olarizers
P
P
ternal
In
External P
the
and
8509B
(HP
v
Wa
.
.
.
.
.
.
.
is
.
.
.
.
. .
.
.
.
.
.
.
.
olarizer
.
.
olarizer .
oincare
P
only)
elength
.
. .
Applied
.
.
.
(HP
.
Displa
.
Averaging . . . . . . . . . . . . . . . . . . . 6-21
Opening the Averaging Window . . . . . . . . 6-21
Selecting DisplayAveraging . . . . . . . . . 6-21
About Display Averaging . . . . . . . . . 6-21
Selecting MeasurementAveraging . . . . . . 6-22
t
.
.
Windo
Range
Op
About
.
ening
Measuremen
.
.
.
Range
the
. .
.
Selecting Autorange
Selecting a Specic Gain State .
About Range
Analog Outputs
. . . .
. . . . . . . . . . . . . . . . 6-24
eraging
Av
.
.
.
.
w
. . . .
. . . . . . . . . . . 6-23
.
.
.
. .
.
.
.
.
.
.
.
. .
.
.
.
.
.
. . . . . . . . 6-23
. . . . . . . 6-23
.
.
.
.
.
.
Opening the Analog Outputs Window. . . . . . 6-24
DOP and Normalized Stokes Parameters Mode . . 6-24
.
.
.
.
.
.
.
.
.
.
.
Photo
w
Ra
Reference
ening
Op
Operation
dio
rame
F
Reference
the
erication
V
de
Info
Curren
ts
.
.
.
. .
.
.
.
.
.
.
.
.
.
F
.
Information Windo
rame
.
.
.
.
.
.
.
.
w
.
.
.
.
6-12
6-14
6-15
6-15
6-16
6-17
6-18
6-18
6-18
6-18
6-19
6-19
6-19
6-20
6-22
6-23
6-23
6-25
6-26
6-26
6-28
Contents-6
Page 13

7. User Interface Reference
Main Window . . . . . . . . . . . . . . . . . 7-2
Optical Source Setup . . . . . . . . . . . . . . 7-7
Calibration . . . . . . . . . . . . . . . . . . 7-9
Operation Verication . . . . . . . . . . . . . 7-11
PMD: Jones Matrix Eigenanalysis . . . . . . . . 7-12
PMD Statistics . . . . . . . . . . . . . . . . . 7-15
PMD: Wavelength-Scanning . . . . . . . . . . . 7-18
Timed Measurements . . . . . . . . . . . . . . 7-22
PDL: Jones Matrix & Jones Matrix . . . . . . . . 7-24
PDL: Power Max - Min . . . . . . . . . . . . . 7-26
PM Fiber Launch . . . . . . . . . . . . . . . 7-28
Marker Angles . . . . . . . . . . . . . . . . . 7-29
8. Lightwave Connector Care
Introduction . . . . . . . . . . . . . . . . . . 8-1
Cleaning and Handling . . . . . . . . . . . . . 8-3
Denition of Terms . . . . . . . . . . . . . . 8-3
Connector
Adapter
Handling
Cleaning
Cleaning
Equipmen
Pro
Cleaning
Equipmen
cess
Pro
Cleaning
Storage
Making
Summary
ection
Insp
Non-Lensed
cess
Ligh
Lensed Connections
.
Connections
.
.
.
.
. .
. .
. .
. .
.
.
.
.
.
.
.
.
.
.
.
.
.
.
.
.
.
. .
. .
. .
. .
.
.
.
.
.
.
.
.
.
.
.
.
.
.
.
.
.
.
.
.
.
.
.
.
. .
.
.
.
.
.
.
.
.
.
.
.
.
. .
.
.
.
.
.
.
.
.
. .
.
.
.
.
.
.
.
.
.
.
.
.
.
.
.
.
.
.
.
.
. .
.
.
.
.
.
.
.
.
.
Connectors
e
v
a
w
t
Ligh
.
.
. .
.
.
.
.
.
.
.
t
.
.
.
.
.
.
.
.
.
.
. .
.
.
.
Adapters
e
v
a
w
t
.
.
.
.
.
t
.
. .
.
.
.
.
.
.
.
.
.
.
.
.
.
.
.
.
.
.
.
.
. .
. .
. .
.
.
.
.
.
.
.
.
.
.
.
.
.
.
.
.
.
.
.
.
.
.
.
.
.
.
.
.
.
.
.
. .
. .
. .
.
.
.
.
.
.
. 8-3
. .
.
.
.
.
.
.
.
.
.
.
.
.
.
Visual Inspection . . . . . . . . . . . . . . . 8-8
Optical Performance Testing . . . . . . . . . . 8-8
Introduction . . . . . . . . . . . . . . . . 8-8
Insertion Loss . . . . . . . . . . . . . . . 8-9
.
. .
.
.
.
.
.
.
.
.
.
.
. .
.
Return
Loss
8-3
8-3
8-3
8-4
8-4
8-4
8-5
8-5
8-5
8-5
8-6
8-7
8-7
8-8
8-9
Regulatory Information
and
y
Safet
9.
Regulations and Licensing .
Safety Information
Environmental Conditions .
Ventilation Requiremen
Cleaning Instructions
Instrument Conforms . . . . . . . . . . . . . 9-3
Laser Ap erture Lo cation . . . . . . . . . . . 9-4
. . . . . . . . . . . 9-1
. . . . . . . . . . . . . . 9-3
.
. . . . . . . . . . 9-3
ts . . . . . . . . . . . 9-3
. . . . . . . . . . . . . 9-3
Contents-7
Page 14

10. Programming
11. Specications and Characteristics
. . . . . . . . . . . . . . . . . . . . . . . 11-1
Warranted Specications . . . . . . . . . . . . 11-1
Polarization Mo de Dispersion (PMD) Specications,
Jones Matrix Eigenanalysis (JME) Method (HP
8509B only) . . . . . . . . . . . . . . . 11-1
Characteristics . . . . . . . . . . . . . . . . . 11-2
Jones Matrix Eigenanalysis PMD Measurement . 11-2
Wavelength Scanning PMD Measurement . . . . 11-3
Comparison Between Jones Matrix Eigenanalysis and
Wavelength Scanning Methods . . . . . . . 11-4
Receiver Characteristics . . . . . . . . . . . . 11-5
Source Characteristics . . . . . . . . . . . . . 11-6
Polarization Dependence, Jones Matrix Method . 11-7
Polarization Dependence, Power Max-Min Method 11-7
Fiber Size and Analog Output Range . . . . . . 11-7
A. Co
P
Glossary
Index
ordinate System
t
olarized
Ligh
and Generation
of
Righ
t-Hand
Circularly
Contents-8
Page 15
Figures
1-1. The HP 8509 Basic Measurement Screen . . . . 1-4
1-2. The Marker Window . . . . . . . . . . . . . 1-6
1-3. Setting a Marker . . . . . . . . . . . . . . . 1-7
1-4. Close Set Marker Window. . . . . . . . . . . 1-7
1-5. Turn Markers On/O . . . . . . . . . . . . . 1-8
1-6. Clear Markers . . . . . . . . . . . . . . . . 1-8
1-7. Center Sphere on Marker . . . . . . . . . . . 1-9
1-8. Marker Zoom and Rotate . . . . . . . . . . . 1-10
1-9. Clear Trace and Hold . . . . . . . . . . . . . 1-11
1-10.and Cal . . . . . . . . . . . . . . . . . . 1-12
Example
2-1.
Measuremen
2-2.
System
2-3.
Optical
2-4.
olarizer
P
2-5.
Polarizer
2-6.
3pt
2-7.
Circular
2-8.
JME
2-9.
2-10. JME
Segmen
2-11.
Find
2-12.
2-13. Optical
of
measuremen
Setup
t
u
Men
Source
Selection
Setup
Reference
olarization
P
Measuremen
Source
Minim
Setup
Selection
t
um
Source Setup
t .
.
.
Setup
.
.
Applied
Selection
t
of
#
. .
. .
.
.
.
.
.
.
.
.
.
.
.
.
.
.
.
.
.
.
.
.
.
.
.
.
oints
P
for PMD:
.
.
.
.
.
.
.
. .
.
.
.
.
.
.
.
.
. .
.
.
.
.
.
.
.
.
.
.
.
.
.
.
. .
.
.
.
.
.
.
.
.
. .
. .
Jones Matrix
.
.
.
.
.
.
.
.
.
.
.
.
.
.
.
.
.
.
. .
. .
. .
.
.
.
.
.
.
.
.
.
.
.
.
.
.
.
.
.
.
.
.
.
.
.
.
.
.
.
. .
.
.
.
.
.
.
.
.
.
.
.
.
.
.
.
.
. .
.
.
.
.
.
.
.
.
.
. .
2-2
2-3
2-4
2-5
2-5
2-6
2-6
2-7
2-8
2-9
2-10
2-10
PMD:JME
for a
y
displa
data
Eigenanalysis . . . . . . . . . . . . . . . 2-11
2-14. PMD: JME MeasurementStart . . . . . . . . 2-11
2-15. Measurement Results . . . . . . . . . . . . . 2-12
2-16. The Measurement Summary . . . . . . . . . . 2-13
2-17. The Measurement Annotation Area . . . . . . . 2-14
Cursor
The
2-18.
Changing
2-19.
2-20. Changing the Graph's Y-Scale
2-21. Displaying Data in T
2-22. Displaying Data in a Statistical
2-23. Displaying Data in a Statistical F
2-24. PMD Statistics File Men
Bar
Measuremen
the
t
abular F
u.
ormat
F
ormat .
.
. . . . . . . . 2-16
.
. . . . . . 2-16
. .
.
.
.
.
Format . . . . . 2-17
ormat . . . . . 2-18
. . . . . . . . . . 2-19
2-15
2-15
.
.
.
.
.
.
.
.
.
.
.
. .
.
.
2-25. Printing the PMD:JME Graph . . . . . . . . . 2-22
2-26. Saveas Text . . . . . . . . . . . . . . . . . 2-22
2-23
.
.
.
.
.
.
.
.
.
.
.
. .
.
2-24
.
.
. .
.
.
.
.
.
.
.
2-25
.
.
.
. .
.
.
.
.
.
.
2-25
.
.
.
.
.
.
.
.
.
.
2-27.
2-28.
2-29.
2-30.
Database
Saving
in
.
.
.
.
Measuremen
Measuremen
.
t
t
.
.
Setup
Start
.
ormat
F
.
.
.
.
.
.
Contents-9
Page 16
2-31. Thru Calibration . . . . . . . . . . . . . . . 2-26
2-32. The Measurement . . . . . . . . . . . . . . 2-26
2-33. The Results . . . . . . . . . . . . . . . . . 2-27
2-34. Example of data displayforawavelength-scanning
PMD measurement . . . . . . . . . . . . 2-33
2-35. Wavelength-Scanning System Setup . . . . . . . 2-34
2-36. Wavelength-Scanning Measurement Selection . . 2-35
2-37. Optical Source Setup for PMD:Wavelength Scanning 2-36
2-38. PMD: WS Measurement Start . . . . . . . . . 2-36
2-39. Measurement Results . . . . . . . . . . . . . 2-37
2-40. The Measurement Summary . . . . . . . . . . 2-38
2-41. The Measurement Annotation Area . . . . . . . 2-39
2-42. The Cursor Bar . . . . . . . . . . . . . . . 2-39
2-43. Changing the MeasurementFormat . . . . . . . 2-40
2-44. Displaying Data in Tabular Format . . . . . . . 2-41
2-45. Printing your Graph . . . . . . . . . . . . . 2-42
2-46. Saveas Text . . . . . . . . . . . . . . . . . 2-43
2-47. Saving in Database Format . . . . . . . . . . 2-43
data
measuremen
Jones matrix
2-48. Example
Measuremen
2-49.
System
2-50.
Optical Source
2-51.
olarizer
P
2-52.
olarizer
P
2-53.
3pt
2-54.
Circular
2-55.
Jones
2-56.
Jones
2-57.
Measuremen
2-58.
Example
2-59.
2-60. Measuremen
2-61. System Menu . . . . . . . . . . . . . . . . 2-57
2-62. Optical Source Setup . . . . . . . . . . . . . 2-57
2-63. PDL Measurement Selection . . . . . . . . . . 2-58
2-64. PDL:Power Max-Min Measurement Window. . . 2-58
2-65. Measurement Results . . . . . . . . . . . . . 2-59
2-66. Example
Measuremen
2-67.
2-68. System Men
2-69. Optical Source Setup
2-70. Jones Matrix Measuremen
2-71. Jones Matrix Measuremen
2-72. Measurement Results . . . . . . . . . . . . . 2-66
2-73. Comparing the output Jones Vectors to 3 known
Jones
2-74.
Example
2-75.
Measuremen
2-76.
of a
.
.
y
displa
Setup
t
u
Men
Selection
Setup
Reference
olarization
P
Matrix
Matrix
measuremen
input
Matrix
Alignment
Measuremen
Measuremen
t Results
PDL
a
of
Setup
t
data
of
Setup
t
u . .
Jones
Application
P
a
of
Setup
t
.
.
.
.
. .
.
.
Setup
.
.
.
.
Applied
measuremen
.
displa
.
.
t
.
. . . . . . . . . . . . . . 2-62
ectors
V
olarization
displa
data
.
PDL
.
.
.
.
.
.
.
.
.
.
.
.
.
.
.
.
.
.
. .
.
.
.
.
.
.
.
.
.
.
.
.
.
.
. .
.
.
.
.
.
.
.
.
.
. .
.
.
.
.
.
.
.
.
Selection
t
Windo
t
.
. .
.
.
.
for
y
. .
.
.
.
.
.
. . . . . . . . . . . . . 2-62
t Selection
t Windo
.
.
.
Maintaining
.
y
.
.
.
w
.
.
.
.
displa
data
t
.
.
.
.
matrix
Jones
a
.
.
.
.
.
.
.
w . . . . . . 2-65
.
.
.
.
.
.
.
.
.
.
.
.
.
.
.
.
t
. .
.
.
.
.
.
. .
. .
.
.
.
.
.
.
.
.
.
.
.
.
.
.
.
.
.
.
.
.
.
.
.
.
.
.
.
.
.
.
.
.
.
.
.
.
.
.
.
.
.
.
.
. .
. .
.
.
.
.
.
.
.
.
.
.
y
.
.
.
.
.
.
.
.
.
.
.
.
.
.
.
.
. .
. . . . . 2-64
.
.
.
.
.
.
.
. .
.
.
.
.
er
Fib
.
.
.
.
.
.
.
.
.
.
.
.
2-47
2-48
2-49
2-49
2-50
2-50
2-50
2-51
2-52
2-53
2-53
2-55
2-56
2-60
2-61
2-68
2-68
2-69
2-70
Contents-10
Page 17
2-77. System Menu . . . . . . . . . . . . . . . . 2-71
2-78. Optical Source Setup . . . . . . . . . . . . . 2-71
2-79. PM Fib er Launch Measurement Selection . . . . 2-72
2-80. PM Fib er Launch AlignmentWindow. . . . . . 2-73
2-81. How PMF cable launch extension ratio is calculated 2-74
2-82. Example of the results that can be achieved with and
without a polarization reference frame . . . . 2-75
2-83. Measurement Setup . . . . . . . . . . . . . . 2-76
2-84. System Menu . . . . . . . . . . . . . . . . 2-77
2-85. Optical Source Setup . . . . . . . . . . . . . 2-77
2-86. Example of a SOP measurement data display . . 2-82
2-87. Measurement Setup . . . . . . . . . . . . . . 2-83
2-88. System Menu . . . . . . . . . . . . . . . . 2-84
2-89. Optical Source Setup . . . . . . . . . . . . . 2-84
2-90. SOP and DOP Measurement Example . . . . . 2-85
2-91. Polarization changes with Ex(t) and Ey(t). . . . 2-87
2-92. Elliptical displays of polarization . . . . . . . . 2-88
2-93. Mathematical description of an elliptical displayof
2-88
.
.
.
.
.
.
.
.
.
.
.
.
. .
polarization
olarization
P
2-94.
Measuremen
3-1.
Men
File
The
4-1.
The Prin
4-2.
Customized
4-3.
The
4-4.
The
4-5.
The
4-6.
Viewing
4-7.
The
4-8.
The
4-9.
The
4-10.
4-11. The
4-12. The Load Menu . . . . . . . . . . . . . . . 4-17
4-13. The Load Window . . . . . . . . . . . . . . 4-17
5-1. The PRESET Conguration . . . . . . . . . . 5-2
5-2. The Show Markers Menu . . . . . . . . . . . 5-3
5-3. Marker Window Hidden . . . . . . . . . . . . 5-3
5-4. The
oincare
P
5-5.
The
5-6.
5-7. P
5-8. The Sho
5-9. Sphere and Ellipse Exc
5-10. The P
5-11. Power Display in Watts Mode . . . . . . . . . 5-7
5-12. The Mark CurrentPointMenu. . . . . . . . . 5-8
5-13.
5-14.
5-15.
5-16. The
5-17.
olarization Ellipse T
Mark
The
The
The
t
Men
e
v
Sa
As Windo
e
v
Sa
Load
a
Load
Preset Conrmation
Men
e
v
Sa
Sa
File
w
Sho
Sphere
w
Sho
w Sphere
ower Displa
Curren
Displa
Displa
Hold
Hold
. .
states
roublesho
T
t
.
u
u
Men
ting
Prin
u
u
Men
Stored
PRESET
u
As:
e
v
Sphere
T
Ellipse
oin
P
t
date
Up
y
date
Up
y
u
Men
unction
F
oincare
P
a
on
Matrix
oting
.
.
.
. .
. .
.
.
.
.
.
.
.
.
.
.
the
.
.
.
O .
ated
.
.
.
.
. .
.
.
P
.
File
.
.
.
.
.
.
.
.
.
.
.
.
.
.
.
.
.
.
Example
.
.
.
.
.
.
w
.
.
.
.
on
race
T
Conguration
Window
.
.
.
.
Congure
.
u
Men
urned
Men
<->
yMen
O .
.
u
urned
Ellipse Men
hanged .
u . . . . . . . . .
Activ
t
u
Men
Box
.
.
.
.
.
.
.
.
.
.
.
.
.
.
.
.
.
.
.
.
.
. .
.
.
.
.
.
.
.
.
.
.
.
.
.
.
.
.
.
.
.
.
Sphere
.
u
.
.
.
.
w
. .
.
.
.
.
.
. .
.
.
.
.
.
.
.
.
.
.
.
.
.
.
.
.
.
.
.
.
.
.
.
.
.
.
.
. .
.
.
.
.
. .
. .
.
.
.
.
.
.
.
.
.
.
.
.
. . 5-7
.
.
.
.
.
.
.
.
.
.
.
.
.
.
.
.
.
.
.
.
.
.
.
. 4-15
.
.
.
.
.
.
.
.
.
. 5-10
Sphere
.
.
.
.
.
.
oincare
Men
.
Windo
.
.
.
. . . . . . . . 5-5
u . . . . . . 5-6
. . . . . . . . 5-6
.
.
.
.
.
2-89
3-2
4-1
4-3
4-4
4-8
4-9
4-10
4-11
4-15
4-16
4-16
5-4
5-4
5-5
5-8
5-9
5-9
5-10
Contents-11
Page 18
5-18. The Clear Trace Menu . . . . . . . . . . . . 5-11
5-19. The Auto Refresh Menu. . . . . . . . . . . . 5-11
6-1. The HP 8509A Optical Source Window . . . . . 6-2
6-2. The HP 8509B Optical Source Window . . . . . 6-3
6-3. The Calibration Window . . . . . . . . . . . 6-5
6-4. The Optical Source Window. . . . . . . . . . 6-7
6-5. The Calibration Window . . . . . . . . . . . 6-9
6-6. The Calibration List . . . . . . . . . . . . . 6-10
6-7. The Optical Source Window. . . . . . . . . . 6-11
6-8. The Calibration Window . . . . . . . . . . . 6-13
6-9. The Calibration List . . . . . . . . . . . . . 6-14
6-10. Calibration Applied . . . . . . . . . . . . . . 6-16
6-11. Deleting a Calibration . . . . . . . . . . . . 6-17
6-12. Conrm or Abort the Deletion Process . . . . . 6-17
6-13. The Polarizers Window . . . . . . . . . . . . 6-18
6-14. The Shutter Menu . . . . . . . . . . . . . . 6-20
6-15. The Averaging Window. . . . . . . . . . . . 6-21
6-16. The Range Window. . . . . . . . . . . . . . 6-23
6-17. The
No
6-18.
Tw
6-19.
Three-P
6-20.
The Op
6-21.
Laser
9-1.
Comparison
11-1.
Analog Outputs
rame
Reference
t
Reference
t
oin
eration
.
erture
of
Optical
F
V
.
JME
.
Lo
Reference
oin
o-P
8509A
Ap
Long
for
Window
Dened
rame
F
rame Information
F
erication
.
.
.
cation
and
er
Fib
.
.
.
.
.
Windo
w
Information
the
for
Windo
.
.
.
w
.
.
.
.
.
.
.
.
.
.
WS Measuremen
.
.
.
.
est
T
.
.
.
.
.
.
Windo
Window
HP
.
.
.
.
. .
Metho
t
.
.
.
.
.
.
.
.
w
.
.
.
.
ds
.
.
6-24
6-26
6-27
6-27
6-28
9-4
11-4
Contents-12
Page 19
Tables
4-1. Summary of HP 8509 Measurement Results
Save/Recall Features . . . . . . . . . . . . 4-6
6-1. Analog Outputs for DOP and Normalized Stokes
Parameters Mo de . . . . . . . . . . . . . 6-24
6-2. Analog Outputs for Raw Dio de Currents Mode . . 6-25
7-1. Main Window . . . . . . . . . . . . . . . . 7-2
7-2. Optical Source Setup . . . . . . . . . . . . . 7-7
7-3. Calibration . . . . . . . . . . . . . . . . . 7-9
7-4. Operation Verication . . . . . . . . . . . . 7-11
7-5. PMD: Jones Matrix Eigenanalysis . . . . . . . 7-12
PMD Statistics
7-6.
7-7. PMD:
Timed
7-8.
PDL:
7-9.
PDL:
7-10.
PDL:
7-11.
Mark
7-12.
Maxim
11-1.
8509B)
11-2. PMD
Metho
Rep
11-3.
Pigtail
Repeatabilit
11-4.
v
a
W
Measuremen
Jones
w
o
P
ow
P
Angles
er
um
Measuremen
d
eatabilit
. .
elength-Scanning
.
ts
Jones
.
of
of
&
Min .
-
Min
-
.
.
.
.
Uncertain
t
8509B
JME
JME
.
.
PMD
PMD
.
DGD
.
Only)
. .
Matrix
Max
er
Max
er
Measurable
.
(HP
y
ositions .
p
y
.
.
.
.
.
.
Matrix
.
. .
.
.
.
.
.
.
.
.
Using
.
.
. .
Using
y
t
.
Measuremen
. .
. .
Measuremen
.
.
.
.
.
JME
.
.
.
.
. .
.
.
.
.
.
.
.
.
.
.
.
.
the
.
.
.
.
.
.
. .
.
.
.
.
.
.
Dela
.
.
JME
.
.
with
t
.
.
with
t
.
. .
.
.
.
.
y
.
.
.
.
.
.
.
.
(HP
.
.
Fixed
.
.
. 7-22
.
.
.
.
.
.
.
.
.
.
.
.
.
.
.
.
.
. .
. .
Randomized Pigtail Positions . . . . . . . . 11-3
11-5. Minimum Measurable PMD Using the Wavelength
Scanning Method . . . . . . . . . . . . . 11-3
11-6. Receiver Characteristics . . . . . . . . . . . . 11-5
11-7. Source Characteristics . . . . . . . . . . . . . 11-6
.
.
External Source
11-8.
Measuremen
11-9.
Only) Jones
11-10. Measuremen
Only) P
Input
olarization
P
of
t
Matrix
olarization Dependence (HP
tofP
ower Max - Min Metho d
11-11. Other Characteristics .
Characteristics
ort
P
Dep
Metho
d
. . . . .
endence (HP
.
.
.
. . . . . . 11-7
. . . . . . . 11-7
.
8509B
.
.
.
.
.
8509B
7-15
7-18
7-24
7-26
7-28
7-29
11-1
11-2
11-2
11-6
11-7
Contents-13
Page 20

Page 21
Getting Started
This chapter contains the following sections.
Description of the Instrument
Installation
About This Manual Set
The Main Menu
The Data Displays (Power, DOP, Ellipse and Poincare Sphere)
The Marker Functions
Rotate
and
om
Zo
1
Description
Installation
of
Instrument
the
4
race
T
r
Clea
45
and
HP
The
calibrated
componen
Cal
8509A/B
p
ts.
Hold
and
5
Ligh
olarization
olarization
P
e
v
a
w
t
measuremen
ts
of
optical
Analyzer
signals and
oers
high-sp
The lightwave polarization analyzer is precongured at the
factory. All that is required to install the system is to unpackthe
the
to
Refer
on.
pieces,
correctly
\Installation"
Start Guide
also pro
system to
vides instructions for unpac
the factory for service.
connect
hapter
c
of
them,
the
and turn
8509A/B
HP
for complete instructions. The \Installation" c
them
Quick
Instal
lation
and
hapter
king the system and returning the
eed,
Getting
Started
1-1
Page 22
About This Manual Set
The HP 8509A/B manual set is made up of three documents.
HP 8509A/B LightwavePolarization
Installation Quick Reference Card
Installation and Quick Start Guide
User's/Reference Guide (this manual)
This guide uses the following conventions:
4
Button
5
This represents a button that can be selected on the
computer screen to perform an action.
N
Menu
Item
This
NN
N
N
N
N
N
N
N
N
N
N
N
N
N
N
N
N
N
NN
NN
NN
NN
N
the
contains an installation procedure.
contains an installation procedure, and an operation
verication procedure to ensure that your analyzer is
operating prop erly.
this is the main manual for the lightwave polarization
analyzer. This manual is describ ed in detail later in this
chapter.
indicates
computer
men
a
screen.
u
item
that
can
e
b
selected
on
1-2
Getting
Started
Page 23
HP 8509A/B User's/Reference Guide Table of Contents
(this manual)
This manual contains the following chapters.
1.
Getting Started
describes the HP 8509A/B manual set, and provides a
description of the Main Menu screen of the software.
2.
Making Measurements
provides step-by-step instructions for making the following
measurements.
Polarization Mode Disp ersion: Jones Matrix Eigenanalysis
Method (PMD JME)
Polarization Mode Disp ersion: Wavelength-Scanning Metho d
(PMD WS)
Polarization Dependent Loss: Jones Matrix (PDL JM)
Polarization Dependent Loss: Power Max-Min Method
Jones Matrix
Polarization Maintaining Fiber Alignment
Polarization Reference Frame
olarization
P
of
State
olarization
P
Degree
of
3.
Accuracy
roublesho
T
ting,
Prin
4.
Measuremen
Instrumen
Displa
The
5.
System
The
6.
terface
User
Ligh
Safet
In
a
w
t
and
y
7.
8.
9.
Information
10.
Programming
11.
Specications and
Characteristics
Glossary
Index
Appendix
Enhancement
oting
ving,
Sa
Results
t
Congurations
t
Men
y
u
Men
Reference
Connector
e
v
Regulatory
and
u
and
Recalling
and
Care
measuremen
File
Displa
System
reac
to
of
u.
men
men
y
men
and
it,
h
connectors.
and
u.
u.
a
solving
vides
vides
vides
eac
ws
procedures
information
a
a
provides
and
pro
pro
pro
sho
description
information on
vides
pro
licensing,
vides
pro
measurement
description of
description
and
trol
con
h
what
of
safet
for impro
problems.
out
ab
the
the
of
displa
es.
do
it
caring for
regulatory
,
y
ving the
items
the
items
items
the
,
y
accuracy
the
in
the
in
the
in
path
the analyzer's
cleaning,
,
environmental information.
provides guidance for programming problems.
provides performance sp ecications and characteristics of the
lightwave polarization analyzer.
denitions.
their
and
terms
of
list
alphab
etized
etized
list of
terms
with
page
n
um
er
b
pro
pro
vides
vides
an alphab
an
references. This is a subject index.
provides specialized bac
kground information.
ts
Getting
Started
1-3
Page 24
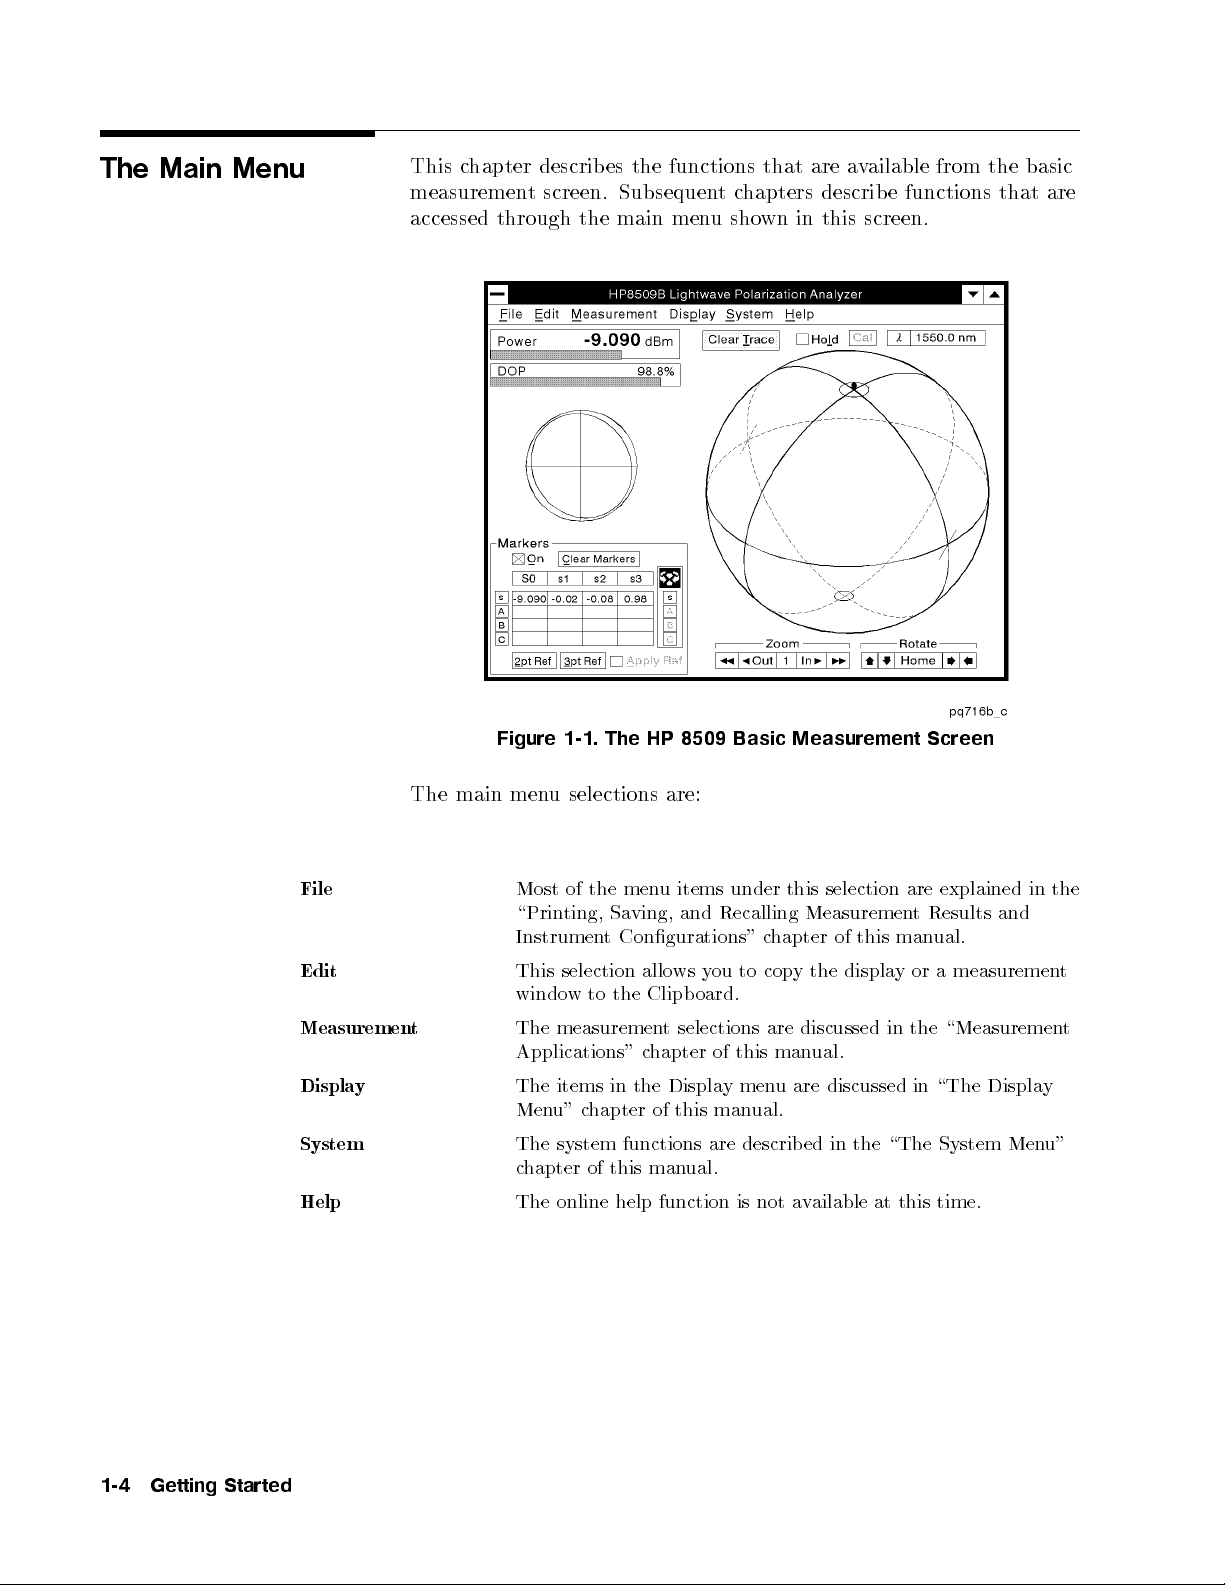
The Main Menu
This chapter describes the functions that are available from the basic
measurement screen. Subsequentchapters describe functions that are
accessed through the main menu shown in this screen.
File
Edit
Measurement
Display
System
Help
The
are
t
man
Screen
Results
ual.
Figure
main men
Most
\Prin
Instrumen
1-1.
selections
u
the
of
ting,
8509 Basic
HP
The
are:
items
u
men
and
ving,
Sa
Congurations"
t
under
Recalling
hapter
c
Measurement
selection
this
Measuremen
this
of
This selection allows you to copy the display or a measurement
window to the Clipb oard.
The measurement selections are discussed in the \Measurement
Applications" chapter of this manual.
The items in the Display menu are discussed in \The Display
ual.
man
this
hapter
c
u"
Men
system
The
chapter of this man
The online help function is not a
of
functions
ual.
are
describ
\The
in the
ed
vailable at this time.
explained
and
System
in
Men
the
u"
1-4
Getting
Started
Page 25
The Data Displays (Power, DOP, Ellipse and Poincare Sphere)
Refer to Figure 1-1 for the location of the displays on the basic
measurement screen.
Power Display
DOP Display
Poincare Sphere
The power of the optical signal under test is displayed as b oth a
horizontal bar, and a digital readout. When the receiver zeroing
routine is b eing performed, a green \zero" message appears in the
power display. Red \Overrange" and \Underrange" messages appear
here also.
The Degree of Polarization (DOP) is displayed as both a horizontal
bar and a digital readout. For the most reliable and accurate
measurements, use polarized light that approaches 100% DOP.
The HP 8509 Poincare sphere is a three-dimensional graphing system
showing all possible states of polarization. A dot or trace on the
sphere represen
allo
inside
ws
relativ
measured
feature
olarization
p
ADDITIONAL
oincare
P
the
Since
know
helpful
solid
the
on
to
lines
sphere.
bac
the
on
Data
k
of
ts the
the
INF
the
the
instrumen
the
oincare
P
to a
e
ORMA
sphere
that
fron
on
sphere is
ortion
p
polarize
d
t's
sphere
receiv
to
user-dened reference
TION
three-dimensional
a
is
sphere,
the
of
(equator
in
the
t
the
of
graticules
the
t
fron
shown
of
er.
displa
and
sphere
blue.
ligh
the
The
signal's state
a
y
and
en
brok
sho
is
e
v
a
w
t
reference
frame.
represen
longitude
on
lines
in red,
wn
signals
as
frame
of
tation, it
lines)
bac
the
and
is
are
of
k
data
olarization Ellipse
P
polarization
The
ellipse pro
vides
o-dimensional
w
t
a
visual
representation of the state of p olarization of an optical signal and
corresponds with points on the Poincare sphere.
Getting
Started
1-5
Page 26
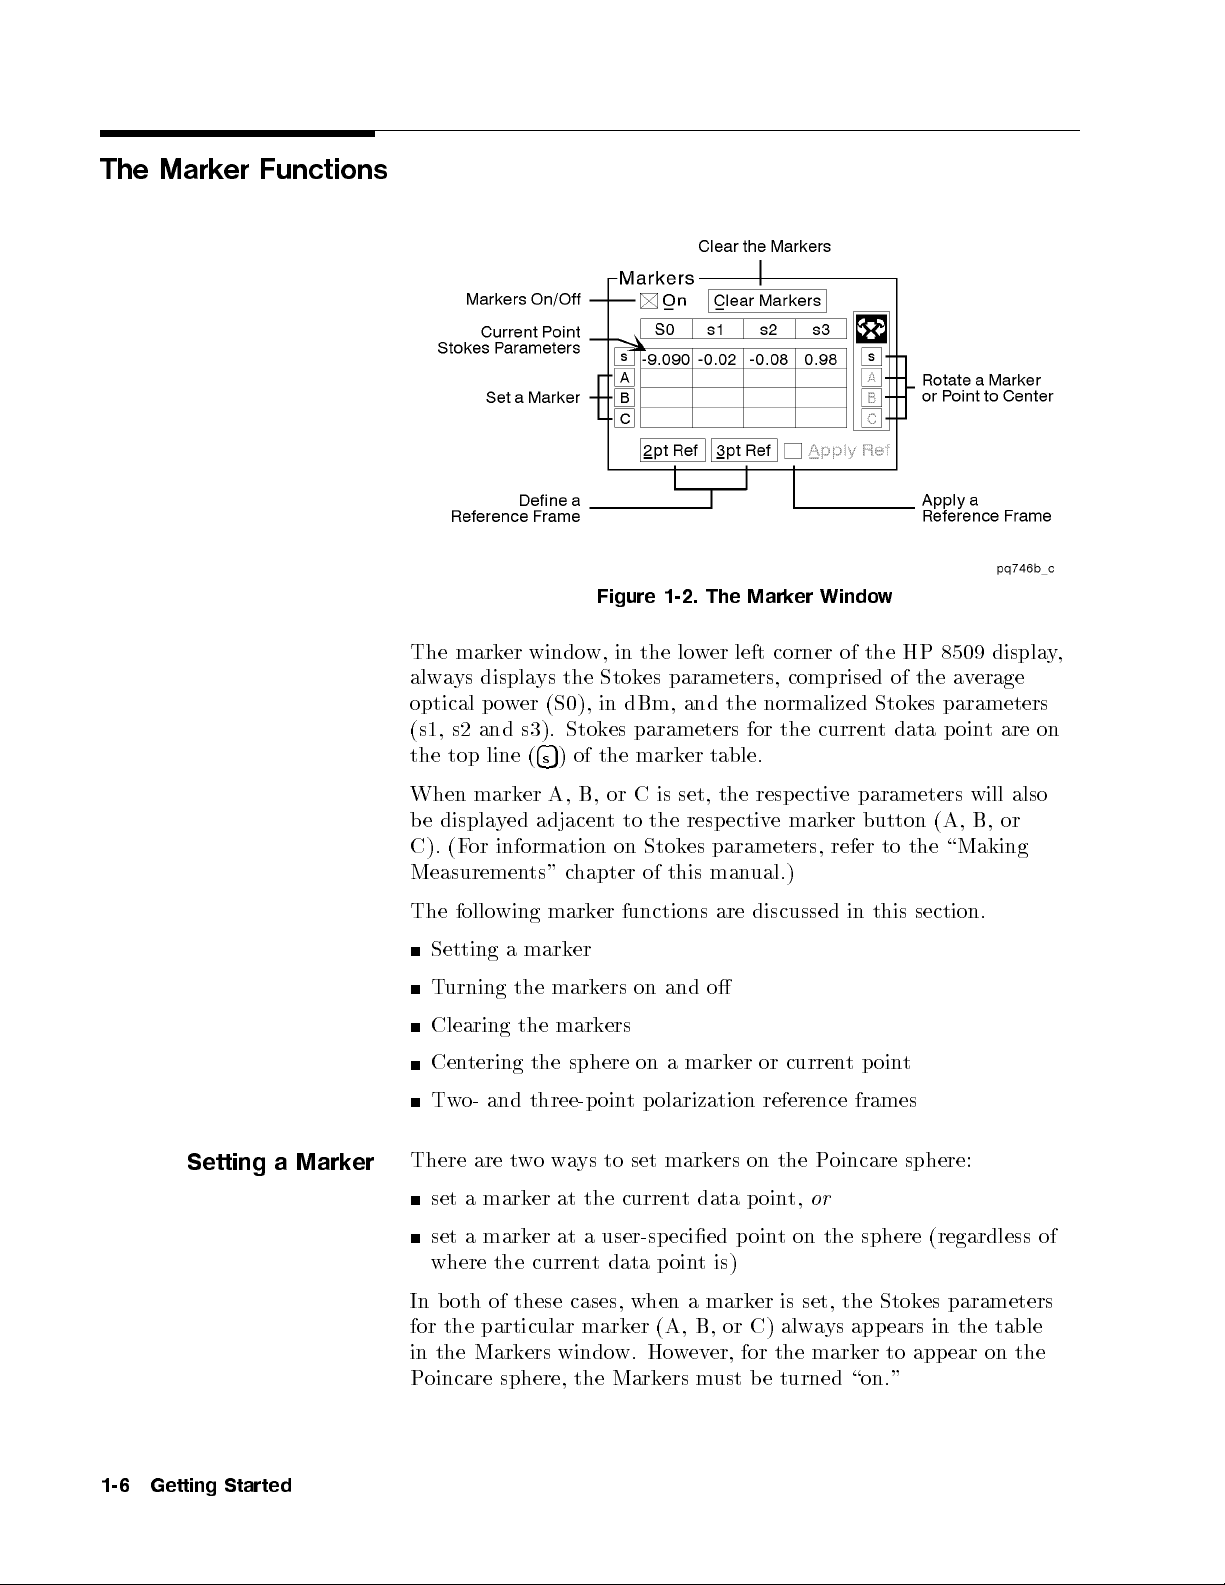
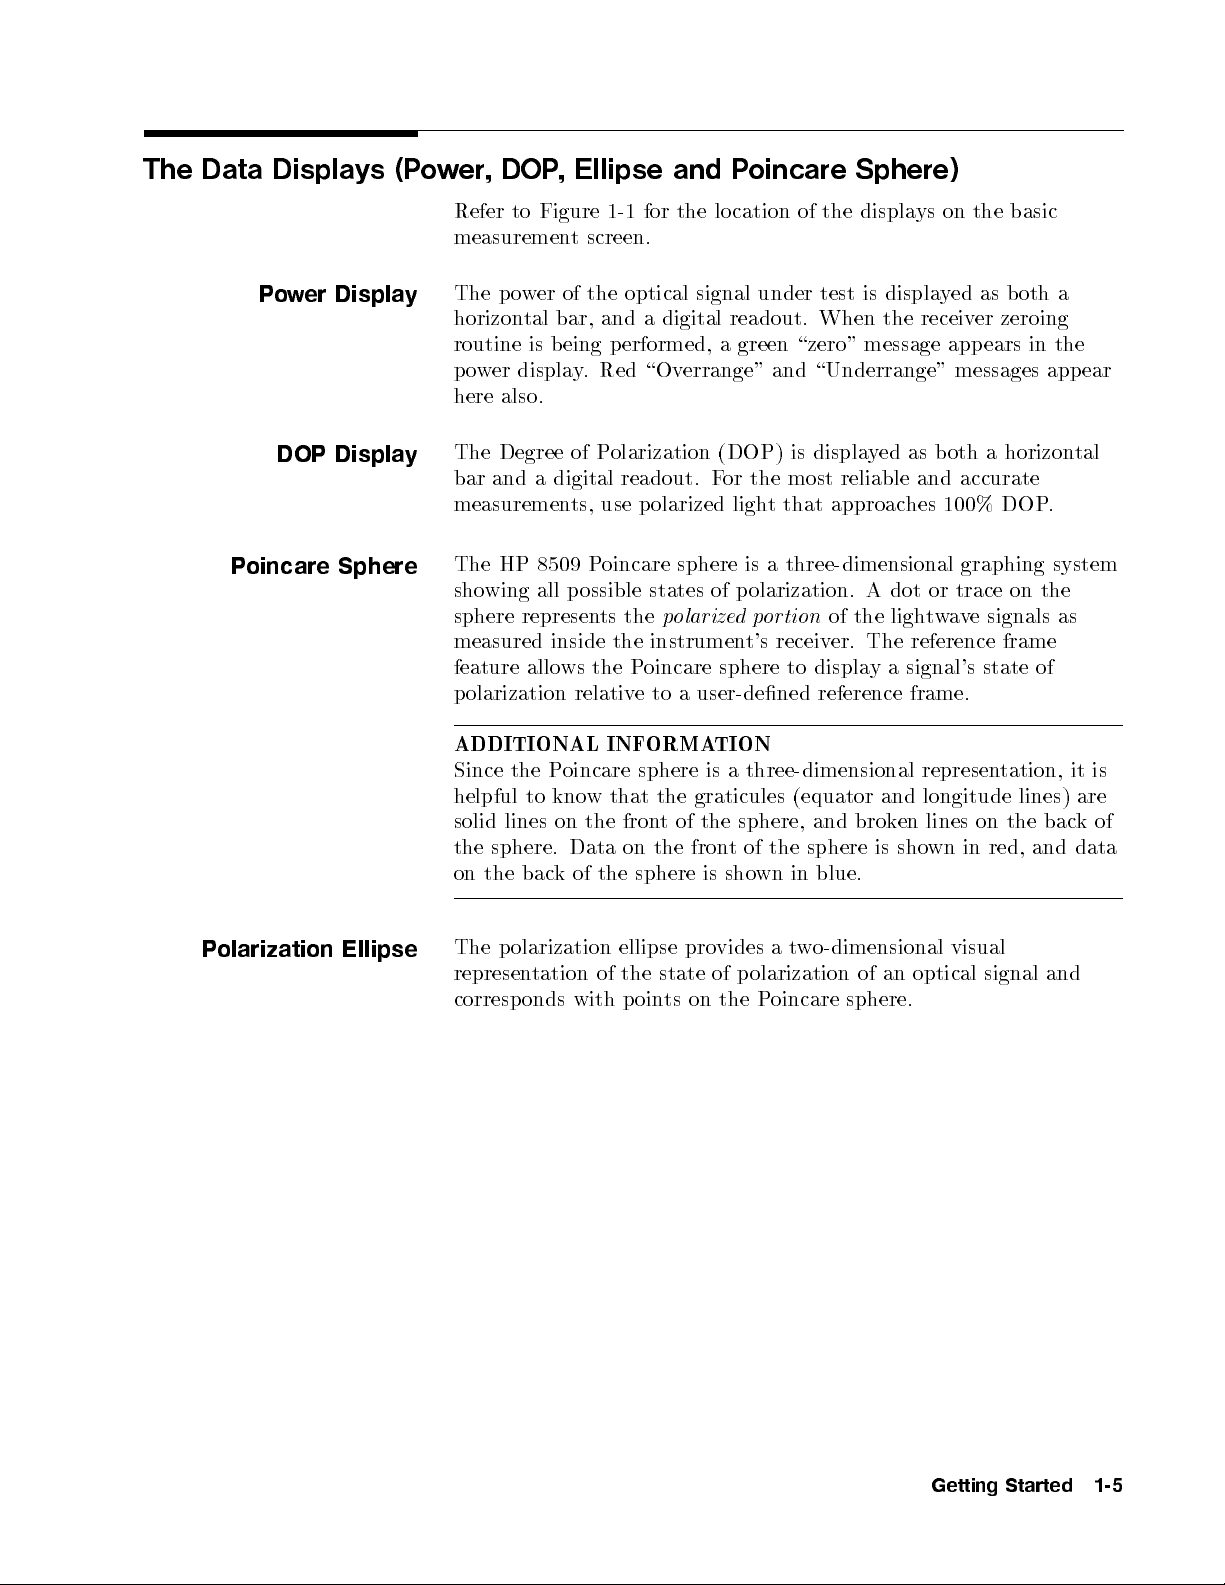
The Marker Functions
The mark
displa
ys
a
alw
s2
top
p
and
line
optical
(s1,
the
er windo
ys
(S0),
er
w
o
s3).
4
(
5
s
the
Stok
of
)
Figure
the
w, in
es
Stok
dBm,
in
parameters for
es
mark
the
Mark
The
1-2.
left
er
w
lo
parameters,
the
and
table.
er
Windo
er
corner
of
comprised
normalized
curren
the
w
the
of
Stokes
data
t
8509
HP
the
parameters
p
v
a
oin
displa
erage
are
t
on
,
y
Setting a Mark
A,
adjacen
ed
y
information
hapter
c
ts"
mark
wing
marker
to
t
on
of
functions
er
resp
the
es
Stok
this man
mark
e
ectiv
parameters,
ual.)
discussed in
are
button
er
to
refer
this section.
the
displa
e
marker
or
(F
When
b
C).
Measuremen
follo
The
Setting a
parameters
e
ectiv
resp
the
set,
is
C
or
B,
Turning the markers on and o
Clearing the markers
Centering the sphere on a marker or currentpoint
frames
oincare sphere:
or
er
p
t
o- and
Tw
There are t
set a mark
a marker at a user-specied poin
set
three-p
wow
er at the curren
where the curren
oin
to set mark
ays
t data poin
olarization
ers on the P
t data poin
t is)
reference
t,
t on the sphere (regardless of
In b oth of these cases, when a marker is set, the Stokes parameters
for the particular marker (A, B, or C) always appears in the table
app
to
er
mark
the
for
er,
ev
w
Ho
w.
windo
the Mark
in
oincare
P
ers
sphere,
the
Mark
ers
m
ust
e
b
turned
\on."
will
B,
(A,
\Making
on
ear
also
or
the
1-6
Getting
Started
Page 27
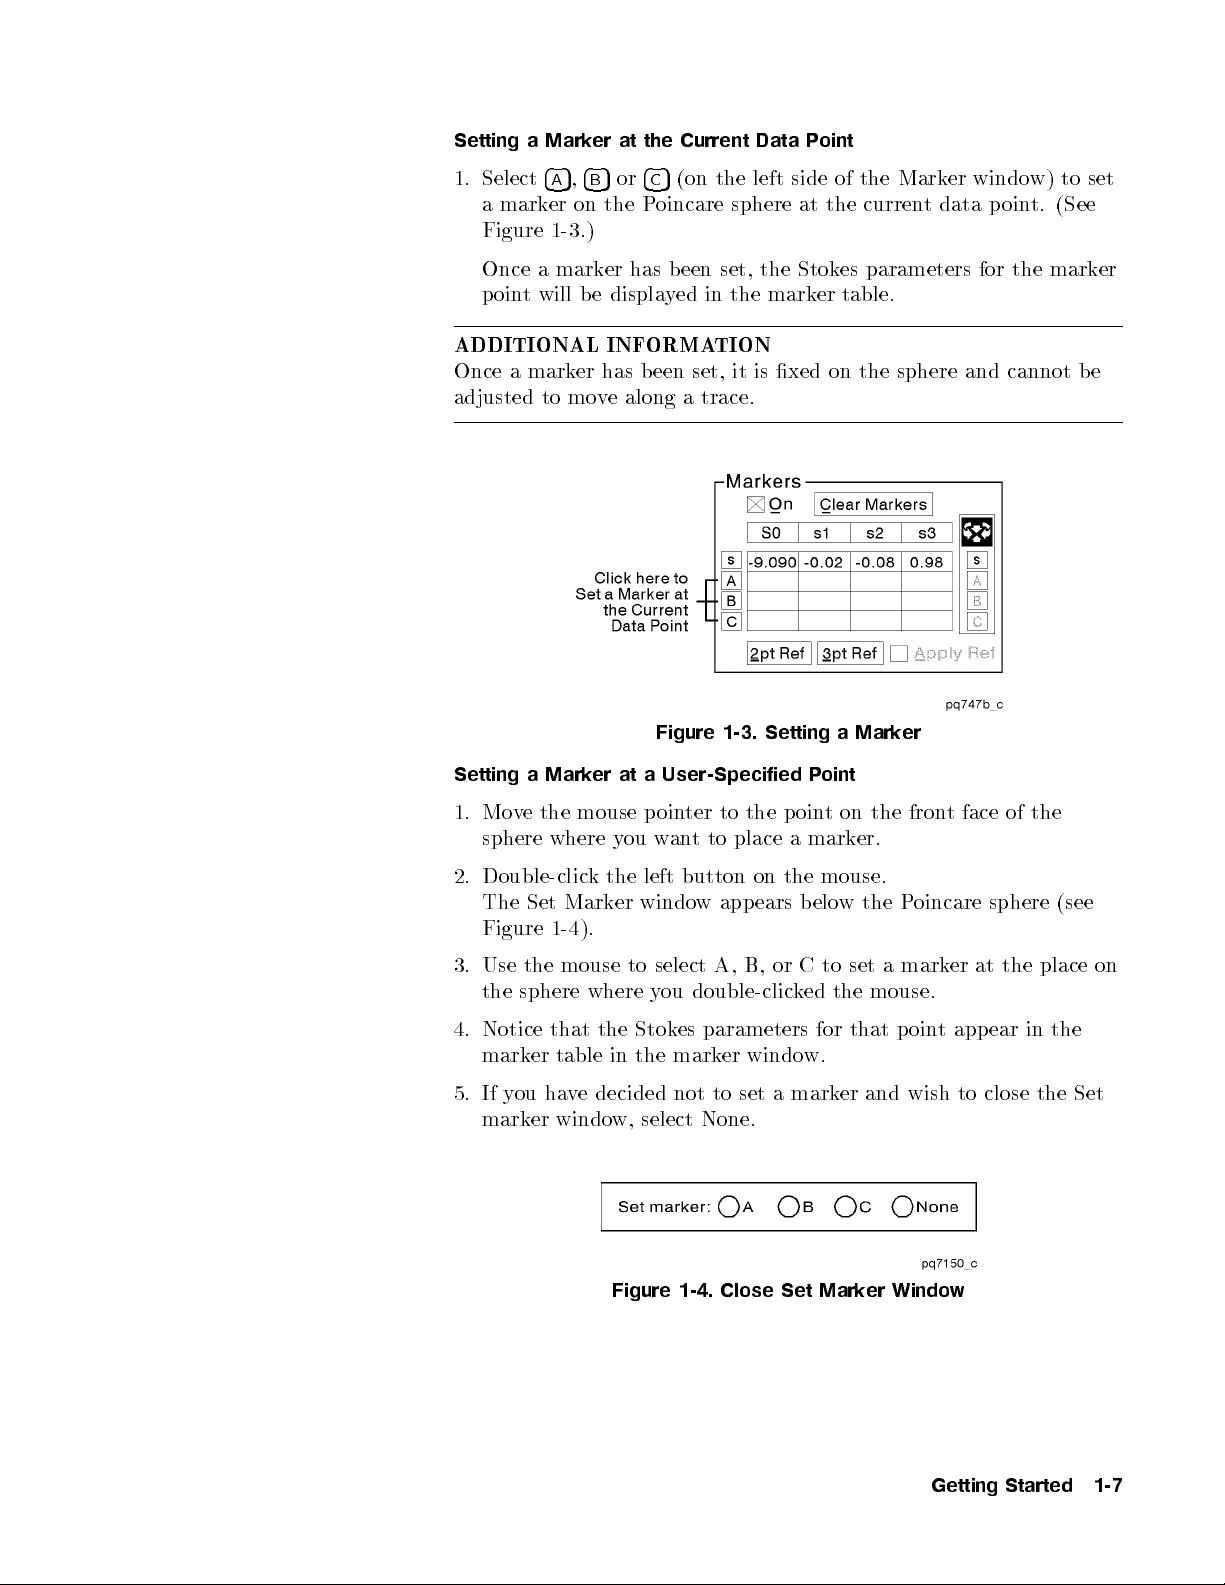
Setting a Marker at the Current Data Point
1. Select
4A5,4B5or4C5
(on the left side of the Marker window) to set
amarker on the Poincare sphere at the current data point. (See
Figure 1-3.)
Once a marker has b een set, the Stokes parameters for the marker
point will be displayed in the marker table.
ADDITIONAL INFORMATION
Once a marker has been set, it is xed on the sphere and cannot be
adjusted to move along a trace.
er
Mark
Figure
1-3.
Setting
a
oint
on
ears
or
oin
p
a
the
P
t
mark
mouse.
elow
b
to
C
on
set
the
er.
the P
a
fron
oincare
mark
t
er
face
at
the
of
sphere
the
(see
place
Setting
v
Mo
1.
sphere
Double-clic
2.
The
Figure 1-4
Use
3.
a
e
Set
the
Mark
the
where
Mark
mouse
at
er
mouse p
ou
y
the
k
er
).
to
User-Specified
a
to
ter
oin
place
to
t
an
w
button
left
app
w
windo
A,
select
the
B,
the sphere where you double-clicked the mouse.
4. Notice that the Stokes parameters for that point appear in the
marker table in the marker window.
5.
ou
y
If
mark
v
ha
window,
er
decided
e
not
select
to set
None.
a
the
close
to
wish
and
er
mark
Figure 1-4. Close Set Marker Window
on
Set
Getting
Started
1-7
Page 28
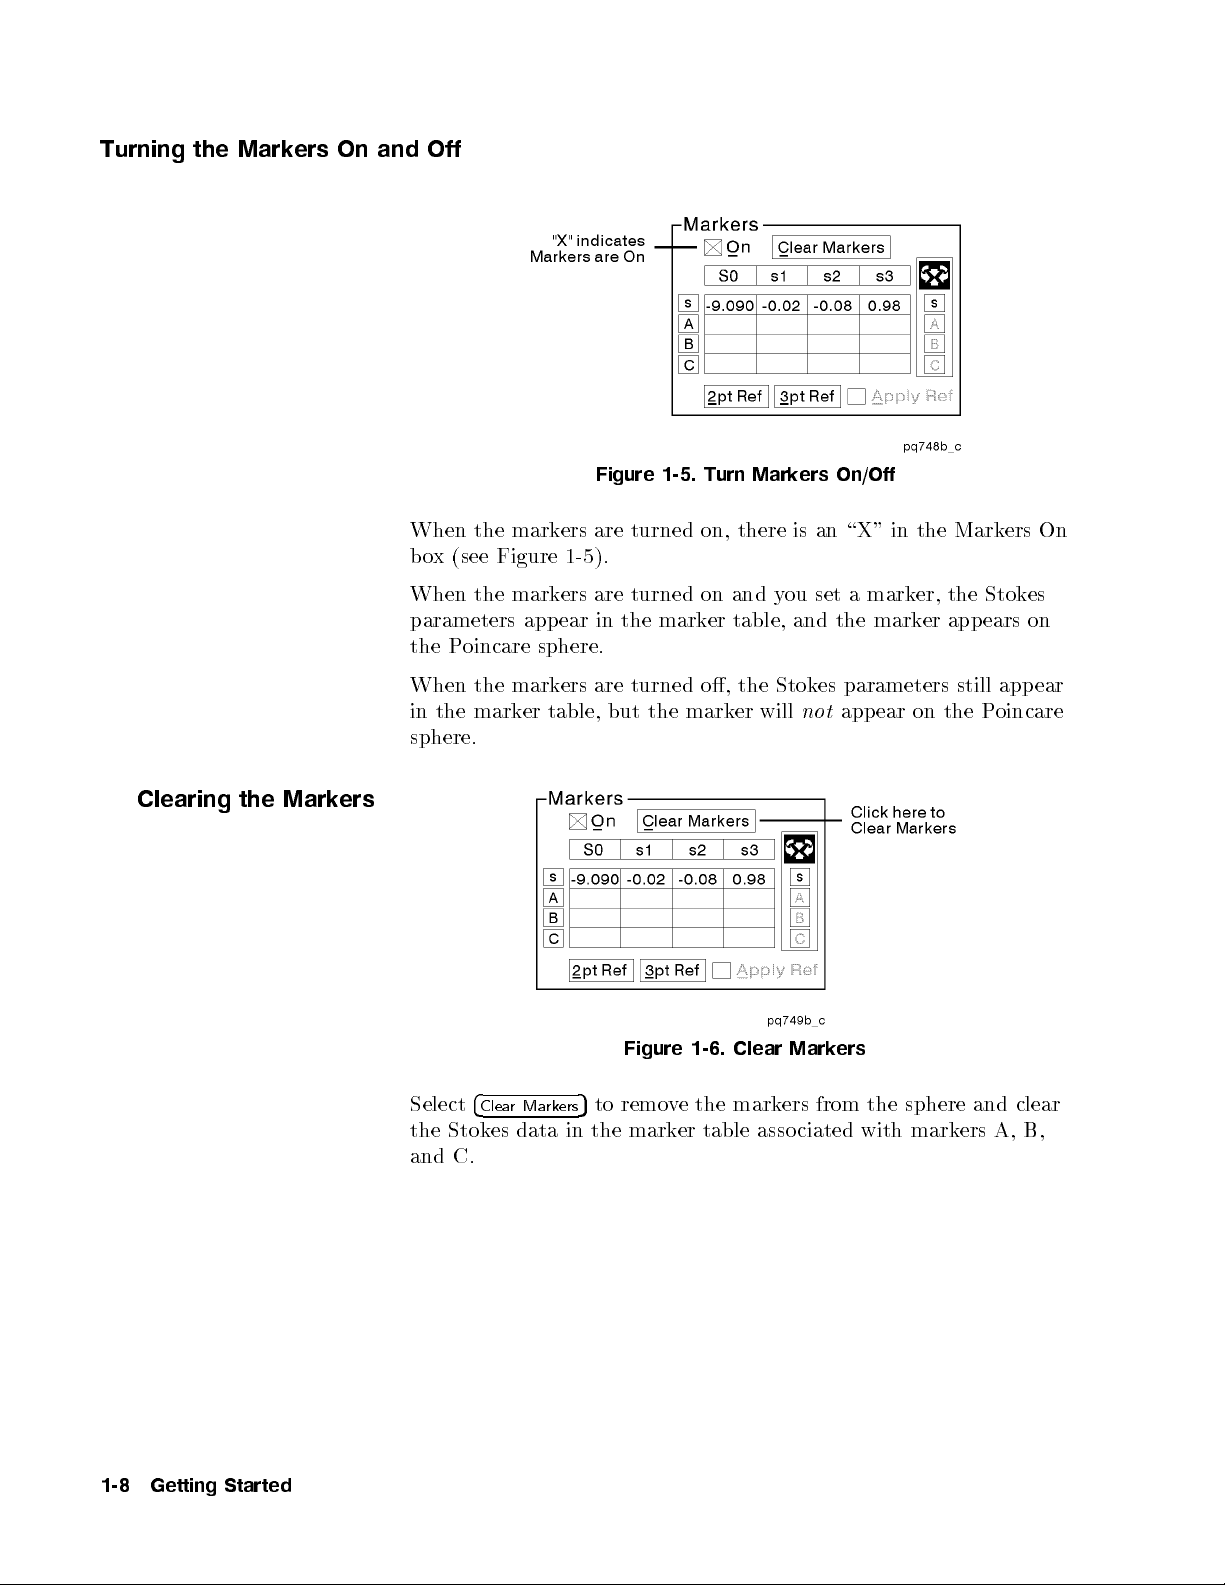
Turning the Markers On and Off
When the markers are turned on, there is an \X" in the Markers On
box (see Figure 1-5).
When
parameters
the
When
the
in
sphere.
the
oincare
P
the
mark
mark
app
sphere.
mark
er
Figure 1-5. Turn Markers On/Off
y
and
mark
the
on
er
o,
mark
table,
the
er will
Stok
ers
ear
ers
table,
are
in
are
turned
the
turned
but
ou
and
set
not
mark
a
mark
the
parameters
es
ear
app
er,
on
er
the
app
still
the
Stok
ears
app
oincare
P
es
on
ear
Clearing
the
Mark
ers
Select
Stok
the
and C.
4
Clea
es
Ma
r
data
ers
rk
in
Figure 1-6. Clear Markers
mark
the
e
v
remo
5
to
table
the mark
er
asso
ers
ciated
from
the
with
sphere
mark
ers
and
A,
clear
B,
1-8
Getting
Started
Page 29

Centering the Sphere on a Marker or Current Point
Figure 1-7. Center Sphere on Marker
The buttons along the right side of the marker b ox correspond to the
current data point and the three markers. These buttons can be used
to rotate the sphere so that the selected p ointormarker is front and
ter.
cen
Tw
or Three-P
o-
oint P
olarization
or
F
reference
man
Reference
information
frame,
ual.
setting a
on
refer
to
the
or
o-
tw
\Making
three-p
oin
Measuremen
olarization
p
t
ts"
hapter
c
of
this
Getting
Started
1-9
Page 30

Zoom and Rotate
Zoom
Figure 1-8. Marker Zoom and Rotate
To Zoom In
To zoom in on data on the Poincare sphere, select either
4
Out
6
decrease
to
ys:
a
w
o
immediately
to
use
to
ts
5
Use
advance
to
Zoom
o
T
zo
o
T
om
zo
factor
The
ou
Y
Select
the
4
5
In
7
om
factor
more
Zoom
can
zo
advance
to
the
Out
out,
in
rapidly
actor
F
the
use
this
factor bac
om
om
zo
select
incremen
.
Function
om
zo
function
the zo
factor
either
ts of
factor
in
kto
om factor
more
4
5
Out
6
one.
function
omed
zo
a
1 without
in incremen
rapidly
4
or
5
66
Use
in
condition
having
4
.
66
.
Use
5
w
t
one.
of
decrease
to
the
the
4
In
7
Use
zo
\Out"
5or4775
om
bring
buttons.
Select this function when the factor is 1 to set the zoom factor to
the most recently visited zoom factor.
4
77
the
.
5
1-10
Getting
Started
Page 31

Rotate
To Rotate the Sphere
To rotate the sphere, select any of the four arrows in the Rotate
area (see Figure 1-8). The sphere will rotate in the direction of the
selected arrow.
The
4
5
Button
Home
4
Clea
CAUTION
To bring the sphere back to the default orientation, select
Any time you rotate the sphere, the trace is cleared. The only
4
Home
5
.
exception to this is when you are viewing a recalled data trace or
a timed measurement. (See the \Printing, Saving and Recalling
Measurement Results and Instrument Congurations" chapter in this
manual.) In these cases, the recalled trace will not be cleared as the
sphere is rotated.
Hold
and
5
race
T
r
Figure
1-9.
Clear
Trace and
Hold
4
ClearTrace
Hold
Select
5
4
ClearTrace
5
to clear the Poincare sphere of previously displayed
data points. The HP 8509 will immediately resume data display
unless the Hold function has been activated.
When
sphere
Hold
displa
,
y
the p
activated,
is
ellipse, or the Stok
Hold function is activ
is toggled on and o b
the instrumen
ton
computational activit
the
the p
,
y
displa
DOP
the
,
y
displa
er
w
o
es parameters (in the Marker windo
ated, there is an \X" in the Hold bo
y selecting Hold (see Figure 1-9). Putting
HOLD
dramatically sp eeds up graphics and
y in the computer. Put the HP 8509 in
date
up
not
es
do
8509
HP
when running other software programs.
Getting
oincare
P
the
olarization
w). When the
x. Hold
HOLD
Started
1-11
Page 32

45
and Cal
Figure 1-10.and Cal
Source
W
a
elength
v
45
Cal
Select
45
to show the Optical Source window. Refer to \The System
Menu" chapter of this do cument for more information on the Optical
Source window.
user-p
a
calibration
k)
hapter
ecic
4
function.
5
erformed
lettering.
ears
app
do
this
of
calibration.
b
has
a
If
gra
in
cumen
een
y
for
t
source
The
function indicates
Cal
The
calibration
applied,
the
calibration
lettering.
instructions
elength is
v
a
w
b
has
ord
w
not
has
Refer to
p
on
applied.
een
\Cal"
een
b
\The
erforming
display
whether or
If
ears
app
applied,
System
a
w
a
ed next
v
a
w
a
b
in
the
Men
elength
v
to the
not
elength
(blac
old
ord \Cal"
w
c
u"
sp
1-12
Getting
Started
Page 33

Making Measurements
This chapter contains information on the following measurements.
1. Jones Matrix Eigenanalysis Method, PMD Measurement
2. Wavelength-Scanning Method, PMD Measurement
3. Jones Matrix Metho d, PDL Measurement
4. Power Max-Min Metho d, PDL Measurement
5. Jones Matrix Measurement
6. Polarization Maintaining Fib er Launch
2
Conv
entions
olarization
P
7.
State
8.
measuremen
The
Description
erforming
P
Setting
olarization
P
of
up
Reference
in
ts
the
of
basic
a
System
the
F
Measurements
hapter
c
this
measuremen
measuremen
t
t
tend
and
an
Measuremen
rame
Source Preparation
Making
the Measuremen
t
Manipulating the Measurement Results
Specialized Measurements
Measurement Specic Concept Information
follo
to
example
t
outline;
this
w
y
displa
data
4
5
Button
NNNNNNNNNNNNNNNNNNNNNNNNN
N
Menu Item
This represen
ts a button that
computer screen to perform an action.
NNN
This indicates a men
u item that can be selected on
the computer screen.
can b e selected on the
Making
Measurements
2-1
Page 34

PMD Measurement: Jones Matrix Eigenanalysis Method
PMD Measurement: Jones Matrix Eigenanalysis Method
Polarization mo de dispersion (PMD) is a fundamental physical
property of optical ber and components in whichalightwave is split
into twowaves of slightly dierent speed on the basis of polarization
state. At a given wavelength, these two polarization modes
experience a dierence in propagation time known as \dierential
group delay" (DGD). The DGD of long optical bers varies with
wavelength. The \PMD" of a test device also refers to the average
value of the dierential group delay. PMD is fundamentally
expressed in units of time, typically picoseconds (1 ps = 10
the case of long bers, it may be normalized to the square ro ot of
ber length with the units of picoseconds per ro ot kilometer.
This section explains how to measure the PMD of a test device using
the Jones matrix eigenanalysis (JME) method, available in the HP
8509B. A typical measurement result, showing the dierential group
delay as a function of wavelength, is shown in the following gure.
0
12
s). In
2-2
Making
Measurements
data
Figure
2-1.
Example
of
Typical applications of the JME
PMD:JME
for a
y
displa
method include measuremen
measurement
tof
EDFA's, couplers, isolators, bers, and optical connectors. Cables
number of ampliers and b er spans
and systems consisting of an
can also b e tested. Consider the follo
method when deciding whic
y
wing aspects of the JME
PMD measurement method to use:
h
Dierential group delay (DGD) is measured as a function of
elength.
v
a
w
Measuremen
v
a
w
w
narro
lo
of
t
elength
PMD
w
range.
comp
onen
ts
can
accomplished
e
b
with a
Page 35

PMD Measurement: Jones Matrix Eigenanalysis Method
The measurement is independent of pigtail position and
polarization launch condition.
Optical ber DGD data can be shown in a histogram and
compared with the expected distribution to assess the statistical
condence of the measurement.
Basic Measurement
System
the
Setting
up
The following measurement procedure illustrates the simplest
and most straightforward path in using the HP 8509B Lightwave
Polarization Analyzer to make a PMD:JME measurement. Other
specialized measurement applications and techniques are included
later on in this section.
Connect
y
illustration.
er
b
8509B
t
en
vemen
source
an
t
.
external
CCURA
A
The
HP
prev
Mo
accuracy
measuremen
our
Install
CY
cable
the
olarization.
p
ENHANCEMENT
leading
EXTERNAL
t after
vemen
mo
y
source
this
of
t
thru
from
SOUR
cable
system
cable
external
the
CE
source
ma
outlined
as
the
for
NOTE
INPUT
olarization
p
jeopardize
y
in
one-time
source
ust
m
has
PMD
the follo
adjustmen
the
to
e
b
wing
t
wn to
do
ed
tap
adjusted.
een
b
measuremen
of
t
Figure
Measurement
2-2.
Setup
Making
Measurements
2-3
Page 36

PMD Measurement: Jones Matrix Eigenanalysis Method
External Source Preparation
Before performing the PMD:JME measurement, external source
polarization must be adjusted via the two knobs on the front panel of
the HP 8509B. The following pro cedure will guide you through the
process.
ADDITIONAL INFORMATION
The 8509B uses an internal three-state, switchable polarizer to
condition the light before it is applied to the device under test.
Adjustment of external source polarization via the front panel knobs
is done to provide a roughly circular state of polarization within the
polarizer assembly, so that all three polarizers will pass high levels of
adjustmen
This
er.
w
o
optical
the
source
that the
eginning
b
p
t
fron
and
adjustment
panel
the
of
a
knobs
HP
long
8509B
b
series
the
or
erformed
p
e
of
hav
t
er
b
emo
tests.
ypically
t
connecting
ved.
once
need
How
w
a
ev
eek
not
the
er,
b
tunable
it
once
or
eated
rep
e
optical
recommended
is
the
at
unless
2-4
Making
Measurements
T
then
select
N
N
NN
N
N
N
Optical
the optical
up
set
o
by selecting the
window.
N
N
N
NN
N
N
N
N
N
Figure 2-3. System Menu
N
N
N
N
N
source,
NN
N
N
N
N
N
N
N
N
N
N
N
Source
button
select
N
N
NN
N
N
N
N
N
N
N
N
N
N
.Y
ou
System
ma
in the upper righ
N
NN
N
N
N
N
N
N
N
N
N
N
NN
from
set
also
y
up
the
main
the
optical
t hand corner of the main
menu,
source
and
Page 37

PMD Measurement: Jones Matrix Eigenanalysis Method
Figure 2-4. Optical Source Setup
Select the external, tunable laser source and set the wavelength to
the approximate center of the widest range you expect to use in
your JME PMD measurements. Use the default power level or set as
desired. If the screen on your computer looks similar to the previous
illustration, select
4
Done
5
.
Select
NNNNNNNNNNNNNNNNNNNN
System
olarizer
Figure
from the main menu, and then select
2-5. P
Selection
Making
Measurements
NNNNNNNNNNNNNNNNNNNNNNNNNNNNNNNN
Polarizers
2-5
Page 38

PMD Measurement: Jones Matrix Eigenanalysis Method
Figure 2-6. Polarizer Setup
Set the p olarizers to
4
Internal
5
and select
4
No Polarizer
5
. If the screen on
your computer looks like the previous illustration, select
Figure 2-7.
Select
N
3pt Ref
from the Markers Area on the Main Screen, wait 5
N
N
N
N
N
N
N
N
N
N
N
N
N
N
N
N
N
N
NN
NN
seconds, and then select
Reference
3pt
NNNNNNNNNNNNNNNNNNNNNNNNNNNNN
Apply 3pt
.
Applied
4
Done
5
.
2-6
Making
Measurements
ADDITIONAL INFORMATION
mea-
ws
ph
allo
ysical
frame
Creating
suremen
t
and
of p
applying
olarization
a
3pt
state
reference
within
frame
a
In this case, the reference frame is lo cated inside the in
polarizer assem
bly.
reference.
of
ternal
Page 39

PMD Measurement: Jones Matrix Eigenanalysis Method
olarization
oin
p
NN
NN
NN
N
N
Mark
P
on the
t
alue
see
to
N
N
N
N
N
N
N
N
N
NN
Current
knobs
of
b
NN
N
N
N
N
N
N
N
N
on
Poincare
s3
the
marking
y
N
N
N
N
N
N
N
NN
NN
NN
Point
fron
the
mark
the
N
NN
N
N
N
N
N
N
N
N
N
N
).
NNNNNNNNNNNNNNNNNNNNNNNNNNNNN
Apply 3pt
panel
t
sphere
is
er
curren
Also
greater
Circular
Source
the
oin
p
e
N
N
N
N
N
and
2-8.
olarization
P
e
activ
absolute v
easier
is
t
N
then
the
the
HP
hes
Adjust
of
approac
than 0.90.
(select
t
oin
p
External
8509B
The activ
un
ole,
p
a
N
NN
NN
NN
NN
N
N
N
Display
Figure
til
and the
N
N
N
N
N
N
notice that the polarization ellipse will become more circular as s3
approaches 0.90. Un-apply the 3pt reference (reselect
before going on to do the JME PMD measurements. Do not move
the cable or the external source polarization knobs.
F
OR
MORE INF
ORMA
More information on State of P
gree of P
olarization (DOP) ma
TION
olarization (SOP) and De-
ybefound
in the glossary and in this
chapter.
t
)
Making
Measurements
2-7
Page 40

PMD Measurement: Jones Matrix Eigenanalysis Method
Making the Measurement
At this pointyour measurement system is ready to makeyour
rst measurement. For our purposes we are going to measure a 10
kilometer sp ool of optical ber. Remove the b er cable connecting
the optical output to the optical input on the HP 8509B. Connect
your test device between the optical output and the optical input.
ACCURACY ENHANCEMENT NOTE
The ber path leading from the optical output of the
HP 8509to the DUT and from the DUT to the optical input of
the HP 8509 must not move during the measurement process.
Unsupported ber, particularly unjacketed ber, should be tap ed
down or placed against stationary ob jects. Movement of the ber
may jeopardize PMD measurement accuracy.
CAUTION
Observe proper connection techniques. Refer to the \Lightwave
Connector
Care" c
Figure
hapter in
2-9.
this
Measurement
JME
Selection
ual.
man
NNNNNNNNNNNNNNNNNNNNNNNNNNNNNNNNNNN
Select
NNNNNNNNNNNNNNNNNNNNNNNNNNNNNNNNNNNNNNNNNNNNNNNNNNNNNNNNNNNNNNNNNNNNNNNNNNNNNNNNNNNNNNNNNNNNNNNNNNNNNNNNNNNNN
Measurement
from the main menu, and then select
PMD:Jones Matrix Eigenanalysis... F2
2-8
Making
Measurements
Page 41

PMD Measurement: Jones Matrix Eigenanalysis Method
Figure 2-10. JME Source Setup
Verify that the source and start and stop wavelengths are correct for
your measurement, and that the optical power is turned on. If the
screen on your computer looks like the previous illustration, select
NNNNNNNNNNNNNNNNNNNNNNNNNNNNNNNNNNNNNNNNNNNNNNNNNNNNNNNNNNNNNNNNNNNNNNNNNN
Find Minimum # of Points
.
ADDITIONAL
matrix
Jones
The
(DGD)
y
dela
alues
v
DGD
the
than
less
wish the
ou
y
If
the
to
in
ter
en
v
a
w,
windo
displa
lasers
ORMA
INF
from
obtained
b
um
n
source
w
o
p
no
alue
v
a
of
y
TION
eigenanalysis
optical
of
pairs
completed
a
in
measuremen
of
er
remain
to
displa
el
lev
er
greater
ailable
than
laser p
method
measuremen
measuremen
wa
t
eled
lev
the
of
y
minim
the
er.
ow
computes dieren
the
so
ts,
actually
is
t
ts.
oin
elength
v
during
optical
um
p
measuremen
the
source
er sho
w
o
p
setup
tial
um
n
wn in
group
er
b
one
t,
the
of
Making
Measurements
2-9
Page 42

PMD Measurement: Jones Matrix Eigenanalysis Method
Figure 2-11. Segment Selection
The window is called Find Minimum # of Points. Sample
measurements will be performed to identify the maximum DGD of
the DUT. The number of points will be set to accommodate this
alue.
v
range.
.
4OK5
Sample
or
F
measuremen
measuremen
this
ts
spaced
enly
ev
are
default
the
use
t,
across
setting b
the
y selecting
elength
v
a
w
ORMA
y
INF
e
b
(Cho
on
found
osing
OR
F
More
oin
p
this
MORE
information
ma
ts
hapter
c
Statistics/Enlarging
Figure 2-12. Find Minimum # of
TION
selecting
the
in
Delta
Sample
the
appropriate
the
\Concepts"
elength
v
Wa
Size).
section
and
um
n
later
Fib
Points
er
er
b
on in
PMD
of
When the automatic routine is nished, you will be advised what
minimum number of measurementpoints is required for your
automatically
is
ts
oin
p
of
er
b
um
n
um
minim
elength
v
a
w
tered
en
closed.
range.
the
in
Select
The
optical
4
to
5
OK
source
tin
con
setup
with the
ue
windo
measuremen
w
when
this
t.
message b
is
x
o
2-10
Making
Measurements
Page 43

PMD Measurement: Jones Matrix Eigenanalysis Method
ACCURACY ENHANCEMENT NOTE
When measuring components, polarization maintaining
ber, or short lengths of single mode b er, use the indicated
minimum number of points. When measuring long ber, or any
device that is expected to exhibit wavelength dependentPMD,
increase the number of points to measure the wavelength dependent
behavior of the device.
PMD:
2-13.
Jones
Matrix Eigenanalysis
Select
Optical
4
5
Done
Source
this
on
Setup
windo
Figure
for
w.
Figure 2-14. PMD: JME Measurement Start
Select
4
Sta
Measurement
rt
5
The JME graph is deriv
performed across the selected w
progresses, the
Measurement Summary
the
from
ed from a series of optical measuremen
velength range. As the measuremen
a
8509B
HP
graph lists the PMD results obtained, up
Graphs
display bar directly belo
to the curren
screen.
The axes of the PMD graph are annotated as dieren
in picoseconds and wavelength in nanometers.
ts
wthe
avelength.
tw
tial group dela
t
y
Making
Measurements
2-11
Page 44

PMD Measurement: Jones Matrix Eigenanalysis Method
Y
lo
our
ok
similar
measuremen
the
to
Figure
complete.
is
t
previous
Measurement
2-15.
illustration.
The
screen
Results
our
y
on
computer
should
2-12
Making
Measurements
Page 45

PMD Measurement: Jones Matrix Eigenanalysis Method
Manipulating the Measurement Results
When your measurement is complete, you may;
The Measurement
Summary
Review the results in the
Review the measurement setup conditions in the
Annotation
area.
Measurement Summary
bar.
Measurement
Examine the dierential group delay at a particular wavelength, by
using the cursor bar.
Display, edit, and print the data in tabular form.
Print the graph with or without measurement annotation and data
listing.
Saveyour measurement and annotation information to a database
for future use, or to reload the measurementbackinto the
HP 8509A/B.
Sa
measuremen
our
y
e
v
t
with
use
for
le
text
a
as
data
spreadsheets.
Graphs
the
windo
ving
w,
using
windo
ws
erform
P
windo
Display
or
tile
other
w.
all
cascade
of
PMD
our
y
mo
des.
measurements
measuremen
without lea
one
in
ts
Bar
Figure
The
Measurement Summary Bar
up to the curren
All of the
displays ha
2-16.
avelength.
tw
ve the same units, whic
displays the PMD
Measurement
The
but default to picoseconds. The bar displa
Summary
results obtained
h are user selectable
ys the a
verage, curren
t,
maximum, minimum, and standard deviation () of the dierential
group delay, up to the currentwavelength.
Making
Measurements
2-13
Page 46

PMD Measurement: Jones Matrix Eigenanalysis Method
The Measurement Annotation Area
Figure 2-17. The Measurement Annotation Area
When the measurement ends, the control panel at the b ottom of the
Graphs window is replaced by
lists the date and time of the start of the measurement, the ber
length in kilometers, the tunable laser power and attenuator settings,
a
w
stop
and
start
the
b
um
n
the
lists
also
It
optical measuremen
h
whic
at
b
can
annotation
main
the
area
windo
w
men
elengths
v
of p
er
toggled
e
u, and
Measurement Annotation
elength
v
a
w
the
and
um
N
N
tak
N
N
N
N
the n
measuremen
The
en.
selecting
y
b
o
N
N
N
N
N
N
N
N
N
N
N
N
N
N
N
N
N
N
NN
NN
.
oints,
ts w
then
that is,
ere
and
on
N
N
N
N
Annotation
in
er
b
. This area
or delta.
terval
v
a
w
of
NN
NN
N
N
N
N
N
N
N
N
N
N
Display
elengths
t
N
N
N
N
N
N
N
N
N
from
ADDITIONAL
matrix
Jones
The
n
um
dela
er
b
one
tial group
the
so
actually
is
ORMA
INF
eigenanalysis
(DGD)
y
DGD
of
than
less
from
alues
v
the
TION
adjacen
obtained
umb
n
metho
er of
d computes
of
pairs
t
completed
a
in
measurement
dieren-
optical
measuremen
measuremen
elengths.
v
wa
ts,
t
2-14
Making
Measurements
Page 47

Using The Cursor
PMD Measurement: Jones Matrix Eigenanalysis Method
Figure 2-18. The Cursor Bar
Changing
The Measurement
Maximize the PMD:JME window within the HP 8509B graphs
window. Activate the
NNNNNNNNNNNNNNNNNNNNNNN
Cursor
between the
Annotation
from the Graphs window menu. The cursor bar appears
Measurement Summary Bar
area. The cursor display shows the DGD value for a
Cursor Bar
by selecting
NNNNNNNNNNNNNNNNNNNNNNN
Display
and the
and then
Measurement
selected wavelength. The wavelength is selected by the slider control,
then
and
Alt
displa
the
.
y
arro
the
w
arro
keys
w
(The
keys),
keyb
or b
oard is
y editing
activ
the w
ated
v
a
pressing
y
b
elength
Format
Figure 2-19. Changing the Measurement Format
Select
Format
from the Main Graphs windowmenu to access the
measurement formatting functions. The measurement graph may
NNNNNNNNNNNNNNNNNNNN
can
length. Cho
er
ter the length of the
NN
N
N
N
from the
picoseconds
or
formatted
e
b
expressed
N
N
N
N
N
N
N
N
N
N
N
N
NN
N
N
N
N
N
in
kilometer
per
N
N
N
N
N
N
NN
N
N
N
N
N
N
N
N
N
N
N
NN
N
Fiber Length...
ve just measured.
ber y
ou ha
either
N
ADDITIONAL INFORMA
ro
er
p
N
N
N
N
N
N
Format
TION
or
ot
N
N
N
N
N
N
N
NN
N
N
toseconds. It
fem
kilometer
N
N
N
menutoen
of
b
b
also
If the ber is long enough to exhibit strong p olarization
mode coupling, you may wish to express the result in units of time
length
ot
ro
per
listed,
are
measuremen
and all
summary
t
using
alues
v
NNNNNNNNNNNNNNNNNNNN
Format
are
bar.
NNNNNNNNNNNNNNNNNNNNNNNNNNNNNNNNNNNNNNNNN
Delay/sqrt(L)
the
up
dated,
on
Making
new
The
.
Y-axis
and
Measurements
units
in
the
e
ose
2-15
Page 48

PMD Measurement: Jones Matrix Eigenanalysis Method
Changing The Graph's Y-Scale
Figure 2-20. Changing the Graph's Y-Scale
Tochange the vertical axis on the measurement graph, select
NNNNNNNNNNNNNNNNNNNNNNN
Display
The submenuprovides three selections. The default selection,
NNNNNNNNNNNNNNNNNNNNNNNNNNNNNNNNNNNNNNNNNNNNNNNNNNNNNNNNNNNNNN
and then
Autoscale/Zero
uses zero
but
oth
optimizes
the
selection
zero
b
measurement
allows
minim
the
as
NNNNNNNNNNNNNNNNNNNNNNN
Y-Scale
Based
the
minimum
minim
as the
curv
specication
v
um
to
e
alue.
,
um and
from the Graphs main window menu.
autoscales
value.
maximum
graph
the
ll
the
of
the
The
area.
maxim
maxim
um
NN
N
N
N
N
N
N
N
N
N
N
N
N
N
N
Autoscale
Y-axis
The
Y-axis
um
NN
NN
Y-axis
N
N
N
N
NN
v
N
N
N
N
Fixed
N
N
N
selection
alues
N
NN
NN
N
N
N
N
N
N
N
N
alue
v
v
to
N
N
N
Scale ...
alue
expand
N
N
N
N
N
N
N
N
N
and
N
N
N
uses
N
N
N
N
N
N
NN
NN
N
N
N
N
N
Displa
ying
and
Printing
abular
T
Data
in
Display the tabular measuremen
then
bo
text bo
NNNNNNNNNNNNNNNNNNNNNNNNN
NNNNNN
Tabular Data
x lls the Graphs windo
x lists information from the measuremen
Format
Figure
ying
Displa
2-21.
NNNNNNN
tdatab
from the Graphs main
verlaying
w, o
abular Format
T
in
Data
NN
N
N
N
N
N
N
N
N
N
N
y selecting
N
Display
window men
the measurement graph. The
t annotation area,
the values in the measurement summary,andalistofwavelengths
at which optical measurements were performed along with the
DGD values derived from each pair. The
en.
op
is
x
o
text b
the
disabled
when
4
Start Measurement
N
N
N
N
N
N
N
N
N
N
and
u. A text
5
button is
2-16
Making
Measurements
Page 49

PMD Measurement: Jones Matrix Eigenanalysis Method
ADDITIONAL INFORMATION
You can add your own notes to the text. All of the stan-
dard keyboard and mouse editing features are available. Use the
mouse to place a text insertion pointanywhere in the document,
and then type the desired text. Text may be selected using the
drag features of the mouse. Selected text may be deleted or copied
to the clipb oard for use in a report or a spreadsheet by pushing the
4
Copy to clipboard
5
button.
The tabular data text box is limited to 60,000 characters.
All or a p ortion of the text box information may be printed. Printing
uses the default printer selected in the windows control panel. To
print all of the text box information just press the
4
Print tabulardata
5
button at the top of the text box. Toprint a portion of the text b ox
information, hi-light the desired text with the mouse before pressing
the
4
Print tabulardata
4
the
Return
N
N
N
N
NN
NN
NN
NN
N
N
N
N
N
N
N
N
N
Display
N
N
to
men
graph
u.
5
button. To return to the graphic display, press
re-select
button
5
or
NNNNNNNNNNNNNNNNNNNNNNNNNNNNNNNNNNNNNN
Tabular
Data
under
the
Displa
ying
Data
in
a
Statistical
Data
format
for
After making y
in the PMD:JME measuremen
results in a statistical format b
NNNNNNNNNNNNNN
PMD Statistics
Format
from
using
discussion
a
NNNNNNNNNNNNNNNNNNNNNNNNN
PMD
its
2-22.
measuremen
Statistics
application
ying Data
Displa
PMD:JME
the
of
Figure
our PMD:JME measuremen
twindo
NNNNN
y rst selecting
. A PMD Statistics windo
can
ts
feature.
er
(Fib
in
w, y
ed
y
displa
e
b
Concepts
the
See
Statistics).
PMD
Statistical
a
t, and while still
y displa
ou ma
NNNNNNNNNNNNNNNNNNNNNNN
Display
w will open.
statistical
in
Format
y the
and then
section
Making
Measurements
2-17
Page 50

PMD Measurement: Jones Matrix Eigenanalysis Method
Figure
previous
The
Maxw
N
N
N
N
or
PMD
N
N
N
N
N
N
from
N
N
N
N
N
N
N
Add
A
multiple
N
NN
N
N
N
N
N
N
N
N
N
Selected
N
N
N
N
N
N
N
N
N
NN
N
from
Statistics
N
N
N
N
N
N
N
N
window.
Single
the
in
N
N
N
N
NN
N
N
Add
and
ADDITIONAL
Displa
2-23.
illustration
curv
ell
PMD:JME
windo
N
N
N
N
NN
N
N
N
N
N
N
N
N
N
N
N
N
N
N
N
N
N
N
N
N
N
N
N
N
NN
N
N
N
N
N
Text
INF
JME
N
N
N
N
N
N
N
N
N
N
N
File...F4
ORMA
e
N
N
N
N
N
N
N
N
N
N
ying
an
is
is
w.
N
N
N
N
N
N
N
N
N
N
Window
N
N
NN
N
N
N
N
N
N
TION
a Statistical
in
Data
example of
automatically
measuremen
com
y
an
Use
N
N
N
N
N
NN
N
N
N
N
N
N
N
N
N
N
N
N
N
N
to
N
N
N
N
N
N
N
N
N
N
N
N
N
N
N
,
F2
ort
imp
the PMD
tted
can
ts
bination
N
N
N
N
N
N
N
N
N
NN
N
N
from
Add
data.
Format
statistics
the
to
displa
e
b
of
N
N
N
N
N
NN
N
N
N
N
N
N
N
N
N
N
N
N
N
N
Database...F3
histogram.
ed
y
NN
N
N
N
N
N
N
N
N
N
N
N
N
N
N
N
N
N
N
N
N
N
N
N
N
N
N
N
N
N
The PMD Statistics function can be selected in twoways;
from the PMD:JME measurement window, or by double clicking
on the PMD Statistics icon in the HP 8509 Program Group in the
Program Manager. The PMD Statistics function is actually provided
by a separate software application.
N
N
N
,
2-18
Making
Measurements
Page 51

PMD Measurement: Jones Matrix Eigenanalysis Method
Figure
menu
File
The
N
N
N
N
N
N
N
N
N
N
NN
a
ts
N
N
N
N
N
N
N
N
N
N
from
windo
v
a
W
are used
N
N
N
N
N
N
N
N
N
N
from
N
N
N
N
N
N
N
NN
N
in
NN
men
of
NN
N
N
N
N
N
elength
NN
N
N
N
N
titled
N
NN
N
N
N
a
from
File
structure.
u
File
the
N
N
N
N
N
N
N
N
N
N
N
N
N
N
N
N
N
Selected
will
w
graph.
to
to
and
w.
windo
N
N
N
N
N
N
N
N
N
N
N
N
NN
NN
NN
Database...F3
\Load:
stored
N
N
N
N
N
N
NN
N
N
N
N
N
N
N
N
N
N
ys and opens a windo
w.
NNNNNNNNNNNNNNNNNNNNNNNNN
le
text
a
with
b
ts
poin
Selecting
wn
do
elemen
N
N
N
N
N
N
N
N
N
Add
JME
the
graph
Histogram
Statistics
N
N
N
NN
NN
NN
Add
PMD Statistics Database Interface window to open. You can then
load the measurement results from a previously stored measurement
into the PMD Statistics window.
NNNNNNNNNNNNNNNNNNNNNNNNNNNNNNNNNNNNNNNNNNNNNNNNNNNNNNNNNNNNNNNNNNNNNNN
Add from Text File...F4.Selecting this menu item will cause a
window
previously
N
N
N
N
N
N
N
N
N
Load Statistics...F5
Statistics displa
can then load previously stored PMD statistics data
Statistics windo
NNNNNNNNNNNNNNNNNNNNNNNNN
NN
Save Statistics...F6.Selecting this menu item opens a window
titled \Save: Text File". You can then save the current statistical
data
analysis
or
including
2-24.
main
the
The
u.
men
N
N
N
N
N
N
N
N
N
N
N
N
N
N
N
NN
N
N
N
N
N
N
JME
wn
sho
e
b
The individual
the
build
the
e
deriv
N
N
N
N
N
N
N
N
N
N
NN
NN
NN
NN
N
N
N
N
N
ext
T
to
le
text
NN
N
N
N
N
N
N
N
N
N
N
N
NN
N
N
N
N
for
spreadsheet.
ey
NNNNNNNNNN
future
ond
.
the
Statistics
PMD
wing
follo
N
N
N
N
N
N
N
N
N
N
N
N
N
N
N
N
N
N
N
NN
N
N
N
N
N
N
N
N
Window
in
Cum
N
N
.
File"
Selecting this men
retriev
displa
F2
Dieren
the
ulativ
statistics
other
Selecting
op
to
ort in
imp
al
measuremen
All
ed
y
w titled \Load: T
to
Statistics
PMD
File Menu
windo
brief
a
is
data
The
.
Group
tial
measuremen
Dieren
e
listed
u
men
this
can
ou
Y
en.
PMD
the
to
u item clears the PMD
PMD
the
elength
v
a
w
will
w,
description
the
from
Delay
oin
p
t
Group
tial
the
in
will
item
then imp
Statistics
ext File". Y
into the PMD
Statistics
ts
oin
tp
range.
drop
of
current
v
of
ts
Dela
PMD
cause the
ose
windo
windo
sa
are
the
ersus
this
y
a
ed,
v
w
w.
ou
Making
Measurements
2-19
Page 52

PMD Measurement: Jones Matrix Eigenanalysis Method
NNNNNNNNNNNNNNNNNNNNNNNNNNNNNNNNNNNNN
N
Print Bitmap.Selecting this menu, will giveyou three choices. To
print the DGD versus Wavelength graph, the Histogram or the entire
window.
NNNNNNNNNNNNNNNNNNNNNNNNNNNNNNNN
Print Data.Selecting this menuwillprint the data. Printing uses
the default printer selected in the windows control panel.
NNNNNNNNNNNNNN
Exit.Selecting this menu will quit the PMD Statistics window
The Edit menu
recently
the
a
W
N
NN
NN
N
N
N
N
N
N
N
N
N
All
and
N
N
N
N
N
N
N
N
N
N
N
N
N
N
Bitmap
elength,
NNNNNNNNNNNNNN
Edit
from the main PMD Statistics window, will drop
added
statistical
elength
v
N
N
N
N
N
N
N
N
N
N
N
N
N
N
N
N
N
N
N
N
Data
N
N
N
N
N
cop
N
N
the
the
N
N
N
N
N
N
N
N
N
to
ying
Histogram
purges
NN
N
N
measuremen
data
data
N
Selecting
.
statistical
N
N
N
NN
N
N
N
N
N
N
N
Clipboard
to
Selecting
down a menu structure. The following is a brief description of the
elements of that Edit menu.
NNNNNNNNNNNNNNNNNNNNNNNNNNNNNNNNNNNNNNNNNNNNNNNNNNNNNNNNNNNNNNNNNNNNNNNNNNNNN
Undo Last Add Alt+Bksp
most
from
ersus
v
set.
N
N
N
N
N
N
N
N
N
Clear
data
N
N
N
N
N
N
N
NN
Copy
selections,
v
a
W
. Selecting this menu item removes the
t
This
set.
efore committing
b
this men
data
N
N
N
N
N
N
N
N
N
N
N
N
N
N
N
N
N
N
N
the
clipb
or
This
.
oard
the en
from
allo
set.
men
our
y
tire
the
y
ws
u item
u
hoice
c
PMD
statistics
examine
to
ou
the statistical
it to
remo
pro
item
of
Statistics
es
v
vides
DGD
displa
the
displa
all
three
v
windo
ys
ersus
and
DGD
data
ed
y
w.
2-20
Making
Measurements
Format
The
Selecting
down a menu structure. The following is a brief description of the
elements of that Format menu.
NN
N
N
N
N
N
N
N
N
N
N
NN
N
N
Wavelength
elength range
v
a
w
data poin
NNNNNNNNNNNNNNNNNNNNNNNNN
NNNN
Autorange
highest w
NNNNNNNNNNNNNNNNNNNNNNNNN
Fixed Range...
set the minim
NNNNNNNNNNNNNNNNNNNNNNNNNNNNNNNNNNNNNNNNNNNNNNNNNN
Histogram X-Axis
range of
the
N
N
N
N
N
NN
N
N
N
N
N
N
N
N
Autoscale
include
to
N
N
N
N
N
N
N
N
N
NN
N
N
N
N
Fixed
Menu
NNNNNNNNNNNNNNNNNNNN
Format
N
N
NN
N
N
N
N
N
N
N
N
N
N
N
ts displa
avelengths of the added or loaded
NNNNNNNNNNNNNNNNNNN
N
N
N
N
N
N
N
N
N
N
N
N
N
N
all
NN
N
N
N
N
N
N
N
N
N
N
N
N
N
N
Scale...
from the main PMD Statistics window, will drop
N
N
N
N
N
N
N
N
N
NN
N
N
N
N
N
N
N
N
Range
adjusts the w
um and maximum
DGD
selected,
is
DGD
N
N
N
N
N
N
N
N
This
.
used
e
b
to
yed in this graph are included in the histogram.
avelength limits to include the lo
selection op ens a dialog bo
. This menuitemprovides twoways to select
to
alues
v
the
in
alues
v
N
N
N
N
N
selected,
is
men
in
e
b
X-axis
the
a
u
item
the
displayed w
displa
statistical
dialog
pro
DGD
ed
y
range
b
o
ys to
a
w
o
w
t
vides
elength graph.
v
a
W
vs
JME PMD data. The
ou
y
hy
adjusts
When
to
set
x with whic
avelengths.
histogram.
the
in
automatically
set.
data
enables
x
select
Only
west and
ou can
When
the
the
Page 53

PMD Measurement: Jones Matrix Eigenanalysis Method
maximum value of DGD to be displayed. The minimum value is
always zero.
The Help menu
The Help menuonlyprovides information ab out the software revision
of the PMD Statistics software, which is a separate application.
The Annotation Area
At the bottom of the PMD Statistics window are a group of numeric
displays, which are describ ed below.
Mean
. This display shows the mean, or average, value of the data
points which are displayed in the DGD vs Wavelength graph. The
is
mean
Minim
um,
maxim
DGD vs
the
selection
um
not
Maxim
v
of
aected
alues
v
a
W
X-axis
the
y
b
.
um
DGD
of
elength
selection
These
of the
graph.
of
scale
of
displa
data p
These
the
X-axis scale
the
w
sho
ys
ts
oin
alues
v
histogram.
the
whic
are
of the
minim
are
h
not
histogram.
and
um
displa
aected
in
ed
y
y
b
DGD
of
er
b
um
n
the
ws
sho
y
displa
This
t
The
and is
This
.
.
data
um
n
not
displa
displa
the
oin
p
er
b
aected
ys.
y
DGD
ts
ere
w
h
whic
indicates the
the
y
b
cum
the
ws
sho
v
a
W
ersus
v
added
size
hoice
c
ulativ
elength
of
of
with
the
X-axis
size
e
graph
last
the
original
limits
the
of
in
is
add
measuremen
either
of
statistical
the
added
le
Last
measuremen
eration.
op
data set,
graphical
the
size
otal
T
data set
when
Wavelength Range / Auto Range mo de.
Subset size
. This display replaces the Total size display when the
DGD versus Wavelength graph is placed in the Fixed Range mo de.
This parameter indicates the number of DGD measurementdata
whic
y
range is
range.
sho
h
the
ws
divided
umb
n
for
ts
oin
p
b
Num
categories
of
that
er
of
fall within
This is
.
bins
k
buc
or
ets
the
in
displa
an
to
ed
y
editable
h
whic
w
displa
the
elength
v
a
DGD
construction of the DGD Histogram.
of the single
Maxwell alpha parameter
parameter
which species the Maxwell curv
. This displa
ws the v
ysho
e that is automatically
alue
tted to the DGD histogram.
t
of
er
Making
Measurements
2-21
Page 54

PMD Measurement: Jones Matrix Eigenanalysis Method
Printing the PMD:JME Graph
Figure 2-25. Printing the PMD:JME Graph
Sa
ving
Measurement
our
y
Select
Selecting
Selecting
annotation
Area."
Selecting
annotation
the
ext
T
as
NNNNNNNNNNNNNN
File
and then
NNNNNNNNNNNNNNNNN
Graph
will print only the graph.
NNNNNNNNNNNNNNNNNNNNNNNNNNNNNNNNNNNNNNNNNNNNNNNNNNNNNNNN
Graph & Annotation
information
N
Graph,
Annotation, &
N
N
N
N
N
N
N
N
NN
NN
N
N
N
N
N
N
N
N
N
N
N
information and
corresp
onding
data
NNNNNNNNNNNNNNNNN
Print
N
N
N
N
N
N
N
N
N
N
from the Graphs main window.
will print the graph and the
Measuremen
\The
N
N
N
N
N
N
N
N
N
N
N
N
list the
ts.
in
N
N
N
N
N
N
N
N
N
NN
NN
N
N
N
N
N
Data
measuremen
N
N
will
prin
discussed
N
N
N
N
NN
NN
N
N
N
oin
p
t
the
t
a
w
Annotation
t
graph,
elengths
v
and
2-22
Making
Measurements
Figure
Select
N
File
and
then
N
Save
N
N
N
N
N
N
N
N
NN
N
N
N
window. A standard windo
ou can select a le name and a directory in whic
ty
poin
will b e stored. Columns of w
will b e sa
ved as text for later use in a spreadsheet. Data sa
2-26.
N
from the
Text
as
JME
w
screen will be displa
Save
Graphs
yed. A
N
N
N
N
N
N
N
NN
N
N
N
N
N
N
N
N
N
N
NN
N
N
N
N
N
N
N
N
N
N
N
NN
N
N
N
N
N
N
N
N
N
N
NN
N
N
h the data
elengths and measuremen
av
ext
as T
e
v
Sa
text cannot b e recalled for future displayby the analyzer.
main
tthis
t data poin
ved as
ts
Page 55

Saving in Database Format
PMD Measurement: Jones Matrix Eigenanalysis Method
Figure 2-27. Saving in Database Format
Select
NNNNNNNNNNNNNN
File
and then
NNNNNNNNNNNNNNNNNNNNNNNNNNNNNNNNNNNNNNNNNNNNNNNNNNNNNNNNNNNNNNNNNNNNNNN
Save JME to Database...
from the Graphs
main windowtosavetheentire measurement and annotation
for future analysis using a database program or to reload the
measurement and certain setup parameters backinto the analyzer. A
of
up
made
is
title
default
measuremen
the
ou
but y
a
ter
en
title
ma
serial
for
y
the
t
wish
um
n
measuremen
and
e
yp
t
it
edit
to
date
and
er
b
the
for
is
t
date
our
y
de
co
pro
and
o
for
vided.
wn
The
time.
the
It
oses.
purp
device under
is
unique
a
ou
Y
ma
test.
name,
y also
Making
Measurements
2-23
Page 56

PMD Measurement: Jones Matrix Eigenanalysis Method
Specialized Measurement Methods
Performing a Cascade Measurement
Cascading is a measurement procedure that mathematically increases
the accuracy of p olarization mo de dispersion (PMD) measurements
of devices and components that can't be directly connected to
the HP 8509B Optical Output without using additional optical
interfacing. PMD cascading techniques are used in bulk optical
applications to separate the PMD response of the test device from
the cloaking eects of the combined PMD response of the xtures
and adapters between the HP 8509B Optical Output and the input
to the test device. Fib er optical applications b enet as well because
the response of optical source interfacing isolators, connectors and
cables of the test system (represented by DCO in the gure shown
below) can be mathematically removed from the total PMD response,
leaving behind the response of the targeted test device (DUT in the
w).
the
of
source
belo
test
terfacing
in
greater
device
than
gure
resp
shown
onse
optical
individually
This
hnique
tec
(DUT)
(DCC)
100 fs.
are
and
most
is
the
appro
eectiv
undesired
ximately
when
e
PMD
the
same
the
of
PMD
the
and
2-24
Making
Measurements
Figure
2-28.
Setting up the System
the Optical
Attach the device to be calibrated out (DCO), bet
Output and the
following illustration. T
Optical Input of the HP 8509B, as outlined in the
ape do
wn the pigtails so that only the nal
ween
portion of the output pigtail of the DCO will b e allowed to move
when the nal test device (DUT) is inserted. Movement of the
calibration
the
een
w
et
error.
t
b
mo
DCO,
or
measuremen
emen
v
t,
tof
causes
pigtail,
input
its
measuremen
and
Page 57

PMD Measurement: Jones Matrix Eigenanalysis Method
Figure 2-29. Measurement Setup
Making the Measurement
Prepare the
1.
polarization
Source
2.
Select
then
N
N
N
PMD:
external source
follo
y
b
Preparation
Measurement
N
N
N
N
N
N
N
N
NN
N
NN
N
N
N
N
N
N
N
N
N
N
N
N
N
N
N
N
N
NN
NN
N
N
N
N
N
N
N
N
N
N
N
N
N
N
N
N
N
N
N
N
N
Jones
wing
p
N
N
N
N
N
N
N
N
N
N
N
N
N
N
N
N
Matrix
to pro
pro
the
this
ortion
from
N
N
N
of
main
the
N
N
N
N
N
N
N
N
N
N
N
NN
N
N
N
N
N
N
N
N
N
N
N
N
Eigenanalysis...
vide a
cedure
JME
windo
N
N
N
N
N
N
N
N
N
N
N
N
N
N
NN
N
circular
describ
PMD
w
N
N
N
N
N
N
N
N
N
N
N
N
N
N
men
N
N
N
N
state
the
in
ed
section.
selections, and
u
N
N
N
N
N
N
N
N
N
NN
N
N
.
F2
of
External
N
N
N
N
N
N
N
ts,
N
N
N
N
N
NN
then
Figure
source
then
N
N
N
N
N
N
from
N
N
N
N
N
N
Cascaded
select
N
N
N
N
N
N
2-30.
Set
3.
um
n
4.
Select
selections,
optical
the
up
oin
p
of
er
b
N
N
N
N
N
N
N
N
N
N
N
N
N
N
N
Measurement
and
5. Note that the measuremen
ellow
ration
w, a y
5or4
New Thru Cal
graphs windo
4
Start Calib
right portion of the graph windo
the
for
4
Done
graphs
the
N
N
N
N
NN
NN
N
N
N
N
N
N
N
N
Measurement
trol area at the bottom of the
tcon
NNNNNNNNNNNNNNNN
NNNNNNN
Cascade
5
, whic
w
range
men
desired
.
5
N
N
N
N
N
N
N
N
N
N
N
N
Device
main
NN
N
N
N
N
N
NN
w
N
.
elength
v
a
windo
Start
banner appears. Select
hever appears at the bottom
w.
the
and
u
Making
Measurements
2-25
Page 58

PMD Measurement: Jones Matrix Eigenanalysis Method
The
6.
DCO.
calibration
only
resulting
When
ma
ber
the
if
Figure 2-31.
measuremen
calibration
thru
the
redone
e
b
y
the
or
DCO
Thru Calibration
haracterizes
c
t
is
selecting
y
b
mo
has
complete,
v
Figure 2-32. The Measurement
ed
PMD
4
New
during
Thru
eects
select
Cal.
the
the
of
4
Continue
.
5
erform
P
5
calibration.
.
The
this
2-26
Making
Measurements
7. Remo
ve the output pigtail of the DCO from the optical input
e only the output pigtail
of the HP 8509B, taking care to mo
v
and not the DCO or its input pigtail. Connect the device to be
measured (DUT) b etween the output pigtail of the DCO and the
Optical
Input of
the
olarization
p
analyzer.
Page 59

PMD Measurement: Jones Matrix Eigenanalysis Method
8. Select
4
Start Measurement
5
. When the measurement is complete, the
PMD eects of the rst DCO are removed and the displayed DGD
represents the newly inserted device. Refer to the follo wing gure.
Results
The
Figure
2-33.
CA
UTION
PMD
general,
In
Single
duce
pro
the
Device
the
measuremen
ected DGD
exp
ADDITIONAL INF
cascaded
of
alues
v
of
ts
the
of
ORMATION
w
t
devices
o
same
devices
cannot
devices
not
do
b
cascade.
in
simply
e added
add.
to
The eectiveness of this method can be veried in two
ways.
1. Perform a cascade thru calibration on a device and then measure
path.
t
b
that
device
same
the
small v
ery
v
the
device
itself
The device m
ers. The
b
y
an
ving
alue
without
of
has
DGD,
een
b
mo
ypically
t
remo
under
ed from
v
0.010ps,
measuremen
the
ust be stable in temperature for this v
result
should
indicating
erication to
be meaningful.
2. Measure the DGD of a device (DUT) in the Single Device mode
(without a cascade thru calibration). Then p erform a cascaded
PMD measurement using this same device (DUT) connected to
a second device (DOC) that has b een cascaded out. The PMD
measuremen
obtained
imp
is
in
ortan
t
the
t.
result
Single
should
Device
be
ery
v
mode.
close
Again,
to
measuremen
the
erature
temp
t
stabilit
a
e
y
Making
Measurements
2-27
Page 60

PMD Measurement: Jones Matrix Eigenanalysis Method
Using a Voltage-Tuned Source
The JME PMD measurementmay be performed using a voltage
tuned optical source. Operation is automatic once the measurement
is started. To p erform a measurementwithavoltage-tuned source,
open a JME PMD window and select Optical Source Setup. Use
Optical Source Selection to choose the voltage-tuned mo de. You will
see a change in the information displayed in the Wavelength area
of the window. Enter the wavelength parameters and number of
points as you would for an HP-IB source. Enter the tuning voltages
corresponding to the start and stop wavelengths. This \calibrates"
your wavelength tuning and requires knowledge of the source tuning
characteristic. The tuning voltage is programmed in linear fashion
between the entered limits. Set the settling times as required for
your source, or use the default values. Connect the tuning voltage
connector
BNC
from
Close
oltage-tuned
v
measuremen
the
laser.
t.
\A"
on
the
rear
the
Optical
panel
Source
of
the
Setup
8509
form
to
the
and
start
Using
Manually-Tuned
a
source
PMD
JME
The
tuned
line
optical
laser
sources
measuremen
Optical
select
manually
the
longer relev
measuremen
source.
with
t
Source
tuned mo
and
t
an
that
a
are
This
lac
man
Setup.
de. The
gra
feature
hardw
k
ual
ed
y
b
may
t
enables
are
source,
Optical
Use
settling time
En
out.
erformed
p
e
tuning
en
op
ter
y
a JME
Source
the
using
use
to
ou
terfaces.
in
PMD windo
Selection
parameters
elength
v
a
w
tunable
p
o
T
to
are
parameters
single
erform
w
hoose
c
no
ually
man
a
and number of points as you would for an HP-IB source. Close
the Optical Source Setup form and start the measurement. The
instruction window will prompt you to adjust the wavelength of the
source and take the next p oint. Repeat this until the measurementis
complete.
a
and
2-28
Making
Measurements
Page 61

PMD:JME Concepts
Polarization Mode Dispersion
Polarization modes
PMD is a fundamental property of optical ber and components by
whichanylightwave signal is split into two polarization modes that
travel at dierent speeds. In eect, single mo de ber is bimo dal with
respect to polarization. The dierence in propagation time between
the two polarization modes is called dierential group delay.
General effects
Because
the
distinction
source
v
c
a
time and
in
v
cable-television
of
olarization
p
may
dieren
of
alues
com
in
hirp
transmitted
signal
system,
the
ariation.
PMD Measurement: Jones Matrix Eigenanalysis Method
of
h
eac
to
from a
inuence
the
as
erted
v
in
degrading
spectrally
laser
can
path
function
a
is
loss
t
amplitude
to
distortion
of
frequency
cause
presen
PMD,
w
et
b
become
bination
signal
the
This
ligh
des
mo
pulses.
een
partly
tial
tensit
in
olarization
p
eect
a
w
t
broaden
group
with
ary
v
to
.
y
causes
pulses
e
v
as
In addition,
olarized
dep
.
y
dela
in
PMD
polarization
in
olarization-dep
p
If
ariation
v
comp
hed
launc
propagate,
they
light
under
Finally
,
transmission
a
is
second-order
osite
partly
transmitter
state
enden
con
systems.
the
wide
large
of
t
in
Mode
Mo
coupling
de-coupling
optical
coupling
the
to
en
giv
term
the
is
of
energy
between polarization modes along the transmission path. Two-port
optical devices (including optical ber) fall into two categories
according to the degree of mode coupling. Non-mode-coupled devices
include most comp onents, hi-bi (polarization maintaining) ber and
short lengths of ordinary single-mo de ber. For these devices, energy
remains
de
olarization
p
each
to
in
hed
launc
propagates.
is generally
dieren
The
independen
tial
tofw
mode coupling, is exhibited b
long b
ers, energy couples b et
mo
y
group
dela
avelength. The other extreme, strong
y long lengths of single-mo de ber. F
ween mo des due to ph
internal to the ber and optical eects induced b
environment.
The dierential group dela
in
non-mo
of
de-coupled
ysical v
devices
ariations
y the ber's
y of highly mode-coupled
or
it
as
de
mo
that
devices is a strong function of wavelength. An intermediate degree of
mode coupling, typical of short to medium lengths of optical ber,
function
eak
w
ely
relativ
a
is
h
whic
y
results
a
w
of
dieren
in
elength.
v
tial
group
dela
Making
Measurements
2-29
Page 62

PMD Measurement: Jones Matrix Eigenanalysis Method
PMD units
Fiber PMD statistics
Dierential group delay is expressed in units of time, generally
either picoseconds (1 ps = 10
12
s) or femtosecond (1 fs = 10
0
15
s).
0
Short-ber PMD may be expressed in terms of time per meter or
kilometer. Due to the eects of mo de-coupling, long-b er dierential
group delay increases as the square ro ot of ber length. Therefore,
long-ber dierential group delay is often expressed in terms of time
per square root of ber length (in kilometers).
The \PMD" of a component or ber is simply the average dierential
group delay.For non-mo de-coupled devices, this may b e obtained
from a single pair of Jones matrix measurements separated bya
known wavelength interval, although in practice an average of several
intervals is used. For highly mode-coupled devices, the measurement
is repeated at a manywavelength intervals across a large wavelength
range. The average dierential group delay is simply the average of
these individual values.
Fitting
T
sucien
the individual
a
curv
closely
dela
the
determine
o
est-t
b
represen
e
resem
tak
y
tly
Maxw
en
whether
sampled
dieren
ell
the
ts
the
bles
the
from
elength
v
a
w
the
particular measuremen
a
in
group
tial
probabilit
ected
exp
Maxwell
measuremen
dela
distribution
y
shap
curv
t
e
e,
can
y
for
the
dep
v
endence
ma
alues
function.
bers.
long
erage
v
a
considered
e
b
of
t, a
e
b
y
dieren
er has
ab
histogram
compared
Maxw
The
data
the
If
tial
statistically
b
of
to
ell
group
een
distribution
the
to
e
curv
ell
Maxw
accurate.
The HP
8509B soft
eigenanalysis
hi-squared
c
w
measuremen
to
d
metho
pro
are
generate
vides
results
t
statistical
a
for
b
the
this
est-t
displa
ose.
purp
Maxwell
uses
It
curve.
the
matrix
Jones
of
y
Once the Maxwell curve t has been performed, the quality of the t
to the data must b e determined. This may b e done qualitatively,by
visually assessing the t, or by use of the quality of t parameter
displayed in the statistics window.
sample
Enlarging
the
If
the
quality
of
the ber. This is most easily accomplished b
wavelength range of the measuremen
measurements should be tak
as p ossible, with w
size
or,
o
p
is
t
avelength in
more
data
required
is
to fully
y expanding
, long-b er PMD
awavelength range
ver as wide
en o
t. Generally
terval small enough to capture the
represen
the
t
features of the curve of dierential group delayversus wavelength.
However, for some bers even the full wavelength range may not b e
sucient to produce a distribution of Maxwellian shape. In such
measuremen
of
the
temp
the
de-coupling
mo
erature.
analysis.
for
All
sample
cases,
at
c
of
the
dieren
t
haracteristics
resulting
the
temp
of
size can
eratures,
b
the
is
data
er
com
increased
e
b
based
are
bined
on
strong
in
y
b
fact
the
functions
a single
eating
rep
that
histogram
t
2-30
Making
Measurements
Page 63

If the ber temperature is changing naturally,duetochanges in the
ambient temperature, the measurementmay be rep eated versus time
to enlarge the sample size. If the b er is in cable form, temperature
change may be induced by passing a current through the metal
members of the cable. The sample size for spo oled b er can also be
enlarged by rearranging the turns of ber on the spo ol. For example,
a sp ool of loosely coiled ber can be turned end over end between
measurements.
Source spectral characteristics
The Jones matrix eigenanalysis method of PMD measurement
involves measuring the output state of p olarization of the device
under test with various linear polarizers inserted in the path b etween
optical source and the device. This requires that the output of
the test device always be at least partially polarized. The output
will dep olarize if the coherence time of the source approaches the
dierential group delay of the test device. Single-line lasers of narrow
ectral
sp
recommended
metho
d.
PMD Measurement: Jones Matrix Eigenanalysis Method
Source,
width,
for
suc
h
the
the
as
Jones
8168A
HP
matrix
unable
T
eigenanalysis
Laser
PMD
measuremen
are
t
Should
Cascade
reference
the
use
I
measurements
frame?
reference
The
birefringence
or
the
from
olarization
p
elength
v
a
w
the
preformed
should
not
test
across
be
frame
and
path
receiv
at
used.
feature
olarization
p
etw
b
The
er.
whic
a
w
a
een
it
h
elength
v
v
remo
dep
automatic
the
reference
up.
set
is
range,
birefringence
es
t
enden
p
frame
is
Since
reference frame
the
olarizer
PMD
(2-p
oin
(3-p
loss
and
appropriate
measuremen
method)
t
the
only
feature
ts
to
are
d)
metho
t
oin
What is a cascade measurement?
A cascade measurement measures the DGD of a single test device
while that test device is connected in series with other elements that
measuremen
demonstrate
DGD.
PMD:JME measuremen
The
ts
of
test device installed. This allo
remove the dieren
tial group dela
a
ws the
t
through
path
HP 8509B to mathematically
y of the path bet
without
and
with
ween the polarizer
the
olving
v
in
cess
pro
step
o
tw
a
is
and the test device.
Typical applications
The cascade metho d is not used in ordinary PMD measurements
in which the device under test is connected by pigtails to the front
ery
v
the
ving
remo
panel
small
y
ma
the
of
amoun
used
e
b
instrumen
dieren
of
t
cases
in
as
t,
tial
where
is
it
group
an
capable
not
dela
optical
of
pigtails.
the
of
y
device with
Making
ev
w
Ho
signican
t
Measurements
er,
PMD,
it
2-31
Page 64

PMD Measurement: Jones Matrix Eigenanalysis Method
such as an isolator, is placed b etween the instrument and the input of
the device under test.
The cascade measurementmay also be used to test individual
sections of a telecommunications system mo del or test bed. Such
systems consist of many sections, each of whichismadeup ofoneor
more amplier/ber pairs. Such systems may provide measurement
taps between sections. The PMD of individual sections maybe
measured using these taps, without disturbing the through path
connections. The output pigtail of the polarization analyzer is
connected to the input of the system and left there throughout the
measurement. A cascade reference measurementistaken with the
optical input of the polarization analyzer connected to the tap just
prior to the section of interest. Then the section of interest is added
and the second step of the measurement is performed. The resulting
measurementcharacterizes only the selected section. If the goal of
the PMD measurement is to relate the PMD of individual sections
to the PMD of the whole system, the cascade measurementmaybe
repeated on each of the sections to characterize the sections. Ateach
PMD
osite
comp
stage,
cascade
v
ro
the
reference
y
ma
one
alues,
ot-sum-of-squares
measurement.
compare
exp
of
the
ected
preceding
all
With individual
addition
alue.
v
of
sections
PMD
is giv
and comp
the
with
ythe
en b
osite PMD
ected
exp
2-32
Making
Measurements
Page 65

PMD Measurement: Wavelength-Scanning Method
PMD Measurement: Wavelength-Scanning Method
Polarization mo de dispersion (PMD) is a fundamental physical
property of optical ber and components in which a lightwave is split
into twowaves of slightly dierent speed on the basis of polarization
state. The two polarization modes experience a dierence in
propagation time known as \dierential group delay" (DGD). The
DGD of long optical bers varies with wavelength. The \PMD" of a
test device also refers to the average value of the dierential group
delay. PMD is fundamentally expressed in units of time, typically
0
picoseconds (1 ps = 10
12
s), although in the case of long bers it
may be normalized to the square root of ber length with the units
of picoseconds per root kilometer.
This section explains how to measure the PMD of a test device using
the wavelength-scanning (WS) metho d. A typical measurement
result is shown in the following gure.
Figure 2-34.
measurement
Example
of
for
y
displa
data
Typical applications of the w
elength-scanning
v
a
w
a
elength-scanning method include
av
PMD
measurement of medium to long optical bers and cables. It can also
be applied to the measuremen
used to c
haracterize amplied systems in whic
t of some
large enough to pro duce a useable n
componen
h the lev
ber of peaks and v
um
ts, and ma
ybe
el of PMD is
alleys in
the response within the system passband. Consider the following
aspects of the wavelength-scanning method when deciding which
use:
to
is
erformed
p
e
d
sligh
tly
faster
with
than
the
Making
HP
JME
the
8509A
Measurements
metho
B.
or
d.
2-33
measuremen
PMD
Measuremen
metho
The
d
t
can
sp
t metho
eed
b
Page 66

PMD Measurement: Wavelength-Scanning Method
The metho d provides more optical p ower to the DUT than the
JME metho d do es.
A single PMD value, or average dierential group delay,is
produced from measurement across a wavelength span.
Broad wavelength ranges are required for measurementoflow
PMD values.
The measurement is inuenced by pigtail position and polarization
launch condition, particularly for lowvalues of PMD.
Basic Measurement
System
the
Setting
up
The following measurement procedure illustrates the simplest and
most straightforward path in using the HP 8509A/B Lightwave
Polarization Analyzer operating system software to makea
wavelength-scanning PMD measurement.
Connect
measuremen
our
y
system
t
outlined
as
in
wing
follo
the
illustration.
2-34
Making
Measurements
elength-Scanning
v
a
W
signal
2-35.
applied to
is
olarization should be adjusted for
Figure
source
the
If
HP 8509B, External Source P
circular polarization as described
hapter.
this c
System
the
External
Source
in External Source Preparation in
Setup
Input
of
the
Connecting the tunable laser directly to the DUT extends the
amplitude range of the measurement to allow measurement of higher
loss devices. If the source is not p olarized, an external polarizer must
used.
e
b
Page 67

Making the Measurement
UTION
CA
PMD Measurement: Wavelength-Scanning Method
At this pointyour measurement system is ready to makeyour
rst measurement. For our purposes we are going to measure a
ten kilometer length of ber. Connect your test device between
the optical output of the laser source and the optical input of the
analyzer.
ACCURACY ENHANCEMENT NOTE
The ber path leading from the tunable laser source to the
DUT and from the DUT to the 8509 optical input must not move
during the measurement process. Unsupported ber, particularly
unjacketed ber, should be taped down or placed against stationary
ob jects. Movement of the ber may jeopardize PMD measurement
accuracy.
ve
a
w
t
\Ligh
the
to
Observ
e
Connector
prop
Care"
connection
er
hapter
c
tec
in
hniques.
man
this
Refer
ual.
Figure 2-36. Wavelength-Scanning Measurement Selection
NNNNNNNNNNNNNNNNNNNNNNNNNNNNNNNNNNN
Select
NNNNNNNNNNNNNNNNNNNNNNNNNNNNNNNNNNNNNNNNNNNNNNNNNNNNNNNNNNNNNNNNNNNNNNNNNNNNNNNNNNNNNNNNNNNNNNNNNNNNNNNNNN
PMD:Wavelength
Measurement
Scanning...
from the main menu, and then select
Shift+F2
Making
Measurements
2-35
Page 68

PMD Measurement: Wavelength-Scanning Method
Figure 2-37. Optical Source Setup for PMD:Wavelength Scanning
Verify that the source and wavelength are correct for your
measurement, and that the power is on. If the screen on your
computer lo oks like the previous illustration, select
4
Done
5
.
ADDITIONAL INF
broader
A
measuremen
accurate measuremen
main
to
wish
ou
y
If
o
p
the
to
in
ter
en
alue
v
a
w,
windo
of
y
displa
lasers
er
b
nm.
bers,
de
e
b
y
ma
,
bers
de
are
Single-mo
generally
1
of
Single-mo
PMD
ORMA
t
t.
lev
tain
el
lev
er
w
greater than
no
ailable
v
a
lengths
adequately
that are
measured
est
b
TION
elength range
v
a
w
p
eled
y
displa
p
laser
range
the
in
measured
h longer
muc
with
w
o
of the
the
er.
w
o
during
er
minim
of
a
w
produces
optical
um
10
using a
y
b
than
elength
v
measuremen
the
source
w
o
p
or
km
km
10
deltas
a
er
lo
wa
more
setup
sho
PMD
w
elength
v
ha
or
of
wn
v
0.25
e
t,
in
b
delta
high
nm
the
ers,
2-36
Making
Measurements
Select
WS
The
erformed
p
4
Sta
rt
graphs
Figure 2-38. PMD: WS Measurement Start
optical
of
range.
Graphs
Measurement
are
across
the
from
5
deriv
selected
ed
the
from
w
HP
a
elength
v
a
8509A/B
series
screen.
measuremen
measuremen
the
As
ts
t
Page 69

PMD Measurement: Wavelength-Scanning Method
progresses, the
Measurement Summary
display bar directly belowthe
graph lists the PMD results obtained, up to the currentwavelength.
ACCURACY ENHANCEMENT NOTE
If your wavelength range was not sucienttoprovide at
least two peaks in one or more of the measurement curves, you will
get the message \One or more of the wavelength scanning traces has
an insucientnumber of p eaks." If you choose
4OK5
and continue
with the measurement, the measurement will ignore these curves and
derive PMD from the curves whichdoshow at least two peaks.
Figure
Measurement
2-39.
Results
Your measurement is complete. The screen on your computer should
look similar to the previous illustration.
The three graphs have xed Y-axes of +1 to01 and showthe
measured values of the normalized Stokes parameters s1, s2, and s3.
graphs.
these
PMD
is determined
from
analysis
of
Making
Measurements
2-37
Page 70

PMD Measurement: Wavelength-Scanning Method
Manipulating the Measurement Results
When your measurement is complete, you may;
Select one of the measurement curves to enlarge vertically.
Measurement
The
Review the results in the
Review the measurement setup conditions in the
Annotation
Examine a curve at a particular wavelength, by using the cursor
bar.
Display, edit, and print the data in tabular form.
Print the graph with or without measurement annotation and data
listing.
Saveyour measurement and annotation information to a database
for future use or to reload the measurement backinto the
HP
erform
P
Displa
or
Summary Bar
8509A/B.
other
all
y
cascade
area.
measuremen
your
of
de.
mo
Measurement Summary
without
ts
measurements
in
lea
one
ving
windo
bar.
Measurement
Graphs
the
using
w,
windo
either
w.
tile
2-38
Making
Measurements
Figure 2-40. The Measurement Summary
The
Measurement Summary Bar
up to the
currentw
avelength.
displays the PMD results obtained
All of the displays have the same units, which are user selectable but
default to picoseconds. The bar displays the PMD derived from each
erage.
v
a
their
as
ell
w
of
the
measured
Stok
parameters,
es
as
Page 71

The Measurement Annotation Area
When the measurement ends, the control panel at the b ottom of the
Graphs window is replaced bythe
This area lists the date and time of the start of the measurement, the
ber length in kilometers, the tunable laser power and attenuator
settings, the
lists
also
optical
h
whic
eaks
p
of
annotation area
the
erformed
p
de
mo
the
detail
in
Minim
um
toggled
and
u,
men
PMD Measurement: Wavelength-Scanning Method
Figure 2-41. The Measurement Annotation Area
Measurement Annotation Area
step
the
the
iden
on
coupling
the
in
eature
F
and
on
then
start and
of
er
b
um
n
measuremen
each
in
tied
an
is
traces
the
factor
Concepts
Size.
o
N
N
N
N
NN
NN
N
N
N
N
N
N
N
N
N
selecting
y
b
Annotation
elengths
p
oin
ts
ts,
w
av
that
ere
stop w
of the
whic
icon
the
and
also
is
k
section under
measuremen
N
N
N
The
N
N
N
N
N
N
N
N
N
N
N
N
Display
N
N
.
tak
curv
minim
N
N
NN
N
N
is,
en.
es.
indicates
h
wn.
sho
N
N
N
N
N
N
N
N
N
N
N
N
and
um
n
the
table
A
the
t
A
feature
um
These
title
the
annotation
t
N
N
N
from
er
b
lists
righ
the
topics
Analysis
the
v
a
w
av
of w
the
hand
t
of
e
yp
t
The
size.
are discussed
area
windo
main
.
elength.
elengths at
ber
num
of
edge
analysis
alue
v
and
de
Mo
e
b
can
w
It
of
Using
The Cursor
Figure 2-42. The Cursor Bar
Use the arrow button in one of the graphs to expand the
graph. Activ
NNNNNNNNNNNNNNNNNNNNNNNNNNNNNNNN
Cursor Bar
the
een
w
et
b
Annotation
parameters
slider con
the
ate the
Cursor Bar
from the Graphs window menu. The cursor bar appears
Summary
Measuremen
The
area.
selected
a
for
arro
trol,
t
cursor
w
eys,
k
w
a
y selecting
b
Bar
sho
y
displa
elength. The
v
editing
y
b
or
ws
NNNNN
Display
the
and
the
v
a
w
the
Making
NNNNNNNNNNNNNNNNNN
and then
Measuremen
normalized
elength
v
a
is
elength
w
Measurements
t
stok
selected
displa
es
y
b
.
y
2-39
Page 72

PMD Measurement: Wavelength-Scanning Method
Changing The Measurement Format
Figure 2-43. Changing the Measurement Format
Select
measuremen
see
NNNNNNNNNNNNNNNNNNNN
Format
section
the
N
N
N
N
N
N
N
N
N
N
N
N
N
N
N
N
N
Delay
displa
e
b
to
N
N
N
N
N
N
N
N
N
N
N
N
N
N
N
N
N
N
Delay/L
to
,
Bar
N
N
N
N
N
N
N
N
N
N
N
N
N
N
N
N
N
N
Delay/sqrt(L)
Summary
length.
er
b
N
N
N
N
N
NN
NN
N
N
N
N
N
N
N
N
N
Fiber
the b
N
position of the
average, median, or maximum value of PMD derived from the
three graphs s1, s2, and s3.
NNNNNNNNNNNNNNNNNNNNNNNNNN
whic
instrumen
valleys), and to use the endpoin
wa
appropriate). F
the PMD:WS
er y
N
N
N
N
N
N
N
NN
NN
NN
NN
N
N
Avg/Median/Max Delay
Analysis
the
h
velengths of the rst and last feature (peak or peak/v
NNNNNNNNNNNNNNNNN
Extrema/Full Scan
peaks and valleys and to use the endpoints of the wavelength
scan
N
N
N
N
N
N
N
N
N
N
N
N
Extrema/First
oth
b
from the Graphs windowmenu to access the
discussion
a
or
formatting
t
y
b
Causes
N
N
N
N
N
b
N
NN
N
N
N
N
N
N
N
Length...
N
N
N
N
N
in
NN
N
N
N
N
p
the
in
ed
y
Causes
display
e
N
N
N
N
N
N
N
N
N
N
N
N
N
N
N
N
N
to
,
Bar
N
N
NN
NN
N
N
N
N
N
N
N
N
N
N
N
v
ha
ou
N
N
N
N
NN
NN
NN
NN
N
N
N
N
N
Measurement Summary Bar
This
elength-scanning
v
a
w
be
can
t
or a detailed discussion of the Analysis mo des, see
Concepts section with that title.
NNNNNNNNNNNNNNNNNNNNNNNNN
a
w
the
N
N
N
N
N
N
N
N
N
N
N
N
N
N
N
N
and
eaks
functions.
in
title
that
alues in
v
PMD
picoseconds.
PMD
the
picoseconds
in
ed
N
Causes
b
N
N
N
N
N
N
N
e
N
N
N
N
N
N
N
men
elength-scanning
v
N
N
N
N
N
N
N
v
the
y
displa
e
men
This
measured.
just
N
NN
NN
NN
NN
N
N
N
N
N
N
set
NNNNNNNNNNN
NN
The PMD value displayed in the left most
item
u
coun
to
Causes the HP 8509A/B to countboth
N
N
N
N
N
N
N
N
N
N
N
N
N
N
N
N
N
N
N
N
N
Last
to
alleys and
F
PMD:WS
the
in
alues
v
p
alues
v
PMD
in picoseconds
ed
selection
u
selection
ws
allo
onse
resp
eaks
p
t
ts of the w
N
form
Causes the
use
to
Concepts.
Measuremen
Measuremen
the
kilometer
er
in
lets
,maybechosen as the
of the
curv
extrema
or
av
ula.
HP
v
a
w
the
PMD
of
Summary
t
Summary
t
er
b
of
the
Measuremen
kilometer
ot
ro
er
p
the
ter
en
ou
y
metho
es are
elength range or the
8509A/B
elengths
analyzed.
eaks
(p
to
of
units,
length.
t
length
y
b
d
plus
alley as
coun
rst
the
Bar
The
t
,
of
of
2-40
Making
Measurements
Page 73

PMD Measurement: Wavelength-Scanning Method
and last feature (peak or valley) in the wavelength-scanning
formula.
NNNNNNNNNNNNNNNNNNNNNNNNNNNNNNNNNNNNNNNNNNNNNNN
Peaks/Full Scan
Causes the HP 8509A/B to countonly
peaks and to use the endpoints of the wavelength scan in the
wavelength-scanning formula.
NNNNNNNNNNNNNNNNNNNNNNNNNNNNNNNNNNNNNNNNNNNNNNNNNNNNNNNNNNN
Peaks/First to Last
Causes the HP 8509A/B to countonly
peaks and to use the wavelengths of the rst and last (peak) in
the wavelength-scanning formula.
NNNNNNNNNNNNNNNNNNNNNNNNNNNNNNNNNNNNNNNNNNNNNNNNNNNNNNNNNNNNNNNNNNNN
Minimum Feature Size..
The value entered here is the
amplitude change, in linear units, required between a feature and
both of its nearest neighbors in order to be recognized as a feature
(peak or valley). For more details, see the PMD:WS Concepts
section of the same title.
NNNNNNNNNNNNNNNNNNNNNNNNNNNNNNNNNNNNNNNNNNNNNNNNNNNNNNNNNNNNNNNNNNNNNNNNNNNNNNNNNNN
Mode Coupling Factor (k)...
The mode coupling factor must
be set according to the type of test device. See the PMD:WS
Concepts section of the same title for details
NNNNNNNNNNNNNNNNNNNNNNNNNNNNNNNNNNN
Polarizer
selections
in the
only
olarizers
P
NNNNNNNNNNNNNNNNNNNNNNNNNNNNNNNNNNN
,
A
Polarizer
the
trol
con
HP 8509B.
details.
for
of
use
See the
NNNNNNNNNNNNNNNNNNNNNNNNNNNNNNNNNNN
,
B
Polarizer
ternal p
the in
PMD:WS
NNNNNNNNNNNNNNNNNNNNNNNNNNNNNNNNNNNNNN
,
C
Polarizer
No
olarizer and
Concepts
section
are a
These
ailable
v
titled
Displa
ying
and
Printing
Select
er
b
ma
ou
y
N
N
N
N
N
N
N
N
N
(
Format
up
are
appropriate
the
enough
long
is
wish
y
N
N
NN
N
N
N
N
N
N
N
N
N
N
N
N
N
N
N
Delay/sqrt(L)
dated,
N
N
N
on
N
to
N
NN
N
N
N
to
express
N
N
N
N
N
N
N
N
N
N
N
Y-axis of
the
units
exhibit
N
N
N
N
N
N
N
N
N
N
the
N
N
).
for
strong
result
The
the
measuremen
the
p
in units
new units
graph,
olarization
time
of
listed,
are
in
and
results.
t
mo
p
the
If
coupling,
de
ot
ro
er
all
and
measuremen
summary bar.
Data
in
abular
T
Format
Figure 2-44. Displaying Data in T
abular Format
NNNNNNNNNNNNNNNNNNNNNN
Display the tabular measuremen
then
NNNNNNNNNNNNNNNNNNNNNNNNN
NNNNNNNNNNN
Tabular Data
NN
from the Graphs main window menu. A text
t data b
y selecting
Display
box lls the Graphs window, overlaying the measurement graph. The
annotation
a
list
along
t
of
a
w
with
elengths
v
the
text
alues
v
whic
alues
v
x
o
b
in
optical
h
deriv
information
lists
measuremen
the
measuremen
from
ed
eac
from the
t
ts
pair.
h
summary
p
ere
w
measuremen
and
,
erformed
the
length
alues
v
N
and
area,
at
DGD
t
the
Making
Measurements
2-41
Page 74

PMD Measurement: Wavelength-Scanning Method
ADDITIONAL INFORMATION
You can add your own notes to the text. All of the stan-
dard keyboard and mouse editing features are available. Use the
mouse to place a text insertion pointanywhere in the document, and
then type the desired text. Text may be selected using the drag
features of the mouse. Selected text may be deleted or copied to the
clipboard by pushing the
The tabular data text box is limited to 60,000 characters.
All or a portion of the text box information maybeprinted. Printing
uses the default printer selected in the Windows Control Panel.
Toprint all of the text b ox information just press
on the Graphs window area. Toprint a portion of the text
box information, select the desired text with the mouse before
pressing
4
Return to Graph
under
4
Print tabulardata
5
at the top of the window or re-select
N
N
N
N
N
N
N
NN
NN
NN
the
Display
4
Copy to clipboard
5
.To return to the graphic display, select
N
N
N
N
N
N
N
N
N
N
men
u.
5
button.
4
Print tabular data
NNNNNNNNNNNNNNNNNNNNNNNNNNNNNNNNNNNNNN
Tabular Data
5
Printing
y
our
Graph
Graph
our
Select
N
NN
NN
NN
N
File
Printing
Figure
N
N
N
N
N
N
and
then
2-45.
N
N
N
NN
NN
NN
N
Print
NN
NN
N
N
N
N
N
N
N
N
N
N
N
N
N
N
PMD
N
from
y
the
Graphs
main
windo
NNNNNNNNNNNNNNNNNNNNNNNNNNNNNNNNNNNNNNNNNNNNNNNNNNNNN
Selecting
Graphs S1, S2, S3
will print only the graph.
NNNNNNNNNNNNNNNNNNNNNNNNNNNNNNNNNNNNNNNNNNNNNNNNNNNNNNNN
Selecting
Graph & Annotation
will print the graph and the
annotation information discussed in \The Measurement Annotation
Area."
N
N
N
N
N
N
N
N
N
N
N
NN
N
N
N
N
N
N
N
N
N
N
N
NN
N
N
N
N
N
N
N
N
N
N
NN
N
N
N
N
N
N
N
N
N
N
N
NN
N
N
N
N
N
N
N
N
N
N
NN
N
N
N
N
N
N
N
N
N
N
N
NN
Selecting
annotation information and
the corresp onding data poin
N
Graph,
Annotation, &
list the measuremen
ts.
Data
will
graph,
the
t
prin
twavelengths and
w.
2-42
Making
Measurements
Page 75

Saving your Measurement as Text
PMD Measurement: Wavelength-Scanning Method
Figure 2-46. SaveasText
Sa
ving
Database
in
Format
Select
File
and then
window. A standard window
NNNNNNNNNNNNNN
NNNNNNNNNNNNNNNNNNNNNNNNNNNNNNNNNNNNNNNNNNNNNNN
Save WS as Text
Save
screen will be displayed. At this
from the Graphs main
pointyou can select a le name and a directory for the data to be
stored. Columns of wavelengths and measurement data points will b e
saved as text for later use in a spreadsheet.
data sa
The
instrumen
future
ved
as text
cannot b
recalled
e
for
t.
displa
the
y
b
y
Figure 2-47. Saving in Database Format
Select
NNNNNNNNNNNNNN
File
and then
NNNNNNNNNNNNNNNNNNNNNNNNNNNNNNNNNNNNNNNNNNNNNNNNNNNNNNNNNNNNNNNNNNNN
Save WS to Database...
from the Graphs
main windowtosavetheentire measurement and annotation
for
future
analysis
measuremen
t
and
using a
certain
database
setup
default title for the measuremen
type and the date and time. It is a unique name,
the measuremen
ou ma
but y
t
y wish to edit it for y
program
parameters
t is pro
our o
vided. The title is made up of
wn purp oses.
to
or
the analyzer.
to
in
reload
the
A
Making
Measurements
2-43
Page 76

PMD Measurement: Wavelength-Scanning Method
PMD:WS Concepts
Polarization Mode Dispersion
Polarization modes
PMD is a fundamental property of optical ber and components by
whichany lightwave signal is split into two polarization modes that
travel at dierent speeds. In eect, single mo de ber is bimo dal with
respect to polarization. The dierence in propagation time between
the two polarization modes is called dierential group delay.
General effects
Because of PMD, lightwave pulses launched partly into eachof
the polarization modes broaden as they propagate, degrading the
w
et
ma
dieren
of
com
in
and
system,
b
ecome
b
y
bination
signal
This
signal
the
distinction
source
alues
v
hirp
c
a transmitted
time
the
in
ariation.
v
cable-television
pulses.
een
partly
group
tial
with PMD
to
tensit
in
olarization
p
causes comp
eect
systems.
v
y
ary
.
In
dep
dela
If
addition,
olarized
Finally
.
y
in a
olarization
p
in
olarization
p
ariation
v
osite
from
t
ligh
under
the inuence
transmitter
,
transmission
state
enden
dep
erted to
v
con
is
second-order
ectrally
sp
a
laser frequency
can
path
function
a
as
is
loss
t
amplitude
distortion
wide
of large
cause
of
presen
in
t
Mode
Mo
b
optical devices
coupling
de-coupling
een p
etw
term
the
is
olarization mo
(including
en
giv
des along
optical
to
b
the
the
er)
coupling
of optical
transmission
w
t
to
in
fall
path.
categories
o
energy
o-p
Tw
ort
according to the degree of mode coupling. Non-mode-coupled devices
include most comp onents, hi-bi (polarization maintaining) ber and
short lengths of ordinary single-mo de ber. For these devices, energy
launched into each polarization mo de remains in that mo de as it
propagates. The dierential group delay of non-mode-coupled devices
de
b
strong
F
er.
ariations
or
is generally
de
mo
long bers, energy couples b et
internal to the ber and
environment. The dieren
indep
coupling,
exhibited
is
ylong
b
ween modes due to ph
optical eects induced b
tial group dela
v
a
w
of
t
enden
devices is a strong function of w
mode coupling, t
ypical of short to medium lengths of optical ber,
other
elength.
The
lengths
of
y of highly mode-coupled
avelength. An in
extreme,
single
mo
ysical v
y the ber's
termediate degree of
results in dierential group delay which is a relatively weak function
of wavelength.
2-44
Making
Measurements
Page 77

PMD units
PMD Measurement: Wavelength-Scanning Method
Dierential group delay is expressed in units of time, generally
either picoseconds (1 ps = 10
Short-ber PMD may be expressed in terms of time per meter or
kilometer. Due to the eects of mo de-coupling, long-b er dierential
group delay increases as the square ro ot of ber length. Therefore,
long-ber dierential group delay is often expressed in terms of time
per square root of ber length (in kilometers).
Optimizing the setup for fiber or component test
Wavelength tuning range
The wavelength-scanning PMD measurement is based upon
the detection of changes in output p olarization as a function of
wavelength. These changes are manifested as peaks and valleys in the
parameter
es
b
er,
analyzes
d
Stok
ts are
range
ecause
should
the
three
and useful
8509's
p
measuremen
resp
normalized
er measuremen
b
elength
v
a
w
ev
w
Ho
metho
enhanced
is
elength-scanning
v
a
w
0
12
s) or femtosecond (1 fs = 10
onses
resp
more accurate
hosen
c
e
b
to
implemen
olarization
axes
ts
ving
ha
onses
s1,
if the
pro
tation
or comp
y
ma
few
s2
n
duce
e
b
p
er
and s3.
er
b
um
or
ten
v
a
w
of
onents,
obtained
eaks.
0
15
s).
Single-mode
large;
is
eaks
p
of
eaks.
p
more
elength-scanning
accuracy
from
er,
h
eaks
p
larger
the
of
b
cases,
or
n
coupled
de
DGD
um
a
ers
b
of
When
the
go
measuring
v
a
w
measuremen
d
o
extrema,
features.
of
The w
a
devices
comp
elength-scanning
can
t
although accuracy
elength
v
(most comp
spacing
onen
onen
resp
e
b
of
ts).
ts
derived
p
olarization
p
and
are
onses
from a
is somewhat
predictable
is
eaks
nm,
1550
t
A
usoidal.
sin
single
impro
the
main
v
for
pro
In
pair
ed
duct
taining
suc
of
for
non-mo
the test device (in ps) and the wavelength interval between adjacent
peaks (in nm) is approximately 7.4 ps nm. A device with DGD of 1.0
ps produces a peak every 7.4 nm.
Analysis
The
annotation area of the
wavewitht
indicate whether the analysis
feature w
vertical marks indicate
mode
de
analysis
mo
ypes of marks, or tics. The
wot
avelengths in the w
represen
is
Graphs windo
ted
y an icon sho
wb
righ
the
at
is using the full scan or rst and last
avelength-scanning form
whether the analysis is coun
t hand
edge
the
of
wing a sine
two bold triangular marks
ula. The smaller,
ting p eaks or
peaks and valleys.
elength-scanning
v
a
w
ending
Dep
algorithm
er
b
um
n
accuracy
des; extrema
mo
of
coun
p
is
on the
up
ts
eaks
impro
eaks
p
ccurring
o
ed
v
scan
full
analysis
extrema
or
in
hoosing
c
y
b
or
de
mo
selected
the
one
extrema
selected,
eaks
(p
of
rst
the
alleys).
v
and
velength
a
w
extrema-based
the
last.
to
When
range
the
small,
is
analysis
Making
Measurements
2-45
Page 78

PMD Measurement: Wavelength-Scanning Method
When measuring single mo de ber, analysis should be applied to the
full wavelength scan. When measuring components and polarization
maintaining ber, cases in which the wavelength-scanning responses
are sinusoidal, analysis should be started and ended on the rst and
last p eak (or extrema). This avoids error caused by the arbitrary
relationship of the endpoints of the wavelength scan and the rst and
last p eaks (or extrema) of the wavelength-scanning response.
In summary, use the analysis mo des as follows;
Single-mode b er peaks or extrema/full scan
Components, PMF peaks or extrema/rst to last
Always analyze extrema if the number of p eaks is small.
Minimum feature size
Once a wavelength-scanning response has been measured, it must
analyzed
be
(extrema).
magnitude
. The
alley
v
er.
b
um
n
situations
in
and
eaks
p
to
The
hange
c
default minim
alue
v
The
where
alleys.
v
tify
iden
\minim
whic
is
b
and
um
h
user
er
dieren
mo
t
coun
feature
tiates
feature
um
selectable.
emen
v
the
size"
is
t
eaks
p
parameter
eak from
ap
is
size
ma
It
causing
or
.05,
y
b
the
and
eaks
p
ecies
sp
an adjacen
dimensionless
a
increased
e
detection
alleys
v
the
in
of
t
size
false
PMD
fiber
PMD
metho
or
of
metho
statistics
Ho
d.
other
d
ph
is
ev
w
ysical
less
commonly
coun
its
than
er, statistics
measuremen
congurations
used
terpart,
may
erformed
p
ts
for
gathered
e
b
the
of
the
Jones
at
b
er.
Statistical
v
a
w
The
ulation
accum
matrix
from a
dieren
eigenanalysis
series of
t
characterization
elength-scanning
er
b
of
elength-scanning
v
wa
eratures
temp
Eachwavelength-scanning measurementcontributes a single pointto
the distribution, unlike the Jones matrix eigenanalysis metho d in
whicheachwavelength interval produces a point.
2-46
Making
Measurements
Page 79

PDL Measurement: Jones Matrix Method
Polarization dependent loss (PDL) describes the insertion loss
variation, gain variation or coupling variation of an optical
component, given all possible input signal polarization states.
It is found in all lightwave comp onents to some degree. PDL
can be desirable (in a linear polarizer) or undesirable (in a
telecommunication system or cable TV system) depending on the
application.
This measurement section explains how to measure the p olarization
dependent loss or gain of a test device using the Jones matrix
(PDL:JM) method. This method measures the absolute or relative
PDL of a lightwave component and displays the results as shown in
the following gure.
PDL Measurement: Jones Matrix Method
Figure 2-48.
Example of a Jones matrix PDL measurement data display
couplers,
cables.
As,
Consider
ypical
T
isolators,
test
devices
for
optical connectors
this
metho
long
and
include EDF
d
er
b
following aspects of this method when deciding whether
PDL:JM or the PDL: P
Measurements are t
Measurement uncertain
ower Max-Min metho d.
ypically completed in t
ypically60.1 dB.
tyis t
wotothree
Measurement range is 3.0 dB.
Op
eration
completely
is
automatic.
Making
Measurements
the
to use
seconds.
2-47
Page 80

PDL Measurement: Jones Matrix Method
Basic Measurement
Setting up the System
The following measurement procedure illustrates the simplest
and most straightforward path in using the HP 8509B Lightwave
Polarization Analyzer operating system software to make a PDL:
Jones Matrix measurement.
Connect your measurement system as outlined in the following
illustration. Begin by connecting the thru cable as shown in the
following gure.
ACCURACY ENHANCEMENT NOTE
The ber cable leading from the external source to the
ed do
etap
ust b
8509A/B
HP
preven
emen
v
Mo
tan
t
EXTERNAL
vemen
ymo
source
this
of
t
after
cable
SOUR
source
ma
INPUT
CE
olarization
p
jeopardize
y
m
een
b
has
measuremen
adjusted.
accuracy
t
wn
to
.
2-48
Making
Measurements
Figure
Measurement Setup
2-49.
Page 81

External Source Preparation
PDL Measurement: Jones Matrix Method
Before performing the measurement, you must select an optical
source. The following procedure will guide you through the process.
Figure 2-50. System Menu
NNNNNNNNNNNNNNNNNNNN
Select
N
N
N
N
N
N
N
N
N
N
N
N
N
N
N
N
Optical
System
N
N
N
N
NN
NN
NN
NN
N
Source
the main
from
NN
N
N
N
N
N
N
N
N
N
N
N
N
N
.
men
select
then
and
u,
Figure 2-51. Optical Source Setup
Select the external laser source and set the CW wavelength for your
measurement. Use the default power level or set as desired. If the
screen on
4
select
Done
y
our
.
5
computer
lo
oks
similar
to
the
previous
illustration,
Making
Measurements
2-49
Page 82

PDL Measurement: Jones Matrix Method
Figure 2-52. Polarizer Selection
Select
Set the
computer
our
y
NNNNNNNNNNNNNNNNNNNN
System
olarizers
p
from the main menu, and then select
Setup
4
No
rizer
ola
P
illustration,
5
.
lo
to
oks
Figure
4
Internal
the
e
lik
2-53. P
5
and
previous
olarizer
select
NNNNNNNNNNNNNNNNNNNNNNNNNNNNNNNN
Polarizers
screen
the
If
select
4
Done
on
.
5
2-50
Making
Measurements
Select
seconds,
N
N
N
N
N
3pt
N
N
N
N
N
and
N
N
N
Figure 2-54. 3pt Reference Applied
N
N
NN
N
N
N
N
N
N
Ref
then
from
select
the
Mark
N
N
N
N
N
N
N
N
N
N
Apply
N
N
N
N
N
N
ers
N
NN
N
3pt
N
N
N
N
N
Area on
N
N
N
N
.
the
Main
Screen,
5
ait
w
Page 83

PDL Measurement: Jones Matrix Method
ADDITIONAL INFORMATION
Creating and applying a 3pt reference frame allows mea-
surement of polarization state within a physical frame of reference.
In this case, the reference frame is lo cated inside the internal
polarizer assembly.
Figure 2-55. Circular Polarization
Adjust the External Source Polarization knobs on the frontpanel
of the HP 8509B until the activepointonthePoincare sphere
greater
is
approaches
0.90.
than
(select
t
poin
ole,
p
a
The
N
N
N
N
N
NN
Display
and
activ
N
N
NN
N
N
N
N
N
absolute
the
is
t
poin
e
N
N
N
N
N
N
N
and
then
v
see
easier
to
N
N
N
N
N
N
N
NN
N
N
N
N
N
N
N
N
N
N
NN
Mark Current
N
N
NN
N
N
marking
y
b
N
N
N
N
N
N
N
N
N
N
N
N
N
N
NN
N
Point
N
s3 mark
the
of
alue
er
curren
the
N
N
N
N
NN
N
N
N
N
N
Also
.
notice that the polarization ellipse will become more circular as s3
approaches 0.90. Then un-apply the 3pt reference before going on
to do the JME PMD measuremen
ts. Do not mo
ve the cable or the
external source p olarization knobs.
FOR MORE INFORMATION
More
Degree
information
Polarization
of
on
State
(DOP)
olarization
P
of
ma
(SOP)
found
e
b
y
Making
and
glossary
the
in
Measurements
.
t
2-51
Page 84

PDL Measurement: Jones Matrix Method
Making the Measurement
At this pointyour measurement system is ready to makeyour rst
measurement. For our purposes we are going to measure a optical
isolator. Remove the ber thru cable connecting the optical output
to the optical input on the HP 8509B. Connect your test device
between the optical output and the optical input.
ACCURACY ENHANCEMENT NOTE
Accuracy is aected by the PDL of the optical connectors,
the physical stability of the bers during the test procedure, the
DOP of the source, and the test signal p ower level. Accuracy is also
degraded when the DUT depolarizes the test signal. This can o ccur
when the dierential group delay(between Ex and Ey), caused by
the DUT, is greater than the coherence time (=1/(line width of the
source in Hz)) of the test signal.
CAUTION
Observe
Connector
proper
Care" c
connection tec
hapter in
this man
hniques.
ual.
Refer
to
the
\Ligh
e
v
a
w
t
2-52
Making
Measurements
Jones
Figure
2-56.
NNNNNNNNNNNNNNNNNNNNNNNNNNNNNNNNNNN
Select
NNNNNNNNNNNNNNNNNNNNNNNNNNNNNNNNNNNNNNNNNNNNNNNNNNNNNNNNNNNNNNNNNNNNNNN
Measurement
from the main menu, and then select
PDL:Jones Matrix ... F3
Matrix
Measurement
Selection
Page 85

Figure
2-57.
PDL Measurement: Jones Matrix Method
Jones
Matrix
Measurement
Windo
w
Select
Connect
the
Press
measuremen
the
w.
windo
ternal
In
the
device
4
Measure
olarizers
P
y
button
5
will
t
ou
app
and
wish
with
ear
Delta
measure.
to
our mouse
y
the
in
ransmission
T
oin
p
olarization
P
Measuremen
The
ter.
endence
Dep
results
data
t.
of
our measuremen
Y
lo
ok
similar
to
Figure 2-58. Measurement Results
t
the
complete.
is
previous
screen
The
illustration.
on
Making
computer
our
y
Measurements
should
2-53
Page 86

PDL Measurement: Jones Matrix Method
Saving the Measurement Results
When your measurement is complete, you maysaveyour results for
future use by selecting
NNNNNNNNNNNNNN
Save
, and then
chapter 4 in this manual.
NNNNNNNNNNNNNNNNNNNNNNNNNNNNNNNNNNNNNNNNNNNNNNNNNNNNNNNNNNNNNNNNNNNNNNNNNNNNNNNNNNNNNNNNNNNNNNNNNNNNNNNNNN
NNNNNNNNNNNNNN
File
from the main window menu, then
Jones Matrix & PDL: Jones Matrix...
. Also see
2-54
Making
Measurements
Page 87

PDL Measurement: Power Max-Min Method
Polarization dependent loss (PDL) describes the insertion loss
variation, gain variation or coupling variation of an optical
component, given all possible input signal polarization states. It is
found in all lightwavecomponents to some degree. It can be desirable
(in a linear polarizer) or undesirable (in a telecommunication or cable
TV system) dep ending upon the application.
This measurement section explains how to measure the p olarization
dependent loss, or gain, of a test device using the power max-min
method (PDL:PMM). A data display example is shown in the
following gure.
PDL Measurement: Power Max-Min Method
Figure 2-59. Example of a PDL measurement data display
Typical test devices for this metho d include linear polarizers, EDFAs,
couplers, isolators, optical connectors and medium to long b er
deciding
PDL
when
metho
to
d.
three
cables.
Consider
whether
Measuremen
to use
this
ts
the
are
follo
metho
ypically
t
wing
or
d
of
ects
asp
Jones
the
completed
PMM PDL
matrix
10 seconds
in
minutes.
ypically60.06 dB.
Measurement uncertain
tyis t
Measurement range is 30.0 dB.
Operation is completely automatic, when an automatic polarization
controller is used.
Making
Measurements
2-55
Page 88

PDL Measurement: Power Max-Min Method
Basic Measurement
Setting up the System
The following measurement procedure illustrates the simplest and
most straightforward path in using the HP 8509A/B Lightwave
Polarization Analyzer operating system software to make a PDL:
Power Max-Min measurement.
Connect your measurement system as outlined in the following
illustration. The HP 11896A Polarization Controller is recommended
for this application.
ACCURACY ENHANCEMENT NOTE
Avoid ber movement to eliminate errors due to bending
loss.
2-56
Making
Measurements
Figure
Measurement
2-60.
Setup
Page 89

External Source Preparation
PDL Measurement: Power Max-Min Method
Before performing the measurement, you must select an optical
source. The following procedure will guide you through the process.
Figure 2-61. System Menu
NNNNNNNNNNNNNNNNNNNN
Select
N
N
N
N
N
N
N
N
N
N
N
N
N
N
N
N
Optical
System
N
N
N
N
NN
NN
NN
NN
N
Source
the main
from
NN
N
N
N
N
N
N
N
N
N
N
N
N
N
.
men
select
then
and
u,
Figure 2-62. Optical Source Setup
Select the external laser source and set the wavelength. Use the
default power level or set as desired. If the screen on your computer
looks
similar
to
the
previous
illustration,
select
4
Done
5
.
Making the Measurement
our measuremen
At this poin
measurement. F
isolator. Connect y
ty
or our purposes w
our test device bet
and the optical input.
our rst
t system is ready to mak
ey
e are going to measure an optical
the polarization con
ween
Making
Measurements
troller
2-57
Page 90

PDL Measurement: Power Max-Min Method
ACCURACY ENHANCEMENT NOTE
Accuracy is aected by the PDL of the optical connectors,
the physical stability of the bers during the test procedure, the
DOP of the source, and the test signal p ower level. Accuracy is also
degraded when the DUT depolarizes the test signal. This can o ccur
when the dierential group delay(between Ex and Ey), caused by
the DUT, is greater than the coherence time (=1/(line width of the
source in Hz)) of the test signal.
CAUTION
Observe proper connection techniques. Refer to the \Lightwave
Connector Care" chapter in this manual.
Connect
N
NN
N
N
N
N
Measurement
N
N
N
N
N
N
N
the
N
N
N
N
N
N
N
N
N
N
N
N
N
N
N
N
N
N
N
N
N
N
N
N
N
N
N
N
N
N
N
N
N
N
N
NN
NN
N
N
N
PDL:Power
Figure 2-63.
device
N
N
N
N
NN
N
from
N
N
N
N
N
N
NN
NN
N
N
N
N
N
N
N
Max-Min
Measurement
PDL
measure
to
wish
ou
y
and
u,
men
main
the
N
N
N
N
N
N
N
N
N
N
N
N
N
N
N
...
N
N
N
N
N
N
N
N
N
NN
NN
Shift+F3
N
N
N
N
N
N
NN
NN
N
N
N
N
N
N
N
N
N
then
then
Selection
select
select
2-58
Making
Measurements
Figure
2-64.
PDL:P
w
o
Max-Min
er
Measurement Windo
w
Page 91

PDL Measurement: Power Max-Min Method
Select the
4
Reset
5
button with your mouse p ointer.
Vary the p olarization at the input of your device under test,
preferably using an automatic (like the HP 11896A polarization
controller, versus a manual controller) polarization controller.
Continue adjustmentuntil the Poincare sphere has been fully
explored or the value of Delta has stabilized.
our
Y
similar
ok
lo
an automatic
If
p
the
8509A/B should b e adjusted so that the HP 8509A/B can follow the
polarization state changes.
For the HP11896A p olarization controller, automatic p olarization
scan rates of #4 to #5 are recommended depending on the PDL of
test
the
Saving the Measurement Results
Saving data capability is not available for this measurement.
measuremen
the
to
olarization
device.
Figure
t
2-65.
is complete.
previous
polarization
troller
con
Measurement
The screen
illustration.
troller
con
the
and
is
displa
on
used,
v
a
y
Results
our
y
the
eraging
computer
scanning
factor
sp
of
should
of
eed
HP
the
Making
Measurements
2-59
Page 92

Jones Matrix Measurement
Jones Matrix Measurement
A Jones matrix is a complex two-by-two matrix that is measured by
the analyzer and mathematically describes the polarization transfer
function of an optical component at a sp ecic optical wavelength.
The Jones matrix of a lightwavecomponent or device can be used
to predict the SOP of an optical output signal given a sp ecic SOP
input signal. It is also used by the analyzer to calculate PDL and
PMD and a polarization reference frame.
This measurement section explains how to measure the Jones matrix
of a test device. A sample data display is shown in the following
gure.
2-60
Making
Figure 2-66.
Example of data display for a Jones matrix measurement
Measurements
Page 93

Jones Matrix Measurement
Basic Measurement
Setting up the System
The following measurement procedure illustrates the simplest and
most straightforward path in using the HP 8509A/B Lightwave
Polarization Analyzer operating system software to make a Jones
Matrix measurement.
Connect your measurement system as outlined in the following
illustration. The HP 11896A polarization controller is recommended
as the polarization adjuster for this application.
ACCURACY ENHANCEMENT NOTE
All ber cables must be tap ed down to preventanymove-
Mo
t.
men
accuracy.
emen
v
of
t
cables ma
y jeopardize
measurement
Figure 2-67. Measurement Setup
Making
Measurements
2-61
Page 94

Jones Matrix Measurement
External Source Preparation
Before performing the measurement, you must select an optical
source. The following procedure will guide you through the process.
Figure 2-68. System Menu
NNNNNNNNNNNNNNNNNNNN
Select
N
N
N
N
N
N
N
N
N
N
N
N
N
N
N
N
Optical
System
N
N
N
N
NN
NN
NN
NN
N
Source
the main
from
NN
N
N
N
N
N
N
N
N
N
N
N
N
N
.
men
select
then
and
u,
Figure 2-69. Optical Source Setup
Select the external laser source and set the CW wavelength for your
measurement. Use the default power level or set as desired. If the
screen on
4
select
Done
y
our
.
5
computer
lo
oks
similar
to
the
previous
illustration,
2-62
Making
Measurements
Next, set the HP8509B to use external p olarizers. In the main
window, select the System men
u and P
olarizers. When the P
controls appear, select External with the mouse and select
olarizers
4
5
Done
.
The next step is to adjust the source p olarization so that
approximately circularly polarized light is applied to the polarizers.
To do this we create a temporary polarization reference frame.
degrees,
0
y
Set
and
the
select
external
mark
reference
on
A
er
the
olarizer
p
main
to
windo
starting
a
w.
angle,
sa
Page 95

Jones Matrix Measurement
Set the p olarizer approximately 60 degrees from the original position
and select marker B. Carefully remove the rotatable reference
polarizer.
Measurement
Procedure
Select
4
2pt Ref
5
and
4
Apply 2pt
5
with the mouse. Adjust the source
assembly polarization adjuster until the active pointonthePoincare
sphere approaches a pole and the absolute value of the s3 marker is
greater than 0.90. The active p oint is easier to see by marking the
current p oint (select Display and then Mark CurrentPoint).
Un-apply the 2-pt reference before pro ceeding. Replace the reference
polarizer in the light beam.
FOR MORE INFORMATION
More information on State of Polarization (SOP) and
Degree of Polarization (DOP) may be found in the glossary.
our
y
e
mak
going
tal.
and
the
to
to measure
op
the
in
residual
olarization
p
en
a
eam
b
PDL
receiv
b
of
er
oin
p
this
t
A
measuremen
rst
quarter-w
The
A
1.
a
measuremen
polarization
mathematically
path
the
inside
the
measuremen
our
y
t
t.
retarder
e
v
has
t
reference
remo
the
from
HP8509A/B.
our
or
F
oriented
o
w
t
ving
reference
t
purp
45
parts:
frame
the
p
ready
system
oses
is
is
are
e
w
horizon
to
established
birefringence
olarizer
to
y
Matrix
Jones
eam,
b
en
op
the
op
is
olarizer
p
in
ened
and
angles
the
used
device
to
measured
is
create the
the
at
reference
The test
2.
measuremen
same
three
device
t
reference
is
windo
inserted
w
frame.
Establish the Polarization Reference Frame
The Jones matrix of the test device is measured and expressed within
the context of the angular relationship of the test device to the rst,
it
this
e
b
tal,
able to
horizon
or
ma
y
polarizer orien
reference
a
align
tation.
olarizer
p
particular
osition.
p
axis
of
the
In
some
test
applications,
device
with
1. Place the reference polarizer in the open beam, allowing enough
space follo
wing the p olarizer to
2. Rotate the polarizer to the position y
insert the test device.
ou wish to dene as
horizontal. Select marker A.
Making
Measurements
2-63
Page 96

Jones Matrix Measurement
ACCURACY ENHANCEMENT NOTE
From this p oint on, the ber path and optics b etween the
reference p olarizer and the HP 8509A/B must not move. Movement
will degrade measurement accuracy.
3. Rotate the reference polarizer by 60 degrees. Select marker B.
4. Rotate the reference polarizer another 60 degrees, for a total of
120 degrees from the initial orientation. Select marker C.
CAUTION
Making the Measurement
5. From the Markers area, select
4
3pt Ref
5
and then
4
Apply 3pt
5
.
Observe proper connection techniques. Refer to the \Lightwave
Connector Care" chapter in this manual.
Selection
then
select
Select
N
N
N
N
N
N
N
N
N
N
N
Figure
NN
NN
NN
N
N
N
N
N
N
N
N
N
N
N
N
Measurement
N
N
N
N
N
N
N
NN
NN
NN
NN
N
N
N
N
N
N
N
Jones
2-70.
N
N
N
N
N
N
N
N
N
N
N
N
N
N
N
NN
N
N
N
N
N
N
N
NN
N
N
N
from the
N
N
N
N
NN
NN
NN
N
N
N
N
Matrix
Measurement
main men
u, and
Jones Matrix ... F4
2-64
Making
Measurements
Page 97

Jones Matrix Measurement
w
Windo
Measuremen
reference frame
reference
rst
the
to
e
select
then
and
select
then
and
lo
Select
Insert
the
with
olarizer
p
the
Set
at
Meas
the external
Set
at
Meas
test
2-71.
P
device
Figure
External
the
desired angular
setting.
external
0.0
p
from
polarizer
from
60.0
Jones
olarizers
to
in
olarizer
Jones
the
Jones
the
Matrix
Delta
and
olarization
p
the
tation
orien
to
angle
Matrix windo
to
angle
Matrix
Measurement
ransmission
T
relativ
degrees
0
w.
degrees
60
w.
windo
Set the external polarizer angle to 120 degrees and then select
Meas at 120.0
from the Jones Matrix window.
t.
cation
Making
Measurements
2-65
Page 98

Jones Matrix Measurement
measuremen
our
Y
similar
ok
lo
matrix
measuremen
magnitude
can
alues
v
Matrix
windo
to
and
e
b
the
phase
view
w.
Figure
complete.
is
t
previous
tdata
in
y
b
ed
Measurement
2-72.
illustration.
b
can
radians
selecting
The
e
and
sho
ol
P
screen
Notice
in
wn
degrees.
values
Dep
Results
y
on
three
olarization
P
computer
our
the Jones
that
formats:
from
the
x+jy
dep
Jones
should
and
enden
t
2-66
Making
Measurements
Page 99

Concepts
The Relative Jones Matrix
Jones Matrix Measurement
The HP8509A/B determines the Jones matrix to within a complex
constant which relates to the absolute delay of the signal through the
device under test. In other words, the Jones matrix only describ es
the dierences b etween input and output light, not the time delay.
When the Jones matrix is measured in the fashion described in
the basic measurement example above, the results are normalized
before they are displayed. In general, the four elements of the matrix
are normalized to the value in the lower right hand corner. Both
amplitude and angle are normalized. Therefore, the lower right
elementmay be displayed as 1 + j0 in the case of real and imaginary
format, or 1.0 at an angle of 0.0 in the case of p olar format. If the
amplitude of the lower right elementisvery small and therefore
vulnerable to noise, the instrument normalizes to one of the other
the
elements
of the
matrix. This
will b
apparen
e
t
from
insp
ection
of
results.
should
ts
selected
as
de
reference
frame
this measuremen
path
the
in
dieren
use
parameter
the
in
s3.
app
The
sign
of
s3
matrix
Jones
de
Max,
es
do
returned
Delta,
mo
matrix
birefringence
HP8509A/B.
the
reference
Dieren
of
t
normalized
HP8509A/B
measuremen
mo
Min
a
use
not
from
PDL
and
texts
es
Stok
wn
sho
is
Description of the Jones Matrix Measurement Algorithm
The HP 8509B automatically calculates the Jones matrix of a
component using three dierent, known, linear states of p olarization
(typically at 0, 60 and 120 degrees). These are created using either
the
wn
sho
as
stimulates the DUT while the output
olarizer
p
plates of
ternal
in
the
rotatable,
olarizer
p
linear
of polarization individually
polarization is measured and recorded. It has been sho
Jones that this polarization
information is sucien
8509 to calculate a Jones matrix. The simple case where the kno
polarized inputs are 0,
45, and 90 degrees in sho
gure.
not
the
in
and
t
w
et
b
con
t
The
endix to
8509B
HP
the
in
erformed
p
e
b
Jones
the v
de
mo
reference
een
tions
en
v
v
con
this man
follo
using
Matrix
the
of
alues
inuenced
are
olarizer
p
the
for
used
tion
en
ual.
external,
an
or
gure. Eac
wing
wn b
t for the HP
wn in the follo
windo
Jones
sign
in
the
This
w.
y
b
and
the
state
h
yR.C.
wn
wing
Making
Measurements
2-67
Page 100

Timed Measurements
Application
of
the
Jones
Comparing
Matrix
Jones
A
output
signal
quarter-
a
create
horizon
the
matrix
of
state
wn.
kno
is
v
a
w
t-hand
righ
a
tal-linear,
output
a
for
olarization
p
or
F
retarder,
e
circular,
olarized
p
Figure
Jones V
ecic
sp
ectors to
device
en
giv
that
example, Jones
ted
orien
olarized
p
a
w
t
ligh
2-73.
can
matrix
45
e
v
3kno
e
b
the
degrees
output
signal.
wn input
pro
to
used
ector
v
Jones
calculations
horizon
to
excited
when
Jones
ject
the input
of
predict
tal,
the
will
y
b
ectors
V
that
a
2-68
Making
Figure 2-74. Jones Matrix Application
Measurements
 Loading...