


Errata
8153A Lightwave Multimeter Operating and Programming Manual
08153-90011
September 1, 1999
Title & Document Type:
Manual Part Number:
Revision Date:
HP References in this Manual
This manual may contain references to HP or Hewlett-Packard. Please note that HewlettPackard's former test and measurement, semiconductor products and chemical analysis
businesses are now part of Agilent Technologies. We have made no changes to this
manual copy. The HP XXXX referred to in this document is now the Agilent XXXX.
For example, model number HP8648A is now model number Agilent 8648A.
About this Manual
We’ve added this manual to the Agilent website in an effort to help you support your
product. This manual provides the best information we could find. It may be incomplete
or contain dated information, and the scan quality may not be idea l. If we find a better
copy in the future, we will add it to the Agilent website.
Support for Your Product
Agilent no longer sells or supports this product. You will find any other available
product information on the Agilent Test & Measurement website:
www.tm.agilent.com
Search for the model number of this product, and the resulting product page will guide
you to any available information. Our service centers may be able to perform calibration
if no repair parts are needed, but no other support from Agilent is available.

Operating and Programming Manual
HP 8153A Lightwave Multimeter
SERIAL NUMBERS
This manual applies to all instruments with Serial No. 2946G00476 and higher.
ABCDE
HP Part No. 08153-90011
Printed in Germany
Third Edition
E0199

This document contains proprietary
information which is protected by
copyright. All rights are reserved.
No part of this document may be
photocopied, reproduced, or
translated to another language
without the prior written consent of
Hewlett-Packard GmbH.
c
Copyright 1999 by:
Hewlett-Packard GmbH
Herrenberger Str. 130
7030 Boeblingen
Germany
Subject Matter
The information in this document is
subject to change without notice.
Hewlett-Packard makes no warranty
of any kind with regard to this
printed material, including, but not
limited to, the implied warranties of
merchantability and tness for a
particular purpose.
Hewlett-Packard shall not be liable
for errors contained herein or for
incidental or consequential damages
in connection with the furnishing,
performance, or use of this material.
Printing History
New editions are complete revisions
of the manual. Update packages,
contain additional and replacement
information to be incorporated into
the manual by the customer. The
date on the title page only changes
when a new manual is published.
When an edition is reprinted, all the
prior updates to the edition are
incorporated.
Notices
Warranty
This Hewlett-Packard instrument
product is warranted against defects
in material and workmanship for a
period of one year from date of
shipment. During the warranty
period, HP will, at its option, either
repair or replace products which
prove to be defective.
For warranty service or repair, this
product must be returned to a service
facility designated by HP. Buyer shall
prepay shipping charges to HP and
HP shall pay shipping charges to
return the product to Buyer.
However, Buyer shall pay all shipping
charges, duties, and taxes for
products returned to HP from
another country.
HP warrants that its software and
rmware designated by HP for use
with an instrument will execute its
programming instructions when
properly installed on that instrument.
HP does not warrant that the
operation of the instrument,
software, or rmware will be
uninterrupted or error free.
Limitation of Warranty
The foregoing warranty shall not
apply to defects resulting from
improper or inadequate maintenance
by Buyer, Buyer-supplied software or
interfacing, unauthorized
modication or misuse, operation
outside of the environmental
specications for the product, or
improper site preparation or
maintenance.
No other warranty is expressed or
implied. Hewlett-Packard specically
disclaims the implied warranties of
Merchantability and Fitness for a
Particular Purpose.
Exclusive Remedies
The remedies provided herein are
Buyer's sole and exclusive remedies.
Hewlett-Packard shall not be liable
for any direct, indirect, special,
incidental, or consequential
damages whether based on contract,
tort, or any other legal theory.
Assistance
Product maintenance agreements
and other customer assistance
agreements are available for
Hewlett-Packard products.For any
assistance contact your nearest
Hewlett-Packard Sales and Service
Oce.Addresses are provided at
the back of this manual.
Certication
Hewlett-Packard Company certies
that this product met its published
specications at the time of
shipment from the factory.
Hewlett-Packard further certies
that its calibration measurements
are traceable to the United States
National Institute of Standards and
Technology, NIST (formerly the
United States National Bureau of
Standards, NBS) to the extent
allowed by the Institutes's
calibration facility, and to the
calibration facilities of other
International Standards Organization
members.
Control Serial Number
First Edition applies directly to all
instruments.
First Edition : E0590
Second Edition : E1191, E0492,
E1192, E1293
Third Edition : E1094, E0796, E0199

Safety Considerations
The Model HP 8153A is a Class 1 instrument (that is
, an instrument with an
exposed metal chassis directly connected to earth via the power supply cable).
The symbol used to show a protective earth terminal in the instrument is
.
Before operation, you should review the instrument and manual, including the
red safety page, for safety markings and instructions.You must follow these to
ensure safe operation and to maintain the instrument in safe condition.
Some HP 8153A circuits are powered whenever the instrument is connected to
the AC power source.To disconnect from the line power, disconnect the power
cord either at the rear power-inlet or at the AC line-power source (receptacle).
One of these must always be accessible. If the instrument is in a cabinet, it must
be disconnected from the line power by the system's line-power switch.
Warning
To avoid hazardous electrical shock, do not perform
electrical tests when there are signs of shipping damage to
any portion of the outer enclosure (covers, panels, etc.).
Line Power Requirements
The HP 8153A can operate from any single-phase A
C power source that supplies
between 100V and 240V at a frequency in the range from 40 to 60Hz. The
maximum power consumption is 55VA with all options installed.
The fuse used by this instrument is T1A / 250V (slow) (HP Part No. 2110-0007).
Changing the fuse should be carried out only by a qualied electrician or by HP
service personnel as it is necessary to open the instrument.
Line Power Cable
In accordance with international safety standards, this instrument has
a three-wire power cable. When connected to an appropriate AC power
receptacle, this cable earths the instrument cabinet. The type of power cable
shipped with each instrument depends on the country of destination. Refer to
Figure 0-1 for the part numbers of the power cables available.
iii

Figure 0-1. Line Power Cables - Plug Identication
Warning
To avoid the possibility of injury or death, you must
observe the following precautions before switching on the
instrument.
If this instrument is to be energized via an
autotransformer for voltage reduction, ensure that the
Common terminal connects to the earthed pole of the
power source.
Insert the power cable plug only into a socket outlet
provided with a protective earth contact. Do not negate
this protective action by the using an extension cord
without a protective conductor.
Before switching on the instrument, the protective
earth terminal of the instrument must be connected to a
protective conductor.You can do this by using the power
cord supplied with the instrument.
It is prohibited to interrupt the protective earth
connection intentionally.
iv

The following work should be carried out by a qualied electrician, and all local
electrical codes must be strictly observed. If the plug on the cable does not t
the power outlet, or if the cable is to be attached to a terminal block, cut the
cable at the plug end and rewire it.
The color coding used in the cable depends on the cable supplied. If you are
connecting a new plug, it should meet the local safety requirements and include
the following features:
Adequate load-carrying capacity (see table of specications).
Ground connection.
Cable clamp.
Operating Environment
Warning
Input/Output Signals
Caution
The HP 8153A is not designed for outdoor use.To prevent
potential re or shock hazard, do not expose the HP 8153A
to rain or other excessive moisture.
A maximum of 15V can be applied as an external voltage to any
of the BNC connectors.
v

Initial Safety Information for Laser Source Modules
The Specications for these modules are as follows:
HP 81551MM HP 81552SM HP 81553SM HP 81554SM
Laser Type
FP-Laser FP-Laser FP-Laser Dual FP-Laser
InGaAsP InGaAsP InGaAsP InGaAsP
Laser Class
According to IEC 825 3A 3A 3A 3A
(Europe)
According to 21 CFR 1040.10 1 1 1 1
(Canada, Japan, USA)
Output Power
Beam Diameter
Numerical Aperture
Wavelength
>
-2dBm
>
0dBm
>
0dBm
>
-1dBm
50m 9m 9m 9m
0.2 0.1 0.1 0.1
850610nm 1310620nm 1550620nm 1310/1550620nm
Note
Note
vi
Canada, Japan, USA
The laser safety warning labels are xed on the laser module.
Europe
A sheet of laser safety warning labels are included with the
laser module.You
MUST
stick the labels in the local language
onto the outside of the mainframe, in a position where they are
clearly visible to anyone using the instrument.
You
MUST
Center for repair and calibration.
The laser module has built in safety circuitry that will disable the optical output
in the case of a fault condition.
return instruments with malfunctioning laser boxes to a HP Service
Warning
Warning
Warning
Warning
Use of controls or adjustments or performance of
procedures other than those specied for the laser source
may result in hazardous radiation exposure.
Refer Servicing only to qualied and authorized personnel.
Do not enable the laser when there is no ber attached to
the optical output connector.
The optical output connector is at the bottom, on the laser
module front panel.
The laser is enabled by pressing the grey button above the
optical output connector on the front panel. The laser is
enabled when the green LED on the front panel of the laser
module is lit.
Under no circumstances look into the end of an optical
cable attached to the optical output when the device is
operational.
The laser radiation is not visible to the human eye, but it
can seriously damage your eyesight.
vii

Sicherheitsinformation fur Laser Quellen
Die Spezikationen f ur die Lasereinsch ube sind wie folgt:
HP 81551MM HP 81552SM HP 81553SM HP 81554SM
Laser Typ
FP-Laser FP-Laser FP-Laser Dual FP-Laser
InGaAsP InGaAsP InGaAsP InGaAsP
Laser Klasse
Entsprechend IEC 825 3A 3A 3A 3A
(Europa)
Ausgangsleistung
Strahldurchmesser
Numerische Apertur
Wellenl
ange
>
-2dBm
>
0dBm
>
0dBm
>
-1dBm
50m 9m 9m 9m
0.2 0.1 0.1 0.1
850610nm 1310620nm 1550620nm 1310/1550620nm
Hinweis
Europa
Ein Blatt mit Laser Warnaufklebern ist jedem Lasereinschub
beigef ugt. Die Aufkleber m ussen in der Landessprache,fur den
Anwender gut sichtbar, an der Aussenseite des Grundger ates
angebracht werden.
Defekte Lasereinsch ube m ussen zur Reparatur oder zur Kalibration an ein HP
Service B uro geschickt werden.
Der Lasereinschub hat eine eingebaute Sicherheitsschaltung die den
Laserausgang im Falle einer St orung abschaltet.
viii

Warnung
Bedienung, Abgleicharbeiten oder die Durchfuhrung von
Tests, die nicht im Handbuch angegeben sind, konnen zum
Austritt gefahrlicher Strahlung fuhren.
Warnung
Warnung
Warnung
Reparaturarbeiten durfen nur von qualiziertem und
bevollmachtigtem Personal durchgefuhrt werden.
Laser nicht ohne angeschlossenen Glasfaserkabel
einschalten.
Der optische Ausgang bendet sich am unteren Teil der
Einschubfrontplatte. Mit dem daruberliegenden grauen
Druckschalter wird der Laser ein- bzw. ausgeschaltet. Bei
eingeschaltetem Laser leuchtet eine grune Anzeige an der
Frontplatte des Einschubes.
Wenn der Laser eingeschaltet ist, darf unter keinen
Umstanden in das Ende des optischen Kabels oder in den
Laserausgang am Gerat geschaut werden.
Der Laserstrahl ist fur das menschliche Auge unsichtbar,
kann aber das Sehvermogen ernsthaft verletzen.
ix

Informations et Consignes de Securite Relativesa l'Utilisation
des Lasers.
Les Sp ecications des Modules Laser sont les Suivantes:
HP 81551MM HP 81552SM HP 81553SM HP 81554SM
Type de Laser
FP-Laser FP-Laser FP-Laser Dual FP-Laser
InGaAsP InGaAsP InGaAsP InGaAsP
Classe du Laser
Conforme au STD IEC 825 3A 3A 3A 3A
(Europe)
Conforme au STD CFR 1040.10 1 1 1 1
(Canada, Japan, USA)
Puissance de Sortie
Diam^etre du Faisceau
Ouverture Numerique
Longueur d'Onde
>
-2dBm
>
0dBm
>
0dBm
>
-1dBm
50m 9m 9m 9m
0.2 0.1 0.1 0.1
850610nm 1310620nm 1550620nm 1310/1550620nm
Remarque
Remarque
x
Canada, Japan, USA
Les etiquettes de s ecurit e sont ach ees sur le module laser.
Europe
Les etiquettes de s ecurit e sont incluses dans le module laser.
Il est obligatoire de coller une etiquette en langage local a

l' exterieur de l'appareil de telle sorte qu'elle soit parfaitement
visible par l'utilisateur.
Il est obligatoire de retourner tout appareil pr
de fonctionnement du laser uniquement
esentant un d efaut
a un centre de r eparation
Hewlett-Packard.
Le module laser comporte un syst eme de s ecurit e mettant hors service la sortie
optique en cas de malfonctionnement du laser.
Attention
L'utilisation du laser en dehors de ses limites de
performances et des procedures denies par HP peut
conduirea une exposition dangereuse de l'utilisateur aux
radiations.
Attention
Seul le personnel autorise par HP est qualie pour
intervenir sur le laser.
Attention
Ne pas mettre le laser sous tension sans s'^etre assure
qu'une bre optique est bien xee sur le connecteur.
Le connecteur de sortie optique est situe au bas de la face
avant du module laser.
La mise en service du laser s'eectue par la pression du
bouton gris situe au dessus de la sortie optique en face
avant du module. L'illumination de la LED verte indique que
le laser est en activite.
Attention
En aucun cas ne tenter de regarder l'extremite de la bre
optique attachee au connecteur lorsque le laser est en
activite.
Bien que la lumiereemise par le laser ne soit pas visible elle
peut cependant^etre dangereuse pour la vue.
xi

Lasersakerhet
Till HP 8153A optiska m atsystem kan man installera en lasermodul. P adetta
vis kan HP 8153A optiska m atsystem ocks a vara en laserapparat, som d a
klassiceras till laserklass 3A.
I Finland har apparatens lasers akerhet inspekterats av Institutet f or
Arbetshygien och typgodk ants av Arbetsskydstyrelsen. Vid inspektionen har
apparaten klassicerats enligt de best ammelser som anges i statsr adets beslut Nr.
472/1985 och standard SFS-IEC 825.
Om man till HP 8153A m atsystem har anlagt en lasermodul eller om man senare
installerar en lasermodul, m aste till apparaten bifogas varningsskyltar enligt
standard SFS-IEC 825:
Bruksanvisningar
Varning
Vid anv andingen av apparaten b or f oljande varningsanvisningar efterf oljas, som
pa detta s att garanterar s akerhet.
Aktivera ej lasern, om inte den optiska kapeln ar kopplad till str al oppningen.
Laserstr alen aktiveras genom att trycka p a den gr aa knoppen ovanf or
str al oppningen. D arefter informerar den gr ona indikationslampan om att
lasern ar i funktion.
xii
Om apparaten anvands pa annat sattan vad i
bruksanvisningar specicerats, kan anvandaren utsattas for
osynlig laserstralning av laserklass 3A.
Titta aldrig in i den till str al oppningen kopplade optiska kabeln eller berns
losa del, n ar lasern ar i funktion.
Underhall
I apparaten nns ej s adana delar, som anv andaren kan underh alla. N ar man
uppt acker att fel i apparaten har uppst att eller att apparaten ej fungerar
felfritt, b or apparaten s andas till HP:s verkstad f or reparering och service.
I lasermodulen nns en inbyggd s akerhetskrets, som s atter laserstr alningen ur
funktion n ar fel uppst ar i apparaten.
xiii

Laserturvallisuus
HP 8153A optiseen yleismittariin voidaan asentaa pistoyksikk on a laserl ahde.
Tall oin HP 8153A optinen yleismittari toimii laserlaitteena joka kuuluu
turvalisuusluokkaan 3A.
Laitteen on tarkastanut Suomessa laserturvallisuuden osalta Ty oterveyslaitos ja
tyypihyv aksynyt Ty osuojeluhallitus.Tarkastuksessa laitteen turvallisuusluokka
on m aaritetty valtioneuvoston p aat oksen N:o 472/1985 ja standardin SFS-IEC
825 mukaisesti.
Mik ali HP 8153A mittauslaitteeseenne on asennettu laserl ahde tai siihen
my ohemmin asennetaan em. laserl ahde, laite on varustettava laserl ahteen
mukana toimitettavilla, standardin SFS-IEC 825 mukaisilla varoitusmerkinn oill a:
Kaytto
Varoitus
Kaytt aess asi laitetta noudata seuraavia varo-ohjeita, jotka takaavat laitteen
turvallisen k ayt on:
al a aktivoi lasers adett a, ellei optinen kaapeli ole kytkettyn asateen
ulostuloliittimeen. Lasers ade aktivoidaan painamalla ulostuloliittimen
yl apuolelle sijoitettua harmaata kytkint a. T all oin vihre a merkkivalo ilmaisee
lasers ateen toimivan.
xiv
Laitteen kayttaminen muulla kuin kayttoohjeesa mainitulla
tavalla saattaa altistaa kayttajan luokan 3A nakymattomalle
lasersateilylle.

al a koskaan katso ulostuloliittimeen kytketyn optisen kaapelin tai kuidun
sis aan sen vapaana olevasta p aast a, kun laite on toiminnassa.
Huolto
Laitteessa ei ole k aytt aj an huollettavissa olevia kohteita. Laite tulee l ahett aa
korjattavaksi ja huollettavaksi HP:n huoltokorjaamoon, mik ali laite vikaantuu
tai sen havaitaan toimivan virheellisesti.
Laserl ahteess aonmyos sis aanrakennettu turvapiiri, joka est aa lasers ateen
toiminnan laitteen vikaantuessa.
xv

Introduction
This manual is arranged into four categories:
Getting Started
Descriptions of operating principles, to make you familiar with the
instrument. Chapter 1.
Quick Reference Guide
Local control and remote control programming information. Chapters 2, 3, 4,
5, 6, 7, 8, and 9.
Reference Data
Supporting information of a non-operational nature. Appendix A, B,C,D,E,
F, G, H, and I.
Customer Assistance
Sales and Service information. Appendix J.
xvi

Contents
1. Getting Started
The HP 8153A System ..................... 1-1
A Quick Overview . . . . . . . . . . . . . . . . . . . . . . . 1-2
The Keyboard . . . . . . . . . . . . . . . . . . . . . . . . 1-2
Measure Mode . . . . . . . . . . . . . . . . . . . . . . . 1-2
Menu Mode ...... ...... ....... ..... 1-3
The Display . . . . . . . . . . . . . . . . . . . . . . . . .
A Sample Session ...... ...... ........ ... 1-8
Hardware Setup . . . . . . . . . . . . . . . . . . . . . . .
Switching On and Recalling the Standard Setting ....... 1-8
Making A Power Measurement ................ 1-9
Logging Data .. ...... ........ ...... .. 1-11
Examining the Data .. ...... ........ ..... 1-12
Plotting Data ........................ 1-13
2. Measure Mode
The Chan Key . . . . . . . . . . . . . . . . . . . . . . . . . 2-1
The Mode Key . . . . . . . . . . . . . . . . . . . . . . . . . 2-1
The Param Key ...... ...... ...... ...... 2-2
Entry Status . . . . . . . . . . . . . . . . . . . . . . . . . 2-2
Default Values . . . . . . . . . . . . . . . . . . . . . . . . 2-2
Parameter List . . . . . . . . . . . . . . . . . . . . . . . . 2-2
...... ...... ........ ..... .... 2-2
CAL ........ ...... ....... ...... 2-3
T............................. 2-3
REF............................ 2-5
ATT...... ...... ....... ...... ... 2-6
AUX ........................... 2-7
The Disp!RefKey....................... 2-7
ThedBKey .. ........ ...... ..... ..... 2-8
Using
4dB5
with a Two Sensor Instrument ........... 2-8
Using
4dB5
with a One Sensor Instrument ...... ..... 2-9
1-6
1-8
Contents-1

The dBm/W Key . . . . . . . . . . . . . . . . . . . . . . . . 2-9
The Zero Key ......................... 2-9
TheNDigKey......................... 2-11
The Range Keys . . . . . . . . . . . . . . . . . . . . . . . . 2-11
The AutoKey ........................ 2-13
TheUpKey......................... 2-13
The Down Key ....................... 2-13
The Analog Output ..................... 2-13
The Modify Keys . . . . . . . . . . . . . . . . . . . . . . . . 2-14
Editing Discrete Valued Parameters . . . . . . . . . . . . . . 2-14
Editing Continuous Valued Parameters ............ 2-14
Editing Units ...... ...... ....... .... 2-14
3. Menu Mode
The Chan Key . . . . . . . . . . . . . . . . . . . . . . . . . 3-1
The Mode Key . . . . . . . . . . . . . . . . . . . . . . . . . 3-1
The System Key . . . . . . . . . . . . . . . . . . . . . . . . 3-2
The Modify Keys . . . . . . . . . . . . . . . . . . . . . . . . 3-2
The Loss Key ......................... 3-2
Preparation ...... ...... ........ ..... 3-2
Running the Loss Application . . . . . . . . . . . . . . . . . 3-3
The Record Key . . . . . . . . . . . . . . . . . . . . . . . . 3-5
Preparation ...... ...... ........ .....
The Stability Application . . . . . . . . . . . . . . . . . . . .
T TOTAL .......... ...... ...... .... 3-8
AUTODUMP . . . . . . . . . . . . . . . . . . . . . . . . . 3-8
Running the Stability Application . . . . . . . . . . . . . . . 3-9
The Logging Application ...... ...... ........ 3-10
SAMPLES . . . . . . . . . . . . . . . . . . . . . . . . . . 3-10
AUTODUMP . . . . . . . . . . . . . . . . . . . . . . . . . 3-11
START .. ...... ...... ..... ........ 3-12
THRESHLD ......................... 3-12
Running the Logging Application . . . . . . . . . . . . . . . 3-13
The Manual Logging Application ................ 3-13
Running the Manual Logging Application .... ...... . 3-13
The Plot Application . . . . . . . . . . . . . . . . . . . . . . 3-14
AUTOSCAL ......................... 3-15
Y MIN ........................... 3-15
YMAX ........................... 3-15
COMMENT ...... ...... ........ ..... 3-16
Running the Plot Application . . . . . . . . . . . . . . . . . 3-16
3-6
3-7
Contents-2

Reading the Plot . . . . . . . . . . . . . . . . . . . . . . . 3-16
The Print Application ..................... 3-19
AUTOSCAL .. ...... ...... ........ ... 3-20
Y MIN ........................... 3-20
YMAX ...... ...... ....... ...... .. 3-21
COMMENT ...... ...... ........ ..... 3-21
Running the Print Application .......... ...... 3-22
Reading the Printout . . . . . . . . . . . . . . . . . . . . . 3-22
The MinMax Applications ................... 3-25
MODE . . . . . . . . . . . . . . . . . . . . . . . . . . . . 3-27
SAMPLES . . . . . . . . . . . . . . . . . . . . . . . . . . 3-27
Running the MinMax Application . . . . . . . . . . . . . . . 3-27
The More Key . . . . . . . . . . . . . . . . . . . . . . . . . 3-28
The Show Application .... ...... ........ ... 3-28
MAXIMUM ...... ...... ........ ..... 3-28
MINIMUM . . . . . . . . . . . . . . . . . . . . . . . . . . 3-28
DIFF ...... ...... ........ ..... ... 3-29
AVERAGE.......................... 3-29
#1 ...... ........ ...... ...... ... 3-29
The Alignment Application . . . . . . . . . . . . . . . . . . . 3-29
Preparation . . . . . . . . . . . . . . . . . . . . . . . . . 3-29
TYPE . . . . . . . . . . . . . . . . . . . . . . . . . . . . 3-30
DELTA ...........................
MAXPOWER ........................
3-31
3-31
Running the Alignment Application . . . . . . . . . . . . . . 3-31
4. System Mode
The Mode Key . . . . . . . . . . . . . . . . . . . . . . . . . 4-1
The Modify Keys . . . . . . . . . . . . . . . . . . . . . . . . 4-1
The System Key . . . . . . . . . . . . . . . . . . . . . . . . 4-2
RECALL .......................... 4-2
The Module Type ..................... 4-3
The Location ....................... 4-3
The Channel . . . . . . . . . . . . . . . . . . . . . . . . 4-3
STORE ........ ...... ........ ..... 4-4
The Module Type ..................... 4-5
The Channel . . . . . . . . . . . . . . . . . . . . . . . . 4-5
The Location ....................... 4-5
HPIB ............................ 4-5
ADDRESS . . . . . . . . . . . . . . . . . . . . . . . . . 4-5
MODE . . . . . . . . . . . . . . . . . . . . . . . . . . . 4-6
Contents-3

LANGUAGE.... ........ ..... ...... . 4-6
DISPLAY ...... ...... ...... ...... .. 4-7
BRIGHT . . . . . . . . . . . . . . . . . . . . . . . . . . 4-7
DATETIME ...... ...... ...... ...... . 4-7
MM/DD/YY ........................ 4-8
HH:MM:SS . . . . . . . . . . . . . . . . . . . . . . . . . 4-8
5. Programming the HP 8153A
Introduction . . . . . . . . . . . . . . . . . . . . . . . . . . 5-1
The HP 8153A HP-IB Capabilities . . . . . . . . . . . . . . . . 5-2
HP-IB Display Indicators . . . . . . . . . . . . . . . . . . . . 5-2
The Parser .......................... 5-3
Parser Type . . . . . . . . . . . . . . . . . . . . . . . . . 5-3
Synchronization . . . . . . . . . . . . . . . . . . . . . . . 5-3
Clearing the Input Queue . . . . . . . . . . . . . . . . . . . 5-4
Accepted Characters . . . . . . . . . . . . . . . . . . . . . 5-4
HP-IB Bus Commands .................... 5-4
HP-IB Priority . . . . . . . . . . . . . . . . . . . . . . . . . 5-6
TMSL . . . . . . . . . . . . . . . . . . . . . . . . . . . . . 5-6
Setting the HP-IB Address ........ ...... ..... 5-8
Syntax Diagram Conventions . . . . . . . . . . . . . . . . . . 5-9
6. Common Commands
Common Status Information .................. 6-1
SRQ, The Service Request .................. 6-3
Input Queue . . . . . . . . . . . . . . . . . . . . . . . . . 6-3
Output Queue . . . . . . . . . . . . . . . . . . . . . . . . 6-3
Error Queue . . . . . . . . . . . . . . . . . . . . . . . . . 6-3
*CLS .......... ...... ........ .... 6-4
*ESE ............................ 6-5
*ESE? . . . . . . . . . . . . . . . . . . . . . . . . . . . . 6-6
*ESR? . . . . . . . . . . . . . . . . . . . . . . . . . . . . 6-6
*IDN? . . . . . . . . . . . . . . . . . . . . . . . . . . . . 6-7
*OPC . . . . . . . . . . . . . . . . . . . . . . . . . . . . 6-8
*OPC? ........................... 6-9
*OPT? .... ...... ....... ...... .... 6-9
*RST .......... ...... ........ .... 6-10
*SRE ...... ...... ........ ...... .. 6-11
*SRE? . . . . . . . . . . . . . . . . . . . . . . . . . . . . 6-12
*STB? . . . . . . . . . . . . . . . . . . . . . . . . . . . . 6-13
*TRG . . . . . . . . . . . . . . . . . . . . . . . . . . . . 6-14
Contents-4

*TST? . . . . . . . . . . . . . . . . . . . . . . . . . . . . 6-14
*WAI ............................ 6-14
7. HP-IB Status Commands
The Status Registers . . . . . . . . . . . . . . . . . . . . . . 7-1
The Condition Registers ................... 7-2
The Transition Filters .................... 7-2
The Event Registers .. ...... ........ ..... 7-2
The Enable Registers . . . . . . . . . . . . . . . . . . . . . 7-2
The Status Commands ...... ...... ........ . 7-3
STATus:PRESet ....................... 7-3
STATus:<node>:CONDition? ................. 7-4
STATus:<node>:ENABle . . . . . . . . . . . . . . . . . . . 7-5
STATus:<node>:ENABle? .................. 7-5
STATus:<node>[:EVENt]? .................. 7-5
STATus:<node>:NTRansition . . . . . . . . . . . . . . . . . 7-6
STATus:<node>:NTRansition? ................ 7-6
STATus:<node>:PTRansition . . . . . . . . . . . . . . . . . 7-6
STATus:<node>:PTRansition? ................ 7-7
The Operation Status . . . . . . . . . . . . . . . . . . . . . . 7-7
The Operation Status Commands ............... 7-9
The OPERation node . . . . . . . . . . . . . . . . . . . . . . 7-10
The OPERation:SETTling Node . . . . . . . . . . . . . . . .
The OPERation:SETTling:LPELTier Node .......... 7-11
The OPERation:SETTling:HPELTier Node ........ .. 7-11
The OPERation:MEASuring Node . . . . . . . . . . . . . . . 7-11
The OPERation:MEASuring:POWer Node .... ...... 7-11
The OPERation:TRIGger Node .. ...... ........ 7-12
The OPERation:TRIGger:POWer Node . . . . . . . . . . . . 7-12
The OPERation:CORRecting Node . . . . . . . . . . . . . . . 7-12
The OPERation:CORRecting:ZERO Node . . . . . . . . . . . 7-12
The OPERation:AVERaging Node ............... 7-12
The OPERation:AVERaging:POWer Node . . . . . . . . . . . 7-12
The OPERation:PROGram Node . . . . . . . . . . . . . . . . 7-13
The OPERation:PROGram:<application>Node . . . . . . . . 7-13
The Questionable Status .................... 7-13
The Questionable Status Commands . . . . . . . . . . . . . . 7-15
The QUEStionable node .................... 7-16
The QUEStionable:POWer Node . . . . . . . . . . . . . . . . 7-17
The QUEStionable:POWer:OVERRange Node . . . . . . . . . 7-17
The QUEStionable:POWer:LCURRent Node .. ...... . 7-17
7-11
Contents-5

The QUEStionable:POWer:HCURRent Node ......... 7-18
The QUEStionable:POWer:LMONitor Node . . . . . . . . . . 7-18
The QUEStionable:POWer:HMONitor Node . . . . . . . . . . 7-18
The QUEStionable:POWer:ENVTemp Node . . . . . . . . . . 7-18
The QUEStionable:ISUMmary Node . . . . . . . . . . . . . . 7-19
The QUEStionable:ISUMmary:INSTrument[1j2] Node . . . . . 7-19
The QUEStionable:ISUMmary:INSTrument[1j2]:POWer Node 7-19
The Source Status ...... ...... ........ ... 7-20
The Source Status Commands The following are the source status 7-20
The SOURce node ...... ...... ........ ... 7-21
8. HP-IB Commands
ABORt Commands . . . . . . . . . . . . . . . . . . . . . . . 8-1
Specifying the Channel . . . . . . . . . . . . . . . . . . . . 8-1
ABORt ........................... 8-1
DISPlay Commands ...................... 8-2
DISPlay:BRIGhtness .... ...... ........ ... 8-2
DISPlay:BRIGhtness? . . . . . . . . . . . . . . . . . . . . . 8-2
DISPlay:STATe... ...... ...... ..... .... 8-3
DISPlay:STATe? ...... ...... ..... ...... 8-3
FETCh Commands . . . . . . . . . . . . . . . . . . . . . . . 8-4
Specifying the Channel . . . . . . . . . . . . . . . . . . . . 8-4
FETCh[:SCALar]:POWer[:DC] . . . . . . . . . . . . . . . . .
INITiate Commands ......................
Specifying the Channel . . . . . . . . . . . . . . . . . . . . 8-7
INITiate:CONTinuous ...... ........ ...... 8-7
INITiate:CONTinuous? .... ........ ...... .. 8-7
INITiate[:IMMediate] . . . . . . . . . . . . . . . . . . . . . 8-8
READ Commands ....................... 8-8
Specifying the Channel . . . . . . . . . . . . . . . . . . . . 8-8
READ[:SCALar]:POWer[:DC] ................. 8-8
SENSe Commands . . . . . . . . . . . . . . . . . . . . . . . 8-9
Specifying the Channel . . . . . . . . . . . . . . . . . . . . 8-11
SENSe:CORRection:COLLect:ZERO ........ ...... 8-11
SENSe:CORRection:COLLect:ZERO? . . . . . . . . . . . . . . 8-11
SENSe:CORRection[:LOSS[:INPut[:MAGNitude]]] . . . . . . . . 8-11
SENSe:CORRection[:LOSS[:INPut[:MAGNitude]]]? ...... . 8-12
SENSe:POWer:ATIME .................... 8-12
SENSe:POWer:ATIME? . . . . . . . . . . . . . . . . . . . . 8-13
SENSe:POWer:RANGe:AUTO ................. 8-13
SENSe:POWer:RANGe:AUTO? ...... ...... .... 8-13
8-4
8-7
Contents-6

SENSe:POWer:RANGe[:UPPER] . . . . . . . . . . . . . . . . 8-14
SENSe:POWer:RANGe[:UPPER]? ............... 8-16
SENSe:POWer:REFerence .................. 8-16
SENSe:POWer:REFerence? .................. 8-17
SENSe:POWer:REFerence:DISPlay .......... .... 8-18
SENSe:POWer:REFerence:STATe ............... 8-19
SENSe:POWer:REFerence:STATe? ............... 8-19
SENSe:POWer:REFerence:STATe:RATIo ............ 8-20
SENSe:POWer:REFerence:STATe:RATIo? . . . . . . . . . . . . 8-20
SENSe:POWer:UNIT .......... ...... ..... 8-21
SENSe:POWer:UNIT? . . . . . . . . . . . . . . . . . . . . . 8-21
SENSe:POWer:WAVElength . . . . . . . . . . . . . . . . . . 8-21
SENSe:POWer:WAVElength? ................. 8-22
SOURce Commands ...................... 8-22
Specifying the Channel . . . . . . . . . . . . . . . . . . . . 8-23
SOURce:AM[:INTernal]:FREQuency . . . . . . . . . . . . . . 8-23
SOURce:AM[:INTernal]:FREQuency? ............. 8-23
SOURce:POWer:ATTenuation ................. 8-24
SOURce:POWer:ATTenuation? . . . . . . . . . . . . . . . . . 8-24
SOURce:POWer:STATe .......... ...... .... 8-24
SOURce:POWer:STATe?.. ...... ...... ...... 8-25
SOURce:POWer:WAVElength .......... ...... . 8-25
SOURce:POWer:WAVElength? . . . . . . . . . . . . . . . . .
8-26
SYSTem Commands .... ...... ...... ...... 8-26
SYSTem:DATE........................ 8-27
SYSTem:DATE? .... ...... ...... ..... .. 8-27
SYSTem:ERRor? .... ...... ..... ........ 8-27
SYSTem:TIME . . . . . . . . . . . . . . . . . . . . . . . . 8-28
SYSTem:TIME? ...... ...... ..... ...... 8-29
9. HP-IB Application Commands
Program Commands ...................... 9-1
PROGram[:SELected]:EXECute . . . . . . . . . . . . . . . . 9-2
PROGram[:SELected]:NAME ................. 9-2
PROGram[:SELected]:NAME? . . . . . . . . . . . . . . . . . 9-3
PROGram[:SELected]:NUMBer ................ 9-3
PROGram[:SELected]:NUMBer? . . . . . . . . . . . . . . . . 9-3
PROGram[:SELected]:STATe .. ...... ...... ... 9-4
PROGram[:SELected]:STATe? ...... ...... ..... 9-4
Mainframe Applications .................... 9-5
The Logging Application .... ...... ........ .. 9-5
Contents-7

The Stability Application . . . . . . . . . . . . . . . . . . . . 9-6
10. HP-IB Programming Examples
Example 1 . . . . . . . . . . . . . . . . . . . . . . . . . . . 10-2
Example 2 . . . . . . . . . . . . . . . . . . . . . . . . . . . 10-3
Example 3 . . . . . . . . . . . . . . . . . . . . . . . . . . . 10-5
Example 4 . . . . . . . . . . . . . . . . . . . . . . . . . . . 10-7
Example 5 . . . . . . . . . . . . . . . . . . . . . . . . . . . 10-10
Example 6 . . . . . . . . . . . . . . . . . . . . . . . . . . . 10-13
Example 7 . . . . . . . . . . . . . . . . . . . . . . . . . . . 10-15
A. Installation
Safety Considerations ..................... A-1
Initial Inspection . . . . . . . . . . . . . . . . . . . . . . . . A-2
Line Power Requirements ................... A-2
Line Power Cable ...................... A-2
Operating Environment .................... A-4
Temperature . . . . . . . . . . . . . . . . . . . . . . . . . A-5
Humidity .......................... A-5
Instrument Cooling ..................... A-5
Input/Output Signals . . . . . . . . . . . . . . . . . . . . . A-5
HP-IB Interface ........................
Cables and Adapters . . . . . . . . . . . . . . . . . . . . .
Connector . . . . . . . . . . . . . . . . . . . . . . . . . .
HP-IB Logic Levels . . . . . . . . . . . . . . . . . . . . . . A-7
Removing and Fitting Modules .......... ...... . A-7
How to Remove a Module .. ...... ...... .... A-7
How to Fit a Module . . . . . . . . . . . . . . . . . . . . . A-8
Storage and Shipment .......... ..... ...... A-9
Claims and Repackaging .................... A-10
Return Shipments to HP ................... A-10
A-5
A-6
A-6
B. Accessories
Mainframe .......................... B-1
Modules . . . . . . . . . . . . . . . . . . . . . . . . . . . . B-2
Connector Interfaces and Other Accessories . . . . . . . . . . . B-3
Contents-8

C. Specications
Mainframe Specications . . . . . . . . . . . . . . . . . . . . C-1
Declaration of Conformity ................... C-3
Supplementary Information: ................ C-4
Acoustic Noise Emission ................... C-5
D. Function Tests
Introduction . . . . . . . . . . . . . . . . . . . . . . . . . . D-1
Equipment Required . . . . . . . . . . . . . . . . . . . . . . D-1
Test Record .......................... D-2
Test Failure .......................... D-2
Instruments Specications ........ ..... ...... D-2
IA. Function Test Using the HP 81533A . . . . . . . . . . . . . D-3
Display Function and Module Interface Tests ......... D-3
Display Function Tests . . . . . . . . . . . . . . . . . . . D-3
Module Interface Tests . . . . . . . . . . . . . . . . . . . D-4
ANALOG INPUT (8152A IN) ................. D-6
P.CTRL ...... ...... ...... ...... ... D-6
IB. Function Test using a HP 81530/31/32 or HP 81536A ..... D-6
HP-IB Interface Test (Optional) . . . . . . . . . . . . . . . . . D-7
E. Cleaning Procedures
Cleaning Materials . . . . . . . . . . . . . . . . . . . . . . .
Cleaning Fiber/Front-Panel Connectors .. ...... ..... E-2
Cleaning Connector Interfaces .. ...... ....... .. E-2
Cleaning Connector Bushings . . . . . . . . . . . . . . . . . . E-3
Cleaning Detector Windows .................. E-3
Cleaning Lens Adapters .... ...... ...... .... E-3
Cleaning Detector Lens Interfaces ........ ...... . E-4
E-1
F. Local Control Summary
Measure Mode . . . . . . . . . . . . . . . . . . . . . . . . . F-1
Menu Mode ...... ...... ........ ..... . F-2
System Mode .... ...... ........ ...... . F-3
Contents-9

G. HP 8153A HP-IB Command Summary
The Logging Application ...... ...... ........ G-4
The Stability Application . . . . . . . . . . . . . . . . . . . . G-5
H. HP 8152A HP-IB Command Summary
Dierences .......................... H-1
Using the FETCh Command - An Example . . . . . . . . . . . . H-3
Setting the Filter .......... ..... ........ H-4
Listener Function ....................... H-5
Settings . . . . . . . . . . . . . . . . . . . . . . . . . . . H-5
Standard Parameter Set ................... H-7
Talker Function ........................ H-8
Interrogating Settings .................... H-8
Status/Error Reporting . . . . . . . . . . . . . . . . . . . . H-10
Universal Commands . . . . . . . . . . . . . . . . . . . . . . H-10
I. Error Codes
Local Operation Error Codes .................. I-1
Module Related Errors . . . . . . . . . . . . . . . . . . . . I-1
Specic Error Identiers . . . . . . . . . . . . . . . . . . . I-2
Store and Recall Errors . . . . . . . . . . . . . . . . . . . . I-2
Plot, Print, Show, and Manual Logging Errors ......... I-2
Loss Errors .... ...... ........ ...... .
HP-IB Errors ........................
HP-IB Error Codes . . . . . . . . . . . . . . . . . . . . . . . I-3
No Error .. ...... ........ ..... ..... I-3
Instrument Specic Errors .................. I-3
Command Errors . . . . . . . . . . . . . . . . . . . . . . . I-4
Execution Errors ........ ...... ........ I-6
Device Dependant Errors . . . . . . . . . . . . . . . . . . . I-7
Query Errors ........................ I-8
I-2
I-3
J. Sales and Service Oces
K. Backdating
Instruments with Serial Numbers 2946G00475 and Earlier .... K-1
Instruments with Serial Numbers 2946G00225 and Earlier .... K-2
The Print Application ........ ...... ...... K-2
SAMPLES . . . . . . . . . . . . . . . . . . . . . . . . . K-2
COMMENT ........................ K-2
Contents-10

Index
Contents-11

Figures
0-1. Line Power Cables - Plug Identication ............ iv
1-1. The HP 8153A System .................... 1-1
1-2. The HP 8153A Keyboard . . . . . . . . . . . . . . . . . . . 1-2
1-3. The HP 8153A Display . . . . . . . . . . . . . . . . . . . . 1-6
1-4. Hardware Set Up for the Sample Session .. ...... ... 1-8
1-5. The Display at the Start of the Sample Session . . . . . . . . .
1-6. Editing the Sensor Wavelength .... ...... ...... 1-10
1-7. Reading the Power Output by the Source ........... 1-11
1-8. Going into Menu Mode . . . . . . . . . . . . . . . . . . . .
1-9. A Plotter Connected to the HP 8153A . . . . . . . . . . . . .
2-1. Measurements with T
Average
1 second . . . . . . . . . . . . 2-4
2-2. Editing the Averaging Time Parameter .. ...... .... 2-4
2-3. The Display while Channel A is Being Zeroed ...... ... 2-10
3-1. Measuring the Reference for the Loss Application ...... . 3-3
3-2. Measuring the Loss of a Device Under Test (DUT) .... ... 3-4
3-3. The Loss Result ....................... 3-5
3-4. Setup for a Record Application . . . . . . . . . . . . . . . . 3-6
3-5. Selecting an Application : Stability . . . . . . . . . . . . . . 3-7
3-6. Editing an Application Parameter : Samples . . . . . . . . . . 3-11
3-7. Stability Plot ........................ 3-18
3-8. Logging Printout . . . . . . . . . . . . . . . . . . . . . . . 3-23
3-9. The Window and Refresh Modes ............... 3-26
3-10. Setup for an Alignment Application . . . . . . . . . . . . . . 3-30
3-11. The Display during the Alignment Application . . . . . . . . . 3-32
4-1. Making a Selection in System Mode : the Recall Function .. . 4-2
4-2. Editing a Parameter in System Mode ............. 4-4
4-3. Setting the Brightness of the Display ............. 4-7
6-1. Common Status Registers . . . . . . . . . . . . . . . . . . . 6-2
7-1. The Registers and Filters in a Node . . . . . . . . . . . . . . 7-1
7-2. The Operation Registers ................... 7-8
7-3. The Questionable Registers . . . . . . . . . . . . . . . . . . 7-14
7-4. The Source Register ........ ...... ..... .. 7-20
1-9
1-11
1-13
Contents-12
8-1. Measurements with T
8-2. Measurements with T
8-3. Measurements with T
A-1. Line Power Cables - Plug Identication ............ A-4
A-2. HP-IB Connector . . . . . . . . . . . . . . . . . . . . . . . A-6
A-3. How to Remove a Module .................. A-8
A-4. Fitting a Module . . . . . . . . . . . . . . . . . . . . . . . A-9
Average
Average
Average
1 second . . . . . . . . . . . . 8-5
>
1 second, continuous triggering. . 8-5
>
1 second, immediate triggering. . 8-6
Contents-13
Tables
1-1. Description of the Display .......... ...... .. 1-6
2-1. ............................... 2-6
2-2. Power Ranges . . . . . . . . . . . . . . . . . . . . . . . . 2-12
5-1. HP-IB Capabilities .. ...... ...... ...... .. 5-2
5-2. Accepted Characters . . . . . . . . . . . . . . . . . . . . . 5-4
5-3. HP-IB Bus Commands .................... 5-5
6-1. Common Command Summary . . . . . . . . . . . . . . . . . 6-4
6-2. The Standard Event Status Enable Register .......... 6-5
6-3. The Standard Event Status Register . . . . . . . . . . . . . .
6-4. Reset State (Standard Setting) .. ...... ...... .. 6-11
6-5. The Service Request Enable Register .. ...... ..... 6-12
6-6. The Status Byte Register . . . . . . . . . . . . . . . . . . .
7-1.
7-2.
7-3.
STATus
STATus
STATus
Command Summary ........ ...... ... 7-9
Command Summary ........ ...... ... 7-15
Command Summary ........ ...... ... 7-21
8-1. ABORt Command Summary ................. 8-1
8-2.
DISPlay
Command Summary . . . . . . . . . . . . . . . . . 8-2
8-3. FETCh Command Summary ................. 8-4
8-4. INITiate Command Summary . . . . . . . . . . . . . . . . . 8-7
8-5. READ Command Summary . . . . . . . . . . . . . . . . . . 8-8
8-6.
SENSe
Command Summary . . . . . . . . . . . . . . . . . . 8-10
8-7. ............................... 8-15
8-8.
8-9.
9-1.
G-1.
G-2.
SOURce
SYSTem
PROGram
STATus
STATus
Command Summary ........ ...... ... 8-22
Command Summary ........ ...... ... 8-26
Command Summary . . . . . . . . . . . . . . . . . 9-2
Command Summary ........ ...... ... G-8
Command Summary ........ ...... ... G-9
6-7
6-13
Contents-14
Getting Started
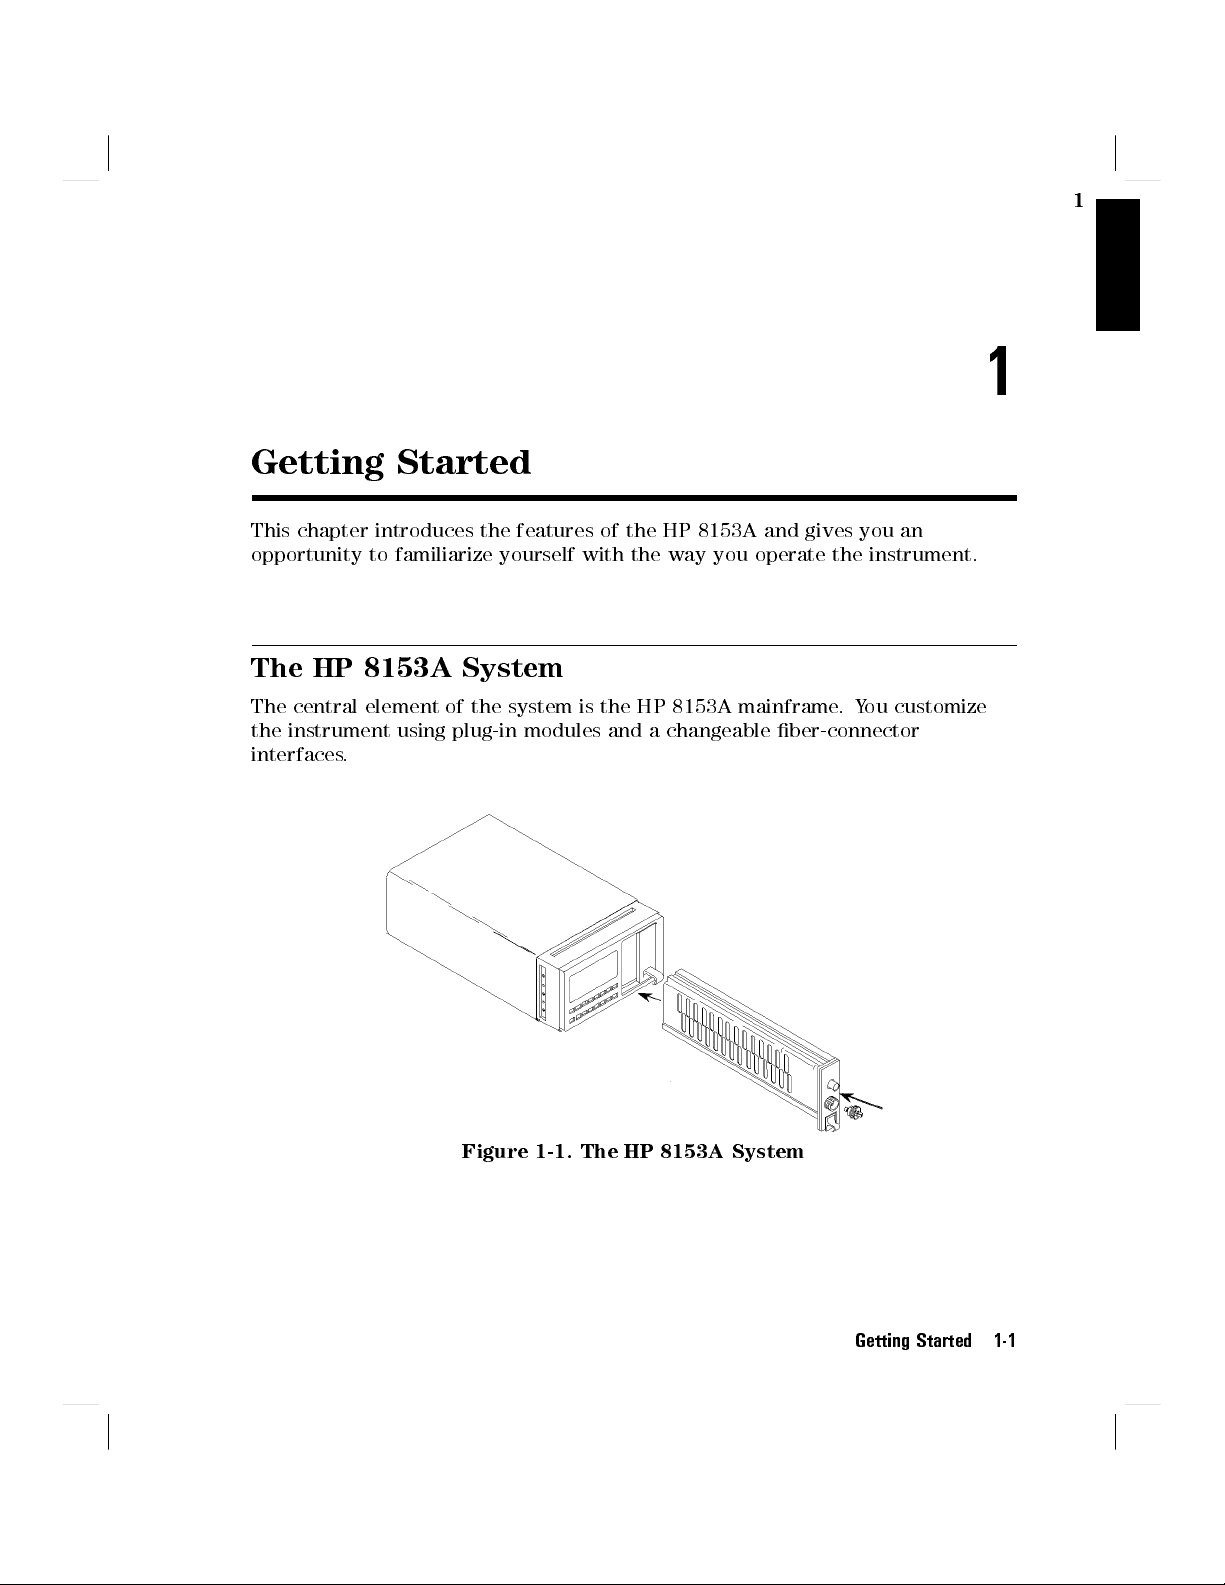
This chapter introduces the features of the HP 8153A and gives you an
opportunity to familiarize yourself with the way you operate the instrument.
The HP 8153A System
The central element of the system is the HP 8153A mainframe.You customize
the instrument using plug-in modules and a changeable ber-connector
interfaces.
1
1
Figure 1-1. The HP 8153A System
Getting Started 1-1

1
A Quick Overview
The Keyboard
Most of the keys have two functions
, depending on the selected mode. Dierent
colors, or whether the legend is on the key or above it, show these dierent
functions.
Figure 1-2. The HP 8153A Keyboard
The
4
5
Chan
key, the
4
Mode
5
key, and the modify keys always have the same
function.
4
Chan
5
Select the channel. The other keys act only on the selected
channel. Channel A corresponds to the module in the left slot.
Channel B corresponds to the module in the right slot.
4
5
Mode
Modify
Keys
Switch between Measure and Menu Mode.
4(5,4)5
5
4+5,4
*
Select the digit or character to edit.
Edit the selected digit or character, or the parameter.
Measure Mode
Measure mode is the mode selected automatically when you switch on the
instrument. In this mode you can set up and make simple measurements.In
measure mode, the black writing on the key shows its function.
4
Param
5
Select the measurement-parameter that you want to view or edit.
1-2 Getting Started

4
Disp!Ref
5
Measure and record the input power-level for use as a reference.
1
4dB5
4
dBm/W
4
Zero
5
5
Display the input power-level relative to a reference.
Switch between dBm and Watt units.
Measure the electrical noise in the instrument, and compensate for
it.
4
5
N Dig
Range Keys
Select the number of decimal places shown in the result.
4
Auto
4Up5
4
Down
5
5
Start or stop automatic ranging.
Select the next higher measuring range.
Select the next lower measuring range.
Menu Mode
In this mode there are pre-programmed routines to perform some common, but
more complicated, measurements. In menu mode, the blue writing above the
key shows the function of the key.
There are some keys whose operation is common to all of the tasks you do in
menu mode.
4
5
gives you access to the parameters for editing.
Edit
5
4
Prev
5
and
step through the items in a menu. For example, these can be
4
Next
dierent types of Record applications, or the dierent parameters for the
system conguration.
4
5
to execute an application, or to nish editing a change of a system
Exec
parameter.
4
5
to pause the running application or to continue a paused application.
Pause
4
System
4
Loss
5
Select system-parameters. This allows you to view or edit the
conguration of the instrument.
5
Select the Loss application. A loss measurement tells you how
much of your optical signal you lose by passing it through a device.
Loss is calculated by the following formula:
P
Loss
=10
To measure loss you need both quantities,P
log
out
(
)
dB
P
in
in
and P
out
. The
application records Pinwhen you start the application. The
instrument expresses all the following results relative to this.
These results are loss results.
Getting Started 1-3

1
4
Record
5
Select from the Stability, Logging, Manual Logging, Plot or Print
applications.
Stability takes samples at evenly spaced intervals for a specied
period.
The parameters for this application are
T_TOTAL
Which sets the total time over which the
measurements are to be made.
AUTODUMP
Which sets whether the results are output to a
printer or plotter when the application nishes.
Logging takes a specied number of samples one immediately
after the other. That is, as soon as the rst sample has ended,
the second starts.
The parameters for this application are
SAMPLES
AUTODUMP
Which sets the number of samples to be taken.
Which sets whether the results are output to a
printer or plotter when the application nishes.
START
Which sets whether the application starts
immediately, or only after the power goes above,or
below, a specied threshold level.
THRESHLD
Which sets the threshold level to be passed before
the application begins.
Manual Logging takes a sample each time the user presses the
4
5
key.
Exec
In addition, the plot and print applications allow you to make
a graphics plot, or a printout from the samples of your record
application.
The parameters for the plot and print applications are
AUTOSCAL
Y_MIN
Y_MAX
COMMENT
4
More
5
Select from the other applications. As standard, the instrument has
Show and Alignment applications.
1-4 Getting Started
Which sets whether the axes are scaled automatically
or not.
Which sets the minimum value for the y-axis.
Which sets the maximum value for the y-axis.
Which allows you to add your own text to the
printout or plot.

The Show application lets you look at the sample values from the
most recent Stability, Logging, or Manual Logging application.
Some simple statistics for the results are also given.
The Alignment application gives you visual, and audible
feedback of the input power, to help you align two components
for the maximum transfer of optical power.
The parameters for this application are
1
TYPE
DELTA
MAXPOWER
The
4
Pause
Which sets whether the maximum transferred
power is determined automatically by the
instrument, or set manually by the user.
Which sets the size of the change in transferred
power indicated on the display, or by the tone.
Which sets expected, or required, maximum
transferred power.
5
key switches on and o the tone.
Getting Started 1-5

1
The Display
The display shows the status and the readings.
Figure 1-3. The HP 8153A Display
Table 1-1. Description of the Display
NNNNNNNN
1
Ch
annel Indicator
Description
Shows the selected channel.
NNNNNNNNNNNNNN
2
Mode
Indicator
Shows the operating mode.
3
Communications
Indicator
NNNNNNNNNNNNNNNNNNNNNNNNNN
TLK ONLY
NNNNNNNNNNNNNNNNNNNNNNNNNN
4
Low Batt
Indicator
1-6 Getting Started
NNNNNNNNNNN
RMT
NNNNNNNNNNN
SRQ
ery
Shows the state of the HP-IB communications.
Remote communications are taking place.
Talk-only selected for the HP-IB.
A service request is pending.
Indicates that the internal battery voltage is
low.

Table 1-1. Description of the Display (continued)
5
Result Field
6
Reference Indicator
A/REF
or
B/REF
A/BorB/A
7
Bar Graph
8
Operation Indicator
AUTO
APPL
EDIT
RUN
PAUSE
eter Indicator
9
NNNNNNNNNNNNNNNNN
Param
CAL
REF
ATT
AUX
10
Character Field
1
Description
This is where the results of tests or
applications are shown.
Shows the reference used for a dB result.
Results relative to a reference.
Results relative to the other channel.
Gives a linear graphical representation of the
result.
Shows the operation type.
The range is being selected automatically.
An application has been selected.
An application parameter is being edited.
An application is running.
An application has been temporarily halted.
shows the type of parameter in the character
eld.
Character eld shows wavelength.
Character eld shows the calibration factor.
T
Character eld shows the averaging time.
Character eld shows the reference level.
Character eld shows the attenuation of the
source.
Auxiliary Parameters.
Used for parameters, and error messages.
Getting Started 1-7
1
A Sample Session
In this sample session you recall the standard setting, take a power
measurement, and then do some data logging.
Hardware Setup
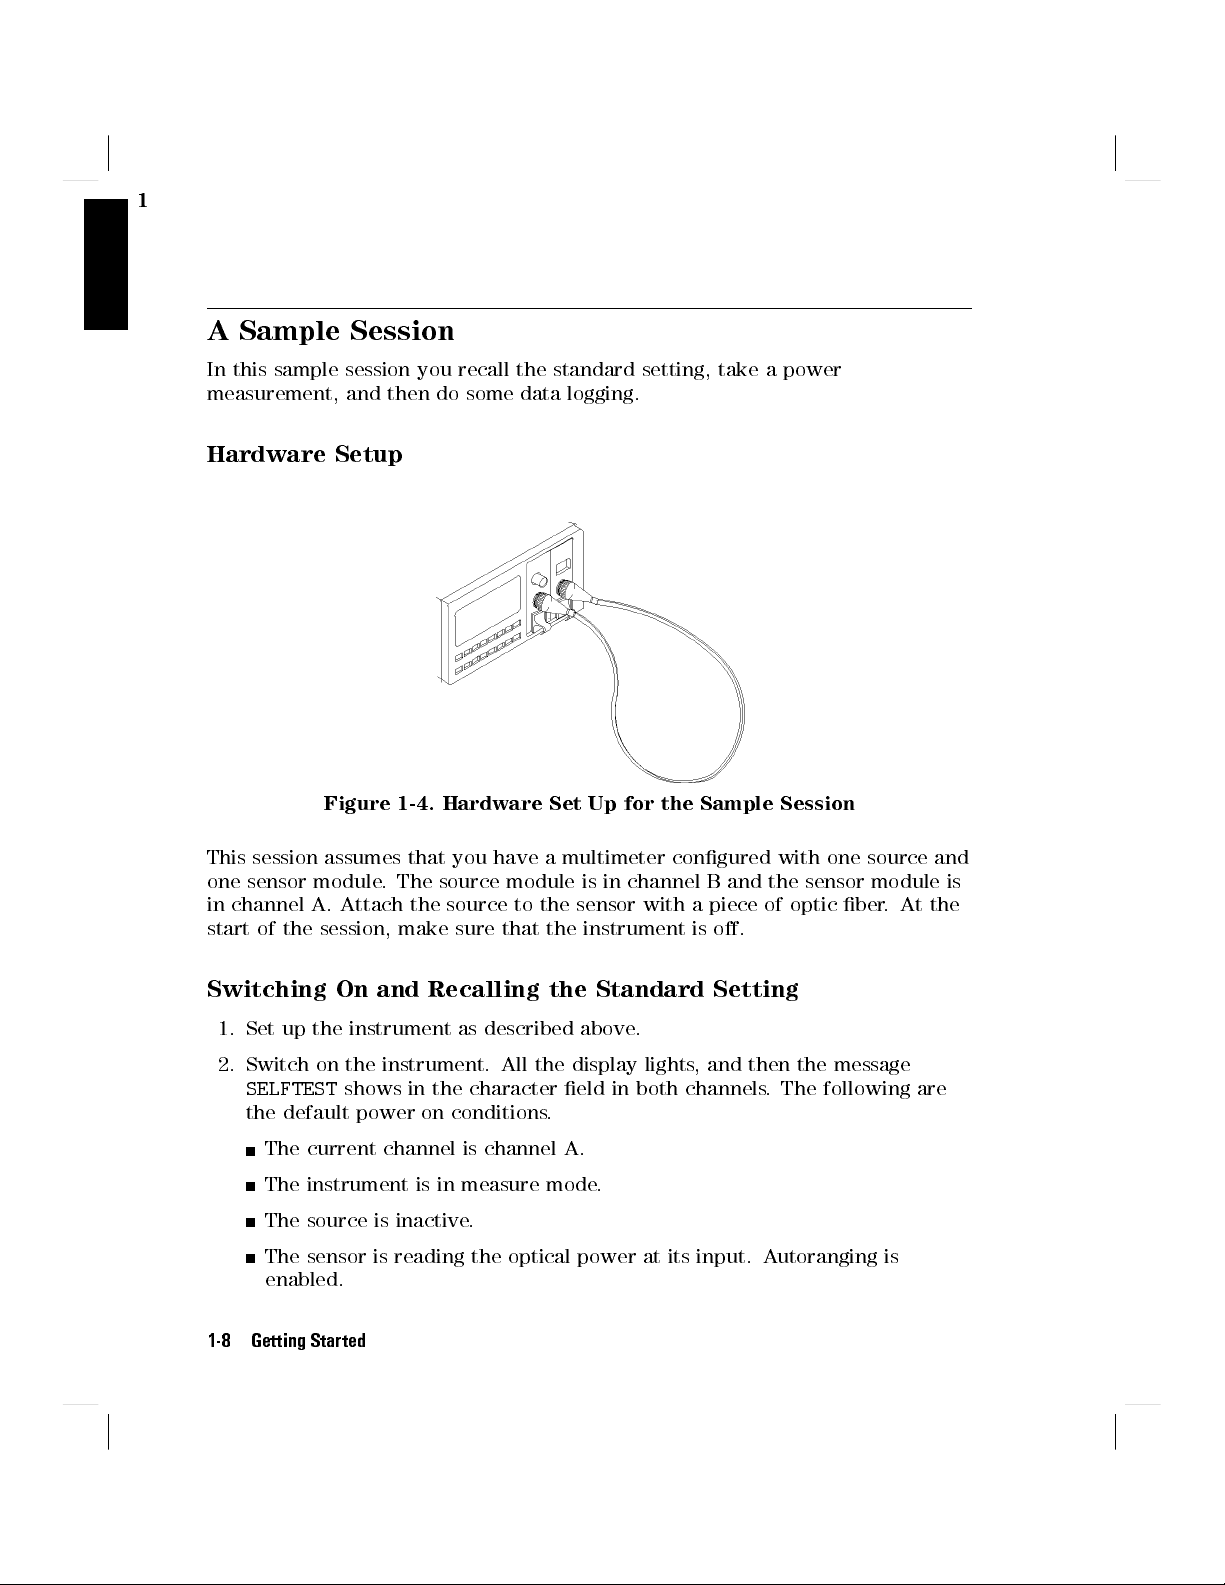
Figure 1-4. Hardware Set Up for the Sample Session
This session assumes that you have a multimeter congured with one source and
one sensor module. The source module is in channel B and the sensor module is
in channel A. Attach the source to the sensor with a piece of optic ber. At the
start of the session, make sure that the instrument is o.
Switching On and Recalling the Standard Setting
1. Set up the instrument as described above.
2. Switch on the instrument. All the display lights, and then the message
SELFTEST
the default power on conditions.
The current channel is channel A.
The instrument is in measure mode.
The source is inactive.
The sensor is reading the optical power at its input. Autoranging is
enabled.
1-8 Getting Started
shows in the character eld in both channels. The following are

Figure 1-5. The Display at the Start of the Sample Session
1
3. Press
4
5
. The instrument goes to menu mode. It shows the
Mode
indicator at the top of the display and the word
at the bottom of the display.
4. Press
4
System
5
. The instrument goes into system mode, it shows the
mode indicator. The character eld shows the message
the display is o.
5. Press
6. Press
4
5
Edit
the message
5
4
Exec
. The instrument shows the
RECALL 0!A
shows in the character eld.
MENU SYS EDIT
to recall the standard setting for channel A. The
indicator shows while the setting is being recalled.
5
7. Press
. The instrument shows the message
4
*
character eld.
5
8. Press
9. Press
to recall the standard setting for channel B.
4
Exec
4
5
to return the instrument to measure mode.
Mode
Making A Power Measurement
Note
Normally, the instrument is left for 20 minutes to warm up.
Maximum accuracy is only possible if the instrument is allowed
to warm up.For this sample session we do not need this
accuracy, so you can go to the next step immediately.
MENU
in the character eld
RECALL
mode indicator and
RUN
RECALL 0!B
MENU
mode
MENU SYS
. The rest of
operation
in the
Getting Started 1-9

1
5
10. Press
4
Param
until theparameter indicator for channel A lights. The
character eld on the left hand side now shows the wavelength for the
sensor. The wavelength of the source shows in the result eld on the right
side. Set the wavelength of the sensor to the wavelength of the source.
5
Use
4*5
4
(
and
5
and
4+5
to select a modiable digit. The modiable digit blinks. Use
4
)
to alter the value of this digit.
Figure 1-6. Editing the Sensor Wavelength
11. Press
4
Zero
ZEROING
5
to remove any electrical osets in the circuitry. The message
is shown in the character eld and
----
shows blinking in the
result eld.
12. Enable the source by pressing the button on its front panel. The green LED
lights to show that the source is now active.
13. The instrument shows the power of the source in the result eld of channel
A, in Watts.
1-10 Getting Started

Figure 1-7. Reading the Power Output by the Source
Logging Data
You will now set up the instrument to record 250 consecutive power readings.
The instrument starts this part with the settings used after the section \Making
aPower Measurement".
1
5
14. Press
MENU.MENU
to change to menu mode. The mode indicator changes to show
4
Menu
is displayed in the character eld.
Figure 1-8. Going into Menu Mode
15. Press
4
Record
5
to choose a record application. The
switches on. The character eld shows
that the character eld shows
LOGGING
STABILTY
.
APPL
operation indicator
. Press
4
Record
Getting Started 1-11
5
again, so

1
5
, the
EDIT
16. Press
the left shows
4
Edit
SAMPLES
operation indicator lights and the character eld on
. The other character eld shows the setting for the
number of samples to be taken.
Use the Modify keys to set the number of samples to 250.
17. Press
18. Press
4
5
Next
it is not, use
4
5
Next
to
IMMEDIAT
, the character eld shows
4*5or4+5
to switch it
. The character eld shows
AUTODUMP
OFF
.
START
. Make sure that it is
Use
4*5or4+5
to set the state
. This means that the logging starts immediately when you
OFF
execute it.
19. Press
4
5
again to get back to the display with
Edit
LOGGING
in the character
eld.
You have now set the parameters for the application. The application takes
a just under a minute to record the values
. While it is running try moving
and twisting the ber to change the power received at the sensor.
20. Press
to start the application. The instrument shows the
4
Exec
RUN
operation
5
indicator. While the application is running, the character eld shows the
number of the sample that is being taken. When the application nishes,
the
RUN
indicator goes out.
Examining the Data
After you have run the Logging application, you can look at the data that has
been recorded. You do this using the Show application.
21. Press
22. Press
. The character eld shows the word
4
More
4
5
. The character eld now shows
Edit
SHOW
MAXIMUM
.
and the value of the
5
highest reading taken during the logging.
.If
23. Press
4
5
. The character eld now shows
Next
lowest reading taken during the logging.
5
24. Press
. The character eld shows
4
Next
highest and lowest readings.
25. Press
4
5
. The character eld shows
Next
readings.
26. Press
4
5
. The character eld shows
Next
To examine all the readings, use the
1-12 Getting Started
DIFF
AVERAGE
#1
4*5
and
MINIMUM
and the value of the
and the dierence between the
and the average of the
and the value of the rst reading.
4+5
.

1
27. When you have nished examining the readings
the display with
SHOW
in the character eld.
, press
5
to get back to
4
Edit
Plotting Data
Now that you have recorded the data, you can plot it on a plotter using the
Hewlett-Packard|Interface Bus (HP-IB).
28. Attach the instrument to a graphics-plotter that has HP-GL capabilities.
Attach the plotter to the HP-IB connector. Do not attach any other device
to this connector at the same time as the plotter. Make sure that the plotter
is congured at address 5.
29. Make sure that the instrument is in T
is in Talk Only mode, the
NNNNNNNNNNNNNNNNNNNNNNNNNN
TLK ONLY
alk Only mode. When the instrument
shows at the top of the display. If the
instrument is not in Talk Only mode use the following procedure to put it
into Talk Only mode
a. Press
b. Press
4
5
System
4
Edit
repeatedly until
5
. The character eld shows the message
HPIB
shows in the character eld.
ADDRESS
and the
HP-IB address of the HP 8153A.
c. Press
d. Use the modify keys to set the HP-IB state to
4
Next
TLK LSTN
5
. The character eld shows the message
is blinking.
TLK ONLY
MODE
.
. The word
e. Press
4
5
to return to the display with
Edit
HPIB
in the character eld.
Figure 1-9. A Plotter Connected to the HP 8153A
Getting Started 1-13

1
30. Press
4
Record
repeatedly, until the message
PLOT
shows in the character
5
eld.
31. Press
4
5
. The character eld shows
Edit
AUTOSCAL
. Use the modify keys to set
this parameter toON. This means that the instrument automatically scales
the plot.
32. Press
4
5
. The character eld shows
Next
COMMENT
. The comment is a message
that prints on the plot. Use the modify keys to enter a comment. Use
and
4)5
to select a character position in your comment. Use
letter and
33. Press
34. Press
The
RUN
4+5
to select a number for your comment.
4
5
to get back to the display with
Edit
4
5
to plot the readings.
Exec
Mode indicator shows while the graph of the results plots
plot has nished the
RUN
indicator switches o.
PLOT
in the character eld.
4*5
. When the
This ends the sample session.
4(5
to select a
1-14 Getting Started

Measure Mode
The default mode at switch-on is Measure Mode. When the instrument is in
measure mode, the mode-indicator shows
MEAS
. In measure mode, the function
of key is shown by the black legend on the key.
The Chan Key
4
5
selects the channel. This can be A or B. The channel- indicator, at the top
Chan
of the display, shows the selected channel.
2
2
Note
When the instrument is under remote operation, this key acts as
Functions in Measure mode apply only to the selected channel.
5
. That is,
4
Local
it returns the instrument to local operation (unless Local Lockout is active).
The Mode Key
4
5
changes the operating mode. If you press this key in measure mode,it
Mode
changes the instrument into menu mode (the next chapter gives a description of
menu mode).
Note
The commands described in this chapter can only be used when
the instrument is in Measure mode.
Local Control - Measure Mode 2-1

2
The Param Key
Use
4
5
to select a measurement-parameters for editing. The parameter-
Param
indicator shows the selected parameter, the character eld shows the value of
the parameter.You can select the next parameter by pressing
4
Param
5
again.
When the hardware does not use a particular parameter, you cannot select it.
When you have selected a parameter, you can edit it using the Modify keys
(described later in this chapter). Some parameters are set by the instrument,
these cannot be edited.
The Applications in Menu mode also use the parameters set in Measure mode.
Entry Status
When you select a parameter, the editable part blinks. The editable part can be
one digit or character, or the whole parameter.You can only edit a parameter,or
a part of a parameter, while it is blinking.
If you do not press any more keys within 10 seconds, the blinking stops and you
are prevented from editing the value.You can enable editing again if you press
any of the Modify keys.
Note
The instrument holds the parameter information in memory
until you edit it. Switching the instrument o does not aect
the parameters.
Default Values
5
If you hold down
4
for 2 seconds or longer, the parameter is set to its
Param
default value.
Parameter List
The parameters and their specications are as follows:
This is the wavelength value. Sometimes, you can set the wavelength to any
value within limits set by the module (for example, for a power sensor). For
other modules, you can choose one wavelength from two possibilities (for
2-2 Local Control - Measure Mode

example, multi-wavelength sources). In other cases, the module sets this value
and you can display the value but you cannot edit it.
2
Display Format
nnnn.n
nm
Limits Depends on the module used.
Resolution 0.1nm
Default Depends on the module used.
CAL
This is a calibration oset that you can enter to compensate for external optical
circuitry. This value is automatically subtracted from the input signal.
P
measured
(
dBm)=P
input
(
dBm)0
CAL(dB
)
Where,
P
measured
P
is the adjusted value of the signal read,
is the input signal level, and
input
CAL is the calibration oset.
Display Format6nnn.nnn
dB
Limits -200.000dBnnn.nnn+200.000dB
Resolution .001dB
Default 0.000dB
When the calibration factor is not set to zero, the
CAL
parameter- indicator stays
on at half brightness.
T
This is the length of time over which a signal is averaged. Longer averaging
times increase the accuracy and improve the noise rejection of the
measurement. Longer averaging times also decrease sensitivity and increase the
length of time between updates of the results on the display.
For averaging times of 1 second or less, a new measurement is shown on the
display at the end of each averaging time. This is drawn in Figure 2-1. A new
measurement is shown on the display at each x.
Local Control - Measure Mode 2-3

2
Figure 2-1. Measurements with T
Average
1 second
For averaging times of more than 1 second, the x value is given by the formula
x
new
=
10T
x
old
T
sample
avg
+
Sample
T
sample
T
avg
Where
x
x
new
old
is the new, displayed result,
is the previously displayed result,
Sample is the value read by the hardware,
T
avg
T
sample
is the averaging time (as set by the user), and
is the time taken, by the hardware, to make a reading.
If the measurement conditions are changed (for example, by a range change in
autoranging) x
is reset, and the averaging starts again. This is why the display
old
update seems faster in autoranging.
Display Format
nnnms,s,
min
Values 20, 50, 100, 200, 500ms, 1, 2, 5, 10, 20, 30s, 1, 2, 5, 10, 15, 20,
30, 60min
Default 200ms
Figure 2-2. Editing the Averaging Time Parameter
2-4 Local Control - Measure Mode

REF
dB results are shown relative to a reference-level. This parameter sets the
reference-level. You can choose the units for the reference using
4
dBm W
5
.
Setting, or changing, the reference only aects results that are displayed in dB.
2
P
display
(dB)=
P
measured
0
REF
Where,
P
display
P
measured
is the displayed, relative power,
is the absolute power-level (see \CAL"), and
REF is the reference.
Logarithmic Units
Display Format6nnn.nnn
dBm
Limits -200.000dBmnnn.nnn+200.000dBm
Resolution 0.001dBm
Default 0.000dBm
Linear Units
Display Format 5 digits pW,nW,W,mW.
Limits 0.001pWn9999.9mW
Resolution see Table 2-1
Default 1000.0W
Local Control - Measure Mode 2-5

2
Range Upper Limit
Table 2-1.
Linear Power
Resolution
@T100ms
+30dBm 1999.9mW 100W
+20dBm 199.99mW 10W
+10dBm 19.999mW 1W
0dBm 1999.9W 100nW
-10dBm 199.99W 10nW
-20dBm 19.999W 1nW
-30dBm 1999.9nW 100pW
-40dBm 199.99nW 10pW
-50dBm 19.999nW 1pW
-60dBm 1999.9pW 0.1pW
-70dBm 199.99pW 0.01pW
-80dBm 19.999pW 0.001pW
ATT
The amount of power that is output from a source can be controlled. This
parameter sets the attenuation of an output.
P
output
=
P
source
0
AT T(dB
)
Where,
P
P
is the power-level at the output of the module,
output
is the power-level at the output of the source, and
source
ATT is the attenuation parameter.
Display Format6n.n
dB
Limits 0.0dBn.n6.0dB
Resolution 0.1dB
Default 0.0dB
2-6 Local Control - Measure Mode

AUX
The output amplitude of a source can be modulated by a square wave. This
parameter sets the frequency of the modulation. The modulation can be one of
CW (continuous wave, that is no modulation), 270Hz, 1kHz, or 2kHz.
Values CW, 270Hz, 1, 2kHz
Default CW
The Disp!Ref Key
2
Pressing this key takes the input power-level and stores it as the reference
.
Setting, or changing, the reference in this way only aects results displayed in
dB.
If the display is in dBm or Watts, the measured power-level is stored as the
reference, that is
REF=P
measured
Where,
REF is the reference, and
P
measured
is the absolute power-level (see \CAL").
If the display is in dB, this value is converted to dBm or Watts before being
stored as a reference, that is
REF
new
=
P
display
(dB)+
REF
old
Where,
REF
P
display
REF
is the reference after the key press,
new
is the displayed, relative power, and
is the reference before the key press.
old
Local Control - Measure Mode 2-7

2
The dB Key
This key switches the display to show results in dB
given with respect to another power-level. This can be a stored reference
. Results in dB are always
,orit
can be a second power-level.
Using
4dB5
with a Two Sensor Instrument
For an instrument with two sensors, the dB result can be with respect to the
reference stored for the channel, or it can be with respect to the power-level of
the other channel.
If the result is in dB with respect to the power-level of the other channel,
4dB5
changes the result to dB with respect to the stored reference. The
reference-indicator shows
set the reference you use
A/REForB/REF
5or4
4
Param
P
display
Disp!Ref
(dB)=
.To see the reference , use
5
.
0
P
measured
REF
4
Param
5
.To
Where,
P
display
P
measured
is the displayed, relative power,
is the absolute power-level (see \CAL"), and
REF is the reference.
If the result is in dB with respect to the reference,
4dB5
changes the result to dB
with respect to the power-level in the other channel. The reference-indicator
shows
A/BorB/A
. When the result is with respect to the power-level in the
other channel, the stored reference is also used in the calculation of the
displayed result.
P
display
(dB)=
P
measured
Where,
P
display
P
measured
is the displayed, relative power,
is the absolute power-level (see \CAL"), and
REF is the reference.
If the result is in dBm or Watts,
2-8 Local Control - Measure Mode
0
P
1stChan
5
changes the result to dB.
4
dB
measured
2ndChan
0
REF

Using
4dB5
the stored reference. The reference-indicator shows
reference, use
4dB5
with a One Sensor Instrument
changes the display to show the result as a relative value with respect to
A/REForB/REF
4
5
.To set the reference, use
Param
4
Param
5or4
Disp!Ref
5
.
2
.To see the
P
display
(dB)=
P
measured
0
REF
Where,
P
display
P
measured
is the displayed, relative power,
is the absolute power-level (see \CAL"), and
REF is the reference.
The dBm/W Key
This key changes the display to show results in dBm or in W
5
If the results are in dB,
4
dBm W
changes the display to showing the result as
dBm or Watts.
5
If the results are in dBm,
4
dBm W
changes the display to showing the results in
Watts.
5
If the results are in Watts,
4
dBm W
changes the display to showing the result in
dBm.
The Zero Key
atts.
The
4
5
works with sensor modules. The function of
Zero
4
5
is to remove any
Zero
electrical oset in the sensor circuitry.
The instrument measures by converting optical power to electrical power, and
then measuring the electrical power. An electrical oset is power that is always
present, even if there is no light at the input. If this oset is not removed, it
will aect the results.
4
5
measures the electrical power when there is no light at the input. The
Zero
instrument uses this value to remove the oset from all further incoming
signals.
Local Control - Measure Mode 2-9

2
Note
The environmental conditions and the temperature of the
instrument aect the electrical oset. For the best results you
must:
Allow the instrument time to acclimatize (c
Allow the instrument time to warm up (c
Make sure that the optical input is not receiving any light. If
you are using multi-mode cable you must disconnect the cable
and cover the input to the sensor to perform a zero
It is a good practice to zero the instrument before making any
important measurements.
The zero operation is performed just for the selected channel. The instrument
automatically repeats the zero operation for each measurement range.
.24 hours).
.20 minutes).
.
Figure 2-3. The Display while Channel A is Being Zeroed
If there is light at the sensor input during a zero operation, the instrument
shows the message
to use the instrument, you can abort the zero operation by pressing any key.
2-10 Local Control - Measure Mode
ZERO ERR
. If you cannot remove the light, but you still want

The N Dig Key
This key selects the number of digits shown after the decimal point in the
5
result. When you use
the number of digits has been reduced to 1,
digits shown. The maximum number of digits after the decimal point is 3.
The Range Keys
The range keys select the range of the units for the result. The table below
gives the possible ranges for results. The available ranges depend on the module
used.
4
rst, it reduces the number of digits shown. After
N Dig
5
4
increases the number of
N Dig
2
Local Control - Measure Mode 2-11
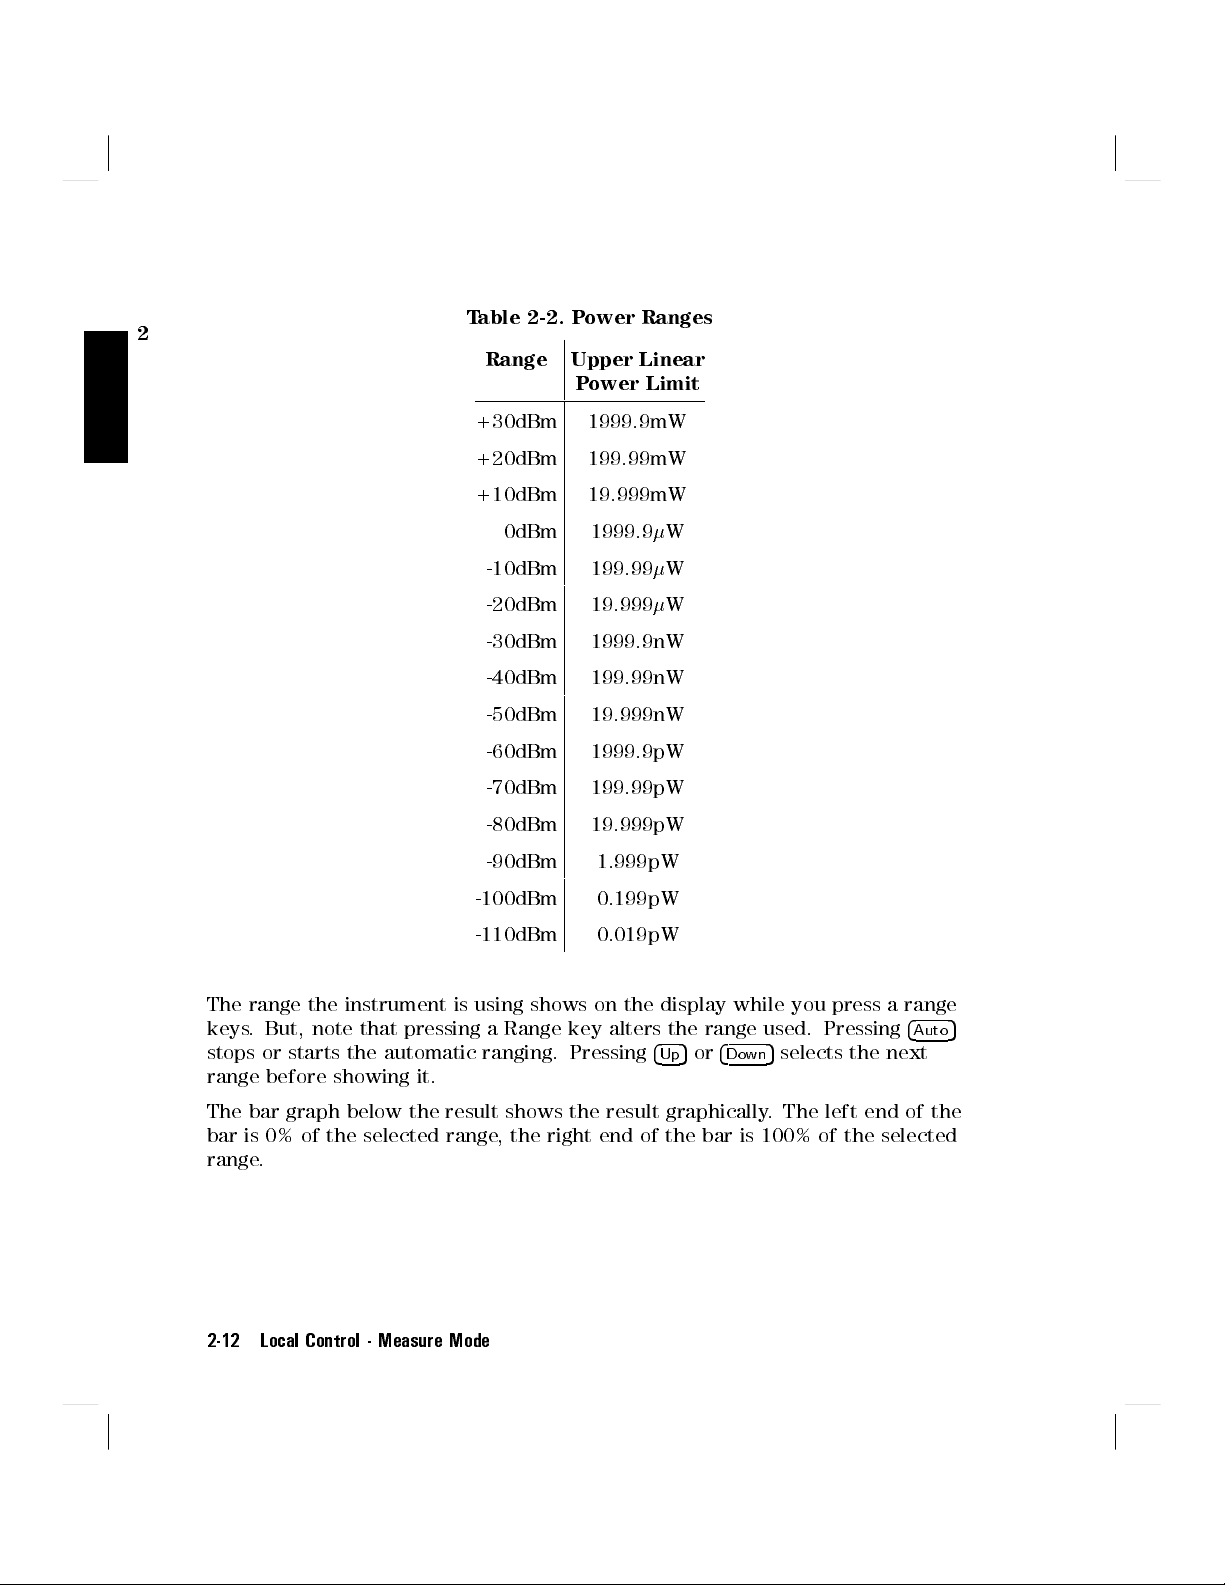
2
Table 2-2. Power Ranges
Range Upper Linear
Power Limit
+30dBm 1999.9mW
+20dBm 199.99mW
+10dBm 19.999mW
0dBm 1999.9W
-10dBm 199.99W
-20dBm 19.999W
-30dBm 1999.9nW
-40dBm 199.99nW
-50dBm 19.999nW
-60dBm 1999.9pW
-70dBm 199.99pW
-80dBm 19.999pW
-90dBm 1.999pW
-100dBm 0.199pW
-110dBm 0.019pW
The range the instrument is using shows on the display while you press a range
keys. But, note that pressing a Range key alters the range used. Pressing
stops or starts the automatic ranging. Pressing
4Up5or4
5
selects the next
Down
4
Auto
range before showing it.
The bar graph below the result shows the result graphically. The left end of the
bar is 0% of the selected range, the right end of the bar is 100% of the selected
range.
2-12 Local Control - Measure Mode
5
The Auto Key
4
5
enables or disables automatic ranging for the result. Automatic ranging
Auto
ensures that the result has a displayed value between 9% and 100% of full
scale. While you have automatic ranging enabled, the operation-indicator shows
AUTO
in the middle of the display. The default state is for automatic ranging to
be enabled.
The Up Key
This key selects the next higher range. If automatic ranging was in operation,
this key disables it.
2
Example
If the instrument is currently in the range 2.000 to 19.999
5
pressing
takes it to the 20.00 to 199.99W range.
4
Up
W,
The Down Key
This key selects the next lower range. If automatic ranging was in operation,
this key disables it.
Example
If the instrument is currently in the -20dBm range
4
5
takes it to the -30dBm range.
Down
, pressing
The Analog Output
The analog output is the BNC connector on the front of the sensor module.It
outputs a voltage directly proportional to the strength of the optical signal at
the optical input, in the current range.
The analog signal is always in the range 0 to 2V, 2V corresponding to a full
power input signal
in the current range
, 0V corresponding to no input signal.
If the range changes, for example, during autoranging, the level to which 2V
corresponds changes. Therefore it is recommended, if you want to use the
analog output, disable autoranging and select the best range for the application
5
with
4Up5or4
Down
.
Possible applications for the analog output, would be to close the feedback
loop controlling the current supplied to a laser; or to monitor optical power on
an oscilloscope (the analog signal reacts instantaneously to the input signal,
whereas the power shown on the display is subject to averaging).
Local Control - Measure Mode 2-13

2
The Modify Keys
You use these keys to edit parameters
.For the purposes of editing, there are
two types of parameter. One type is the parameter that can have one of several,
separate values, these are discrete valued parameters
parameter that can have any value between certain limits
. The second type is the
, these are continuous
valued parameters.
Editing Discrete Valued Parameters
When selecting one of several discrete values, the
value and the
Example
4+5
selects the next lowest value.
The averaging time can have only particular values. If you are
editing this parameter and it is currently 200ms, pressing
4*5
selects the next highest
5
4
*
changes the value to 500ms. If you are editing this parameter
5
and it is currently 200ms, pressing
changes the value to
4
+
100ms.
4)5
and
4(5
have no eect in the editing of discrete valued parameters.
Editing Continuous Valued Parameters
Where a value is being set from between certain limits, you can edit each
character individually.
The
5
changes the editable character to the next one on the left. The
4
(
5
4
)
changes the editable character to the next one on the right. The editable
characters include each digit of numeric parameters, the decimal point (see
below), and characters in messages. When a character is selected for editing it
blinks.
Pressing
4+5
decrements the editable character. The
4*5
increments the editable
character.
Editing Units
To edit the magnitude of Watt values, select the decimal point as the editable
5
character. Use the
5
to move the decimal point to the left, use
4
+
to move the
4
*
decimal point to the right.
When the decimal point reaches its rightmost or leftmost position, pressing the
key again changes the multiplier of the units.
2-14 Local Control - Measure Mode

Example
If you are editing a reference, and the value is 234.5W, with
the eld of edit at the decimal point, pressing
4+5
changes the
value to 2.345nW.
Similarly, if you are editing a reference, and the value is
2.345W, with the eld of edit at the decimal point, pressing
changes the value to 234.5mW.
2
4*5
Local Control - Measure Mode 2-15


3
Menu Mode
In menu mode the instrument oers several advanced test applications. When
the instrument is in this mode, the mode-indicator shows
MENU
. In this mode the
blue legends, above the keys, show the commands available to the user.
The Chan Key
4
5
selects the channel. This can be A or B. The channel- indicator, at the top
Chan
of the display, shows the selected channel.
Note
When the instrument is under remote control, this key acts as
Functions in the Menu mode apply only to the selected channel.
4
5
. That is,it
Local
returns the instrument to local control (unless Local Lockout is active).
3
The Mode Key
4
5
changes the operating mode. If you press this key in menu mode,it
Mode
changes the instrument into measure mode (the previous chapter gives a
description of measure mode).
Note
The commands described in this chapter can only be used when
the instrument is in Menu mode.
Local Control - Menu Mode 3-1

The System Key
4
5
System
changes the instrument to system mode (the next chapter gives a
description of system mode).
3
The Modify Keys
The section \The Modify Keys" in Chapter 2, gives a description of how to use
the Modify keys.
The Loss Key
4
5
starts the loss application. You need both a source and a sensor module to
Loss
run this application.
A loss measurement tells you how much of your optical signal you lose by
passing it through a device.You calculate loss by the following formula:
P
out
)
Loss
=10
log
To measure loss you need both quantities,P
(
P
in
in
dB
and P
. The application
out
measures Pinwhen you start it running. Once you have taken a reference, the
instrument expresses all the following results relative to this. These results are
loss results.
Preparation
You need both a source and a sensor module for the Loss application.
Before you start the Loss application, make sure that you have set all the
measurement-parameters that you use. It is most important to make sure that
you have setTfor the sensor andfor the source. If you are already in Menu
mode, you have to return to Measure mode to set these parameters.
3-2 Local Control - Menu Mode

Running the Loss Application
After pressing
4
5
, the instrument checks to see if both a source and sensor
Loss
module are present. If one or both are missing the character eld shows the
message
CONFIG ?
. The instrument does not enter the loss application.
If both modules are present:
The sensor wavelength is automatically set to the wavelength of the source.
(When you stop the application running, the parameters for the sensor are
automatically reset to the values in use before you started the application.)
The operation-indicator shows
APPL
, this stays lit while the instrument is in
the loss application.
The instrument shows
LOSS
in the character eld.
The instrument reads the reference level when you start the application
running. To read the input signal and use it as the reference
, do the following:
1. Make sure that the device under test is not in the system.
2. Make sure that the source is not active. The sourceisactive whenever the
green LED on its front panel lights.
3. Connect the source to the input of the system without the device under test.
4. Connect the output of the system to the sensor.
3
Figure 3-1. Measuring the Reference for the Loss Application
5. Press
4
Exec
5
.
The instrument takes the reference and then runs the application. While the
application is running, the
RUN
operation-indicator lights.
Local Control - Menu Mode 3-3

Warning
Do not look into the end of an optical cable attached to a
laser output when the device is operational.
3
Note
Once you have taken the reference, you can place the device under test into the
system.
Figure 3-2. Measuring the Loss of a Device Under Test (DUT)
Do not stop and restart the application as you insert and change devices
under test. Every time you start the application, the instrument takes a
new reference.You can switch the source o and on without disturbing the
reference value. Do this to avoid exposure to laser radiation when you are
changing the device under test.
Do not disconnect the ber from the source when making a loss
measurement. A small change in the coupling at the source can
introduce large errors into your measurement.
While the application is running, the result eld shows the loss,indB, and the
character eld shows the reference, in dBm. 1 indicates the result eld and 2
indicates the character eld in Figure 3-3. If you are using both wavelengths
of a dual wavelength source, the loss and reference for both wavelengths are
displayed. The loss and reference for the lower wavelength is shown on the
left. The loss and reference for the higher wavelength is shown on the right.
3-4 Local Control - Menu Mode

Figure 3-3. The Loss Result
4
5
stops the application running.
Exec
The Record Key
4
5
Record
number of samples in succession. There are three types of record application.
starts the record applications. Record applications allow you to take a
Stability takes samples at evenly spaced intervals over a specied period.
Logging takes a specied number of samples one immediately after the other.
That is, as soon as the rst sample has ended, the second starts.
3
Manual Logging takes a sample each time the user presses the
In addition, there are plot and print applications that allow you to make a
graphics plot, or a printout of the samples of your record application.
The nal application on the Record key is the MinMax application, which
displays minimum measured value and the dierence between this minimum
and the maximum measured value, for a changing power level.
Local Control - Menu Mode 3-5
4
Exec
5
key.

Preparation
You need a sensor module to perform any of the record applications.For the
stability, or either of the logging applications
is to have the device under test connected to the sensor.
3
Figure 3-4. Setup for a Record Application
To make a plot of the samples you need a HPGL plotter.To get a printout of
the samples you need a Thinkjet printer. If you are using a plotter or a printer,
it must be attached as the only device to the HP-IB connector on the back of
the instrument. The device address of the plotter must be set to 5. The device
address of the printer must be set to 1. To output to a printer or plotter, the
instrument HPIB State must be set to Talk Only (for instructions on how to do
this see \MODE" in Chapter 4).
, the only hardware setup you need
With Firmware revisions 1.7 and greater, to output to a printer or plotter, the
instrument HPIB State must be set to Talk Listen (the default condition). For
information on setting the HPIB Status, see \MODE" in Chapter 4.
Note
Before you start a record application, make sure that you have set all the
measurement-parameters that you use. It is most important to make sure that
3-6 Local Control - Menu Mode
To nd the rmware revision, switch o the instrument, and
then hold any key while the instrument is powering up. The
rmware revision is shown at the bottom right of the display.
Switch o the instrument and power it up again for normal
operation.

you have setTandfor the sensor. If you are already in Menu mode, you have
to return to Measure mode to set these parameters.
After pressing
4
5
Record
and
4
5
, you choose an application using
Record
4
5
choose the next of the record applications.
Next
4
Record
5,4
4
Prev
Next
5or4
Prev
5
chooses the
5
.
previous of the record applications. While you are in the record applications the
APPL
operation-indicator lights. The application is displayed in the character
eld of the selected channel.
The Stability Application
In the Stability application the instrument makes a number of evenly spaced
samples over a period specied by the user. The application rst takes
consecutive samples of the power from the device under test (that is, the next
sample begins as soon as the previous one has nished). Some of this data is
then discarded so that the samples are evenly spaced over the whole of the
specied period. The maximum number of samples is 500.
Example
is set to 1s (T
T
avg
isTset in Measure mode).
avg
The user sets the total time for the stability application to 8
minutes and 22 seconds. This is a total time of 502 seconds.
The instrument takes 502 samples, but discards every second
sample so that at the end, there are 251 evenly spaced samples.
When you select the Stability application the character eld shows
STABILTY
.
3
Figure 3-5. Selecting an Application : Stability
Local Control - Menu Mode 3-7

This application has two parameters.
application.
AUTODUMP
enables or disables the automatic plotting or printing
T_TOTAL
sets the total time for Stability
of the samples when the application nishes. All the other parameters
(Wavelength, T
Press
4
5
to look at, or edit the parameters. After pressing
Edit
parameters using
3
operation-indicator lights.
, etc.) use the values given to them in measure mode.
avg
4
Edit
4
5
and
4
5
Next
. While you are editing a parameter, the
Prev
5
, you can select
EDIT
T TOTAL
When you select this parameter, the left side character eld shows the message
T_TOTAL
. The right side character eld shows the value for the total time
.
You edit the time using the Modify keys. The lower limit for the time is 1
second. The higher limit for the total time is 99 hours
, 59 minutes and 59
seconds. The displayed value is always the setting for the total time. Due to
the way the measurements are taken, you may nd that the application runs
for a little longer than
T_TOTAL
depends on a number of factors including the system conguration.
T_TOTAL
. The dierence of the actual total time from
The worst case timing dierence is 30s/h.
You can press
4
5
if you have nished editing, or you can press
Edit
4
Next
5or4
Prev
to edit the other parameter.
AUTODUMP
When you select this parameter, the left side character eld shows the message
AUTODUMP
. The right side character eld shows whether the automatic dump
has been enabled. The dump can be a plot of the samples or a printout of the
samples. If the automatic dump is enabled the dump is made after the Stability
application has taken the last sample.
Note
Other applications also use the same
AUTODUMP
parameter.
Changing this parameter in the Logging application aects the
Stability application.
The Plot application sets the parameters for an automatic
plot. The Print application sets the parameters for an
automatic print. These applications are described later in this
chapter.
You should not enable automatic dumping to a printer or
plotter if there is a logging or stability application running in
the other channel. The automatic dump is given priority, and
3-8 Local Control - Menu Mode
5

the application in the other channel will be stopped for the
duration of the print or plot.
In the case of a logging application, the linearity of the timing
information is aected. In the case of a stability application,
no new data is recorded while the dump is being made.
You edit the dump enable using the Modify keys. It can have the value
to disable both the automatic plot and the automatic print,
the plot, or
PRINTER
, to enable the print. The displayed value is always the
PLOTTER
OFF
,
to enable
setting for the dump.
You can press
4
5
if you have nished editing, or you can press
Edit
4
Next
5or4
Prev
to edit the other parameter.
Running the Stability Application
5
To run the application, press
you are editing parameters. While the application is running, the
.You cannot run the application if
4
Exec
RUN
operation-indicator lights.
While the application is running, the result eld shows the sample, and the
character eld shows the time remaining until the application nishes. After all
the samples have been taken, the
4
5
suspends the running of the application. You can restart it by pressing
Pause
4
5
a second time. When you have pressed pause, you can look at the
Pause
RUN
operation-indicator switches o.
parameters set for the application in the Measure mode.You select parameters
with
4
5
and
4
5
Next
4
5
stops the application running.
Exec
Prev
.
3
5
Local Control - Menu Mode 3-9
The Logging Application
In the Logging application the instrument makes a number of consecutive
samples. The user species the number of samples
. Consecutive samples are
samples where one begins as soon as the previous one has nished.
3
When you select the Logging application the character eld shows
This application has several parameters.
that are to be taken.
AUTODUMP
enables or disables the automatic plotting or
printing of the samples when the application nishes.
SAMPLES
sets the number of samples
START
LOGGING
determines the
.
conditions that have to be met before the application starts taking samples.
THRESHLD
starts taking samples. All the other parameters (Wavelength, T
sets the threshold power that must be crossed before the application
, etc.) use the
avg
values given to them in measure mode.
5
5
Press
to look at, or edit the parameters. After pressing
4
Edit
parameters using
4
Next
5
and
5
. While you are editing a parameter, the
4
Prev
, you can select
4
Edit
EDIT
operation-indicator lights.
The total time for the logging application consists of the averaging time and the
time to process the sample. That is, a sample is only taken after the previous
sample has been taken and processed.
The processing time depends on a number of factors including the system
conguration. If any applications or measurements are running in the other
channel, the processing time between samples may vary.
On printer or plotter outputs, the total time given for the logging application
includes both the averaging and the processing time.
SAMPLES
When you select this parameter, the left side character eld shows the message
SAMPLES
. The right side character eld shows the number of samples to be
taken.
3-10 Local Control - Menu Mode

Figure 3-6. Editing an Application Parameter : Samples
You edit the number of samples using the Modify keys. The lower limit is 2.
The higher limit is 500. The displayed value is always the setting for the
number of samples.
3
You can press
4
5
if you have nished editing, or you can press
Edit
4
Next
5or4
Prev
to edit the other parameters.
AUTODUMP
When you select this parameter, the left side character eld shows the message
AUTODUMP
. The right side character eld shows whether the automatic dump
has been enabled. The dump can be a graphic plot of the samples or a printout
of the samples. If the automatic dump is enabled the dump is made after the
Stability application has taken the last sample.
Note
Other applications also use the
AUTODUMP
parameter. Changing
this parameter in the Logging application aects the Stability
application.
The Plot application sets the parameters for an automatic
plot. The Print application sets parameters for an automatic
print. These applications are described later in this chapter.
You should not enable automatic dumping to a printer or
plotter if there is a logging or stability application running in
the other channel. The automatic dump is given priority, and
the application in the other channel will be stopped for the
duration of the print or plot.
5
Local Control - Menu Mode 3-11

In the case of a logging application, the linearity of the timing
information is aected. In the case of a stability application,
no new data is recorded while the dump is being made.
You edit the dump enable using the Modify keys. It can have the values
3
the plot, or
PRINTER
, to enable the print. The displayed value is always the
to disable both the automatic plot and the automatic print,
PLOTTER
OFF
to enable
,
setting for the dump.
You can press
5
if you have nished editing, or you can press
4
Edit
4
Next
5or4
Prev
5
to edit the other parameter.
START
When you select this parameter, the left side character eld shows the message
START
. The right side character eld shows which of the start conditions has
5
been enabled. The application can be started immediately when you press
4
Exec
,
or it can be started when the input power-level is above or below a certain
threshold.
You edit the start condition using the Modify keys. It can have the values
IMMEDIAT
, to start the application when you press
4
Exec
5,ABOVE
to start the
application when the input power-level is above a certain threshold, or
BELOW
, to start the application when the input power-level is below a certain
threshold. The displayed value is always the setting for the start condition.
You can press
4
5
if you have nished editing, or you can press
Edit
4
Next
5or4
Prev
5
to edit the other parameter.
THRESHLD
You can only select this parameter when
START
is set to
ABOVEorBELOW
. When
you select this parameter, the left side character eld shows the message
THRESHLD
. The right side character eld shows the threshold that has to be
crossed before the application starts taking samples.
You edit the threshold using the Modify keys. The lower limit is -400.00dBm.
The higher limit is 400.00dBm. The displayed value is always the setting for
the threshold.
You can press
4
5
if you have nished editing, or you can press
Edit
4
Next
5or4
to edit the other parameters.
3-12 Local Control - Menu Mode
Prev
5

Running the Logging Application
To run the application, press
you are editing parameters. While the application is running, the
4
5
.You cannot run the application if
Exec
RUN
operation-indicator lights.
While the application is running, the result eld shows the sample, and the
character eld shows the number of samples that have been taken. After all the
samples have been taken, the
4
5
suspends the running of the application. You can restart it by pressing
Pause
5
4
a second time. When you have pressed pause, you can look at the
Pause
RUN
operation- indicator switches o.
parameters set for the application in the Measure mode.You select parameters
5
4
Prev
.
5
with
4
Exec
5
and
4
Next
stops the application running.
The Manual Logging Application
In the Manual Logging application the instrument takes a sample every time the
5
user presses
When you select the Logging application the character eld shows
Press
4
5
to look at the existing samples, or to take a sample again. After
Edit
pressing
4
Edit
editing samples, the
5
press
, the input power-level replaces the power-level logged for the
4
Exec
.
4
Exec
MAN LOGG
5
you can select a sample using the Modify keys. While you are
EDIT
operation- indicator lights.To take a sample again,
.
chosen sample.
3
5
Press
if you have nished editing.
4
Edit
Running the Manual Logging Application
While the application is running, the result eld shows the input power-level,
and the character eld shows the number of samples taken.
5
To take a sample, press
5
. When you press
4
Exec
the result is stored as the
4
Exec
next sample.
Example
The user is not currently editing samples. The character eld
shows
#61
, that is, 61 samples have been taken. On pressing
Local Control - Menu Mode 3-13
4
5
, the input power-level is read and stored as sample
Exec
number 62.
#62
is shown in the character eld.
While a sample is being taken, the
RUN
operation-indicator lights.
3
The Plot Application
In the Plot application the instrument takes the samples from a Stability or
Logging application and generates a plot of the samples.You can only plot
the samples from the most recent StabilityorLoggingorManual Logging
application.
To make a plot of the samples you need a HPGL plotter
. The plotter must
be attached as the only device to the HP-IB connector on the back of the
instrument. The device address of the plotter must be set to 5. T
plotter the instrument HPIB State must be set to T
alk Only (for instructions on
o output to a
how to do this see \MODE" in Chapter 4).
With Firmware revisions 1.7 and greater, to output to a printer or plotter, the
instrument HPIB State must be set to Talk Listen (the default condition). For
information on setting the HPIB Status, see \MODE" in Chapter 4.
Note
To nd the rmware revision, switch o the instrument, and
then hold any key while the instrument is powering up. The
rmware revision is shown at the bottom right of the display.
Switch o the instrument and power it up again for normal
operation.
When you select the Plot application the character eld shows
application has several parameters.
scaling of the plot.
Y_MAX
sets the maximum value on the y-axis of the plot.
Y_MIN
sets the minimum value on the y-axis of the plot.
AUTOSCAL
enables or disables automatic
COMMENT
character message printed on the plot for identication.
Press
4
5
to look at, or edit the parameters. After pressing
Edit
parameters using
4
Next
5
and
4
5
. While you are editing a parameter, the
Prev
operation-indicator lights.
3-14 Local Control - Menu Mode
PLOT
. This
is an eight
4
5
, you can select
Edit
EDIT

AUTOSCAL
When you select this parameter, the left side character eld shows the message
AUTOSCAL
. The right side character eld shows whether automatic scaling has
been enabled. If automatic scaling is enabled the instrument decides the best
limits for the y-axis by examining the samples.
You edit the automatic scaling enable using the Modify keys. It can have
the value
OFF
, to disable both automatic scaling, orON, to enable automatic
scaling. The displayed value is always the setting for the scaling.
3
You can press
4
5
if you have nished editing, or you can press
Edit
4
Next
5or4
Prev
to edit the other parameters.
The maximum and minimum values you choose for the graph, when autoscaling
is o, are subject to rounding. The nal scaling is calculated to give eleven
divisions of the y-axis with standard spacings (that is
, spacings that are multiples
of 1, 2 or 5).
Y MIN
You can only select this parameter when
select this parameter, the left side character eld shows the message
AUTOSCAL
is set to
OFF
. When you
Y_MIN
. The
right side character eld shows the minimum value for the y-axis of the plot.
You edit the y-axis minimum value using the Modify keys
. The lower limit is
-800.00dBm. The higher limit is 800.00dBm. The displayed value is always
the setting for the minimum.
You can press
4
5
if you have nished editing, or you can press
Edit
4
Next
5or4
Prev
to edit the other parameters.
Y MAX
You can only select this parameter when
select this parameter, the left side character eld shows the message
AUTOSCAL
is set to
OFF
. When you
Y_MAX
. The
right side character eld shows the maximum value for the y-axis of the plot.
5
5
You edit the y-axis maximum value using the Modify keys. The lower limit is
-800.00dBm. The higher limit is 800.00dBm. The displayed value is always
the setting for the maximum.
You can press
4
5
if you have nished editing, or you can press
Edit
4
Next
5or4
Prev
to edit the other parameters.
Local Control - Menu Mode 3-15
5

COMMENT
When you select this parameter the left side character eld shows the message
COMMENT
. The right side character eld shows the comment string. The comment
string is included so that you can identify the plot.
3
Note
Other applications in the same channel share the
COMMENT
parameter. Changing this parameter in the Plot application
aects the Print application.
You edit the comment using the Modify keys. There are eight characters in
the comment and each of these can be a number (0to9), a math symbol (-,
+
), a space, a letter (AtoZ), or punctuation symbols (!,?,.,,,:,;,&,|,@,
#,$,%,*,[,],
,or!). The displayed characters are always the setting for
the comment.
You can press
5
if you have nished editing, or you can press
4
Edit
4
Next
5or4
Prev
5
to edit the other parameters.
Running the Plot Application
To run the application, press
you are editing parameters. While the application is running, the
4
5
.You cannot run the application if
Exec
RUN
operation-indicator lights.
If you try to run the plot without samples or with invalid samples, the message
NO DATA
After the plot has nished, the
4
Exec
,or
DATA ?
5
stops the application running. The message
, shows in the character eld. The application does not run.
RUN
operation-indicator switches o.
ABORTED
shows in the
character eld.
Reading the Plot
Figure 3-7 shows a sample plot. The areas on this gure are:
The HP logo and the instrument number.
The type of record application that produce the samples. This is one of
STABILITY,LOGGING
,or
MAN LOGG
.
The comment. The message set up in the Plot application is included here on
the plot.
3-16 Local Control - Menu Mode
The rst column of data contains the parameters set in Measure mode. These
are
T avg
, the averaging time,
wavelength, and
included when the samples were taken as absolute values.
The second column of data contains the parameters set in Menu mode for
the application. These are
was taking samples, and
column is the data and time at which the record application was run.
The total time for the logging application consists of the averaging time
and the time to process the sample. That is, a sample is only taken after
the previous sample has been taken and processed. On the plot, the total
time given for the logging application includes both the averaging and the
processing time.
Reference
Cal Fact
, the reference power-level. The reference is not
T total
Samples
, the number of samples taken. Also in this
the calibration factor,
, the period for which the application
Wvl
, the
3
Local Control - Menu Mode 3-17

3
Figure 3-7. Stability Plot
The third column of data contains statistics based on the samples taken.
These are
power-level sampled,
maximum power-levels sampled, and
Max
, the maximum power-level sampled,
Diff
, the dierence between the minimum and
Avg
, the mean average of the samples.
Min
the minimum
Note
The quantity on the y-axis of the plot is always power. The units can be dBm,
dB,orWatts.
3-18 Local Control - Menu Mode
If the samples are taken in dB or dBm,
of these logarithmic values. If the samples are taken in Watts,
Avg
is the mean average of the linear values.
Avg
is the mean average

The quantity on the x-axis of the plot is time for the plot of samples from a
Stability or a Logging application, or the number of samples for the plot from
a Manual Logging application. The units of time can be seconds, minutes or
hours.
The plot is of the power as a function of time for the Stability or Logging
applications. The plot is of power as a function of the number of samples
taken for the Manual Logging application.
Horizontal dotted lines are drawn on the plot at the maximum, minimum and
average power-levels sampled. A vertical dotted line marks the nal sample.
The Print Application
In the Print application the instrument takes the samples from a Stability or
Logging application and generates a graphic printout of the samples.You can
only printout the samples from the most recent StabilityorLoggingorManual
Logging application, in the selected channel.
To make a printout of the samples you need a Thinkjet printer. The printer
must be attached as the only device to the HP-IB connector on the back of the
instrument. The device address of the printer must be set to 1. To output to a
printer the instrument HPIB State must be set to Talk Only (for instructions on
how to do this see \MODE" in Chapter 4).
3
With Firmware revisions 1.7 and greater, to output to a printer or plotter, the
instrument HPIB State must be set to Talk Listen (the default condition). For
information on setting the HPIB Status, see \MODE" in Chapter 4.
Note
To nd the rmware revision, switch o the instrument, and
then hold any key while the instrument is powering up. The
rmware revision is shown at the bottom right of the display.
Switch o the instrument and power it up again for normal
operation.
When you select the Print application the character eld shows
application has several parameters.
scaling of the plot.
Y_MAX
sets the maximum value on the y-axis of the plot.
Y_MIN
sets the minimum value on the y-axis of the plot.
AUTOSCAL
enables or disables automatic
COMMENT
PRINT
is an eight
. This
character message printed on the plot for identication.
Local Control - Menu Mode 3-19

Press
4
5
to look at, or edit the parameters. After pressing
Edit
parameters using
4
Next
5
and
operation- indicator lights.
AUTOSCAL
4
4
5
. While you are editing a parameter, the
Prev
5
, you can select
Edit
EDIT
3
When you select this parameter, the left side character eld shows the message
AUTOSCAL
. The right side character eld shows whether automatic scaling has
been enabled. If automatic scaling is enabled the instrument decides the best
limits for the y-axis by examining the samples.
Note
Other applications in the same channel share the
AUTOSCAL
parameter. Changing this parameter in the Print application
aects the Plot application.
You edit the automatic scaling enable using the Modify keys. It can have
the value
OFF
, to disable both automatic scaling, orON, to enable automatic
scaling. The displayed value is always the setting for the scaling.
You can press
4
5
if you have nished editing, or you can press
Edit
4
Next
5or4
Prev
5
to edit the other parameters.
The maximum and minimum values you choose for the graph, when autoscaling
is o, are subject to rounding. The nal scaling is calculated to give eleven
divisions of the y-axis with standard spacings (that is, spacings that are multiples
of 1, 2 or 5).
Y MIN
You can only select this parameter when
select this parameter, the left side character eld shows the message
AUTOSCAL
is set to
OFF
. When you
Y_MIN
. The
right side character eld shows the minimum value for the y-axis of the plot.
Note
Other applications in the same channel share the
Y_MIN
parameter. Changing this parameter in the Print application
aects the Plot application.
You edit the y-axis minimum value using the Modify keys. The lower limit is
-800.00dBm. The higher limit is 800.00dBm. The displayed value is always
the setting for the minimum.
3-20 Local Control - Menu Mode

You can press
4
5
if you have nished editing, or you can press
Edit
to edit the other parameters.
Y MAX
4
Next
5or4
Prev
5
You can only select this parameter when
select this parameter, the left side character eld shows the message
AUTOSCAL
is set to
OFF
. When you
Y_MAX
. The
right side character eld shows the maximum value for the y-axis of the plot.
Note
Other applications in the same channel share the
Y_MAX
parameter. Changing this parameter in the Print application
aects the Plot application.
You edit the y-axis maximum value using the Modify keys
. The lower limit is
-800.00dBm. The higher limit is 800.00dBm. The displayed value is always
the setting for the maximum.
You can press
5
if you have nished editing, or you can press
4
Edit
4
Next
5or4
Prev
to edit the other parameters.
COMMENT
When you select this parameter the left side character eld shows the message
COMMENT
. The right side character eld shows the comment string. The comment
string is included so that you can identify the plot.
Note
Other applications in the same channel share the
COMMENT
parameter. Changing this parameter in the Print application
aects the Plot application.
3
5
You edit the comment using the Modify keys. There are eight characters in
the comment and each of these can be a number (0to9), a math symbol (-,
+
), a space, a letter (AtoZ), or punctuation symbols (!,?,.,,,:,;,&,|,@,
#,$,%,*,[,],
,or!). The displayed characters are always the setting for
the comment.
You can press
5
if you have nished editing, or you can press
4
Edit
4
Next
5or4
to edit the other parameters.
Local Control - Menu Mode 3-21
Prev
5

Running the Print Application
To run the application, press
you are editing parameters. While the application is running, the
operation-indicator lights.
3
If you try to run the print without samples or with invalid samples, the message
NO DATA
After the print has nished, the
4
Exec
character eld.
Reading the Printout
The following gure shows a sample of the printout.
,or
DATA ?
5
stops the application running. The message
, shows in the character eld. The application does not run.
4
5
.You cannot run the application if
Exec
RUN
operation-indicator switches o.
ABORTED
RUN
shows in the
3-22 Local Control - Menu Mode

3
Figure 3-8. Logging Printout
The areas on the gure are:
The header contains the instrument number. Also in the printout header is
the data and time at which the record application was run.
The application parameters are given in three blocks. In the rst block is the
type of application that took the samples. This is one of
or
MANUAL LOGGING
.
STABILITY,LOGGING
Local Control - Menu Mode 3-23
,

Also in the rst block is the Measurement type, this describes the channel
used, and how the readings were made, for example,
absolute readings were made in channel A, or
B / REF
Ch. A (Absolute)
when
when relative readings
were made in channel B.
The last element in the rst block is the comment. The message set up in the
3
Plot application is here on the printout.
The second block of data contains the parameters set in Measure mode.
These are
wavelength, and
T avg
, the averaging time,
Reference
Cal Fact
the calibration factor,
Wvl
, the
, the reference power-level. The reference is not
included when the samples were taken as absolute values.
The third block of data contains the parameters set in Menu mode for the
application. These are
taking samples, and
T total
Samples
, the period for which the application was
, the number of samples taken.
The total time for the logging application consists of the averaging time and
the time to process the sample. That is, a sample is only taken after the
previous sample has been taken and processed. On the printout, the total
time given for the logging application includes both the averaging and the
processing time.
The nal block of data contains statistics based on the samples taken. These
are
Max
, the maximum power-level sampled,
sampled,
Diff
, the dierence between the minimum and maximum
power-levels sampled, and
Avg
, the mean average of the samples.
Min
the minimum power-level
Note
If the samples are taken in dB or dBm,
Avg
is the mean average
of these logarithmic values. If the samples are taken in Watts,
Avg
is the mean average of the linear values.
The printer now outputs a graph with the same format as the plot (see
Figure 3-7). That is,
The quantity on the y-axis of the graph is power. The units can be dBm, dB,
or Watts.
The quantity on the x-axis of the graph is time for the graph of samples from
a Stability or a Logging application, or the number of samples for the graph
from a Manual Logging application. The units of time can be seconds, minutes
or hours.
3-24 Local Control - Menu Mode

The graph is of the power as a function of time for the Stability or Logging
applications. The graph is of power as a function of the number of samples
taken for the Manual Logging application.
Horizontal dotted lines are drawn on the graph at the maximum, minimum
and average power-levels sampled.
The MinMax Applications
MinMax is only supplied with software versions 2.1 and later.
3
Note
To nd the rmware revision, switch o the instrument, and
then hold any key while the instrument is powering up. The
rmware revision is shown at the bottom right of the display.
Switch o the instrument and power it up again for normal
operation.
The MinMax applications are intended principally for polarization dependent
measurements, but can be used for other types of measurement.
MinMax measures the incoming power, and displays the minimum value
measured (at the bottom of the display), and the dierence between this
minimum and the maximum value measured (at the top of the display).
There are three modes of operation.
Continuous mode, which compares each new measured value with the
maximum and minimum values so far, and replaces them as necessary.
This mode is useful for measuring the Polarization Dependent Loss (PDL) of a
component. Run the application while sweeping the polarization of the source
applied to the component.
Window mode, which compares each new measured value with the maximum
and minimum values for the lastNsamples (N, the number of samples is set
by the user).
Refresh mode, which compares each new measured value with the maximum
and minimum values for the currentNsamples (N, the number of samples is
set by the user). The minimum and maximum are calculated and displayed for
one set of samples at a time, after the full set of samples have been measured.
Local Control - Menu Mode 3-25

The Window and Refresh modes are for use, for example, when you are
searching for or setting the position of minimum PDL.
Note
The length of the window
, or the refresh period must be shorter
than the rate at which you are changing the polarization, in this
case.
3
Figure 3-9. The Window and Refresh Modes
3-26 Local Control - Menu Mode

MODE
This is the parameter which chooses the mode,
CONT
selects the continuous mode,
WINDOW
REFRESH
selects the Window mode, and
selects the Refresh mode.
SAMPLES
This is the parameter which sets the length of the Window or Refresh mode.
It is possible to use up to 500 samples in the Window mode.
It is possible to use up to 10000 samples in the Refresh mode.
The length of the window or the refresh period is set by the number of samples,
and the averaging time. The averaging time is set in Measure mode.
Running the MinMax Application
5
To run the application, press
editing parameters (press
4
Edit
application is running, the
RUN
.You cannot run the application if you are
4
Exec
5
again, to nish editing parameters). While the
operation-indicator lights.
While the application is running, the result eld shows the dierence between
minimum and maximum measurements, and the character eld shows the
minimum measurement.
4
5
suspends the running of the application. While the application is paused,
Pause
the power level is shown in the result eld. You can restart the MinMax
5
application by pressing
4
a second time.
Pause
3
4
5
stops the application running.
Exec
Local Control - Menu Mode 3-27

The More Key
4
5
gets you into the other applications. The full list of these applications
More
depends on the modules that you have installed. There are two that are
standard, these come with the mainframe. They are the show and the alignment
applications.
3
After pressing
4
5
, you choose an application using
More
acts in the same way as
4
5,4
Next
4
5
. The application is displayed in the character eld
Next
More
5or4
Prev
5.4
More
5
of the selected channel.
The Show Application
In the Show application you can look at the samples from a Stability or Logging
application. You can only look at the samples from the most recent Stability
or
LoggingorManual Logging application.
When you select the Show application the character eld shows
application has no parameters that can be modied.
Press
4
5
to look at the stored values. While you are looking at the stored
Edit
values, the
you use
4
Prev
EDIT
operation-indicator lights.To move from one value to another
5
and
4
5
.
Next
MAXIMUM
When
MAXIMUM
shows in the left side character eld, the value in the right side
character eld is the maximum power-level sampled.
MINIMUM
When
MINIMUM
shows in the left side character eld, the value in the right side
character eld is the minimum power-level sampled.
SHOW
. This
3-28 Local Control - Menu Mode

DIFF
When
DIFF
shows in the left side character eld, the value in the right
side character eld is the dierence between the minimum and maximum
power-levels sampled.
AVERAGE
When
AVERAGE
shows in the left side character eld, the value in the right side
character eld is the mean average of the samples.
Note
If the samples are taken in dB or dBm,
Avg
is the mean average
of these logarithmic values. If the samples are taken in Watts,
Avg
is the mean average of the linear values.
#1
When
#1
shows in the left side character eld, the value in the right side
character eld is the rst of the samples taken. To examine the rest of the
samples, use the Modify keys. In this case the Modify keys operate on the value
in the left side character eld.
The Alignment Application
The Alignment application simplies the alignment of two optical components to
get the best transfer of power from one to the other.
3
Preparation
You need a sensor module to perform the Alignment application. The only
hardware setup you need is to have the device under test connected to the
sensor.
Local Control - Menu Mode 3-29

3
Figure 3-10. Setup for an Alignment Application
Before you start the Alignment application, make sure that you have set all the
measurement-parameters that you use. It is most important to make sure that
you have setTandfor the sensor. If you are already in Menu mode, you have
to return to Measure mode to set these parameters.
When you select the Alignment application the character eld shows
This application has several parameters.
TYPE
sets whether the instrument
ALIGNMNT
automatically records the maximum power-level, or the user sets the
maximum power-level.
bar.
MAXPOWER
(Wavelength, T
Press
4
Edit
sets the maximum power- level. All the other parameters
avg
5
to look at, or edit the parameters. After pressing
parameters using
DELTA
sets the range of power shown by the graphic
, etc.) use the values given to them in measure mode.
5
, you can select
4
Edit
5
4
Next
5
and
. While you are editing a parameter, the
4
Prev
EDIT
operation-indicator lights.
TYPE
When you select this parameter, the left side character eld shows the message
TYPE
. The right side character eld shows whether the automatic recording of
the maximum power-level has been enabled.
You edit the mode using the Modify keys. It can have the values
enable the automatic recording of the maximum power- level, or
AUTO
,to
MANUAL
,
where the user sets the maximum power-level. The displayed value is always
the setting for the mode.
3-30 Local Control - Menu Mode
.

You can press
4
5
if you have nished editing, or you can press
Edit
to edit the other parameters.
DELTA
4
Next
5or4
Prev
5
When you select this parameter
DELTA
. The right side character eld shows the value for the delta.
You edit the delta using the Modify keys
, the left side character eld shows the message
. The lower limit is 0.01dB. The
higher limit is 13.00dB. The displayed value is always the setting for the delta.
You can press
4
5
if you have nished editing, or you can press
Edit
4
Next
5or4
to edit the other parameters.
MAXPOWER
You can only select this parameter when
this parameter, the left side character eld shows the message
TYPE
is set to
MANUAL
. When you select
MAXPOWER
. The
right side character eld shows the setting for the maximum power.
You edit the maximum power using the Modify keys. The lower limit is
-400.00dBm. The higher limit is 400.00dBm. The displayed value is always
the setting for the maximum.
You can press
5
if you have nished editing, or you can press
4
Edit
4
Next
5or4
to edit the other parameters.
Running the Alignment Application
To run the application, press
you are editing parameters. While the application is running, the
4
5
.You cannot run the application if
Exec
RUN
operation-indicator lights.
Prev
Prev
3
5
5
While the application is running, the left side result eld shows the maximum
power-level. If
input power-level read since the application started. If
the maximum power-level is set by
TYPE
is set to
AUTO
, the maximum power-level is the maximum
TYPE
is set to
MAXPOWER
. The right side result eld shows
MANUAL
the input power-level, in dB, relative to the maximum power-level.
Local Control - Menu Mode 3-31
,

3
Figure 3-11. The Display during the Alignment Application
The character eld shows the input power-level graphically. The right end
of the character eld always represents the maximum power-level. The left
end of the character eld represents P
power-level, and 1P is determined by
When the the graph is seven dots high, 1P is equal to
1P is now equal to half the value of
high. If you press
4*5
a second time, 1P is equal to a quarter the value of
max
DELTA
DELTA
0
1P, where P
. Pressing
DELTA
is the maximum
max
4*5
and
4+5
. If you press
changes 1P.
and the graph is shown ve dots
4*5
,
DELTA
and the graph is shown three dots high.
Example
DELTA
is set to 1.00dB.
MAXPOWER
is set to 1.00dBm.
The right end of the graph represents 1.00dBm. At the start of
the application The left end of the graph represents 0.00dBm.
4*5
is pressed twice.
The left end of the graph represents 0.75dBm. The graph is
three dots high.
4+5
is pressed once.
The left end of the graph represents 0.50dBm. The graph is ve
dots high.
If only the last column of dots on the left is lit, the power-level is outside the
limits set by P
5
enables and disables the tone. The frequency of the tone increases with
4
Pause
max
0
1P and P
max
input power-level. The lowest frequency corresponds to the left side of the
power graph in the character eld. The highest frequency corresponds to the
right side of the power graph in the character eld. If the power-level is outside
the limits set by P
max
0
1P and P
, no tone sounds.
max
3-32 Local Control - Menu Mode

4
5
stops the application running.
Exec
3
Local Control - Menu Mode 3-33


4
System Mode
System mode is where you set the congurations that aect the instrument as a
whole. When you activate system mode, the mode- indicator shows
the top of the display.
The Mode Key
4
5
selects the operating mode. Pressing this key when in the system mode
Mode
transfers operation to Measure mode.
MENU SYS
at
4
Note
The Modify Keys
See \The Modify Keys" in Chapter 2 for details on how to use the modify keys.
The commands described in this chapter can only be used when
the instrument is in System mode.
Local Control - System Mode 4-1

The System Key
4
5
System
using
selects the parameter-set for modication. You choose a parameter-set
4
Next
5,4
System
5or4
Prev
5.4
System
5
acts in the same way as
4
5
. The current
Next
application is displayed in the character eld of the current channel.
Note
The conguration information is held in memory until the next
time you specically modify it. It is not aected by the power
to the instrument being switched o.
4
RECALL
The recall function sets a channel conguration according to data that has been
stored in memory. When you select the recall function, the left side character
eld shows the message
RECALL
.
Figure 4-1. Making a Selection in System Mode : the Recall Function
There are three parameters for this function. The module type that the
conguration was saved for, the location where the conguration was saved,
and the channel to set with the conguration.
5
Press
to look at or edit the parameters. All of the parameters are displayed
4
Edit
at the same time in the right side character eld. You can select between the
location and the channel using
While you are editing parameters, the mode-indicator shows
Press
4
5
to make a recall of the selected data.
EXEC
4(5
and
4)5
.You cannot edit the module type.
MENU SYS EDIT
4-2 Local Control - System Mode
.

The Module Type
The module type is indicated by the last two numeric digits of the product
number. Not all locations have a module type. That is, the standard setting,
and locations that have not been used to store conguration data do not have a
module type parameter.You must have the correct module type in the selected
channel to make a recall. If you do not, the message
MISMATCH
will be shown
when you try to make a recall.
The Location
The location where the conguration data is stored is a number between 0 and
9. This number is displayed to the left of the arrow.
You edit the location using the Modify keys. The location used for the recall is
the displayed value.
Location 0 always contains the standard setting. The standard setting is:
Parameter Setting
Sensor
4
Module dependent.
CAL 0.000dB.
T 200ms (500ms for Head Interface Module).
REF 1000.0W.
Auto Ranging Enabled.
Units Watts
Display Full Resolution
Source
Module dependent, lower wavelength for dual wavelength
source.
ATT 0.0dB.
AUX CW.
Output Disabled.
The Channel
This is either the letterAor the letterB. It is displayed to the right of the arrow.
You must have the correct module type in the selected channel to make a recall.
Local Control - System Mode 4-3

If you do not, the message
MISMATCH
will be shown when you try to make a
recall.
You edit the channel using the Modify keys. The channel that will be set by the
data is the displayed value.
Example
The character eld shows the message
You press
4
Exec
5
.
RECALL '54 3!A
.
If there is an HP 81554SM in channel A, channel A will be
congured according to the data in location 3.
STORE
4
The store function stores the instrument conguration in memory
. When you
select the store function, the left side character eld shows the message
STORE
.
There are three parameters for this function. The module type for which the
last save to this location was made, the channel for which the information is to
be saved, and the location where the data is to be saved.
5
Press
to look at or edit the parameters. All of the parameters are displayed
4
Edit
at the same time in the right side character eld. You can select between the
location and the channel using
While you are editing parameters, the mode-indicator shows
4(5
and
4)5
.You cannot edit the module type.
MENU SYS EDIT
.
Figure 4-2. Editing a Parameter in System Mode
Press
4
5
to make a store with the selected parameters.
EXEC
4-4 Local Control - System Mode
The Module Type
The module type is shown for the last data that was stored in the selected
location. If no data has been stored in a location, this information is blank. The
module type is indicated by the last two numeric digits of the product number.
The Channel
This is either the letterAor the letterB. It is displayed to the left of the arrow.
You edit the channel using the Modify keys. The channel data that will be saved
is the displayed value.
The Location
The location where the conguration data will be stored is a number between 1
and 9. This number is displayed to the right of the arrow.
You edit the location using the Modify keys. The location used for the recall is
the displayed value.
Example
The character eld shows the message
You press
4
Exec
5
.
STORE '54 3!A
.
If there is an HP 81554SM in channel A, channel A will be
congured according to the data in location 3.
HPIB
The HP-IB conguration sets the parameters aecting how the instrument is
remotely controlled. When you select the HP-IB conguration, the left side
character eld shows the message
There are three parameters for this conguration. These are
the HP-IB address of the instrument,
talk-only operation, and
LANGUAGE
HPIB
.
ADDRESS
MODE
, to set the instrument to control or
, to set
, to set the type of commands that are used
by the instrument.
5
5
Press
to look at or edit the parameters. After pressing
4
Edit
select parameters using
mode-indicator shows
5
and
4
Next
4
Prev
MENU SYS EDIT
5
. While you are editing a parameter, the
.
4
Edit
, you can
4
ADDRESS
When you select this parameter, the left side character eld shows the message
ADDRESS
. The right side character eld shows the setting for the device address
of the instrument.
Local Control - System Mode 4-5
 Loading...