


Agilent Technologies
1670G Series Benchtop
Logic Analyzers
Technical Data
Affordable logic
analyzers designed for
your exact needs
Agilent Technologies 1670G
Series benchtop logic analyzers
enable design engineers to purchase a logic analyzer that meets
their exact needs and their budget.
The 1670G Series models have the
option of a built-in, 500 MHz,
2 GSa/s oscilloscope that can be
triggered by the logic analyzer.
Some of the toughest hardware
debug problems can be found
only with the digital triggering
capabilities of a logic analyzer
and can be solved only with the
analog resolution of an
oscilloscope.
An optional pattern generator in
the 1670G Series allows
designers to substitute stimulus
for missing subsystems during
product development.
The 1670G Series helps
simplify the capture and analysis
of complex events with optional
256K or 2M deep memory. Deep
memory is a valuable logic
analyzer feature for debugging
embedded microprocessor
systems.
The units include a VGA resolution color flat panel display to
help you find information quickly. The user interface helps to
locate the source of design
problems in less time. You have
Figure 1. Agilent’s 1670G Series Benchtop Logic Analyzers Offer Deep Memory
and Integrated Oscilloscope or Pattern Generator Options.
Agilent Model Number 1670G 1671G 1672G 1673G 1664A
_______________________________________________________________________________________
Channel count 136 102 68 34 34
Timing analysis speed 250/500 MHz (full/half channels)
State analysis speed 150 MHz 50 MHz
State clock/qualifiers 4 2
Memory depth/channel
[3]
64/128K (full/half channels) 4/8K
with option 1
[1], [3]
256/512K n/a
with option 2
[3]
2/4M n/a
Option 3
[2]
2-channel, 500 MHz, 2 GSa/s, 32K n/a
(oscilloscope) sample oscilloscope
Option 4 32-channel, 100/200 MHz, 256K n/a
(pattern generator) vector pattern generator
Built-in display color monochrome
LAN port Thin LAN & Ethertwist
[1]
Choose memory option 1 or 2.
[2]
Choose either the scope or the pattern generator (compatible with option 1 or 2).
[3]
Time or state tags halve the acquisition memory when there are no unassigned pods.
the option of using a mouse or
the front panel to easily navigate
through the user interface; a PC
style keyboard is also supported.
A compact all-in-one design
helps save space on a crowded
lab bench.

2
.
Features Benefits
State/timing analyzer Select the number of channels to match your application
(34, 68, 102, 136).
Optional deep memory 256K or 2M of memory allows capture and analysis of much
longer periods of execution. Helps solve poorly understood
or difficult to reproduce problems.
Optional oscilloscope An integrated oscilloscope can be triggered from the
analyzer (and vice versa) and provides the ability to view
analog and digital signals simultaneously.
Optional pattern An integrated pattern generator provides stimulus for
generator missing components, so that testing can begin before the
system is complete.
Trigger functions Trigger functions are depicted graphically and textually, and
may be combined to create custom trigger sequences for
capturing a complex series of events.
Global markers Track a symptom in one domain (e.g. timing) to its cause in
another domain (e.g. analog).
Documentation capability Save screen shots in standard TIFF, PCX, and EPS formats on
disk. Print screen shots and trace listings to a local
printer. Save acquired data in ASCII format for post
processing.
Processor and bus Quickly and reliably connect to a wide variety of specific
support processors and buses. Inverse assemblers allow data to be
viewed at the assembly level.
LAN Ethertwist and ThinLAN connectors support FTP, PC/NFS
protocols, and work with X11 windows packages. Users can
program the analyzer, archive data, and setup files via telnet
sockets.
Probing A wide variety of IC clips, QFP adapters, QFP probes, and
headers are available to help connect the analyzer to the
system under test.
Figure 2. Logic Analyzer Dimensions
and Weight
Figure 3. Diagram of Logic Analyzer’s Front and Rear Panels
pods
external
trigger BNCs
RS-232-C
connector
GPIB
connector
keyboard
parallel printer
connector
LAN
connectors
line power
module
mouse
Weight = 28.6 lbs. (13 kg)
Agilent Technologies 1670G Series Specifications
13.0 in.
(330 mm)
8.1 in.
(205 mm)
17.3 inches
(440 mm)
14.5 in.
(367 mm)
quick menu keys
H
1660ES
LOGIC ANALYZER
done key select key
display
movement keys
MENU
System
Config
Trigger
Listing
Done Select
Page
power on/off
data entry keys
Format
Waveform
Clear
entry
Don't
care
±
.
Q
A
Page
disk drive
DEF
9
567
YU
BA
NM
Run
Cont
Stop
Print
All
I
OP
KH
C
8
4
0123
WER T
SDFGJL
ZXCVB
oscilloscope channels
shift key

3
Figure 4. Configuration Screen
Figure 5. Format Screen
Run—starts data acquisition in
specified trace mode.
Stop—halts acquisition and displays current data.
Acquisition mode and number of
channels (assign pods) are
specified. Timing and State
measurements can be taken
simultaneously.
Activity indicators allow users to
monitor device-under-test
activity during analyzer setup.
User mnemonics defined (for bit
patterns or ranges), or up to 1000
symbols extracted from popular
object module formats. In symbol mode, symbols will be displayed in place of data.
Logic threshold levels.
State speed can be specified
when analyzer is in state mode.
Full channel (250 MHz) or half
channel (500 MHz) can be specified in timing mode. (Screen shot
is in state mode.)
Activity indicators.
Appropriate channels assigned to
a label.
Channels can be grouped and
given a 6-character label.
Maximum of 126 labels with up
to 32 channels each.
Agilent Technologies 1670G Series
Annotated Screen Shots

4
Figure 6. Trigger Screen
Ten pattern recognizers (and bit
patterns in each label) can be
defined.
Edge terms make it easy to trigger on rising or falling edges on
any number of specified signals.
They can also be used to trigger
on glitches to 3.5 ns.
Analyzer and oscilloscope or pattern generator can cross-arm
each other. Arming is started by
Run, Group Run, or the PortIn
BNC (rising edge). PortOut is
asserted as a rising edge at the
PortOut BNC.
Twenty-three trigger functions
(shown graphically and
textually) can be combined to
create custom trigger sequences.
Up to twelve sequence levels
with branching and timers can
be defined.
Agilent Technologies 1670G Series
Annotated Screen Shots
Figure 8. Listing Display
Knob (or hold down right mouse
button) scrolls through listing
display.
Markers measure the time
between events, search for specific events, and gather statistical
data.
Trigger is located at line 0.
Figure 7. Graphical Trigger Function
5
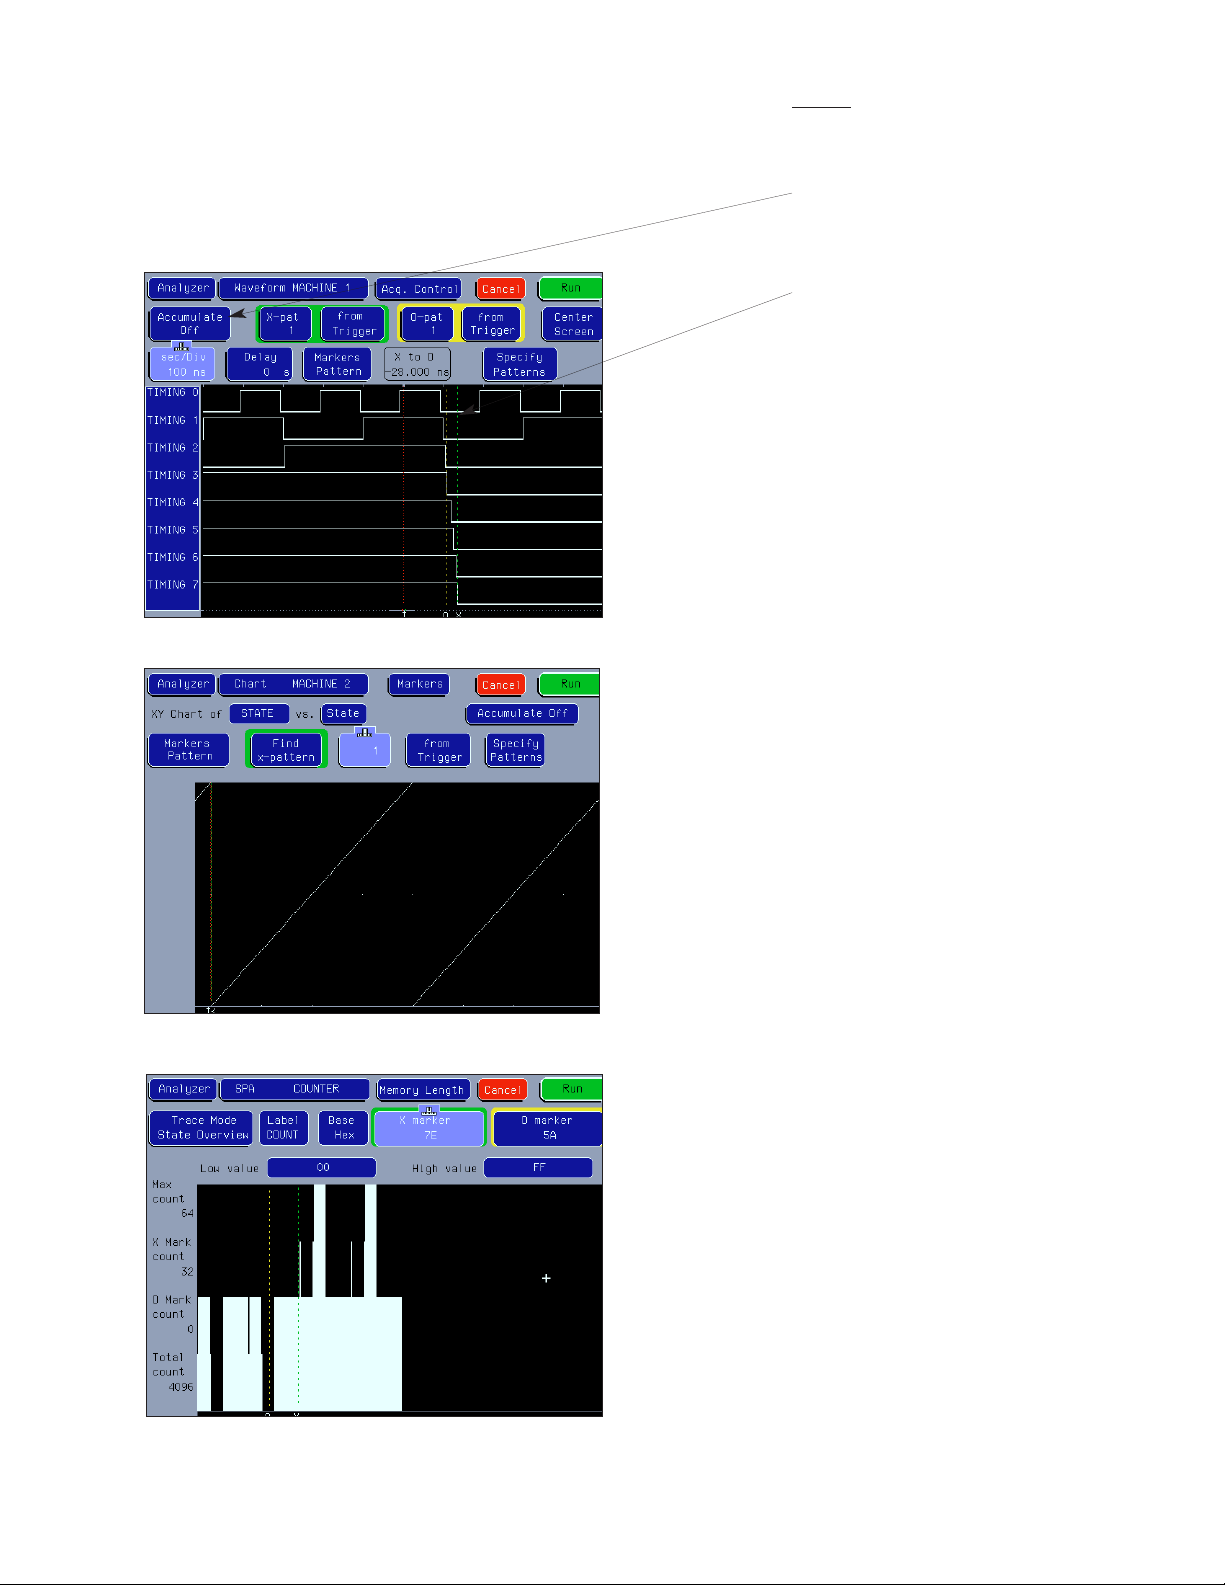
Figure 9. Waveform Display
Figure 10. Chart Display (State Mode Only)
Accumulate—waveform is not
erased between successive
acquisitions (persistence).
All displays are time-correlated,
so the trigger, x, and o markers
are located at equivalent positions in time on each display.
Overlay—multiple channels displayed on one line, with value in
selected base if space permits.
Maximum of 24 lines per screen;
may scroll through up to 96 lines.
Chart mode plots the value of a
specified label (on y-axis)
versus a state number or another
label (on x-axis). Both axes can
be scaled. Useful for A/D converters and obtaining a visual
overview of bus activity (address
flow or data flow).
Agilent Technologies 1670G Series
Annotated Screen Shots
Figure 11. System Performance Analyzer (SPA)
There are three SPA modes available: State Overview (shown
here provides a visual indication
of memory use), State Histogram
(% time spent in each function),
and Time Interval (execution
time of a particular function).

6
Figure 13. Oscilloscope Display (Option 003)
Figure 14. Pattern Generator Sequence Window (Option 004)
Several different views of the
oscilloscope display are available,
each offering different control
options. The Scope Channel display is shown here.
The pattern generator allows the
user to create data streams from
provided macros or from various
external sources and use them to
stimulate a target. Since the pattern generator is internal to the
logic analyzer, the target
response can be measured with
the logic analyzer to identify
incorrect output and potential
target system malfunction.
Figure 12. Compare Screen
(State Mode Only)
Compare performs a
post-processing, bit-by-bit
comparison of acquired state
data and compare image data.
Copy state acquisition into compare image buffer (may edit any
bit in compare image). The compare feature halves the memory
depth (1/4 memory with Opt.
002)
Stop Measurement halts repetitive acquisitions when current
and compare acquisitions are
equal or not equal.
Compare Partial allows masking
of a compare image in order to
compare only certain bits or set
ranges of states (rows). (It compares data that falls within
enabled channels and specified
range.)
Difference Listing highlights differences between the current
state listing and compare image.
(Reference listing shows compare image and bit masks.)
Agilent Technologies 1670G Series
Annotated Screen Shots
 Loading...