

Page 1
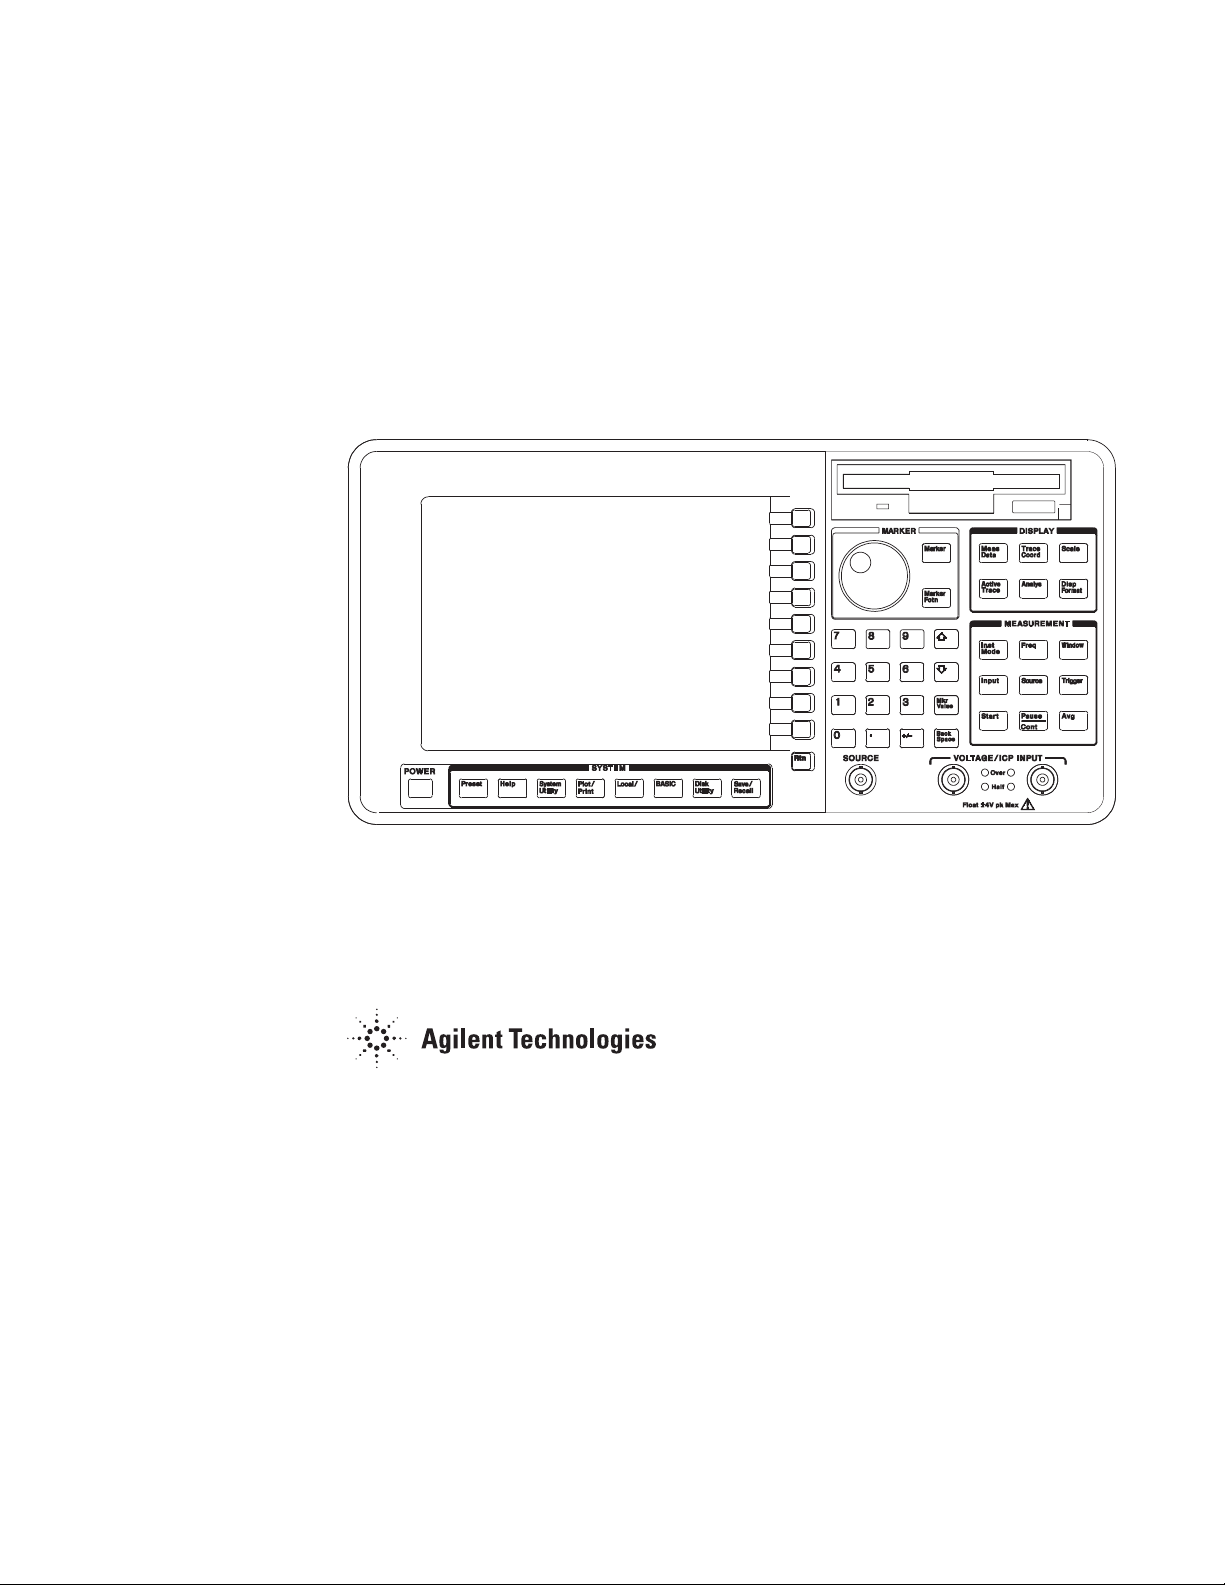
Agilent 35670A Quick Start Guide
Agilent Part Number 35670-90056
Printed in U.S.A.
Print Date: October 2000
© Agilent Technologies, Inc.,1992, 1995, 2000. All rights reserved.
8600 Soper Hill Road Everett, Washington 98205-1209 U.S.A.
Page 2
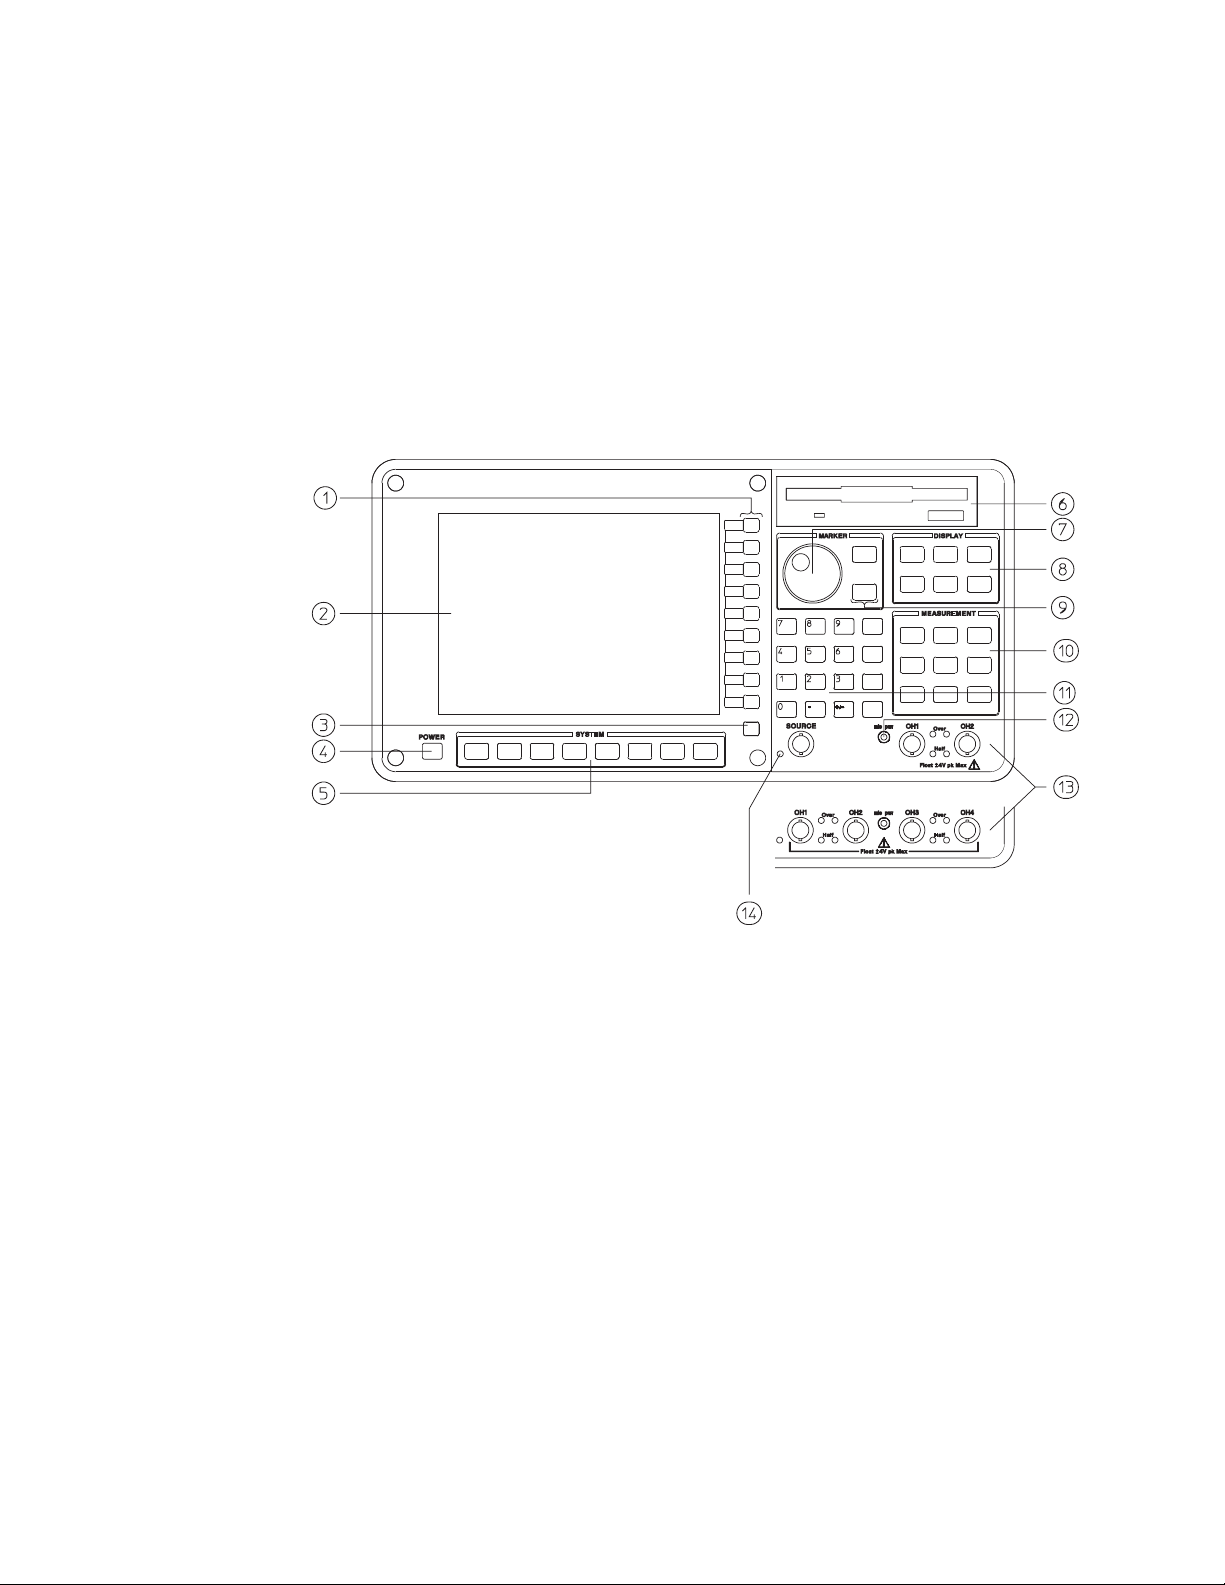
The Agilent 35670A at a Glance (Front Panel)
Page 3

Agilent 35670A Front Panel
1-Use the softkeys to select items from the current
menu. A softkey’s function is indicated by a video
label on the analyzer’s screen. Throughout this
book, softkeys are printed like this:
[
FFT ANALYSIS
Hardkeys are front-panel buttons whose functions
are always the same. They have a label printed
directly on the key itself. Throughout this book,
hardkeys are printed like this: [
].
Inst Mode
].
2-The analyzer’s screen is divided into the menu
area and the display area. The menu area displays
video labels for the softkeys. The data area
displays measurement data and information about
the parameter settings.
3-The [
level.
] key returns the menu to the previous
Rtn
4-The POWER switch turns on the analyzer.
5-Use the SYSTEM keys to control various
system-level functions. These functions include
saving files, plotting measurement data, and
accessing online help.
6-Use the disk drive to save your work on 3.5
inch flexible disks.
7-The knob moves the markers and the cursor. It
also steps through numeric values and scrolls
through online help.
10-Use the MEASUREMENT keys to control the
analyzer’s source and inputs. They also control
measurement parameters. You must make a new
measurement if you change a
MEASUREMENT parameter.
11-Use the numeric-entry keys to enter a numeric
value.
12-The microphone power connector provides
power (8 Vdc) for the Microphone Adapter Kit
(Option UK4).
13-The connector area of the front panel has two
different configurations. The standard analyzer
has a source output connector and two input
connectors. The 4-channel analyzer (Option AY6)
has four input connectors.
Range indicators are located next to each input
connector. The upper LED is the over-range
indicator (the signal level exceeds the current
range setting). The lower LED is the half range
indicator (the signal level exceeds half the current
range setting).
14-A source on/off indicator is located at the left
edge of the connector area.
The standard Agilent 35670A (2-channel) has a
source connector on the front panel.
8-Use the DISPLAY keys to control what
appears on the analyzer’s traces. They only affect
how data is displayed; DISPLAY keys do not
change measurement parameters. You can press
keys in the DISPLAY menus without losing
measurement parameters.
9-Use the MARKER keys to select a variety of
marker features.
Page 4
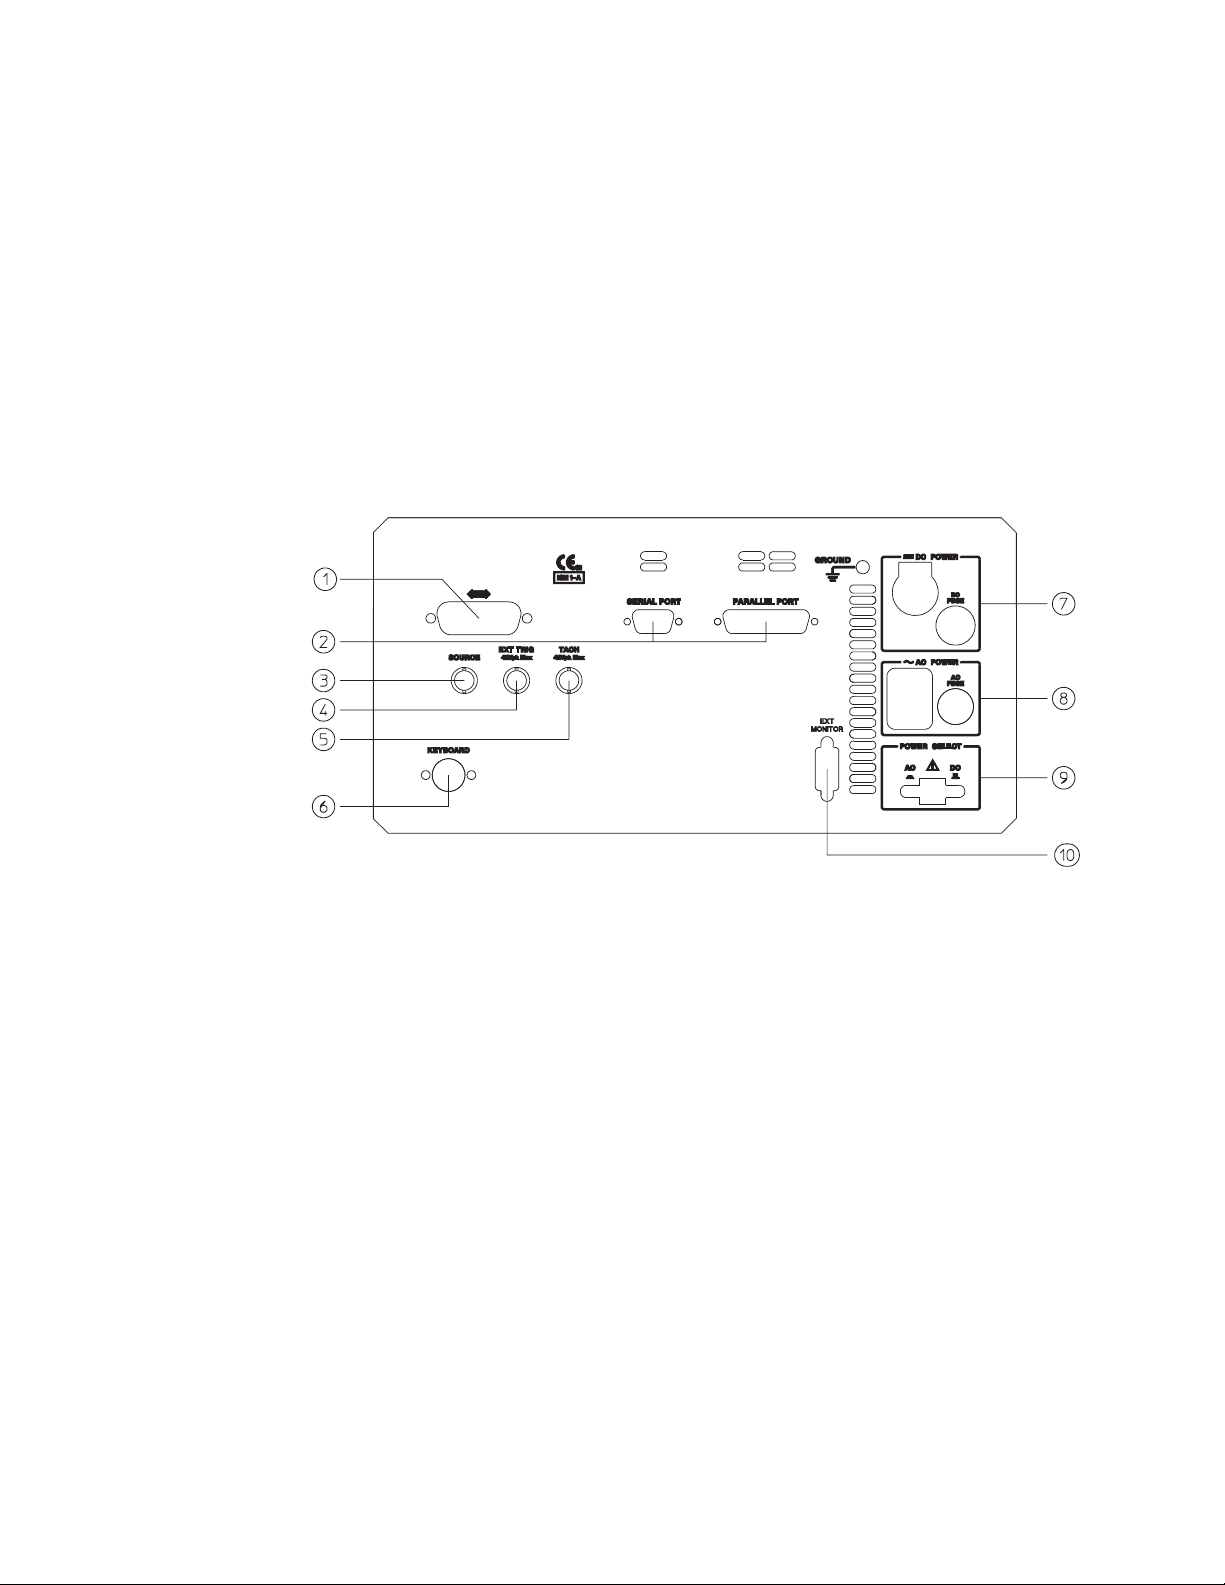
The Agilent 35670A at a Glance (Rear Panel)
Page 5

Agilent 35670A Rear Panel
1-The GPIB connector links the Agilent 35670A
to other GPIB devices. GPIB parameters are set in
the [
Local/GPIB
] and [
Plot/Print
] menus.
2-The SERIAL PORT and the PARALLEL
PORT link the analyzer to plotters and printers.
These parameters are set in the [
Plot/Print
] menu.
3-The SOURCE connector outputs the analyzer’s
source signal. An LED on the front panel
indicates if the source is on or off. The source
parameters are set in the [
The standard Agilent 35670A (2-channel) also has
a source connector on the front panel.
Source
] menu.
4-The EXT TRIG connector links the analyzer to
an external trigger signal. The external trigger
parameters are set in the [
Trigger
] menu.
5-The TACH connector links the analyzer to a
tachometer. The tachometer parameters are set in
the [
Input
] menu.
6-The KEYBOARD connector attaches an
optional keyboard to the analyzer.
7-The DC POWER connector accepts DC power
levels from 12 - 28 Vdc (nominal).
8-The AC POWER connector accept a wide range
of ac voltage levels.
9-The POWER SELECT switch determines
whether the analyzer is powered via the AC
POWER connector or the DC POWER connector.
10-The EXT MONITOR port links the analyzer
to multi-sync monitors.
Page 6

Saftey Summary
The following general safety precautions must be observed during all phases of
operation of this instrument. Failure to comply with these precautions or with
specific warnings elsewhere in this manual violates safety standards of design,
manufacture, and intended use of the instrument. Agilent Technologies, Inc.
assumes no liability for the customer’s failure to comply with these requirements.
GENERAL
This product is a Safety Class 1 instrument (provided with a protective earth
terminal). The protective features of this product may be impaired if it is used in
a manner not specified in the operation instructions.
All Light Emitting Diodes (LEDs) used in this product are Class 1 LEDs as per
IEC 60825-1.
ENVIRONMENTAL CONDITIONS
This instrument is intended for indoor use in an installation category II,
pollution degree 2 environment. It is designed to operate at a maximum relative
humidity of 95% and at altitudes of up to 2000 meters. Refer to the
specifications tables for the ac mains voltage requirements and ambient
operating temperature range.
BEFORE APPLYING POWER
Verify that the product is set to match the available line voltage, the correct fuse
is installed, and all safety precautions are taken. Note the instrument’s external
markings described under Safety Symbols.
GROUND THE INSTRUMENT
To minimize shock hazard, the instrument chassis and cover must be connected
to an electrical protective earth ground. The instrument must be connected to
the ac power mains through a grounded power cable, with the ground wire
firmly connected to an electrical ground (safety ground) at the power outlet.
Any interruption of the protective (grounding) conductor or disconnection of
the protective earth terminal will cause a potential shock hazard that could
result in personal injury.
Page 7

FUSES
Only fuses with the required rated current, voltage, and specified type (normal
blow, time delay, etc.) should be used. Do not use repaired fuses or
short-circuited fuse holders. To do so could cause a shock or fire hazard.
DO NOT OPERATE IN AN EXPLOSIVE ATMOSPHERE
Do not operate the instrument in the presence of flammable gases or fumes.
DO NOT REMOVE THE INSTRUMENT COVER
Operating personnel must not remove instrument covers. Component
replacement and internal adjustments must be made only by qualified service
personnel.
Instruments that appear damaged or defective should be made inoperative and
secured against unintended operation until they can be repaired by qualified
service personnel.
WARNING The WARNING sign denotes a hazard. It calls attention to a procedure,
practice, or the like, which, if not correctly performed or adhered to,
could result in personal injury. Do not proceed beyond a WARNING
sign until the indicated conditions are fully understood and met.
Caution The CAUTION sign denotes a hazard. It calls attention to an operating
procedure, or the like, which, if not correctly performed or adhered to, could
result in damage to or destruction of part or all of the product. Do not proceed
beyond a CAUTION sign until the indicated conditions are fully understood and
met.
Page 8
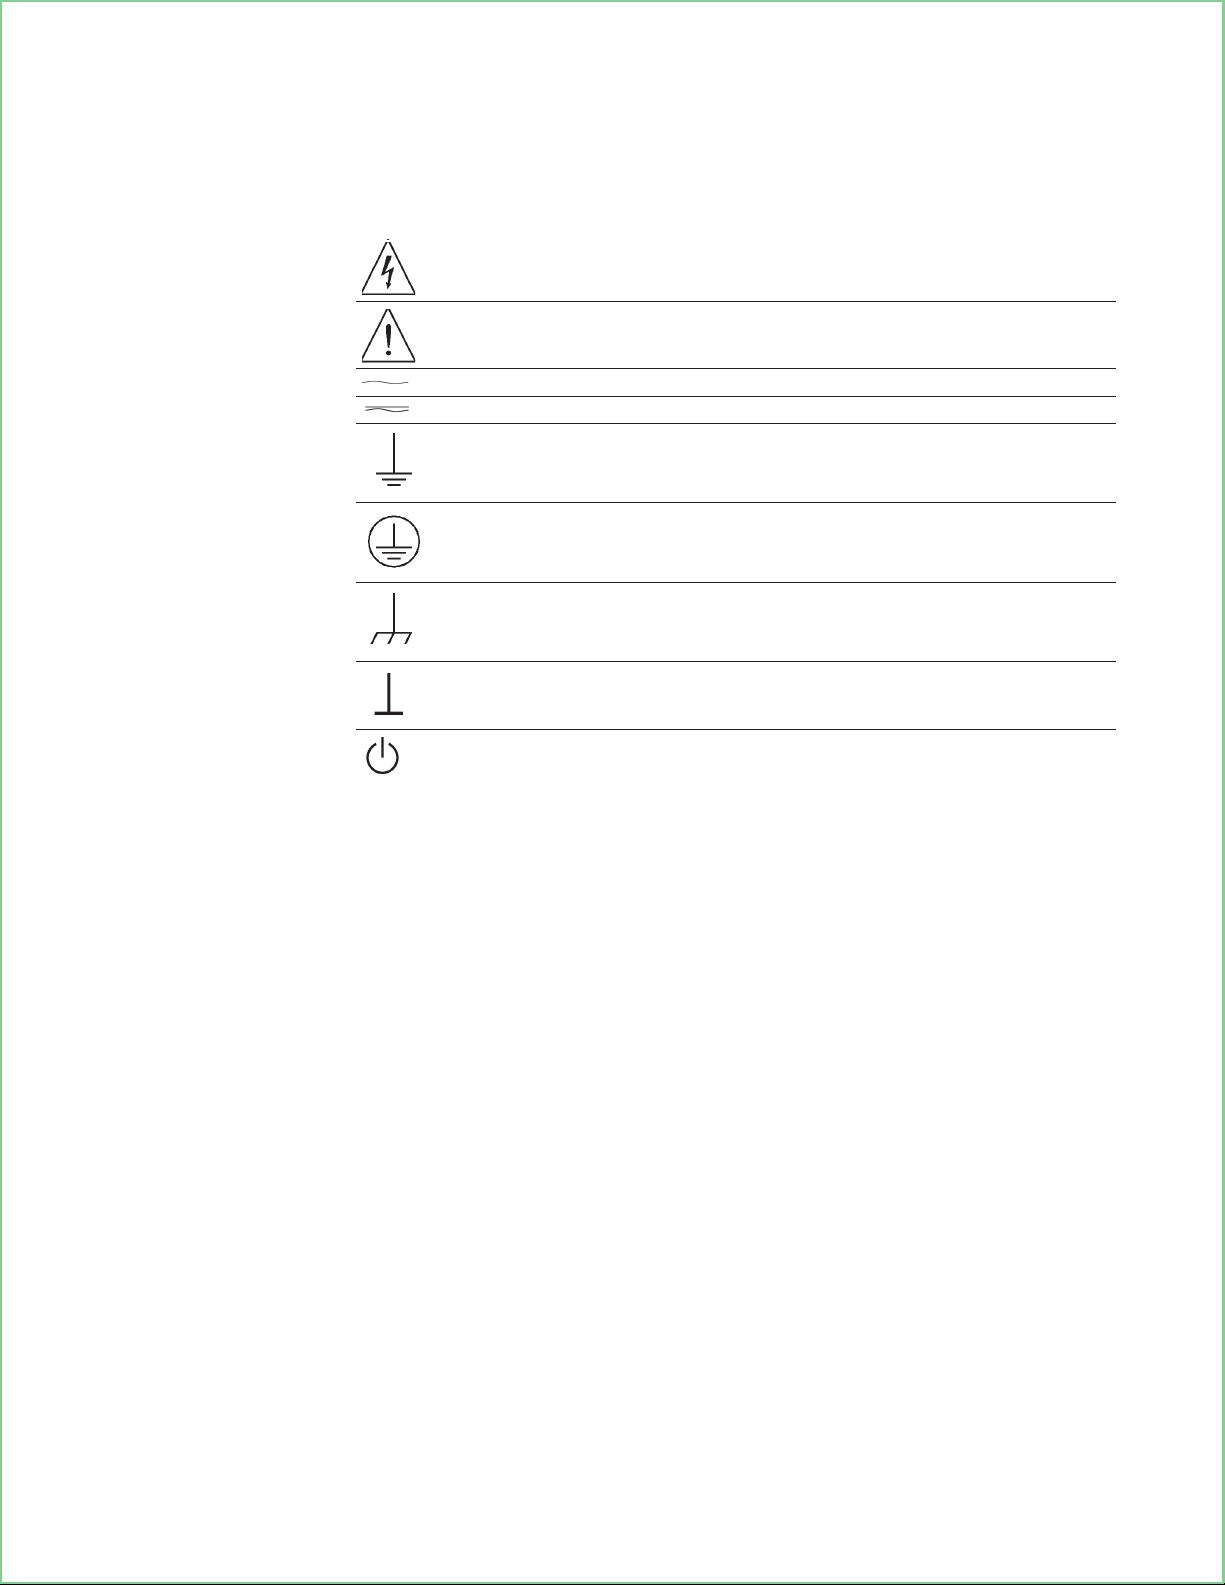
Safety Symbols
Warning, risk of electric shock
Caution, refer to accompanying documents
Alternating current
Both direct and alternating current
Earth (ground) terminal
Protective earth (ground) terminal
Frame or chassis terminal
Terminal is at earth potential.
Standby (supply). Units with this symbol are not completely disconnected from ac mains when
this switch is off
Page 9

Table of Contents
The Basics 1
To turn on the analyzer — AC power 2
To turn on the analyzer — DC Power 3
Todisplayhelpforakey 4
To preset the analyzer 5
To activate the input channels 6
To activate the input channels—Option AY6 7
To select an instrument mode 8
To type a text string 9
To change a numeric parameter 10
To move the main marker 11
To measure a value relative to a reference 12
Setting Up 13
To set the analyzer’s GPIB address 14
To set the analyzer’sclock 15
To select the default disk 16
Working with the Display 17
To select the active trace 18
To display traces 19
To select measurement data 20
To scale measurement data 22
To display the measurement state 23
To change parameters using the measurement state 24
To display a waterfall 25
Page 10

Making Measurements 27
To measure a spectrum 28
To measure frequency response — FFT 30
To measure frequency response — Swept Sine (Option 1D2) 32
To calibrate a microphone — Octave Analysis (Option 1D1) 34
To measure sound pressure level — Octave Analysis
(Option 1D1) 36
To measure harmonic distortion 38
To characterize a tach pulse 40
To specify tachometer holdoff time 42
To measure an order spectrum 44
Saving and Plotting Data 47
To format a flexible disk 48
Tosaveatracetoafile 49
To recall a trace from a file 50
Tosaveatracetoadataregister 51
To setup your plotter — GPIB 52
To setup your plotter — Serial 53
To plot screen contents 54
Automating Measurements 55
To select the active Instrument BASIC program 56
To record a measurement sequence 57
To execute a recorded measurement sequence 58
To customize your analyzer 59
To save an Instrument BASIC program to disk 60
Index
Guide to 35670A Documentation
Need Assistance?
About this Edition
Page 11

The Basics
Page 12

Page 13

The Basics
Even if you decide to skip the rest of this book, be sure to read through and perform
the tasks in this section. Understanding these tasks is very important if you want to get
the most from your Agilent 35670A.
1
Page 14
The Basics Agilent 35670A Quick Start Guide
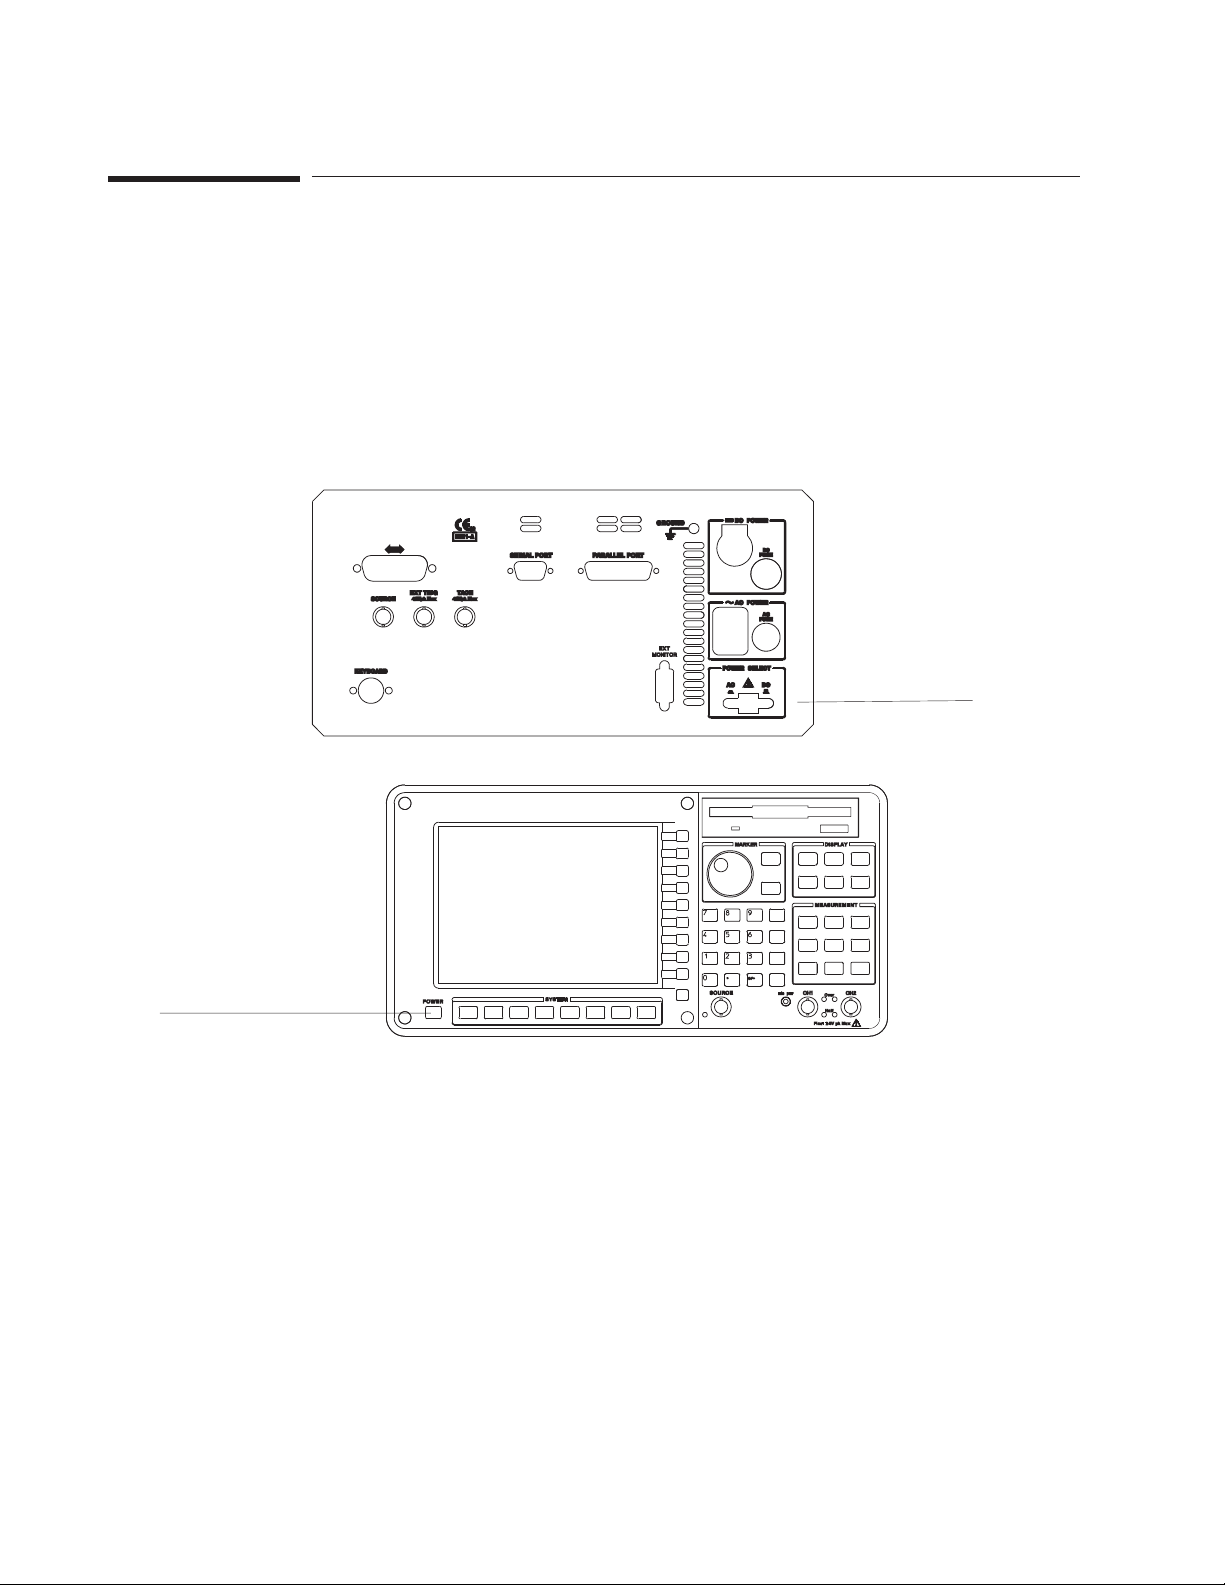
To turn on the analyzer — AC power
Depress the power select switch on the rear panel to select “AC” power.
1
2 Connect the power cord to the analyzer.
3 Depress the power switch.
The power switch is located in the lower-left corner of the front panel.
Power Switch
Power Select
Switch
2
Page 15
Agilent 35670A Quick Start Guide The Basics
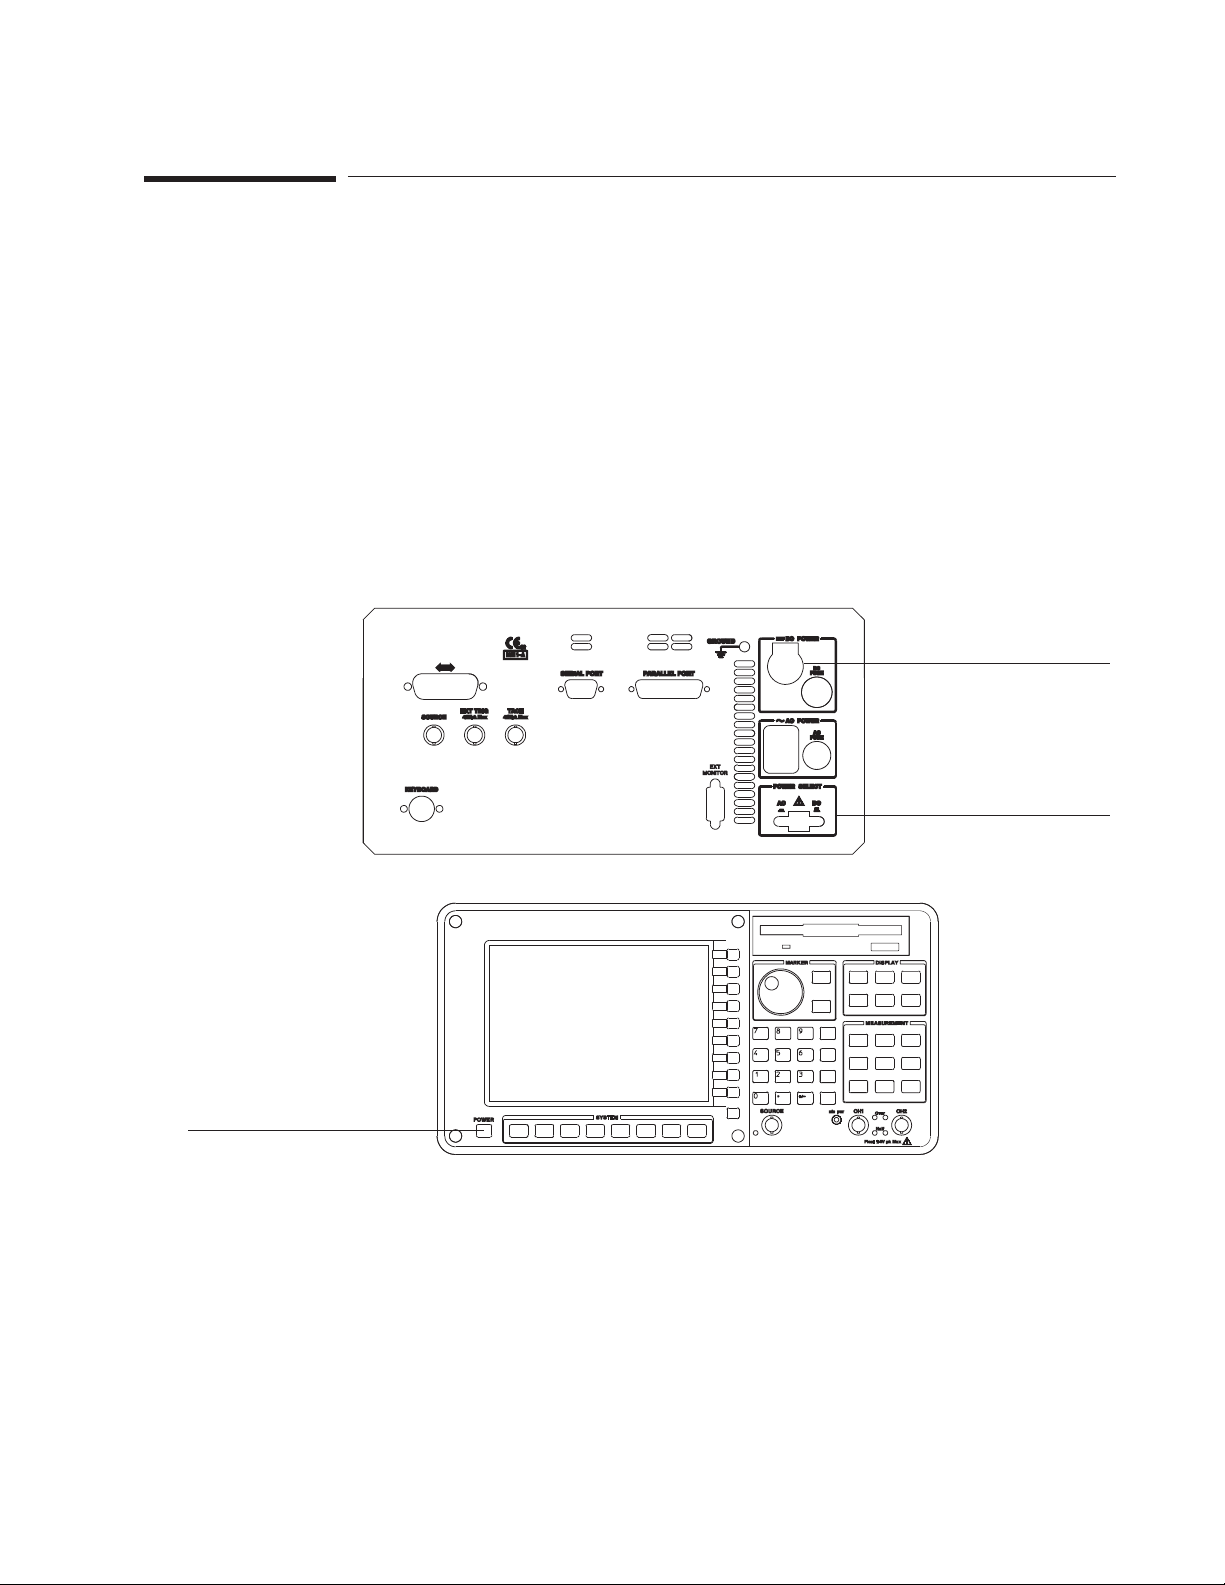
To turn on the analyzer — DC Power
Depress and release the power select switch on the rear panel.
1
2 Connect the DC source to the analyzer.
3 Depress the power switch.
If the analyzer is running on AC power, you can switch to DC power, without turning
off the analyzer. It is important to remember to connect the DC source before
releasing the power select switch on the rear panel.
If you need to ground the DC source, a ground terminal is located on the rear panel.
DC Source
Power Switch
Power Select
Switch
3
Page 16
The Basics Agilent 35670A Quick Start Guide
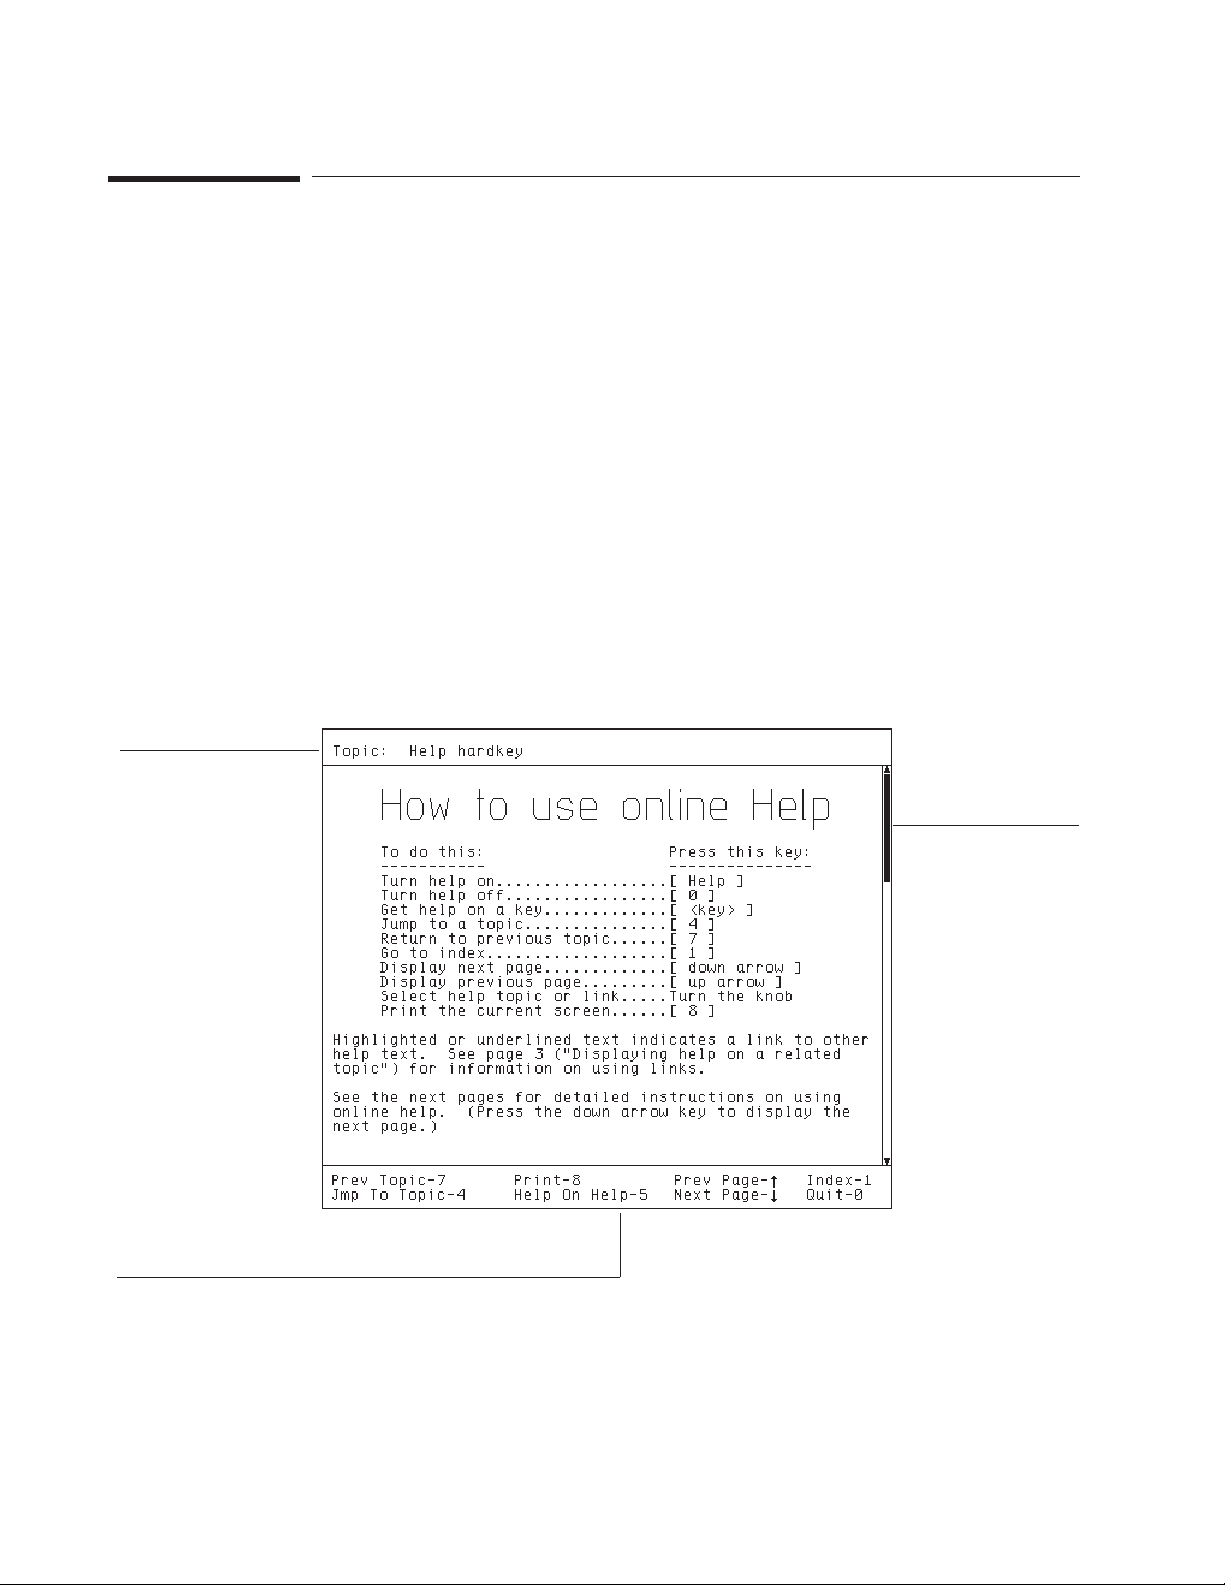
Todisplayhelpforakey
Title shows
you which topic
is displayed
1
Press [
HELP
].
2 Press any hardkey or softkey.
3 Press the down-arrow or up-arrow hardkey to page.
or
Turn the knob to scroll.
4 Repeat steps 2 and 3 for each key you want help on.
5 Press [
The first time you press , take a few minutes to read the help overview. It is only four
pages long, and it includes descriptions of advanced help features—like the index and
cross-reference “links”—that can help you locate the information you need quickly.
When you quit help, the analyzer restores the menu that was displayed before you
activated help.
] to quit online help.
HELP
Scroll bar
indicates how
much of the
topic is
displayed
Legend shows you
which help functions are
assigned to the numeric
keypad
4
Page 17
Agilent 35670A Quick Start Guide The Basics
To preset the analyzer
Press [
1
2 Press [
].
Preset
DO PRESET
].
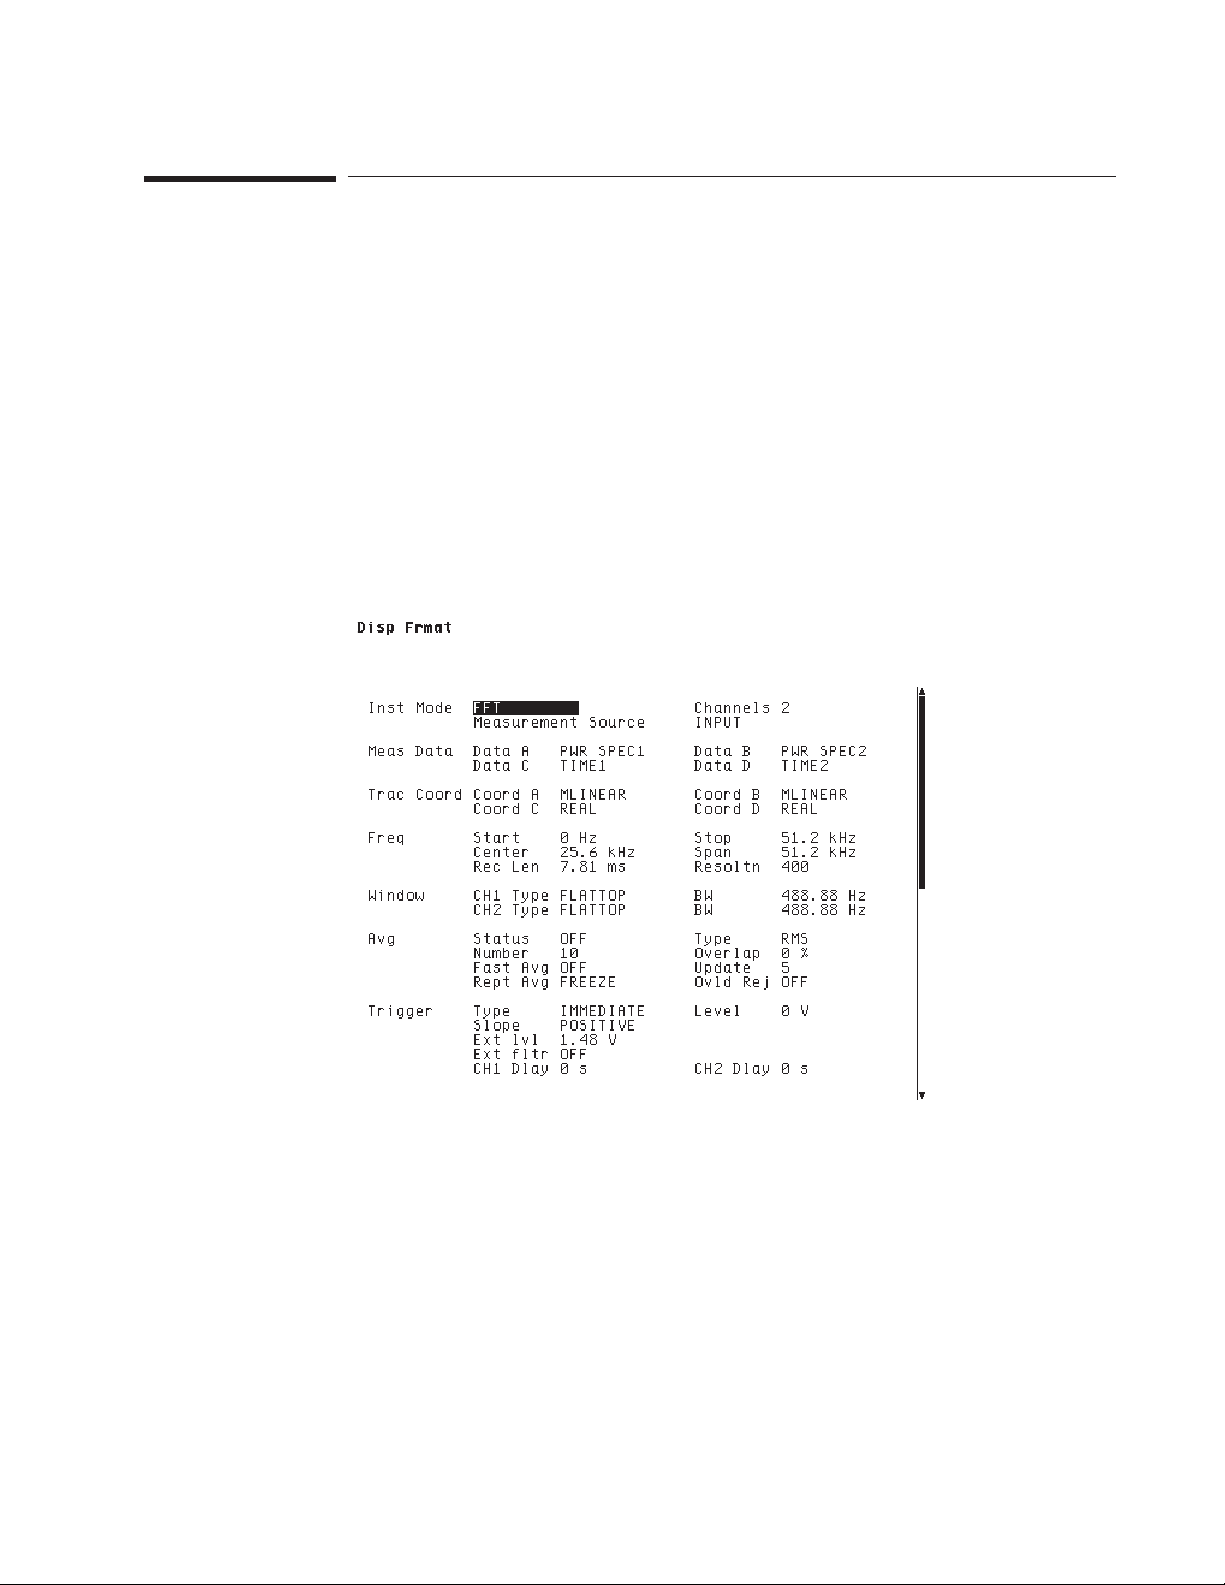
You can preset the analyzer to return it to a known state. This known state provides a
convenient starting point when you are setting up a new measurement.
The following illustration lists the states of important parameters after you preset the
analyzer. You can display this listing on your analyzer by pressing [
[
MEASURMNT STATE
].) For more information on the analyzer’s preset state, use
Disp Format
online help. To define your own preset state, see “To customize your analyzer,” in the
Automating Measurements section.
Measurement State
after pressing
[Preset] [Do Preset]
]
5
Page 18
The Basics Agilent 35670A Quick Start Guide
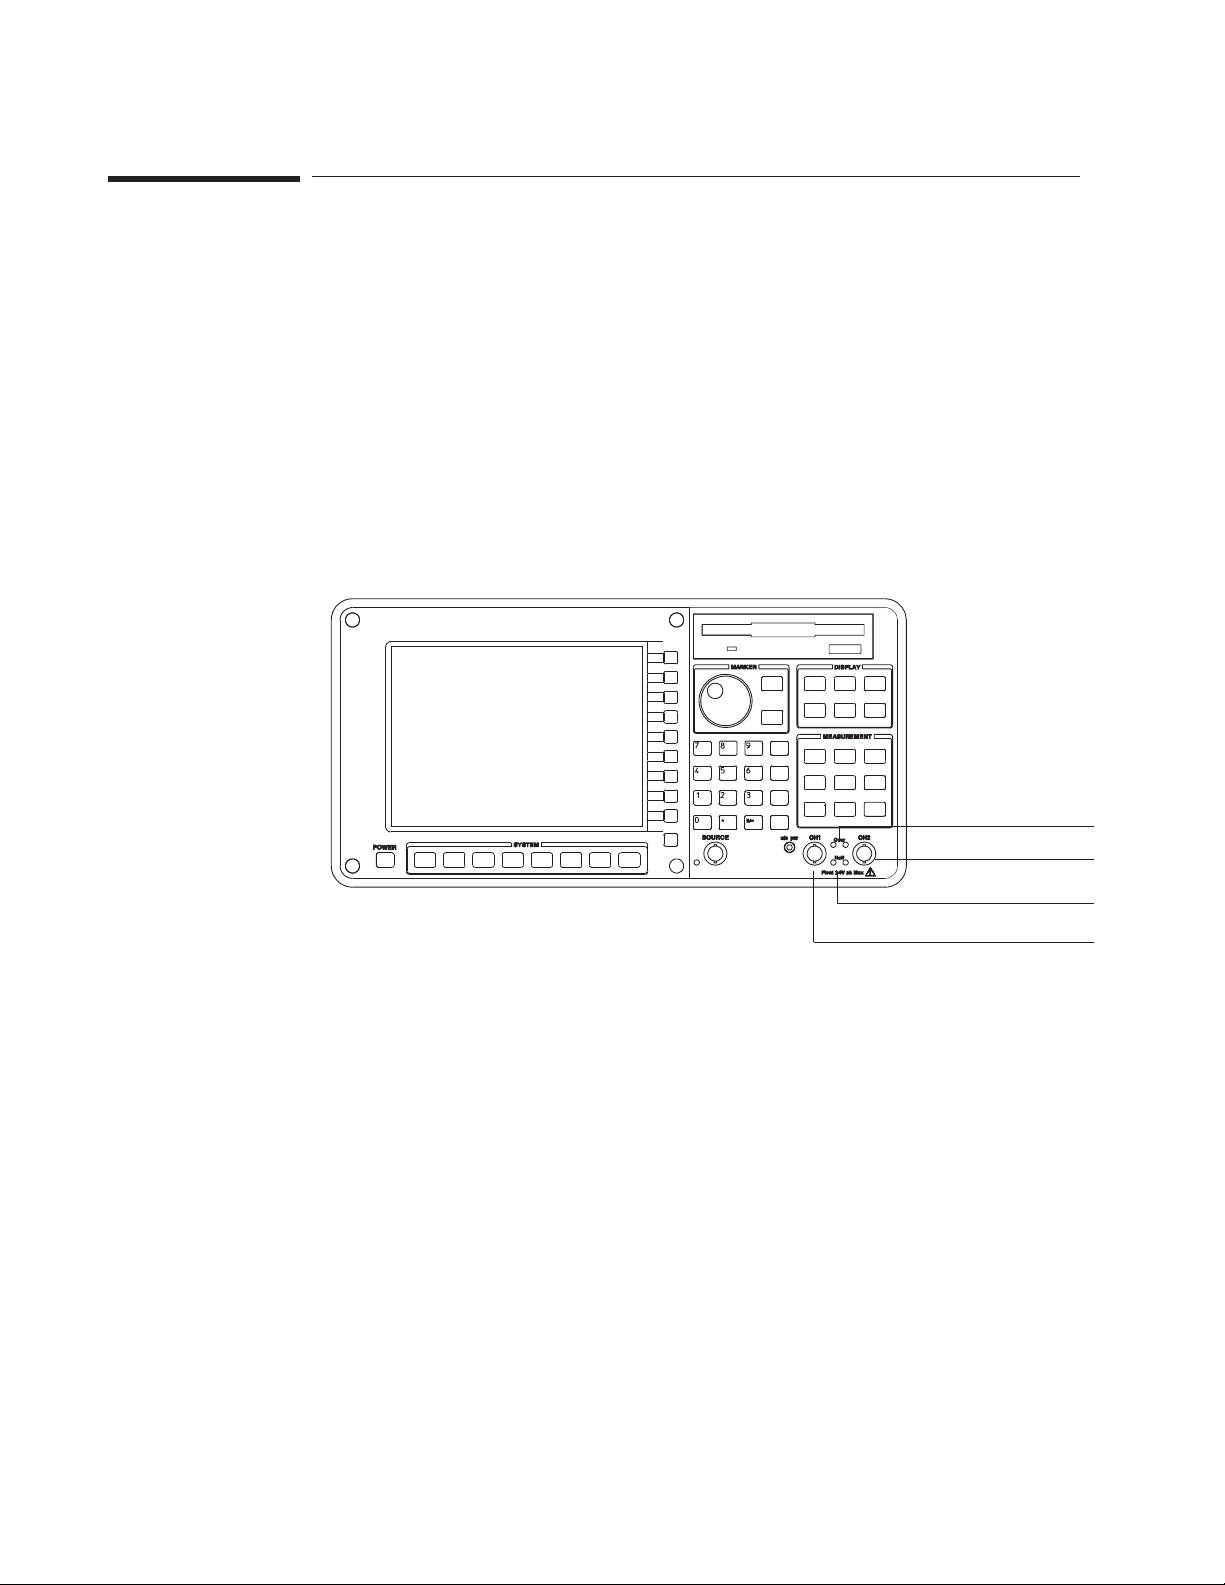
To activate the input channels
Press [
1
2 Press [
This selection must be made before the measurement is started. If you change the
number of input channels, you must restart the measurement. At preset, the analyzer is
set to measure with two channels.
Channel 1 is the reference channel for measurement results that require data for
two channels.
Inst Mode
CHANNELS 1 2
].
] to highlight1for a one channel measurement.
Overload Indicator
Channel 2
Half Range Indicator
Channel 1
6
Page 19
Agilent 35670A Quick Start Guide The Basics
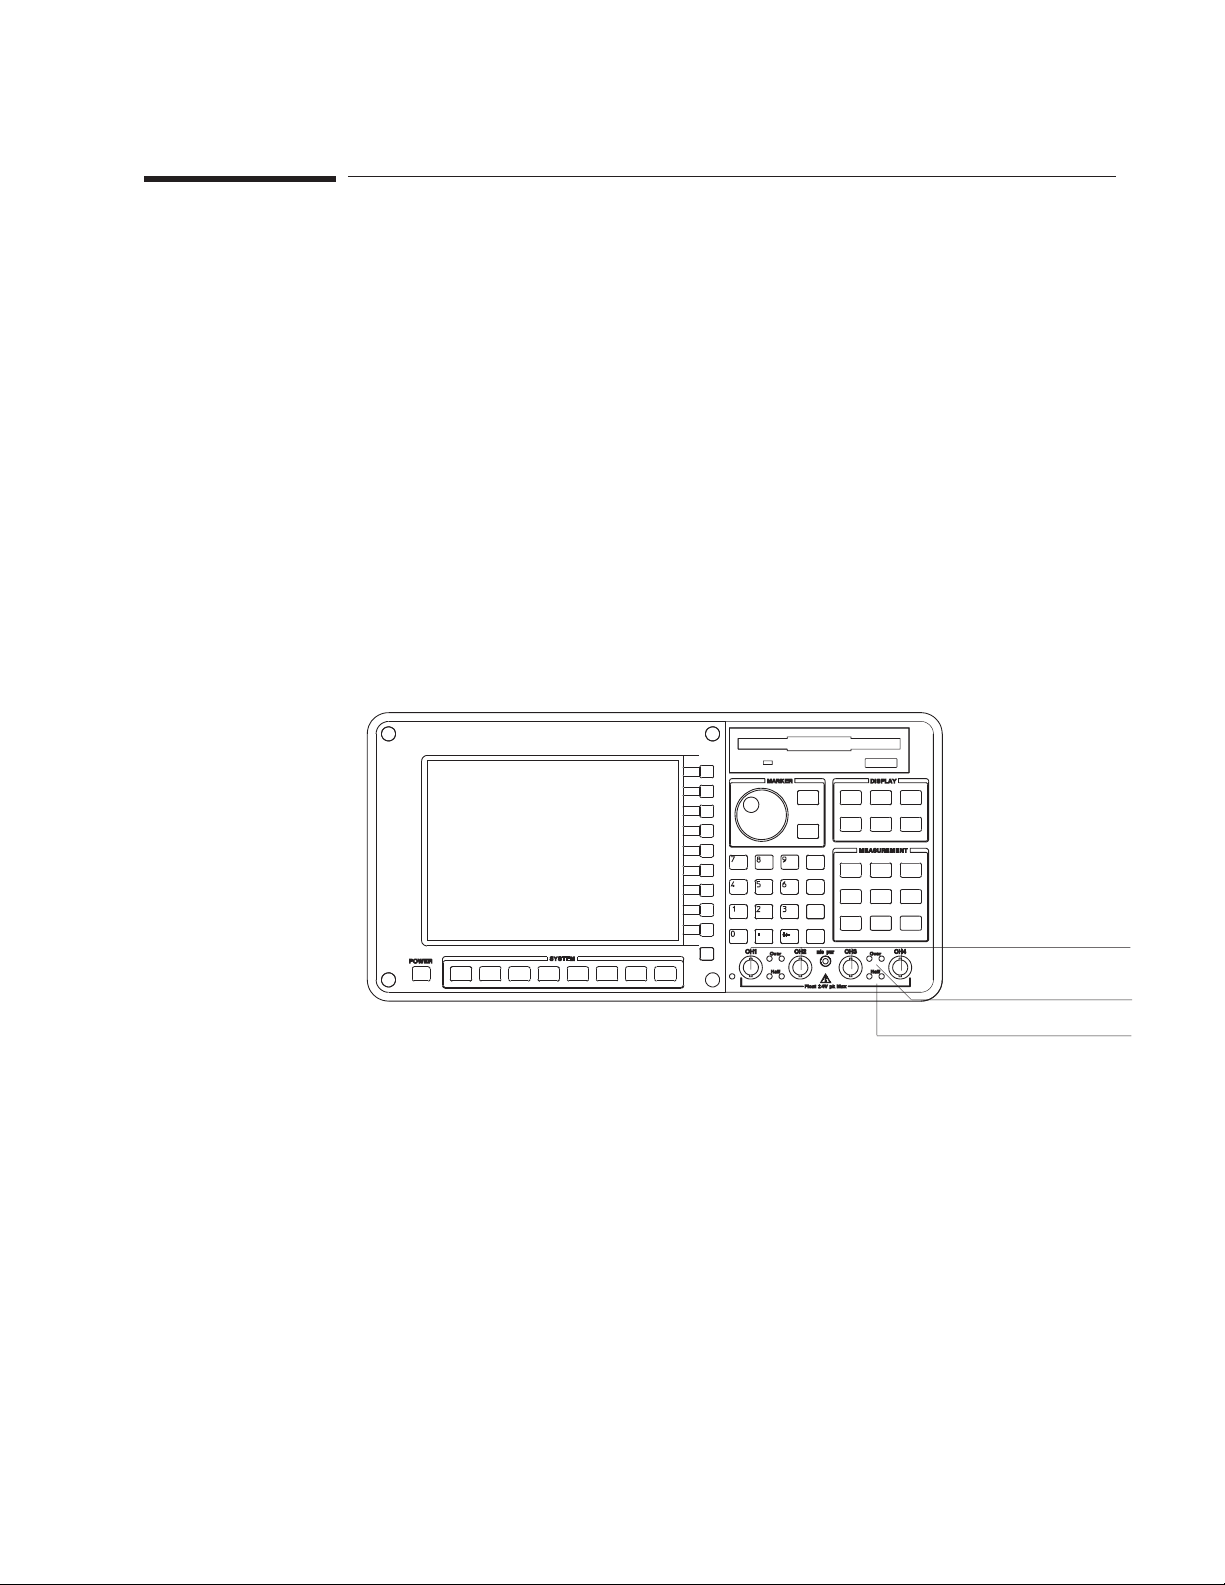
To activate the input channels—Option AY6
Press [
1
2 Press [
Inst Mode
CHANNELS 1 2 4
highlight
1
3 If you want to make Channel 3 the reference channel to Channel 4, press [
] to highlight
1,3
].
] to highlight4for a four channel measurement. Press it again to
for a single channel measurement.
.
1,3
REF CHANS 1
This selection must be made before the measurement is started. If you change the
number of input channels, you must restart the measurement. At preset, the analyzer is
set to measure with two channels.
Channel 1 is the default reference channel. If you want to use channel pairs, set
Channel 3 as the reference to Channel 4. Channel 1 remains the reference to
Channel 2.
Option AY6
Overload Indicator
Half Range Indicator
7
Page 20

The Basics Agilent 35670A Quick Start Guide
To select an instrument mode
1
Press [
Inst Mode
].
2 Press [
FFT ANALYSIS
].
or
Press [
OCTAVE ANALYSIS
] to select Realtime Octave Measurements
(Option 1D1 only).
or
Press [
ORDER ANALYSIS
] to select Computed Order Tracking (Option 1D0 only).
or
Press [
SWEPT SINE
] to select Swept Sine Measurements (Option 1D2 only).
or
Press [
CORRELATN ANLYSIS
].
or
Press [
HISTOGRAM/TIME
] to select histograms and time domain.
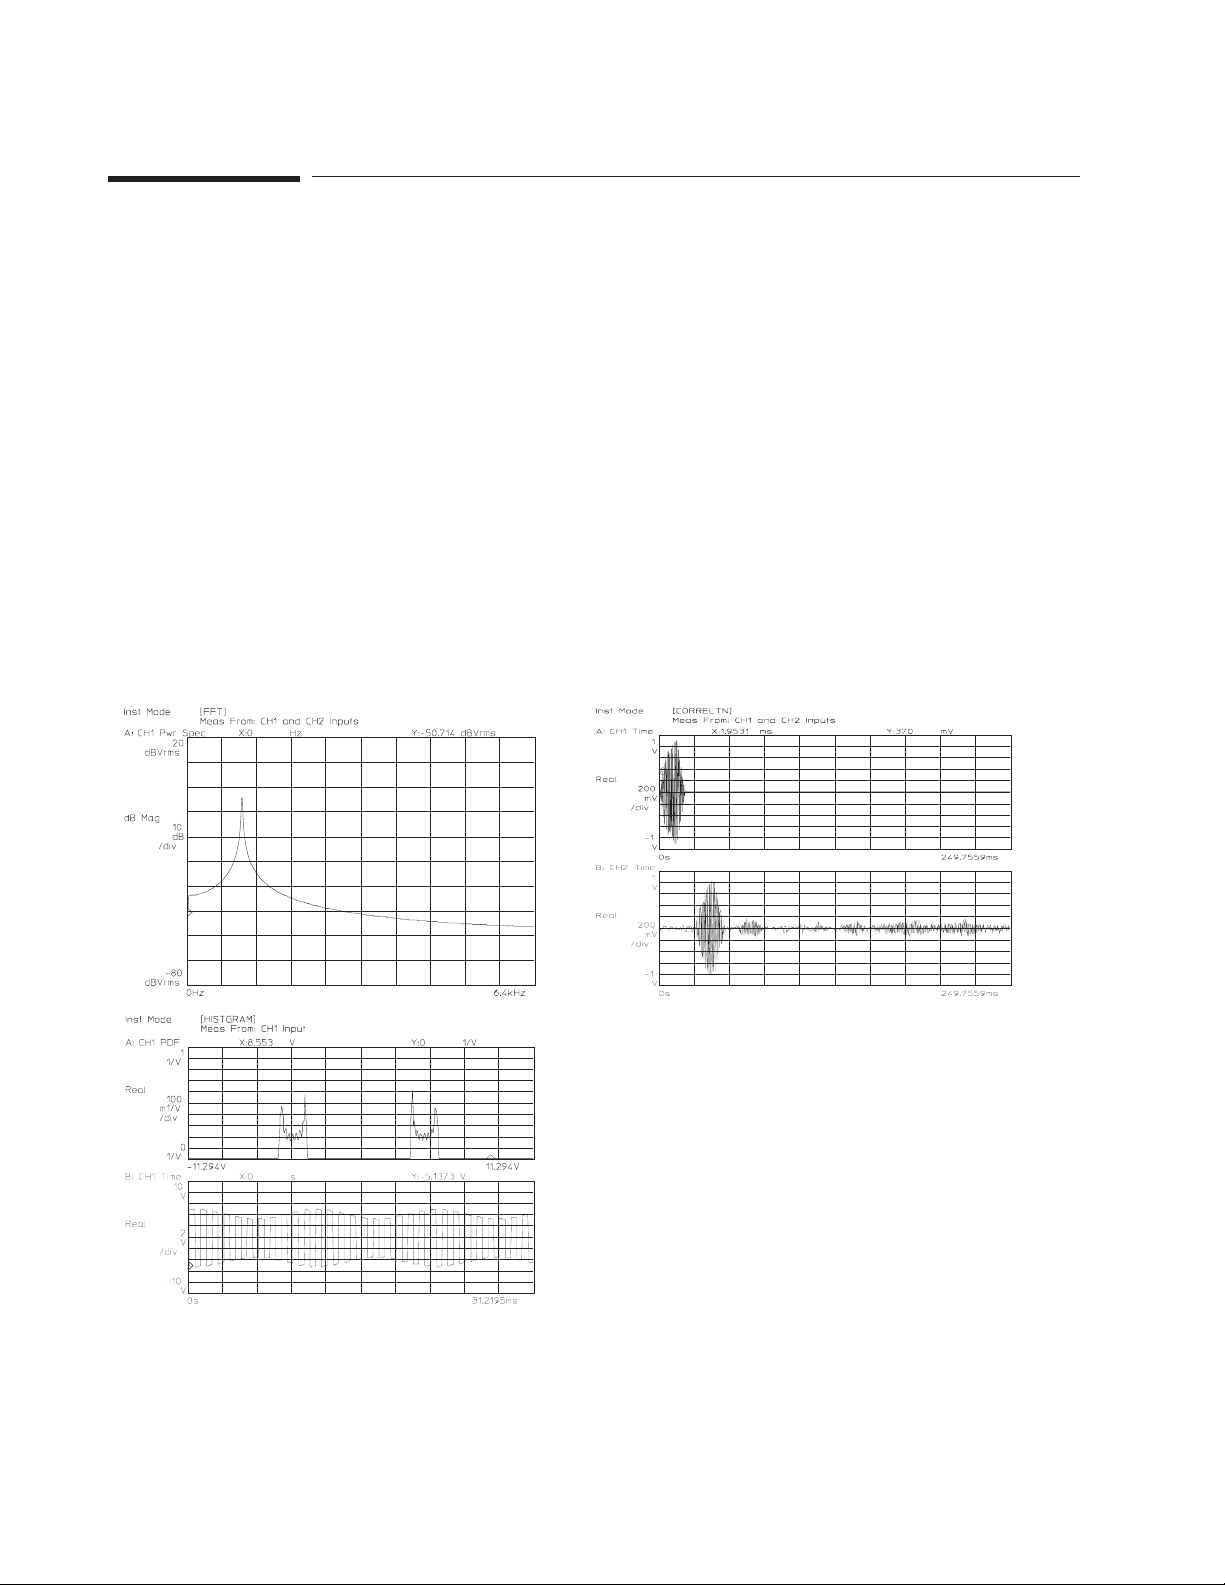
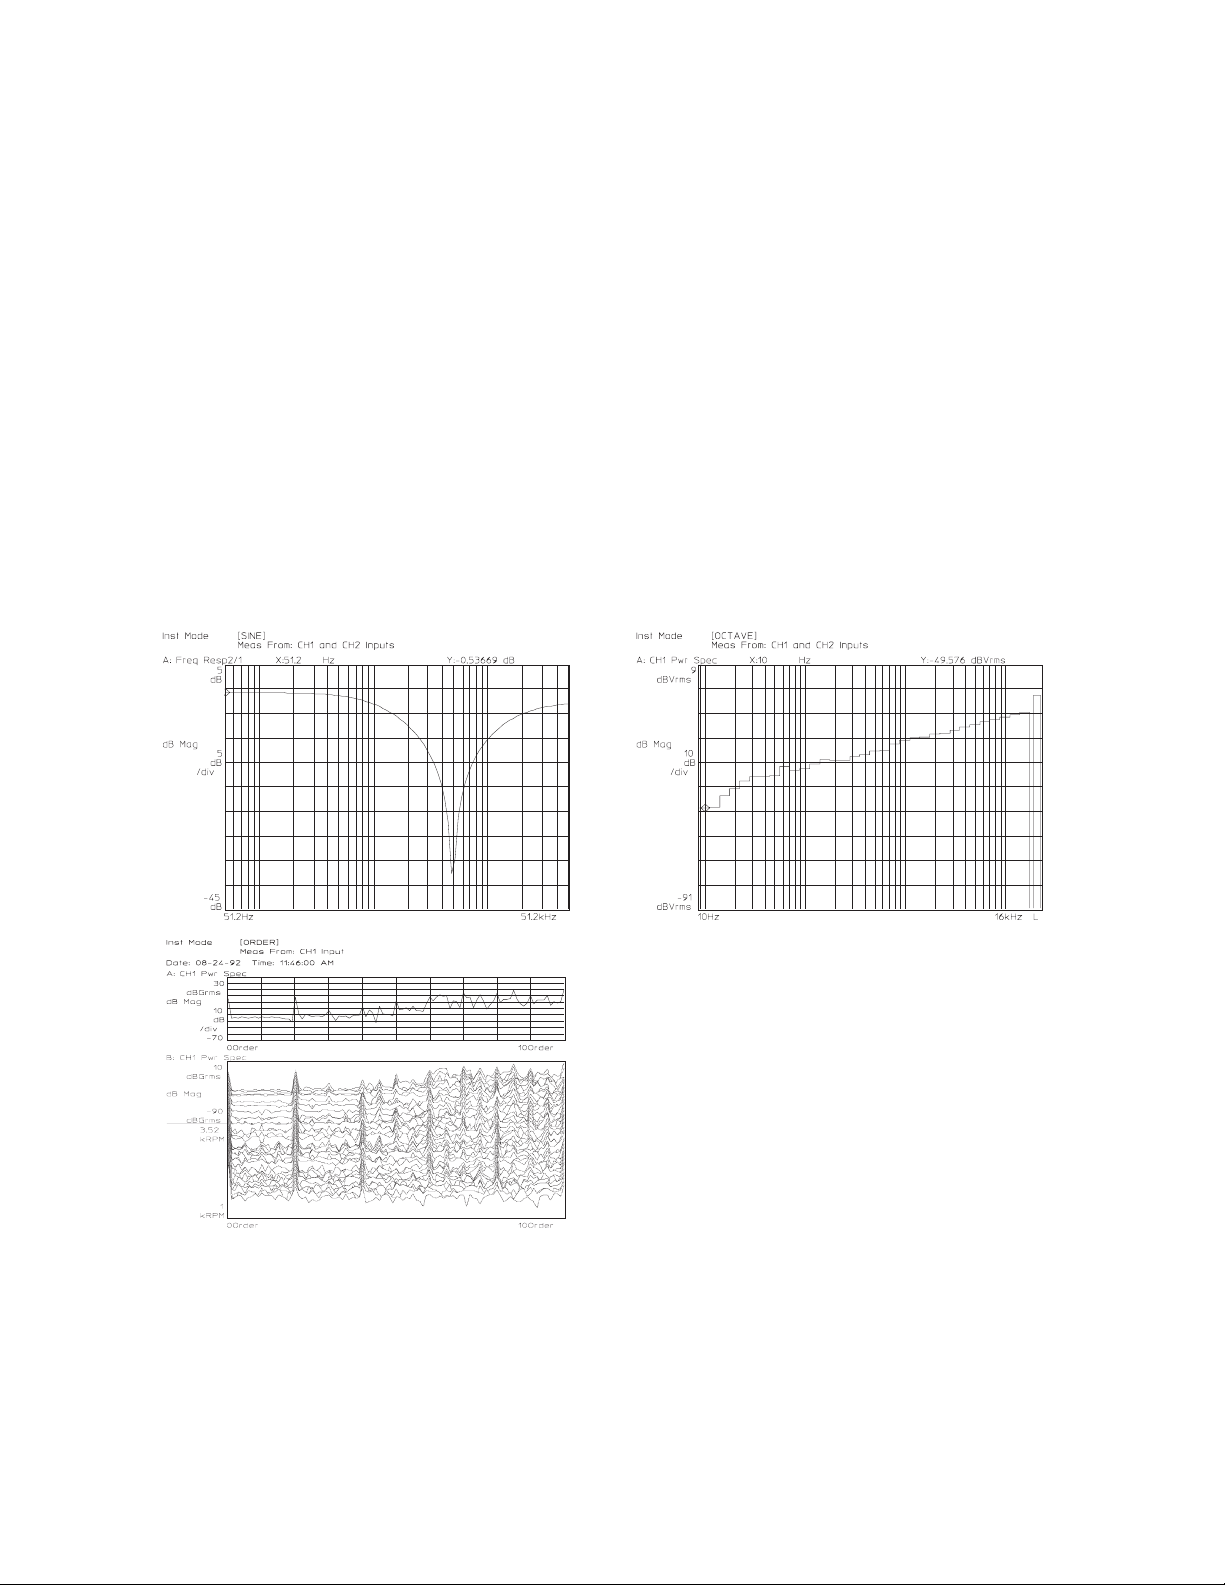
The analyzer can make measurements that fall into six broad categories, some
available as special options. These categories are called instrument modes.
You should select an instrument mode before specifying other measurement
parameters. Instrument modes are not coupled. Parameters set in one instrument
mode are independent of parameters set in the other modes.
For more information on the six instrument modes, use online help.
8
Page 21
Agilent 35670A Quick Start Guide The Basics
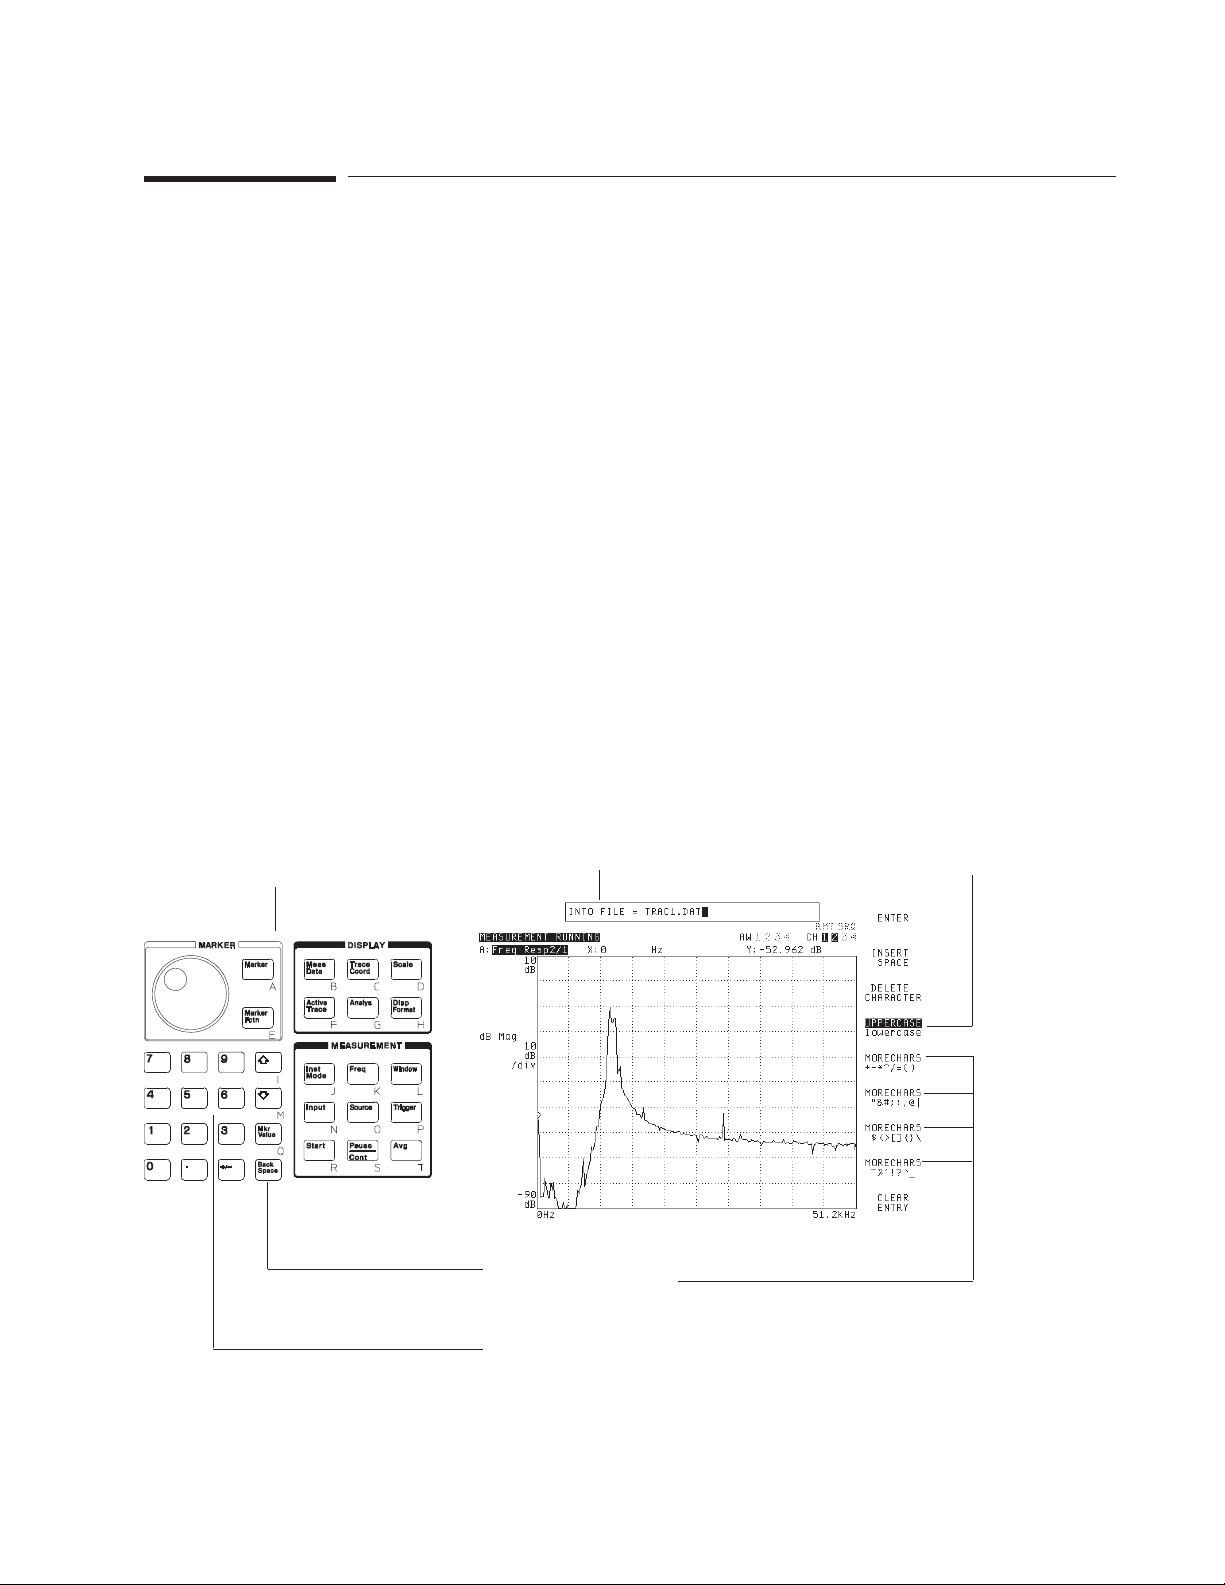
To type a text string
Plug in the optional keyboard.
1
2 Press a softkey that displays a text prompt box. (For example, press [
[
SAVE DATA
3 Type the text. All characters—alpha, numeric and special—are enabled.
4 Use the [
5 Press [
You do not need the optional keyboard to enter a text string. The analyzer enters
alpha-entry mode when you press a softkey that displays a text prompt. While the
analyzer is in this mode
• Most front-panel hardkeys are remapped as alpha characters.
• The numeric keypad is active.
• The alpha-entry menu gives you access to special characters and other typing
functions.
For more information on alpha-entry mode, use online help. (Alph-entry mode can be
accessed through the online help index.)
Each remapped hardkey inserts
the character adjacent to its
lower-right corner
], [
SAVE TRACE
BACK SPACE
] to accept the string you typed.
ENTER
This text prompt is displayed when
you press [SAVE TRACE]
], [
INTO FILE
] key or cursor keys one or more times if you make a mistake.
].)
Save/Recall
[UPPERCASE lowercase] works like
CAPS LOCK on a keyboard
],
[Back Space] backs up
over mistakes
Numeric hardkeys insert
numbers
MORECHARS softkeys
insert special characters
9
Page 22
The Basics Agilent 35670A Quick Start Guide
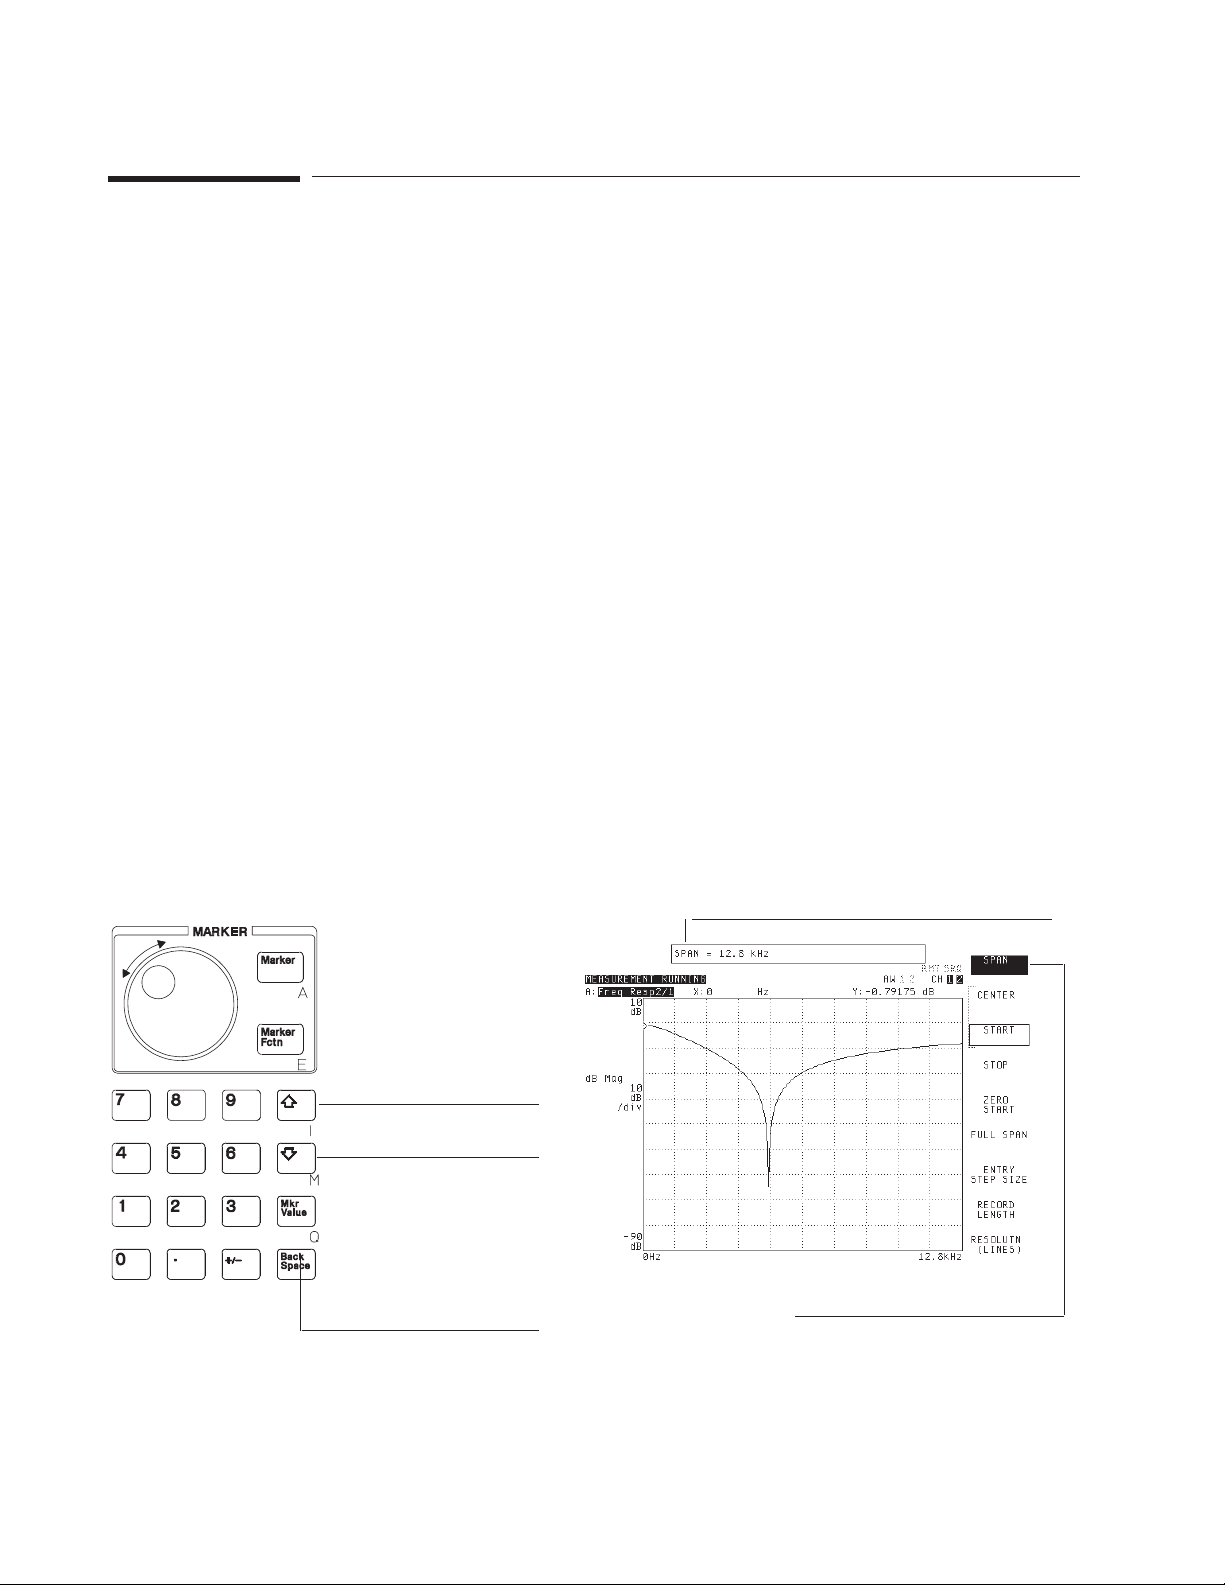
To change a numeric parameter
Press a softkey that displays a numeric-entry prompt box (for example [
1
] menu.
[
Freq
SPAN
]inthe
2 Press one of the arrow hardkeys.
or
Type a value with the optional keyboard.
or
Turn the knob before the prompt box disappears.
or
Type a value with the numeric keypad.
3 If you typed a number, press a unit softkey or [
If you are using an optional keyboard, press the corresponding function key.
When you press a softkey that controls a numeric parameter, the analyzer activates the
key (indicated by highlighting the softkey) and displays a numeric-entry prompt box.
The prompt box is removed after a short time if you do not change the value, but the
softkey remains active. An active softkey is always ready to accept entry from the
arrow keys or numeric keypad, even when the prompt box is not displayed.
The arrow hardkeys and the knob change a numeric parameter by stepping it through
successive values. In some cases, you can specify the size of the step. The knob is
more convenient if you need to step a parameter quickly through many successive
values, but the prompt box must be displayed before you start turning the knob.
] to complete the entry .
ENTER
This numeric-entry prompt is displayed
when you press [Freq] [Span]
Increase a value by
turning the knob
clockwise or pressing the
up-arrow hardkey
Decrease a value by
turning the knob
counter-clockwise or
press the down-arrow
hardkey
[Back Space] backs up
over mistakes
10
Highlighting (also called
inverse video) shows that
[SPAN] is the active softkey
Page 23
Agilent 35670A Quick Start Guide The Basics
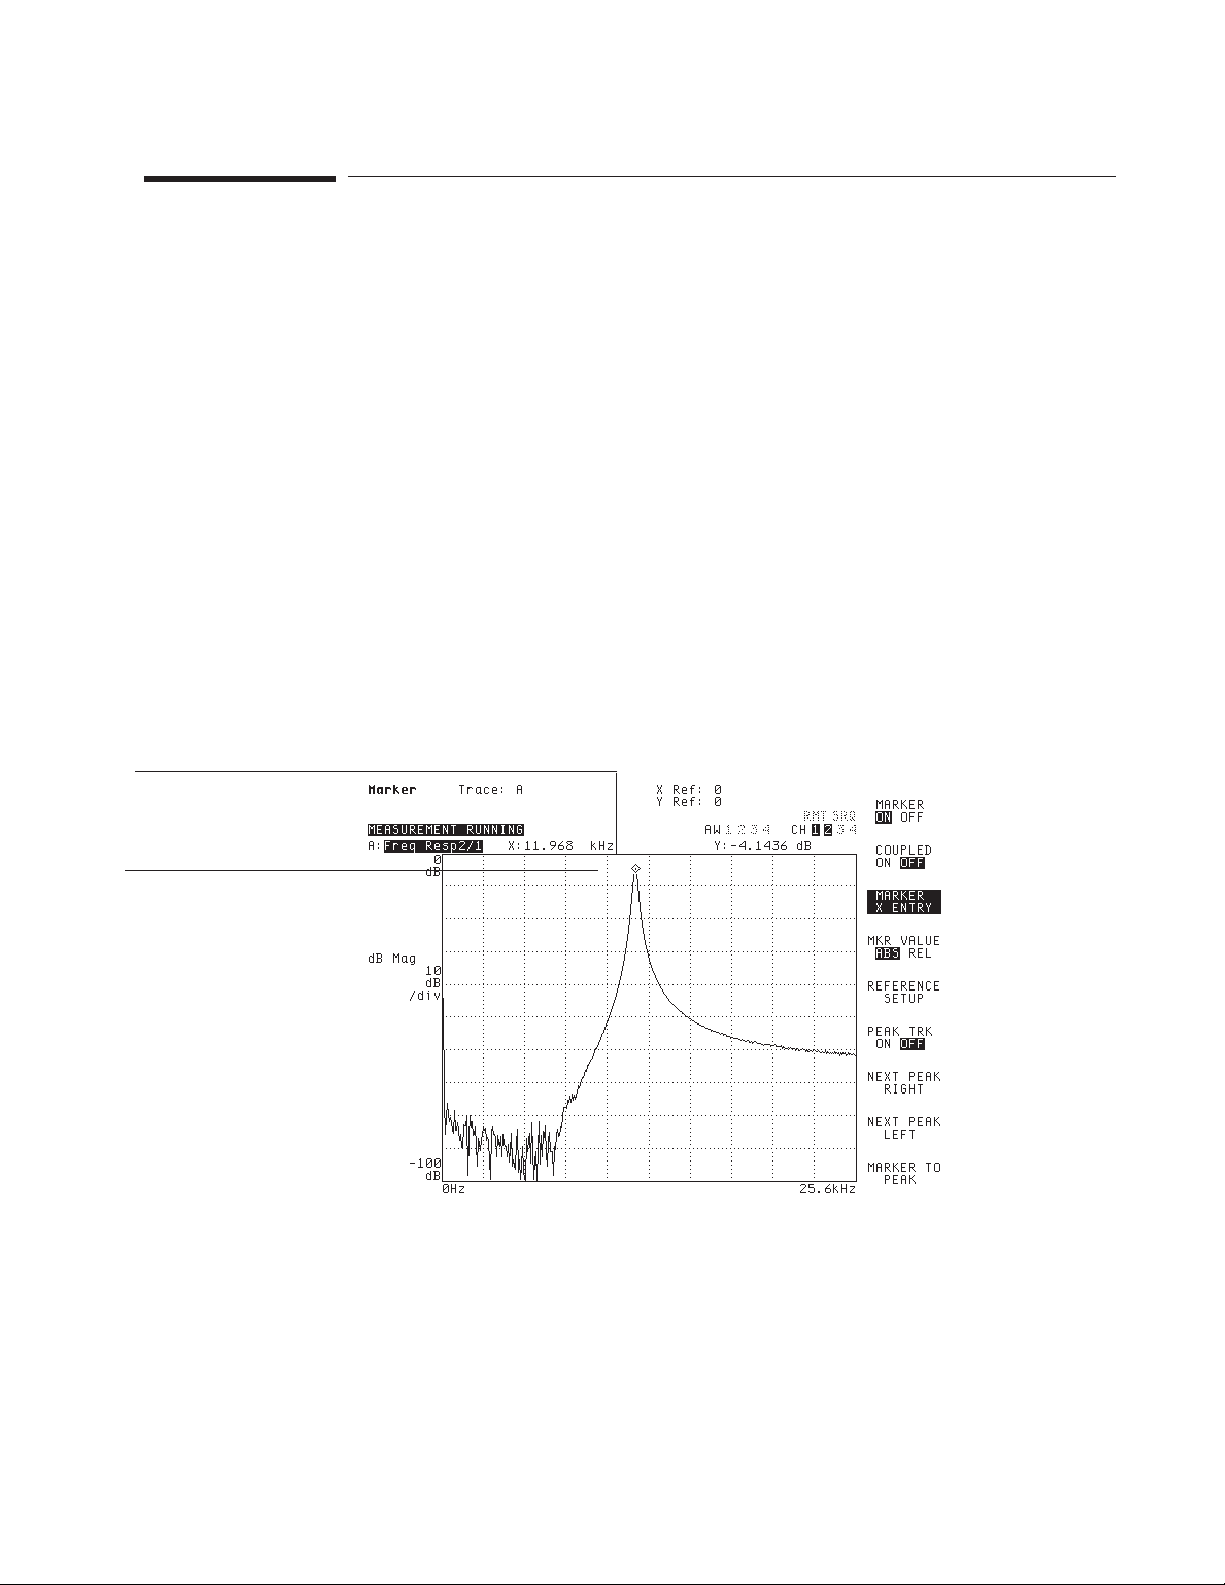
To move the main marker
Marker readout
area
1
Press [
Marker
].
2 Turn the knob.
You can easily determine the X- and Y-axis values of any point on a trace. Just move
the main marker to the point of interest and read its value from the marker readout.
The main marker appears as a small diamond.
You do not always need to press [
Marker
habit to develop. The knob has two primary functions outside of text entry: moving
the main marker and changing the value of numeric parameters. When you press
[
Marker
], you ensure that the knob is assigned to moving the marker.
In addition to using the knob, you can move the main marker by pressing the arrow
keys or entering an X-axis position. In both cases, you must press [
can also press one of the marker search softkeys. For more information on moving
markers,seeonlinehelpforthesoftkeysinthe[
] before you turn the knob, but it is a good
] first. You
Marker
Marker
] menu.
Main Marker
11
Page 24
The Basics Agilent 35670A Quick Start Guide
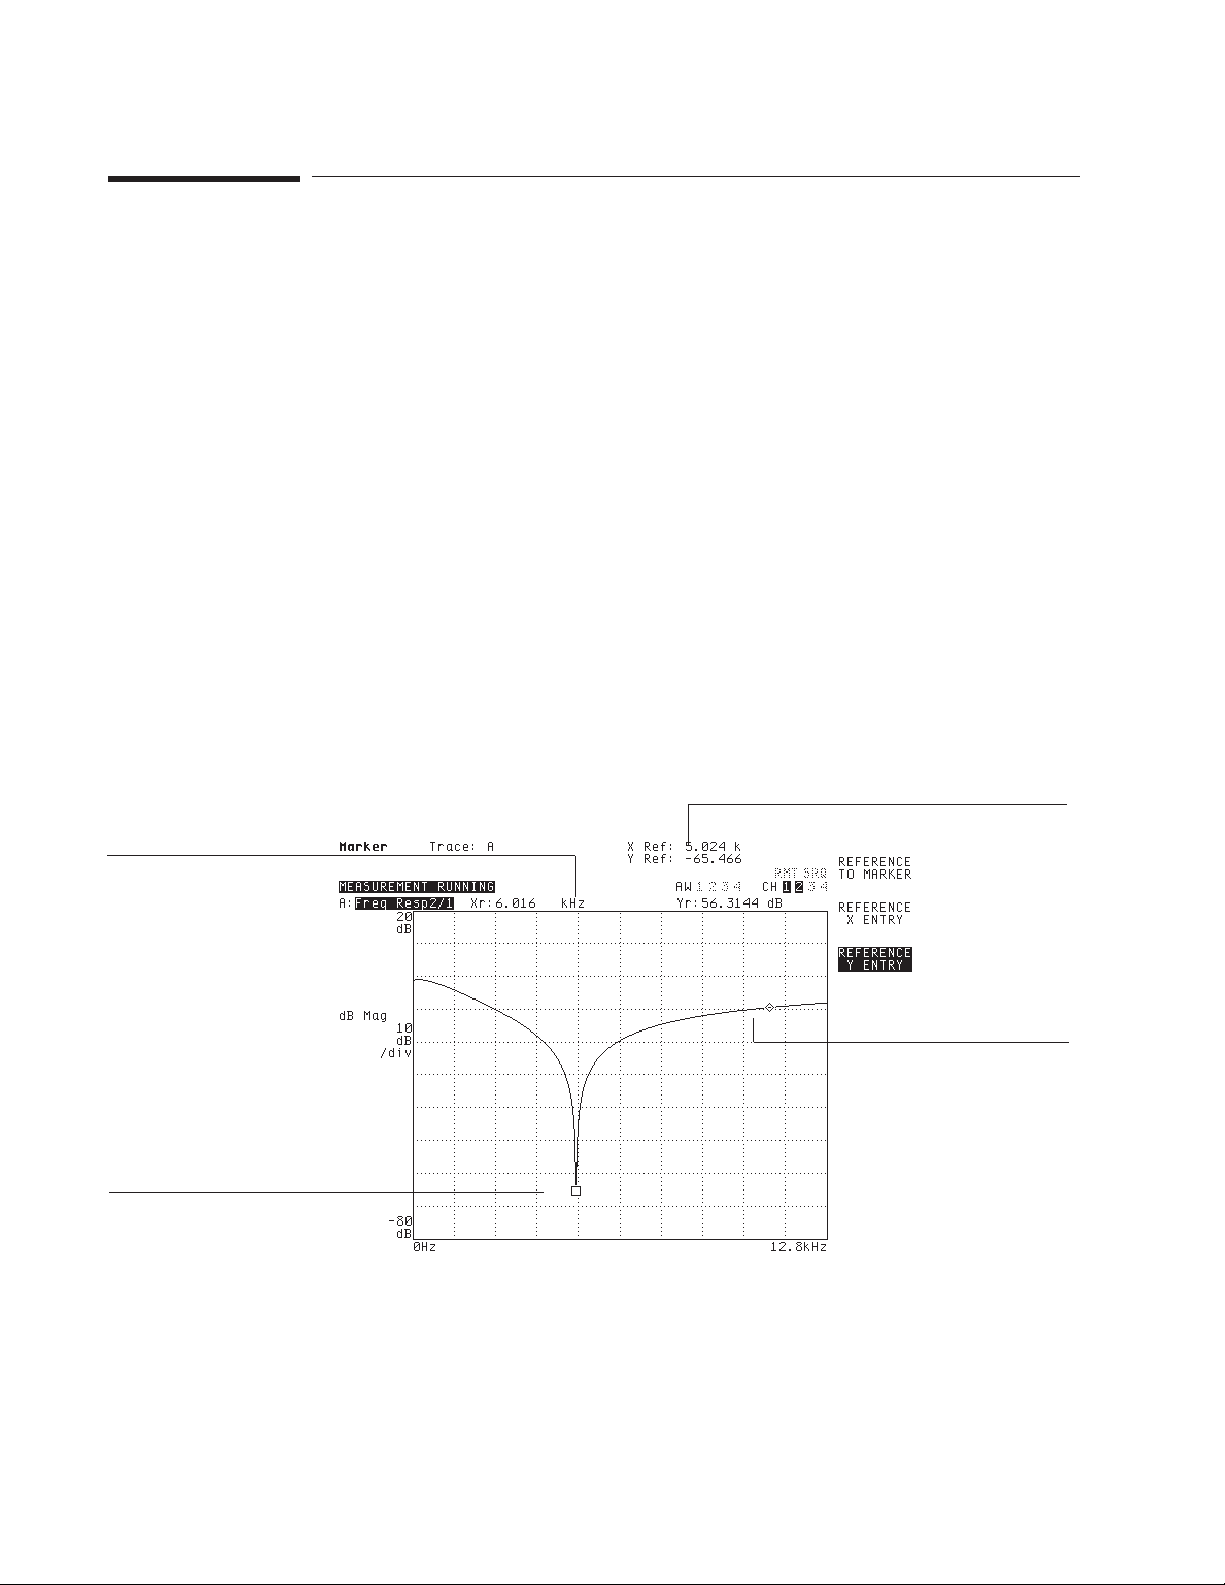
To measure a value relative to a reference
Relative Marker
readout area
To stop a measurement, press [
1
2 Press [
Marker
], [
REFERENCE SETUP
Pause-Cont
].
].
3 Using the knob, move the main marker to the reference position.
4 Press [
REFERENCE TO MARKER
].
5 Using the knob, move the relative marker to the point of interest.
6 Read the Xr and Yr values which are relative to the main marker’s reference position.
The [
REFERENCE TO MARKER
main marker’s current marker position. The marker reference appears as a small
square. The marker readouts, Xr and Yr at the top of the grid, are relative to this
position.
The relative marker let you easily determine the peak-to-peak value of a spectrum. It
can also be used to measure the holdoff time for a tachometer signal.
] key turns on the relative marker and zeroes it at the
Marker Reference
values
Marker Reference
Relative Marker
12
Page 25

Setting Up
Page 26

Page 27

Agilent 35670A Quick Start Guide Setting Up
Setting Up
This section shows you how to initialize some important settings that you will rarely
need to change. The settings are stored in the analyzer’s battery-backed memory so
they are not lost when you turn off the analyzer or when you press
[
][
Preset
This section does not show you how to install your analyzer. If you have just
unpacked your analyzer, refer to your Agilent35670A Installation and Verification
Guide..
DO PRESET
].
13
Page 28
Setting Up Agilent 35670A Quick Start Guide
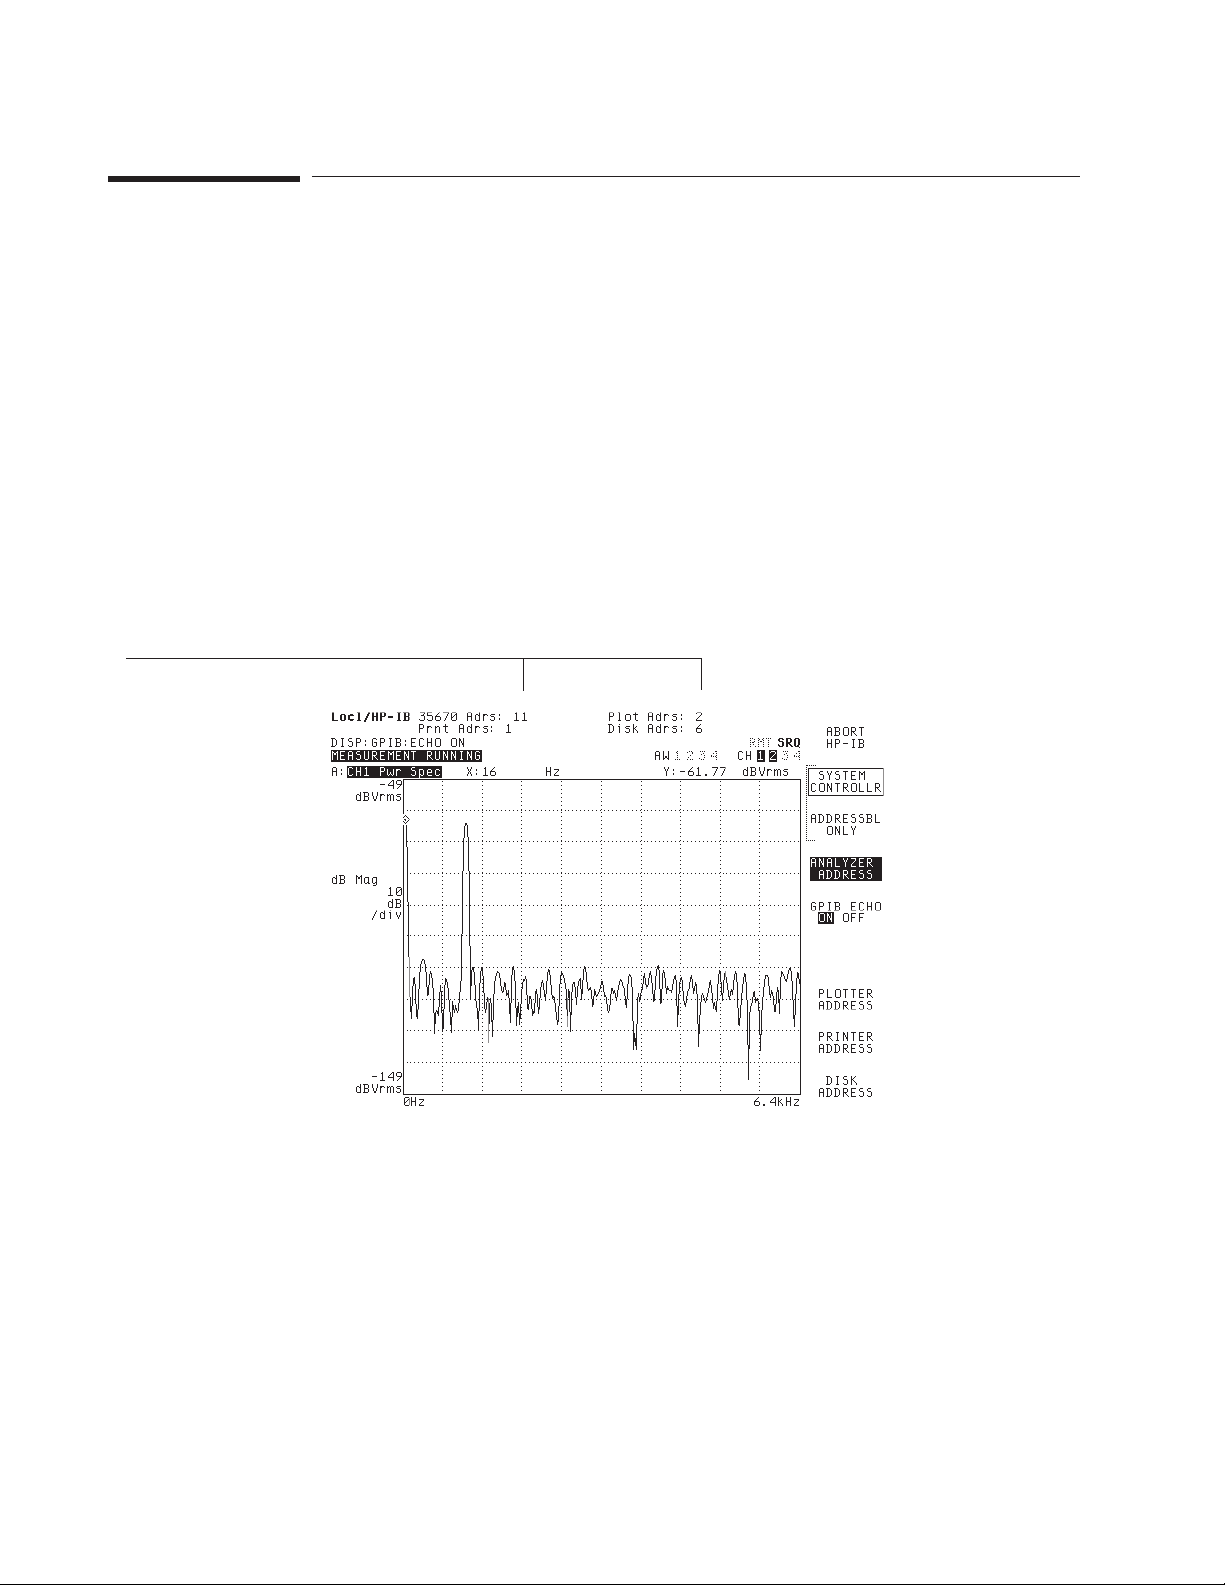
To set the analyzer’sGPIBaddress
1
Press [
Local/GPIB
].
2 Verify the analyzer’s GPIB address at the top of the display.
3 To change the address, press [
You can create an GPIB system by connecting your analyzer to other devices with
GPIB cables. For example, you create a simple GPIB system when you connect the
analyzer to an GPIB plotter. To make the system function properly, you must assign a
unique address to each attached device—even the analyzer.
The analyzer’s address is set to 11 at the factory. Valid values include all integers
from 0 through 30.
Current GPIB Address
Settings
ANALYZER ADDRESS
]<number>[
ENTER
].
14
Page 29
Agilent 35670A Quick Start Guide Setting Up
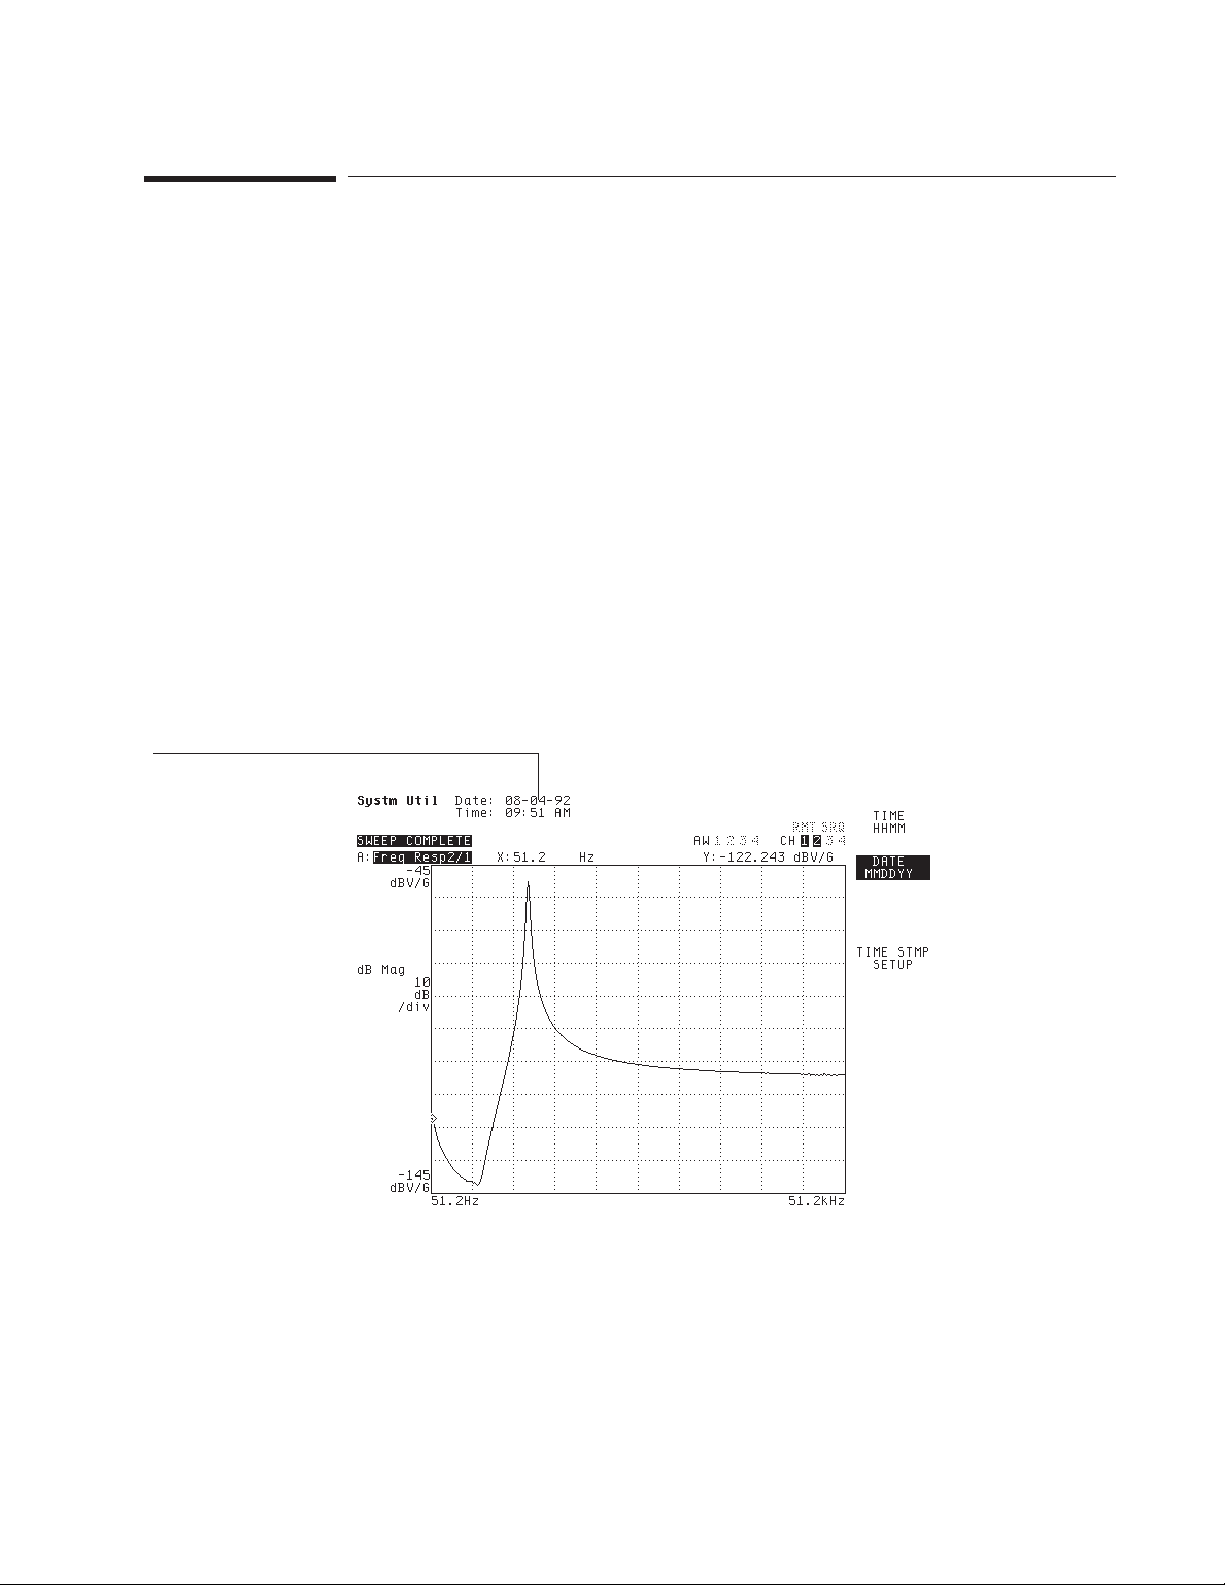
To set the analyzer’sclock
Time and date are
included in top-left
corner when you plot
or print with [TIME
STMP ON] in
[Plot/Print] [MORE
SETUP] menus
Press [
1
2 Press [
3 Press [
System Utility
TIME HHMM
DATE MMDDYY
] [
CLOCK SETUP
] <time> [
]<date>[
ENTER
ENTER
].
].
].
You can set the analyzer’s battery-backed clock to match the current time and date.
After you set the clock, it maintains the time and date—even when the analyzer is
turned off.
Enter <time> and <date> using the numeric keypad. Use a 24-hour format for <time>
and a month-day-year format for <date>.
The time stamp determines how the analyzer displays the date and time. To change
the format of the time stamp, press [
[
TIME STAMP SETUP
]. The analyzer provides several formats. See online help for
System Utility
] [
CLOCK SETUP
]
more information.
15
Page 30

Setting Up Agilent 35670A Quick Start Guide
To select the default disk
1
Press [
Disk Utility
] [
DEFAULT DISK
].
or
Press [
2 Press [
Save/Recall
NON-VOL RAM DISK
] [
DEFAULT DISK
]
].
or
Press [
VOLATILE RAM DISK
]
or
Press [
INTERNAL DISK
]
or
Press [
EXTERNAL DISK
].
Your default disk selection tells the analyzer which disk to use when it is saving and
recalling files. You can use online help to learn more about these options, but here is
an overview:
• [
NON-VOL RAM DISK
] selects the analyzer’s battery-backed RAM disk. There is
approximately 100 Kbytes of storage space for data. (Option UFF adds an
additional 1 Mbytes of non-volatile RAM.) The data is not lost when you turn off
the analyzer.
• [
VOLATILE RAM DISK
] selects the analyzer’s volatile RAM disk. Data is lost when
you turn off the analyzer. However, you can format the disk to hold more data than
the non-volatile RAM disk, and file operations are much faster than on the internal
disk.
• [
INTERNAL DISK
] selects the analyzer’s internal disk drive. The internal disk uses
3.5-inch flexible disks (double-sided, double- or high-density). For more
information, see “To format a flexible disk” later in this book.
• [
EXTERNAL DISK
number with the [
drive in the [
must be set as the [
] selects an external GPIB disk. (You must specify a disk unit
EXTERNAL DISK UNIT
Local/GPIB
] menu with the [
SYSTEM CONTROLLER
] softkey.) Enter the address of the disk
DISK ADDRESS
] softkey. The analyzer
]. For more information on setting
addresses, see online help.
16
Page 31

WorkingwiththeDisplay
Page 32

Page 33

WorkingwiththeDisplay
This section shows you how to control important display options. It will be easier for
you to analyze data if you know how to control these options.
17
Page 34
Working with the Display Agilent 35670A Quick Start Guide
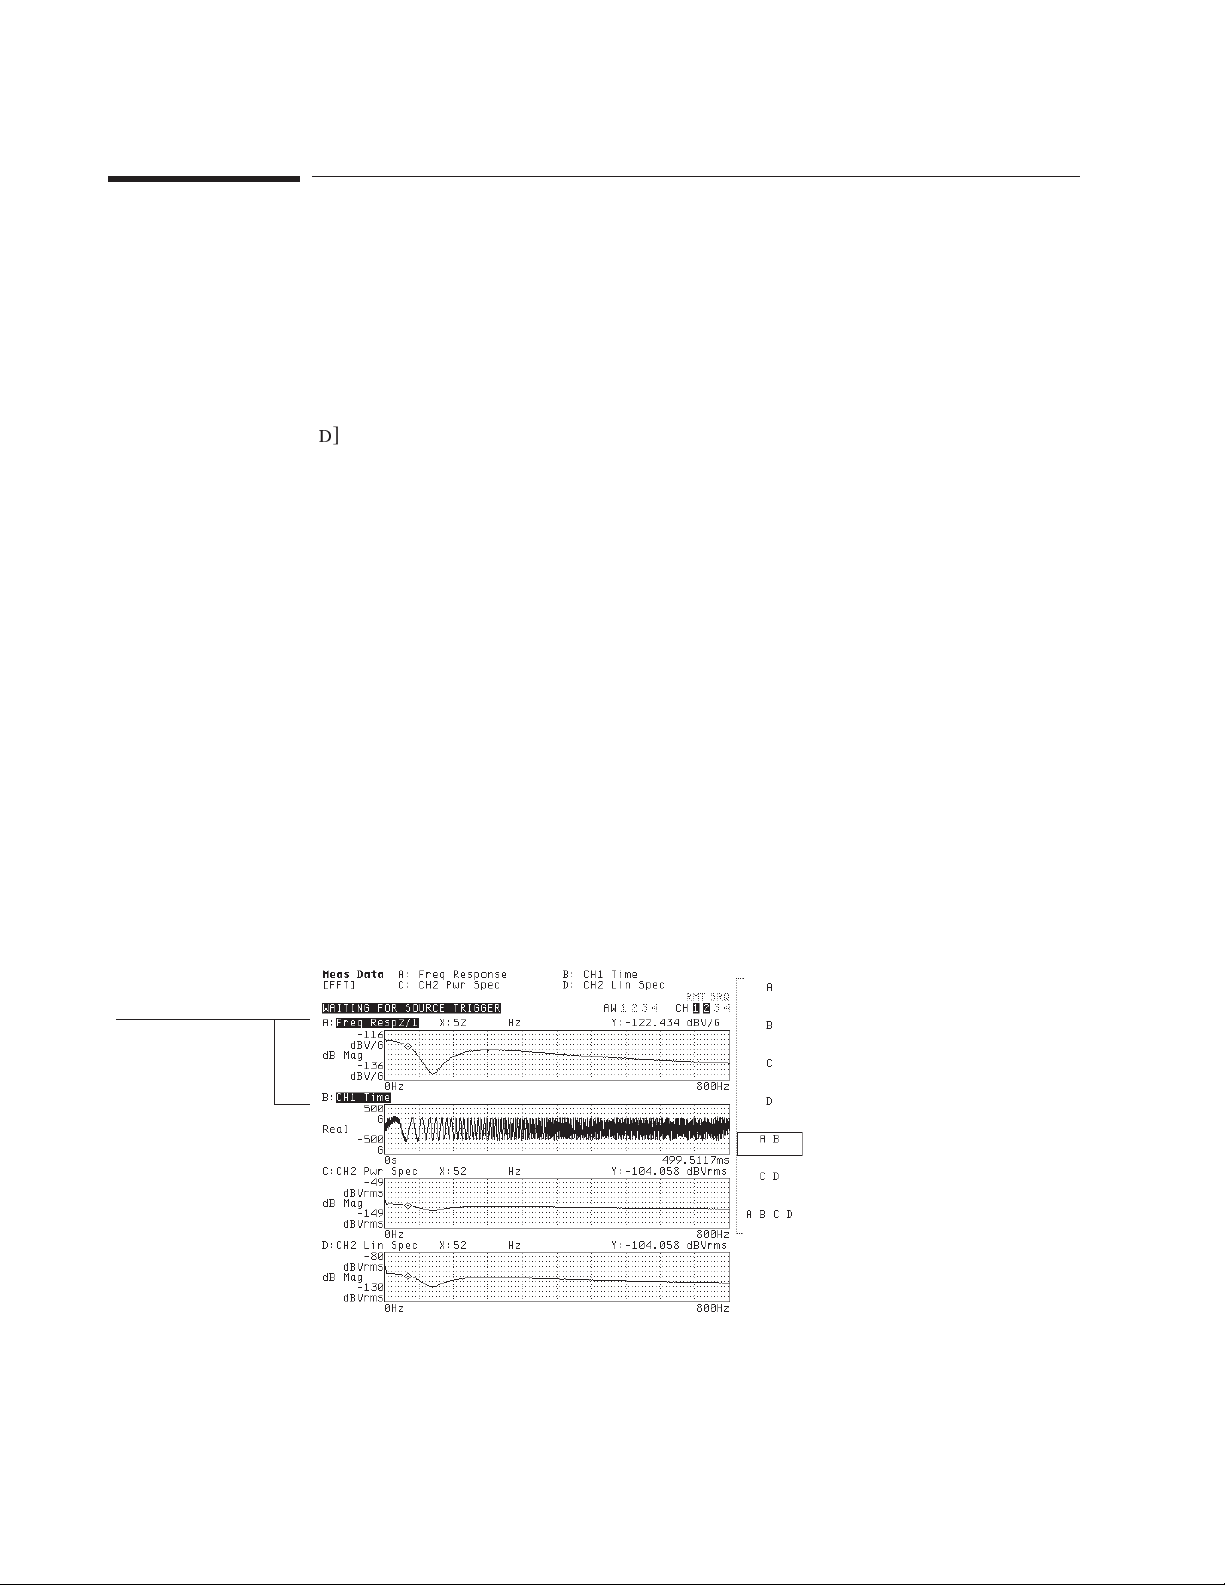
To select the active trace
1
Press [
Active Trace
].
2 Press one of the following softkeys:
[
]
A
]
[
B
]
[
C
[
]
D
]
[
AB
]
[
CD
[
ABCD
The analyzer has four trace buffers that are independent of the input channels: trace A,
trace B, trace C, and trace D. In addition to the individual traces, the following traces
can be active at the same time:
• A and B—trace A is the “most active” trace.
• C and D—trace C is the “most active” trace.
• ABCD—trace A is the “most active” trace.
Trace pairs AC and BD cannot be active at the same time.
The “most active” trace data is saved during a save operation and menu selections
show the “most active” trace setup.
You have many options for selecting and displaying the contents of a trace, but you
must activate the trace before you can change these options. For example, most of the
selections under the [
].
Marker
] and [
Display
] menus only affect the active trace.
Inverse video
indicates which
traces are active
18
Page 35
Agilent 35670A Quick Start Guide Working with the Display
To display traces
Press [
1
2 Press [
Disp Format
SINGLE
].
].
or
press [
SINGLE FRNT/BACK
].
or
press [
UPPER/LOWER
].
or
press [
UPPER/BIG LOWER
].
or
press [
UPPR/LOWR FRNT/BACK
].
or
QUAD
].
press [
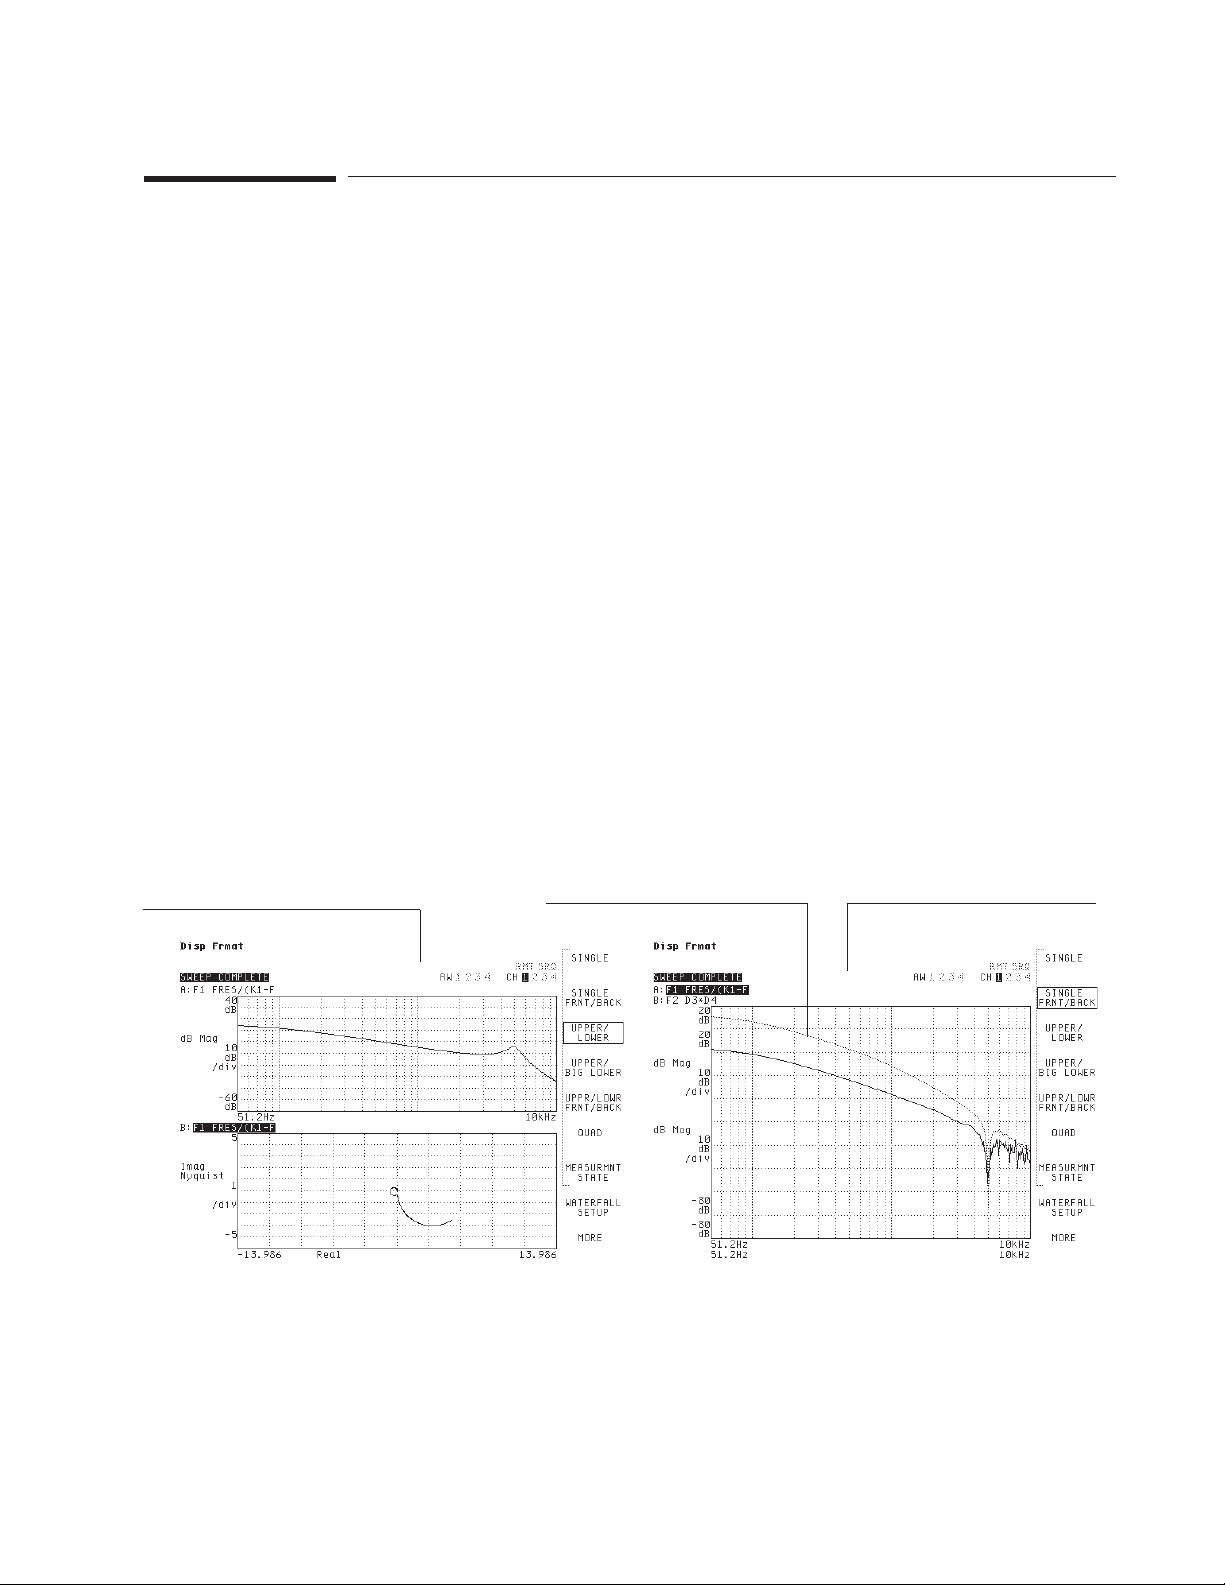
When you display multiple traces, any number of them can be active. The analyzer
uses inverse video to show you which traces are active.
If you select the front/back formats (press [
[
UPPR/LOWR FRNT/BACK
]), the “back” trace is ghosted (displayed with half-bright
SINGLE FRNT/BACK
]or
characters).
The analyzer allows only one active trace if you select the single-trace display format.
The analyzer selects the “most active” trace. See the previous task if you do not
understand what it means to activate a trace.
Upper/lower trace format
Back trace appears ghosted
Single Front/Back format
19
Page 36
Working with the Display Agilent 35670A Quick Start Guide
To select measurement data
Select the active traces. (See “To select the active trace,” the first task in this section.)
1
2 Press [
3 Press [
Meas Data
CHANNEL 1 2
or
Press [
CHANNEL 1 2 3 4
selections as you press [
4 Press one of the measurement data softkeys. The [
another menu of measurement data selections.
If measurement data is not available, its softkey label is ghosted (displayed using
half-bright characters). The availability of trace data is limited by:
• your selection of instrument mode (See “To select an instrument mode” in the first
section.)
• the number of active channels
].
]
] (option AY6). The analyzer steps through the channel
CHANNEL 1 2 3 4
].
MORE CHOICES
] softkey displays
20
Page 37
Agilent 35670A Quick Start Guide Working with the Display
When the analyzer has two active input channels and multiple active traces, selecting
measurement data while the [
• Channel 1 measurement data to Trace A.
• Channel 2 measurement data to Trace B.
• Channel 1 measurement data to Trace C.
• Channel 2 measurement data to Trace D.
ALL CHANNELS
] softkey is highlighted, sets:
When the analyzer has four active input channels (Option AY6) and four active traces,
selecting measurement data while the [
• Channel 1 to Trace A.
• Channel 2 to Trace B.
• Channel 3 to Trace C.
• Channel 4 to Trace D.
ALL CHANNELS
] softkey is highlighted, sets:
21
Page 38
Working with the Display Agilent 35670A Quick Start Guide
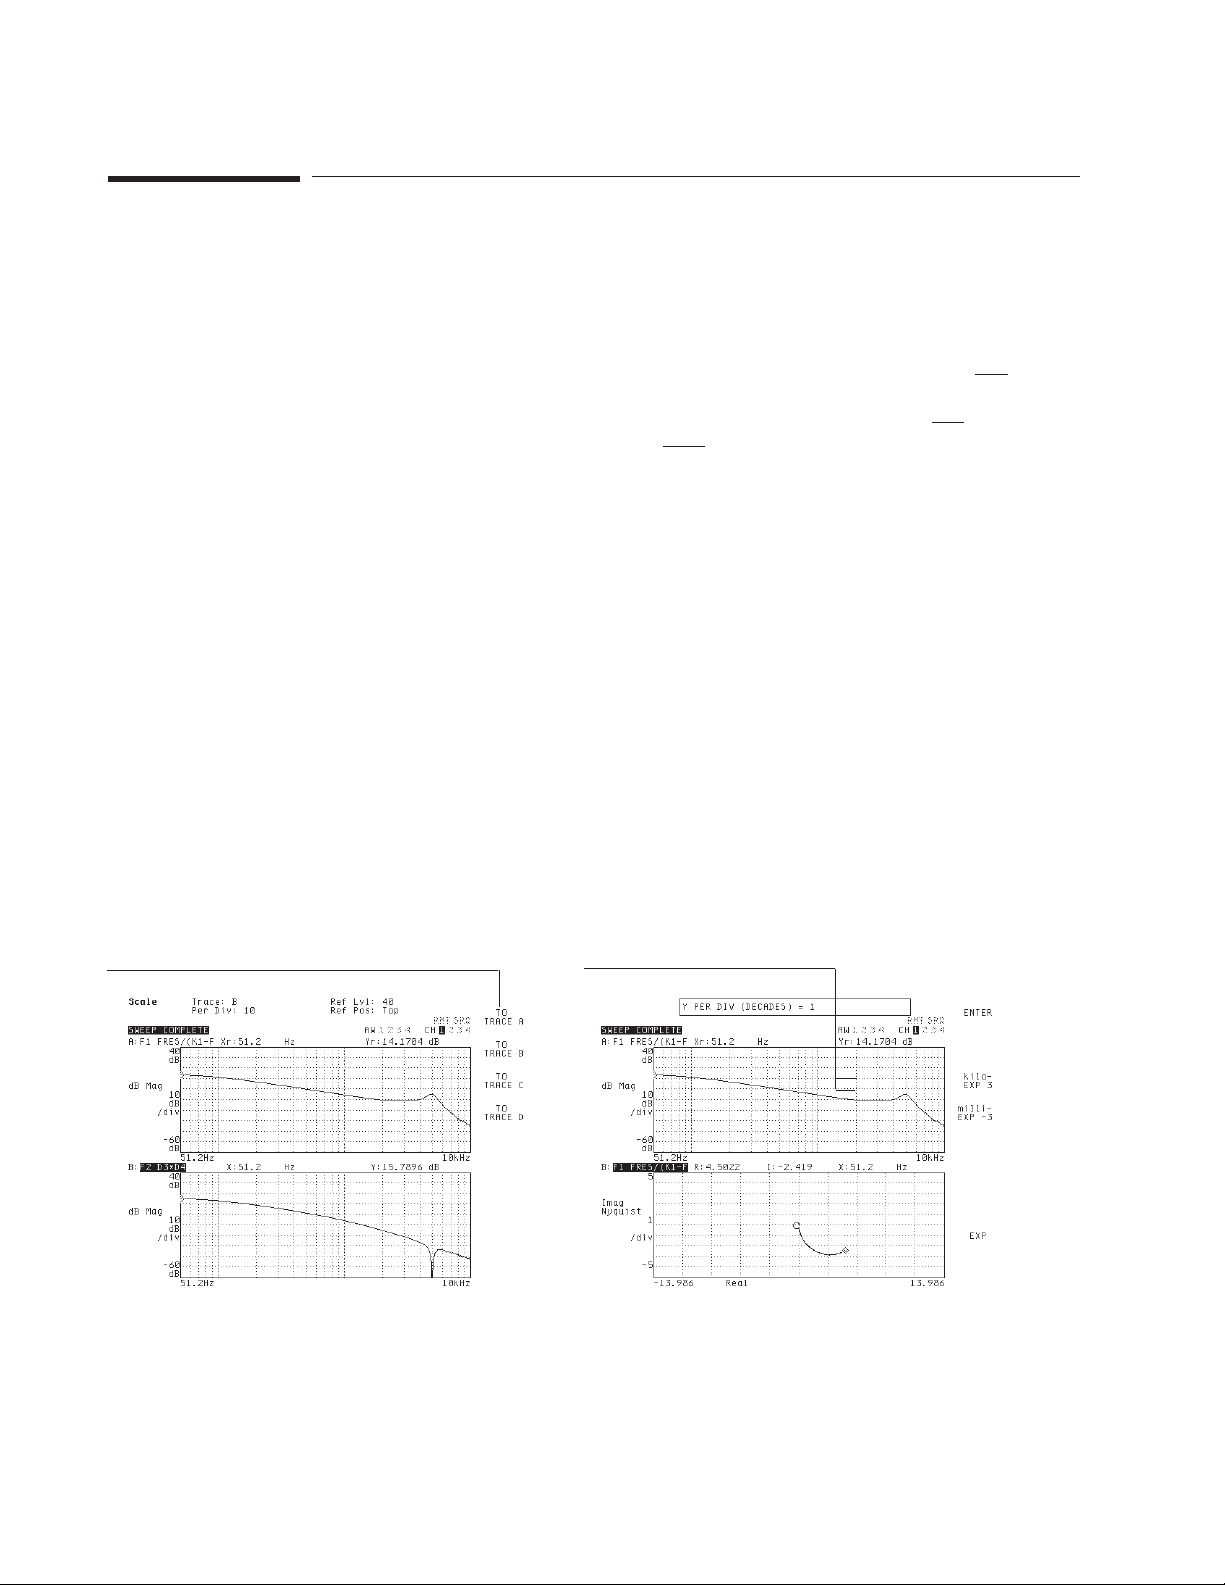
To scale measurement data
Select the active trace(s) you want to scale. (See “To select the active trace,” the first
1
task in this section.)
2 For continuous autoscaling, press [
or
For single autoscaling, press [
press [
Autoscaling provides a convenient starting point when you are scaling measurement
data. It displays all of the data within the bounds of the active trace box. From this
starting point, you can easily reposition and expand the trace by modifying the values
of other scaling softkeys.
• Use [
reference value you specify. You can also anchor the reference to the top of the
trace box ([
([
• Use [
enter a value that defines the height of each vertical division.
• Use [
the input channel supplying the measurement data.
To learn more about the scaling softkeys, use online help.
Matches Scale Menu scales the
active trace to any other trace
AUTOSCALE ON OFF
CENTER REFERENCE
TOP REFERENCE
BOTTOM REFERENCE
YPERDIV
INP RANGE TRACKING
] to expand or compress the trace in relation to the Y-axis. You
Scale
] [
Scale
] [
AUTOSCALE ON OFF
AUTOSCALE ON OFF
] to highlight ON.
] to highlight ON, then
] to highlight OFF.
] to expand or compress a trace around the center
]) or to the bottom of the trace box
]).
] to expand or compress a trace in relation to the level of
Y Per Dir defines the increment
between Y-axis divisions
22
Page 39
Agilent 35670A Quick Start Guide Working with the Display
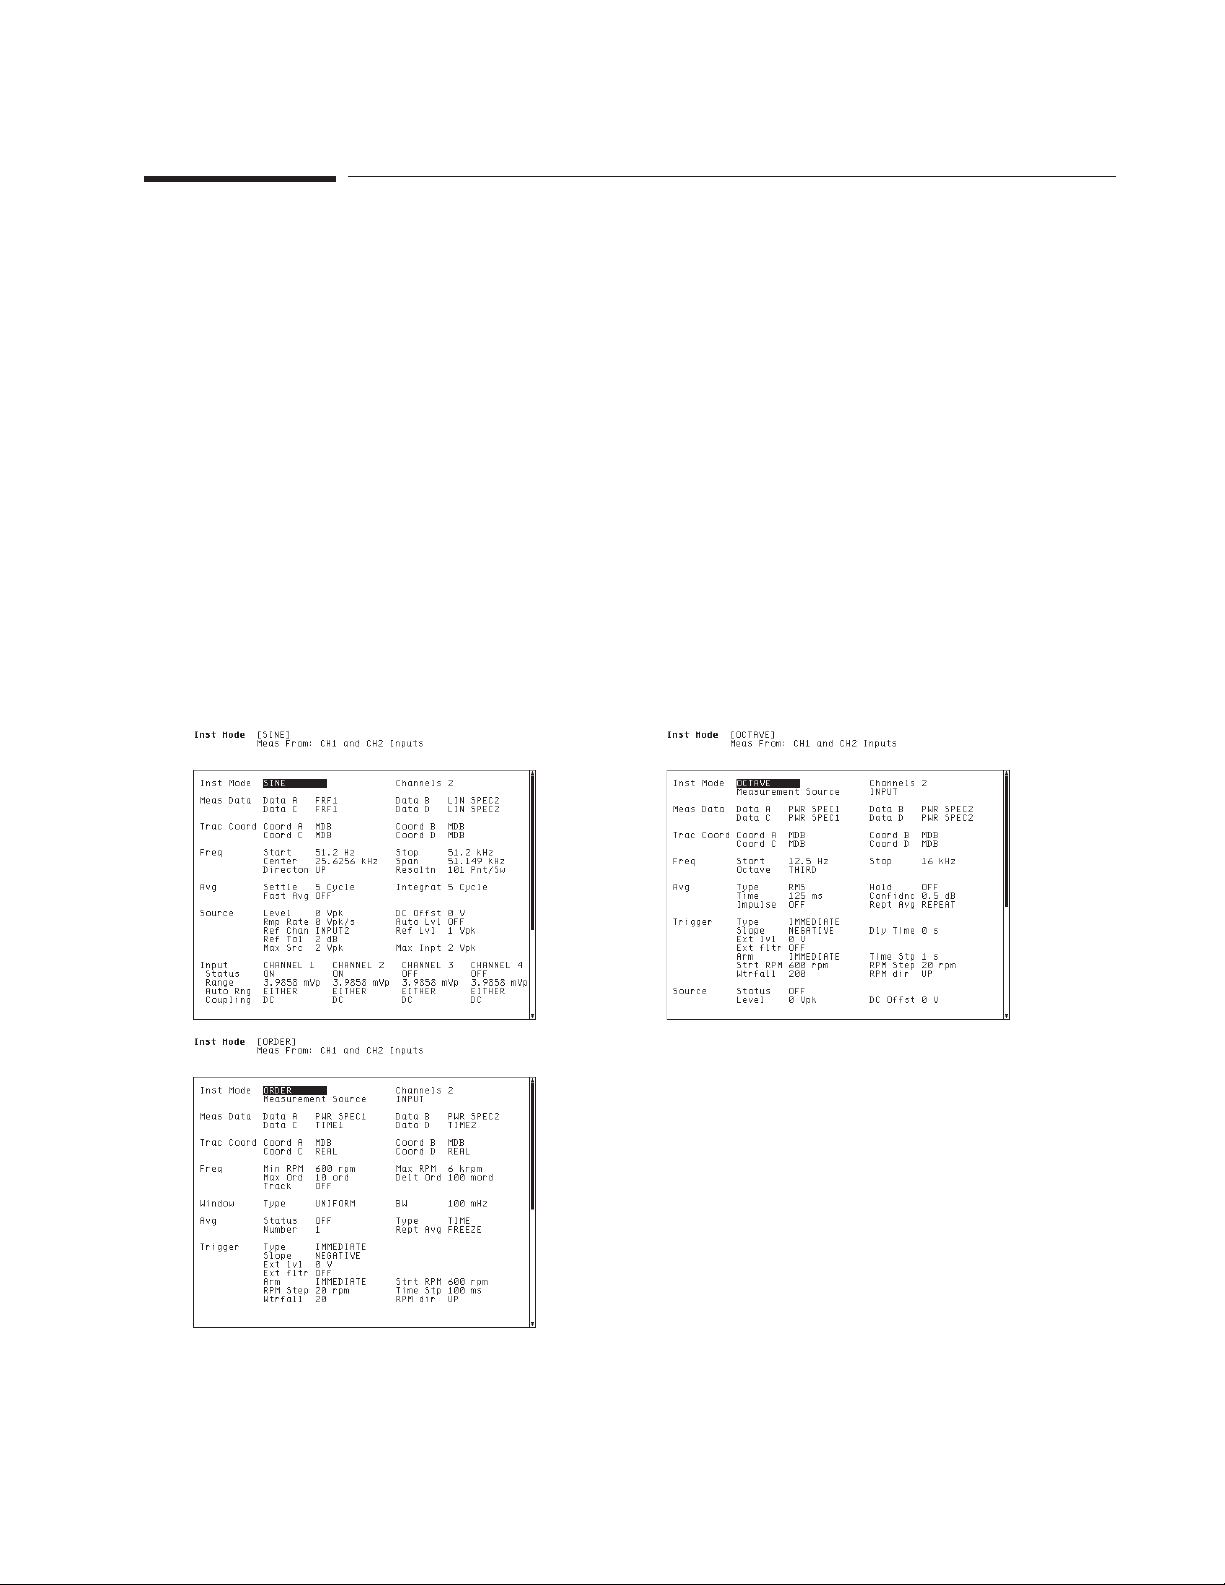
To display the measurement state
•
Press [
Disp Format
The measurement state is a list that summarizes the current states of important
measurement parameters. There are several ways you can use the list. You can:
• quickly check the current setup
• document the setup (The list can be printed or plotted.)
• change the parameters while viewing the setup (See the next task, “To change
parameters using the measurement state.”)
When you learn to switch between the analyzer’s instrument modes, you will notice
that the contents of the list are different for each mode. This reflects the fact that some
parameters are not used for a particular instrument mode.
] [
MEASURMNT STATE
].
Swept Sine instrument mode
(option 1D2)
Realtime Octave analysis instrumnet mode
(option 1D1)
Computed Order analysis intrument
mode (option 1D0)
23
Page 40
Working with the Display Agilent 35670A Quick Start Guide
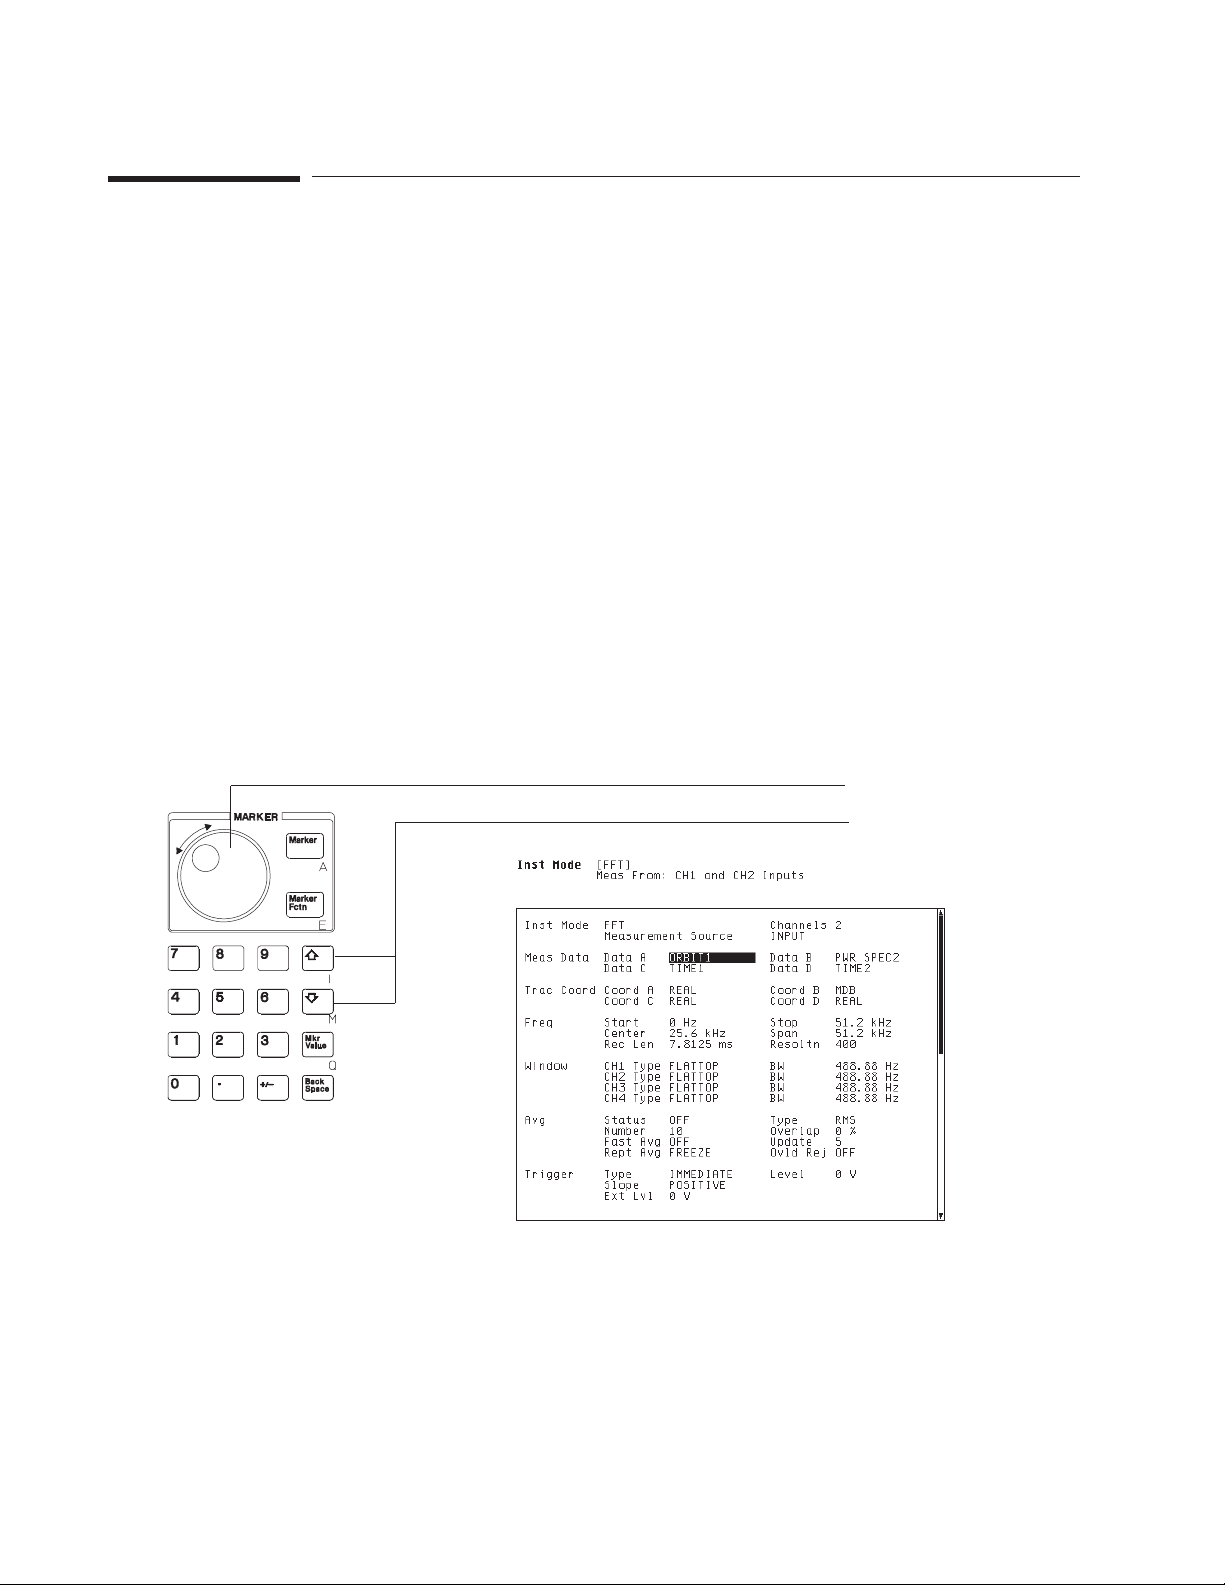
To change parameters using the measurement state
To stop a measurement, press [
1
2 Press [
Disp Format
] [
MEASURMNT STATE
Pause-Cont
].
].
3 Using the knob, move the cursor to the field you wish to change.
4 Use the up-arrow or down-arrow keys to step through the available values for that
field.
or
Press <number> <unit>.
5 Press [
6 Press [
Pause-Cont
Disp Format
As you select parameter values, the analyzer may change other parameters to their
default value. It is best to start at the top of the list and work your way down.
Pausing the measurement while you change the measurement state, allows the process
to go faster.
].
] and the appropriate trace-display format softkey.
Turn the knob to select the field
Use the arrow keys to step through values
24
Page 41
Agilent 35670A Quick Start Guide Working with the Display
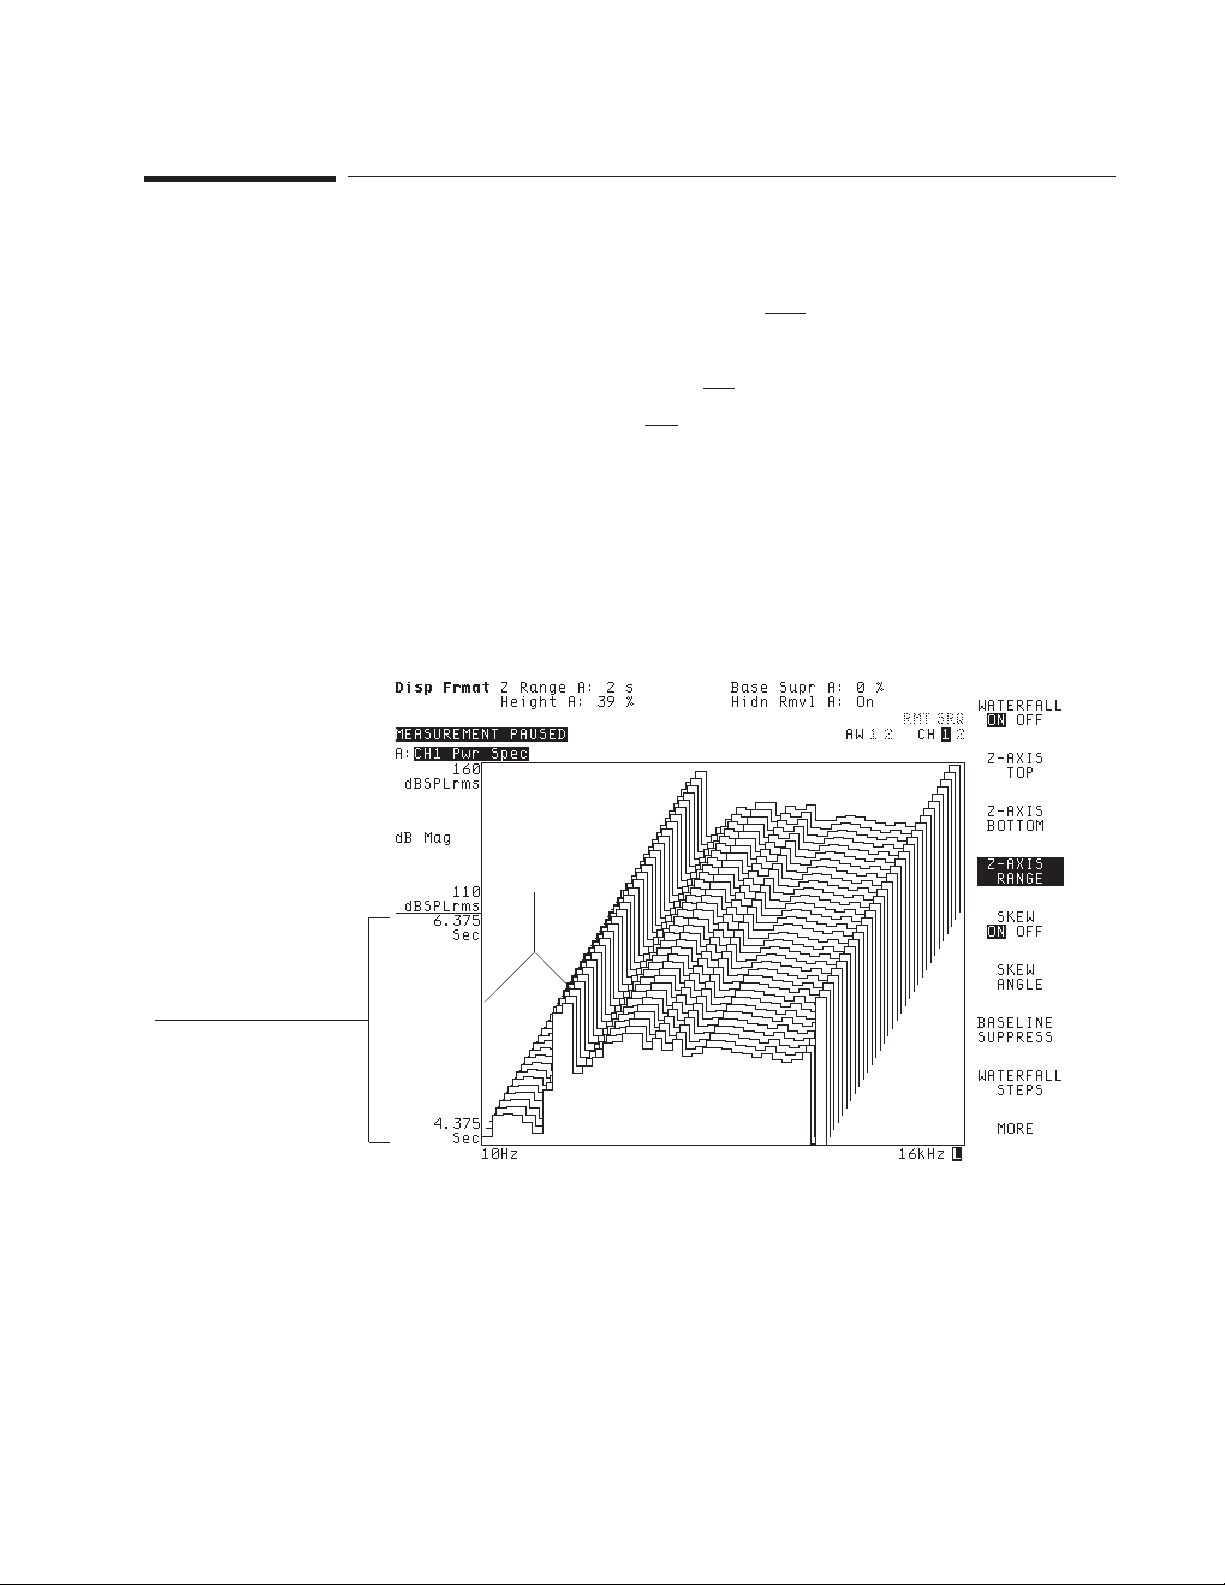
Todisplayawaterfall
Press [
1
2 Press [
3 Press [
4 Press [
5 Press [
The traces scroll down the trace box. The newest trace is at the top. The
[
Z AXIS RANGE
waterfall. The range varies with the type of data you are displaying.
The waterfall diplay format is not available for swept sine measurements. For more
information, see the Agilent 35670A Operator’s Guide and online help.
] [
Scale
Disp Format
WATERFALL ON OFF
SKEW ON OFF
Z AXIS RANGE
AUTOSCALE ON OFF
] [
WATERFALL SETUP
] to highlight ON.
] <number> <unit>.
] key specfies the range of complete traces you want displayed on the
Skew Angle
] to highlight OFF.
].
] to highlight ON.
Z-axis range values
25
Page 42

Working with the Display Agilent 35670A Quick Start Guide
26
Page 43

Making Measurements
Page 44

Page 45

Making Measurements
This section shows you how to make several basic measurements. Each of the major
instrument modes is presented.
• FFT Analysis
• Real-time Octave Measurements (Option 1D1 only)
• Computed Order Tracking (Option 1D0 only)
• Swept Sine Measurements (Option 1D2 only)
• Correlation
• Histograms and Time Domain
27
Page 46
Making Measurements Agilent 35670A Quick Start Guide
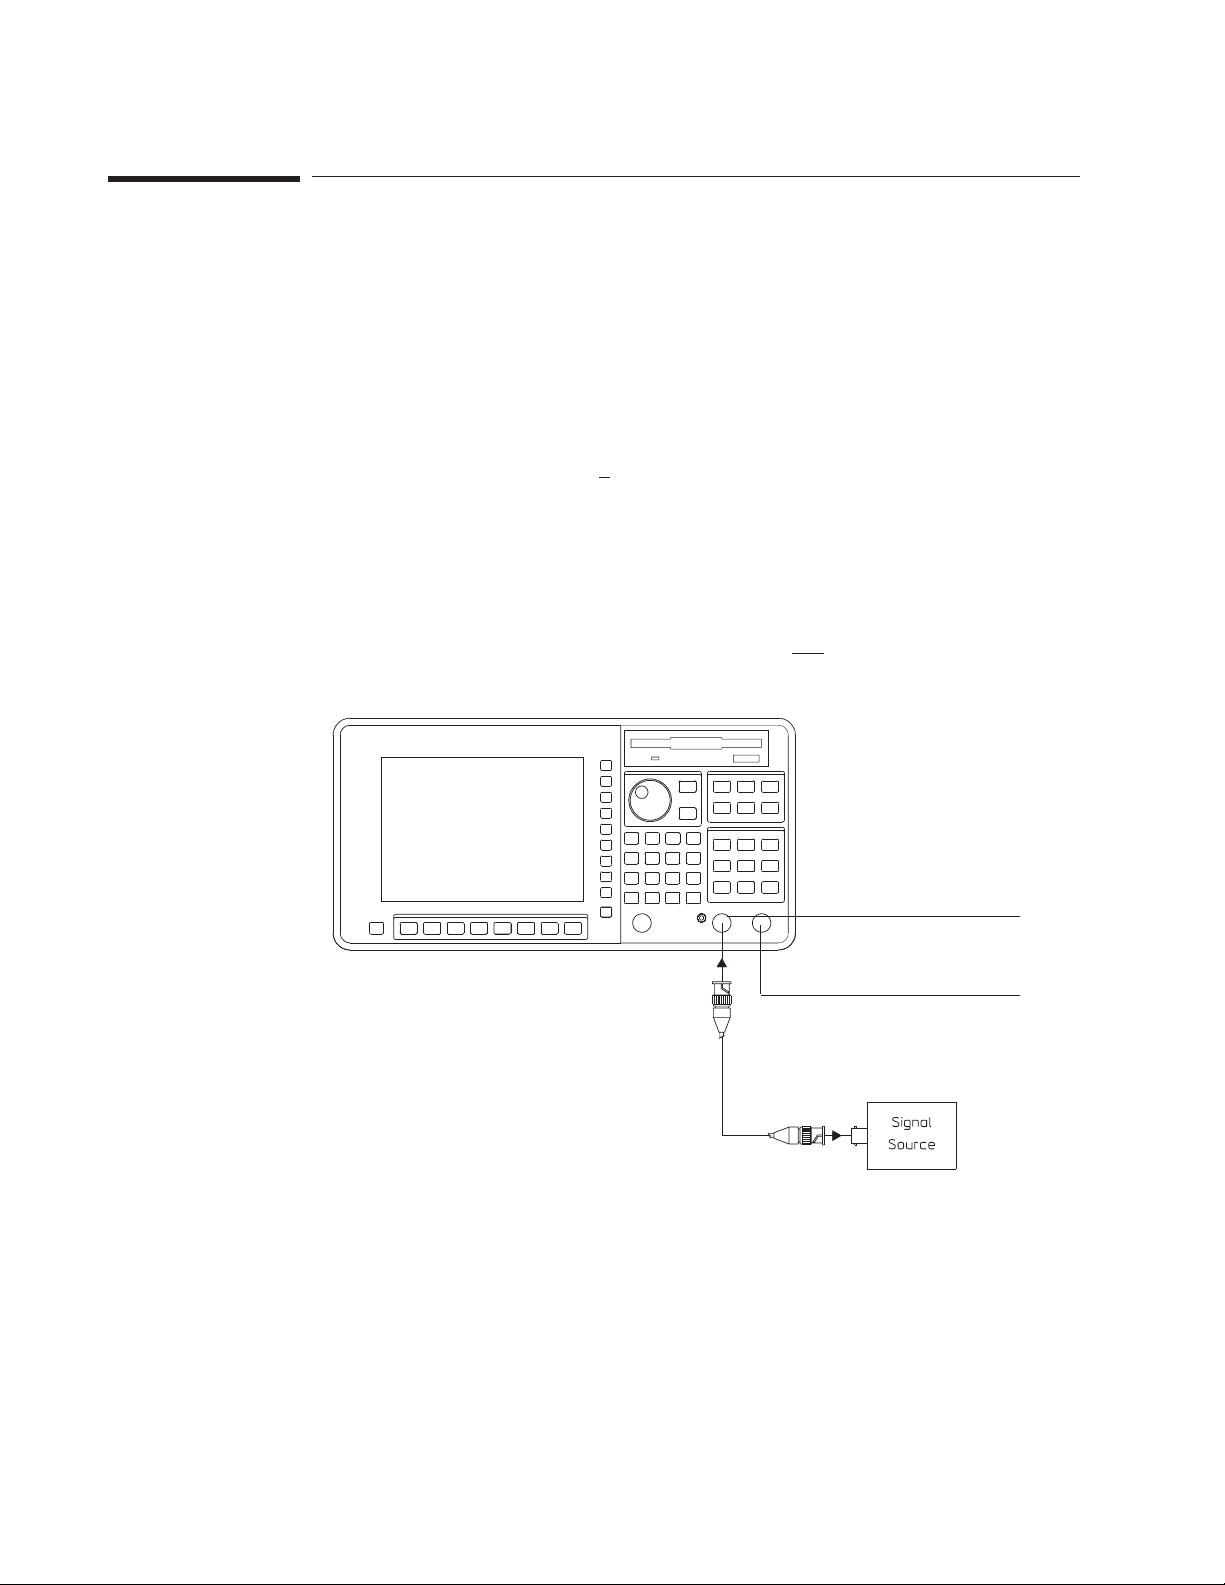
To measure a spectrum
The Agilent 35670A evaluates signals and devices under 102.4 kHz. Dynamic range
is 80 dB guaranteed. The analyzer has a 25.6 kHz real-time rate at 400 lines of
resolution.
1 Initialize the analyzer.
Press [
Press [
or [
CHANNELS 1 2 4
] then press [
Preset
CHANNELS 1 2
DO PRESET
]
] to highlight 1.
].
2 Connect the signal source as shown in the illustration.
3 Select the measurement parameters.
Press [
Freq
] [
] <number> <unit>, then press [
START
] <number> <unit>.
STOP
4 Specify the averaging parameters.
Press [
] then press [
Avg
AVERAGE ON OFF
] to highlight ON.
28
Channel 1
Channel 2
Page 47
Agilent 35670A Quick Start Guide Making Measurements
5 Configure the display.
Press [
], then press[
Scale
AUTOSCALE ON OFF
] to highlight ON.
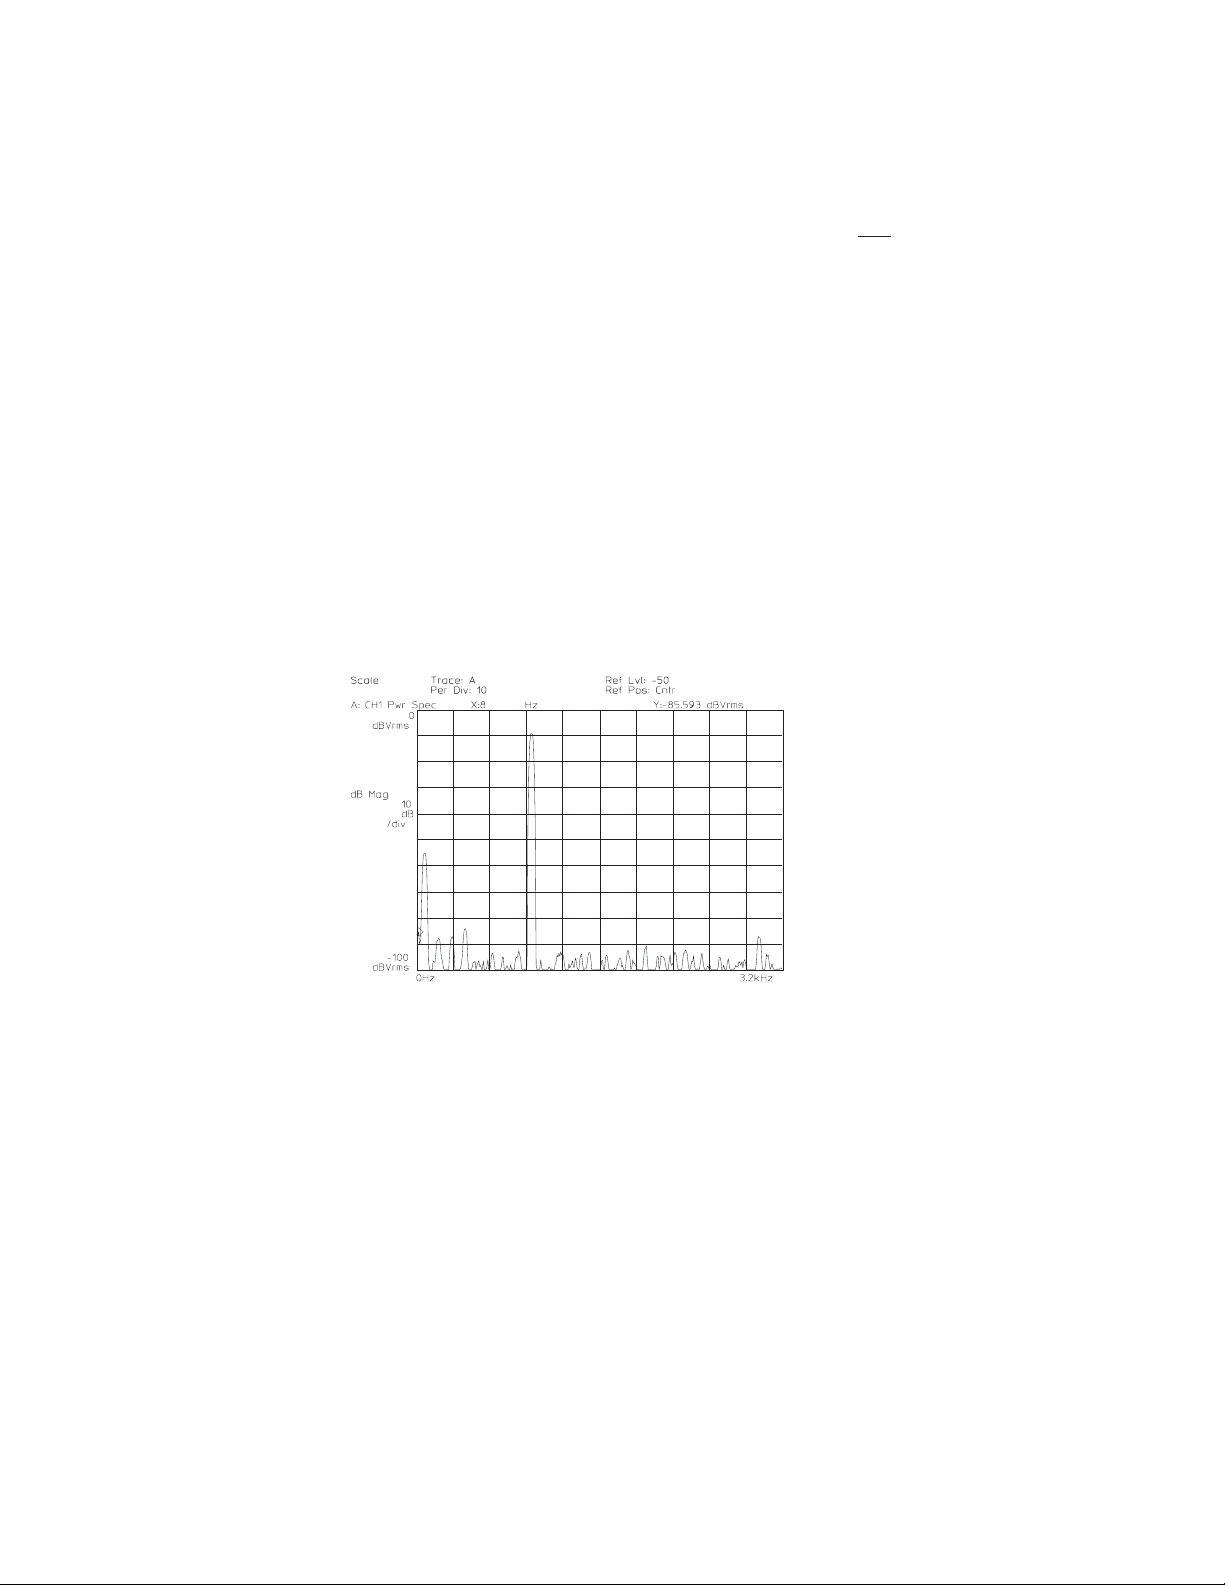
6 Measure the signal source.
Press [
The default number of averages is 10. To specify a different number of averages,
press [
The average count at the bottom of the display is updated after each average.
Resolution can be set to 100, 200, 400 or 800 lines. Press
[
Freq
The lines of resolution appears at the top of the display.
The analyzer has an input impedance of approximately 1 Megohm. If your signal
source needs to be terminated with a lower impedance, use an appropriate feedthrough
terminator between the output of the signal source and the Channel 2 input.
].
Start
] [
Avg
NUMBER AVERAGES
] [
RESOLUTN (LINES)
] <number> [
] <number> [
ENTER
ENTER
].
].
29
Page 48
Making Measurements Agilent 35670A Quick Start Guide
To measure frequency response — FFT
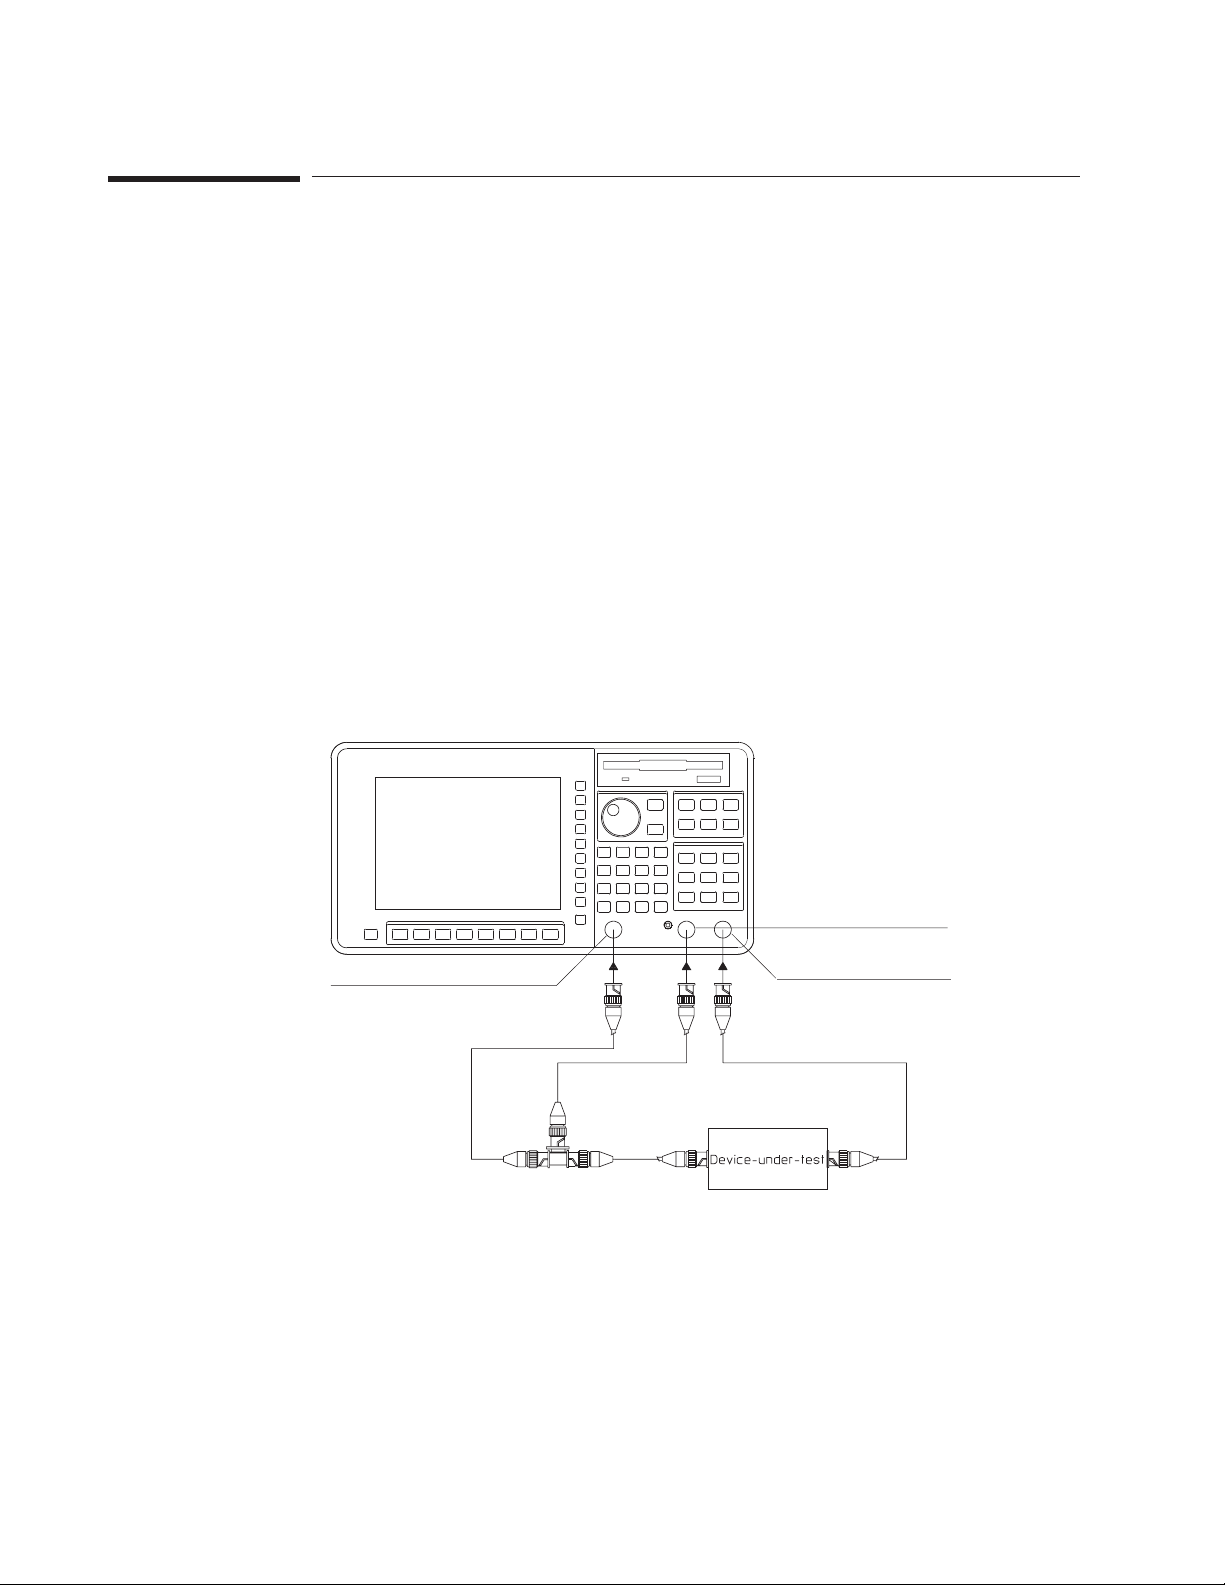
Adevice’s frequency response can be measured using the high-speed FFT analysis.
The dynamic range is typically 80 dB. For better dynamic range, use the optional
Swept Sine instrument mode.
1 Initialize the analyzer.
Press [
[
DO P RESET
Press [
].
Preset
].
Meas Data
] [
FREQ RESP 2/1
].
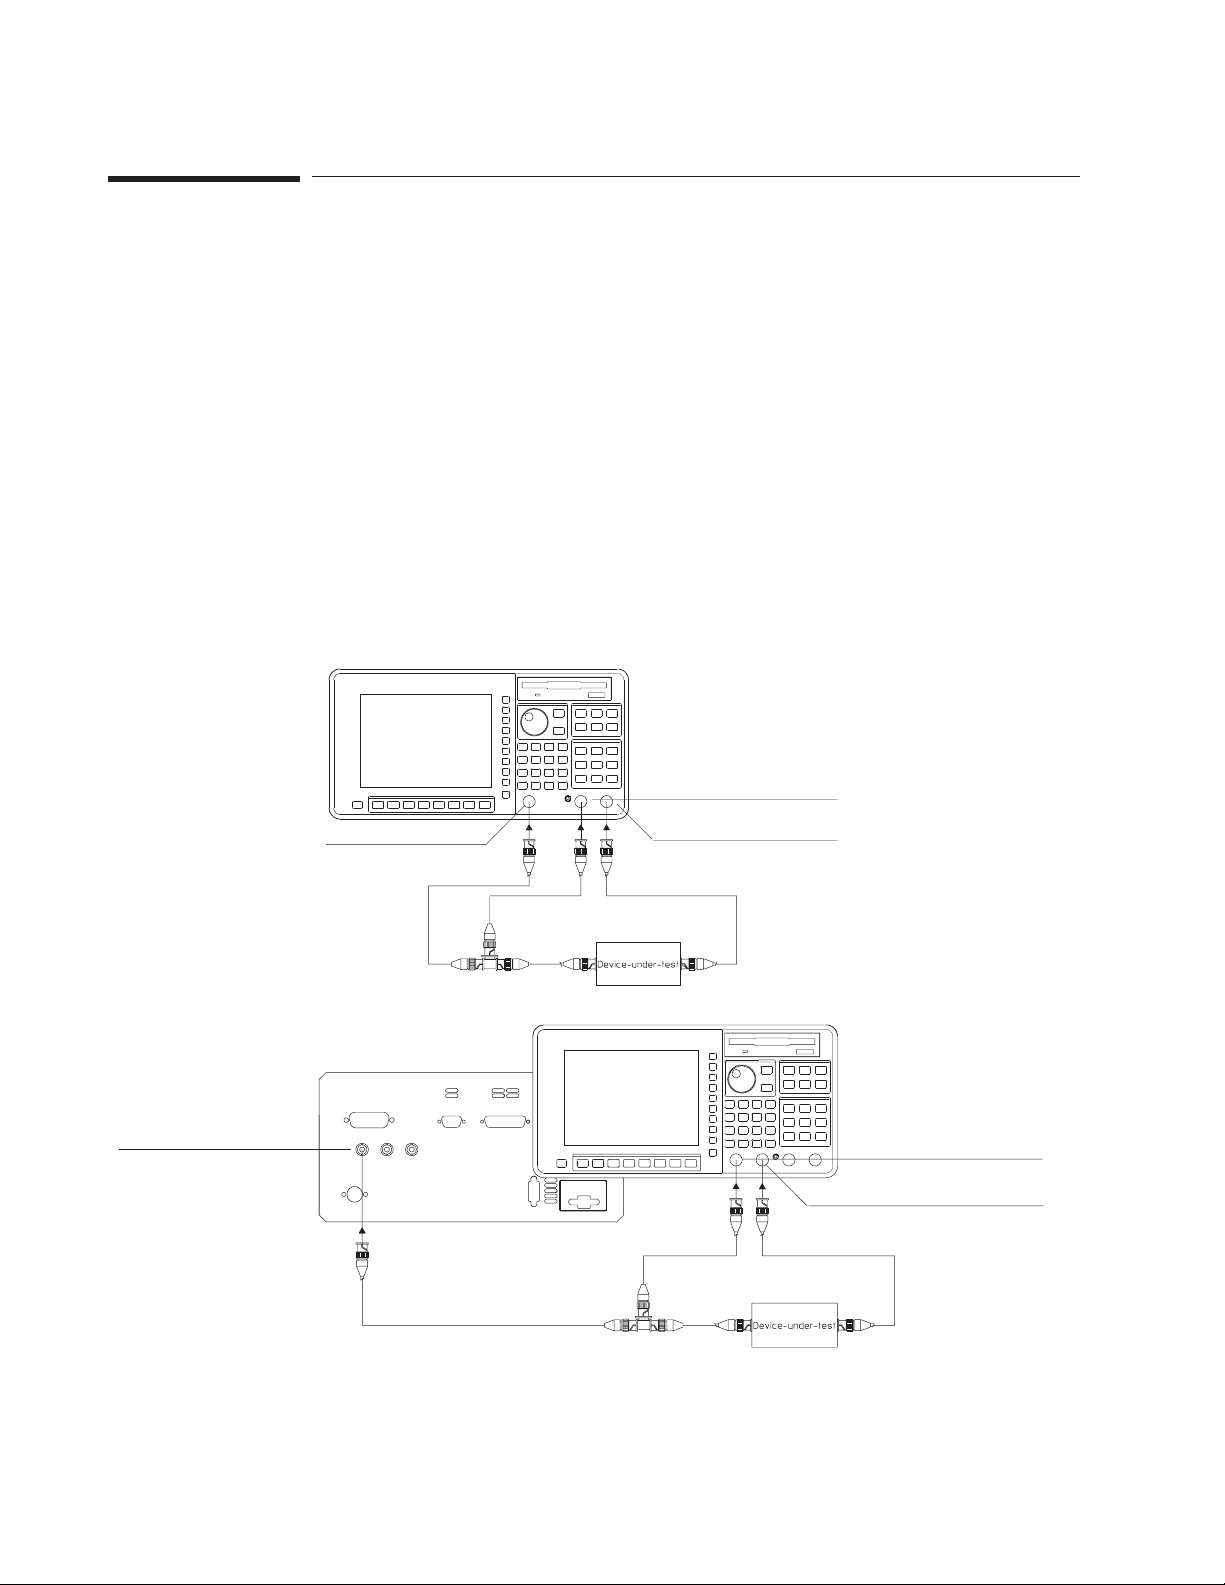
2 Connect the device-under-test (DUT) as shown in the illustration.
3 Specify the measurement parameters.
Press [
Press [
Press [
Press [
] [
Freq
Source
] <number> <unit>, then press [
LEVEL
Window
] <number> <unit>, then press [
START
],[
PERIODIC CHIRP
] [
UNIFORM
].
] <number> <unit>.
STOP
].
SOURCE ON OFF
] to highlightON.
30
Source
Channel 1
Channel 2
Page 49
Agilent 35670A Quick Start Guide Making Measurements
4 Specify the triggering parameters.
Press [
Trigger
] [
SOURCE TRIGGER
].
5 Configure the display.
Press [
Press [
],thenpress[
Scale
Disp Format
AUTOSCALE ON OFF
] [
MORE][BODE DIAGRAM
] to highlight ON.
].
6 Measure the DUT.
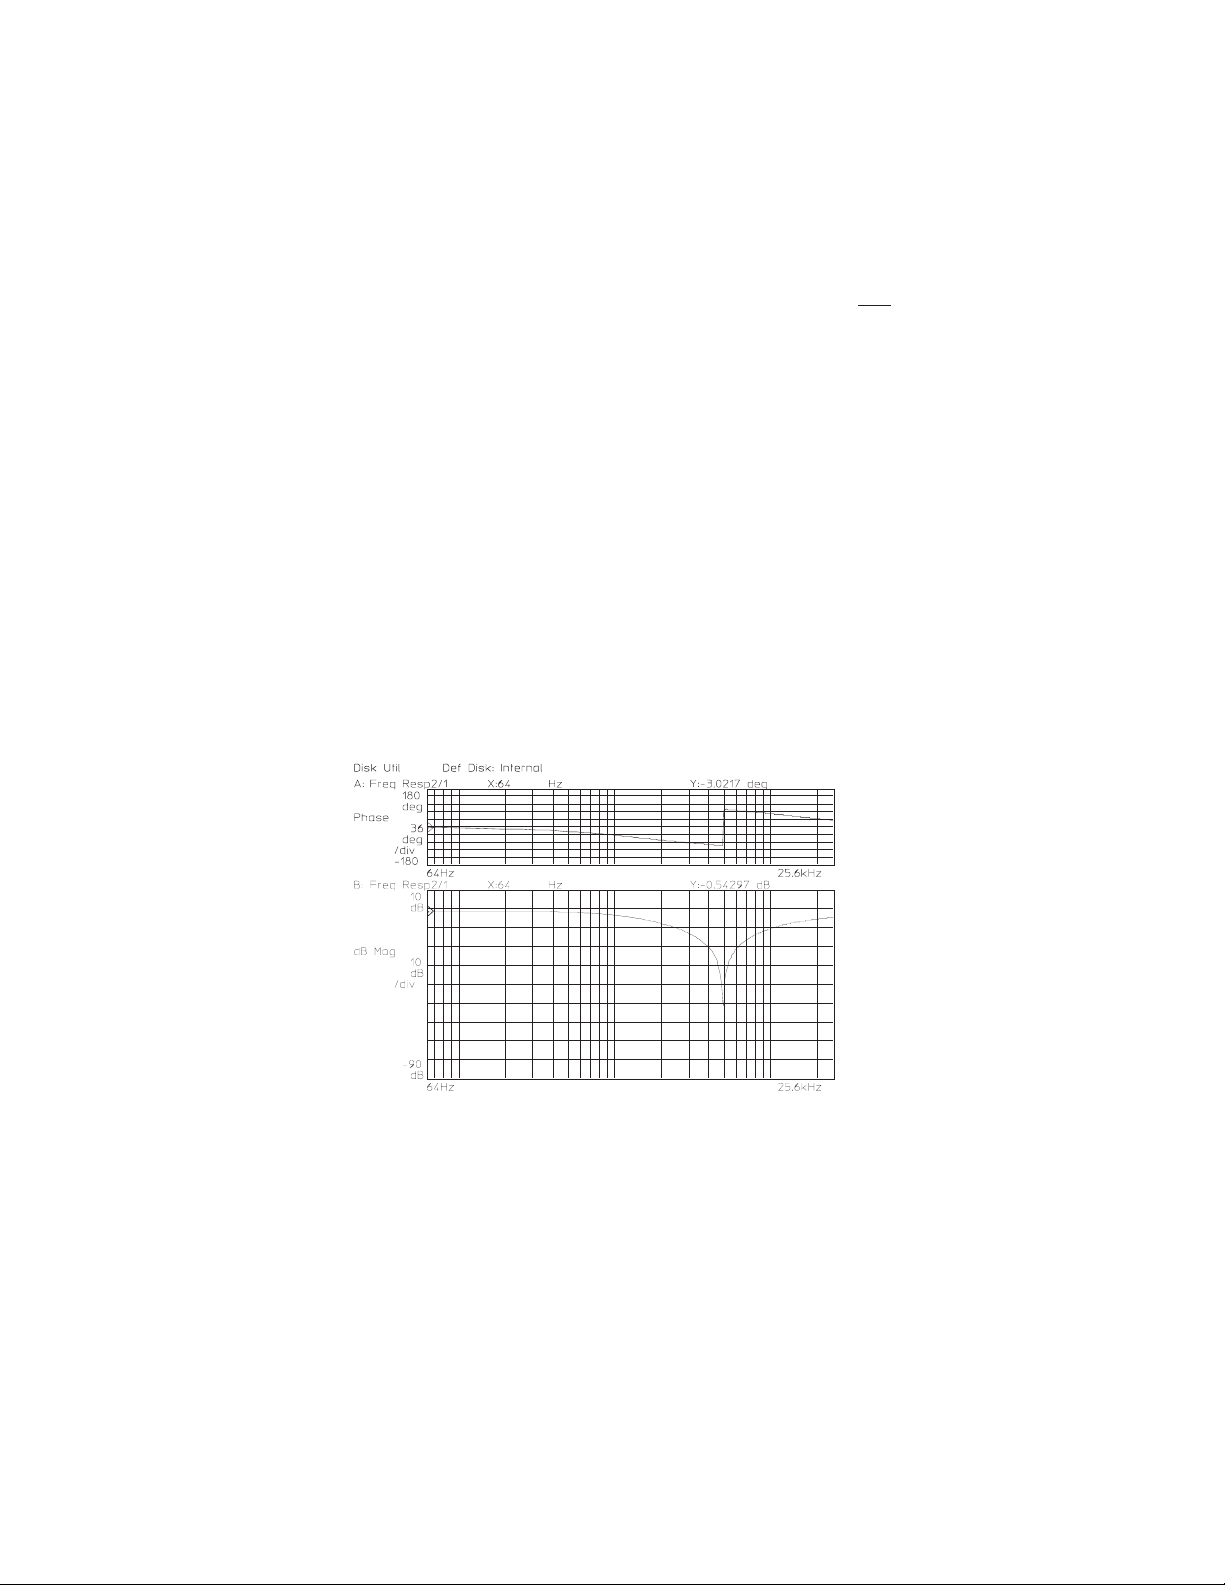
Press [
A triggered measurement and the uniform window selection produces a much more
accurate response at the low end of the frequency spectrum. The periodic chirp
provides more energy than random noise. It is a self-windowing signal that provides
exactly the same stimulus from one measurement average to the next. Consequently,
averaging is not required.
The analyzer’s source impedance is less than 5 ohms. If your DUT needs a specific
source impedance, insert the appropriate resistor in series with the source output.
To display the measurement data on a logarithmic scale
press [
].
Start
Trace Coord
] then press [
X-AXIS LIN LOG
] to highlight LOG.
31
Page 50
Making Measurements Agilent 35670A Quick Start Guide
To measure frequency response — Swept Sine (Option 1D2)
Swept Sine measurements are available only with those Agilent 35670A analyzers
that are equipped with Option 1D2. The measurement range expands to 130 dB
(typical), but measurement time increases as compared to the FFT instrument mode.
1 Initialize the analyzer.
Press [
Press [
] [
Preset
SWEPT SINE
DO PRESET
].
].
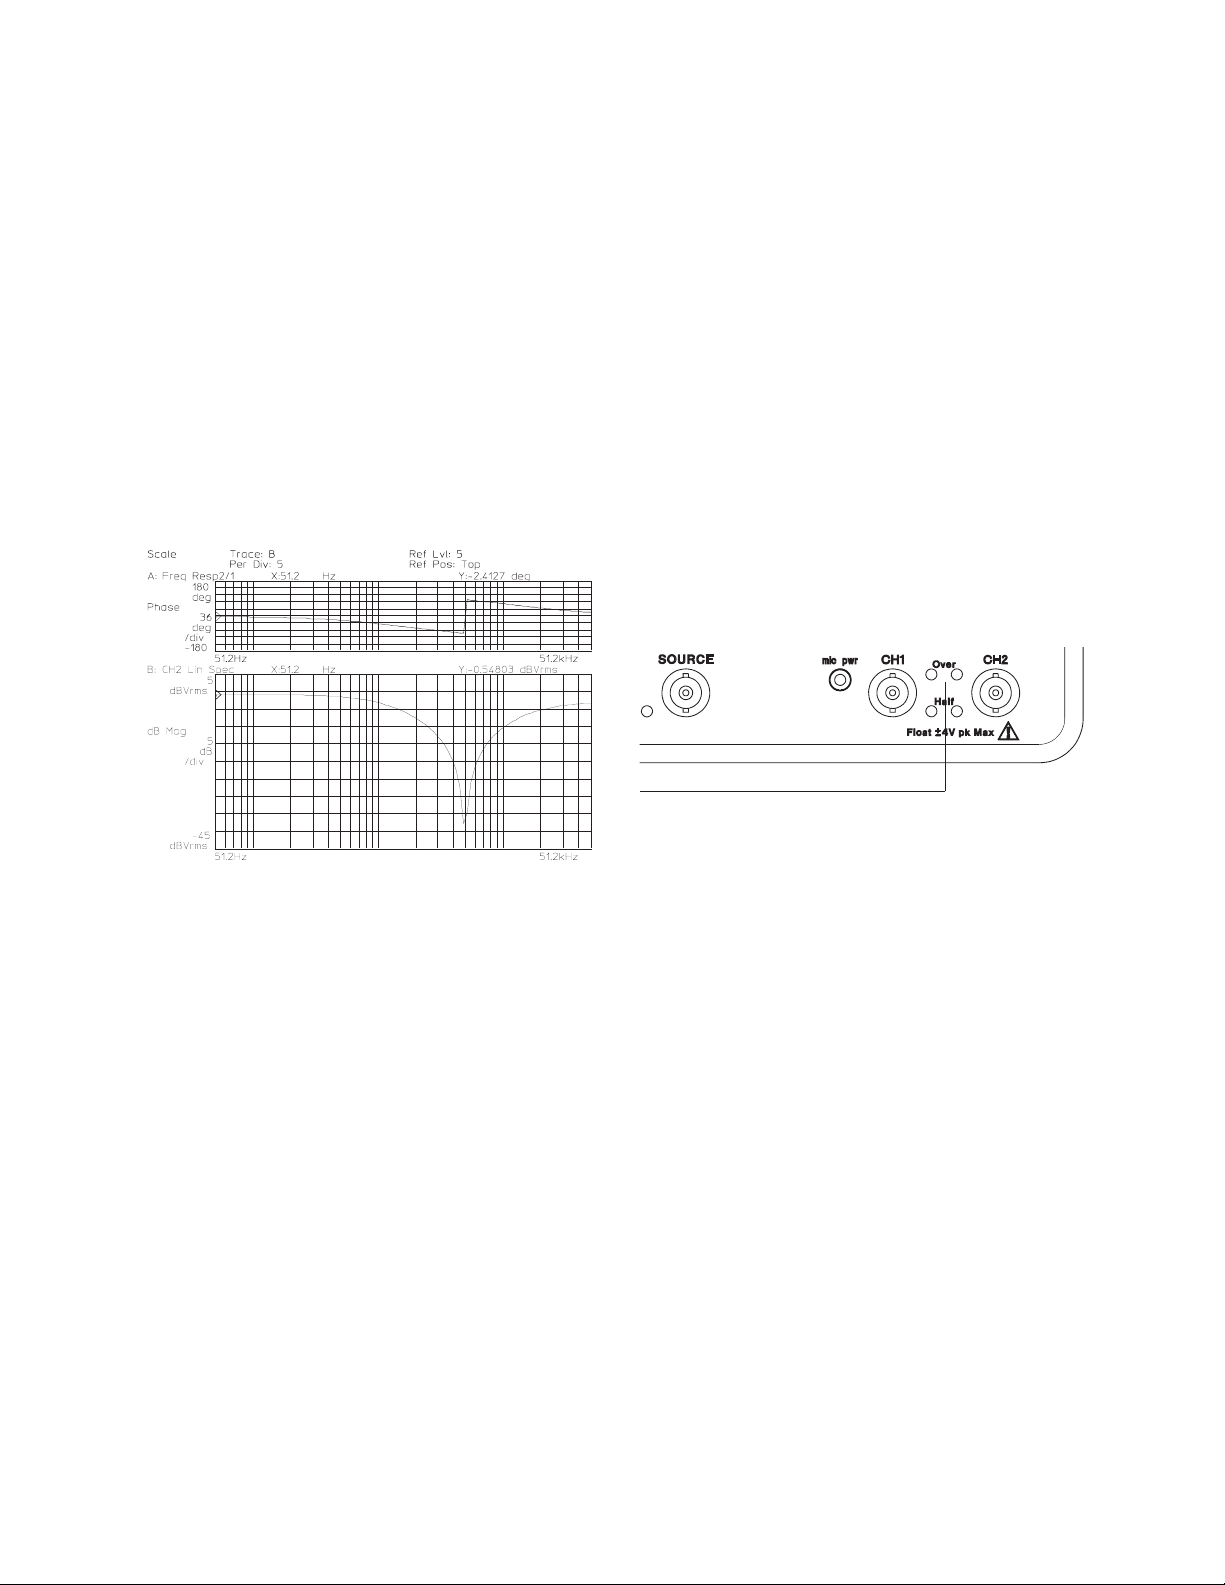
2 Connect the device-under-test (DUT).
3 Select the measurement parameters.
Press [
Press [
sweep.
Press [
] [
Freq
RESOLUTN SETUP
Source
] <number> <unit>, then press [
START
] [
] <number> <unit>.
LEVEL
], then press [
SWEEP LIN LOG
] <number> <unit>.
STOP
] to highlight
for a linear
LIN
Option AY6
Source
Source
Channel 1
Channel 2
Rear Panel
Channel 1
Channel 2
32
Page 51
Agilent 35670A Quick Start Guide Making Measurements
4 Configure the display.
Press [
Press [
],thenpress[
Scale
Disp Format
AUTOSCALE ON OFF
][
MORE][BODE DIAGRAM
] to highlightON.
].
5 Measure the DUT.
Press [
If you want to use a linear X-axis for the logarithmic sweep:
Press [
If the overload indicator (as shown in the illustration) flashes, the analyzer is
autoranging to provide the best signal-to-noise ratio.
].
Start
Trace Coord
] then press[
X-AXIS LIN LOG
] to highlight
LIN
.
Overload indicator flashes when
analyzer is autoranging
33
Page 52
Making Measurements Agilent 35670A Quick Start Guide
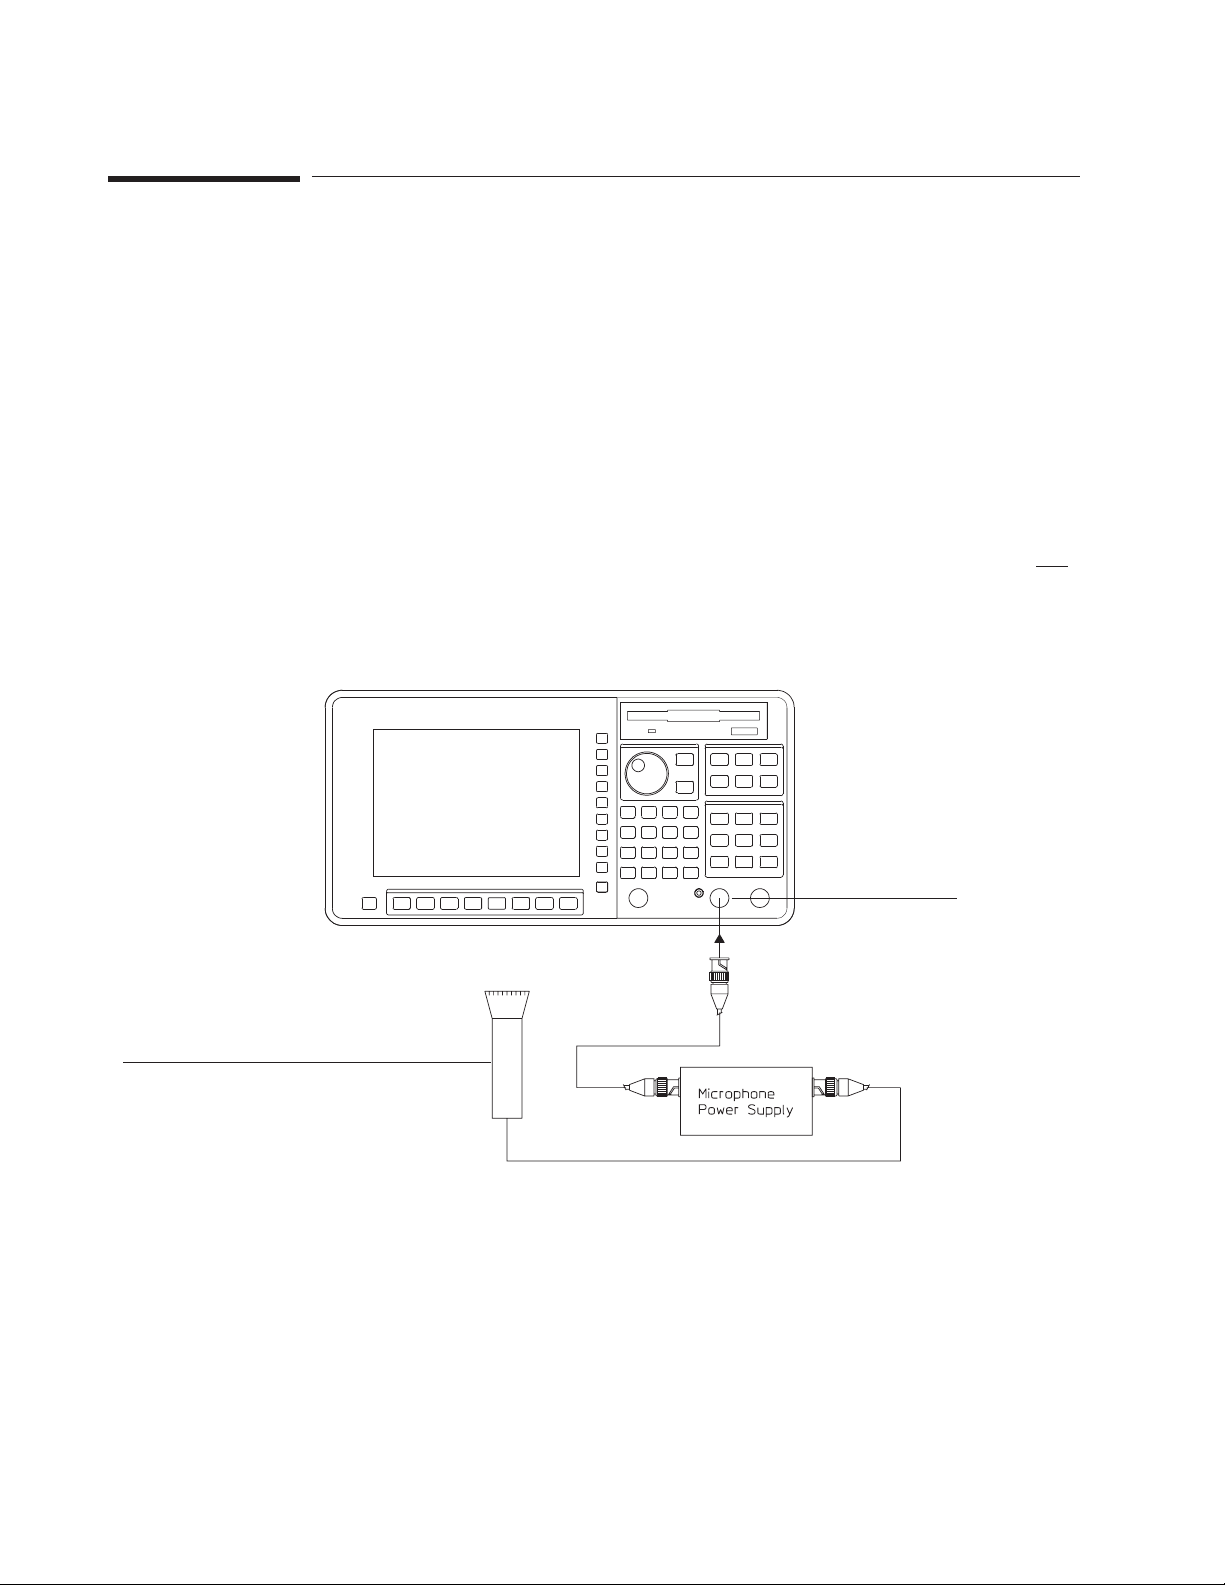
To calibrate a microphone — Octave Analysis (Option 1D1)
Octave measurements are available only with those Agilent 35670A analyzers that are
equipped with Option 1D1. Signals can be analyzed at frequencies up to 40 kHz in the
single-channel mode. This task measures the sound pressure level of the calibrator.
1 Initialize the analyzer.
Press [
Press [
] [
Preset
OCTAVE ANALYSIS
DO PRESET
].
].
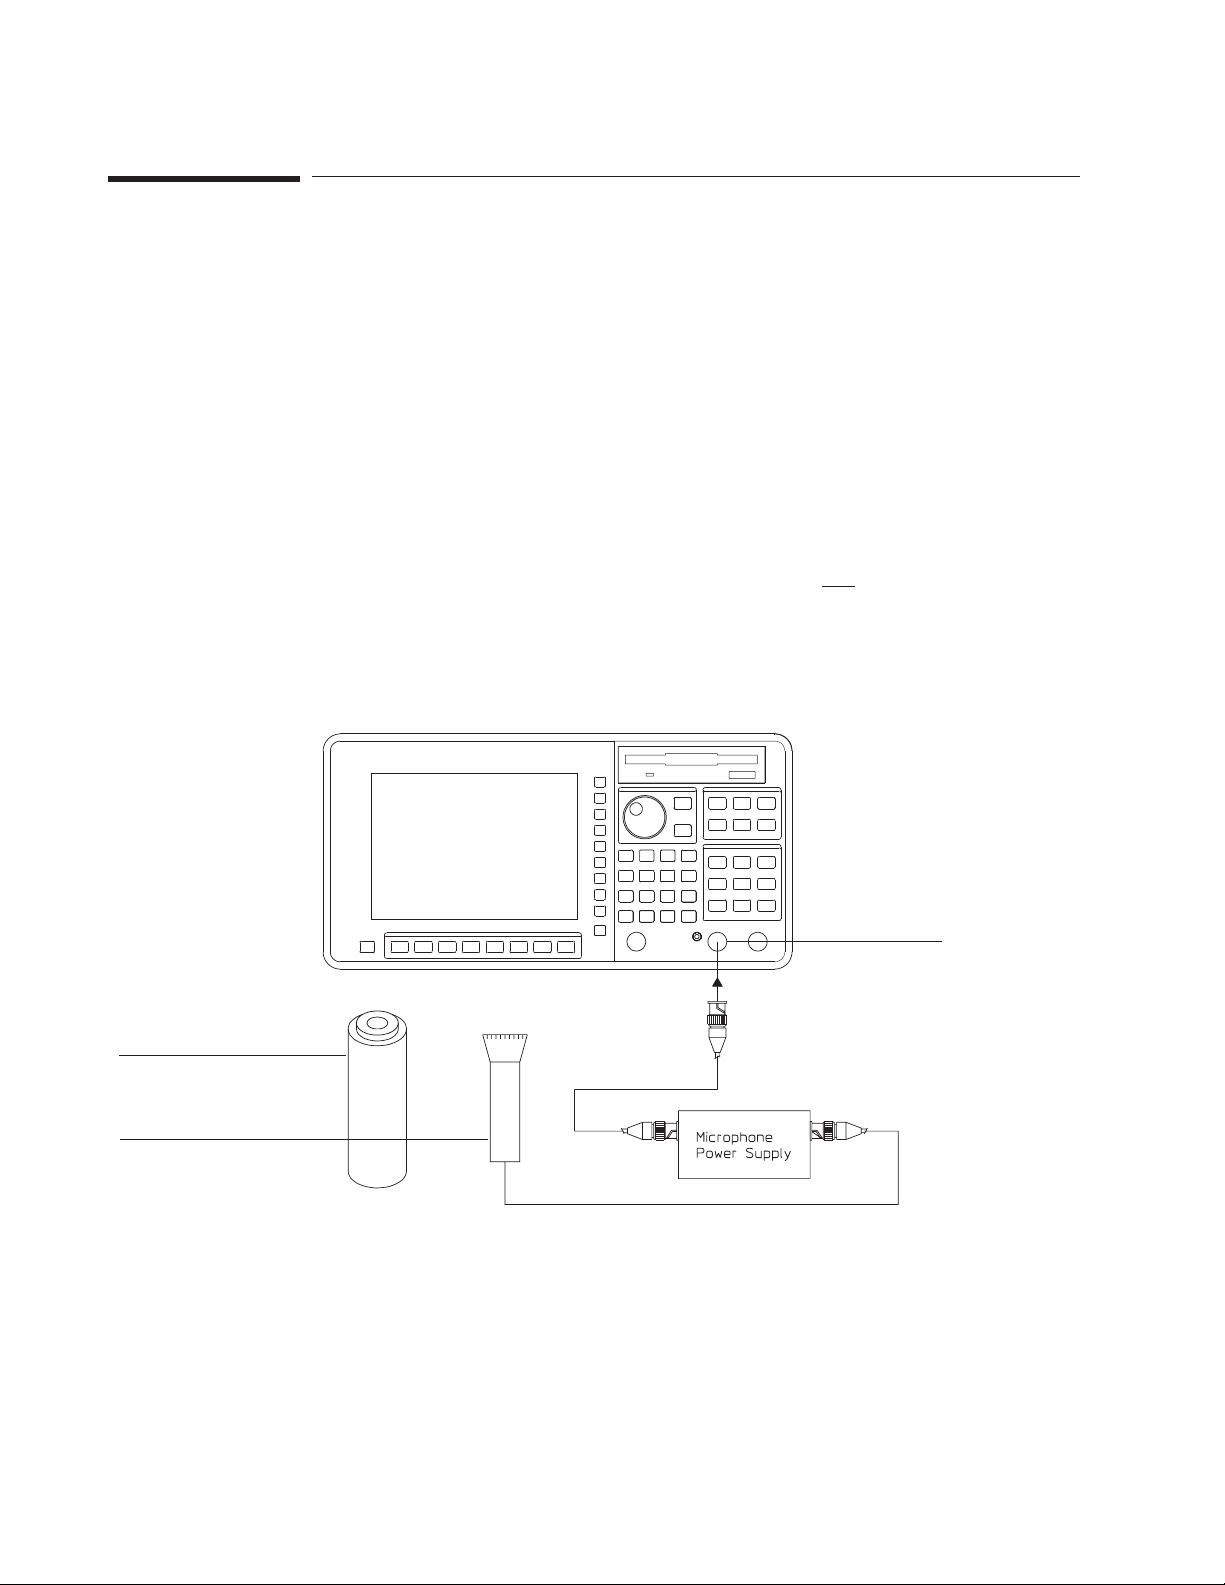
2 Connect the microphone input to the analyzer’s Channel 1 input as shown in the
illustration. Attach a calibrator to the microphone.
3 Configure the display.
Press [
],thenpress[
Scale
AUTOSCALE ON OFF
] to highlight ON.
4 Start the calibration.
Turn on the calibrator.
Start
].
Press [
Calibrator
Laboratory
Microphone
Channel 1
34
Page 53
Agilent 35670A Quick Start Guide Making Measurements
5 Specify the calibration parameters.
Press [
Press [
Press [
Press [
Press [
Press [
Press [
Press [
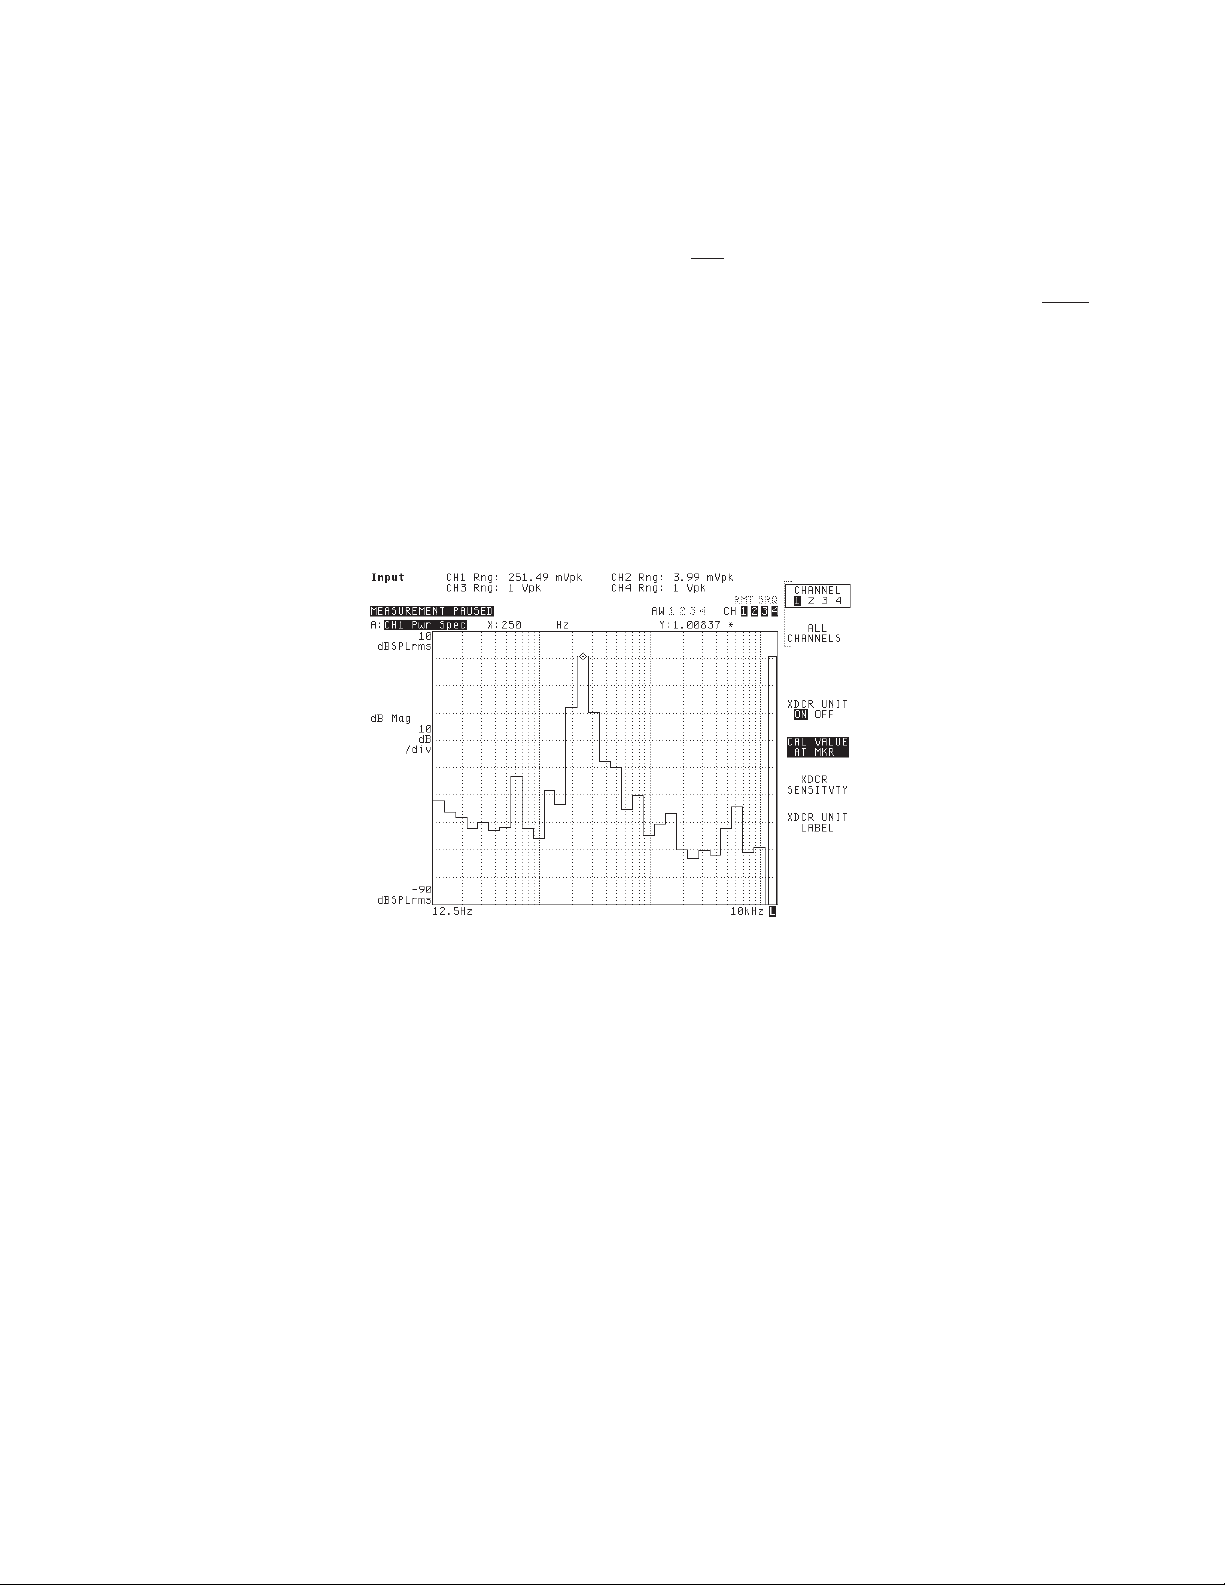
Specify the calibration parameters to match the calibrator’s specifications.
The values you specify for the transducer units are retained, unless you preset the
analyzer or turn it off.
] [
Input
XDCR UNIT ON OFF
XDCR UNIT LABEL][PASCAL
Trace Coord
dB REF SETUP][dBSPL (20 uPA)
Marker
Input
CAL VALUE AT MKR
XDCR UNIT CH1 SETUP
] to highlight ON.
] [
Y UNITS
],[
MARKER TO PEAK
] [
XDCR UNIT CH1 SETUP
], then press [
], <number> [
]
].
AMPLITUDE PK PP RMS
] to highlight RMS.
].
].
].
].
ENTER
35
Page 54
Making Measurements Agilent 35670A Quick Start Guide
To measure sound pressure level — Octave Analysis (Option
1D1)
Octave measurements are available only with those Agilent 35670A analyzers that are
equipped with Option 1D1.
1 Initialize the analyzer.
If you have not already done so, calibrate the microphone.
See the previous measurement, “To calibrate a microphone.”
2 Set the calibrated microphone in front of the sound source.
3 Select the measurement parameters.
Press [
Press [
Press [
Press [
] [
Input
Trace Coord
dB REF SETUP][dBSPL (20 uPa)
Rtn
FRONT END CH1 SETUP
] [
Y UNITS][EU
].
], then press [
].
].
A WT FLTR ON OFF
] to highlight ON.
Laboratory
Microphone
Channel 1
36
Page 55
Agilent 35670A Quick Start Guide Making Measurements
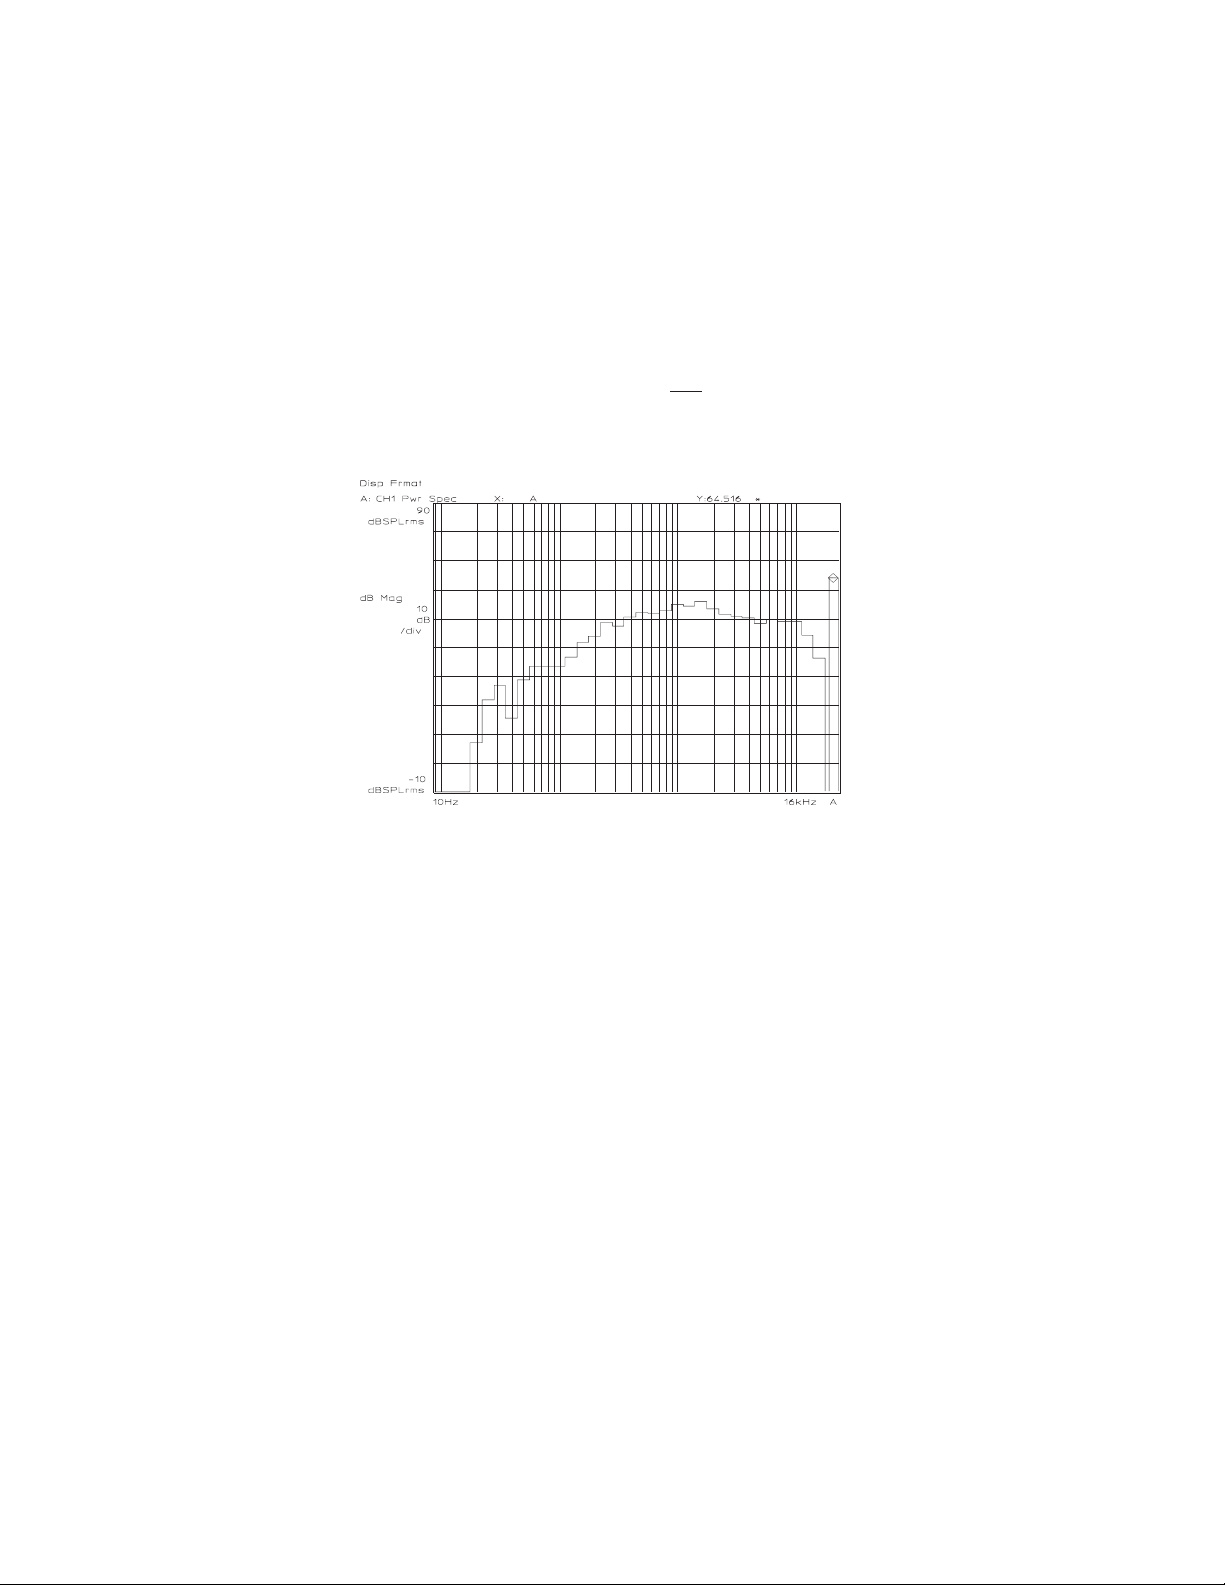
4 Measure the sound source.
Press [
Calibration must be done unweighted. If you preset the analyzer, the transducer units
you specify in the previous task, “To calibrate a microphone,” are lost.
To compute and display the IEC 65 impulse characteristic in the overall power band,
press [
main marker to the far right band.
].
Start
IMPULSE ON OFF
] to highlight ON in the [
] menu. Use the knob to move the
Avg
37
Page 56
Making Measurements Agilent 35670A Quick Start Guide
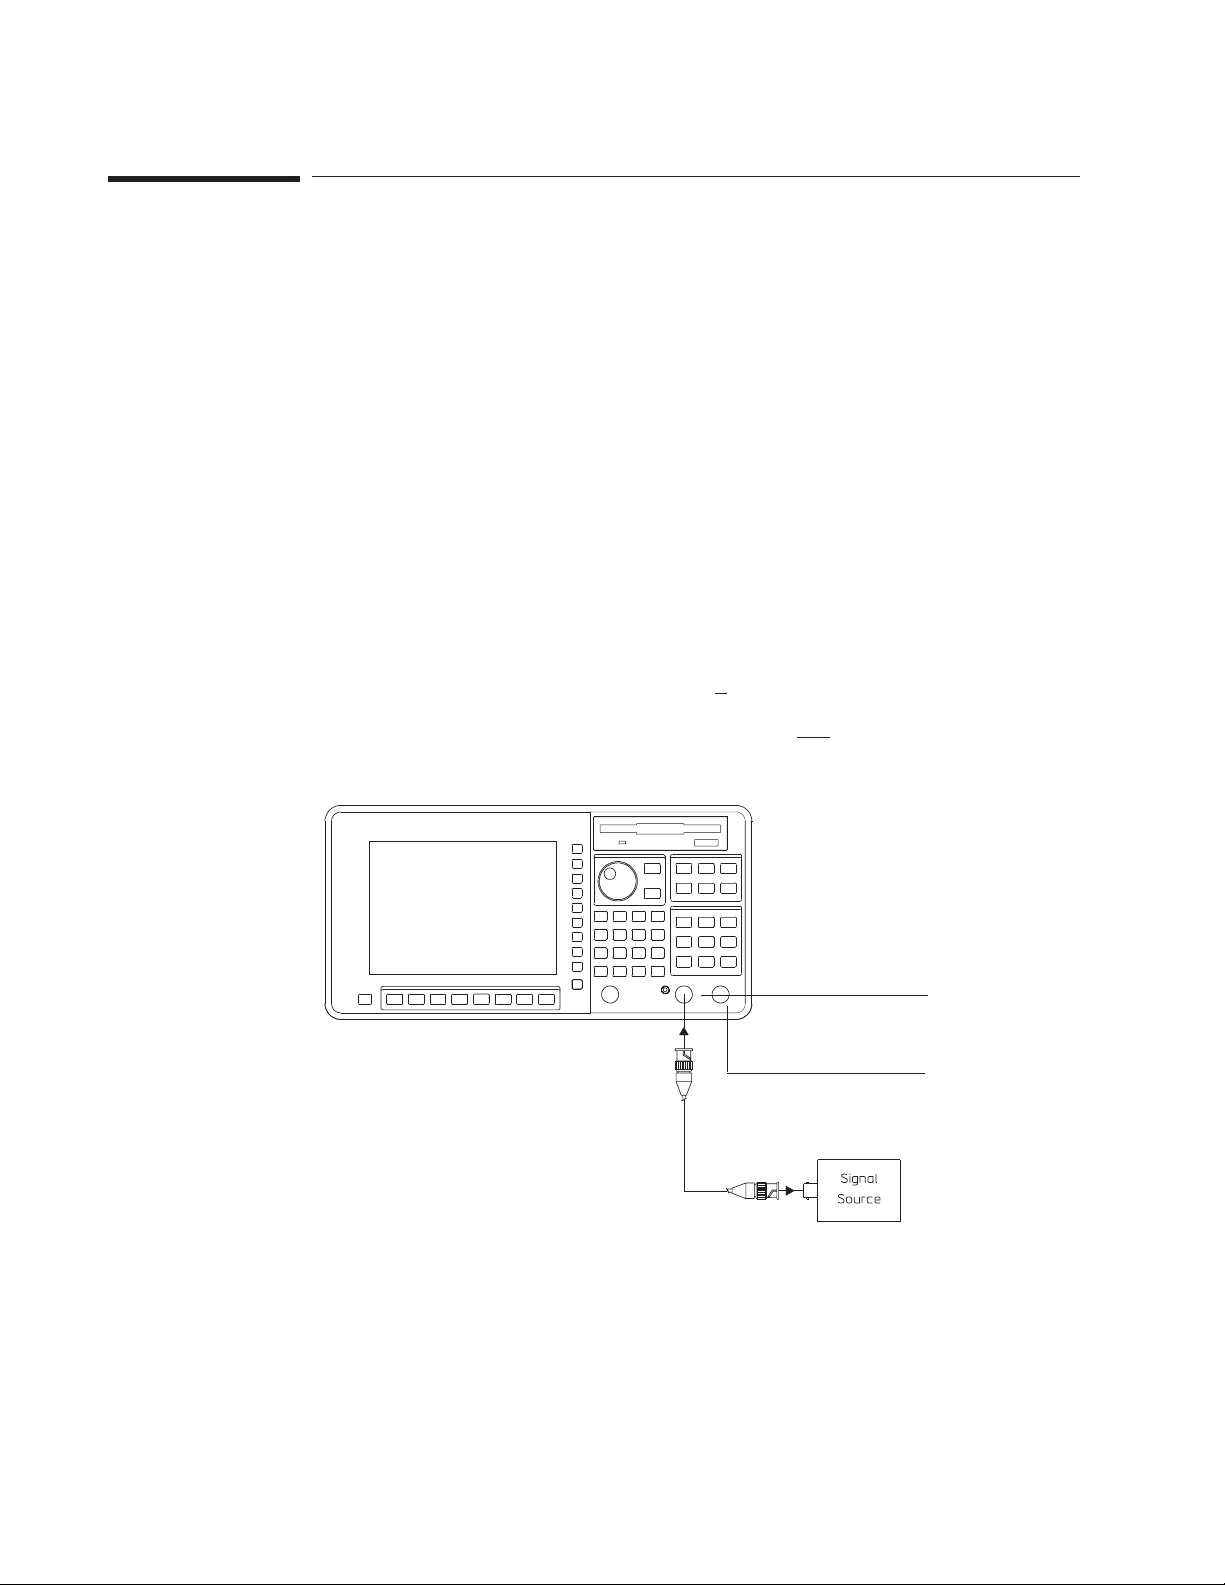
To measure harmonic distortion
In addition to measuring harmonic distortion, this task measures the frequency and
amplitude of the fundamental frequency.
1 Initialize the analyzer.
Press [
Preset
] [
DO PRESET
].
2 Connect the signal source as shown in the illustration.
3 Select the measurement parameters.
Press [
press [
Press [
Press [
or
Press [
] [
Freq
STOP
Window
HANN
FLAT TOP
START
] <number> <unit>.
].
].
].
] <number> <unit>, then
4 Specify the triggering and averaging parameters.
Press [
Trigger
press [
TRIGGER SETUP][CHANNEL LEVEL
Press [
Avg
] [
CHANNEL 1 2 3 4
],thenpress[
] to highlight 1, then
AVERAGE ON OFF
], <number> <unit>.
] to highlight ON.
38
Channel 1
Channel 2
Page 57
Agilent 35670A Quick Start Guide Making Measurements
5 Configure the display.
Press [
], then press[
Scale
AUTOSCALE ON OFF
] to highlight ON.
6 Measure the signal source.
Press [
Press [
Press [
Press [
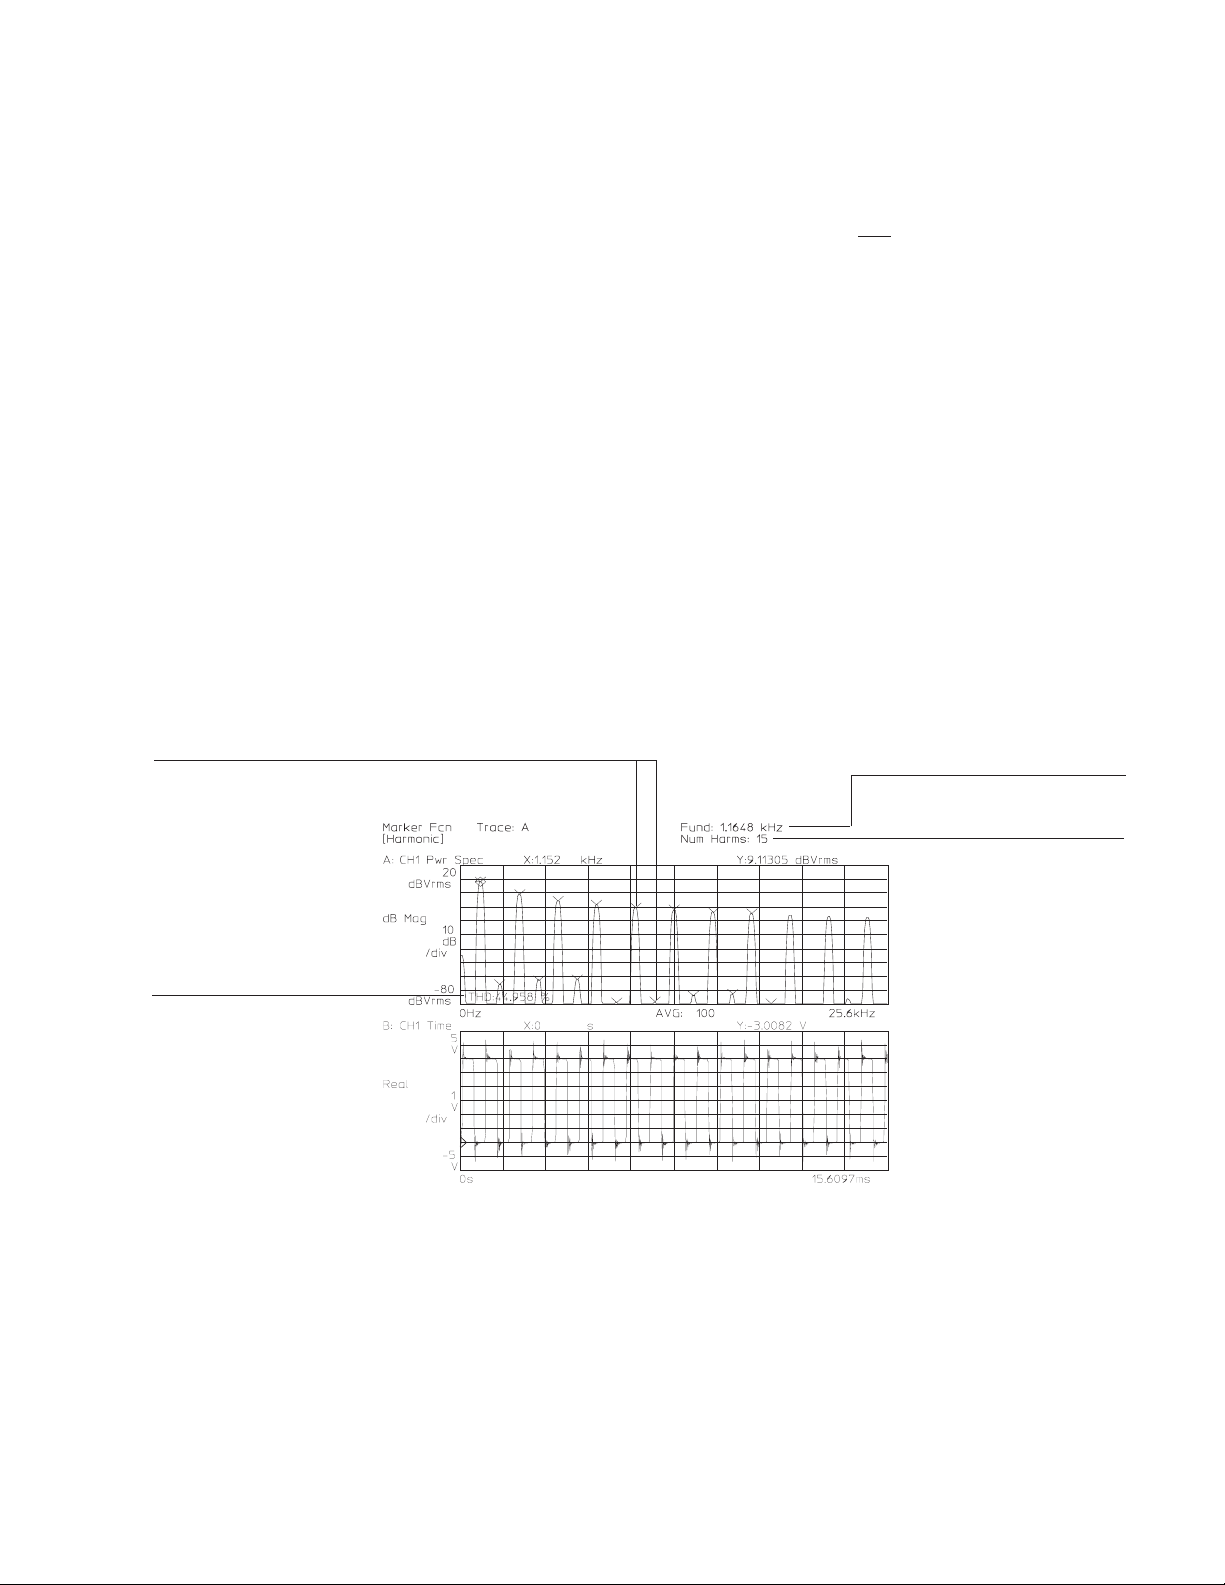
The results of the THD calculation appear at the bottom left of the analyzer’sdisplay.
The number of harmonics used to calculate THD appears at the top of the screen. The
default is 20 harmonics. (If there are fewer than 20 harmonics, the available number
of harmonics are used.) To change the number of harmonics, use the
[
NUMBER OF HARMONICS
].
Start
Marker
Marker Fctn
THD
],thenpress[
].
MARKER TO PEAK
] [
HARMONIC MARKER][FUNDAMENTL FREQUENCY
] softkey in the [
].
HARMONIC MARKER
] menu.
] [
Mkr Value
].
Harmonic
Markers
THD calculation
appears at the
lower-left of
the upper trace
display box
The absolute marker, [
MARKER TO PEAK
], measures the amplitude of the fundamental
frequency. If the harmonic markers do not line up with the harmonics, you will need
to adjust the value of the fundamental frequency (The marker falls in the middle of the
frequency bin.) Use the arrow keys or the knob to adjust the value of the fundamental
frequency until the harmonic markers line up with the harmonics.
Fundamental freauency
Number of harmonics
used to calculate THD
39
Page 58
Making Measurements Agilent 35670A Quick Start Guide
To characterize a tach pulse
To set the input parameters for a tachometer, you must first verify the amplitude of the
tachometer pulse and determine the appropriate trigger level. This task is part of the
initialization step for several tasks that follow.
1 Initialize the analyzer.
Press [
Press [
Press [
] [
Preset
HISTOGRAM/TIME
Meas Data
DO PRESET
], then press [
].
].
UNFILTERED TIME CH 1
].
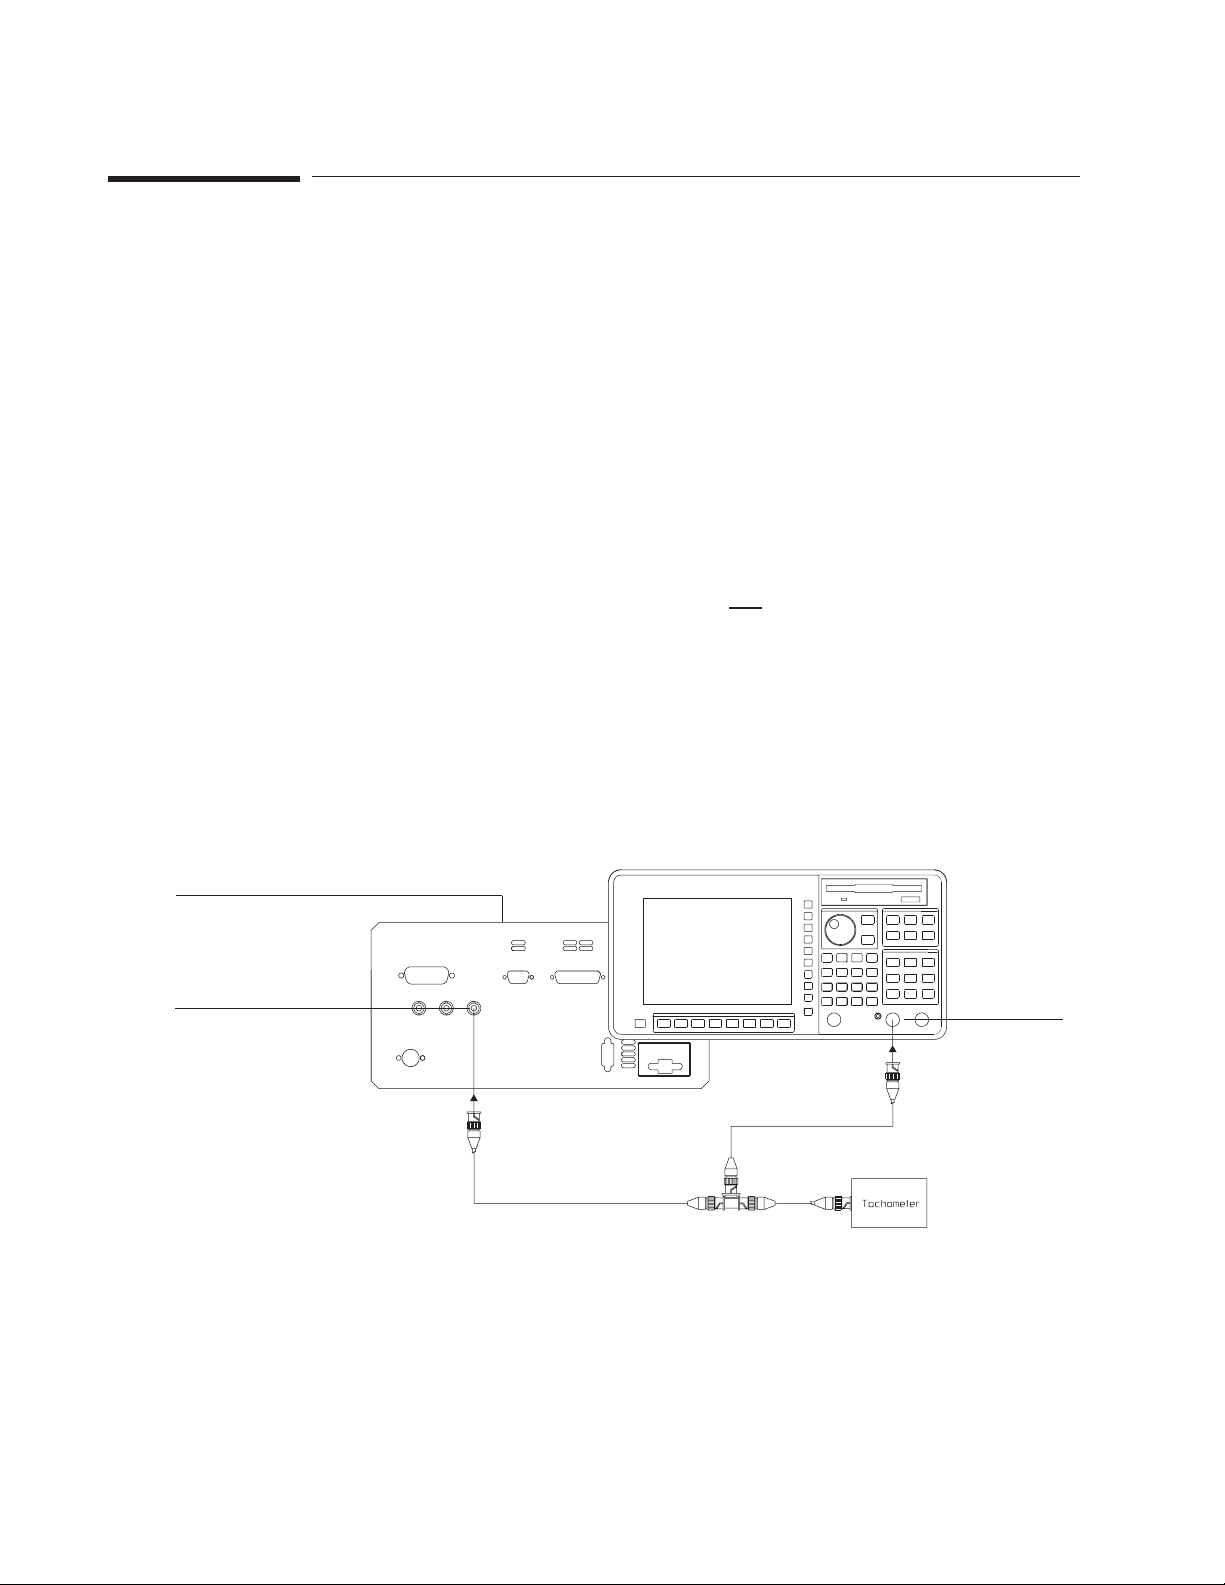
2 Connect the tachometer to the analyzer’s Channel 1 input and to the tachometer input
on the rear panel. See illustration.
3 Configure the display.
Press [
Scale
] [
AUTOSCALE ON OFF
] to highlight ON.
4 Specify the measurement parameters.
Press [
Use the up arrow hardkey to increase the time record, until there are several tach
pulses on the display.
Press [
Press [
] [
Freq
Trigger
Pause-Cont
RECORD TIME
] [
CHANNEL 1
].
].
].
Rear Panel
Tach
Channel 1
40
Page 59
Agilent 35670A Quick Start Guide Making Measurements
5 Select the tachometer parameters.
Press [
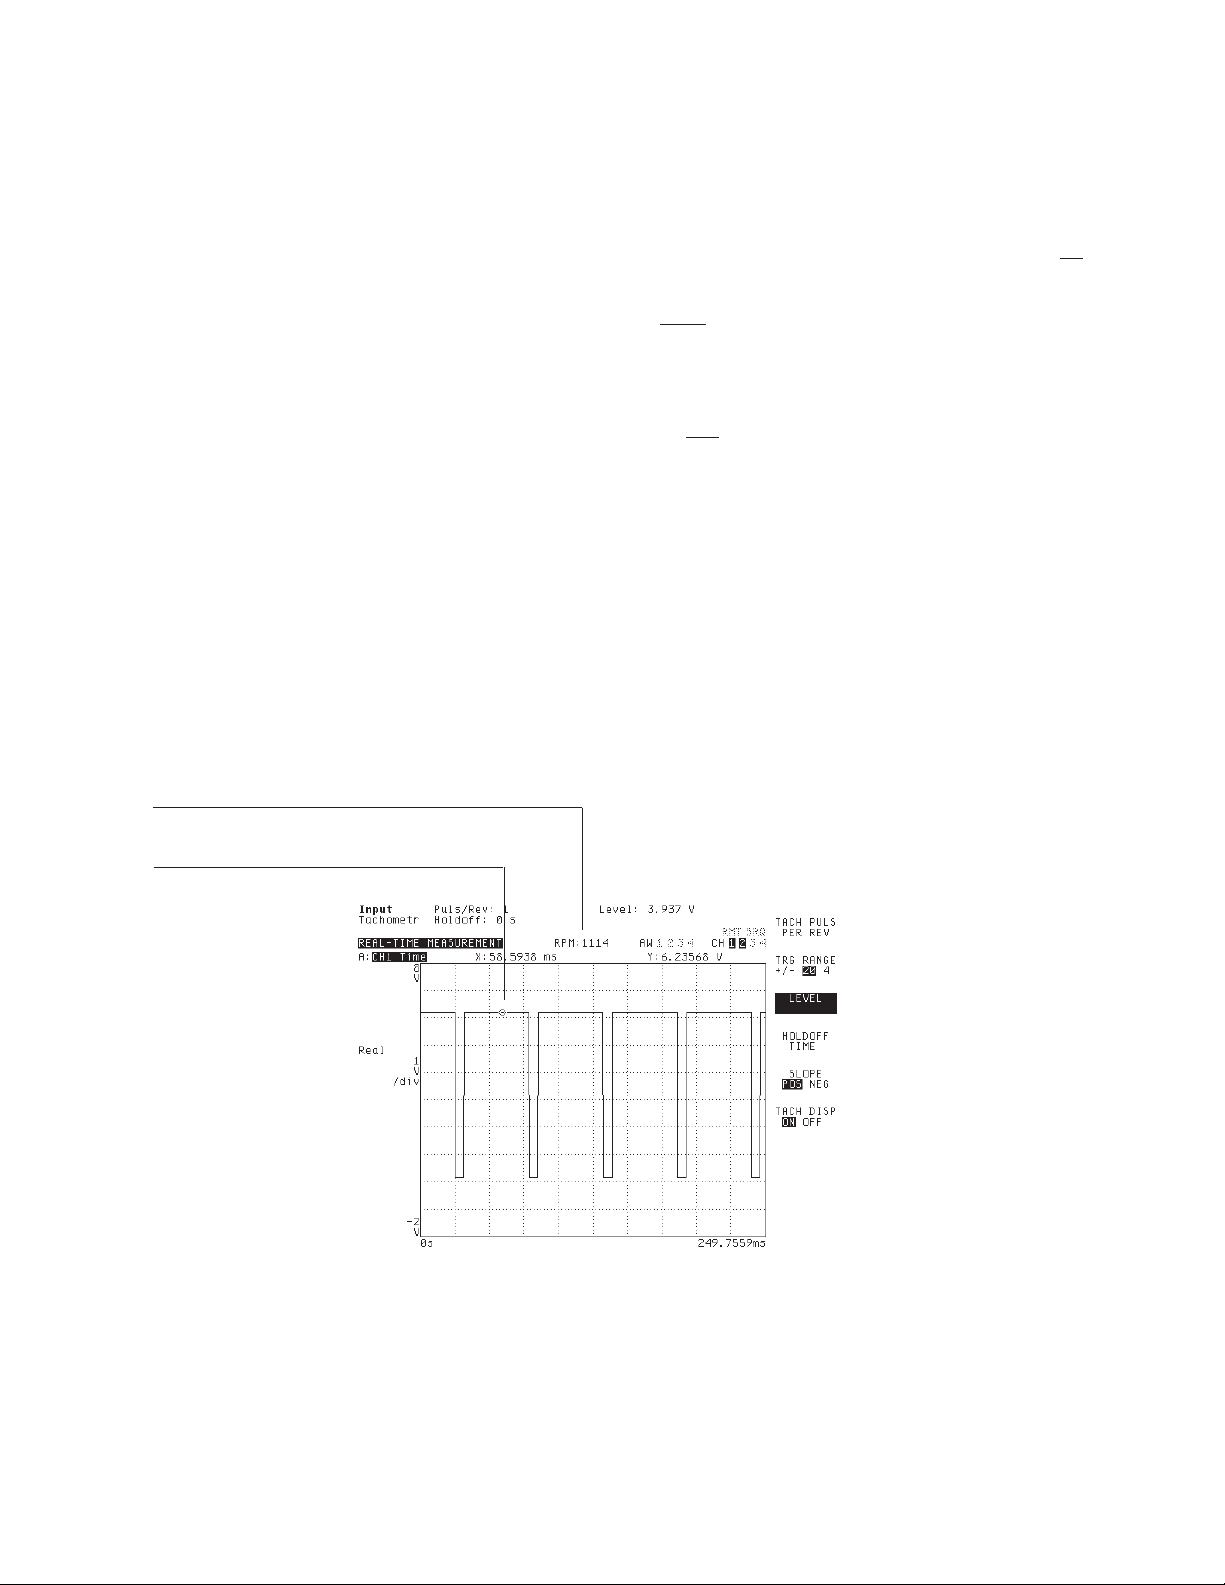
If the peak-to-peak value exceeds 4 volts, press [
Press [
level.
Press [
(negative) edge of the signal.
Press [
] [
Input
LEVEL
SLOPE POS NEG
TACH PULS PER REV
TACHOMETR SETUP
] <number> <unit>. The analyzer detects the tachometer signal at this
] to highlight NEG if you want the analyzer to detect the falling
]<number>[
].
] to highlight 20.
ENTER
TACH RANG +/- 20 4
].
6 Verify tachometer parameters.
Press [
TACH DISP ON OFF
top of the display.
This task uses the Histogram/Time instrument mode. It lets you view the tachometer
input signal in the time domain. Unfiltered time channel data is not processed through
anti-aliasing filters or bandwidth-limiting filters. For more information see online help.
You may be able to use the relative marker to determine the peak-to-peak value of the
signal in Step 5. See “To measure a value relative to a reference” in the first section.
The tachometer indicator displays the number of tachometer transitions. If multiple
transitions occur within any one edge of the signal, you will need to “clean it up” by
specifying a tachometer delay in seconds. See the next task, “To specify tachometer
holdoff time.”
] to highlight ON. The tachometer indicator appears at the
Tach Display
You can use
the markers
to determine
appropriate value for
41
Page 60
Making Measurements Agilent 35670A Quick Start Guide
To specify tachometer holdoff time
If the edge of the tachometer input signal is not clean, the analyzer may trigger a
measurement at inappropriate times. Holdoff time specifies a delay between valid
tachometer transitions. The analyzer waits this amount of time before it accepts
another tachometer input.
1 Initialize the analyzer.
See the previous task, “To characterize a tach pulse.”
Press [
Pause-Cont
] to pause the measurement.
2 Configure the display.
Press [
Press [
between the markers, then press [
Using the knob, move the axes scale markers to an edge of the tachometer input signal.
],thenpress[
Scale
AXES SCAL MARKERS][CHANGE WIDTH
AUTOSCALE ON OFF
MOVE CENTER
] to highlight ON.
]. Using the knob, widen the gap
].
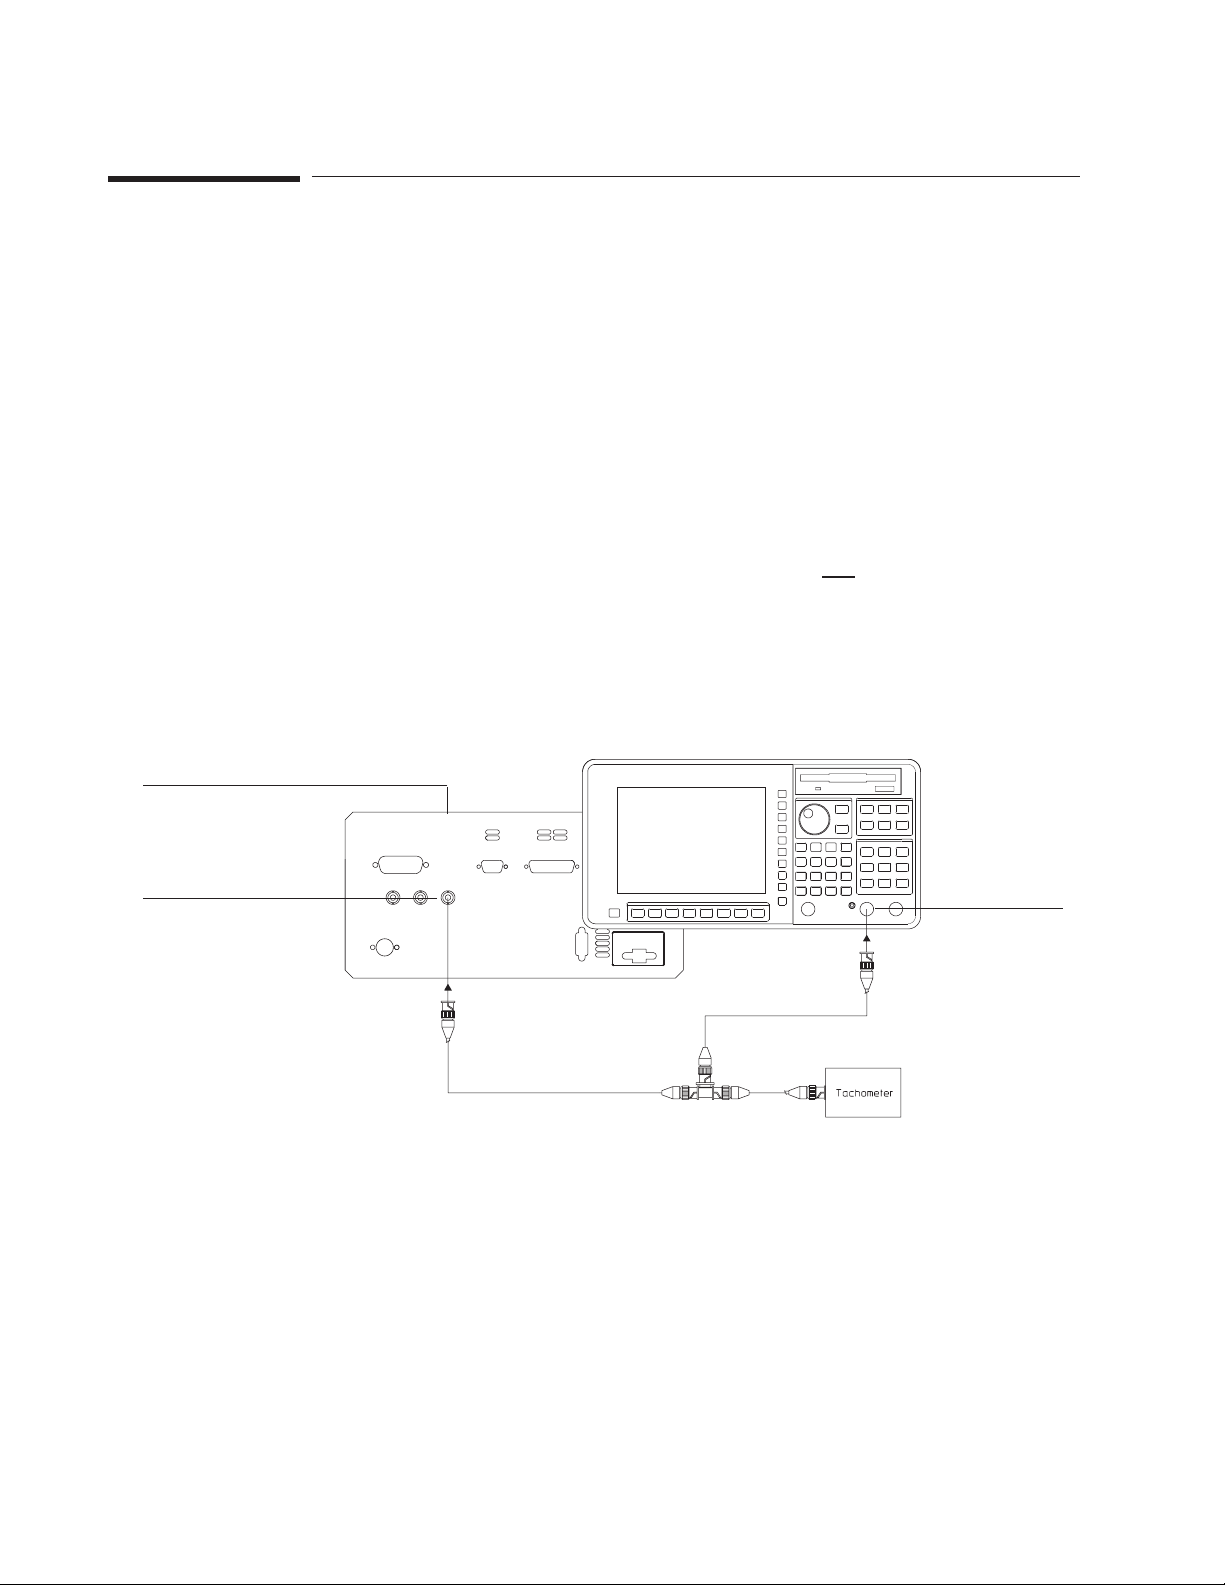
Rear Panel
Tach
Press [
SCALE AT MARKERS
].
Channel 1
42
Page 61
Agilent 35670A Quick Start Guide Making Measurements
3 Measure the holdoff time.
Press [
Marker
Using the knob, move the marker to the start of the first clean edge.
Press [
REFERENCE TO MARKER
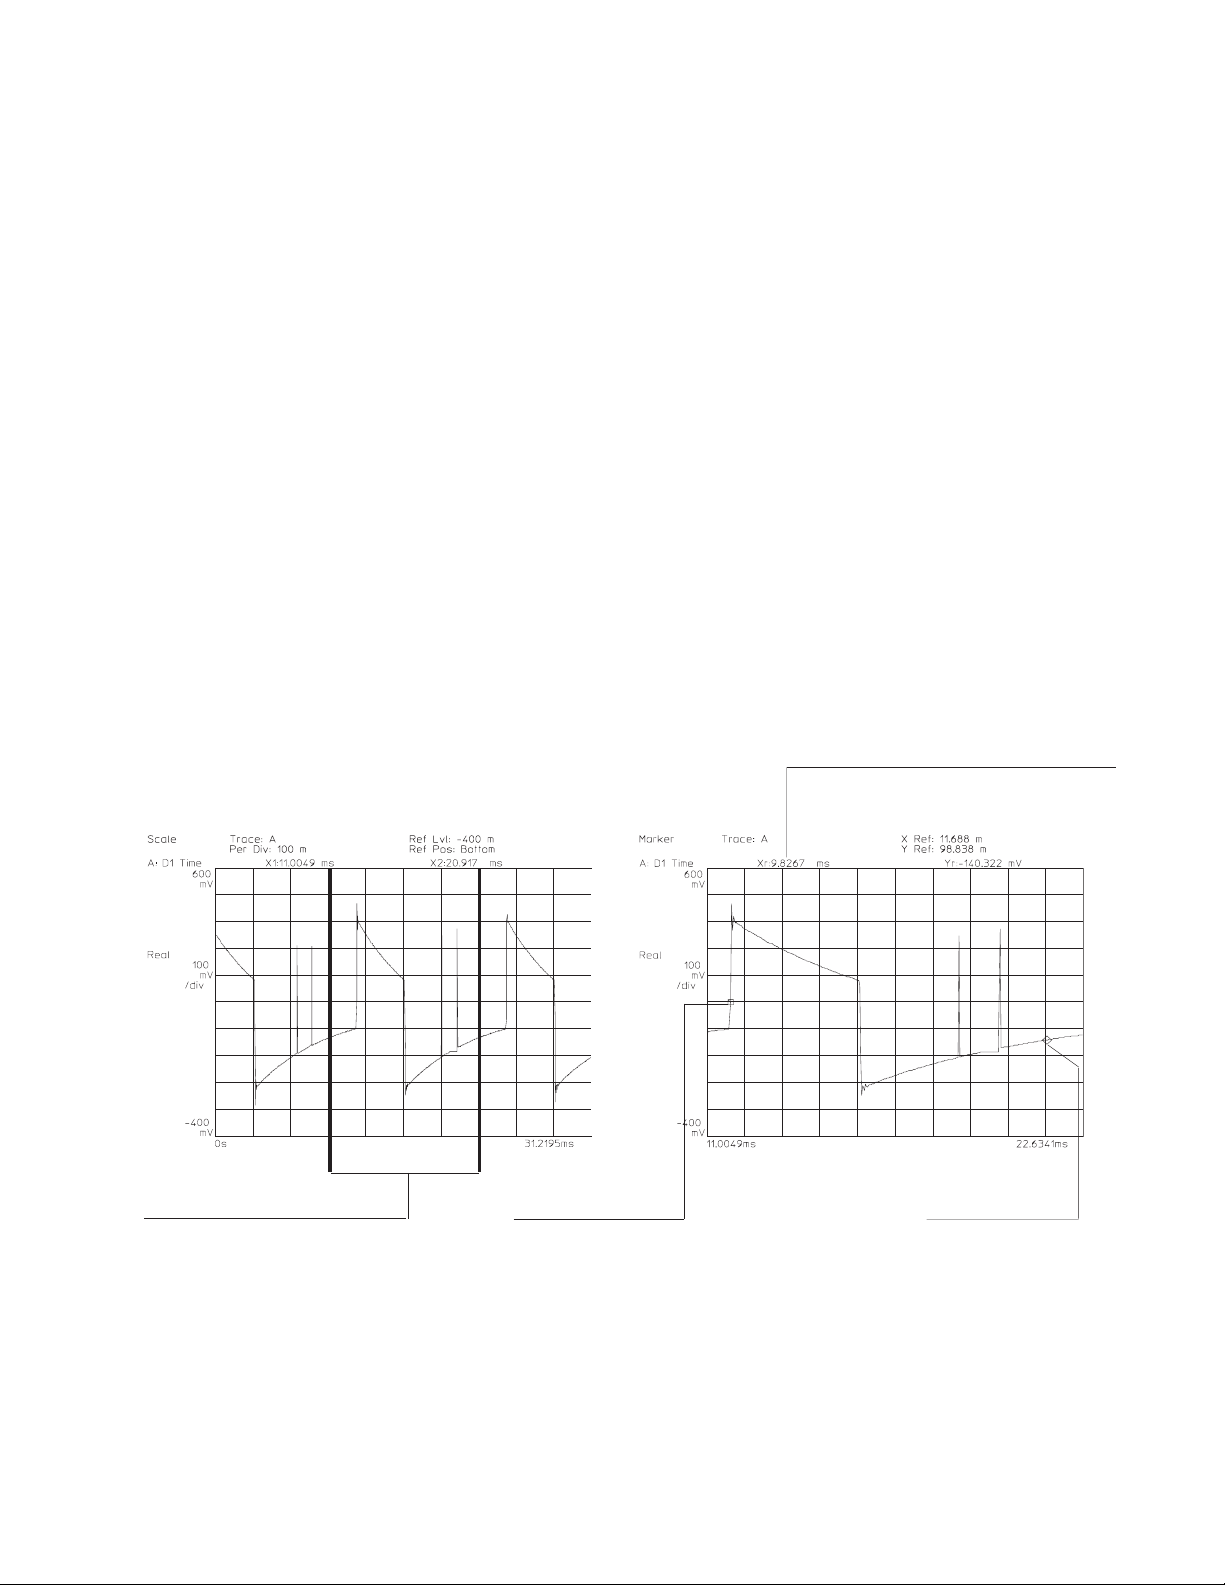
Now use the knob to move the marker past any inappropriate transitions on the edge of
the signal.
Note the Xr marker value at the top of the grid.
], [
REFERENCE SETUP
].
].
4 Specify the holdoff time.
Press [
Input
],[
TACHOMETR SETUP
], [
HOLDOFF TIME
], then press [
Mkr Value
].
5 Verify the tachometer input.
Press [
Press [
Press [
Press [
The Xr marker value displayed in Step 3 is specified as the holdoff time in Step 4.
The tachometer indicator at the top of the display is reading the tachometer input
signal from the rear panel. The display is showing the tachometer signal from
Channel 1.
], [
Scale
Inst Mode
Meas Data
Start
AXES SCAL MARKERS
].
] [
ORDER ANALYSIS
] [
PWR SPEC CHANNEL 1
], then press [
].
].
FULL SCALE
].
[SCALE AT MARKER]
displays only that part of the
trace between the [AXES
SCALE MARKER]
Marker Reference
Relative Marker value
specifies holdoff time
Relative Marker
43
Page 62
Making Measurements Agilent 35670A Quick Start Guide
To measure an order spectrum
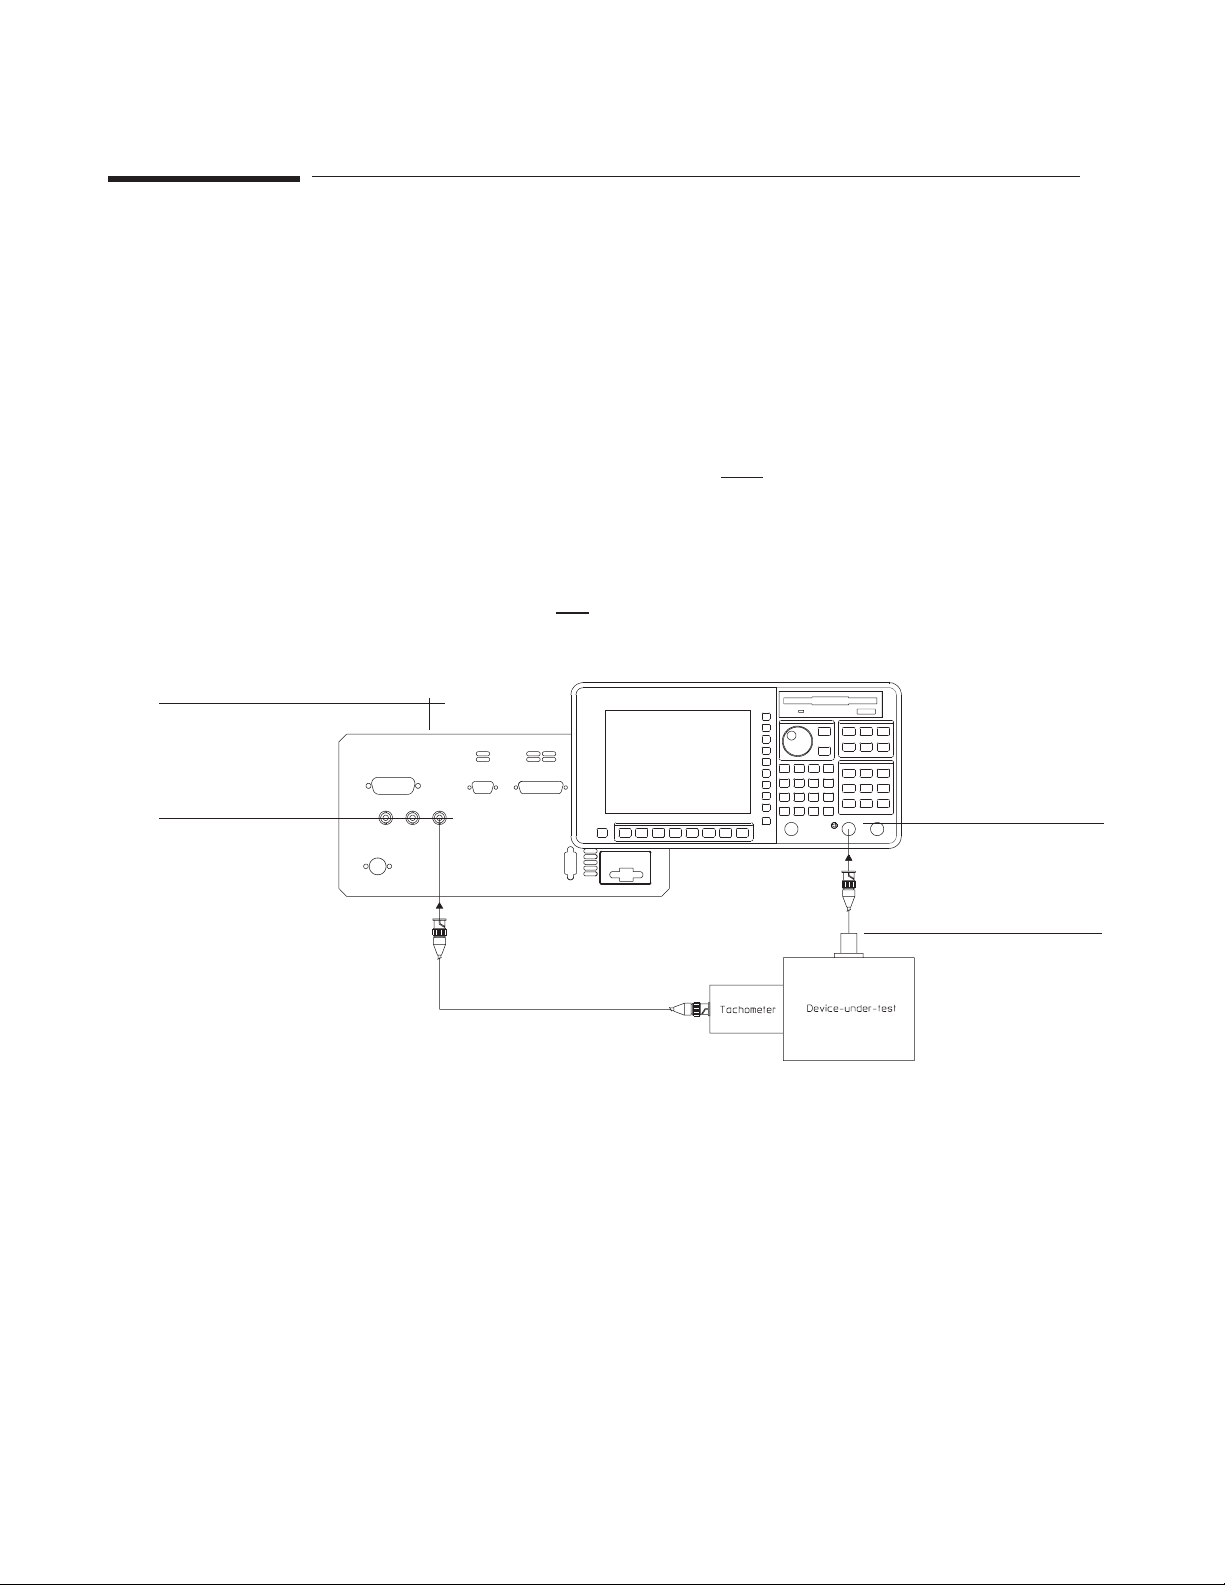
Order analysis measurements are available only with those Agilent 35670A analyzers
that are equipped with Option 1D0.
1 Initialize the analyzer.
Set the input parameters for the tachometer. See the previous tasks, “To characterize a
tach pulse” and “To specify tachometer holdoff time.”
Press [
Press [
Marker
Inst Mode
] [
MARKER ON OFF
] [
ORDER ANALYSIS
] to highlight OFF.
].
2 Connect your device-under-test (DUT) as shown in the illustration.
If the accelerometer or displacement transducer requires ICP current,
press [
SUPLY ON OFF
Input
] [
CH1 AUTO RANGE
] to highlight ON.
]andthenpress[
FRNT END CH1 SETUP][ICP
Rear Panel
Tach
Channel 1
Transducer
44
Page 63
Agilent 35670A Quick Start Guide Making Measurements
3 Specify the measurement parameters.
Press [
Press [
Press [
Press [
] [
Input
XDCR UNIT ON OFF
XDCR SENSITVTY
XDCR UNIT LABEL][g
XDCR UNIT CH1 SETUP
] to highlight ON.
] <number> <unit>.
] [
Rtn
].
].
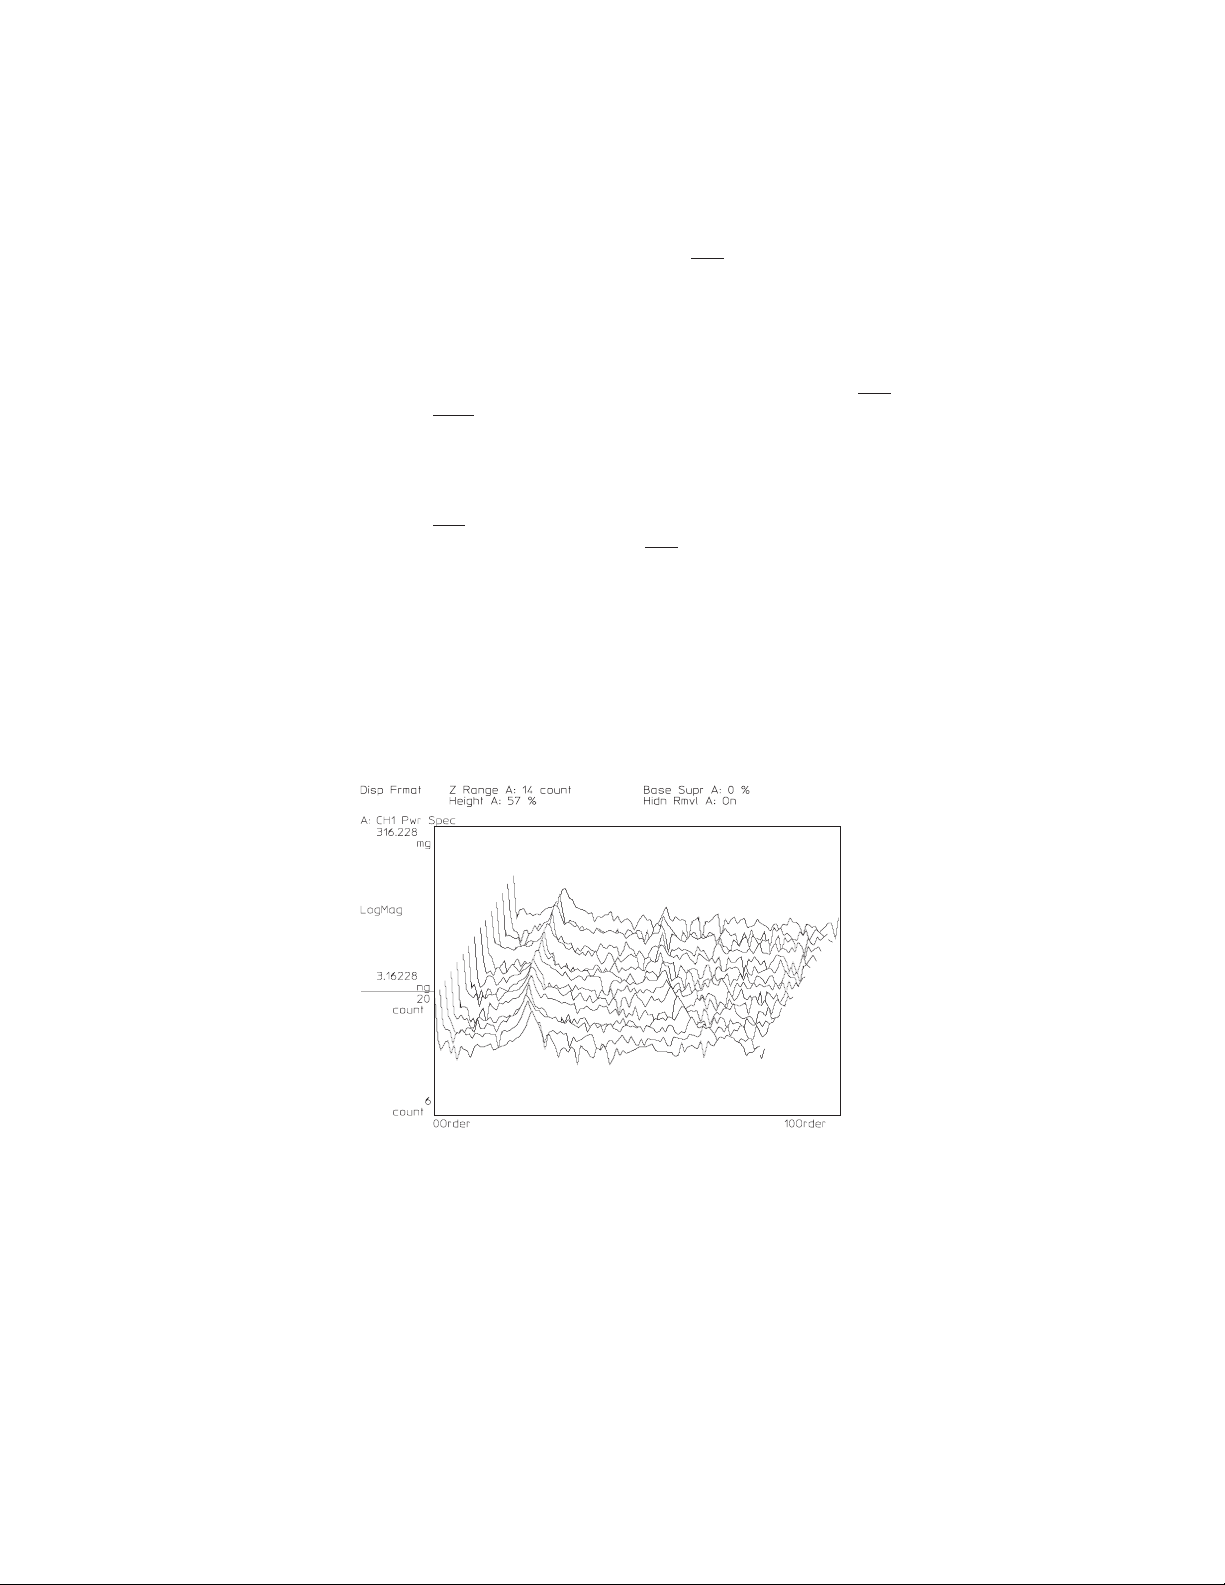
4 Configure the display.
Press [
Trace Coord
Press [
highlight
Press [
Press [
Press [
Press [
highlight
Press [
],thenpress[
Scale
OFF.
Trace Coord
AMPLITUDE PK PP RMS
].
EU
Display Format
ON.
SKEW ON OFF
] [
LOG MAGNITUDE
AUTOSCALE ON OFF
] [
Y UNITS
].
] to highlight PK.
] [
WATERFALL SETUP
] to highlight ON.
].
] to highlight ON, then press it again to
], then press [
WATERFALL ON OFF
]to
5 Measure the DUT.
Press [
If you turn on the ICP current source in Step 2, AC coupling is automatically engaged
to maximize dynamic range and minimize distortion. Allow approximately 30
seconds for time to charge the AC/DC capacitor and for the input range to stabilize.
Start
].
45
Page 64

Making Measurements Agilent 35670A Quick Start Guide
46
Page 65

Saving and Plotting Data
Page 66

Page 67

Saving and Plotting Data
This section shows you how to perform some basic disk operations and how to plot the
contents of the analyzer’sscreen.
47
Page 68
Saving and Plotting Data Agilent 35670A Quick Start Guide
To format a flexible disk
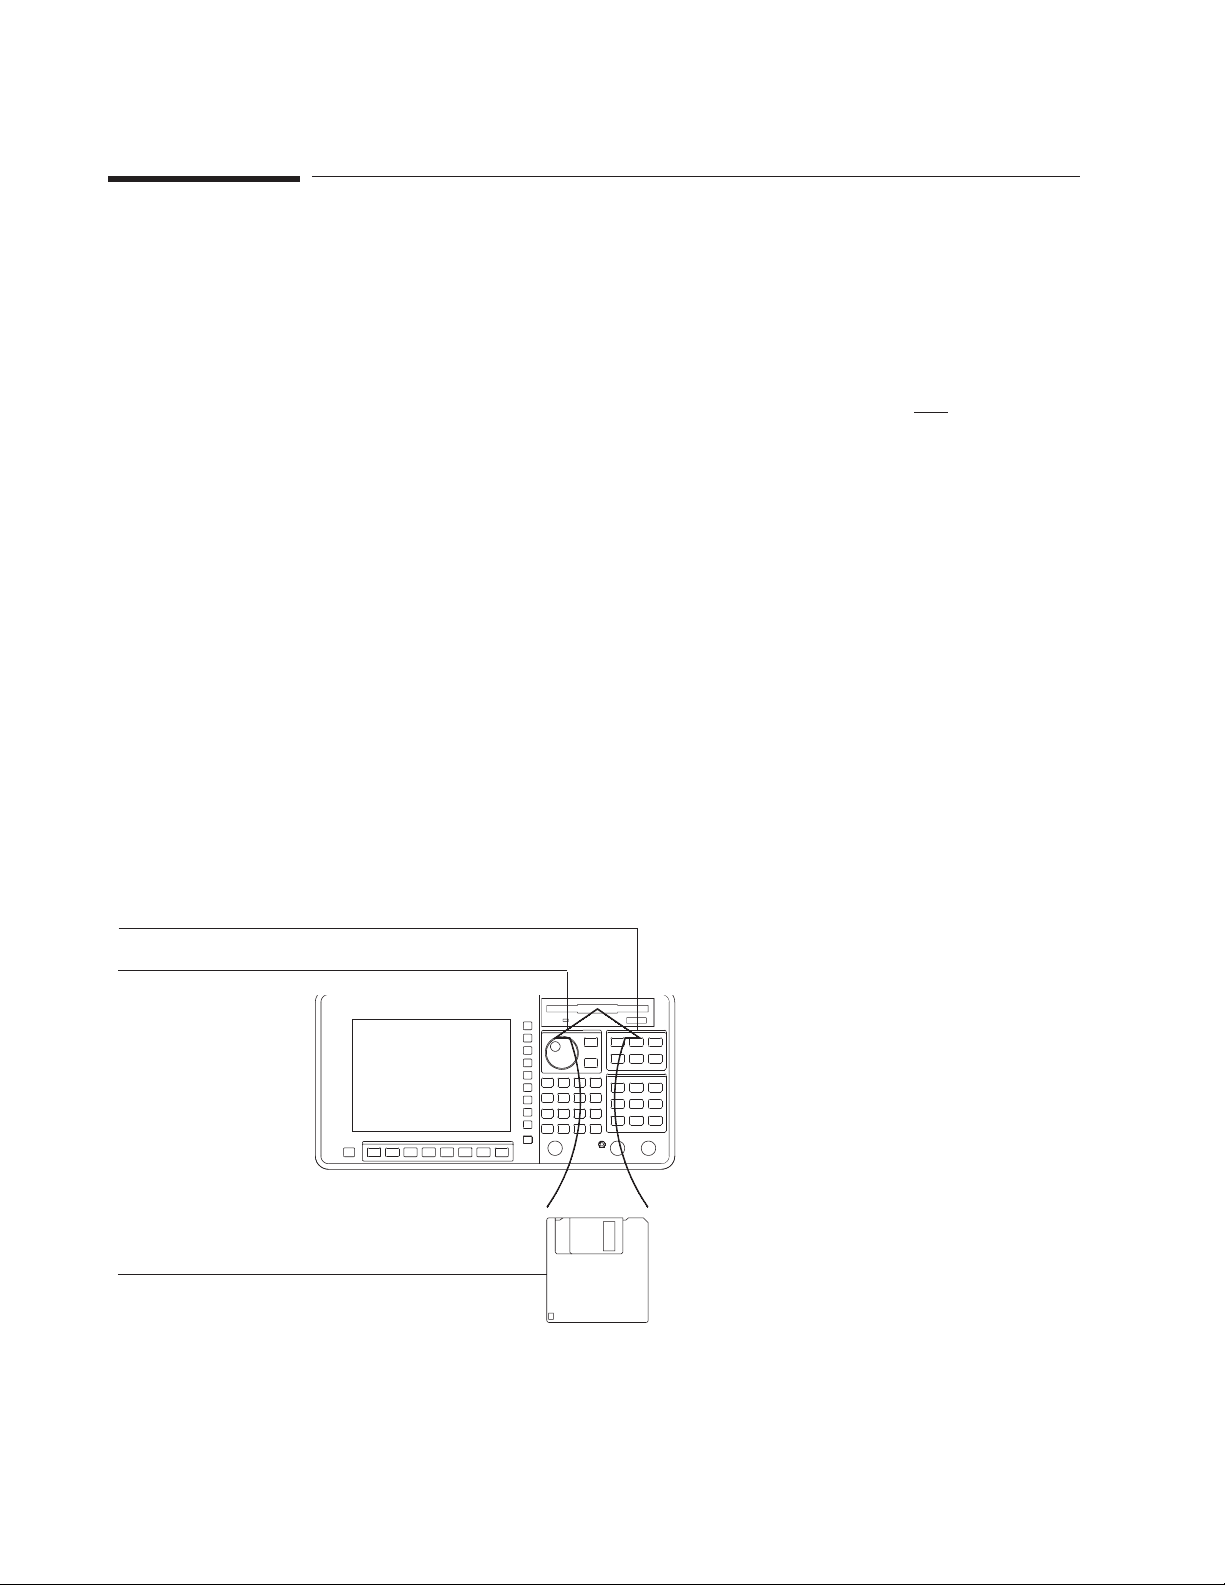
Insert a 3.5-inch flexible disk into the analyzer’s internal disk drive.
1
2 Press [
Press [
3 Press [
Disk Utility
].
Rtn
FORMAT DISK][DISK TYPE
] [
DEFAULT DISK][INTERNAL DISK
], then press [
].
LIF DOS
] to highlight LIF.
The default is DOS.
4 Press [
5 Press [
INTRLEAVE FACTOR
PERFORM FORMAT][ENTER
] [0] [
]. [0] is the default.
ENTER
].
Caution You can damage both the disk and the drive if you attempt to eject a disk when the
“FORMAT DISK in Progress” message is displayed or when the disk’s busy light is
on.
You must format a 3.5-inch flexible disk before you can use it to store Agilent 35670A
data. Use a double-sided double-density or high-density disk that is not
write-protected. (See the illustration.) The analyzer takes about two and a half
minutes to format a disk and is unavailable for other tasks during that time.
The analyzer offers two types of disk formats—LIF and DOS. Step 3 sets the format.
Step 4 defines the sector numbering (interleave factor) to the default value (1 for LIF
formatted disks or 3 for DOS formatted disks). For more information on the
formatting parameters, use online help.
The Disk-eject button
Do not eject the disk
when the “busy”
light is on
Usea3.5-inch
flexible disk (DS,
DD) or (DS, HD)
48
Page 69

Agilent 35670A Quick Start Guide Saving and Plotting Data
Tosaveatracetoafile
Activate the trace if the one you want to save is not currently active. See
1
“To select the active trace” in the Working with the Display section.
2 Press [
Save/Recall
3 Type a file name, then press [
or
Use the default name.
After you have entered a file name the analyzer saves the active trace to a file on the
default disk. The analyzer automatically increments the default file name during
successive save operations. For more information on typing a file name and selecting
the default disk, see “Totypeatextstring” and “To select the default disk” earlier in
this book.
Tosaveatracetoadataregister,repeatstep2exceptpressoneofthedataregister
softkeys, rather than the [
] [
SAVE DATA][SAVE TRACE][INTO FILE
].
ENTER
INTO FILE
] softkey.
].
49
Page 70

Saving and Plotting Data Agilent 35670A Quick Start Guide
To recall a trace from a file
The analyzer recalls
the highlighted file
1
Press [
Save/Recall
], then press [
CATALOG ON OFF
] to highlight ON.
2 Turn the knob to highlight the file you want to recall.
3 Press [
RECALL DATA][RCL TRACE][FROM FILE INTO D1][ENTER
].
4 Activate the appropriate trace if the one you want to replace is not currently active.
See “Toactivateatrace.”
5 Press [
Meas Data
It is generally easier to recall a trace if you display the disk catalog and highlight the
trace file first. When you do this, the prompt box that is displayed when you press
[
FROM FILE INTO D1
enter to recall the file. If you do not display the catalog first, you will need to type the
correct file name into the prompt box before you press enter.
The analyzer always recalls a trace into a data register. Steps 4 and 5 allow you to
view the recalled trace by selecting the contents of that data register for display.
] [
MORE CHOICES][DATA REGISTER][D1
] already contains the correct file name. You only need to press
].
50
Page 71

Agilent 35670A Quick Start Guide Saving and Plotting Data
To save a trace to a data register
Activate the trace if the one you want to save is not currently active. See “To select
1
theactivetrace.”
2 Press [
Save/Recall
] [
SAVE DATA][SAVE TRACE][INTO D1
].
Data registers are cleared each time you turn off the analyzer. The analyzer uses the
data registers to store the contents of certain operations.
• D6—is a default data register for the curve fit operation.
• D7—is a default data register for the curve fit operation.
• D8—is the default data register for the synthesis operation.
To recall a trace from a data register, see steps 4 and 5 of “To recall a trace from a
file.”
51
Page 72
Saving and Plotting Data Agilent 35670A Quick Start Guide
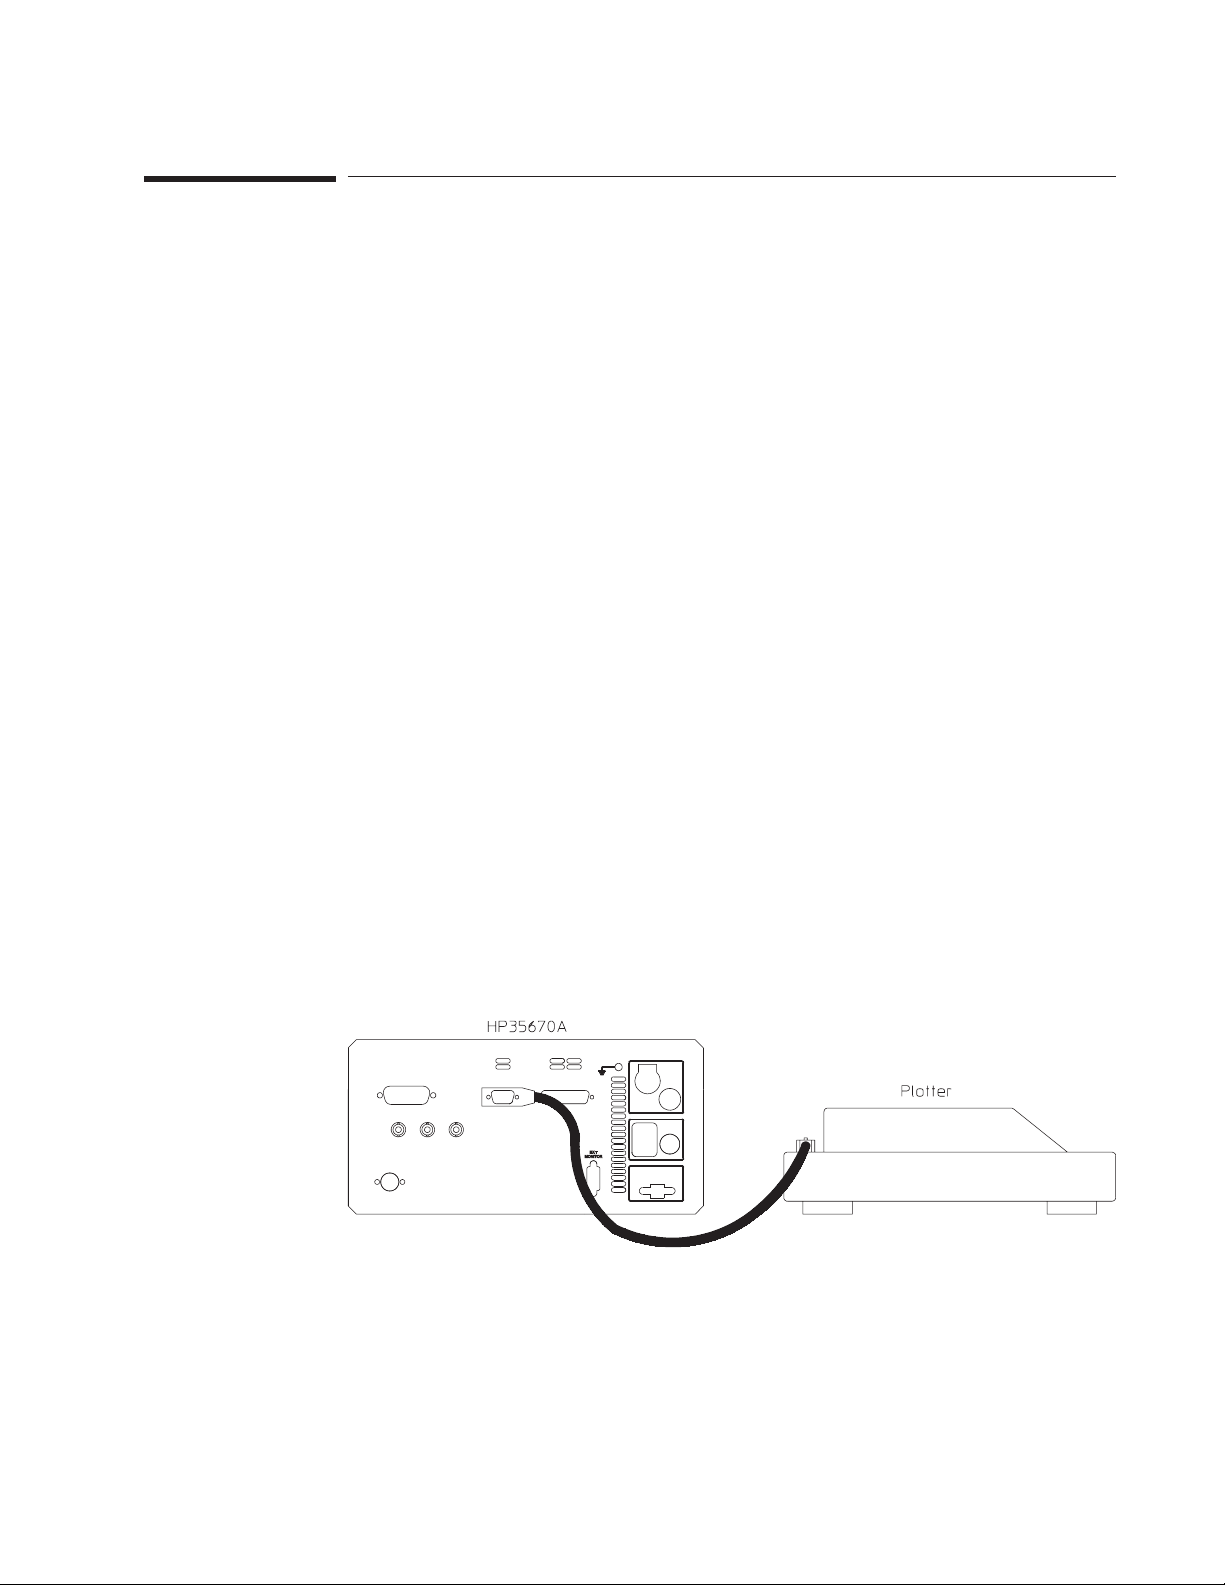
To setup your plotter — GPIB
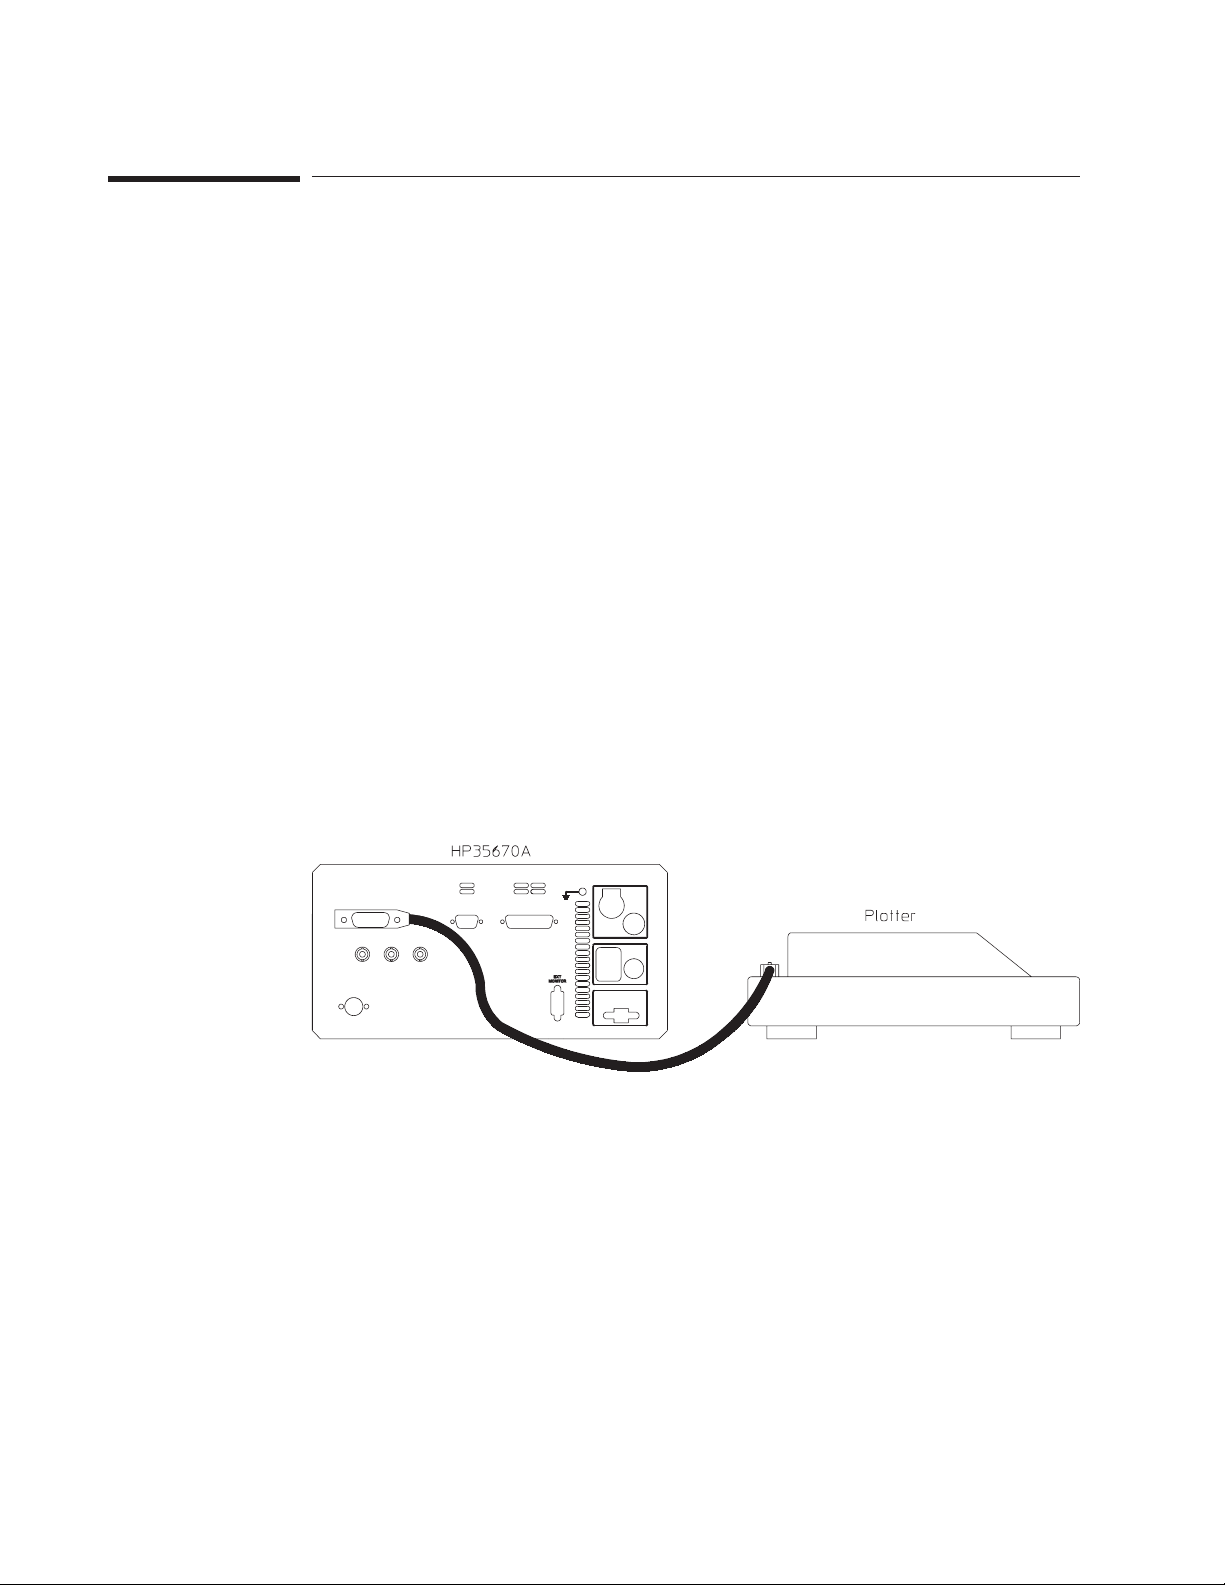
Connect the GPIB ports of your plotter and analyzer with an GPIB cable.
1
2 Verify the GPIB address of the analyzer.
See “To set the analyzer’sGPIBaddress” in the Setting Up section.
3 Turn on the plotter.
4 Determine the GPIB address of the plotter.
If you need to change the setting on the analyzer, press [
[
PLOTTER ADDRESS
] <number> [
ENTER
].
Local/GPIB
]
5 Press [
SYSTEM CONTROLLR
The current setting for the plotter’s address appears at the top of the display. Refer to
you plotter’s documentation to determine its GPIB address. If you need to change it,
substitute the value for <number> in Step 4.
If there is more than one controller on the bus, the analyzer needs to have active
control instead of system control to initiate a plot. See “Passing Control” in the GPIB
Programmer’s Guide for more information.
].
52
Page 73
Agilent 35670A Quick Start Guide Saving and Plotting Data
To setup your plotter — Serial
Connect the serial ports of your plotter and analyzer with a RS-232-C cable.
1
2 Check the plotter’s documentation to verify the serial configuration.
3 Turn on the plotter.
4 To set the plotter’s baud rate on the analyzer, press [
SETUP][BAUD RATE
]. The softkey steps through the available values.
Plot/Print
] [
MORE SETUP][SERIAL
5 In the same menu, set the transmitter’s (the analyzer’s) handshake pacing type. Press
[
XMIT PACE
]. The softkey steps through the available values.
6 Set the other parameter values, if you need to change the settings.
The configuration is saved in non-volatile RAM. Refer to your plotter’s
documentation to determine the required serial configuration. The analyzer is
considered the transmitter and the plotter is considered the receiver.
The default values should satisfy the configuration for most plotters. Additional
parameters that you can change are:
• [
BITS/CHAR
• [
STOP BITS
• [
PARITY
• [
PRTY CHK
• [
RCVR PACE
] — specifies the number bits in each character.
] — specifies the number of “stop bits” sent with each character.
] — sets the parity generated for characters.
] — enables parity verification capability.
] — sets the receiver handshake pacing type.
53
Page 74

Saving and Plotting Data Agilent 35670A Quick Start Guide
To plot screen contents
Set up your plotter.
1
2 Press [
3 Press [
Press [
4 Press [
Press the [
Local/GPIB
Plot/Print
].
Rtn
PLOT/PRNT DESTINATN
OUTPUT TO GPIB
] [
SYSTEM CONTROLLR
][
PLO T/PRNT DEVI CE][HP-GL PLOTTER
].
].
] if your plotter is connected to the GPIB
].
(see “To setup you plotter—GPIB.”
or
Press [
OUTPUT TO SERIAL
] if your plotter is connected to the RS-232-C
(see “To setup you plotter —RS-232-C.”
or
Press [
OUTPUT TO PARALLEL
] if your plotter is connected to the parallel port.
or
Press [
OUTPUT TO FILE
] to plot the contents of the screen to a file
(see “To select the default disk”).
5 Press [
6 Press [
].
Rtn
Plot/Print
] [
START PLOT/PRNT
].
The analyzer is only able to initiate plotting if the plotter is connected to the
appropriate port and if the analyzer is designated as the system controller. All of the
contents of the screen, except the softkey labels, are plotted when you complete
this task.
To print the contents of the screen, press [
PLOT/PRNT DEVICE][RASTER PRINTER
Step 3. Be sure a printer is connected to the appropriate interface port.
]in
54
Page 75

Automating Measurements
Page 76

Page 77

Automating Measurements
This section shows you how to customize your analyzer and introduces the analyzer’s
keystroke recording feature . Keystroke recording is an optional feature that is
available under the [
] hardkey when you order Option 1C2, Instrument BASIC.
Basic
55
Page 78
Automating Measurements Agilent 35670A Quick Start Guide
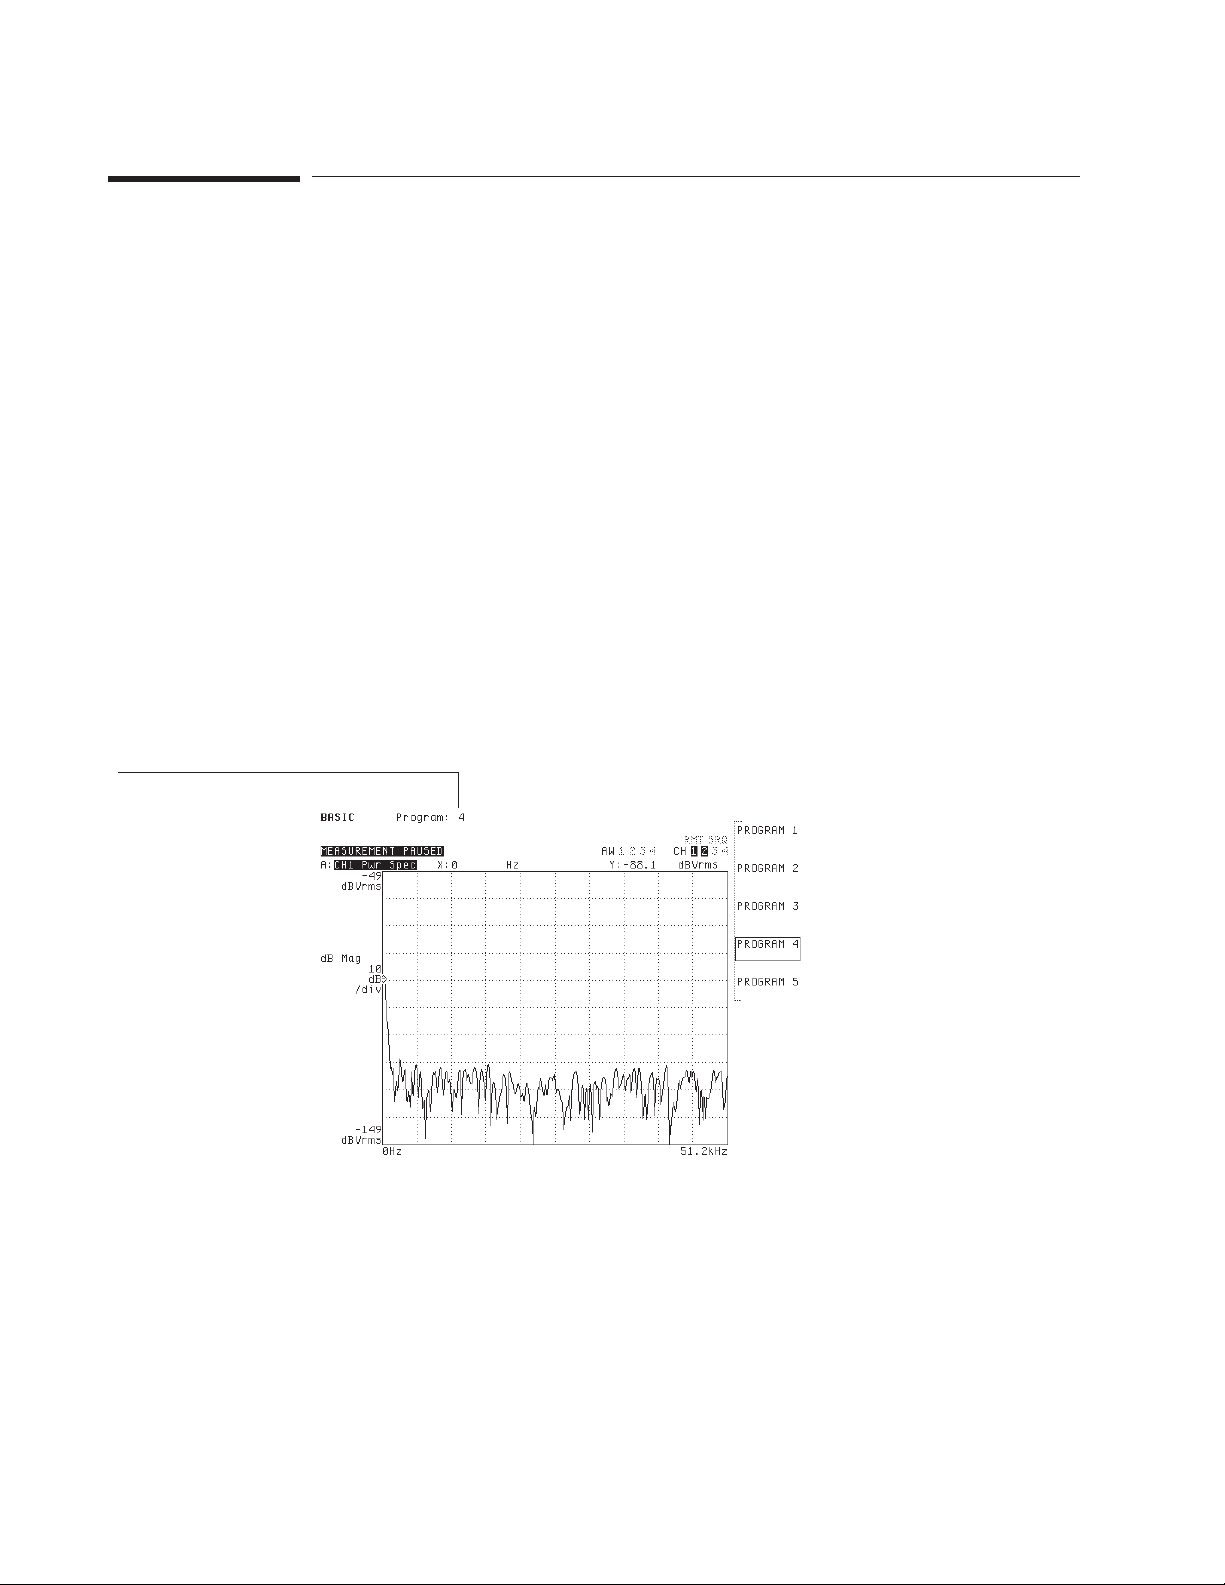
To select the active Instrument BASIC program
Active Program
Press [
1
2 Press [
] [
Basic
PROGRAM 1
INSTRUMNT BASIC][SELECT PROGRAM
].
].
or
Press [
PROGRAM 2
].
or
Press [
PROGRAM 3
].
or
Press [
PROGRAM 4
].
or
Press [
3 Press [
PROGRAM 5
].
Rtn
].
The analyzer has five program buffers. Only one program buffer can be active at any
one time. The currently active program appears at the top of the display.
The softkeys may have different labels. Press the softkey corresponding to the
program you want to activate.
56
Page 79
Agilent 35670A Quick Start Guide Automating Measurements
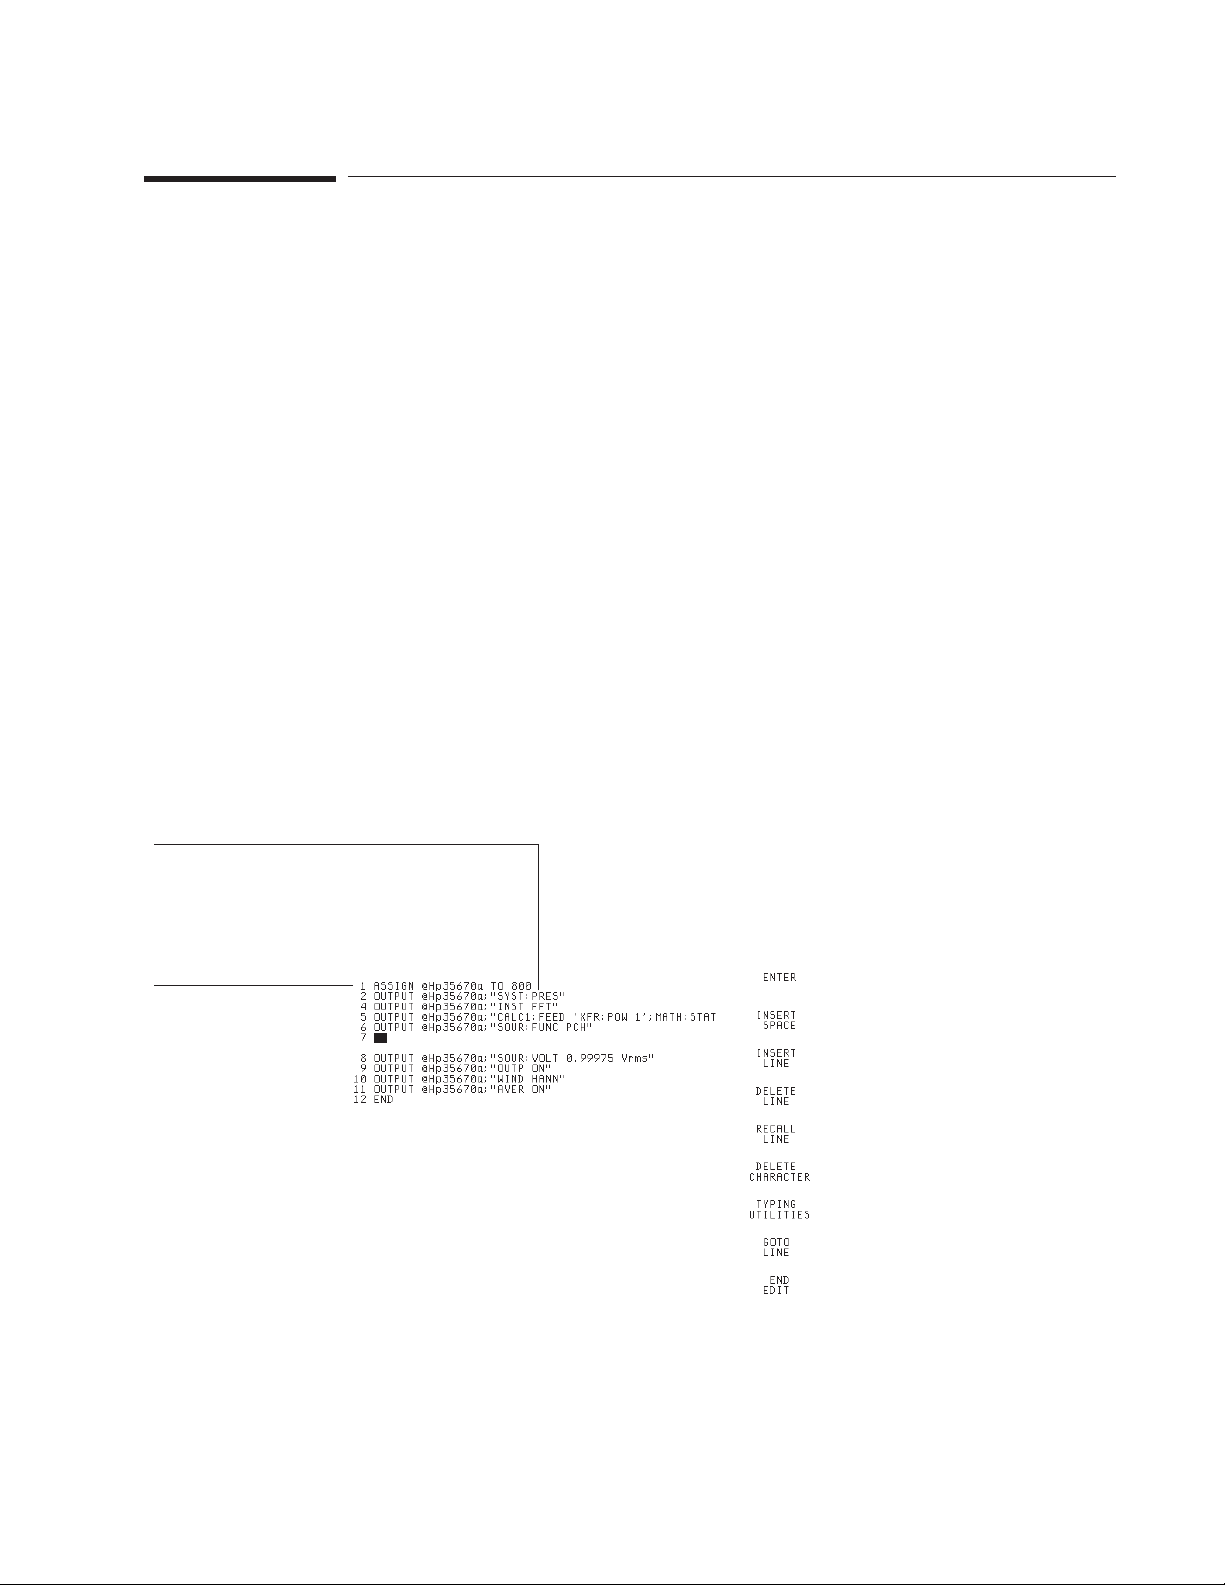
To record a measurement sequence
Select the active program.
1
(See the previous task, “To select the active Instrument BASIC program.”
2 Press [
3 Press [
4 Press the keys in your measurement sequence.
5 Press [
GPIB Commands
equivalent to your key
presses are enclosed in
quotes
] [
Basic
Press [
PERFORM SCRATCH
ENABLE RECORDING
] to end recording.
Basic
INSTRUMNT BASIC][UTILITIES][SCRATCH][SCRATCH
] [
Rtn][Rtn
].
].
].
When you record a measurement sequence with Instrument BASIC, the analyzer
converts key-presses to equivalent GPIB commands. The commands are then inserted
in BASIC program lines in the analyzer’s active program buffer. The second step of
this task clears the program buffer so your measurement sequence will not be inserted
into an existing program. The remaining steps actually record your key-presses.
To produce consistent results, it is important to make [
keys you press in step 4. [
DO PRESET
] eliminates many unknowns by returning most
Preset
] [
DO PRESET
] the first
analyzer parameters to their default states. To learn more, see Using Instrument
BASIC with the Agilent 35670A.
Recorded BASIC program
is
displayed when you press
[BASIC] [Instrument
BASIC]
[EDIT PROGRAM]
57
Page 80

Automating Measurements Agilent 35670A Quick Start Guide
To execute a recorded measurement sequence
Press [
1
2 Press [
].
Basic
RUN PROGRAM 1
].
or
Press [
RUN PROGRAM 2
].
or
Press [
RUN PROGRAM 3
].
or
Press [
RUN PROGRAM 4
].
or
Press [
RUN PROGRAM 5
].
This task runs the program currently loaded in the selected program buffer. To run the
program in the active program buffer, press [
[
RUN PROGRAM
].
Basic
] [
INSTRUMNT BASIC
]
If your program is stored on one of the analyzer’s disks, you will need to load it into
the active program buffer before running it. (You can recall programs with the
[
RECALL PROGRAM
] softkey, located in the [
Save/Recall
] menu.
Once your program is running, you can stop it by pressing one of three keys:
• Press [
• Press [
• Press [
] to PAUSE the program.
Basic
Local/GPIB
Preset
] to ABORT the program.
] to ABORT the program. To preset the analyzer, press [
DO PRESET
See Using Instrument BASIC with the Agilent 35670A for more information on
pausing and stopping a program.
].
58
Page 81

Agilent 35670A Quick Start Guide Automating Measurements
To customize your analyzer
Creating an AUTO_ST.STA file allows you to automatically specify a specific
measurement state when you turn on the analyzer or when you press [
[
RECALL AUTOSTATE
].
Preset
]
1 Initialize the analyzer.
Press [
Preset
] [
DO PRESET
].
2 Configure the analyzer to fit your application.
3 Select the default disk, either the non-volatile RAM disk or the internal disk.
See “To select the default disk” in the second section, Setting Up.
4 Save the measurement state.
If the internal disk drive is the default disk, insert a 3.5 inch floppy disk.
Press [
Save/Recall
Press [
ENTER
At power-up, the analyzer searches the internal disk drive first and then searches the
non-volatile RAM disk for the “AUTO_ST” file. If it is found, the analyzer loads the
measurement state immediately.
] [
SAVE MORE][SAVE AUTOSTATE
].
].
59
Page 82
Automating Measurements Agilent 35670A Quick Start Guide
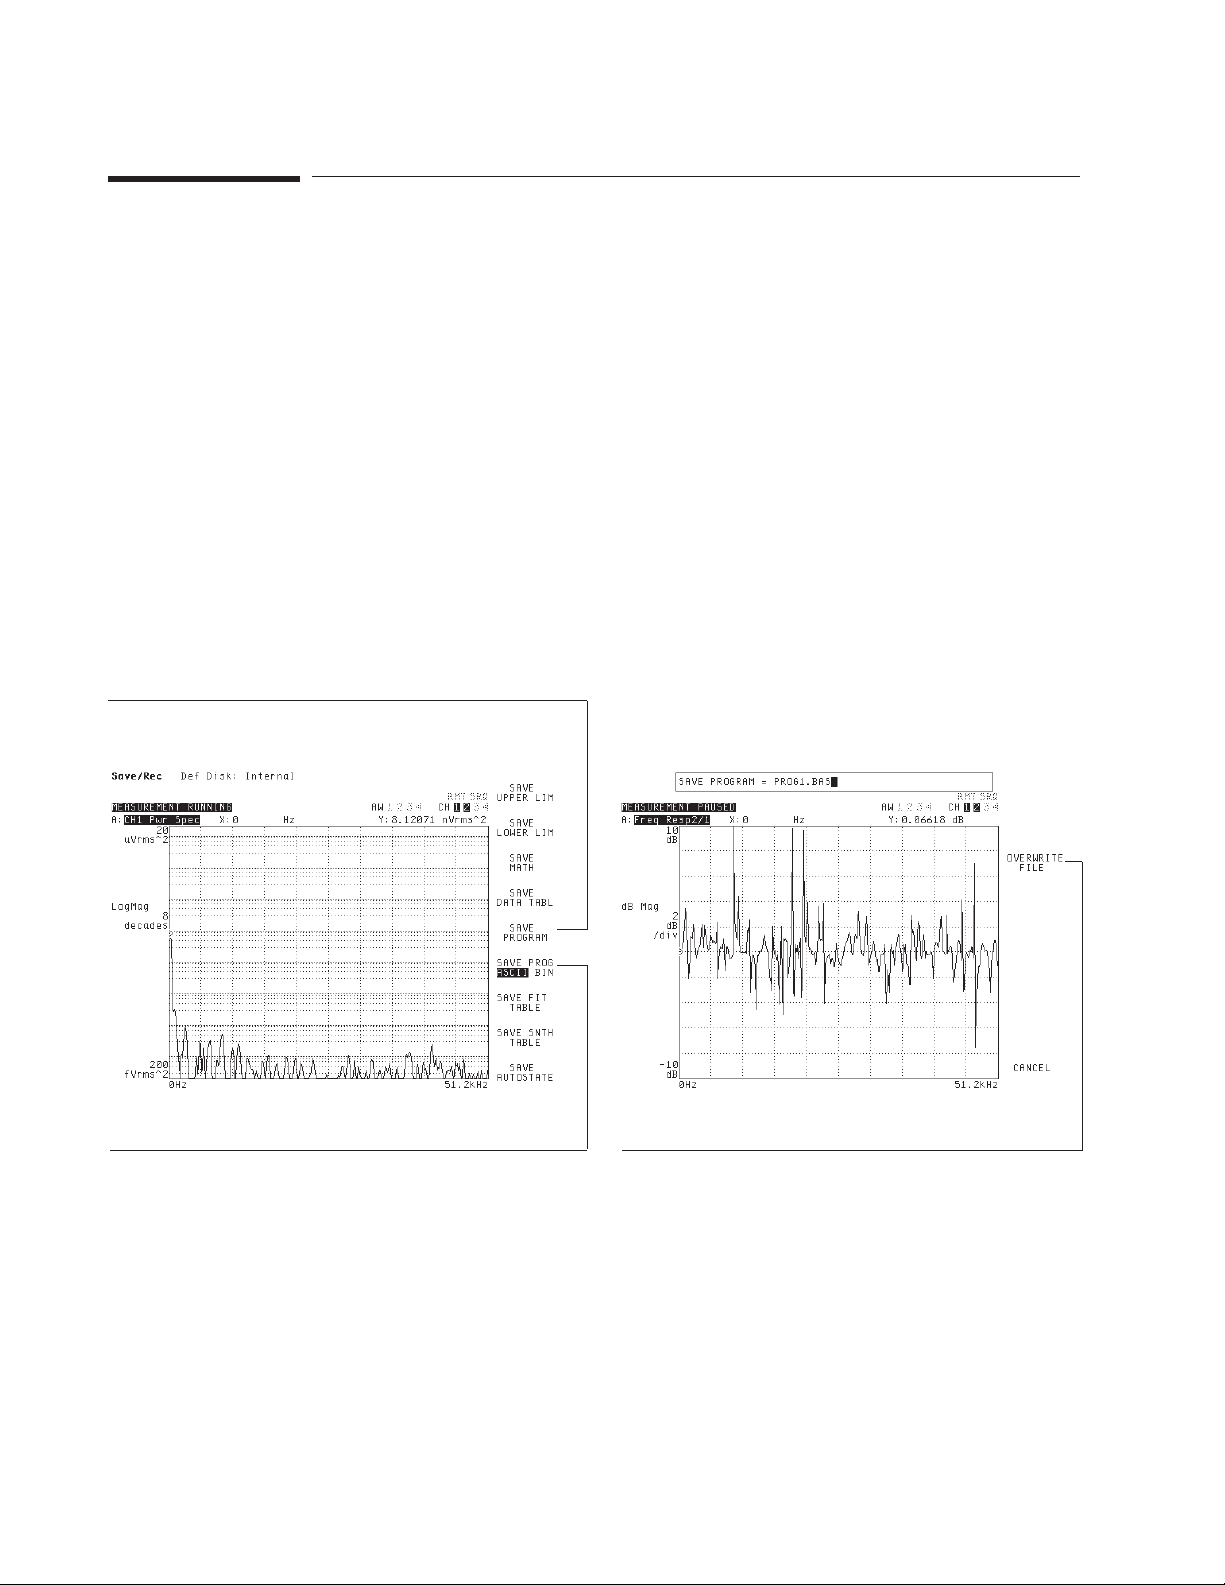
To save an Instrument BASIC program to disk
Select the active Instrument BASIC program.
1
2 Select the default disk.
3 Press [
Press [
Save/Recall
SAVE PROGRAM
] [
4 Type a file name, then press [
5 If the program had been saved before, press [
After you have entered a file name the analyzer saves the active program to a file on
the default disk. If the file name ends with a number (for example, PROG1), the
analyzer automatically increments the default file name during successive save
operations. For more information on typing a file name and selecting the default disk,
see “To type a text string” and “To select the default disk” earlier in this book.
To save a program, press [SAVE PROGRAM]
SAVE MORE
].
ENTER
].
].
OVERWRITE FILE
].
Determines if program is saved as an ASCII
file or binary file
60
If program already exists,
press [OVERWRITE FILE]
Page 83

Index
Page 84

Page 85

Index
A
AC power 2
active trace 18 - 19
address
analyzer 14
plotter 52
analyzer
customizing 59
HP-IB address 14
setting the clock 15
AUTO_ST 59
autoscaling 22
autosequence 57
average, specifying 29
B
BASIC
See Instrument BASIC
battery power 3
C
calibrating, microphone 34
clock, setting 15
D
data register, saving a trace 51
date, setting 15
DC power 3
disk
default 16
formatting 48
saving a program 60
saving a trace 49
display
activating a trace 18
measurement state 23
plotting contents 54
scaling 22
selecting data 20
dynamic range 28
E
entering
numbers 10
parameters 24
text 9
F
FFT, frequency response 30
files
recalling 50
saving 49
formatting disks 48
frequency response
FFT 30
swept-sine 32
frequency span, setting 28
G
GPIB
analyzer’s address 14
plotter’s address 52
plotting 54
H
harmonic distortion 38
help, online 4
histogram,unfiltered time 40
holdoff time 42
i
Page 86

I
ICP, turning on 45
impedance
input 29, 31
source 31
inputs
activating channels 6-7
setting reference 6-7
Instrument BASIC
active program 56
recording a program 57
running a program 58
saving to a file 60
instrument modes 8
instrument state
See measurement state
internal disk 16
K
keyboard, using 9
keystroke recording 57
L
line power,using 2
M
map displays 25
markers
absolute 39
axes scale 41
harmonic 39
moving the main 11
reference 12
relative 12
mass storage 16
measurement data
scaling 22
selecting 20
measurement state 5
at power-up 59
displaying 23
updating 24
order spectrum 45
sound pressure level 36
spectrum 28
tach pulse 40
THD 38
time waveform 41
O
octave analysis
microphone calibration 34
sound pressure level 36
online help, using 4
order analysis 45
order spectrum 45
overload indicator 33
P
parameters, entering 24
peak-to-peak value, determining 12, 41
plotter
HP-IB address 52
serial 53
plotting, screen 54
preset 5
printing, screen 54
program
active 56
executing 58
recording 57
running 58
R
recalling
atrace 50
files 50
recording keystrokes 57
reference markers 12
register, saving a trace 51
relative markers 12
resolution 29
RPM indicator 41
measuring
frequency response 30, 32
fundamental frequency 38
microphone calibration 34
ii
Page 87

RS-232-C
configuring 53
plotting 54
running a program 58
S
saving
a program 60
trace data 49
scaling 22
selecting data 20
setting default disk 16
setup state 5
sound pressure level 36
span, setting 28
spectrum
measuring 28, 45
peak-to-peak value 12
storage devices 16
swept-sine analysis,frequency response
32
T
tachometer
characterize 40
holdoff time 42
text, entering 9
text, typing 9
time stamp 15
trace
activating 18
displaying 18 - 19
scaling 22
trace data
in waterfall 25
See also measurement data
plotting 54
recalling 50
saving to a data register 51
saving to a file 49
selecting 20
transducer units 35, 45
turning on the analyzer 2-3
typing text 9
U
units, transducer 35
V
values, entering 10
volatile RAM disk 16
W
waterfall displays 25
iii
Page 88

Guide to Agilent 35670A Documentation
If you are thinking about... And you want to... Then read...
Unpacking and installing
the Agilent 35670A
Getting started
Making measurements
Creating automated
measurements
(
Instrument BASIC is Option 1C2)
Install the Agilent 35670A
Dynamic Signal Analyzer
Do operation verification or
performance verification tests
Make your first measurements
with your new analyzer
Review measurement basics Agilent 35670A Operator’s
Learn what each key does Use the analyzer’s[
Learn how to make typical
measurements with the Agilent
35670A
Understand each of the
analyzer’s instrument modes
Learn the Instrument BASIC
interface
Record keystrokes for a
particular measurement
Program with Instrument BASIC Instrument BASIC User’s
Agilent 35670A Installation and
Verification Guide
Agilent 35670A Installation and
Verification Guide
Agilent 35670A Quick Start
Guide
Guide
Help
Agilent 35670A Operator’s
Guide
Agilent 35670A Operator’s
Guide
Using Instrument BASIC with
the Agilent 35670A
Agilent 35670A Quick Start
Guide
Handbook
]key
Remote operation
Using analyzer data with
a PC application
Servicing the analyzer
Learn about the GPIB GPIB Programmer’sGuide
Learn how to program with GPIB GPIB Programming with
the HP 35670A
Find specific GPIB commands Agilent 35670A GPIB
Commands: Quick Reference
Display or plot analyzer data on
or from a Personal Computer
Transfer analyzer data to a PC
sofware application forma
Transfer data from a PC
software application format tothe
analyzer (for example, to load
data into a data register)
Adjust, troubleshoot, or repair the
analyzer
Standard Data Format Utilities:
User’s Guide
Agilent 35670A
Service Guide
Page 89

Page 90

Need Assistance?
If you need assistance, contact your nearest Agilent Technologies Sales and
Service Office listed in the Agilent Catalog. You can also find a list of local
service representatives on the Web at:
http://www.agilent.com/find/assist or contact your nearest regional office
listed below.
If you are contacting Agilent Technologies about a problem with your Agilent
35670 Dynamic Signal Analyzer, please provide the following information:
q Model number: Agilent 35670A
q Serial number:
q Options:
q Date the problem was first encountered:
q Circumstances in which the problem was encountered:
q Can you reproduce the problem?
q What effect does this problem have on you?
You may find the serial number and options from the front panel of your
analyzer by executing the following:
Press [
Press [
If you do not have access to the Internet, one of these centers can direct you to
your nearest representative:
System Utility
System Utility
United States Test and Measurement Call Center
Canada (905) 206-4725
Europe (31 20) 547 9900
Japan Measurement Assistance Center
Latin America (305) 267 4245
Australia/New Zealand 1 800 629 485 (Australia)
Asia-Pacific (852) 2599 7777
], [
], [
], [
more
options setup
serial number
].
].
(800) 452-4844 (Toll free in US)
(81) 426 56 7832
(81) 426 56 7840 (FAX)
(305) 267 4288 (FAX)
0800 738 378 (New Zealand)
(FAX) (852) 2506 9285
Page 91

Page 92

About t his edition
October 2000: Rebranded to Agilent Technologies
January 1995: In this edition, Setting Up, page 13, was corrected to refer to “your
HP 35670A Installation and Verification guide”.
November 1992: Previous edition.
 Loading...