

Page 1

8436
3-PHASE POWER QUALITY
ANALYZER
PowerPad
®
ENGLISH
Find Quality Products Online at: sales@GlobalTestSupply.com
User Manual
www.GlobalTestSupply.com
Page 2

2
Statement of Compliance
Chauvin Arnoux®, Inc. d.b.a. AEMC® Instruments certifies that
this instrument has been calibrated using standards and
instruments traceable to international standards.
We guarantee that at the time of shipping your instrument has
met its published specifications.
An N.I.S.T. traceable certificate may be requested at the time
of purchase, or obtained by returning the instrument to our
repair and calibration facility, for a nominal charge.
The recommended calibration interval for this instrument is 12
months and begins on the date of receipt by the customer. For
recalibration, please use our calibration services. Refer to our
repair and calibration section at
Serial #:
Catalog #: 2136.43/2136.44
Model #: 8436
Please fill in the appropriate date as indicated:
Date Received:
Date Calibration Due:
®
Chauvin Arnoux
d.b.a AEMC
®
, Inc.
Instruments
Find Quality Products Online at: sales@GlobalTestSupply.com
www.GlobalTestSupply.com
Page 3

3
®
Thank you for purchasing a PowerPad
enclosed operating instructions carefully and comply with the precautions for use. These products must be only used by qualified
and trained users.
WARNING, risk of DANGER! The operator must refer to these instructions whenever this danger symbol appears.
CAUTION! Risk of electric shock. The voltage at the parts marked with this symbol may be dangerous.
Equipment is protected by double insulation.
USB socket.
SD Card.
Ground/Earth.
Important instructions to read and to fully understand.
Useful information or hint to read.
The CE marking guarantees conformity with European directives and with regulations covering EMC.
The trash can with a line through it means that in the European Union, the product must undergo selective disposal for
the recycling of electric and electronic material, in compliance with Directive WEEE 2002/96/EC.
III Model 8436. For best results from your instrument and for your safety, read the
Definition of Measurement Categories (CAT)
■ CAT IV corresponds to measurements taken at the source of low-voltage installations.
Example: power feeders, counters and protection devices.
■ CAT III corresponds to measurements on building installations.
Example: distribution panel, circuit-breakers, machines or fixed industrial devices.
■ CAT II corresponds to measurements taken on circuits directly connected to low-voltage installations.
Example: power supply to domestic electrical appliances and portable tools.
PRECAUTIONS FOR USE
This device is compliant with safety standard IEC 61010-2-030, the leads are compliant with IEC 61010-031, and the current sensors
are compliant with IEC 61010-2-032, for voltages up to 600 V in category IV or 1000 V in category III. Failure to observe the safety
instructions may result in electric shock, fire, explosion, and destruction of the instrument and of the installations.
■ The operator and/or the responsible authority must carefully read and clearly understand the various precautions to be taken
in use. Sound knowledge and a keen awareness of electrical hazards are essential when using this instrument.
■ If you use this instrument other than as specified, the protection it provides may be compromised, thereby endangering you.
■ Do not use the instrument on networks of which the voltage or category exceeds those mentioned.
■ Do not use the instrument if it appears to be damaged, incomplete, or poorly closed.
■ Before each use, check the condition of the insulation on the leads, housing, and accessories. Any item of which the insulation
is deteriorated (even partially) must be set aside for repair or scrapping.
■ Use only the leads and accessories supplied. Using leads (or accessories) of a lower voltage or category reduces the voltage
or category of the combined instrument + leads (or accessories) to that of the leads (or accessories).
■ Use personal protection equipment systematically.
■ Keep your hands away from the terminals of the instrument.
■ When handling the leads, test probes, and alligator clips, keep your fingers behind the physical guard.
■ Use only the external power adaptor and battery pack supplied by the manufacturer. They include specific safety features.
■ Some current sensors must not be placed on or removed from bare conductors at hazardous voltages: refer to the sensor
manual and comply with the handling instructions.
Find Quality Products Online at: sales@GlobalTestSupply.com
www.GlobalTestSupply.com
Page 4

4
CONTENTS
1. INTRODUCTION ........................................................................................................................................................................................................7
1.1. DELIVERY CONDITION ...................................................................................................................................................................................7
1.2. ORDERING INFORMATION ............................................................................................................................................................................7
1.3. ACCESSORIES ...............................................................................................................................................................................................7
1.4. REPLACEMENT PARTS ..................................................................................................................................................................................7
1.5. BATTERY CHARGING .....................................................................................................................................................................................8
1.6. LANGUAGE SELECTION ................................................................................................................................................................................9
2. DESCRIPTION......................................................................................................................................................................................................... 10
3. OPERATION ............................................................................................................................................................................................................ 19
4. CONFIGURATION ................................................................................................................................................................................................... 23
2.1. FUNCTIONS ................................................................................................................................................................................................... 10
2.1.1. MEASUREMENTS ............................................................................................................................................................................. 10
2.1.2. DISPLAY FUNCTIONS ....................................................................................................................................................................... 11
2.1.3. CONFIGURATION ............................................................................................................................................................................. 11
2.2. INSTRUMENT INTERFACE ........................................................................................................................................................................... 12
2.3. ON/OFF BUTTON .......................................................................................................................................................................................... 13
2.4. DISPLAY ........................................................................................................................................................................................................ 13
2.4.1. PRESENTATION................................................................................................................................................................................ 13
2.4.2. FUNCTION BUTTONS ....................................................................................................................................................................... 14
2.5. KEYPAD BUTTONS ........................................................................................................................................................................................ 15
2.5.1. FUNCTION (YELLOW) BUTTONS ..................................................................................................................................................... 15
2.5.2. NAVIGATION BUTTONS .................................................................................................................................................................... 15
2.5.3. MODE BUTTONS ............................................................................................................................................................................... 15
2.5.4. OTHER BUTTONS ............................................................................................................................................................................. 16
2.
6. CONNECTORS .............................................................................................................................................................................................. 16
2.6.1. CONNECTION TERMINALS .............................................................................................................................................................. 16
2.6.2. SIDE CONNECTORS ......................................................................................................................................................................... 17
2.7. POWER SUPPLY ........................................................................................................................................................................................... 17
2.8. ABBREVIATIONS .......................................................................................................................................................................................... 17
3.1. START-UP ..................................................................................................................................................................................................... 19
3.2. CONFIGURATION ......................................................................................................................................................................................... 19
3.3. LEADS INSTALLATION ................................................................................................................................................................................. 20
3.3.1. SINGLE-PHASE NETWORK .............................................................................................................................................................. 21
3.3.2. SPLIT-PHASE NETWORK ................................................................................................................................................................. 21
3.3.3. THREE-PHASE NETWORK ............................................................................................................................................................... 21
3.3.4. CONNECTION ................................................................................................................................................................................... 22
3.4. INSTRUMENT FUNCTIONS .......................................................................................................................................................................... 22
3.4.1. WAVEFORM CAPTURE .................................................................................................................................................................... 22
3.4.2. HARMONICS DISPLAY ...................................................................................................................................................................... 22
3.4.3. WAVEFORM MEASUREMENTS ........................................................................................................................................................ 22
3.4.4. ALARM RECORDING ......................................................................................................................................................................... 22
3.4.5. RECORDING ..................................................................................................................................................................................... 22
3.4.6. ENERGY MEASUREMENTS.............................................................................................................................................................. 22
4.1. CO
NFIGURATION MENU .............................................................................................................................................................................. 23
4.2. DISPLAY LANGUAGE ................................................................................................................................................................................... 23
4.3. DATE/TIME .................................................................................................................................................................................................... 23
4.4. DISPLAY ..................................................................................................................................................................................................... 24
4.4.1. BRIGHTNESS .................................................................................................................................................................................... 24
4.4.2. COLORS ........................................................................................................................................................................................... 24
4.4.3. DISPLAY SHUTDOWN ...................................................................................................................................................................... 24
4.4.4. NIGHT MODE .................................................................................................................................................................................... 25
4.5. CALCULATION METHODS ............................................................................................................................................................................ 25
4.5.1. NON-ACTIVE QUANTITIES CALCULATION ...................................................................................................................................... 25
4.5.2. UNITS OF ENERGY ........................................................................................................................................................................... 26
4.5.3. K FACTOR .......................................................................................................................................................................................... 26
4.
5.4. PHASE HARMONICS......................................................................................................................................................................... 27
4.5.5. LONG-TERM FLICKER (PLT) ............................................................................................................................................................. 27
4.6. CONNECTION ............................................................................................................................................................................................... 28
4.7. SENSORS AND RATIOS ............................................................................................................................................................................... 32
4.7.1. CURRENT SENSORS AND RATIOS .................................................................................................................................................. 32
4.7.2. VOLTAGE RATIOS ............................................................................................................................................................................. 32
4.8. CAPTURE MODE .......................................................................................................................................................................................... 33
4.8.1. TRANSIENT VOLTAGE THRESHOLDS .............................................................................................................................................. 33
4.8.2. TRANSIENT CURRENT THRESHOLDS ............................................................................................................................................ 34
4.8.3. INRUSH CURRENT THRESHOLDS ................................................................................................................................................... 35
4.
9. TREND MODE ............................................................................................................................................................................................... 35
4.10. ALARM MODE ............................................................................................................................................................................................. 37
4.11. ERASE MEMORY ........................................................................................................................................................................................ 38
4.12. ABOUT ..................................................................................................................................................................................................... 39
Find Quality Products Online at: sales@GlobalTestSupply.com
www.GlobalTestSupply.com
Page 5

5
5. WAVEFORM CAPTURE ........................................................................................................................................................................................... 40
5.1. TRANSIENT MODE ....................................................................................................................................................................................... 40
5.1.1. CONFIGURING AND STARTING A SEARCH ..................................................................................................................................... 41
5.1.2. DISPLAYING A TRANSIENT .............................................................................................................................................................. 41
5.1.3. DELETING A SEARCH FOR TRANSIENTS ....................................................................................................................................... 42
5.1.4. DELETE A TRANSIENT ..................................................................................................................................................................... 42
5.2. INRUSH CURRENT MODE ............................................................................................................................................................................ 43
5.2.1. CONFIGURING THE CAPTURE ........................................................................................................................................................ 43
5.2.2. CAPTURE PARAMETERS ................................................................................................................................................................. 44
5.2.3. TRUE RMS CURRENT AND VOLTAGE ............................................................................................................................................. 44
5.2.4. INSTANTANEOUS INRUSH CURRENT ............................................................................................................................................. 46
6. HARMONICS ..................................................................................................................................................................................................... 48
6.1. PHASE-TO-NEUTRAL VOLTAGE ................................................................................................................................................................... 48
6.1.1. 3L PHASE-TO-NEUTRAL VOLTAGE HARMONICS DISPLAY SCREEN ............................................................................................. 48
6.1.2. L1 PHASE VOLTAGE HARMONICS DISPLAY SCREEN .................................................................................................................... 49
6.2. CURRENT ..................................................................................................................................................................................................... 49
6.2.1. 3L CURRENT HARMONICS DISPLAY SCREEN ................................................................................................................................ 49
6.2.2. L1 CURRENT HARMONICS DISPLAY SCREEN ................................................................................................................................ 50
6.3. APPARENT POWER ...................................................................................................................................................................................... 50
6.3.1. 3L APPARENT POWER HARMONICS DISPLAY SCREEN ................................................................................................................ 50
3.2. L1 APPARENT POWER HARMONICS DISPLAY SCREEN ................................................................................................................ 51
6.
6.4. PHASE-TO-PHASE VOLTAGE ....................................................................................................................................................................... 51
6.4.1. 3L PHASE-TO-PHASE VOLTAGE HARMONICS DISPLAY SCREEN ................................................................................................. 51
6.4.2. L1 PHASE-TO-PHASE VOLTAGE HARMONICS DISPLAY SCREEN ................................................................................................ 52
6.5. EXPERT MODE ............................................................................................................................................................................................. 52
6.5.1. PHASE-TO-NEUTRAL VOLTAGE EXPERT MODE DISPLAY SCREEN ............................................................................................. 52
6.5.2. CURRENT EXPERT MODE DISPLAY SCREEN................................................................................................................................. 53
7. WAVEFORM ..................................................................................................................................................................................................... 54
7.1. TRUE RMS .................................................................................................................................................................................................... 54
7.1.1. 3U RMS DISPLAY SCREEN ............................................................................................................................................................... 55
7.1.2. 4V RMS DISPLAY SCREEN ............................................................................................................................................................... 55
7.1.3. 4A RMS DISPLAY SCREEN ............................................................................................................................................................... 55
7.1.4. RMS DISPLAY SCREEN FOR THE NEUTRAL ................................................................................................................................... 56
7.2. TOTAL HARMONIC DISTORTION ................................................................................................................................................................. 56
7.2.1. 3U THD DISPLAY SCREEN ............................................................................................................................................................... 56
7.2.2. 4V THD DISPLAY SCREEN ................................................................................................................................................................ 56
7.2.3. 4A THD DISPLAY SCREEN ................................................................................................................................................................ 57
7.3. PEAK FACTOR .............................................................................................................................................................................................. 57
7.3.1. 3U CF DISPLAY SCREEN .................................................................................................................................................................. 57
7.3.2. 4V CF DISPLAY SCREEN.................................................................................................................................................................. 57
7.3.3. 4A CF DISPLAY SCREEN
.................................................................................................................................................................. 58
7.4. MAX - MIN AND MEAN VOLTAGE AND CURRENT ........................................................................................................................................ 58
7.4.1. 3U MAX-MIN DISPLAY SCREEN........................................................................................................................................................ 58
7.4.2. 4V MAX.-MIN. DISPLAY SCREEN ...................................................................................................................................................... 59
7.4.3. 4A MAX.-MIN. DISPLAY SCREEN ...................................................................................................................................................... 59
7.4.4. L1 MAX.-MIN. DISPLAY SCREEN ...................................................................................................................................................... 59
7.4.5. NEUTRAL MAX.-MIN. DISPLAY SCREEN ......................................................................................................................................... 60
7.5. SIMULTANEOUS DISPLAY ........................................................................................................................................................................... 60
7.5.1. 3U SIMULTANEOUS DISPLAY SCREEN ........................................................................................................................................... 60
7.5.2. 4V SIMULTANEOUS DISPLAY SCREEN ........................................................................................................................................... 60
7.5.3. 4A SIMULTANEOUS DISPLAY SCREEN ........................................................................................................................................... 61
7.5.4. L1 SIMULTANEOUS DISPLAY SCREEN............................................................................................................................................ 61
7.5.5. SCREEN FOR SIMULTANEOUS DISPLAY OF NEUTRAL .................................................................................................................. 61
7.6. PHASOR DIAGRAM ....................................................................................................................................................................................... 62
7.6.1. 3V PHASOR ....................................................................................................................................................................................... 62
7.6.2. 3U PHASOR DIAGRAM DISPLAY SCREEN ....................................................................................................................................... 62
7.6.3. 3A PHASOR DIAGRAM DISPLAY SCREEN ....................................................................................................................................... 62
7.6.4. L1 PHASOR DIAGRAM DISPLAY SCREEN ....................................................................................................................................... 63
8. ALARM MODE ..................................................................................................................................................................................................... 64
8.1. ALARM MODE CONFIGURATION ................................................................................................................................................................. 64
8.
2. ALARM CAMPAIGN CONFIGURATION ........................................................................................................................................................... 64
8.3. CAMPAIGNS LIST .......................................................................................................................................................................................... 65
8.4. ALARMS LIST ................................................................................................................................................................................................ 65
8.5. DELETING AN ALARM CAMPAIGN ................................................................................................................................................................ 65
8.6. ERASING ALL ALARM CAMPAIGNS .............................................................................................................................................................. 65
9. TREND MODE ..................................................................................................................................................................................................... 66
9.1. CONFIGURING AND STARTING A RECORDING .......................................................................................................................................... 66
9.2. TREND MODE CONFIGURATION ................................................................................................................................................................. 66
9.3. VIEWING THE RECORDING LIST ................................................................................................................................................................. 67
9.4. DELETING RECORDINGS ............................................................................................................................................................................ 67
9.5. VIEWING RECORDS ..................................................................................................................................................................................... 67
9.5.1. RECORDING PARAMETERS ............................................................................................................................................................ 67
9.5.2. TREND GRAPHS ............................................................................................................................................................................... 68
Find Quality Products Online at: sales@GlobalTestSupply.com
www.GlobalTestSupply.com
Page 6

6
10. POWER AND ENERGY MODE .............................................................................................................................................................................. 74
10.1. 3L FILTER .................................................................................................................................................................................................... 74
10.1.1. POWERS DISPLAY SCREEN............................................................................................................................................................. 74
10.1.2. QUANTITIES ASSOCIATED WITH THE POWERS DISPLAY SCREEN ............................................................................................. 74
10.1.3. ENERGIES CONSUMED DISPLAY SCREEN ..................................................................................................................................... 75
10.1.4. ENERGIES GENERATED DISPLAY SCREEN ................................................................................................................................... 75
10.2. FILTERS L1, L2 AND L3 ............................................................................................................................................................................... 75
10.2.1. POWERS AND ASSOCIATED QUANTITIES DISPLAY SCREEN ....................................................................................................... 75
10.2.2. ENERGY METERS DISPLAY SCREEN .............................................................................................................................................. 76
10.3. FILTER Σ ..................................................................................................................................................................................................... 76
10.3.1. TOTAL POWERS AND ASSOCIATED QUANTITIES DISPLAY SCREEN ........................................................................................... 76
10.3.2. TOTAL ENERGY METERS DISPLAY SCREEN .................................................................................................................................. 77
10.4. START ENERGY METERING ...................................................................................................................................................................... 77
10.5. STOP ENERGY METERING ........................................................................................................................................................................ 78
10.6. RESET ENERGY METERING ...................................................................................................................................................................... 78
11. SCREEN SNAPSHOT MODE ................................................................................................................................................................................ 79
11.1. SCREEN SNAPSHOTS ............................................................................................................................................................................... 79
11.2. HANDLING SCREEN SNAPSHOTS ............................................................................................................................................................ 79
11.2.1. VIEWING A SNAPSHOT .................................................................................................................................................................... 79
11.2.2. DELETING A SNAPSHOT .................................................................................................................................................................. 79
12. HELP BUTTON ..................................................................................................................................................................................................... 80
13. DATAV IEW® SOF TW ARE ....................................................................................................................................................................................... 81
13.1. INSTALLING DATAVIEW
®
........................................................................................................................................................................... 81
13.2. POWERPAD III CONTROL PANEL .............................................................................................................................................................. 82
13.3. CONNECTING TO A COMPUTER ............................................................................................................................................................... 82
14. GENERAL SPECIFICATIONS ............................................................................................................................................................................... 83
14.1. ENVIRONMENTAL CONDITIONS ................................................................................................................................................................ 83
14.2. MECHANICAL CONDITIONS ....................................................................................................................................................................... 83
14.3. OVERVOLTAGE CATEGORIES PER IEC 61010-1 ...................................................................................................................................... 83
14.4. ELECTROMAGNETIC COMPATIBILITY ....................................................................................................................................................... 84
14.5. POWER SUPPLY ......................................................................................................................................................................................... 84
14.5.1. EXTERNAL POWER SUPPLY ............................................................................................................................................................ 84
14.5.2. BATTERY POWER SUPPLY .............................................................................................................................................................. 84
14.5.3. CONSUMPTION................................................................................................................................................................................. 84
14.5.4. BATTERY LIFE .................................................................................................................................................................................. 84
14.5.5. DISPLAY UNIT ................................................................................................................................................................................... 84
15. FUNCTIONAL SPECIFICATIONS.......................................................................................................................................................................... 85
15.1. REFERENCE CONDITIONS ........................................................................................................................................................................ 85
15.2. NOMINAL CURRENT ACCORDING TO TYPE OF SENSOR ....................................................................................................................... 85
15.3. ELECTRICAL CHARACTERISTICS ............................................................................................................................................................. 86
15.3.1. VOLTAGE INPUT CHARACTERISTICS ............................................................................................................................................. 86
15.3.2. CURRENT INPUT CHARACTERISTICS ............................................................................................................................................ 86
15.
3.3. BANDWIDTH ...................................................................................................................................................................................... 86
15.3.4. INSTRUMENT SPECIFICATIONS (EXCLUDING CURRENT SENSOR) ............................................................................................ 86
15.3.5. CURRENT SENSOR SPECIFICATIONS (AFTER LINEARIZATION) ................................................................................................. 95
15.4. CLASS B UNDER STANDARD IEC 61000-4-30 ........................................................................................................................................... 96
15.4.1. INSTRUMENT CONFORMITY ........................................................................................................................................................... 96
15.4.2. UNCERTAINTIES AND MEASUREMENT RANGES .......................................................................................................................... 96
15.4.3. REAL-TIME CLOCK UNCERTAINTY ................................................................................................................................................. 96
16. MAINTENANCE ..................................................................................................................................................................................................... 97
16.1. CLEANING THE CASING ............................................................................................................................................................................ 97
16.2. SENSORS.................................................................................................................................................................................................... 97
16.3. BATTERY REPLACEMENT ........................................................................................................................................................................... 97
16.4. MEMORY CARD .......................................................................................................................................................................................... 99
16.5. FIRMWARE UPDATE ................................................................................................................................................................................ 100
REPAIR AND CALIBRATION ................................................................................................................................................................................... 101
TECHNICAL AND SALES ASSISTANCE ................................................................................................................................................................. 101
LIMITED WARRAN TY ............................................................................................................................................................................................... 101
Find Quality Products Online at: sales@GlobalTestSupply.com
www.GlobalTestSupply.com
Page 7

7
1. INTRODUCTION
1.1. DELIVERY CONDITION
®
NOTE: After receiving your PowerPad
the battery indicator is accurate.
Ensure the contents shipped are consistent with the packing list. Notify your distributor of any missing items. If the equipment appears
damaged, file a claim immediately with the carrier and notify your distributor at once. Save the damaged packing container to
substantiate your claim. Do not use equipment which is damaged or appears to be damaged.
1.2. ORDERING INFORMATION
PowerPad
Includes extra-large tool bag, accessory pouch, 5 ft (1.5m) USB cable, five 10 ft black voltage leads with alligator clips, 110V US
power cord, NiMH battery, twelve color-coded input ID markers, quick start guide, high-voltage warning/caution card, and a USB drive
containing DataView
PowerPad
Includes all items listed in Cat. #2136.43 above, as well as four water-tight IP67 AmpFlex
®
III Model 8436 (No Sensors - Waterproof IP67).....................................................................................…… Cat. #2136.43
®
software and user manual
®
III Model 8436 (AmpFlex
®
- Waterproof IP67).............................................................................................. Cat. #2136.44
1.3. ACCESSORIES (not IP67)
10 ft USB cable................................................................................................................................................................... Cat. #2136.80
AC/DC Current Probe Model SL261* (10A-100mV/A, 100A-10mV/A, BNC) ..................................................................... Cat. #1201.51
*Adapter - BNC Adapter (mandatory if using an SL261 w/ the 8436)................................................................................. Cat. #2140.40
AC Current Probe Model MR193-BK.................................................................................................................................. Cat. #2140.28
AC Current Probe Model MN93-BK.................................................................................................................................... Cat. #2140.32
AC Current Probe Model SR193-BK ................................................................................................................................. Cat. #2140.33
AC Current Probe Model MN193-BK ................................................................................................................................. Cat. #2140.36
MiniFlex
AC/DC Current Probe Model J93-BK…….......................................................................................................................... Cat. #2140.49
MiniFlex
®
Sensor 10" Model MA193-10-BK ...................................................................................................... Cat. #2140.48
®
Sensor 14” Model MA193-14-BK........................................................................................................................ Cat. #2140.50
III Model 8436, charge and discharge the instrument one or two cycles to ensure
®
196A-24-BK with documentation.
1.4. REPLACEMENT PARTS
Extra Large Classic Tool Bag ............................................................................................................................................ Cat. #2133.73
Battery 9.6V NiMH.............................................................................................................................................................. Cat. #2140.19
Set of 12, Color-coded Input ID Markers ........................................................................................................................... Cat. #2140.45
5 ft USB cable..................................................................................................................................................................... Cat. #2140.46
Accessory Pouch (accessories not included) .................................................................................................................... Cat. #2140.72
Lead – One 10 ft (3M) Black Lead (Waterproof cap) {Rated 1000V CAT IV} &
One Black Alligator Clip {Rated 1000V CAT IV, 15A} ....................................................................................................... Cat. #2140.73
AmpFlex® Sensor 24" Model 196A-24-BK.......................................................................................................................... Cat. #2140.75
Power Cord 110V (IP67)..................................................................................................................................................... Cat. #5000.63
Line power cord 110-1000V DC to 440Hz.......................................................................................................................... Cat. #5000.89
Find Quality Products Online at: sales@GlobalTestSupply.com
www.GlobalTestSupply.com
Page 8

8
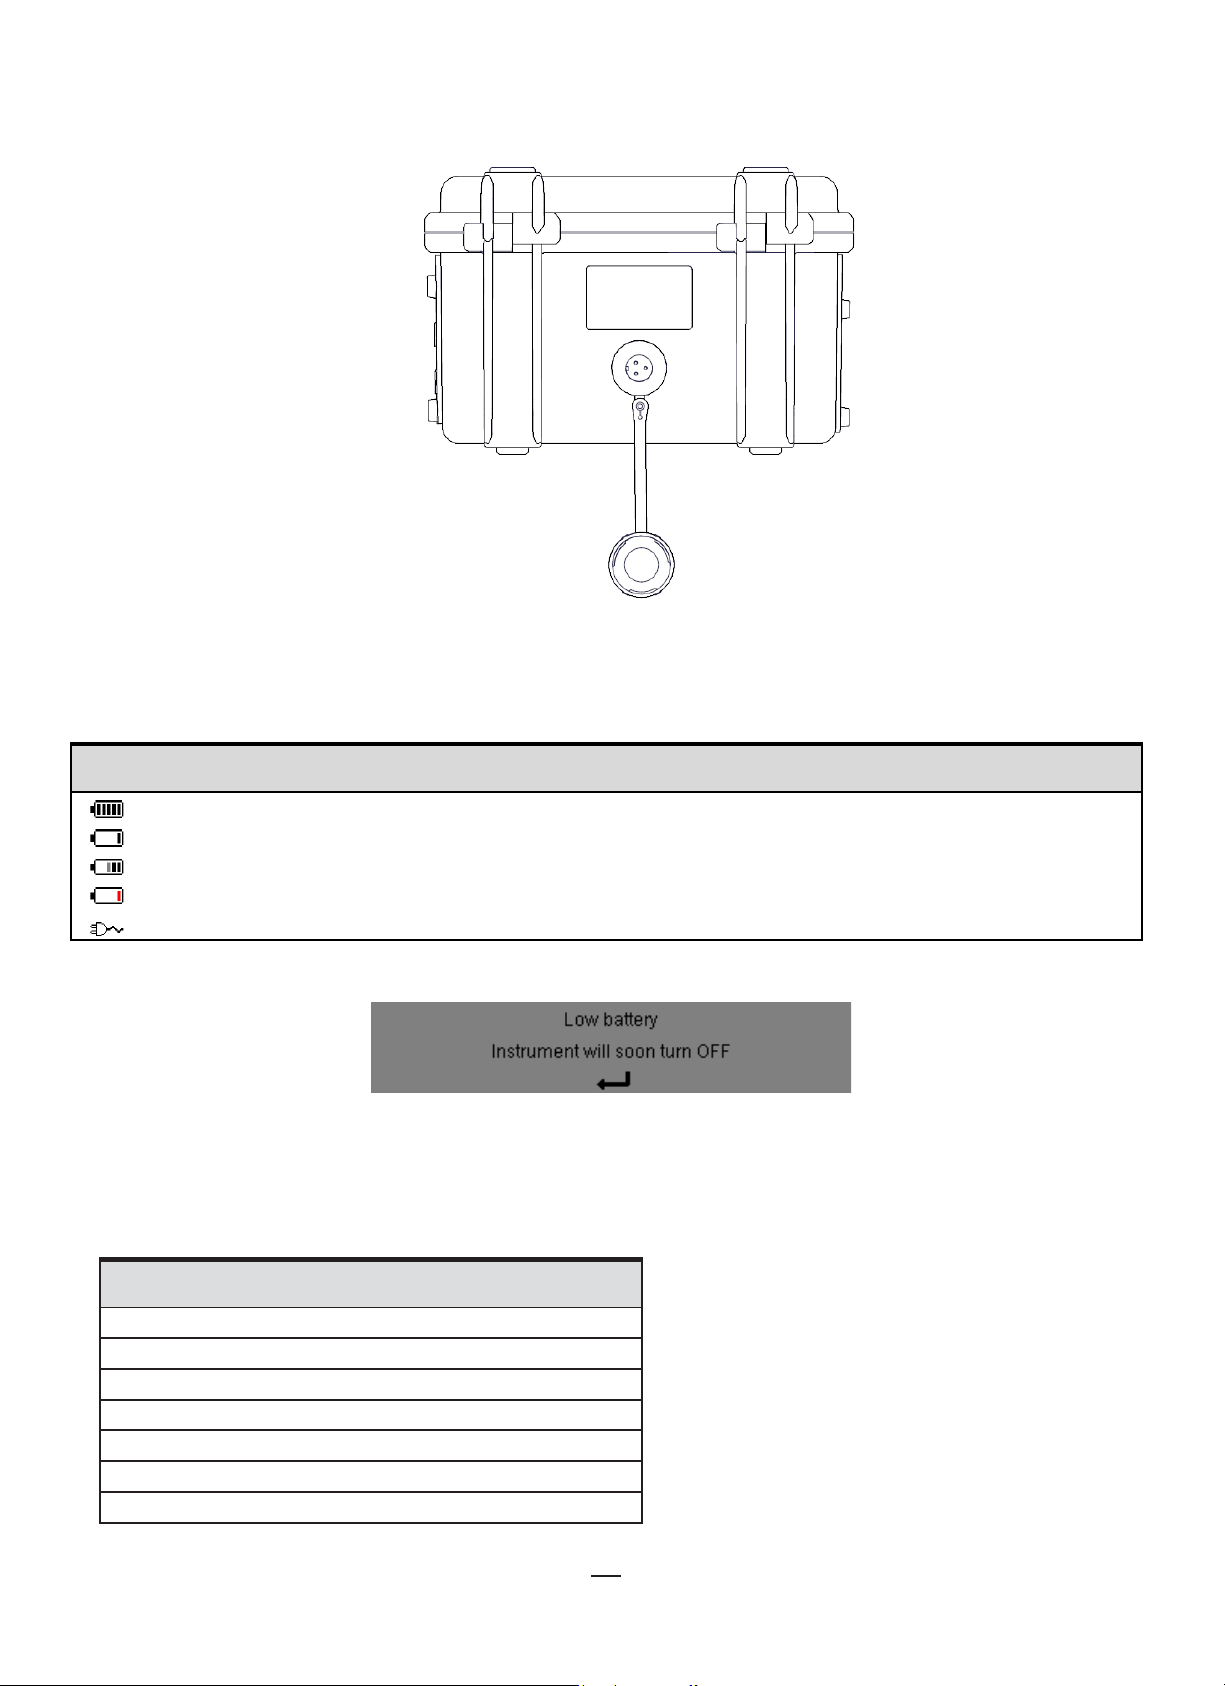
1.5. BATTERY CHARGING
230 V ± 10 %, 50 Hz
Figure 1-1
Before first use, fully charge the battery.
120 V ± 10 %, 60 Hz
It is also possible to charge the battery using the voltage on the voltage measurement terminals. To do this: with the connector cover
removed, connect the power supply cord to the battery charging connector and the two safety-series banana plugs with rear-mounted
sockets to any two of the phases (L1, L2, L3).
1. Remove the connector cover on the instrument (see Figure 1-1).
2. Connect the AC power cord and screw it in place.
3. Plug the power cord into a power outlet.
The button lights; it will go out only when the plug is disconnected.
When the battery is fully discharged, charging takes approximately 5
hours.
Figure 1-2
To make measurements while charging the battery, connect the measurement leads to the terminals and to the safety- series banana
plugs with rear-mounted sockets.
Figure 1-3
Find Quality Products Online at: sales@GlobalTestSupply.com
www.GlobalTestSupply.com
Page 9

9
1.6. LANGUAGE SELECTION
Before using the instrument, choose the language in which you want the instrument to display its messages.
1. Press the button to turn the instrument ON.
2. Press the Configuration button. This displays the Configuration menu
(Figure 1-4).
3. At the bottom of the screen are the language options. Press the function
button that corresponds with the desired language. (The selected language
appears in yellow.) If the desired language is not displayed, press the
button to view additional options.
Figure 1-4
Find Quality Products Online at: sales@GlobalTestSupply.com
www.GlobalTestSupply.com
Page 10

10
2. DESCRIPTION
2.1. FUNCTIONS
The Model 8436 a three-phase network analyzer with color graphic display and built-in rechargeable battery. The instrument:
■ measures RMS values, powers, and perturbations of electric distribution networks
■ delivers a snapshot of the principal characteristics of a three-phase network
■ tracks variations of various parameters over time
■ provides IP67 (watertight) operation
The measurement uncertainty of the Model 8436 is better than 1% (excluding uncertainties due to connected sensors). The instrument
is also versatile, with a choice of sensors providing measurements ranging from a few mA (MN193) to several kA (AmpFlex
The instrument is compact and impact resistant, with a simple and easy-to-use interface. It is designed for technicians and engineers
performing electrical network installation, inspection and maintenance.
2.1.1. MEASUREMENTS
The Model 8436 measures:
■ RMS values of AC voltages up to 1000V between terminals. By using the ratios, the instrument can measure voltages up to
hundreds of gigavolts.
■ RMS values of AC currents up to 10,000A (neutral included). By using the ratios, the instrument can measure currents up to
hundreds of kiloamperes.
■ DC components of voltages and currents (neutral included).
■ Minimum and maximum half-cycle RMS voltage and current values (excluding neutral).
■ Peak voltage and current values (neutral included).
■ Frequency of 50Hz and 60Hz networks.
■ Current and voltage peak factors (neutral included).
■ Harmonic loss factor (FHL), application to transformers in the presence of harmonic currents.
■ K factor (FK), application to transformers in the presence of harmonic currents.
■ Total harmonic distortion with respect to the fundamental (THD in %f) of the current and of the voltages (excluding neutral).
■ Total harmonic distortion with respect to the RMS AC value (THD in %r) for the current and the voltages (neutral included).
■ Active, reactive (capacitive and inductive), non-active, distortion, and apparent power, by phase and cumulative (excluding
neutral).
■ Power factor (PF) and displacement factor (DPF) or cos Φ (excluding neutral).
■ RMS distortion value (d) for the current and the voltages (excluding neutral).
■ Short-term voltage flicker (PST) (excluding neutral).
■ Long-term voltage flicker (PLT) (excluding neutral).
■ Active, reactive (capacitive and inductive), non-active, distortion, and apparent energy (excluding neutral).
■ Current and voltage harmonics (excluding neutral) up to order 50: RMS value, percentage referred to the fundamental, (%f)
(excluding neutral), or the total RMS value (%r), minimum and maximum and sequence harmonics.
■ Apparent harmonic power up to order 50 (excluding neutral): percentages referred to the fundamental apparent power (%f) or
the total apparent power (%r), minimum and maximum of a rank.
■ Inrush currents, starting of motors.
®
).
Find Quality Products Online at: sales@GlobalTestSupply.com
www.GlobalTestSupply.com
Page 11

11
2.1.2. DISPLAY FUNCTIONS
■ Waveforms (voltages and currents).
■ Frequency bar chart (voltages and currents).
■ Inrush Current function: displays parameters useful for study of the starting of a motor.
• Instantaneous current and voltage at the instant designated by the cursor.
• Maximum instantaneous absolute value of the current and of the voltage (over the entire starting time).
• RMS value of the half-cycle (or lobe) of the current and voltage (excluding neutral) on which the cursor is positioned.
• Maximum half-cycle RMS current (over the entire starting time).
• Instantaneous network frequency at the instant designated by the cursor.
• Maximum, mean, and minimum network frequencies (over the entire starting time).
• Time at which starting of motor commenced.
■ Screen captures (up to 50).
■ Transients function. Detection and recording of transients (up to 210) between user-defined start and stop dates and times.
Recording of four complete cycles (one before the triggering event and three after) in the eight acquisition channels.
■ Trend recording (data logging) function. 2GB memory with date-stamping and user-defined start and stop dates for recording,
with a maximum of 100 recordings. Display, in bar chart or graph form, of the means of many parameters vs. time, with or
without maximum and minimum values.
■ Alarm function. List of recorded alarms (up to 16,362) exceeding thresholds defined in the configuration menu. User-defined
alarm monitoring start and stop times.
2.1.3. CONFIGURATION
■ Date and time.
■ Screen brightness.
■ Graph colors.
■ Management of switching off of the screen.
■ Night mode.
■ Calculation methods (non-active quantities broken down or not, choice of the unit of energy, choice of the coefficients of
calculation of the K factor), choice of reference for the level of harmonics, PLT calculation (sliding or not).
■ Distribution system (single-phase, two-phase, three-phase with or without neutral) and of the connection method (standard,
2-element method or 2½-element method).
■ Recording, alarms, inrush currents, and transients.
■ Data erasure (total or partial).
■ Software and hardware version numbers display.
■ Language setting.
■ Display of current sensors detected not detected, not managed, simulated or impossible to simulate (2-element connection
method). Setting of voltage and current ratio, of the transduction ratios and of the sensitivity.
Find Quality Products Online at: sales@GlobalTestSupply.com
www.GlobalTestSupply.com
Page 12

12
2.2. INSTRUMENT INTERFACE
1
Cover
9
ON/OFF button
2
LCD display
10
Help button
3
Measurement connection terminals
11
Screen snapshot button
4
USB socket
12
Configuration button
5
Confirm/Enter button
13
Return /previous button
6
Navigation buttons
14
Function (yellow) buttons
7
Battery compartment and memory card slot cover
15
Battery charging connector
8
Mode buttons
Figure 2-1
Find Quality Products Online at: sales@GlobalTestSupply.com
www.GlobalTestSupply.com
Page 13

13
2.3. ON/OFF BUTTON
1
Mode icon
2
Battery charge level
3
Date/time
4
Frequency calculated over 1 second
5
Function icons
6
Active mode screen
The instrument can operate either on its battery or on external power. Pressing the button powers ON the instrument. If the instrument
is shut off suddenly (line power outage in the absence of the battery) or automatically (battery low), an information message is displayed
the next time it is started.
Pressing again turns the instrument OFF. If the instrument is recording, metering energy, or searching for transients, alarms, and/or
inrush current acquisition, it requests confirmation. Select Yes or No on the corresponding yellow button, then press the button to
validate.
■ No: recording will continue.
■ Yes: data recorded up to that point is finalized and the instrument is turned OFF.
2.4. DISPLAY
2.4.1. PRESENTATION
The backlit 320x240 (1/4 VGA) pixel graphic screen displays all measurements with their graphs, the parameters of the unit, the graphs
selected, the instantaneous values of the signals, and the type of measurement selected. When the instrument is powered ON, it initially
displays the Waveform screen (see §7).
Figure 2-2
Automatic display shutdown is configured via the Display Configuration Mode menu (see §4.4.3).
Find Quality Products Online at: sales@GlobalTestSupply.com
www.GlobalTestSupply.com
Page 14

14
2.4.2. FUNCTION BUTTONS
V
Move the cursor to the first occurrence of the
The display uses the following icons for the yellow function buttons:
Icon Function
Phase-to-neutral voltage mode.
A
S
U
var
Wh
FK
%f-%r
PLT
CF
RMS
PEAK
THD
PF…
W…
Wh…
Phase-to-neutral current mode.
Power mode.
Phase-to-phase voltage mode.
Non-active quantities.
Units of energy.
K factor coefficients.
Reference for the level of harmonics.
Long-term flicker calculation mode.
Peak factors and graphs.
RMS values and graphs.
PEAK values and graphs.
Harmonic distortion and graphs.
PF, cos Φ (DPF), tan Φ, and Φ.
Powers and associated quantities (PF, cos Φ, DPF,
tan Φ and
Energy meters.
Energy calculation activation/de-activation.
Zoom in.
Zoom out.
Display contrast.
Measurement channel colors.
Screen ON/OFF.
Night mode.
Recording configuration mode.
Recording look-up mode.
Start recording.
Rapid configuration and start of recording.
Stop recording.
Stop function in progress.
Delete.
Configuration mode
).
Φ
VA
Icon Function
>t=0<
>t=-T<
Transient list display filter activate/deactivate.
Maximum/minimum display.
Move the cursor to the first occurrence of the
maximum phase-to-neutral voltage.
Move the cursor to the first occurrence of the
minimum phase-to-neutral voltage.
Move the cursor to the first occurrence of the
maximum phase-to-phase voltage.
Move the cursor to the first occurrence of the
minimum phase-to-phase voltage.
Move the cursor to the first occurrence of the
maximum current.
Move the cursor to the first occurrence of the
minimum current.
maximum instantaneous frequency.
Move the cursor to the first occurrence of the
minimum instantaneous frequency.
Move the cursor to the first occurrence of the
maximum of the measurement displayed.
Move the cursor to the first occurrence of the
minimum of the measurement displayed.
Simultaneous display of all voltage and current
measurements (RMS, DC, THD, CF, PST, PLT, FHL,
FK).
Select all items.
Deselect all items.
Transient mode.
Inrush current mode.
Phasor diagram.
Move cursor to transient triggering time.
Move the cursor to one signal period before the
triggering date of the transient.
Energies consumed by the load.
Energies generated by the load.
Page 1 of Help.
Page 2 of Help.
Page 3 of Help.
Page 4 of Help.
Previous configuration.
Next configuration.
Previous page.
Next page.
Find Quality Products Online at: sales@GlobalTestSupply.com
www.GlobalTestSupply.com
Page 15

15
2.5. KEYPAD BUTTONS
Up arrow.
Down arrow.
Return.
2.5.1. FUNCTION (YELLOW) BUTTONS
These six buttons activate the function or tool represented by the corresponding icon on the screen.
2.5.2. NAVIGATION BUTTONS
A block of four arrow buttons, a select button and a Return button are used for navigating menus.
Button Function
2.5.3. MODE BUTTONS
These buttons display specific modes:
Button Function See
Right arrow.
Left arrow.
Confirm selection.
Waveform acquisition mode, with two sub-modes: transients mode (blackouts, interference, etc.) and
inrush current mode (starting of motor).
Harmonic graphs display mode: representation of voltage, current, and power harmonics, order by
order; determination of harmonic currents produced by nonlinear loads, analysis of problems caused
by harmonics according to their order (overheating of neutrals, conductors, motors, etc.).
Waveform display mode: display of voltage and current waveforms, display of minima and maxima
of summary tables, determination of phase rotation.
Alarm mode: list of recorded alarms exceeding selected thresholds; recording of network blackouts
with half-cycle resolution (Vrms, Arms, Urms), determination of energy consumption overshoots,
monitoring of compliance with a power supply quality contract.
§ 5
§ 6
§ 7
§ 8
Trend mode: recording of selected parameters.
Power/energy mode: display of power and energy measurements.
Three buttons are real-time mode buttons: , and .
In each of these modes, colored circles on a white background (for example ) indicate channel number or type. These indicate
saturation; the circle background is colored when the channel measured is potentially full (for instance ).
When the circle corresponds to a simulated channel (for example in 4-wire three-phase with selection V1V2, 2½-element method, or in
3-wire three-phase with selection A1A2, 2-element method; see connections in §4.6), this channel is potentially full if at least one channel
used in calculating it is potentially full.
Similarly, if the circle corresponds to a phase-to-phase voltage channel, it is potentially full if at least one of the phase- to-neutral
voltage channels used in calculating it is potentially full.
§ 9
§ 10
Find Quality Products Online at: sales@GlobalTestSupply.com
www.GlobalTestSupply.com
Page 16

16
2.5.4. OTHER BUTTONS
Function
Configuration.
Snapshot of
Help:
Button
See
§ 4
current screen and retrieval of screens already stored. § 11
provides information about the currently displayed functions and symbols. § 12
2.6. CONNECTORS
2.6.1. CONNECTION TERMINALS
These are located on one side of the housing. Each terminal is protected by a plug. The plugs must be removed to connect the leads,
then stowed in the pouch in the cover of the instrument.
To keep the instrument water- and air-tight and the terminals clean, put the plugs back on the unused terminals. The terminals let the
operator:
■ screw special leads in place to ensure total water-tightness
■ or connect standard leads that are slightly less water-tight
Four current input terminals for
current sensors (MN clamp, C
clamp, MiniFlex
clamp, SL261 clamp, etc.)
®
, AmpFlex®, PAC
Five voltage input terminals
Figure 2-3
Find Quality Products Online at: sales@GlobalTestSupply.com
www.GlobalTestSupply.com
Page 17
17
2.6.2. SIDE CONNECTORS
kilo
Mega
Tera
On the right side of the instrument is the connector used to charge the battery and operate the instrument on AC power, or supply it
from the voltages on the measurement terminals.
Figure 2-4
2.7. POWER SUPPLY
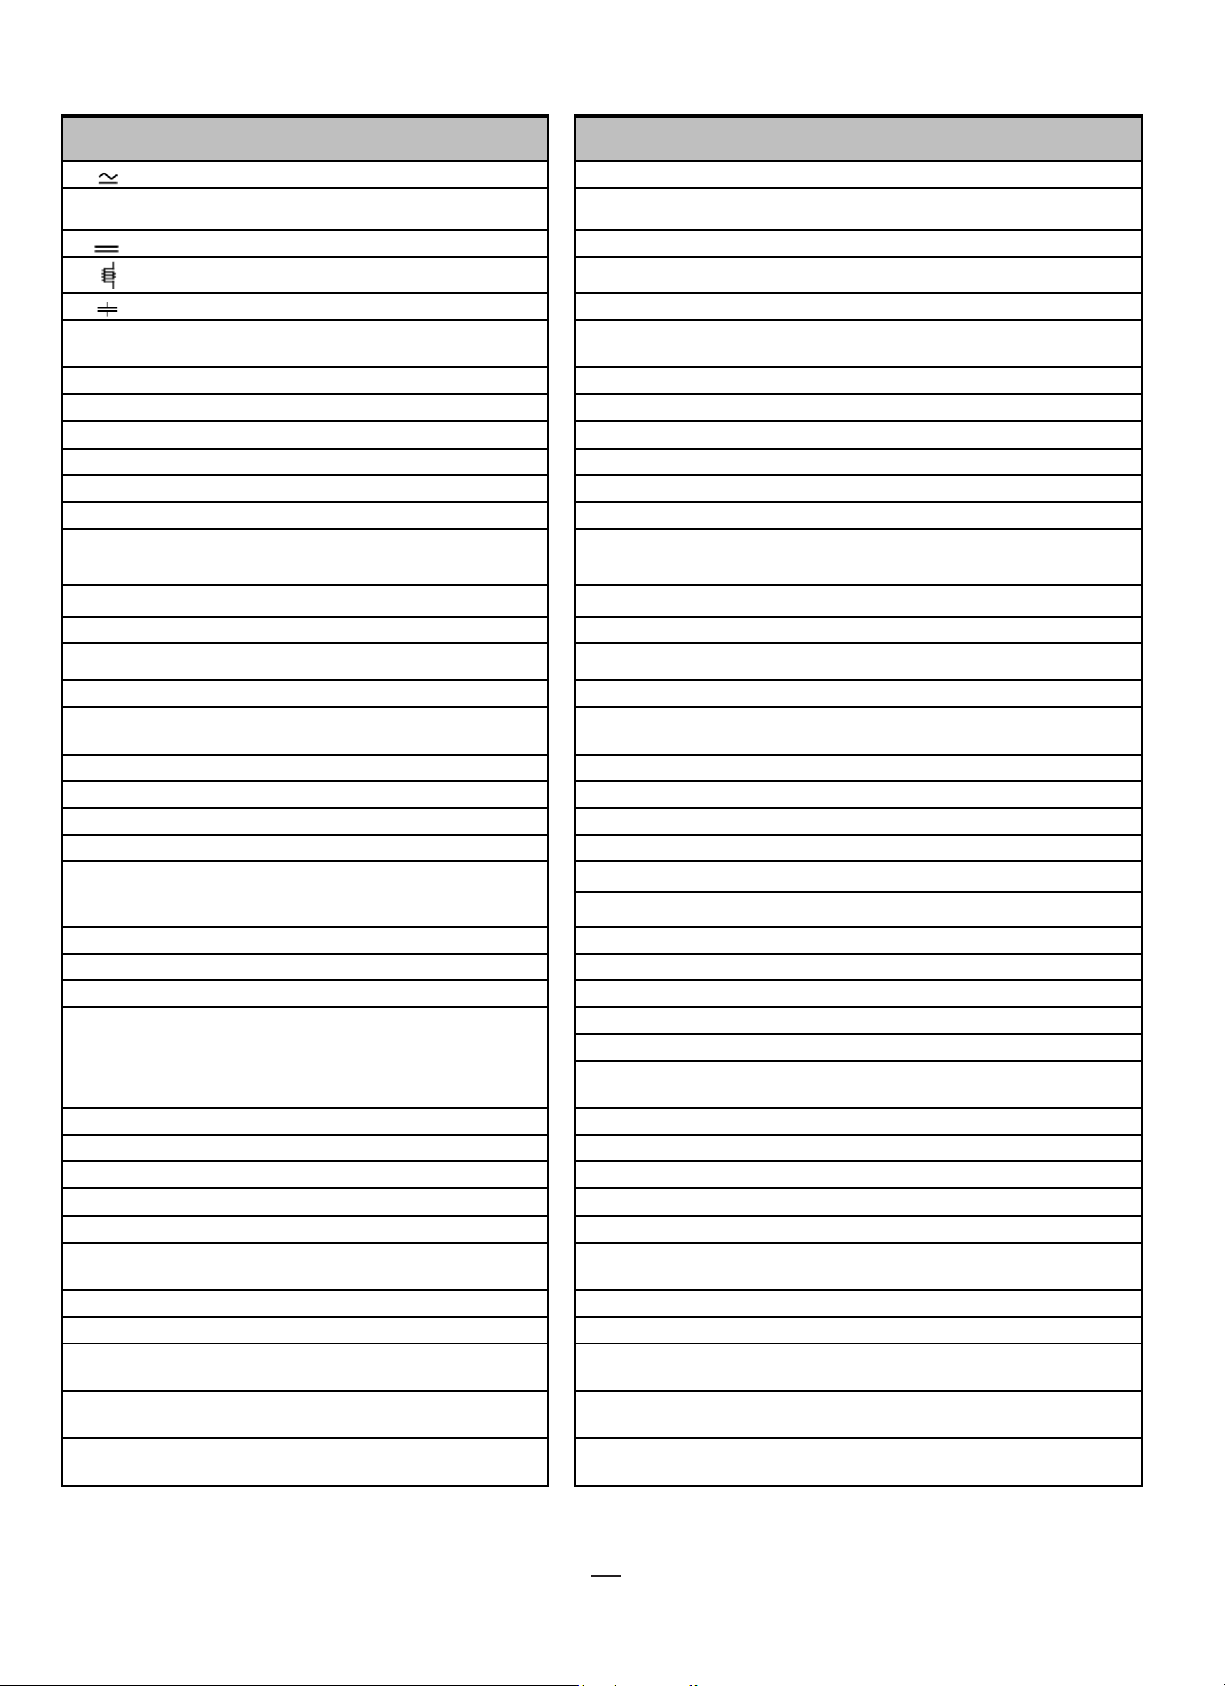
The battery icon in the top right corner of the screen shows the battery charge level. The number of bars is proportional to the charge
level.
Icon Description
Battery charged
Low battery
Moving bars: battery charging
Red bar: the condition of the battery is unknown because it has never been fully charged
The instrument is connected to external power without the battery
When instrument shutdown due to low battery is imminent, a warning message is displayed:
Press
to confirm the message. If you do not connect the instrument to external power, it turns OFF one minute after this message is
displayed. To avoid this, start re-charging the battery immediately.
2.8. ABBREVIATIONS
Prefixes of International System (SI) units:
Prefix Symbol Multiplies by
milli
Giga
Peta
Exa
m 10
k 10
M 10
G 10
T 10
P 10
E 10
-3
3
6
9
12
15
18
Find Quality Products Online at: sales@GlobalTestSupply.com
www.GlobalTestSupply.com
Page 18
18
Symbols used by the instrument:
AC and DC components.
N
Non-active power.
~
DC component only.
P
Active power.
Capacitive phase shift.
Pdch
DC energy.
Maximum (+) or minimum (-) peak instantaneous
value of the signal.
-.+
Expert mode.
PF
Power factor.
| |
Absolute value.
Ph
Active energy.
Sum of values.
PLT
Long-term flicker.
%
Percentage.
PST
Short-term flicker.
%f
Fundamental value as reference.
Q1
Reactive power (fundamental).
%r
Total value as reference.
Q1h
Reactive energy (fundamental).
UA
A-h
Current harmonic.
S-h
Apparent harmonic power.
Ad
RMS distortion current.
t Relative date of time cursor.
Tangent of the phase shift of voltage with respect to
current.
Apk+
Maximum peak value of current.
THD
Total harmonic distortion (in %f or in %r).
Apk-
Minimum peak value of current.
U Phase-to-phase voltage.
Arms
True RMS current.
U-h
Phase-to-phase voltage harmonic.
Athdf
Total harmonic distortion of current in %f.
Ucf
Phase-to-phase voltage crest factor.
Aunb
Negative-sequence current unbalance rate.
Upk+
Maximum peak value of phase-to-phase voltage.
AVG
Mean value (arithmetic mean).
Upk-
Minimum peak value of phase-to-phase voltage.
CF
Peak factor (current or voltage).
Urms
True RMS phase-to-phase voltage.
Uthdf
Total phase-to-phase voltage harmonic distortion in %f.
Uthdr
Total phase-to-phase voltage harmonic distortion in %r.
Negative-sequence phase-to-phase voltage
unbalance rate.
D
Distortion power.
V
Phase-to-neutral voltage; also Volt (unit).
DC
DC component (current or voltage).
V-h
Phase-to-neutral voltage harmonic.
Dh
Distortion energy.
Vcf
Voltage crest (peak) factor.
DPF
Displacement factor (cos Φ).
Vd
Phase-to-neutral RMS distortion voltage.
FHL
Harmonic loss factor.
Vdc
Peak factor of the phase-to-ground voltage.
Maximum peak value of the phase-to-neutral
voltage.
Hz
Frequency of network.
Vpk-
Minimum peak value of the phase-to-neutral voltage.
L
Channel (Line).
Vrms
True RMS phase-to-neutral voltage.
Total harmonic distortion of phase-to-neutral voltage
in %f.
Total harmonic distortion of phase-to-neutral voltage
in %r.
Negative-sequence phase-to-ground voltage
Symbol Definition
AC component only.
Inductive phase shift.
°
Degree.
Σ
Φ
or
VA
Φ
A
Acf
Phase shift of voltage with respect to current.
Current; also Ampere (unit).
Crest (peak) factor of current.
Symbol Definition
Nh
Pdc
PEAK or PK
RMS
S
Sh
Non-active energy.
DC power.
True RMS value (current or voltage).
Apparent power.
Apparent energy.
Adc
Athdr
cos Φ
FK
DC current.
Total harmonic distortion of the current with
the total RMS value without DC as reference.
Cosine of the phase shift of voltage with
respect to current (DPF – fundamental
power factor or displacement factor).
K factor.
tan Φ
Ud
Udc
Uunb
Vpk+
Phase-to-phase RMS distortion voltage.
Phase-to-phase DC voltage.
MAX
MIN
ms
Maximum value.
Minimum value.
Millisecond.
Vthdf
Vthdr
Vunb
unbalance rate.
Find Quality Products Online at: sales@GlobalTestSupply.com
www.GlobalTestSupply.com
Page 19

19
3. OPERATION
3.1. START-UP
To turn the instrument ON, press the button.
After the software check, the home page is displayed, followed by the information screen that indicates the software version of the
instrument and its serial number. The Waveform screen is then displayed:
Figure 3-1
3.2. CONFIGURATION
To configure the instrument:
1. Press . The Configuration screen appears (see Figure 4-1).
2. Press or to select the parameter to be modified.
3. Press to enter the selected sub-menu.
4. Use the arrow buttons ( or and or ) and the button to validate. For more details, see §§4.3 to 4.10.
The following settings must be checked (and if necessary modified) for each measurement:
■ Calculation methods (see §4.5).
■ Distribution system (single-phase to five-wire three-phase) and connection method (2 wattmeters, 2 ½ elements, standard)
(§4.6).
■ Current ratios according to the type of current sensor connected (§4.7).
■ Voltage ratios (§4.7).
■ Triggering levels (transients mode and inrush current capture) (§4.8).
■ Values to be recorded (trend mode) (§4.9).
■ Alarm thresholds (§4.10).
To return to the Configuration screen from a sub-menu, press the button.
Find Quality Products Online at: sales@GlobalTestSupply.com
www.GlobalTestSupply.com
Page 20

20
3.3. LEADS INSTALLATION
To identify the leads and input terminals, you can mark them in accordance with the usual phase/neutral color code using the colored rings
and inserts supplied with the instrument.
1. Detach the insert and place it in the hole provided for it near the terminal (large insert for a current terminal; small insert for a
voltage terminal).
Figure 3-2
2. Clip rings of the same color to the ends of the lead you will connect to the terminal. Twelve sets of rings and inserts of different
colors are provided to enable you to coordinate the instrument with any applicable phase/neutral color codes.
3. Connect the measurement leads to the instrument terminals. Be sure to define the transformation ratios of the current sensors
and of the voltage inputs (see §4.7).
To make a measurement, at a minimum you must select:
■ calculation method (§4.5)
■ connection (§4.6)
■ sensor ratios (§4.7)
The measurement leads must be connected to the electrical network to be measured as shown by the following diagrams.
Find Quality Products Online at: sales@GlobalTestSupply.com
www.GlobalTestSupply.com
Page 21

21
3.3.1. SINGLE-PHASE NETWORK
Figure 3-3 (2-wire single-phase connection)
Figure 3-4 (3-wire single-phase connection)
Figure 3-5 (2-wire split-phase connection)
Figure 3-6 (3-wire split-phase connection)
Figure 3-7 (4-wire split-phase connection)
Figure 3-8 (3-wire three-phase connection)
Figure 3-9 (4-wire three-phase
connection)
Figure 3-10 (5-wire three-phase connection)
3.3.2. SPLIT-PHASE NETWORK
3.3.3. THREE-PHASE NETWORK
When connecting to a three-phase network, you do not need to connect all terminals in voltage or current.
For 3-wire three-phase, indicate the current sensors that will be connected: all 3 sensors (3A) or only 2 (A1 and A2, or A2 and A3, or A3
and A1).
For 4- and 5-wire three-phase, indicate the voltages that will be connected: all 3 voltages (3V) or only 2 (V1 and V2, or V2 and V3, or
V3 and V1).
Find Quality Products Online at: sales@GlobalTestSupply.com
www.GlobalTestSupply.com
Page 22
22
3.3.4. CONNECTION
1. Turn the instrument ON.
2. Configure the instrument for the measurement to be made and the network type (see §4).
3. Connect the leads and current sensors to the instrument.
4. Connect the ground and/or neutral lead to the network ground and/or neutral (when it is distributed) and connect the
corresponding current sensor.
5. Connect the L1 phase lead to the network L1 phase and connect the corresponding current sensor.
6. If applicable, repeat the procedure for phases L2 and L3, and for N.
NOTE: Complying with this procedure minimizes connection errors and saves time.
Disconnection procedure:
1. Proceed in reverse order of connection, always finishing by disconnecting the neutral (when distributed).
2. Disconnect the leads and turn the instrument OFF.
3.4. INSTRUMENT FUNCTIONS
Any screen display can be saved as a “snapshot” by pressing the button for 3 seconds (see §11).
You can press the Help button at any time. The Help screen will provide information about the symbols and mode currently
displayed.
3.4.1. WAVEFORM CAPTURE
With the instrument powered up and connected to the network, press .
You can display the Transients mode (see §5.1) or the Inrush current mode (§5.2).
3.4.2. HARMONICS DISPLAY
With the instrument powered up and connected to the network, press .
You can display the phase-to-neutral voltage (see §6.1), current (§6.2), apparent power (§6.3) or phase-to- phase voltage (see §6.4).
3.4.3. WAVEFORM MEASUREMENTS
With the instrument powered up and connected to the network, press .
You can display the measurements of the true RMS value (see §7.1), total harmonic distortion (§7.2), peak factor (§7.3),
maximum/minimum voltage and current (§7.4), multiple values simultaneously (§7.5), or phasor diagram (§7.6).
3.4.4. ALARM RECORDING
With the instrument powered up and connected to the network, press .
You can configure the alarm mode (§8.1), configure an alarm campaign (§8.2), look it up (§8.4), or erase it (§8.6).
3.4.5. RECORDING
With the instrument powered up and connected to the network, press .
You can configure and start recordings (§9.1 and §9.2). You can view (§9.5) and erase (§9.4) them.
3.4.6. ENERGY MEASUREMENTS
With the instrument powered up and connected to the network, press .
You can measure the energies consumed (§10.1.3) or generated (§10.
1.4, §10.2.2, or §10.3.2).
Find Quality Products Online at: sales@GlobalTestSupply.com
www.GlobalTestSupply.com
Page 23

23
4. CONFIGURATION
The Configuration button displays the Configuration menu for configuring the instrument. This must be done before each new
type of measurement. The configuration remains in memory, even after the instrument is turned OFF.
4.1. CONFIGURATION MENU
The arrow (, , , ) buttons let you navigate the Configuration menu and select settings. A value that can be modified is identified
by arrows.
For most options, you must press the
menu from a sub-menu.
4.2. DISPLAY LANGUAGE
To select the display language, press the yellow button under the corresponding icon on the screen (Figure 4-1).
button to confirm and apply the change. Pressing the return button returns to the main
Figure 4-1
The selected language is highlighted in yellow.
4.3. DATE/TIME
The Date/Time menu sets the instrument date and time.
1. In the Configuration screen, select the Date/Time option and press
Figure 4-2
2. To change a value, press or . To move from one field to another, press or . To confirm, press
3. Use these buttons to select and set the date format (DD/MM/YY or MM/DD/YY) and time format (12/24 or AM/PM). Changes
take effect immediately.
4. To return to the Configuration menu, press .
NOTE: The date and time parameters cannot be changed while the instrument is recording, metering energy, or searching
for transients, alarms, and/or inrush current events.
. This displays the Date/Time menu.
.
Find Quality Products Online at: sales@GlobalTestSupply.com
www.GlobalTestSupply.com
Page 24

24
4.4. DISPLAY
The Display menu lets you set options that affect the instrument display screen, including:
■
Brightness level (§4.4.1)
■
Display colors (§4.4.2)
■
Automatic shutdown of screen (§4.4.3)
■
Night mode (§4.4.4)
To open Display mode, select the Display option in the Configuration screen and press
(Figure 4-3). The options at the bottom of the screen allow you to navigate to other display screens.
4.4.1. BRIGHTNESS
The Brightness menu adjusts the brightness level of the instrument display screen.
1. At the Configuration screen, select the Display option and press
Figure 4-3
2. Use the left and right ( ) buttons to change the brightness.
3. To return to the Configuration menu, press .
. This displays the Brightness screen.
. This opens the Brightness screen
4.4.2. COLORS
The Colors menu defines the colors of the voltage and current graphs.
1. In the Brightness screen (Figure 4-3), press the function button. This displays the Colors menu.
Figure 4-4
2. There are 15 colors available: green, dark green, yellow, orange, pink, red, brown, blue, turquoise blue, dark blue, very light
grey, light grey, grey, dark grey, and black. Use the arrow (, , , ) buttons to change the assignments of the colors.
3. To return to the Configuration menu, press .
4.4.3. DISPLAY SHUTDOWN
The Display Shutdown menu defines whether or not the screen automatically turns OFF after a specific period of inactivity, to save
battery power.
1. In the Brightness screen, press the function button. This displays the Display Shutdown screen.
Figure 4-5
Find Quality Products Online at: sales@GlobalTestSupply.com
www.GlobalTestSupply.com
Page 25

25
2. Use the arrow (, ) buttons to choose Automatic or Never. When Automatic is selected, the display screen turns OFF after
five minutes without button activity (if the instrument is powered only by its battery and if recording is in progress) and after
ten minutes if no recording is in progress. The ON/OFF button blinks to indicate that the instrument is still in operation.
Pressing any button on the keypad relights the screen.
3. To return to the Configuration menu, press .
4.4.4. NIGHT MODE
The Night Mode menu enables night mode. In night mode, the screen colors change to light text on a dark background for easier
viewing in low-light conditions.
1. At the Brightness screen, press the function button to display the Night Mode screen.
Figure 4-6
2. Use the navigation buttons (, ) to activate or deactivate night mode. The screen then changes to reverse video and all
colors are changed.
3. To return to the Configuration menu, press .
4.5. CALCULATION METHODS
The Calculation Methods option in the Configuration menu defines:
■ Breakdown or no breakdown of non-active quantities (§4.5.1)
■ Unit of energy (§4.5.2)
■ Coefficients of calculation for K factor (§4.5.3)
■ Reference for the level of phase harmonics (§4.5.4)
■ Method of calculation of long-term flicker (§4.5.5)
4.5.1. NON-ACTIVE QUANTITIES CALCULATION
The var Non-Active Values menu defines whether or not to break down the non-active quantities (powers and energies).
1. At the Configuration screen, select and press
2. Use the arrow (, ) buttons to select Broken down or Not broken down.
■ Broken down: Non-active power N is broken down into reactive power (fundamental) Q1 and distorting power D. Non-
active energy Nh is broken down into Q1h and Dh.
■ Not broken down: Non-active power N and non-active energy Nh are displayed.
3. Press
NOTE: You cannot change this option when the instrument is recording, metering energy, and/or searching for alarms.
to validate the selection and return to the Configuration menu.
. This displays the Non-Active Values menu.
Figure 4-7
Find Quality Products Online at: sales@GlobalTestSupply.com
www.GlobalTestSupply.com
Page 26

26
4.5.2. UNITS OF ENERGY
The Wh Energy Unit menu defines the unit of display of energies.
1. At the Non-Active Values screen (Figure 4-7), press the Wh function button to display the Energy Unit screen.
Figure 4-8
2. Use the arrow buttons (, ) to select the unit:
■ Wh: watt-hour.
■ J: joule.
■ toe (nuclear): nuclear ton oil equivalent.
■ toe (non-nuclear): non-nuclear ton oil equivalent.
■ BTU: British Thermal Unit.
3. Press
to validate the selection and return to the Configuration menu.
4.5.3. K FACTOR
The FK menu defines the coefficients used for the calculation of Factor K.
1. At the Non-Active Values screen, press the FK function button to display the Transformer Factor K screen.
Figure 4-9
2. Use the arrow buttons (, , , ) to fix the value of coefficients q and e:
■ q: exponential constant that depends on the type of winding and the frequency. The value of q can range from 1.5 to 1.7.
The value of 1.7 is suitable for transformers having round or square conductors, in all types of winding. The value of 1.5
is suitable for those in which the low-voltage windings are in tape form.
■ e: ratio between the losses linked to eddy currents (at the fundamental frequency) and resistive losses (both evaluated at
the reference temperature). The value of e can range from 0.05 to 0.1.
The default values (q = 1.7 and e = 0.10) are suitable for most applications.
3. Press
to validate the selection and return to the Configuration menu.
NOTE: You cannot change this option when the instrument is recording and/or searching for alarms.
Find Quality Products Online at: sales@GlobalTestSupply.com
www.GlobalTestSupply.com
Page 27

27
4.5.4. PHASE HARMONICS
The %f-%r Phase Harmonic Ratios menu defines the reference for the level of harmonics of the phases.
1. At the Non-Active Values screen, press the %f-%r function button to display the Phase Harmonic Ratios screen.
Figure 4-10
2. Use the arrow buttons (, ) to set the reference for harmonics:
■ %f: the reference is the value of the fundamental.
■ %r: the reference is the total value.
3. Press
For the level of harmonics of the V-h, A-h, and U-h phases, the fundamental and total values are RMS values. For the level of
harmonics of the S-h phases, the fundamental and total values are apparent power values.
to validate the selection and return to the Configuration menu.
NOTE: You cannot change this option when the instrument is recording and/or searching for alarms.
4.5.5. LONG-TERM FLICKER (PLT)
The PLT Long-Term Flicker menu defines the method used to calculate the PLT (long-term flicker).
1. At the Non-Active Values screen, press the PLT function button to display the Long-Term Flicker screen.
Figure 4-11
2. Use the arrow buttons (, ) to choose sliding or non-sliding.
■ Sliding: the PLT is calculated every 10 minutes. The first value is available 2 hours after the instrument is turned ON,
because it takes 12 values of PST to calculate the PLT.
■ Non-sliding: the PLT is calculated every 2 hours.
3. Validate by pressing the
button. The instrument returns to the Configuration menu.
NOTE: You cannot change this option when the instrument is recording and/or searching for alarms.
Find Quality Products Online at: sales@GlobalTestSupply.com
www.GlobalTestSupply.com
Page 28

28
4.6. CONNECTION
Pressing Electrical Hook-up in the Configuration menu displays the Electrical Connection screen. This defines how the instrument is
connected to different types of electrical networks.
Figure 4-12
Several electrical diagrams can be selected. Use the arrow buttons (, , , ) to choose a connection.
One or more types of network correspond to each distribution system.
Distribution system Source
Single-phase 2-wire
(L1 and N)
Single-phase 2-wire non-earthed neutral
Single-phase 3-wire
(L1, N and earth)
Split-phase 2-wire
(L1 and L2)
Single-phase 3-wire earthed neutral
Split-phase 2-wire
3-phase open star 2-wire
Find Quality Products Online at: sales@GlobalTestSupply.com
www.GlobalTestSupply.com
Page 29

29
Distribution system Source
Split-phase 3-wire non-grounded neutral
3-phase open star 3-wire non-grounded neutral
Split-phase 3-wire
(L1, L2 and N)
3-phase high leg delta 3-wire non-grounded neutral
3-phase open high leg delta 3-wire non-grounded
neutral
Split-phase 4-wire grounded neutral
Split-phase 4-wire
(L1, L2, N and earth)
3-phase open star 4-wire grounded neutral
3-phase high leg delta 4-wire grounded neutral
3-phase open high leg delta 4-wire grounded neutral
Find Quality Products Online at: sales@GlobalTestSupply.com
www.GlobalTestSupply.com
Page 30

30
Distribution system Source
3-phase star 3-wire
3-phase delta 3-wire
3-phase 3-wire
(L1, L2 and L3)
Indicate which current
sensors will be connected: all
3 (3A) or only 2 (A1 and A2, or
A2 and A3, or A3 and A1).
Three-wattmeter method with
virtual neutral (with 3 sensors
connected) or two-wattmeter
method or two-element
method or Aron method (with
2 sensors connected).
A third sensor is not
necessary if two sensors of
the same type, same range,
and same ratio are connected.
Otherwise, the third sensor
must be connected to make
current measurements.
3-phase open delta 3-wire
3-phase open delta 3-wire grounded junction of phases
3-phase open delta 3-wire grounded corner of phase
3-phase high leg delta 3-wire
3-phase open high leg delta 3-wire
Find Quality Products Online at: sales@GlobalTestSupply.com
www.GlobalTestSupply.com
Page 31

31
Distribution system Source
only 2 (V1 and V2, or V2 and
three phase voltages must be
3-phase 4-wire
(L1, L2, L3 and N)
Indicate which voltages will
be connected: all 3 (3V) or
V3, or V3 and V1).
If only two of the three
voltages are connected, the
balanced
(2½-element method)
3-phase star 4-wire non-grounded neutral
3-phase open high leg delta 4-wire non-grounded
neutral
3-phase high leg delta 4-wire non-grounded neutral
3-phase 5-wire
(L1, L2, L3, N and earth)
Indicate which voltages will
be connected: all 3 (3V) or
only 2 (V1 and V2, or V2 and
V3, or V3 and V1).
If only two of the three
voltages are connected, the
three phase voltages must
be balanced
(2½-element method)
Validate the selection with the
NOTE: You cannot change the network type when the instrument is recording, metering energy, or searching for transients,
alarms, and/or inrush current acquisitions.
3-phase star 5-wire grounded neutral
3-phase open high leg delta 5-wire grounded neutral
3-phase high leg delta 5-wire grounded neutral
button. The instrument returns to the Configuration menu.
Find Quality Products Online at: sales@GlobalTestSupply.com
www.GlobalTestSupply.com
Page 32

32
4.7. SENSORS AND RATIOS
NOTE: The ratios cannot be changed if the instrument is recording, metering energy, or searching for transients, alarms,
and/or inrush current acquisitions.
4.7.1. CURRENT SENSORS AND RATIOS
Pressing Probes and Ratios at the Configuration menu displays a menu for defining the current sensors and ratios. It
automatically displays the current sensor models detected by the instrument. If a sensor is detected but not a supported type, an
error message is displayed.
Figure 4-13
For a 3-wire three-phase set-up where only two of the three current sensors required are connected, if these two sensors are of the
same type and have the same ratio, the instrument simulates the third sensor by assuming the same characteristics as the other two.
The third sensor will be shown in the list as being simulated, or impossible to simulate otherwise.
Supported current sensors are:
MN93 clamp: 200 A.
MN193 clamp: 100 A or 5 A.
SR193 clamp: 1000 A.
J93 clamp : 3500 A.
AmpFlex®: 100, 6500 or 10000 A.
MiniFlex®: 100 or 6500 A.
MR193 clamp: 1000 A.
SL261 clamp: 100 A (sensitivity 10 mV/A).
SL261 clamp: 10 A (sensitivity 100 mV/A).
Three phase adapter: 5 A.
If an MN193 clamp (5A range), an Adapter, an AmpFlex®, a MiniFlex®, or an SL261 clamp is used, adjustment of the ratio, of the
range, or of the sensitivity is proposed automatically.
Use the arrow buttons (, , , ) to define the transformation ratios between the primary current (1A to 60,000A) and the secondary
current (1A, 2A or 5A), then validate with the
The primary current cannot be less than the secondary current.
button.
4.7.2. VOLTAGE RATIOS
The Sensors and Ratios menu also lets you set voltage ratios. The option for doing this is either U (for setups without neutral) or V (for
setups with neutral). Select the displayed option from the Current Ratios and Current Sensors menu (Figure 4-13).
Ratios are phase-to-neutral voltage ratios when there is a neutral, and phase-to-phase voltage ratios when there is not. The ratios
settings can be different or the same for all or for some channels.
Find Quality Products Online at: sales@GlobalTestSupply.com
www.GlobalTestSupply.com
Page 33

33
Figure 4-14 (Voltage Ratios screen without neutral)
Figure 4-15 (Voltage Ratios screen with neutral)
•
•
Use the arrow buttons (, ) to choose the configuration of the ratios.
■ 3U 1/1 or 4V 1/1: all channels have the same 1/1 ratio.
■ 3U or 4V: all channels have the same ratio, to be configured.
Press the
Press the
secondary voltage is in V
button, then use the , buttons to highlight the ratio in yellow.
button, then use the , , and buttons to change the ratio. The primary voltage is in kV and the
■ 3V + VN: all channels have the same ratio and the neutral has a different ratio. Proceed as when there is only one
ratio, but perform the operation twice.
■ U1+U2+U3 or V1+V2+V3+VN: each channel has a different ratio, to be configured. Proceed as when there is only one ratio,
but perform the operation several times.
Validate with the
NOTE: The primary and secondary voltages can each be configured with a multiplier factor of 1/√3.
button. To return to the Configuration menu, press .
4.8. CAPTURE MODE
The Capture mode is used to configure the voltage thresholds, the current thresholds of the transient mode, and the
current thresholds of the inrush current mode. Selecting this option displays the Voltage Thresholds menu (Figure 4-16). On the
bottom left of this screen are two function buttons:
defines thresholds for voltage (V or U, depending on setup) or current (A).
defines inrush current thresholds.
4.8.1. TRANSIENT VOLTAGE THRESHOLDS
The Voltage Thresholds menu configures the voltage thresholds. Thresholds can be configured to be the same for all channels
or different for some or all of them.
Figure 4-16
To change the voltage thresholds, press
Find Quality Products Online at: sales@GlobalTestSupply.com
. Use the arrow buttons (, ) to choose configuration of the thresholds.
www.GlobalTestSupply.com
Page 34

34
■ 4V or 3U: all channels have the same threshold.
• Press the
• Press the
button, then use the , buttons to highlight the value of the threshold in yellow.
button, then use the , , and buttons to change the threshold. The unit can be the V or the kV.
■ 3V + VN: all channels have the same ratio and the neutral has a different ratio. Proceed as when there is only one ratio, but
perform the operation twice.
■ V1+V2+V3+VN or U1+U2+U3: each channel has a different ratio, to be configured. Proceed as when there is only one ratio,
but perform the operation several times.
Validate with the
NOTE: Transient thresholds cannot be changed if the instrument is actively searching for transients.
button. To return to the Configuration menu, press .
4.8.2. TRANSIENT CURRENT THRESHOLDS
Pressing the A function button in the Voltage Threshold menu (Figure 4-16) displays the Current Thresholds menu. This configures
the current thresholds (independently of the current sensors detected by the instrument). Configured thresholds can be the same for
all channels or different for some or all of them.
Figure 4-17
To change the current thresholds, press
Use the arrow buttons (, ) to choose the configuration of the thresholds.
.
■ 4A: all current sensors have the same threshold.
• Press the
• Press the
button, then use the , buttons to highlight the value of the threshold in yellow.
button, then use the , , and buttons to change the threshold. The unit can be the A, the kA or the mA.
■ 3A + AN: all current sensors have the same threshold and the one connected to the neutral has a different threshold. Proceed
as when there is only one ratio, but perform the operation twice.
■ A1+A2+A3+AN: each current sensor has a different threshold, to be configured. Proceed as when there is only one ratio, but
perform the operation several times.
Validate with the
NOTE: Changing the thresholds in the transient mode is impossible if the instrument is searching for transients.
button. To return to the Configuration menu, press .
Find Quality Products Online at: sales@GlobalTestSupply.com
www.GlobalTestSupply.com
Page 35

35
4.8.3. INRUSH CURRENT THRESHOLDS
Figure 4-19 (Trend mode – first screen)
Figure 4-20 (Trend mode – second screen)
Pressing the function button in the Voltage Threshold menu displays the Current Thresholds Setup menu. This defines
the inrush current thresholds. To do this, you must configure the triggering threshold and the inrush current capture stopping
threshold (triggering threshold less hysteresis).
Figure 4-18
1. To change the inrush current triggering threshold, press the
2. Use the , , and buttons to change the triggering threshold. The unit can be the A, the kA, or the mA.
3. Press the
4. Use the , , and buttons to change the hysteresis and press the
5. To return to the Configuration menu, press .
NOTES: Configuring the hysteresis at 100% is equivalent to not having a stop threshold.
Changing the thresholds in inrush current mode is not possible if the instrument is in inrush current capture mode.
button, then use the , buttons to highlight the hysteresis in yellow.
button.
button to validate.
4.9. TREND MODE
Selecting Trend Mode in the Configuration menu displays the Trend Mode menu. This lets you select the measured and
calculated values (Urms, Vrms, Arms, etc.) to include in recordings ( , see §9).
There are 4 possible programmable configurations: , , , and independent of one another. To go from one to the
other, use the or button.
To select the parameter to be recorded, move the yellow cursor to the parameter using the , , and buttons, then validate with
the
button. The selected parameter is identified by a red dot. The frequency (Hz) is always selected (black spot).
NOTE: Quantities displayed in red are incompatible with the configuration chosen (connection selected, sensors
connected, ratios programmed, reference of the level of harmonics of the phases, breakdown of the non-active quantities).
For example, if no current sensor is connected; all current quantities will be in red.
To select all parameters displayed on the page, press the button. To deselect all parameters on the page, press the button.
To change configuration pages, press the or button.
Find Quality Products Online at: sales@GlobalTestSupply.com
www.GlobalTestSupply.com
Page 36

36
Recordable values are:
Upk+
Maximum peak value of phase-to-phase voltage.
Athdf
Harmonic distortion of the current with the RMS value of the fundamental as reference.
Unit Definition
Urms RMS phase-to-phase voltage.
Udc RMS phase-to-neutral voltage.
Upk- Minimum peak value of phase-to-phase voltage.
Ucf Crest (peak) factor of phase-to-phase voltage.
Uthdf Harmonic distortion of the phase-to-phase voltage with the RMS value of the fundamental as reference.
Uthdr Harmonic distortion of the phase-to-phase voltage with the total RMS value without DC as reference.
Vrms RMS phase-to-neutral voltage.
Vdc DC phase-to-neutral voltage.
Vpk+ Maximum peak value of the phase-to-neutral voltage.
Vpk- Minimum peak value of the phase-to-neutral voltage.
Vcf Crest factor of phase-to-neutral voltage.
Vthdf Harmonic distortion of the phase-to-neutral voltage with the RMS value of the fundamental as reference.
Vthdr Harmonic distortion of the phase-to-neutral voltage with the total RMS value without DC as reference.
Arms RMS current.
Adc DC current.
Apk+ Maximum peak value of the current.
Apk- Minimum peak value of the current.
Acf Crest factor of current.
Athdr Harmonic distortion of the current with the total RMS value without DC as reference.
P Active power.
Pdc DC power.
Q
Reactive power (fundamental).
1
N Non-active power.
D Distortion power.
S Apparent power.
PF Power factor.
cos Φ
tan Φ
PST Short-term flicker.
PLT Long-term flicker.
FHL Harmonic loss factor
FK K factor.
Vunb
or Uunb
Aunb Negative-sequence current unbalance factor.
Hz Network frequency.
U-h Harmonics in phase-to-phase voltage.
V-h Harmonics in phase-to-neutral voltage
A-h Harmonics in current.
S-h Harmonics in power.
Cosine of the phase shift of the voltage with respect to the current (displacement factor or fundamental power
factor – DPF).
Tangent of the phase shift of the voltage with respect to the current.
Negative-sequence phase-to-ground voltage unbalance factor (set-up with neutral).
Negative-sequence phase-to-phase voltage unbalance factor (set-up without neutral).
Find Quality Products Online at: sales@GlobalTestSupply.com
www.GlobalTestSupply.com
Page 37

37
The values U-h, V-h, A-h, and S-h involve the recording of harmonics of U, V, A, and S. You can select a range of orders of harmonics
Active alarms
Inactive alarm
Alarm not programmed
Figure 4-22
to be recorded (0 to 50) for each of these quantities. You can also specify that only odd harmonics within the selected range be
recorded.
NOTE: The level of harmonics of order 01 will be displayed only if they involve values expressed in %r.
To change an order of harmonic:
1. Select the parameter to be recorded (identified by a red spot).
2. Move the yellow cursor to the parameter using the , , and buttons, then select it by pressing the
3. Change the value using the and buttons, then validate with the
Figure 4-21
NOTE: If a recording is in progress, the associated configuration cannot be modified and the selected values are
identified by black spots.
To return to the Configuration menu, press .
button.
button.
4.10. ALARM MODE
The Alarm Mode screen defines the alarms used by the Alarm Mode function (see §7).
You can program up to 40 alarms. You can define a alarm on each of the following parameters:
Hz, Urms, Vrms, Arms, |Udc|, |Vdc|, |Adc|, |Upk+|, |Vpk+|, |Apk+|, |Upk-|, |Vpk-|, |Apk-|, Ucf, Vcf, Acf, Uthdf, Vthdf, Athdf, Uthdr,
Vthdr, Athdr, |P|, |Pdc|, |Q
without neutral), Aunb, U-h, V-h, A-h and |S-h| (see the table of abbreviations in §2.8).
To activate an alarm: Move the yellow cursor to its number using the , buttons, then select it with the
alarm is identified by a red spot. An alarm that is not configurable (indicated by “?”) cannot be activated.
To program the alarm: Move the yellow cursor using the , , and buttons, then validate with the
value, then validate again.
| or N, D, S, |PF|, |cos Φ|, |tan Φ|, PST, PLT, FHL, FK, Vunb (or Uunb for a three-phase source
1
button. The active
button. Change the
Find Quality Products Online at: sales@GlobalTestSupply.com
www.GlobalTestSupply.com
Page 38

38
To set an alarm, select the following values:
NOTE: Alarms appear in red if the configured quantity and/or target is incompatible with the selected configuration
NOTE:
■ Type of alarm.
■ Order of the harmonic (between 0 and 50), for |S-h|, A-h, U-h and V-h only.
■ Target of the alarm:
• 3L: 3 phases monitored individually
• N: monitoring of neutral
• 4L: 3 phases and neutral monitored individually
• Σ: surveillance of the value of the complete system
■ Direction of the alarm (>or <), for Hz, Urms, Vrms, Arms, |Udc|, |Vdc|, |Adc|, |Upk+|, |Vpk+|, |Apk+|, |Upk-|, |Vpk-| and
|Apk-|.
■ Triggering threshold (value and unit), for Urms, Vrms, Arms, |Udc|, |Vdc|, |Adc|, |Upk+|, |Vpk+|, |Apk+|, |Upk-|, |Vpk-|,
|Apk-|, |P|, |Pdc|, |Q
| or N, D and S.
1
■ Minimum duration above or below the alarm threshold: in minutes, seconds, or also (for Vrms, Urms and Arms
[excluding the neutral]) in hundredths of a second.
■ Hysteresis: 1%, 2%, 5% or 10%.
To go from one page to the other, press the or button.
Each overshoot of an alarm will be recorded in a campaign of alarms.
(connection selected, sensors connected, ratios programmed, or calculation methods chosen).
Alarms on the level of harmonics of order 01 apply only to values expressed in %r.
If a search for alarms is in progress, the activated alarms cannot be modified and are identified by black spots. However, new alarms
(not yet programmed or not activated) can be activated.
To return to the Configuration menu, press .
4.11. ERASE MEMORY
The Erase Memory menu partially or totally deletes the data recorded in the instrument.
Figure 4-23
To select an item to be erased, move the yellow cursor to it using the , , and buttons, then validate with the
The item to be erased is identified by a red spot.
To select all items, press .
To deselect all items, press .
To proceed with the erasure, press the button, then confirm with the
To return to the Configuration menu, press .
Which erasures are possible depends on the recordings in progress (recording, metering of energy, search for
transients, alarms, and/or inrush current acquisition).
button.
button.
Find Quality Products Online at: sales@GlobalTestSupply.com
www.GlobalTestSupply.com
Page 39

39
4.12. ABOUT
The About screen displays information concerning the instrument.
Figure 4-24
To return to the Configuration menu, press .
Find Quality Products Online at: sales@GlobalTestSupply.com
www.GlobalTestSupply.com
Page 40

40
5. WAVEFORM CAPTURE
Sub-mode indicator.
Memory indicator. The black bar
represents memory used; the white
Display list of transient searches
(see §5.1.2).
Configure a search (see §5.1.1).
menu
triggering thresholds (see §4.8).
Start a search.
Figure 5-2
The Waveform capture mode displays and captures transients and inrush currents. It contains two sub-modes:
■
Transient mode (§5.1)
■
Inrush current mode (§5.2)
Figure 5-1
To select a sub-mode, move the yellow cursor to it using the and buttons, then validate with the
To return to the Waveform capture screen, press .
button.
5.1. TRANSIENT MODE
The Transient mode is used to record transients, to look up the list of recorded searches and the list of transients they contain, or
erase them. You can record up to 7 detections and 210 transients.
When the Transient mode is invoked:
■
If no recording has been made, the Detection Schedule screen is displayed (Figure 5-2).
■
If transients have been recorded, the Detection List is displayed (Figure 5-3).
bar represents memory available.
Shortcut to the Configuration
to set the voltage and current
Find Quality Products Online at: sales@GlobalTestSupply.com
www.GlobalTestSupply.com
Page 41

41
5.1.1. CONFIGURING AND STARTING A SEARCH
Sub-mode indicator.
Memory indicator. The black bar
represents memory used; the white
.
Figure 5-3
To configure a search for a transient, enter:
■
Start date and time
■
Stop date and time
■
Number of transients to search for
■
Name of search
To change an item, move the yellow cursor to it using the and buttons, then validate with the
using the , , and buttons, then validate again.
The name can be up to 8 characters long (uppercase letters and numbers 0 through 9). Different searches can have the same name.
The last 5 names assigned (in the transient, trend, and alarm modes) are kept in memory. When a name is entered, it may then be
completed automatically.
NOTE: The start date and time must be later than the current date and time.
The stop date and time must be later than the start date and time.
When configuration is complete, start the search by pressing the button. The status bar icon blinks to indicate that the search
has started. The button replaces the button and can be used to stop the search before it is finished.
The message Detection on standby is displayed until the start time is reached. It is then replaced by the message Detection in
progress. When the stop time is reached, the Detection Schedule screen returns with the button. You can then configure another
search.
During a search for transients, only the stop date field can be modified. It is automatically highlighted in yellow.
To return to the Waveform Capture screen, press .
button. Change the value
5.1.2. DISPLAYING A TRANSIENT
To display the recorded transients, press . The Detection List screen is displayed.
bar represents memory available.
If the stop date is in red, it does not match the configured stop date, due to either:
■ power supply problem (battery low or disconnection of the instrument supplied by external power only)
■ the maximum number of transients has been reached, thereby ending the search
Find Quality Products Online at: sales@GlobalTestSupply.com
www.GlobalTestSupply.com
Page 42

42
To select a search for transients, move the cursor to it using the and buttons. The selected search is bolded. Then validate with the
Triggering channel of the transient.
Transients display filter:
4 V
one of the 4 voltage chan
displayed.
4 A
one of the 4 current chan
displayed.
L1, L2,
an event on a particular phase are
displayed (voltage or current).
N
the neutral current or neu
are displayed
Transient number.
Name of the search for transients.
the choice
of a transient list display filter.
Figure 5-4
Location in the record of the zone
displayed.
to one period of
the signal before the transient
triggering time.
triggering time.
Instantaneous value of the signals
the or button.
Figure 5-5
button. The instrument then displays a list of transients.
: all transients are displayed.
: transients triggered by an event in
nels are
: transients triggered by an event in
nels are
or L3: transients triggered by
Activates or deactivates
: transients triggered by an event on
To select a transient, move the cursor to it using the and buttons. The selected field is bolded. Then validate with the
The instrument displays the transients in the form of graphs.
Indicates number assigned to displayed
graph. In this example circle 1 is filled
Move the cursor
in to indicate channel V1 triggered
capture of the transient.
tral voltage
button.
Select graphs to display.
according to the position of the cursor
Move the cursor to the transient
NOTE: The graphs selection filter is dynamic and depends on the selected connection. For example, the filter
displays (3U, 3A) for a 3-wire three-phase set-up.
To return to the Transient list screen, press .
on the scale. To move the cursor, use
5.1.3. DELETING A SEARCH FOR TRANSIENTS
When the list of searches for transients is displayed (see Figure 5-3), select the search to be erased. Move the cursor to it using the
and buttons. The selected search is bolded. Then press the button. Press
NOTE: A search for transients can be deleted only if it is not in progress.
To return to the Waveform capture screen, press the button.
to validate or to cancel.
5.1.4. DELETE A TRANSIENT
When the list of transients in a search is displayed (see Figure 5-4), select the transient to be erased. Move the cursor to it using
the and buttons. The selected transient is bolded. Then press the button. Press to validate or to cancel.
To return to the Waveform capture screen, press the button.
Find Quality Products Online at: sales@GlobalTestSupply.com
www.GlobalTestSupply.com
Page 43

43
5.2. INRUSH CURRENT MODE
Sub-mode indicator.
If the
not available
with the configuration (connection, type
of sensors, or current
nd starting of
a capture.
Configure capture.
menu to set triggering thresholds
Start capture.
Figure 5-6
NOTE: To achieve a valid measurement, the voltage must be present and stable before starting an InRush current
measurement.
NOTE: The instrument can store only a single inrush current capture in memory. To make another capture, delete the
previous one.
The Inrush Current sub-mode lets you capture (record) inrush currents (voltage and current waveforms, network frequency,
half-cycle RMS voltages and currents except for the neutral), view, and delete the recordings.
When you open Inrush Current mode:
■ If no capture has been made, the Capture Schedule screen (Figure 5-6) is displayed.
■ If a capture has been made, then the Capture Parameters screen (Figure 5-7) is displayed.
5.2.1. CONFIGURING THE CAPTURE
triggering filter appears in red, it is
due to an incompatibility
Capture parameters (see §5.2.2).
Rapid configuration a
Shortcut to the Configuration
(§4.8).
Press the button to start recording immediately with a current threshold of 0 A and a hysteresis of 100%.
NOTE: The rapid starting of an inrush current modifies the configuration of the current threshold.
To configure a capture, enter the triggering filter (3A, A1, A2, or A3), the start date and time, and the recording mode (RMS +
PEAK or RMS only).
ratio).
■ RMS + PEAK recording mode produces a trend recording of the half-period RMS values and a trend recording of the
samples (envelopes and waveforms). The maximum duration of the recording depends on the frequency network and
is on average about one minute.
■ In RMS only recording mode, recording of samples is eliminated in favor of a longer maximum capture duration.
This mode records only the half-period RMS values and its maximum duration is about ten minutes.
To modify an item, move the yellow cursor to it using the and buttons, then validate with the
using the , , and buttons, then validate again.
button. Change the value
NOTE: You cannot configure an alarm campaign if an inrush current capture is in progress.
After configuration, start the capture by pressing the button. The status bar icon blinks to indicate that the capture has started.
The button replaces the button and can be used to stop the capture before it is finished.
The message “capture pending” is displayed until the start time is reached and the triggering conditions are satisfied. It is then
replaced by the message “capture in progress.” The memory status indicator appears at the top of the screen. This indicator
disappears when the capture is completed.
If the capture is completed with a stop event or if instrument recording memory is full, the capture stops automatically.
To return to the Waveform capture screen, press .
Find Quality Products Online at: sales@GlobalTestSupply.com
www.GlobalTestSupply.com
Page 44

44
5.2.2. CAPTURE PARAMETERS
Display in PEAK mode (see §5.2.4).
Display in RMS mode (see §5.2.3).
.
Figure 5-7
Location of the zone displayed in
the record.
MAX: maximum half-cycle RMS value
of the inrush current capture.
Reminder of number assigned to the
graph displayed.
circle 1
channel A1 triggered the inrush
current capture
Scale of values in amperes.
t: relative time position of the cursor
(t=0 corresponds to the start of the
A1, A2, A3: RMS values of currents 1,
2, and 3 in the half
position of the
Figure 5-8
To display the characteristics of the capture, press . The Capture Parameters screen is displayed.
If a capture duration is displayed in red, it has been cut short due to one of the following:
■ power supply problem (battery low)
■ memory is full
■ measurement error
■ incompatibility between the quantity monitored and the configuration of the instrument (for example removal of a current
sensor)
Choose the type of display, RMS or PEAK, by pressing the yellow button corresponding to the icon. The instrument then displays
the graphs.
NOTE: The PEAK button is not displayed when the inrush current capture recording mode is RMS only.
5.2.3. TRUE RMS CURRENT AND VOLTAGE
The RMS mode displays the record of the trend of the true half-cycle RMS current and voltage and the frequency trend graph.
The display depends on the type of selection filter:
3V: displays the 3 voltages during the inrush current capture for set-ups with neutral.
3U: displays the 3 voltages during the inrush current capture for set-ups without neutral.
3A: displays the 3 currents during the inrush current capture.
L1, L2, L3: display the current and voltage in phases 1, 2 and 3 respectively (for set-ups with neutral only).
Hz: displays the evolution of the network frequency vs. time.
Below are three examples of display.
5.2.3.1. 3A RMS display screen for a three-phase connection with neutral
In this example,
is filled in, indicating that
Time cursor. Use the or
button to move the cursor.
.
-cycle at the
inrush current capture).
Find Quality Products Online at: sales@GlobalTestSupply.com
www.GlobalTestSupply.com
cursor.
Page 45

45
5.2.3.2. 3A RMS display screen for a three-phase connection without neutral
cycle RMS
value of the inrush current capture.
or button to move the cursor.
t: relative time position of the cursor
(t=0 corresponds to the start of the
inrush current capture).
Figure 5-10
NOTE: Filters L2 and L3 display the recording of the true half-cycle RMS current and voltage of phases 2 and 3. The
Figure 5-9
5.2.3.3. L1 RMS display screen for a three-phase connection with neutral
MAX: maximum half-
Time cursor of the graph. Use the
V1: RMS value of voltage 1 in the
half-cycle at the position of the cursor.
A1: RMS value of current 1 in the halfcycle at the position of the cursor.
screen is identical to the one displayed for filter L1.
The , , and buttons move the cursor to the first occurrence of a minimum or maximum voltage or current
value.
5.2.3.4. RMS display screen in Hz for a three-phase connection without neutral
Figure 5-11
The and buttons go to the first occurrence of a minimum or maximum frequency value.
Find Quality Products Online at: sales@GlobalTestSupply.com
www.GlobalTestSupply.com
Page 46

46
5.2.4. INSTANTANEOUS INRUSH CURRENT
Location of the zone displayed in
Number assigned to the displayed
graph.
in to indicate
capture of the inrush current
Time cursor. Use the
move the cursor
Scale of values in amperes.
A1, A2, A3: instantaneous values of
currents 1,
the
t: relative time position of the cursor
(t=0 corresponds to the start of the
Figure 5-12
PEAK mode displays the envelopes and waveforms of the inrush current capture. The PEAK display of an inrush current capture
provides two possible representations:
■ envelope
■ waveform
The change from one of these representations to the other is automatic, as a function of the zoom level. If the zoom in is high
enough, the representation is of the “waveform” type.
The display depends on the type of display filter:
4V: displays the 4 voltages during the inrush current capture for set-ups with neutral (for a waveform type display only).
3U: displays the 3 voltages during the inrush current capture for set-ups without neutral (for a waveform type display only).
4A: displays the 4 currents during the inrush current capture (for a waveform type display only).
L1, L2 or L3: display the voltage and current of phases 1, 2, and 3, respectively (only for set-ups with neutral and for a waveform
type display).
N: displays the neutral current and neutral voltage during the inrush current capture (for a waveform type display only).
V1, V2, V3: displays the 3 voltages during the inrush current capture for set-ups with neutral (for an envelope type display only).
U1, U2, U3: displays the 3 voltages during the inrush current capture for set-ups without neutral (for an envelope type display only).
A1, A2, A3: displays the 3 currents during the inrush current capture (for an envelope type display only).
Below are three examples of display.
5.2.4.1. 4A PEAK display screen for a 5-wire three-phase connection
the record.
MAX |PEAK|: maximum
instantaneous absolute value of
the inrush current capture.
inrush current capture).
5.2.4.2. 3A PEAK display screen for a 3-wire three-phase connection
In this example, circle 3 is filled
channel A3 triggered
.
or button to
2, and 3 at the position of
cursor
Figure 5-13
Find Quality Products Online at: sales@GlobalTestSupply.com
www.GlobalTestSupply.com
Page 47

47
5.2.4.3. A1 PEAK display screen for a three-phase connection without neutral
MAX |PEAK|: maximum
instantaneous absolute value of the
inrush current capture.
t: relative time position of the
cursor (t=0 corresponds to the
: maximum instantaneous
cycle identified
Figure 5-14
In the example below, the image is zoomed out to the point the envelope type of display appears.
start of the inrush current capture).
A1
current of the half-
by the cursor.
Time cursor of the graph. Use the
or button to move the cursor.
Find Quality Products Online at: sales@GlobalTestSupply.com
www.GlobalTestSupply.com
Page 48

48
6. HARMONICS
Apparent power harmonics (§6.3).
F
or button to make selections.
Current harmonics (§6.2).
neutral voltage
P
(§
Figure 6-1
Information about the harmonic at
the fundamental (order 1).
Display of 3 phases 3L, of L1, L2, L3,
N, or of
connection only
the display press the or button.
H
the harmonics. The level of the
harmonic is
with respect to the fundamental or to
the total RMS value.
DC
1 to 25
When the cursor exceeds order 25,
orders 26 to 50 appear.
or button to move the cursor.
Figure 6-2
Harmonics mode displays harmonic levels of voltage, current, and apparent power, order by order. This lets you determine the
harmonic currents produced by nonlinear loads, and analyze problems caused by harmonics according to their order (overheating of
neutrals, conductors, motors, etc.).
ilters and expert mode (§6.5). Use the
hase-to-phase voltage harmonics
Phase- to-
harmonics (§6.1).
6.1. PHASE-TO-NEUTRAL VOLTAGE
The V sub-menu displays the harmonics of the phase-to-neutral voltage only for sources having a neutral.
The choice of graphs to be displayed depends on the type of connection (see §4.6):
■
Single-phase, 2-wire: no choice (L1)
■ Single-phase, 3-wire: L1, N
■ Split-phase, 3-wire: 2L, L1, L2
■ Split-phase, 4-wire: 2L, L1, L2, N
■ Three-phase, 4-wire: 3L, L1, L2, L3, -,+
■ Three-phase, 5-wire: 3L, L1, L2, L3, N, -,+
The screen captures shown as examples below are those obtained with a 5-wire three-phase connection.
6.4).
6.1.1. 3L PHASE-TO-NEUTRAL VOLTAGE HARMONICS DISPLAY SCREEN
the cursor position.
V-h03: harmonic number.
%: level of harmonics with the
fundamental RMS value as
reference (%f) or the (total) RMS
value as reference (%r).
V: RMS voltage of the harmonic
in question.
+000°: phase shift with respect to
Harmonic selection cursor. Use the
Find Quality Products Online at: sales@GlobalTestSupply.com
www.GlobalTestSupply.com
expert mode (three-phase
– see §6.5). To select
orizontal axis indicates the orders of
calculated as a percentage
: DC component.
: harmonics of order 1 to 25.
Page 49

49
6.1.2. L1 PHASE VOLTAGE HARMONICS DISPLAY SCREEN
Information about the harmonic at
Display of the 3 phases 3L, of L1, L2,
The horizontal axis indicates the
Harmonic selection
Indicator of the
higher than 25
Figure 6-3
Information about the harmonic
level of harmonics with the
fundamental RMS value as
reference (%f) or the (total) RMS
: RMS current of the harmonic
Display of the 3 phases 3L, of L1, L2,
L3, N, or of the expert mode (three
phase connection only
select the display press or .
The horizontal axis indicates the orders
of the harmonics.
shown as
the fundamental or to the total RMS.
Rang DC:
1 to 25
When the cursor exceeds order 25,
order 26 to 50 appears
or button to move the cursor.
Figure 6-4
the cursor position.
V-h03: harmonic number.
%: level of harmonics with the
fundamental RMS value as
reference (%f) or the (total) RMS
value as reference (%r).
V: RMS voltage of the harmonic
in question.
-143°: phase shift with respect to
the fundamental (order 1).
max – min: maximum and
minimum levels of the harmonic
in question. They are reset
when the harmonic number is
changed or the
THD: total harmonic distortion.
Vd: RMS distortion voltage.
NOTES: Filters L2 and L3 display the harmonics of the phase-to-neutral voltage for phases 2 and 3, respectively. The
screen is identical to the one displayed for filter L1.
There is no phase shift or distortion value for the neutral channel.
button is
pressed.
cursor. Use the or
button to move the cursor
6.2. CURRENT
The A sub-menu displays harmonics of the current.
presence of non-zero
harmonics of order
L3, N, or of the expert mode (threephase connection only - see §
select the display press or .
orders of the harmonics. The level of the
harmonic is given as a percentage with
respect to the fundamental or to the
total RMS value.
DC: DC component.
1 to 25: harmonics of order 1 to 25.
When the cursor exceeds order 25,
order 26 to 50 appears.
6.5). To
6.2.1. 3L CURRENT HARMONICS DISPLAY SCREEN
at the cursor position.
A-h05: harmonic number.
%:
value as reference (%r).
A
in question.
+179°: phase shift with respect to
the fundamental (order 1).
Harmonic selection cursor. Use the
-
– see §6.5). To
Harmonic level is
a percentage with respect to
DC component.
: harmonics of order 1 to 25.
.
Find Quality Products Online at: sales@GlobalTestSupply.com
www.GlobalTestSupply.com
Page 50

50
6.2.2. L1 CURRENT HARMONICS DISPLAY SCREEN
Information about the harmonic
Display of the 3 phases 3L, of L1, L2,
The horizontal axis indicates the
Harmonic selection cursor. Use the
Figure 6-5
NOTE: Filters L2 and L3 display the current harmonics of phases 2 and 3, respectively. The screen is identical to the one
displayed for filter L1.
Information about the harmonic at
The horizontal axis indicates the
Harmonic selection cursor. Use the
Figure 6-6
at the cursor position.
A-h05: harmonic number.
%: level of harmonics with the
fundamental RMS value as
reference (%f) or the (total) RMS
value as reference (%r).
A: RMS current of the harmonic
in question.
+178°: phase shift with respect to
the fundamental (order 1).
max – min: maximum and
minimum levels of the harmonic.
They are reset when the
harmonic number is changed or
the
button is pressed
THD: total harmonic distortion.
Ad: RMS distortion current.
There is no phase shift or distortion value for the neutral channel.
or button to move the cursor
L3, N, or of the expert mode (threephase connection only - see §
select the display press or .
orders of the harmonics. The level of
the harmonic is given as a percentage
with respect to the fundamental or to
the total RMS value.
Rang DC: DC component.
1 to 25: harmonics of order 1 to 25.
When the cursor exceeds order 25,
order 26 to 50 appears.
6.3. APPARENT POWER
The S sub-menu displays the harmonics of the apparent power, for all connections except 3-wire three-phase.
The horizontal axis indicates the orders of the harmonics. The bars of the bar chart above the horizontal centerline signify harmonic
power consumed, those below it harmonic power generated.
6.5). To
6.3.1. 3L APPARENT POWER HARMONICS DISPLAY SCREEN
the cursor position.
S-h03: harmonic number.
%: level of harmonics with the
fundamental apparent power as
reference (%f) or the (total)
apparent power as reference (%r).
+006°: phase shift of the voltage
harmonic with respect to the
current harmonic for the order in
question.
: Indicator of energy
generated for this harmonic.
: Indicator of energy
consumed for this harmonic.
or button to move the cursor
Display of the 3 phases 3L, of L1, L2
or L3. To select the display press the
or button
orders of the harmonics. The level of
the harmonic is given as a percentage
of the fundamental apparent power or
the (total) apparent power.
Rang DC: DC component.
1 to 25: harmonics of order 1 to 25.
When the cursor exceeds order 25,
order 26 to 50 appears.
Find Quality Products Online at: sales@GlobalTestSupply.com
www.GlobalTestSupply.com
Page 51

51
6.3.2. L1 APPARENT POWER HARMONICS DISPLAY SCREEN
Information about the harmonic at
Horizontal axis indicates the orders of
Harmonic selection cursor. Use the
Figure 6-7
NOTE: Filters L2 and L3 display the apparent power of the harmonics for phases 2 and 3, respectively. The screen is
identical to the one displayed for filter L1.
Information about the harmonic
or button to move the cursor
Figure 6-8
the cursor position.
S-h03: harmonic number.
%: level of harmonics with the
fundamental apparent power as
reference (%f) or the (total)
apparent power as reference (%r).
+045°: phase shift of the voltage
harmonic with respect to the
current harmonic for the order in
question.
min–max: maximum and
minimum levels of the harmonic
in question. They are reset when
the harmonic number is changed
or the
button is pressed.
or button to move the cursor
Display of the 3 phases 3L, of L1, L2 or
L3. To select the display press the or
button
the harmonics. The level of the
harmonic is given as a percentage of
the fundamental apparent power or the
(total) apparent power.
Rang DC: DC component.
1 to 25: harmonics of order 1 to 25.
When the cursor exceeds order 25,
order 26 to 50 appears.
: Indicator of energy consumed for
this harmonic
6.4. PHASE-TO-PHASE VOLTAGE
The U sub-menu is available for all connections except 2- or 3-wire single-phase. This sub-menu displays the harmonics of the phaseto-phase voltage.
6.4.1. 3L PHASE-TO-PHASE VOLTAGE HARMONICS DISPLAY SCREEN
at the cursor position.
U-h03: harmonic number.
%: level of harmonics with the
fundamental RMS value as
reference (%f) or the (total) RMS
value as reference (%r).
V: RMS voltage of the harmonic
in question.
+000°: phase shift with respect to
the fundamental (order 1).
Harmonic selection cursor. Use the
Display of the 3 phases 3L, of L1, L2
or L3. To select the display press the
or button.
Horizontal axis indicates the orders of
the harmonics. The level of the
harmonic is given as a percentage
with respect to the fundamental or to
the total RMS value.
Rang DC: DC component.
1 to 25: harmonics of order 1 to 25.
When the cursor exceeds order 25,
order 26 to 50 appears
Find Quality Products Online at: sales@GlobalTestSupply.com
www.GlobalTestSupply.com
Page 52

52
6.4.2. L1 PHASE-TO-PHASE VOLTAGE HARMONICS DISPLAY SCREEN
Information about the harmonic
Horizontal axis indicates the orders of
Harmonic selection cursor. Use the
Figure 6-9
NOTE: Filters L2 and L3 display the phase-to-phase voltage harmonics for phases 2 and 3, respectively. The screen is
identical to the one displayed for filter L1.
sequence.
Figure 6-10
at the cursor position.
Uh 03: harmonic number.
%: level of harmonics with the
fundamental RMS value as
reference (%f) or the (total) RMS
value as reference (%r).
V: RMS voltage of the harmonic
in question.
+000°: phase shift with respect
to the fundamental (order 1).
max – min: indicators of the
maxi- mum and minimum of the
level of harmonics or by
pressing the
THD: total harmonic distortion.
Ud: phase-to-phase RMS
distortion voltage.
button.
or button to move the cursor
Display of the 3 phases 3L, of L1, L2 or
L3. To select the display press the or
button.
the harmonics. The level of the harmonic
is given as a percentage with respect to
the fundamental or to the total RMS
value.
Rang DC: DC component.
1 to 25: harmonics of order 1 to 25.
When the cursor exceeds order 25,
order 26 to 50 appears.
6.5. EXPERT MODE
Expert mode is available with a three-phase connection only. It displays the influence of the harmonics on the heating of the
neutral and on rotating machines. To display Expert mode, select from a harmonics display screen by pressing the or
button. The selection is highlighted in yellow and the screen simultaneously displays Expert mode.
From this screen, two sub-menus are available:
1
V for three-phase set-ups with neutral or U for the three-phase set-up without neutral.
2
A for the expert mode in current.
NOTE: The breakdown into sequences shown below is valid only for balanced loads.
6.5.1. PHASE-TO-NEUTRAL VOLTAGE EXPERT MODE DISPLAY SCREEN
For three-phase set-ups with neutral, the V sub-menu displays the influence of the harmonics of the phase-to-neutral voltage on the
heating of the neutral and on rotating machines.
Harmonics inducing a negative
sequence.
Harmonics inducing a zero
sequence.
For three-phase set-ups without neutral, the U sub-menu displays the influence of the harmonics of the phase-to-phase voltage
on the heating of revolving machines.
Harmonics inducing a positive
%: level of harmonics with the
fundamental RMS value as reference
(%f) or the (total) RMS value as
reference (%r).
Find Quality Products Online at: sales@GlobalTestSupply.com
www.GlobalTestSupply.com
Page 53

53
6.5.2. CURRENT EXPERT MODE DISPLAY SCREEN
sequence.
Figure 6-11
The A sub-menu displays the influence of the harmonics of the current on the heating of the neutral and on rotating machines.
Harmonics inducing a negative
sequence.
Harmonics inducing a zero
sequence.
Harmonics inducing a positive
%: level of harmonics with the
fundamental RMS value as reference
(%f) or the (total) RMS value as
reference (%r).
Find Quality Products Online at: sales@GlobalTestSupply.com
www.GlobalTestSupply.com
Page 54

54
7. WAVEFORM
Maximum and minimum RMS
D
to select the display.
Peak factor (§7.3).
Total harmonic distortion (§7.2).
Simultaneous display of the following
measurements:
PST,
True RMS value (§7.1).
Phasor
Figure 7-1
The Waveform button displays current and voltage graphs, along with the values measured and those calculated from the
voltages and currents (except for power, energy, and harmonics).
This is the first display screen that appears when the instrument is powered ON.
values and peak values (§7.4).
isplay filters. Use the or button
RMS, DC, THD, CF,
PLT, FHL and FK (§7.5).
diagram of the signals (§7.6).
7.1. TRUE RMS
The RMS sub-menu displays the waveforms over one period of the signals measured and the true RMS voltage and current.
The choice of graphs to display depends on the type of connection (see §4.6):
■ Single-phase, 2-wire or Split-phase, 2-wire: no choice (L1)
■ Single-phase, 3-wire:
• RMS, THD, CF, and : 2V, 2A, L1, N
• : no choice (L1)
■ Split-phase, 3-wire:
• RMS, THD, CF, and : U, 2V, 2A, L1, L2
• : 2V, 2A, L1, L2
■ Split-phase, 4-wire:
• RMS, THD, CF, and : U, 3V, 3A, L1, L2 N
• : 2V, 2A, L1, L2
■ Three-phase, 3wire: 3U, 3A
■ Three-phase, 4-wire: 3U, 3V, 3A, L1, L2, L3
■ Three-phase, 5-wire:
• RMS, THD, CF, and : 3U, 4V, 4A, L1, L2, L3 and N
• : 3U, 3V, 3A, L1, L2 and L3
The following examples were obtained with a three-phase 5-wire connection.
Find Quality Products Online at: sales@GlobalTestSupply.com
www.GlobalTestSupply.com
Page 55

55
7.1.1. 3U RMS DISPLAY SCREEN
Instantaneous values of the signals at
the position of the cursor.
t:
U1
voltage between phases 1 and 2 (U
U2
voltage between phases 2 and 3 (U
U3
voltage between phases 3 and 1 (U
Instantaneous value cursor. Use
Figure 7-2
Instantaneous values of the signals
at the position of the cursor.
t:
period.
V1
voltage of graph 1.
V2
voltage of graph 2.
V3
voltage of graph 3.
VN
neutral voltage
Figure 7-3
Instantaneous values of the signals
at the position of the cursor.
t:
A1
A2
A3
AN
current
Voltage axis with automatic
button to move the
Figure 7-4
This screen displays the three phase-to-neutral voltages of a three-phase system.
RMS phase-to-phase voltages.
time relative to the start of the period.
Voltage axis with automatic
scaling.
the or button to move the
cursor.
: instantaneous phase-to-phase
: instantaneous phase-to-phase
: instantaneous phase-to-phase
7.1.2. 4V RMS DISPLAY SCREEN
This screen displays the three phase-to-neutral voltages and the neutral-to-earth voltage of a three-phase system.
).
12
).
23
).
31
RMS voltages.
Voltage axis with automatic
scaling.
Instantaneous value cursor. Use
the or button to move the
cursor
7.1.3. 4A RMS DISPLAY SCREEN
This screen displays the three phase currents and the neutral current of a three-phase system.
RMS currents.
scaling.
time relative to the start of the
: instantaneous phase-to-neutral
: instantaneous phase-to-neutral
: instantaneous phase-to-neutral
: instantaneous value of the
.
time relative to the start of the period.
: instantaneous current of phase 1.
: instantaneous current of phase 2.
: instantaneous current of phase 3.
: instantaneous value of the neutral
.
Instantaneous value cursor. Use
the or
cursor.
Find Quality Products Online at: sales@GlobalTestSupply.com
www.GlobalTestSupply.com
Page 56

56
7.1.4. RMS DISPLAY SCREEN FOR THE NEUTRAL
Instantaneous values of the signals at
the position of the cursor.
t:
period.
VN
AN
Figure 7-5
NOTE: Filters L1, L2, and L3 display the current and voltage in phases 1, 2, and 3, respectively. The screen is identical to
the one displayed for the neutral.
Instantaneous values of the signals at
the position of the cursor.
t:
U1
voltage between phases 1 and 2 (U
U2
voltage between phases 2 and 3 (U
U3
voltage between phases 3 and 1 (U
Instantaneous value cursor. Use
Figure 7-6
Instantaneous values of the signals at
the position of the cursor.
t:
V1
voltage of graph 1.
V2
voltage of graph 2.
V3
voltage of graph 3.
VN
voltage
Voltage axis with automatic
Instantaneous value cursor. Use
Figure 7-7
This screen displays the neutral voltage with respect to earth and the neutral current.
RMS voltage and current.
Current and voltage axis with
automatic scaling.
Instantaneous value cursor. Use
the or button to move the
cursor.
time relative to the start of the
: instantaneous neutral voltage.
: instantaneous neutral current.
7.2. TOTAL HARMONIC DISTORTION
The THD sub-menu displays the waveforms of the signals measured over one full cycle and the total voltage and current harmonic
distortion. The levels are displayed either with the fundamental RMS value as reference (%f) or with the RMS value without DC as
reference (%r), depending on which reference is chosen in the configuration menu.
7.2.1. 3U THD DISPLAY SCREEN
This screen displays the phase-to-phase voltage waveforms for one period and the total harmonic distortion values.
Harmonic distortion for each
graph.
Voltage axis with automatic
scaling.
the or button to move the
cursor.
time relative to the start of the period.
: instantaneous phase-to-phase
: instantaneous phase-to-phase
: instantaneous phase-to-phase
7.2.2. 4V THD DISPLAY SCREEN
This screen displays the phase-to-neutral voltage waveforms for one period and the total harmonic distortion values.
Harmonic distortion for each
graph.
scaling.
the or button to move the
cursor.
time relative to the start of the period.
: instantaneous phase-to-neutral
: instantaneous phase-to-neutral
: instantaneous phase-to-neutral
: instantaneous value of the neutral
.
).
12
).
23
).
31
Find Quality Products Online at: sales@GlobalTestSupply.com
www.GlobalTestSupply.com
Page 57

57
7.2.3. 4A THD DISPLAY SCREEN
Instantaneous values of the signals at
the position of the cursor.
t:
period.
A1
A2
A3
AN
neutral current
Current axis with automatic
Instantaneous value cursor. Use
Figure 7-8
Instantaneous values of the signals at
the
t:
U1
voltage
U2
voltage
U3
voltage
Figure 7-9
Instantaneous values of the signals at
the position of the cursor.
t
V1
voltage of graph 1.
V2
voltage of graph 2.
V3
voltage of graph 3.
VN
to
Figure 7-10
This screen displays the phase current waveforms for one period and the total harmonic distortion values.
Harmonic distortion for each
the or button to move the
NOTE: Filters L1, L2, L3 and N display the total current and voltage harmonic distortion for phases 1, 2 and 3 and the
neutral channel.
graph.
scaling.
cursor.
time relative to the start of the
: instantaneous current of phase 1.
: instantaneous current of phase 2.
: instantaneous current of phase 3.
: instantaneous value of the
.
7.3. PEAK FACTOR
The CF sub-menu displays the waveforms of the signals measured over one period and the voltage and current peak factors.
7.3.1. 3U CF DISPLAY SCREEN
This screen displays the phase-to-phase voltage waveforms of one period and the peak factors.
Peak factor for each graph.
Voltage axis with automatic
scaling.
Instantaneous value cursor. Use
the or button to move the
cursor.
7.3.2. 4V CF DISPLAY SCREEN
This screen displays the phase-to-neutral voltage waveforms of one period and the peak factors.
Peak factor for each graph.
Voltage axis with automatic
scaling.
Instantaneous value cursor. Use
the or button to move the
cursor.
position of the cursor.
time relative to the start of the period.
: instantaneous phase-to-phase
between phases 1 and 2 (U12).
: instantaneous phase-to-phase
between phases 2 and 3 (U23).
: instantaneous phase-to-phase
between phases 3 and 1 (U31).
: time relative to the start of the period.
: instantaneous phase-to-neutral
: instantaneous phase-to-neutral
: instantaneous phase-to-neutral
: instantaneous value of the phase-
-neutral voltage of the neutral.
Find Quality Products Online at: sales@GlobalTestSupply.com
www.GlobalTestSupply.com
Page 58

58
7.3.3. 4A CF DISPLAY SCREEN
Instantaneous values of the signals at
the position of the cursor.
t
A1
A2
A3
AN
of the neutral.
Figure 7-11
NOTE: L1, L2, L3 and N display the current and voltage peak factors for phases 1, 2 and 3, respectively and the neutral
channel.
NOTE: The MAX and MIN RMS measurements are calculated every half cycle (i.e. every 10 ms for a 50-Hz signal). The
measurements are refreshed every 250 ms.
Columns of values for each graph (1, 2, and 3).
This screen displays the current waveforms of one period and the peak factors.
Peak factor for each graph.
: time relative to the start of the period.
Current axis with automatic
scaling.
Instantaneous value cursor. Use
the or button to move the
cursor.
: instantaneous current of phase 1.
: instantaneous current of phase 2.
: instantaneous current of phase 3.
: instantaneous value of the current
7.4. MAX - MIN AND MEAN VOLTAGE AND CURRENT
The sub-menu displays the one-second mean and half-cycle maximum and minimum RMS voltage and current and the
instantaneous positive and negative peak voltage and current.
The RMS measurements are calculated over one second.
7.4.1. 3U MAX-MIN DISPLAY SCREEN
This screen displays the one-second mean and half-cycle maximum and minimum RMS values and the positive and negative
phase-to-phase voltage peaks.
MAX: maximum RMS phase-to-phase voltage since the instrument was turned ON or
since the last time the
RMS: true RMS phase-to-phase voltage.
MIN: minimum RMS phase-to-phase voltage since the instrument was turned ON or
since the last time the
PK+: maximum (positive) peak phase-to-phase voltage since the instrument was
turned ON or since the last time the
PK-: minimum (negative) peak phase-to-phase voltage since the instrument was
turned ON or since the last time the
Figure 7-12
button was pressed.
button was pressed.
button was pressed.
button was pressed.
Find Quality Products Online at: sales@GlobalTestSupply.com
www.GlobalTestSupply.com
Page 59

59
7.4.2. 4V MAX.-MIN. DISPLAY SCREEN
Columns of values for each voltage graph (1, 2 and 3).
Column of values for the neutral: RMS, PEAK+ and PEAK- parameters.
Columns of values for each current graph (1, 2 and 3).
was pressed.
The same information as for the phase-to-neutral voltage, but for the current.
Column of voltage values.
NOTE: L2 and L3 display the RMS, maximum, minimum, and mean values and the positive and negative peak values of the
phase- to-neutral voltage and of the current for phases 2 and 3, respectively.
This screen displays the one-second mean and half-cycle maximum and minimum RMS values and the positive and negative peaks
of the phase-to-neutral voltages and of the neutral.
Column of values for the neutral: RMS, PEAK+ and PEAK- parameters.
MAX: maximum RMS phase-to-neutral voltage since the instrument was turned ON or
since the last time the
RMS: true RMS phase-to-neutral voltage.
MIN: minimum RMS phase-to-neutral voltage since the instrument was turned ON or
since the last time
PK+: maximum peak phase-to-neutral voltage since the instrument was turned ON or
since the last time
PK-: minimum peak phase-to-neutral voltage since the instrument was turned ON or
since the last time
Figure 7-13
button was pressed.
was pressed.
was pressed.
was pressed.
7.4.3. 4A MAX.-MIN. DISPLAY SCREEN
This screen displays the one-second mean and half-cycle maximum and minimum RMS values and the positive and negative peak
values of the phase and neutral currents.
MAX: maximum RMS current since the instrument was turned ON or since the last
time
was pressed.
RMS: true RMS current.
MIN: minimum RMS current since the instrument was turned ON or since the last time
was pressed.
PK+: maximum peak current since the instrument was turned ON or since the last time
was pressed.
PK-: minimum peak current since the instrument was turned ON or since the last time
Figure 7-14
7.4.4. L1 MAX.-MIN. DISPLAY SCREEN
This screen displays the one-second mean and half-cycle maximum and minimum RMS values and the positive and negative peaks
of the phase-to-neutral voltage and of the current of phase 1.
MAX: maximum RMS phase-to-neutral voltage since the instrument was turned ON or
since the last time
RMS: true RMS phase-to-neutral voltage.
MIN: minimum RMS phase-to-neutral voltage since the instrument was turned ON or
since the last time
PK+: phase-to-neutral maximum peak voltage since the instrument was turned ON or
since the last time
PK-: phase-to-neutral minimum peak voltage since the instrument was turned ON or
since the last time
Figure 7-15
was pressed.
was pressed.
was pressed.
was pressed
Find Quality Products Online at: sales@GlobalTestSupply.com
www.GlobalTestSupply.com
Page 60

60
7.4.5. NEUTRAL MAX.-MIN. DISPLAY SCREEN
The
but for the
Figure 7-16
Column of phase-to-phase voltages (phases 1, 2, and 3).
Column of RMS and DC values along with the CF and the
This screen displays the RMS values and the positive and negative peaks of the neutral relative to earth.
Column of voltage values.
RMS: true RMS voltage.
PK+: maximum peak voltage
since the instrument was turned
ON or since the last time the
button was pressed.
PK-: minimum peak voltage
since the instrument was turned
ON or since the last time the
button was pressed
same information as for the voltage,
current.
7.5. SIMULTANEOUS DISPLAY
The sub-menu displays all of the voltage and current measurements (RMS, DC, THD, CF, PST, PLT, FHL and FK).
7.5.1. 3U SIMULTANEOUS DISPLAY SCREEN
This screen displays the RMS, DC, THD, and CF values of the phase-to-phase voltages.
RMS: true RMS value calculated over 1 second.
DC: DC component.
THD: total harmonic distortion with the fundamental RMS
value as reference (%f) or with the total RMS value without
DC as reference (%r).
CF: peak factor calculated over 1 second.
7.5.2. 4V SIMULTANEOUS DISPLAY SCREEN
This screen displays the RMS, DC, THD, CF, PST and PLT values of the phase-to-neutral voltages and of the neutral.
THD (%r) concerning the neutral.
Column of voltages simple (phases 1, 2, and 3).
RMS: true RMS value calculated over 1 second.
DC: DC component.
THD: total harmonic distortion with the fundamental RMS
value as reference (%f) or with the total RMS value
without DC as reference (%r).
CF: peak factor calculated over 1 second.
PST: short-term flicker calculated over 10 minutes.
PLT: long-term flicker calculated over 2 hours.
Figure 7-17
Figure 7-18
Find Quality Products Online at: sales@GlobalTestSupply.com
www.GlobalTestSupply.com
Page 61

61
7.5.3. 4A SIMULTANEOUS DISPLAY SCREEN
Column of RMS values and (if the current sensor allows)
the neutral.
harmonics.
Column of voltage values simple.
: true RMS value calculated
over 1 second.
DC component.
: total harmonic distortion
value
value without DC as
(%r).
: peak factor calculated over 1
second.
term flicker calculated
over 10 minutes.
term flicker calculated
over 2 hours.
Current column.
Figure 7-20
NOTE: The DC value of the current of phase 1 is displayed only if the associated current sensor can measure direct
current. L2 and L3 provide the simultaneous display of the current and voltage for phases 2 and 3, respectively.
This screen displays the RMS, DC (only if at least one of the current sensors can measure direct current), THD, CF, FHL and FK
values of the phase and neutral currents.
DC values along with the CF and the THD (%r) concerning
Columns of current values (phases 1, 2 and 3).
RMS: true RMS value calculated over 1 second.
DC: DC component.
THD: total harmonic distortion with the fundamental RMS
value as reference (%f) or with the total RMS value
without DC as reference (%r).
CF: peak factor calculated over 1 second.
FHL: harmonic loss factor. For the oversizing of
transformers to allow for harmonics.
FK: K factor. Derating of the transformer as a function of the
Figure 7-19
NOTE: To make it possible to adjust the zero of current sensors measuring DC, the DC values are never cancelled.
7.5.4. L1 SIMULTANEOUS DISPLAY SCREEN
This screen displays the RMS, DC, THD, and CF values of the phase-to-neutral voltage and of the current, PST and PLT of the phaseto-neutral voltage, and FHL and FK of the current for phase 1.
RMS
DC:
THD
with the fundamental RMS
as reference (%f) or with the total
RMS
reference
CF
PST: short-
PLT: long-
RMS, DC (if the current sensor allows), THD and CF values.
FHL: harmonic loss factor. For the
oversizing of transformers to allow for
harmonics.
FK: K factor. Derating of the
transformer as a function of the
harmonics.
7.5.5. SCREEN FOR SIMULTANEOUS DISPLAY OF NEUTRAL
This screen displays the RMS, THD and CF voltage and current of the neutral, the DC component of the neutral voltage, and (if
the current sensor allows) the DC component of the neutral current.
Find Quality Products Online at: sales@GlobalTestSupply.com
www.GlobalTestSupply.com
Page 62

62
7.6. PHASOR DIAGRAM
NOTE: To allow the display of all vectors, those of which the modulus is too small to be pictured are displayed with their
names followed by an asterisk (*).
Column of values for each vector
Phasor diagram.
Vunb: negative-sequence voltage
Figure 7-21
The Phasor sub-menu displays a vector representation of the fundamentals of the voltages and currents. It indicates their
associated quantities (modulus and phase of the vectors) and the negative-sequence voltage and current unbalance rates.
7.6.1. 3V PHASOR
This screen displays a vector representation of the fundamentals of phase-to-neutral voltages and currents. It indicates their
associated quantities (modulus and phase of the phase-to-neutral voltage vectors) and the negative-sequence voltage unbalance rate.
The reference vector of the representation (at 3 o’clock) is V1.
(1, 2, and 3).
|V1|, |V2| and |V3|: module of
the vectors of the fundamentals
of the phase-to-neutral voltages
(phases 1, 2 and 3).
Φ
: phase angle of the
12
fundamental of phase 1 with
respect to the fundamental of
phase 2.
Φ
: phase angle of the
23
fundamental of phase 2 with
respect to the fundamental of
phase 3.
: phase angle of the
Φ
31
fundamental of phase 3 with
respect to the fundamental of
phase 1.
unbalance rate.
Indicators showing potential saturation
of the channel.
7.6.2. 3U PHASOR DIAGRAM DISPLAY SCREEN
This screen displays a vector representation of the fundamentals of the phase-to-phase voltages and of the currents. It indicates their
associated quantities (modulus and phase of the phase-to-phase voltage vectors) and the negative-sequence voltage unbalance rate.
The reference vector of the representation (at 3 o’clock) is U1.
The information displayed is identical to that described in §7.6.1 but relative to the phase-to-phase voltage.
7.6.3. 3A PHASOR DIAGRAM DISPLAY SCREEN
For sources having a neutral, this screen displays the vector representation of the fundamental component of the phase-to-neutral
voltages and of the current. For 3-wire three-phase (source without neutral), this screen displays only the vector representation of the
fundamental components of the current. It indicates their associated quantities (modulus and phase of the current vectors) and
negative-sequence current unbalance rate. The reference vector of the representation (at 3 o’clock) is A1.
The information displayed is identical to that described in §7.6.1 but relative to the current.
Find Quality Products Online at: sales@GlobalTestSupply.com
www.GlobalTestSupply.com
Page 63

63
7.6.4. L1 PHASOR DIAGRAM DISPLAY SCREEN
|V1|: modulus of the vector of
phase 1.
Indicators showing potential saturation
of the channel
ΦVA: phase angle of the
Figure 7-22
NOTE:
| U1|: modulus of the vector of
phase 1.
Indicators showing potential saturation
of the channel
ΦUA: phase shift of the
phase 1.
Figure 7-23
In the presence of the neutral, this screen displays a vector representation of the fundamentals of the phase-to-neutral voltages and
the currents of one phase. It indicates their associated quantities (modulus and phase of the current and phase-to-neutral voltage
vectors). The reference vector of the representation (at 3 o’clock) is the current vector.
the fundamental of the phase-to-
neutral voltage of phase 1.
|A1|: modulus of the vector of
the fundamental of the current of
fundamental of the phase-to-
neutral voltage of phase 1
relative to the fundamental of
the current of phase 1.
In the absence of the neutral (2-wire two-phase):
L2 and L3 display vector representations of the fundamentals of the phase-to-neutral voltages and the currents of
phases 2 and 3, respectively. They indicate their associated quantities (modulus and phase of the current and phase-toneutral voltage vectors of phases 2 and 3, respectively). The reference vector of the representation (at 3 o’clock) is the
current vector (A2 and A3, respectively).
.
the fundamental component of
the phase-to-phase voltage
between phases 1 and 2 (U
|A1|: modulus of the vector of
the fundamental of the current of
fundamental component of the
phase-to-phase voltage
between phases 1 and 2 (U
with respect to the fundamental
component of the current of
).
12
12
.
)
Find Quality Products Online at: sales@GlobalTestSupply.com
www.GlobalTestSupply.com
Page 64

64
8. ALARM MODE
List of alarm campaigns (§8.3).
Access to Alarm mode
Configure
Figure 8-1
The Alarm mode detects overshoots of thresholds on each of the following parameters: Hz, Urms, Vrms, Arms, |Udc|, |Vdc|,
|Adc|, |Upk+|, |Vpk+|, |Apk+|, |Upk-|, |Vpk-|, |Apk-|, Ucf, Vcf, Acf, Uthdf, Vthdf, Athdf, Uthdr, Vthdr, Athdr, |P|, |Pdc|, |Q
|PF|, |cos Φ|, |tan Φ|, PST, PLT, FHL, FK, Vunb, Uunb (for a three-phase source without neutral) Aunb, U-h, V-h, A-h and |S-h|
(see the table of abbreviations in §2.8).
The alarm thresholds must be:
■ configured in the Configuration / Alarm mode screen (see §4.10)
■ active (marked with a red spot on that same screen)
Stored alarms can subsequently be uploaded to a computer via the DataView PowerPad III Control Panel software (see §13). You
can capture over 16,000 alarms.
configuration (see §8.1).
an alarm campaign (§8.2).
| or N, D, S,
1
The and icons have the following functions:
Validating the programming of a campaign and starting the alarm campaign.
Voluntary stopping alarm campaign.
8.1. ALARM MODE CONFIGURATION
The submenu displays the list of configured alarms (see §4.10). This shortcut button lets you define or change alarm
configurations. The following information is displayed.
Press to return to the Detection Schedule screen.
8.2. ALARM CAMPAIGN CONFIGURATION
The Detection Schedule submenu specifies the start and stop times for an alarm campaign (see Figure 8-1).
To program an alarm campaign, enter the start date and time, the stop date and time, and the name of the campaign.
To modify an item, move the yellow cursor to it using the and buttons, then validate with the
the , , and buttons, then validate again.
The name can be up to 8 characters long (uppercase letters and numbers 0 through 9). Several campaigns may have the same
name. The last 5 names given (in the transient, trend, and alarm modes) are kept in memory. When a name is entered, it may then
be completed automatically.
NOTE: The start date and time must be later than the current date and time.
The stop date and time must be later than the start date and time.
It is not possible to configure an alarm campaign if an inrush current capture is in progress.
After configuration, start the campaign by pressing the button. The status bar icon blinks to indicate that the campaign has
started. The button replaces the button and can be used to stop the campaign before it is finished. Alarms in progress are
recorded in the campaign if their duration is equal to or greater than their configured minimum duration.
The Campaign on standby message is displayed until the start time is reached. It is then replaced by the message Campaign
running. When the stop time is reached, the Detection Schedule screen returns with the button. You can then program another
campaign.
During an alarm campaign, only the stop date field can be modified. It is automatically highlighted in yellow.
Find Quality Products Online at: sales@GlobalTestSupply.com
www.GlobalTestSupply.com
button. Change the value using
Page 65

65
8.3. CAMPAIGNS LIST
Name of the campaign.
Start date and time of the
Stop date and time of the campaign.
Figure 8-2
Amount of memory dedicated to
.
Alarm duration.
Alarm date and time.
Minimum or maximum of alarm
detected (
configured
Target of the alarm detected.
C
on the connection chosen
Type of alarm detected.
Figure 8-3
To display the list of campaigns performed, press the button. The Detection List screen is displayed. The list can contain up
to 7 campaigns.
campaign.
If the stop date of the campaign is in red, it does not match the stop date initially configured, either because:
■
power supply problem (battery low or disconnection of the instrument supplied by mains only)
■
memory is full
8.4. ALARMS LIST
To select a campaign, move the cursor to it using the and buttons. The selected name is bolded. Then select it with the
button. The instrument then displays the alarms in list form.
alarms
hoice of filter is dynamic. It depends
If an alarm duration is displayed in red, it was cut short due to:
■
Power supply problem (battery low).
■
Manual stopping campaign (by pressing ) or turning OFF the instrument (by pressing ).
■
Memory is full.
■
Measurement error.
■
Incompatibility between the quantity monitored and the configuration of the instrument (for example withdrawal of a
current sensor).
In the last two cases, the minimum and maximum are also displayed in red. To return to the Detection List screen, press .
depending on the
alarm direction).
8.5. DELETING AN ALARM CAMPAIGN
When the list of campaigns performed is displayed (see Figure 8-3), select the campaign to be erased. This is done by moving the
cursor to it using the and buttons. The selected campaign is bolded.
Then press the button. Press
to validate or to cancel.
NOTE: It is not possible to delete an alarm campaign in progress.
8.6. ERASING ALL ALARM CAMPAIGNS
Erasing all alarm campaigns is possible only from the Configuration menu, in the Erase Memory sub-menu (see §4.11).
Find Quality Products Online at: sales@GlobalTestSupply.com
www.GlobalTestSupply.com
Page 66

66
9. TREND MODE
Memory card usage.
List of records (§9.3).
and starting of
recording (see §9.1).
Configuring a recording (§9.1).
Access to Trend mode
.
Starting a recording (
Figure 9-1
The Trend mode records changes to parameters previously specified in the Trend Mode screen in the Configuration menu (see
§4.9). This mode manages up to 2 GB of data.
Rapid configuring
configuration (§4.9)
§9.1).
9.1. CONFIGURING AND STARTING A RECORDING
The Recording Schedule submenu specifies the characteristics of a recording (see Figure 9-1).
To start a recording immediately, press the button. Recording starts immediately; all measurements are recorded every second
until the memory or completely full. The configuration displayed is .
To configure a recording, before starting it choose configuration to , enter the start date and time, the stop date and time,
the period, and the name of the recording.
To modify a setting, move the yellow cursor to it using the and buttons, then validate with the
using the , , and buttons, then validate again.
The Period setting is the time over which the measurements of each recorded value are averaged (arithmetic mean). Possible
values are: 1 s, 5 s, 20 s, 1 min, 2 min, 5 min, 10 min and 15 min.
The name can be up to 8 characters long (uppercase letters and numbers 0 through 9). Several recordings may have the same
name. The last 5 names given (in the transient, trend, and alarm modes) are kept in memory. When a name is entered, it may then
be completed automatically.
NOTE: The start date and time must be later than the current date and time.
button. Change the value
The stop date and time must be later than the start date and time.
After configuration, start recording by pressing the button. If not enough memory is available, the instrument displays a message
informing you of this. The status bar icon blinks to indicate that recording has begun. The button replaces the button and
can be used to stop the recording before it is finished.
The Recording on standby message is displayed until the start time is reached. It is then replaced by the message Recording
running. When the stop time is reached, the Program a Record screen returns with the button. You can then configure a new
recording.
During the recording of a trend, only the stop date field can be modified. It is automatically highlighted in yellow.
9.2. TREND MODE CONFIGURATION
The submenu displays the list of trend recording configurations (see §4.9). This shortcut button lets you specify or modify the
trend recording configurations.
Find Quality Products Online at: sales@GlobalTestSupply.com
www.GlobalTestSupply.com
Page 67

67
9.3. VIEWING THE RECORDING LIST
Recording name.
Recording stop time.
Figure 9-2
The icon navigates through multiple
screen pages.
pages by pressing the or button.
Measurement types.
Figure 9-3
The Recording List submenu displays a list of recordings stored in the instrument memory.
Amount of memory dedicated to
recordings.
Recording start time.
If the stop date is in red, it does not match the configured date, due to a power supply problem (battery low or disconnection of the
instrument supplied by external power only).
9.4. DELETING RECORDINGS
When the list of records is displayed (see Figure 9-2), select the recording to be erased by highlighting it using the and buttons.
(The selected recording is bolded.) Then press the button. Press
to validate or to cancel.
9.5. VIEWING RECORDS
9.5.1. RECORDING PARAMETERS
With the Recording List displayed, select a recording and press
If a measurement does not appear among the tabs at the bottom of the screen, calculation of the measurement was incompatible
with the selected configuration (connection, types of sensors, ratios). For example, if the configured calculation mode is Non-active
Quantities not broken down (see §4.5.1), the D tab does not appear.
Press the associated function button to display the graph for a measurement.
to open it. The Recording Parameters menu is displayed.
You can also navigate
Find Quality Products Online at: sales@GlobalTestSupply.com
www.GlobalTestSupply.com
Page 68

68
9.5.2. TREND GRAPHS
Position of
record.
To select the display filter, press the
or button.
This screen is a partial view of
visible part.
the cursor.
Figure 9-4
has
.
C
1 minute and 5 days
Figure 9-5
NOTES:
occurrence of the minimum
.
P
occurrence of the maximum value.
Figure 9-6
Date at cursor position.
the trend graph. There are other
screens before and after the
Use the or button to move
The display period of this graph is one minute. Since the period of the record is one second, each point of this graph corresponds to
a value recorded in a one-second window once a minute. There is therefore a substantial loss of information (59 values out of 60),
but the display is rapid.
Saturated values appear in red.
Black dashes - - - - indicate erroneous values.
Red dashes - - - - If red dashes appear when the is pressed, they indicate values that are not calculated in the MIN-MAX-
AVG mode.
viewing window in the
The MIN-AVG-MAX mode
been activated
The display period of this graph is one minute. With MIN-AVG-MAX mode activated, each point of this graph represents the
arithmetic mean of 60 values recorded every second. This display is therefore more precise, because there is no loss of information,
but slower (see the table at the end of this section).
To stop the calculation of MIN-AVG-MAX mode, press .
recording display window positioning bar.
MIN-AVG-MAX mode is not available while a trend is being recorded.
To return to the Recording Parameters screen, press .
Places the cursor on the first
While MIN-AVG-MAX mode is being calculated, a progress bar is displayed in the status bar instead of the
value
hange the display scale between
laces the cursor on the first
Pressing the or button automatically sets “zoom in” to the highest level (display period identical to the recording period) and
de-activates the MIN-AVG-MAX mode if activated.
Find Quality Products Online at: sales@GlobalTestSupply.com
www.GlobalTestSupply.com
Page 69

69
Graph of maxima.
Graph of
mean.
Values of the cursor (minimum, mean,
and maximum).
.
Figure 9-7
Position of the viewing window in
the record.
To select the display filter, press
the or button.
This screen is a partial view of
visible part.
the cursor.
Figure 9-8
.
Figure 9-9
NOTE: For the quantities (P, Pdc, VAR, S, D, PF, cos Φ and tan Φ) and for a three-phase source without neutral, only the
total quantities are represented.
Graph of minima
The display period of this graph is one minute. Each point of the mean graph represents the arithmetic mean of 60 values recorded
every second. Each point of the graph of the maxima represents the maximum of the 60 values recorded every second. Each point
of the graph of the minima corresponds to the minimum of the 60 values recorded every second. This display is therefore more
precise than the previous one.
Date of the cursor.
the trend graph. There are other
screens before and after the
Use the or button to move
For each phase (L1, L2, and L3), at each recording of a value over one second (recording period), the instrument also records the
minimum half-cycle RMS value over one second and the maximum half-cycle RMS value over one second. These are the three
graphs shown in Figure 9-7.
MIN-AVG-MAX mode activated
This graph differs slightly from the previous one because, with the MIN-AVG-MAX mode, there is no loss of information.
Find Quality Products Online at: sales@GlobalTestSupply.com
www.GlobalTestSupply.com
Page 70

70
The sum of the powers of the
C
1 minute and 5 days.
Figure 9-12
Figure 9-10
Figure 9-11
three phases (Σ) is presented in
bar graph form.
hanges the display scale between
For the energy graphs, the quantities are expressed in Wh, J, toe, or BTU, depending on the configured unit (see §4.5.2).
Figure 9-13
This graph differs slightly from the previous one because, with the MIN-AVG-MAX mode, there is no loss of information.
The MIN-AVG-MAX mode can be activated for the powers to display, above the graph, the mean power value at the cursor date
along with the maximum and minimum power values in the display period. Note that, in contrast with the other quantities, only the bar
chart of mean values is represented.
Find Quality Products Online at: sales@GlobalTestSupply.com
www.GlobalTestSupply.com
Page 71

71
Starting date of the selection.
Date of the cursor (ending date of the
selection). Use the
or buttons to
move the cursor.
Energy calculation mode.
Pressing this button lets you
define the start of the selection.
Figure 9-14
.
Position of the viewing window in the
record.
To select the display filter, press the
or button.
This screen is a partial view of
the
visible part.
button to move
the cursor.
Figure 9-16
MAX mode activated.
Figure 9-17
The display period of this bar chart is one minute. Since the recording period is one second, each bar of this bar chart represents a
value recorded in a one-second window once a minute.
The energy calculation mode determines the sum of the powers on the selected bars.
Figure 9-15
With the MIN-AVG-MAX mode activated, the display differs slightly from the previous one because there is no loss of information.
Date at cursor position
the trend graph. There are other
screens before and after
Use the or
The period of display of this graph is two hours. Since the recording period is one second, each point of this graph represents a
value recorded every second taken every two hours. There is therefore a substantial loss of information (7,199 out of 7,200), but the
display is rapid.
MIN-AVG-
Find Quality Products Online at: sales@GlobalTestSupply.com
www.GlobalTestSupply.com
Page 72

72
This graph differs considerably from the previous one, because MIN-AVG-MAX mode is activated. Each point of the mean graph
Pressing this button stops the
recorded values and
.
Figure 9-18
D
available
it was not
Figure 9-19
C
1 minute and 5 days.
Figure 9-20
represents the arithmetic mean of 7,200 values recorded every second. Each point of the graph of the maxima represents the
maximum of the 7,200 values recorded every second. Each point of the graph of the minima corresponds to the minimum of the
7,200 values recorded every second.
This display is therefore more precise, because there is no loss of information, but slower (see the table at the end of this
section).
loading of
calculation of values displayed
ashes indicate that the value is not
at the cursor position because
calculated.
Display of the record is not complete because construction was stopped before the end.
The display has not been stopped and is therefore complete.
hanges the display scale between
Find Quality Products Online at: sales@GlobalTestSupply.com
www.GlobalTestSupply.com
Page 73

73
The following table indicates the time needed to display the graph on screen as a function of the width of the display window for
5 days
2 hours
11 seconds
10 minutes
15 hours
15 minutes
2 seconds
1 minute 15 seconds
5 hours
5 minutes
1 second
25 seconds
20 minutes
10 seconds
1 second
2 seconds
1 second
a recording period of one second:
Width of display window
(60 points or increments)
Grid increment
Typical waiting time for
display with MIN-AVG-
MAX mode deactivated
Typical waiting time for
display with MIN-AVG-
MAX mode activated
2.5 days 1 hour
10 hours 10 minutes
1 hour 1 minute
5 minutes 5 seconds
1 minute 1 second
These times can be long, so the instrument provides the ability to stop the display at any time by pressing the button. It is also
possible, at any time, to press:
■
or to change the scale of the display
■
or to move the cursor
■
or to change the display filter
But note that this may restart the loading and/or calculation of the values from the beginning.
6 seconds
2 seconds
1 second
1 second
5 minutes
50 seconds
8 seconds
1 second
1 second
Find Quality Products Online at: sales@GlobalTestSupply.com
www.GlobalTestSupply.com
Page 74

74
10. POWER AND ENERGY MODE
Active power.
DC power (only if a DC current
sensor is connected).
power.
power.
power.
Figure 10-1
Power factor.
Fundamental power factor (also
-
DPF).
.
Phase shift of the voltage
with respect to the current.
Figure 10-2
The button displays power- and energy-related measurements.
The available sub-menus depend on the filter.
■
For 2- and 3-wire single-phase connections and for the 2-wire two-phase connection, only L1 is available. The filter is
therefore not displayed, but the display is the same as for L1.
■
For the 3-wire three-phase connection, only Σ is available. The filter is therefore not displayed, but the display is the same as
for Σ.
10.1. 3L FILTER
10.1.1. POWERS DISPLAY SCREEN
The W... sub-menu is used to display the powers.
Reactive
Distortion
Apparent
NOTE: This screen corresponds to the choice “non-active quantities broken down” in the AR tab of the Calculation
Methods menu in Configuration mode. If “non-active quantities not broken down” is selected, D (distortion power) is not
displayed and Q1 appears in place of N. This non-active power is unsigned and has no inductive or capacitive effect.
10.1.2. QUANTITIES ASSOCIATED WITH THE POWERS DISPLAY SCREEN
The PF sub-menu... displays the quantities associated with the powers.
called displacement factor
Tangent of the phase shift
Find Quality Products Online at: sales@GlobalTestSupply.com
www.GlobalTestSupply.com
Page 75

75
10.1.3. ENERGIES CONSUMED DISPLAY SCREEN
Active energy.
current
connected).
energy.
energy.
energy.
Figure 10-3
Active energy.
current
connected).
energy.
energy.
energy.
Figure 10-4
Active power.
Power factor (PF).
DC power.
power.
Fundamental power factor (also
DPF).
Distortion power.
.
Figure 10-5
The sub-menu displays the meters of energy consumed by the load.
DC energy (only if a DC
sensor is
Reactive
Distortion
Apparent
NOTE: This screen corresponds to the choice “non-active quantities broken down” in the VAR tab of the Calculation
Methods menu of the Configuration mode. If “non-active quantities not broken down” is selected, Dh (distortion energy)
does not appear and Q1h is replaced by Nh. This non-active energy has no inductive or capacitive effect.
10.1.4. ENERGIES GENERATED DISPLAY SCREEN
The sub-menu displays the meters of the energy generated by the load.
DC energy (only if a DC
sensor is
Inductive reactive effect .
Capacitive reactive effect .
Inductive reactive effect .
Reactive
Distortion
Apparent
NOTE: This screen corresponds to the choice “non-active quantities broken down” in the VAR tab of the Calculation
Methods menu of the Configuration mode. If “non-active quantities not broken down” is selected, Dh (distortion energy)
does not appear and Q1h is replaced by Nh. This non-active energy has no inductive or capacitive effect.
10.2. FILTERS L1, L2 AND L3
10.2.1. POWERS AND ASSOCIATED QUANTITIES DISPLAY SCREEN
The W... sub-menu displays the powers and associated quantities.
Reactive
Capacitive reactive effect .
called displacement factor -
Tangent of the phase shift.
Apparent power
Phase shift of voltage with
respect to current.
Find Quality Products Online at: sales@GlobalTestSupply.com
www.GlobalTestSupply.com
Page 76

76
NOTE:
energy consumed by
.
Meters of the energy generated by
the load
Active energy.
current
connected).
Inductive reactive effect .
energy.
energy.
Apparent energy.
Figure 10-6
NOTE: This screen corresponds to the choice “non-active quantities broken down” in the VAR tab of the Calculation
Σ
Total active power.
Total DC power.
Total power factor (PF).
power.
called displacement factor - DPF).
Total distortion power.
.
Figure 10-7
NOTE: This screen corresponds to the choice “non-active quantities broken down” in the VAR tab of the Calculation Methods
Filters L2 and L3 display the same information for phases 2 and 3.
Φ
is displayed for the 2-wire two-phase set-up.
UA
This screen corresponds to the choice “non-active quantities broken down” in the VAR tab of the Calculation
Methods menu of the Configuration mode. If “non-active quantities not broken down” is selected, D (distortion power) does
not appear and Q1 is replaced by N. This non-active power has no inductive or capacitive effect.
10.2.2. ENERGY METERS DISPLAY SCREEN
The Wh... sub-menu displays the energy meters.
Meters of
the load
DC energy (only if a DC
sensor is
Reactive
Distortion
Methods menu of the Configuration mode. If “non-active quantities not broken down” is selected, Dh (distortion energy) does
not appear and Q
Filters L2 and L3 display the same information for phases 2 and 3.
10.3. FILTER
h is replaced by Nh. This non-active energy has no inductive or capacitive effect.
1
Capacitive reactive effect .
10.3.1. TOTAL POWERS AND ASSOCIATED QUANTITIES DISPLAY SCREEN
The W... sub-menu displays the powers and associated quantities.
Total reactive
Total apparent power
menu of the Configuration mode. If “non-active quantities not broken down” is selected, D (distortion power) does not
appear and Q
is replaced by N. This non-active power has no inductive or capacitive effect.
1
Total fundamental power factor (also
Total tangent of the phase shift.
Find Quality Products Online at: sales@GlobalTestSupply.com
www.GlobalTestSupply.com
Page 77

77
10.3.2. TOTAL ENERGY METERS DISPLAY SCREEN
consumed
.
Meters of the energy generated by
the load.
Total active energy.
DC
current sensor is connected).
energy.
energy.
Total apparent energy.
Figure 10-8
metering.
Pressing suspends energy
metering.
Figure 10-9
energy metering is in progress.
Figure 10-10
The Wh... sub-menu displays the energy meters.
Meters of the energy
by the load
Total DC energy (only if a
Total reactive
Total distortion
NOTE: This screen corresponds to the choice “non-active quantities broken down” in the VAR tab of the Calculation Methods
menu of the Configuration mode. If “non-active quantities not broken down” is selected, Dh (distortion energy) does not
appear and Q
For 3-wire three-phase networks, only the display of total quantities is available, the method of calculation of the powers used is the
two-wattmeter method (with 2 sensors connected) or the three-wattmeter method with virtual neutral (with 3 sensors connected).
h is replaced by Nh. This non-active energy has no inductive or capacitive effect.
1
Total inductive reactive effect .
Total capacitive reactive effect .
10.4. START ENERGY METERING
To start an energy metering, press the button in an energies display screen ( , , or Wh...).
Start date/time of energy
The blinking symbol indicates
The diagram used is the 4-quadrant diagram.
NOTE: The non-nullity threshold is 11.6 kWh for non-nuclear toe and 3.84 kWh for nuclear toe.
Find Quality Products Online at: sales@GlobalTestSupply.com
www.GlobalTestSupply.com
Page 78

78
10.5. STOP ENERGY METERING
S
displayed next to start date/time.
Figure 10-11
To suspend energy metering, press .
top date/time of metering are
A disconnection of the metering is not definitive. It can be resumed by pressing the button again.
NOTE: If no recording is in progress, disconnecting the energy metering leads to the appearance of the blinking symbol in
the status bar (in place of the symbol). Disconnecting the energy metering also leads to the replacement of the button
by the button.
10.6. RESET ENERGY METERING
To suspend metering, press the button. To then reset energy metering, press the button and validate with the
energy values (consumed and generated) are then reset.
button. All
Find Quality Products Online at: sales@GlobalTestSupply.com
www.GlobalTestSupply.com
Page 79

79
11. SCREEN SNAPSHOT MODE
Display list of screen snapshots.
Figure 11-1
The button can take up to 50 screen snapshots and display recorded snapshots. Saved snapshots can then be transferred to a
computer running the DataView PowerPad III Control Panel.
11.1. SCREEN SNAPSHOTS
Press for approximately 3 seconds to take a snapshot of any screen. When the snapshot is taken, the icon of the active mode
( , , , , , , ) at the top of the display unit is replaced by the icon. You can then release the button.
The instrument can record up to 50 screen snapshots. If you attempt to record an additional snapshot, the instrument informs you that
snapshots must be deleted by displaying the icon in place of .
11.2. HANDLING SCREEN SNAPSHOTS
To enter screen snapshot mode, briefly press the button. The instrument then displays a list of recorded screen snapshots.
Available image memory. The
black bar represents memory
used and the white bar
represents memory available.
List of saved snapshots. Each icon
represents the type of screen
recorded, followed by the date and
time of the snapshot.
Icons for browsing screen
pages.
Delete a screen snapshot.
11.2.1. VIEWING A SNAPSHOT
To view a snapshot, select it in the list of screen snapshots using the , , and buttons. The date and time of the selected
snapshot are bolded.
Press
snapshot was taken ( , , , , , , ).
Press to return to the list of screen snapshots.
to display the selected snapshot. The icon is displayed, alternating with the icon for the mode that was active when the
11.2.2. DELETING A SNAPSHOT
To delete a snapshot, select it in the list of screen snapshots using the , , and buttons. The date and time of the selected
snapshot are bolded.
Press the button and validate by pressing
To cancel the deletion, press instead of
. The snapshot is removed from the list.
.
Find Quality Products Online at: sales@GlobalTestSupply.com
www.GlobalTestSupply.com
Page 80

80
12. HELP BUTTON
mode.
progress.
buttons and icons.
Help page 2.
Help page 1.
Figure 12-1
Figure 12-2
The button provides information about the button functions and symbols used in the current display mode. The following is an
example of Help information displayed:
Indicates active
Help in
List of information concerning the
List of symbols used on the page.
Find Quality Products Online at: sales@GlobalTestSupply.com
www.GlobalTestSupply.com
Page 81

81
13. DATAVIEW® SOFTWARE
The DataView
instrument to a computer.
®
PowerPad III Control Panel software supplied with the instrument is used to transfer the data recorded in the
13.1. INSTALLING DATAVIEW®
DO NOT CONNECT THE INSTRUMENT TO THE COMPUTER BEFORE INSTALLING THE SOFTWARE AND
DRIVERS.
NOTE: When installing, the user must have Administrative access rights during the installation. The user’s access rights
can be changed after the installation is complete. DataView
When you purchase the instrument, the product package includes a USB drive containing DataView program files. To begin
installation:
1. Insert the DataView drive into an available USB port on your computer.
If Autorun is enabled, an AutoPlay window appears on your screen. Click “Open folder to view files” to display the DataView
folder.
If Autorun is not enabled or allowed, use Windows Explorer to locate and open the USB drive labeled “DataView.”
2. When the DataView folder is open, find the file Setup.exe and double-click it to run the installation program.
3. The DataView setup screen appears. In the upper left corner of the screen, choose the language version of DataView to
install. In the lower left corner are the available installation options. In addition to the DataView software, you can select
“Adobe Reader.” This links to the Adobe web site where you can download the latest version of Reader. This program is
required to create DataView .pdf documents. The option DataView Update opens the AEMC website where you can check for
the latest DataView software version releases. Similarly, Firmware Upgrades links to the website where you can check for new
firmware updates for the Model 8436. Finally, User Manuals displays a printable .pdf file containing the documentation that
accompanies DataView. (DataView also comes with a Help system that is installed with the program files.) To install
DataView, select DataView in the Options list and click Install.
4. After a few moments the DataView InstallShield Wizard welcome screen appears. The InstallShield Wizard program leads you
through the DataView installation process. To proceed, click Next.
5. Read the license agreement and indicate your acceptance by clicking “I accept the terms of the license agreement.” Then click
Next.
6. At the Customer Information screen, enter your username and company name. Also choose whether this installation is for all
users of the computer, or just for your username. Click Next to proceed.
7. The next screen lets you select the DataView setup. If you choose Custom, you are prompted to select individual DataView
components to install. To install the full DataView product, select Complete and then click Next.
8. You are now prompted to select the Control Panel(s) you want to install. Each AEMC product family has its own specially
designed Control Panel. If you are performing a Complete install, by default all available Control Panels are selected. Control
Panels take up disk space on the computer; so unless you have other types of AEMC instruments, we recommend that you
select PowerPad III and deselect the rest. You should also check the option PDF-XChange, which is a requirement if you plan
to create .pdf versions of DataView reports. After you finish selecting and deselecting Control Panels, click Next.
9. The InstallShield Wizard now informs you that the program is ready to install DataView. If you want to review any of your
previous selections, click the Back button to return to earlier screens. Otherwise, click Install to begin installation.
10. The InstallShield Wizard installs DataView software. During this process, a status bar displays the progress of the installation.
You may also see a warning message about installing DataView with your AEMC instrument connected to the computer. If the
instrument or USB cable is connected, disconnect it now. Then click OK to proceed.
11. After a few moments, a screen appears informing you that installation is complete. Click Finish to leave the InstallShield
Wizard.
12. Close the DataView Setup screen. The DataView folder now appears on your computer desktop. This contains the DataView
®
must be reinstalled for each user in a multi-user system.
icon along with the PowerPad III Control Panel icon and the icon(s) for any other AEMC product Control Panel(s) you
installed.
Find Quality Products Online at: sales@GlobalTestSupply.com
www.GlobalTestSupply.com
Page 82

82
13.2. POWERPAD III CONTROL PANEL
Clicking the PowerPad III Control Panel icon opens the PowerPad III Control Panel:
Figure 13-1
In general, core DataView features are for creating, viewing, editing, and storing DataView reports; while the PowerPad III Control
Panel is for connecting to, configuring, viewing measurements on, and downloading data from the instrument. You can access all
DataView features through either the DataView icon or the Control Panel icon. For users who interact with PowerPad III instruments,
we recommend primarily using the PowerPad III Control Panel. However, there are situations where using the core DataView icon
may be more convenient for some users, such as when viewing multiple archived reports from different AEMC product families.
For further information about using the PowerPad III Control Panel, consult the Help system that comes with the product. Access
this Help by (1) pressing F1, or (2) clicking the option Help in the PowerPad III Control Panel’s menu bar at the top of the screen.
13.3. CONNECTING TO A COMPUTER
Before you can use the PowerPad III Control Panel to communicate with your instrument, you must establish a connection between
the instrument and the computer. To begin, ensure that you have installed DataView with the PowerPad III Control Panel. Also
ensure that the instrument is connected to the computer via the provided USB cable. When you make this connection, drivers are
installed as part of the DataView installation process.
If you need assistance during the connection process, press the Help button.
After the instrument is successfully connected, consult the PowerPad III Control Panel Help system for instructions about viewing
real-time data on the instrument, downloading and viewing recorded sessions, creating DataView reports from the downloaded data,
and configuring the instrument.
Find Quality Products Online at: sales@GlobalTestSupply.com
www.GlobalTestSupply.com
Page 83

83
14. GENERAL SPECIFICATIONS
14.1. ENVIRONMENTAL CONDITIONS
The following chart shows conditions relating to ambient temperature and humidity:
%RH
1 = Reference range.
2 = Range for use.
3 = Range for storage with batteries.
4 = Range for storage without batteries.
NOTE: At temperatures above 104°F (40°C), the instrument must be powered by the battery alone OR by the external
power unit alone. The instrument must not be used with both the battery AND external power.
Altitude :
Use < 6560’ (2000 m)
Storage < 32,800’ (10,000 m)
Degree of pollution: 2
Use indoors
14.2. MECHANICAL CONDITIONS
Dimensions (L x W x H) 10.6” x 9.8” x 7.1” (270 mm x 250 mm x 180 mm)
Weight approximately 8.16 lbs (3.7 kg)
Screen 4.65” x 3.54” (118 mm x 90 mm), diagonal 5.82” (148 mm)
Ingress protection IP 67 per EN 60529 with the housing closed and the protecting plugs on the terminals.
IP 54 with cover open, instrument not in operation (terminals not connected and nothing pressed
on the keyboard).
IP 50 with cover open and instrument in operation.
Fall 40” (1m) on each edge as per IEC 61010-1
14.3. OVERVOLTAGE CATEGORIES PER IEC 61010-1
The instrument is compliant with IEC 61010-1, 600 V category IV or 1000 V category III.
■
AmpFlex®, MiniFlex®, or SR193 clamps keeps the “device + current sensor” system at 600 V category IV or 1000 V
category III.
■
MR193, J93, MN93, MN193, or SL261 clamps downgrades the “device + current sensor” system to 300 V category IV or
600 V category III.
■
5 A adapter downgrades the “device + current sensor” system to 150 V category IV or 300 V category III.
Double insulation between the inputs/outputs and earth.
Double insulation between the voltage inputs, the power supply, and the other inputs/outputs.
Find Quality Products Online at: sales@GlobalTestSupply.com
www.GlobalTestSupply.com
Page 84

84
14.4. ELECTROMAGNETIC COMPATIBILITY
Capacity
4000 mAh nominal
Nominal voltage
1.2 V per cell, 9.6 V total
Charging current
1 A
Service T°
32 to 122 °F (0 to 50 °C)
Storage T°
storage ≤ 30 days: -4 to 122 °F (-20 to 50 °C)
storage for 30 to 90 days: -4 to 104 °F (-20 to 40 °C)
storage for 90 days to 1 year: -4 to 86 °F (-20 to 30 °C)
Typical consumption of the
Active power (W)
17
6
RMS current (mA)
130
60
Emissions and immunity in an industrial setting compliant with IEC 61326-1.
For electromagnetic emissions, the instrument belongs to group 1, class A, under standard EN55011. Class A devices are intended
for use in industrial environments. There may be difficulties ensuring electromagnetic compatibility in other environments, because of
conducted and radiated disturbance.
For immunity to radio frequency fields, the instrument is intended for use at industrial sites under standard IEC61326-1.
For the AmpFlex
■ An (absolute) influence of 2% may be observed on the current THD measurement in the presence of a radiated electric
field.
■ Influence of 0.5 A may be observed on the RMS current measurement in the presence of conducted radio frequencies.
■ Influence of 1 A may be observed on the RMS current measurement in the presence of a magnetic field.
®
and MiniFlex® sensors:
14.5. POWER SUPPLY
14.5.1. EXTERNAL POWER SUPPLY
Range of use: 110 to 1000 V and DC to 440 Hz.
Input current: 0.8 A
14.5.2. BATTERY POWER SUPPLY
The instrument is supplied by a 9.6 V, 4000 mAh battery pack, consisting of eight rechargeable NiMH elements.
Battery 8 NiMH storage cells
maximum
RMS
Life at least 300 charge-discharge cycles
Charging time approximately 5 hours
Charging T° 50 to 104 °F (10 to 40 °C)
If the instrument is to be left unused for an extended period, remove the battery (see § 16.3).
14.5.3. CONSUMPTION
instrument on external power (mA)
Apparent power (VA) 30 14
Battery charging Battery charged
14.5.4. BATTERY LIFE
Battery life is 10 hours when the battery delivered with the instrument is fully charged, with the display screen ON. If the display
screen is OFF (saving energy), battery life is more than 15 hours.
14.5.5. DISPLAY UNIT
The display unit is an active matrix (TFT) LCD type with the following specifications:
■
5.7” diagonal
■
resolution 320 x 240 pixels (1/4 VGA)
■
color
■
minimum luminosity 210 cd/m², typical 300 cd/m²
■
response time between 10 and 25 ms
■
angle of view 80° in all directions
■
excellent rendering from 32 to 122°F (0 to 50°C)
Find Quality Products Online at: sales@GlobalTestSupply.com
www.GlobalTestSupply.com
Page 85

85
15. FUNCTIONAL SPECIFICATIONS
Humidity (relative humidity)
[45 %; 75 %]
[30 mV
; 1 V
] without DC (< 0.5 %)
[11.73 mV
; 391 mV
] without DC (< 0.5 %)
[117.3 µV
; 3.91 mV
] without DC (< 0.5 %)
■ 3 A
RMS
⇔ 117.3 µV
RMS
to 50 Hz
Frequency of electrical network
50 Hz ± 0.1 Hz or 60 Hz ± 0.1 Hz
Harmonics
< 0.1 %
Voltage ratio
1 (unity)
Voltages
measured (not calculated)
Current sensors
actual (not simulated)
-1
≤ 0.1 V.m
for [2 GHz ; 2.7 GHz]
Magnetic field
< 40 A.m
-1
DC (earth’s magnetic field)
nom
nom
SR193 clamp
1000
30
MR193 clamp
1000
30
MN193 clamp (100 A)
100
3
SL261 clamp (100 mV/A)
10
0.3
5 A adapter
5
0.15
Essailec
®
adapter
15.1. REFERENCE CONDITIONS
This table indicates the reference conditions of the quantities used by default in the specifications listed in § 15.3.4.
Parameter Reference conditions
Ambient temperature 73 ± 5 °F (23 ± 3 °C)
Atmospheric pressure [860 hPa; 1060 hPa]
Phase-to-neutral voltage [50 V
Standard current circuit input voltage
(Except Flex
®
type current sensors)
Unamplified Rogowski current circuit input voltage
(Flex® type current sensors)
Amplified Rogowski current circuit input voltage
■
■ 3
■
■ 300 A
■
(Flex® type current sensors)
RMS
RMS
A
nom
×
A
10 kA
100 A
; 1000 V
(1)
⇔ 1 V
(1)
nom
RMS
⇔
RMS
⇔ 11.73 mV
RMS
RMS
⇔
RMS
] without DC (< 0.5 %)
RMS
RMS
RMS
÷ 100 ⇔ 30
391 mV
3.91 mV
RMS
RMS
RMS
mV
to 50 Hz
to 50 Hz
RMS
to 50 Hz
RMS
RMS
Phase shift
0° (active power and energy)
90° (reactive power and energy)
Voltage unbalance < 10 %
Current ratio 1 (unity)
Power supply Battery only
Electric field
< 1 V.m
≤ 0.3 V.m
for [80 MHz ; 1 GHz[
-1
for [1 GHz ; 2 GHz[
-1
(1) The values of A
are given in the table below.
nom
15.2. NOMINAL CURRENT ACCORDING TO TYPE OF SENSOR
Current sensor (except Flex®)
Nominal RMS current
(A
) [A]
J93 clamp 3500 105
Lower limit of the reference range
(3 × A
÷ 100) [A]
MN93 clamp 200 6
SL261 clamp (10 mV/A) 100 3
MN193 clamp (5 A) 5 0.15
5 0.15
Find Quality Products Online at: sales@GlobalTestSupply.com
www.GlobalTestSupply.com
Page 86

86
15.3. ELECTRICAL CHARACTERISTICS
Measurement range without ratio
(with unity ratio)
Minimum
Maximum
Frequency
(7)
40 Hz
70 Hz
10 mHz
±10 mHz
100 mV
V < 1000 V
1 V
V ≥ 1000 V
100 mV
U < 1000 V
1 V
U ≥ 1000 V
100 mV
V < 1000 V
1 V
V ≥ 1000 V
100 mV
U < 1000 V
1 V
U ≥ 1000 V
100 mV
V < 1000 V
1 V
V ≥ 1000 V
100 mV
U < 1000 V
1 V
U ≥ 1000 V
100 mV
V < 1000 V
1 V
V ≥ 1000 V
100 mV
U < 1000 V
1 V
U ≥ 1000 V
Severity of short-term flicker (PST)
0
12
0.01
See corresponding table
Severity of long-term flicker (PLT)
0
12
0.01
Uncertainty of PST
±(1% + 5 ct)
CF < 4
±(5% + 2 ct)
CF ≥ 4
15.3.1. VOLTAGE INPUT CHARACTERISTICS
Range for use: 0 VRMS to 1000 VRMS AC+DC phase-to-neutral and neutral-to-earth.
0 V
(on condition of compliance with 1000 VRMS with respect to earth in Cat III).
Input impedance: 1195 kΩ (between phase and neutral and between neutral and earth).
Admissible overload: 1200 V
2000 V
15.3.2. CURRENT INPUT CHARACTERISTICS
Operating range: [0 V; 1 V]
Input impedance: 1 MΩ.
Admissible overload: 1.7 V
®
type current sensors (AmpFlex® and MiniFlex®) switch the current input to an integrator assembly (amplified or unamplified
Flex
Rogowski channel) capable of interpreting the signals from Rogowski sensors. The input impedance is reduced to 12.4 kΩ in this
case.
15.3.3. BANDWIDTH
Measurement channels: 256 points per period, i.e.:
■ 50 Hz: 6.4 kHz (256 × 50 ÷ 2).
■ 60 Hz: 7.68 kHz (256 × 60 ÷ 2).
Analogue 3-dB bandwidth: 76 kHz.
15.3.4. INSTRUMENT SPECIFICATIONS (EXCLUDING CURRENT SENSOR)
Quantities concerning currents and voltages
RMS to 2000 VRMS AC+DC phase-to-phase.
RMS constant.
RMS for one second.
RMS constant.
RMS
voltage
Direct
voltage
(6)
(DC)
RMS ½
voltage
Peak
voltage
Measurement
simple 2 V 1000 V
(5)
compound 2 V 2000 V
simple 2 V 1200 V
compound 2 V 2400 V
simple 2 V 1000 V
compound 2 V 2000 V
simple 2 V 1414 V
compound 2 V 2828 V
Display resolution
(with unity ratio)
(1)
Maximum intrinsic
error
±(0.5% + 200 mV)
±(0.5% + 1 V)
(2)
±(0.5% + 200 mV)
±(0.5% + 1 V)
(3)
±(1% + 500 mV)
±(1% + 1 V)
(3)
±(1% + 500 mV)
±(1% + 1 V)
(1)
(2)
(4)
(4)
±(0.8% + 1 V)
±(0.8% + 1 V)
±(3% + 2 V)
±(3% + 2 V)
Peak factor (PF) (voltage and
current)
1 9.99 0.01
Find Quality Products Online at: sales@GlobalTestSupply.com
www.GlobalTestSupply.com
Page 87

87
(1) Limitation of the MR193 and SL261 clamps
Measurement range without ratio
(with unity ratio)
Minimum
Maximum
J93 clamp
3 A
3500 A
1 A
±(0.5% + 1 A)
100 mA
A < 1000 A
1 A
A ≥ 1000 A
MN93 clamp
200 mA
200 A
100 mA
±(0.5% + 200 mA)
10 mA
A < 100 A
100 mA
A ≥ 100 A
1 mA
A < 10 A
10 mA
A ≥ 10 A
MN193 clamp (5 A)
Essailec® adapter
1 A
A < 10 kA
10 A
A ≥ 10 kA
100 mA
A < 1000 A
1 A
A ≥ 1000 A
10 mA
A < 100 A
100 mA
A ≥ 100 A
J93 clamp
3 A
5000 A
1A
±(1% + 1 A)
100 mA
A < 1000 A
1 A
A ≥ 1000 A
10 mA
A < 100 A
100 mA
A ≥ 100 A
1 mA
A < 10 A
10 mA
A ≥ 10 A
(2) Two-phase (opposite phases) – same note as (1)
(3) Limitation of the voltage inputs
(4) 1000 x √2 ≈ 1414; 2000 x √2 ≈ 2828
(5) Total RMS value and RMS value of the fundamental
(6) DC harmonic component (n= 0)
(7) For voltages > 5 V
RMS
current
Measurement
SR193 clamp
MR193 clamp
SL261 clamp (10 mV/A)
MN193 clamp (100 A)
SL261clamp (100 mV/A) 10 mA 10 A
(2)
5 A adapter
® (4)
® (4)
AmpFlex
MiniFlex
(10 kA)
® (4)
® (4)
AmpFlex
MiniFlex
(6500 A)
® (4)
® (4)
AmpFlex
MiniFlex
(100 A)
1 A 1000 A
100 mA 100 A
5 mA 5 A 1 mA ±(0.5% + 2 mA)
10 A 10 kA
10 A 6500 A
100 mA 100 A
Display resolution
(with unity ratio)
Maximum
intrinsic error
±(0.5% + 200 mA)
±(0.5% + 1 A)
±(0.5% + 20 mA)
±(0.5% + 100 mA)
±(0.5% + 2 mA)
±(0.5% + 10 mA)
±(0.5% + 3 A)
±(0.5% + 3 A)
±(0.5% + 30 mA)
MR193 clamp 1 A 1300 A
(1)
Direct
current
(3)
(DC)
SL261 clamp (10 mV/A) 100 mA 100 A
SL261 clamp (100 mV/A) 10 mA 10 A
(1)
(1)
(1) In 1000 VRMS, category III, provided that the voltage between each of the terminals and earth does not exceed 1000 VRMS
(2) Total RMS value and RMS value of the fundamental
(3) DC harmonic component (n= 0)
(4) Sensors compatible with the instrument (see §1.2)
±(1% + 1 A)
±(1% + 100 mA)
±(1% + 10 mA)
Find Quality Products Online at: sales@GlobalTestSupply.com
www.GlobalTestSupply.com
Page 88

88
Measurement
Measurement range without
ratio (with unity ratio)
Minimum
Maximum
J93 clamp
1 A
3500 A
1 A
± (1% + 1 A)
100 mA
A < 1000 A
1 A
A ≥ 1000 A
MN93 clamp
200 mA
240 A
100 mA
±(1% + 1 A)
clamp (10 mV/A)
10 mA
A < 100 A
100 mA
A ≥ 100 A
1 mA
A < 10 A
10 mA
A ≥ 10 A
MN193 clamp (5 A)
Essailec® adapter
1 A
A < 10 kA
10 A
A ≥ 10 kA
100 mA
A < 1000 A
1 A
A ≥ 1000 A
10 mA
A < 100 A
100 mA
A ≥ 100 A
J93 clamp
1 A
4950 A
1 A
±(1% + 2 A)
1 A
A < 1000 A
1 A
A ≥ 1000 A
MN93 clamp
200 mA
282.8 A
100 mA
±(1% + 2 A)
clamp (10 mV/A)
10 mA
A < 100 A
100 mA
A ≥ 100 A
1 mA
A < 10 A
10 mA
A ≥ 10 A
MN193 clamp (5 A)
Essailec® adapter
1 A
A < 10 kA
10 A
A ≥ 10 kA
100 mA
A < 1000 A
1 A
A ≥ 1000 A
10 mA
A < 100 A
100 mA
A ≥ 100 A
Display resolution
(with unity ratio)
Maximum intrinsic error
RMS ½
current
SR193 clamp
MR193 clamp
SL261
MN193 clamp (100 A)
SL261 clamp (100
mV/A)
5 A adapter
AmpFlex
MiniFlex
® (2)
® (2)
(10 kA)
AmpFlex
MiniFlex
® (2)
® (2)
(6500 A)
AmpFlex
MiniFlex
® (2)
® (2)
(100 A)
1 A 1200 A
0.1A 120 A
10 mA 12 A
±(1% + 1 A)
±(1% + 100 mA)
±(1% + 10 mA)
5 mA 6 A 1 mA ±(1% + 10 mA)
10 A 10 kA
10 A 6500 A
100 mA 100 A
(1)
±(2.5% + 5 A)
±(2.5% + 5 A)
±(2.5% + 200 mA)
SR193 clamp
MR193 clamp
SL261
MN193 clamp (100 A)
SL261 clamp (100
mV/A)
1 A 1414 A
100 mA 141.4 A
10 mA 14.14 A
(1)
(1)
(1)
(1)
±(1% + 2 A)
±(1% + 200 mA)
±(1% + 20 mA)
Peak
current (PK)
5 A adapter
AmpFlex
MiniFlex
® (2)
® (2)
5 mA 7.071 A
10 A 14.14 kA
(1)
(1)
1 mA ±(1% + 20 mA)
±(3 % + 5 A)
(10 kA)
AmpFlex
MiniFlex
® (2)
® (2)
10 A 9192 kA
(1)
±(3% + 5 A)
(6500 A)
AmpFlex
MiniFlex
® (2)
® (2)
100 mA 141.4 A
(1)
±(3% + 600 mA)
(100 A)
(1) 3500 x √2 ≈ 4,950; 1000 x √2 ≈ 1,414; 200 x √2 ≈ 282.8; 100 x √2 ≈ 141.4; 10 x √2 ≈ 14.14; 10,000 x √2 ≈ 14,140; 6,500 x √2 ≈ 9192
(2) Sensors compatible with the instrument (see §1.2).
Find Quality Products Online at: sales@GlobalTestSupply.com
www.GlobalTestSupply.com
Page 89

89
Quantities concerning powers and energies
Measurement range without
ratio (with unity ratio)
Minimum
Maximum
cos Φ ≥ 0.8
0.2 ≤ cos Φ < 0.8
±(1%)
cos Φ ≥ 0.8
0.5 ≤ cos Φ < 0.8
±(1%)
sin Φ ≥ 0.5
0.2 ≤ sin Φ < 0.5
±(1.5%)
sin Φ ≥ 0.5
0.2 ≤ sin Φ < 0.5
±(4% + 20 ct)
or
Apparent power (S)
10 mVA
10 MVA
4 digits at most
±(1%)
DC power (Pdc)
20 mVA
6 MVA
4 digits at most
±(1.5%)
cos Φ ≥ 0.5
0.2 ≤ cos Φ < 0.5
±(1%)
cos Φ ≥ 0.8
0.2 ≤ cos Φ < 0.8
±(1%)
cos Φ ≥ 0.8
0.5 ≤ cos Φ < 0.8
±(1%)
sin Φ ≥ 0.5
0.2 ≤ sin Φ < 0.5
±(1.5%)
±(2.5%)
0.2 ≤ sin Φ < 0.5
Apparent energy (Sh)
1 mVAh
9,999,999 MVAh
7 digits at most
±(1%)
Measurement
Active power (P)
Reactive power
(Q1)(2)
and non-active (N)
Distortion power (D)
(1)
Excluding Flex
AmpFlex
MiniFlex
Excluding Flex
AmpFlex
MiniFlex
(7)
Display resolution
(with unity ratio)
Maximum intrinsic error
±(1%)
®
(3)
10 mW
®
®
®
10 mvar
®
®
(3)
10 MW
10 Mvar
(4)
(4)
4 digits at most
4 digits at most
(5)
(5)
±(1.5% + 10 ct)
±(2.5% + 20 ct)
±(1.5% + 10 ct)
±(2.5% + 20 ct)
if ∀ n ≥ 1, τn ≤(100 ÷ n) [%]
10 mvar
(3)
10 Mvar
(4)
4 digits at most
±(2% +(n
(5)
±(2 % +(n
× 0.5%) + 100 ct)
max
≤ 20 %f
THD
A
× 0.7%) + 10 ct)
max
THDA > 20 %f
(3)
(8)
(4)
(9)
(5)
(5)
Peak factor (PF)
Excluding Flex
Active energy
(Ph)(1)
AmpFlex
MiniFlex
(2)
Excluding Flex
AmpFlex
Reactive energy
(2)
(Q h)
and
non-active
energy (N)
MiniFlex
Distortion energy (Dh)
®
®
®
®
®
®
-1 1 0.001
1 mWh 9,999,999 MWh
1 mvarh 9,999,999 Mvarh
1 mvarh 9,999,999 Mvarh
DC energy (Pdch) 1 mWh 9,999,999 MWh
±(1.5% + 10 ct)
±(1.5%)
(6)
7 digits at most
(5)
±(1.5%)
±(1.5%)
(6)
7 digits at most
(5)
sin Φ ≥ 0.5
±(5.5%)
THD
≤ 20 %f
(6)
7 digits at most
(6)
(10)
7 digits at most
(5)
(5)
(5)
±(1.5%)
THD
A
> 20 %f
A
Find Quality Products Online at: sales@GlobalTestSupply.com
www.GlobalTestSupply.com
Page 90

90
(1) Stated uncertainties on active power and energy measurements are maxima for |cos Φ| = 1 and typical for other phase differences.
(2) Stated uncertainties on reactive power and energy measurements are maxima for |sin Φ| = 1 and typical for other phase shifts.
(3) With MN193 clamp (5 A) or 5 A adapter or Essailec
(4) With AmpFlex
(5) Resolution depends on the current sensor used and on the value to be displayed.
(6) Energy is equivalent to more than 114 years of the associated maximum power (unity ratios).
(7) n
max
(8) With SL261 clamp (100 mV/A).
(9) With J93 clamp, for a 2-wire single-phase connection (phase-to-ground voltage).
(10) Energy corresponds to more than 190 years at maximum power Pdc (unit ratios).
®
or MiniFlex
is the highest order for which the harmonic ratio is non-zero.
®
for a 2-wire single-phase connection (phase-to-ground voltage).
®
adapter.
Quantities associated with power
Measurement range
Measurement
Display resolution Maximum intrinsic error
Minimum Maximum
Phase differences of fundamentals -179° 180° 1° ±2°
cos Φ (DPF)
tan Φ
Voltage unbalance (UNB) 0% 100% 0.1%
Current unbalance (UNB) 0% 100% 0.1% ±10 ct
-1 1 0.001
0.001
-32.77
(1)
32.77
(1)
tan Φ < 10
0.01
tan Φ ≥ 10
±1° for Φ
±5 ct for cos Φ
±1° for Φ
±3 ct
UNB ≤ 10%
±10 ct
UNB > 10%
(1) |tan Φ| = 32,767 corresponds to Φ = ±88.25° + k × 180° (k being a natural number)
Find Quality Products Online at: sales@GlobalTestSupply.com
www.GlobalTestSupply.com
Page 91

91
Quantities concerning the spectral composition of the signals
Measurement range
Minimum
Maximum
0.1 %
1 %
0.1 %
n ≤ 25
1 %
0.1 %
±(2 % + (n × 0.3 %) + 5 ct)
1 %
±(2 % + (n × 0.6 %) + 5 ct)
Total voltage harmonic distortion (THD)
(referred to the fundamental) of voltage
current harmonic distortion (THD)
±(2.5 % + 5 ct)
or
±(2 % + (n
× 0.2 %) + 5 ct)
±(2 % + (n
× 0.5 %) + 5 ct)
Total current harmonic distortion (THD)
±(2.5 % + 5 ct)
n
or
±(2 % + (n
× 0.3 %) + 5 ct)
±(2 % + (n
× 0.6 %) + 5 ct)
Total voltage harmonic distortion (THD)
voltage
Total current harmonic distortion (THD)
±(2.5 % + 5 ct)
or
±(2 % + (n
× 0.2 %) + 5 ct)
±(2 % + (n
× 0.5 %) + 5 ct)
Total current harmonic distortion (THD)
±(2.5 % + 5 ct)
or
±(2 % + (n
× 0.3 %) + 5 ct)
±(2 % + (n
× 0.6 %) + 5 ct)
±(5 % + (n
× 0.4 %) + 5 ct)
±(10 % + (n
× 0.7 %) + 5 ct)
±(5 % + (n
× 0.4 %) + 5 ct)
max
±(10 % + (n
× 0.7 %) + 5 ct)
max
-179°
180°
1°
±(1.5° + 1° x (n ÷ 12.5)
Measurement
Voltage harmonic ratio (τn)
Current harmonic ratio (τn)
(non-Flex®)
Current harmonic ratio (τn)
(AmpFlex® & MiniFlex®)
Total
(referred to the fundamental) of current
(non-Flex®)
Display resolution Maximum intrinsic error
0 %
0 %
0 %
1500 %f
100 %r
1500 %f
100 %r
1500 %f
100 %r
0 % 999.9 % 0.1 % ±(2.5 % + 5 ct)
0 % 999.9 % 0.1 %
τn < 1000 %
τn ≥ 1000 %
τn < 1000 %
τn ≥ 1000 %
τn < 1000 %
τn ≥ 1000 %
±(2.5 % + 5 ct)
±(2 % + (n × 0.2 %) + 10 ct)
±(2 % + (n × 0.6 %) + 5 ct)
n > 25
n ≤ 25
n > 25
if ∀ n ≥ 1. τn ≤ (100 ÷ n) [%]
max
n
≤ 25
max
max
n
> 25
max
if ∀ n ≥ 1.
≤ (100 ÷ n2) [%]
τ
(referred to the fundamental) of current
0 % 999.9 % 0.1 %
(AmpFlex® & MiniFlex®)
(referred to the signal without DC) of
(referred to the signal without DC) of
0 % 100 % 0.1 % ±(2.5 % + 5 ct)
0 % 100 % 0.1 %
current (non-Flex®)
(referred to the signal without DC) of
0 % 100 % 0.1 %
current (AmpFlex® & MiniFlex®)
Harmonic loss factor (FHL) 1 99.99 0.01
K factor (FK) 1 99.99 0.01
Phase shifts of harmonics (order ≥ 2)
max
n
≤ 25
max
max
n
> 25
max
if ∀ n ≥ 1. τn ≤ (100 ÷ n) [%]
max
n
≤ 25
max
max
n
> 25
max
if ∀ n ≥ 1. τn ≤ (100 ÷ n2) [%]
max
n
≤ 25
max
max
n
> 25
max
max
n
≤ 25
max
max
n
> 25
max
max
n
≤ 25
max
n
> 25
NOTE: n
is the highest order for which the harmonic ratio is non-zero.
max
Find Quality Products Online at: sales@GlobalTestSupply.com
www.GlobalTestSupply.com
Page 92

92
Measurement
Measurement range
(with unity ratio)
Minimum
Maximum
100 mV
V < 1000 V
1 V
V ≥ 1000 V
100 mV
1 V
100 mV
V < 1000 V
1 V
V ≥ 1000 V
100 mV
U < 1000 V
1 V
±(2 % + (n x 0.2%) + 1 A)
n ≤ 25
A < 1000 A
±(2 % + (n x 0.2%) + 1 A)
n ≤ 25
1 A
A ≥ 1000 A
±(2 % + (n x 0.5%) + 1 A)
n > 25
±(2 % + (n x 0.2%) + 1 A)
n ≤ 25
±(2 % + (n x 0.5%) + 1 A)
n > 25
10 mA
±(2 % + (n x 0.2%) + 100 mA)
n ≤ 25
100 mA
A ≥ 100 A
±(2 % + (n x 0.5%) + 100 mA)
1 mA
±(2 % + (n x 0.2%) + 10 mA)
n ≤ 25
10 mA
A ≥ 10 A
±(2 % + (n x 0.5%) + 10 mA)
±(2 % + (n x 0.2%) + 10 mA)
n ≤ 25
±(2 % + (n x 0.5%) + 10 mA)
n > 25
1 A
A < 10 kA
±(2 % + (n x 0.3%) + 1 A + (Af
x 0.1%))
n ≤ 25
10 A
A ≥ 10 kA
±(2 % + (n x 0.6%) + 1 A + (Af
x 0.1%))
n > 25
100 mA
A < 1000 A
±(2 % + (n x 0.3%) + 1 A + (Af
x 0.1%))
n ≤ 25
1 A
A ≥ 1000 A
±(2 % + (n x 0.6%) + 1 A + (Af
x 0.1%))
n > 25
10 mA
A < 100 A
±(2 % + (n x 0.2%) + 30 pt)
n ≤ 25
100 mA
A ≥ 100 A
±(2 % + (n x 0.5%) + 30 pt)
n > 25
Display
resolution (with
unity ratio)
Maximum intrinsic error
RMS
harmonic
voltage
(order n ≥ 2)
RMS
distortion
voltage
simple 2 V 1000 V
compound 2 V 2000 V
(1)
(2)
U < 1000 V
U ≥ 1000 V
simple (Vd) 2 V 1000 V
compound (Ud) 2 V 2000 V
(1)
(2)
U ≥ 1000 V
J93 clamp 1 A 3500 A 1 A
100 mA
SR193 clamp
MR193 clamp
1 A 1000 A
MN93 clamp 200 mA 200 A 100 mA
SL261 clamp (10
mV/A) MN193
100 mA 100 A
A < 100 A
clamp (100 A)
±(2.5 % + 1 V)
±(2.5 % + 1 V)
±(2.5 % + 1 V)
±(2.5 % + 1 V)
n > 25
RMS
harmonic
SL261 clamp
(100 mV/A)
10 mA 10 A
current
(order n ≥ 2)
MN193 clamp (5
A) 5 A adapter
Essailec
®
5 mA 5 A 1 mA
adapter
AmpFlex
MiniFlex
® (4)
® (4)
10 A 10 kA
(10 kA)
AmpFlex
MiniFlex
® (4)
® (4)
10 A 6,500 A
(6500 A)
AmpFlex
MiniFlex
® (4)
® (4)
100 mA 100 A
(100 A)
(1) n
is the highest order for which the harmonic ratio is non-zero.
max
(2) Two-phase (opposite phases) – same note as (1).
(3) RMS value of the fundamental.
(4) Sensors compatible with the instrument (see §1.2).
A < 10 A
n > 25
RMS
RMS
RMS
RMS
(3)
(3)
(3)
(3)
Find Quality Products Online at: sales@GlobalTestSupply.com
www.GlobalTestSupply.com
Page 93

93
Measurement range
(with unity ratio)
Minimum
Maximum
100 mA
A < 1000 A
1 A
A ≥ 1000 A
10 mA
A < 100 A
100 mA
A ≥ 100 A
1 mA
A < 10 A
10 mA
A ≥ 10 A
MN193 clamp (5 A)
Essailec® adapter
1 A
A < 10 kA
10 A
A ≥ 10 kA
100 mA
A < 1000 A
1 A
A ≥ 1000 A
10 mA
A < 100 A
100 mA
A ≥ 100 A
(50% duty cycle)
2
PST ∈ [0.5 ; 5]
± 5%
PST ∈ [0.5 ; 5]
± 5%
39
PST ∈ [0.5 ; 12]
± 5%
PST ∈ [0.5 ; 10]
± 5%
1620
PST ∈ [0.25 ; 12]
± 15%
PST ∈ [0.25 ; 10]
± 15%
Display
Measurement
resolution
Maximum intrinsic error
(with unity ratio)
±((n
J93 clamp 1 A 3500 A 1 A
x 0.4%) + 1 A)
max
RMS
distortion
current
(1)
(Ad)
SR193 clamp MR193
clamp
1 A 1000 A
MN93 clamp 200 mA 200 A 100 mA
SL261 clamp (10 mV/A)
MN193 clamp (100 A)
SL261 clamp (100
mV/A)
5 A adapter
AmpFlex
MiniFlex
® (2)
® (2)
0.1A 100 A
10 mA 10 A
5 mA 5 A 1 mA
10 A 10 kA
(10 kA)
AmpFlex
MiniFlex
® (2)
® (2)
10 A 6500 A
(6500 A)
AmpFlex
MiniFlex
® (2)
® (2)
100 mA 100 A
(100 A)
±((n
x 0.4%) + 1 A)
max
±((n
x 0.4%) + 1 A)
max
±((n
x 0.4%) + 100 mA)
max
±((n
x 0.4%) + 10 mA)
max
x 0.4%) + 10 mA)
±((n
max
±((n
x 0.4%) + 1 A)
max
±((n
x 0.4%) + 1 A)
max
±(n
x 0.5%) + 30 pt)
max
(1) In 1000 V
, category III, provided that the voltage between each of the terminals and earth does not exceed 1000 V
RMS
(2) Sensors compatible with the instrument (see §1.2).
Severity of short-term flicker
Rectangular variations
per minute
1
7
110
Range of current and voltage ratios
Ratio Minimum Maximum
Voltage
Current
(1)
100
1000 x √3
.
RMS
Maximum intrinsic error of the short-term flicker severity measurement (PST)
120 V lamp
60 Hz network
PST ∈ [0.5 ; 4]
PST ∈ [0.5 ; 7]
PST ∈ [0.5 ; 12]
1 60,000 / 1
± 5%
± 5%
± 5%
9,999,900 x √3
0.1
PST ∈ [0.5 ; 4]
PST ∈ [0.5 ; 8]
PST ∈ [0.5 ; 10]
230 V lamp
50 Hz network
± 5%
± 5%
± 5%
(1) Only for the MN193 clamp (5 A), the 5 A adapter and the Essailec® adapter.
Find Quality Products Online at: sales@GlobalTestSupply.com
www.GlobalTestSupply.com
Page 94

94
Measurement ranges after application of the ratios
Measurement range
Minimum
Maximum
RMS & RMS ½ voltage
simple
120 mV
170 GV
compound
320 mV
480 GV
Active energy (Ph)
(1)
Measurement
with minimum ratio(s)
compound 120 mV 340 GV
Direct voltage (DC) simple 120 mV 200 GV
compound 120 mV 400 GV
Peak voltage (PK) simple 160 mV 240 GV
RMS & RMS ½ current 5 mA 300 kA
Direct current (DC) 10 mA 5 kA
Peak current (PK) 7 mA 420 kA
Active power (P)
DC power (Pdc)
Reactive power (Q1)
non-active (N) and
distortion power (D)
Apparent power (S)
DC energy (Pdch)
Reactive energy (Q1h)
non-active (Nh) and
distortion energy (Dh)
Apparent energy (Sh)
600 µW
1.2 mW
600 µvar
600 µVA
1 mWh
1 mWh
1 mvarh
1 mVAh
with maximum ratio(s)
9 999 999 EWh
9 999 999 EWh
9 999 999 Evarh
9 999 999 EVAh
51 PW
1 PW
51 Pvar
51 PVA
(3)
(3)
(3)
(3)
(2)
(1)
(1)
(1) Energy corresponds to more than 22,000 years of the associated maximum power (maximum ratios).
(2) Energy Pdch corresponds to more than 1 million years at maximum power Pdc (maximum ratios).
(3) Maximum value calculated for a 2-wire single-phase connection (phase-to-ground voltage).
Find Quality Products Online at: sales@GlobalTestSupply.com
www.GlobalTestSupply.com
Page 95

95
15.3.5. CURRENT SENSOR SPECIFICATIONS (AFTER LINEARIZATION)
Type of sensor
RMS current (Arms)
Maximum error for Arms
Maximum error for Φ
®
(1)
6500 A / 10 kA
[10 A ; 100 A[
±3 %
±1°
[100 A ; 10 kA]
±2 %
±0.5°
®
(1)
6500 A / 10 kA
[10 A ; 100 A[
±3 %
±1°
[100 A ; 10 kA]
±2 %
±0.5°
®
(1)
100 A
[100 mA ; 100 A]
±3 %
±1°
®
(1)
100 A
[100 mA ; 100 A]
±3 %
±1°
[3 A ; 50 A[
-
-
[50 A ; 100 A[
±(2 % + 2.5 A)
±4°
[100 A ; 500 A[
±(1.5 % + 2.5 A)
±2°
[500 A ; 2000 A[
±1 %
±1°
[2000 A ; 3500 A]
±1 %
±1.5°
]3500 A ; 5000 A] DC
±1 %
-
[1 A ; 10 A[
±0.8 %
±1°
[10 A ; 100 A[
±0.3 %
±0.5°
[100 A ; 1000 A]
±0.2 %
±0.3°
[1 A ; 10 A[
±(1.5 % + 1 A)
-
[10 A ; 100 A[
±(1.5 % + 1 A)
±2°
[100 A ; 200 A[
±3 %
±1.5°
[200 A ; 800 A[
±3 %
±1.5°
[800 A ; 1000 A[
±5 %
±1.5°
]1000 A ; 1300 A] DC
±5 %
-
[200 mA ; 500 mA[
-
-
[500 mA ; 10 A[
±(3 % + 1 A)
-
[10 A ; 40 A[
±(2.5 % + 1 A)
±3°
[40 A ; 100 A[
±(2.5 % + 1 A)
±3°
[100 A ; 200 A]
±(1 % + 1 A)
±2°
[100 mA ; 1 A[
±(0.7 % + 2 mA)
±1.5°
[1 A ; 100 A]
±0.7 %
±0.7°
[100 mA ; 40 A[
±(2 % + 50 mA)
±0.5°
[40 A ; 100 A]
±7.5 %
±0.5°
[10 mA ; 10 A]
±(1.5 % + 50 mA)
±1°
[5 mA ; 50 mA[
±(1 % + 100 µA)
±1.7°
[50 mA ; 500 mA[
±1 %
±1°
[500 mA ; 5 A]
±0.7 %
±1°
[5 mA ; 50 mA[
±(1 % + 1.5 mA)
±1°
[50 mA ; 1 A[
±(0.5 % + 1 mA)
±0°
[1 A ; 5 A]
± 0.5 %
±0°
NOTE: This table does not take into account possible distortion of the measured signal (THD) because of the physical
Sensor errors are offset by a typical correction inside the instrument. This typical correction, applied to the phase and amplitude,
depends on the type of sensor connected (detected automatically) and the gain in the current acquisition channel used.
The RMS current measurement error and phase error are additional errors (which must therefore be added to the instrument errors),
indicated as influences on the calculations carried out by the analyzer (powers, energies, power factors, tangents, etc.).
AmpFlex
MiniFlex
AmpFlex
MiniFlex
J93 clamp
3500 A
SR193 clamp
1000 A
MR193 clamp
1000 A
MN93 clamp
200 A
MN193 clamp
100 A
SL261 clamp (10 mV/A)
100A
SL261 clamp (100 mV/A)
10A
Clamp MN193
5 A
5 A adapter
Essailec® adapter
(1) Sensors compatible with the instrument (see §1.2).
limitations of the current sensor (saturation of the magnetic circuit or of the Hall-effect cell). Class B under standard
IEC61000-4-30.
Find Quality Products Online at: sales@GlobalTestSupply.com
www.GlobalTestSupply.com
Page 96
96
15.4. CLASS B UNDER STANDARD IEC 61000-4-30
[42.5 Hz ; 69 Hz]
±10 mHz
[50 V ; 1000 V]
[0 % ; 10 %]
±0.3 % or ±3 ct
[50 V ; 1000 V]
[2 V ; 1000 V]
±(2.5 % + 1 V)
15.4.1. INSTRUMENT CONFORMITY
The instrument and DataView PowerPad III Control Panel software are compliant with class B of standard IEC61000-4-30 for the
following parameters:
■
Industrial frequency
■
Supply voltage amplitude
■
Flicker
■
Supply voltage brownouts
■
Temporary overvoltages at industrial frequency
■
Supply voltage blackouts
■
Voltage transients
■
Supply voltage unbalance
■
Voltage harmonics
To ensure this compliance, trend recordings (Trend mode) must be made with:
■
Recording period of one second
■
Vrms and Urms selected
■
V-h01 and U-h01 selected
15.4.2. UNCERTAINTIES AND MEASUREMENT RANGES
Parameter Range Uncertainty
Industrial frequency
Supply voltage amplitude
Flicker [0.25 ; 12] See the corresponding tables
Supply voltage
brownouts
Temporary
overvoltages at
industrial frequency
Supply voltage
blackouts
Supply voltage unbalance
Voltage harmonics
Residual voltage
Duration
Maximum
amplitude
Duration [10 ms ; 65,535 days]
Duration [10 ms ; 65,535 days]
Rate
Voltage
[50 V ; 1000 V]
[5 % of U
[10 ms ; 65,535 days]
[U
din
[0 % ; 1500 %] ±(2.5 % + 5 ct)
; U
din
; 150 % of U
] ±2 % of U
din
] ±2 % of U
din
±1 % of U
80 ppm ±10 ms (maximum)
30 ppm ±10 ms (typical)
80 ppm ±10 ms (maximum)
30 ppm ±10 ms (typical)
80 ppm ±10 ms (maximum)
30 ppm ±10 ms (typical)
din
din
din
U
din
[50 V ; 1000 V]
V ∈ {120 V ; 230 V}
U ∈ {207 V ; 400 V}
[50 V ; 1000 V]
[50 V ; 1000 V]
[50 V ; 1000 V]
[50 V ; 1000 V]
15.4.3. REAL-TIME CLOCK UNCERTAINTY
The uncertainty of the real-time clock is 80 ppm at most (instrument 3 years old used at an ambient temperature of 122°F [50°C]).
With a new instrument at 77°F (25°C), this uncertainty is only 30 ppm.
Find Quality Products Online at: sales@GlobalTestSupply.com
www.GlobalTestSupply.com
Page 97

97
16. MAINTENANCE
Except for the battery and the memory card, the instrument contains no parts that can be replaced by personnel
who have not been specially trained and accredited. Any unauthorized repair or replacement of a part by an
“equivalent” may seriously impair safety.
16.1. CLEANING THE CASING
Disconnect the instrument from all connections and turn it OFF.
Use a soft cloth, dampened with soapy water. Rinse with a damp cloth and dry rapidly with a dry cloth or forced air. Do not use alcohol,
solvents, or hydrocarbons.
16.2. SENSORS
Current sensors must be maintained as follows:
■
Clean with a sponge and soapy water, rinse with a sponge and clean water, and dry rapidly.
■
Keep the air gaps of the clamps (MN93, MN193, SR193, MR193 and SL261) perfectly clean using a cloth. Lightly oil visible
metal parts to avoid rust.
16.3. BATTERY REPLACEMENT
To ensure safety, replace the battery only with the original model.
■
Do not throw the battery into a fire.
■
Do not expose the battery to a temperature in excess of 212°F (100°C).
■
Do not short-circuit the terminals of the battery pack.
Remove the old battery.
To eliminate all risk of electric shock, disconnect the power supply cord and measurement leads of the instrument.
1. Using a Phillips screwdriver, remove the 6 screws of the battery compartment cover.
Figure 16-1
Find Quality Products Online at: sales@GlobalTestSupply.com
www.GlobalTestSupply.com
Page 98

98
2. Remove the cover.
Figure 16-2
3. Tilt the top of the battery outward and remove it from its compartment.
Figure 16-3
4. Disconnect the battery connector without pulling on the wires.
The instrument retains the date-time function for approximately 24 hours without the battery.
Spent batteries must not be treated as ordinary household waste. Take them to the appropriate recycling collection point.
Installing the new battery.
1.
Connect the new battery. The connector is error-proofed to prevent reversals of polarity.
2.
Place the bottom of the battery in its compartment, then the top. Arrange the wires so that they do not protrude.
3.
Put the battery compartment cover back in place and screw the 6 screws back in.
If the battery is disconnected, it must then be fully recharged, even if it is not replaced, so that the instrument can detect the
battery charge condition (this information is lost when the battery is disconnected).
Find Quality Products Online at: sales@GlobalTestSupply.com
www.GlobalTestSupply.com
Page 99

99
16.4. MEMORY CARD
Memory card protected
The instrument accepts SD (SDSC), SDHC, and SDXC type memory cards. The card supplied with the instrument can store up to
8GB. (Note, however, that the maximum size of a trend recording is 2GB.)
Before removing or inserting the memory card, ensure the instrument is disconnected and powered OFF. Write-protect the memory
card when you remove it from the instrument. Unlock write-protection before inserting the card back into the instrument.
Memory card not protected
To access the memory card, proceed as for the replacement of the battery.
1. Make sure that the instrument is disconnected and OFF.
2. Remove the cover and remove the battery from its compartment without disconnecting it.
3. Press on the memory card to release it, then press on the protecting tab to remove it from its slot. You can then grip the card.
Figure 16-4
4. When you replace the memory card, the contacts must be on the left side and the locator down.
Figure 16-5
5. Insert the card into its slot until it snaps into place. The protecting tab is at the top of the card.
6. Put the battery back in its compartment and screw the cover back on.
Find Quality Products Online at: sales@GlobalTestSupply.com
www.GlobalTestSupply.com
Page 100

100
16.5. FIRMWARE UPDATE
AEMC on occasion may update the firmware that controls instrument operation. These updates are available for free download from
the AEMC Downloads web site at
and downloading updates as they become available. Upgrade instructions are included on the web site.
To check the current firmware revision running on your instrument, press to display the Configuration menu, then select the
About option. This displays the About screen (see Figure 4-24), which includes the firmware version number currently running on the
instrument. Compare this number against the firmware version posted on the AEMC Downloads site to determine whether or not your
instrument should be updated.
Firmware update erases all data (configuration, alarm campaigns, snapshots, inrush current capture, transient detection,
trend recordings). Save any data you want to keep to a computer via the DataView PowerPad III Control Panel (see §13)
before updating firmware.
. We recommend checking this site regularly
Find Quality Products Online at: sales@GlobalTestSupply.com
www.GlobalTestSupply.com
 Loading...