

Page 1

n
3-PHASE POWER QUALITY
ANALYZER
8435
®
PowerPad
ENGLISH
IMPORTANT WARRANTY NOTE:
By registering online within 30 days from the date of
purchase, your warranty will be extended to 3 years
User Manual
Page 2

Thank you for purchasing a PowerPad® III Model 8435
For best results from your instrument and for your safety, read the enclosed operating instructions carefully and comply
with the precautions for use. These products must be only used by qualied and trained users.
WARNING, risk of DANGER! The operator must refer to
these instructions whenever this danger symbol appears.
CAUTION! Risk of electric shock. The voltage at the
parts marked with this symbol may be dangerous.
Equipment is protected by double insulation.
USB socket.
SD Card.
Ground/Earth.
Important instructions to read and to fully understand.
Useful information or hint to read.
The CE marking guarantees conformity with European directives and with regulations covering EMC.
The trash can with a line through it means that in the European Union, the product must undergo selective disposal for the
recycling of electric and electronic material, in compliance with Directive WEEE 2002/96/EC.
Denition of Measurement Categories (CAT)
■ CAT IV Measurement category IV corresponds to measurements taken at the source of low-voltage installations.
Example: power feeders, counters and protection devices.
■ CAT III Measurement category III corresponds to measurements on building installations.
Example: distribution panel, circuit-breakers, machines or xed industrial devices.
■ CAT II Measurement category II corresponds to measurements taken on circuits directly connected to low-voltage
installations. Example: power supply to domestic electrical appliances and portable tools.
PRECAUTIONS FOR USE
This instrument and its accessories comply with safety standards IEC 61010-1, IEC 61010-031, and IEC 61010-2-032 for
voltages of 600V in category IV or 1000V in category III.
Failure to observe the safety instructions may result in electric shock, re, explosion, and destruction of the instrument
and of the installations.
● The operator and/or the responsible authority must carefully read and clearly understand the various precautions to be
taken in use. Sound knowledge and a keen awareness of electrical hazards are essential when using this instrument.
● If you use this instrument other than as specied, the protection it provides may be compromised, thereby
endangering you.
● Do not use the instrument on networks of which the voltage or category exceeds those mentioned.
● Do not use the instrument if it seems to be damaged, incomplete, or poorly closed.
● Before each use, check the condition of the insulation on the leads, housing, and accessories. Any item of which the
insulation is deteriorated (even partially) must be set aside for repair or scrapping.
● Use only the leads and accessories supplied. Using leads (or accessories) of a lower voltage or category reduces the
voltage or category of the combined instrument + leads (or accessories) to that of the leads (or accessories).
● Use personal protection equipment systematically.
● Keep your hands away from the terminals of the device.
● When handling the leads, test probes, and crocodile clips, keep your ngers behind the physical guard.
● Use only the mains power adaptor and battery pack supplied by the manufacturer. They include specic safety
features.
● Some current sensors must not be placed on or removed from bare conductors at hazardous voltages: refer to the
sensor manual and comply with the handling instructions.
Page 3

READ CAREFULLY BEFORE
USING FOR THE FIRST TIME
Your instrument is equipped with a NiMH battery. This technology oers several advantages:
● Long battery charge life for a limited volume and weight.
● Possibility of quickly recharging your battery.
● Signicantly reduced memory eect: you can recharge your battery even if it is not fully discharged.
● Respect for the environment: no pollutant materials such as lead or cadmium, in compliance with the applicable
regulations.
After prolonged storage, the battery may be completely discharged. If so, it must be completely recharged.
Your instrument may not function during part of this recharging operation.
Full recharging of a completely discharged battery may take several hours.
NOTE: In this case, at least 5 charge/discharge cycles will be necessary for your battery to recover 95% of its capacity.
To make the best possible use of your battery and extend its eective service life:
● Only use the charger supplied with your instrument. Use of another charger may be dangerous.
● Only charge your instrument at temperatures between 0° and 40°C.
● Comply with the conditions of use dened in the operating manual.
● Comply with the storage conditions specied in the operating manual.
NiMH technology allows a limited number of charge/discharge cycles depending signicantly on:
● The conditions of use.
● The charging conditions.
Do not dispose of the battery pack with other solid waste. Used batteries must be entrusted to a qualied recycling
company or to a company specialized in processing hazardous materials.
Page 4

TABLE OF CONTENTS
1. INTRODUCTION .............................................................................................................................................. 7
1.1 RECEIVING YOUR SHIPMENT ............................................................................................................................................... 7
1.2 ORDERING INFORMATION ..................................................................................................................................................... 7
1.2.1 ACCESSORIES ............................................................................................................................................................. 7
1.2.2 REPLACEMENT PARTS ............................................................................................................................................... 7
2. PRODUCT FEATURES .................................................................................................................................... 8
2.1 DESCRIPTION ........................................................................................................................................................................... 8
2.2 KEY FEATURES ........................................................................................................................................................................ 8
2.3 CONTROL FUNCTIONS ......................................................................................................................................................... 10
2.4 CONNECTION TERMINALS ................................................................................................................................................... 10
2.5 DISPLAY ....................................................................................................................................................................................11
2.6 BUTTON FUNCTIONS ............................................................................................................................................................ 12
3. OPERATION .................................................................................................................................................. 14
3.1 GETTING STARTED................................................................................................................................................................ 14
3.1.1 CONNECTING ............................................................................................................................................................. 14
3.1.2 DISCONNECTING ....................................................................................................................................................... 14
3.2 INSTRUMENT CONFIGURATION (SET-UP MODE)...............................................................................................15
3.2.1 DATE/TIME ................................................................................................................................................................... 16
3.2.2 DISPLAY ....................................................................................................................................................................... 17
3.2.2.1 CONTRAST/BRIGHTNESS ............................................................................................................................... 17
3.2.2.2 COLORS .............................................................................................................................................................. 17
3.2.2.3 DISPLAY SHUTDOWN (AUTO POWER OFF) ................................................................................................. 18
3.2.3 CALCULATION METHODS ........................................................................................................................................ 18
3.2.3.1 ENERGY UNIT .................................................................................................................................................... 19
3.2.3.2 K FACTOR ........................................................................................................................................................... 19
3.2.3.3 PHASE HARMONIC RATIOS ............................................................................................................................. 20
3.2.3.4 LONG-TERM FLICKER ...................................................................................................................................... 20
3.2.4 ELECTRICAL HOOK-UP ............................................................................................................................................. 21
3.2.5 PROBES AND RATIOS ............................................................................................................................................... 25
3.2.5.1 CURRENT PROBES ........................................................................................................................................... 25
3.2.5.2 VOLTAGE RATIOS .............................................................................................................................................. 26
3.2.6 CAPTURE MODE ........................................................................................................................................................ 27
3.2.6.1 TRANSIENT VOLTAGE THRESHOLDS ........................................................................................................... 27
3.2.6.2 TRANSIENT CURRENT THRESHOLDS .......................................................................................................... 28
3.2.6.3 INRUSH CURRENT THRESHOLDS ................................................................................................................. 29
3.2.7 TREND MODE ............................................................................................................................................................. 30
3.2.8 ALARM MODE CONFIGURATION ............................................................................................................................. 32
3.2.9 ERASING MEMORY .................................................................................................................................................... 33
3.2.10 ABOUT ........................................................................................................................................................................ 34
4. DISPLAY MODES .......................................................................................................................................... 35
4.1 WAVEFORM CAPTURE MODE
4.1.1 TRANSIENT MODE
2
.............................................................................................................................................. 35
.................................................................................................................................................... 35
Power Quality Analyzer PowerPad® III Model 8435
Page 5

4.1.1.1 PROGRAMMING AND STARTING A SEARCH ................................................................................................ 35
4.1.1.2 STOPPING A SEARCH....................................................................................................................................... 36
4.1.1.3 DISPLAYING A TRANSIENT .............................................................................................................................. 37
4.1.1.4 DELETING A TRANSIENT ................................................................................................................................. 38
4.1.2 INRUSH CURRENT MODE
4.1.2.1 PROGRAMMING A CAPTURE .......................................................................................................................... 39
4.1.2.2 STARTING A CAPTURE ..................................................................................................................................... 40
4.1.2.3 MANUALLY STOPPING A CAPTURE ............................................................................................................... 40
4.1.2.4 DISPLAYING THE PARAMETERS OF A CAPTURE ........................................................................................ 40
4.1.3 TRUE RMS CURRENT AND VOLTAGE .................................................................................................................... 41
4.1.3.1 RMS DISPLAY SCREEN (3A) ............................................................................................................................ 41
4.1.3.2 RMS DISPLAY SCREEN (L1)............................................................................................................................. 42
4.1.4 INSTANTANEOUS INRUSH CURRENT .................................................................................................................... 43
4.1.4.1 PEAK DISPLAY SCREEN (4A) .......................................................................................................................... 43
4.1.4.2 PEAK DISPLAY SCREEN (A1) .......................................................................................................................... 44
4.2 HARMONICS MODE
4.2.1 PHASE-TO-NEUTRAL VOLTAGE HARMONIC ......................................................................................................... 44
4.2.1.1 PHASE-TO-NEUTRAL HARMONICS DISPLAY SCREEN (3L) ....................................................................... 45
4.2.1.2 PHASE VOLTAGE HARMONICS DISPLAY SCREEN (L1) .............................................................................. 45
4.2.2 CURRENT .................................................................................................................................................................... 46
4.2.2.1 CURRENT HARMONICS DISPLAY SCREEN (3L) .......................................................................................... 46
4.2.2.2 CURRENT HARMONICS DISPLAY SCREEN (L1) .......................................................................................... 47
4.2.3 APPARENT POWER ................................................................................................................................................... 48
4.2.3.1 APPARENT POWER HARMONICS DISPLAY SCREEN (3L) .......................................................................... 48
4.2.3.2 APPARENT POWER HARMONICS DISPLAY SCREEN (L1) .......................................................................... 48
4.2.4 PHASE-TO-PHASE VOLTAGE ................................................................................................................................... 49
4.2.4.1 PHASE-TO-PHASE VOLTAGE HARMONICS DISPLAY SCREEN (3L) ......................................................... 49
4.2.4.2 PHASE-TO-PHASE VOLTAGE DISPLAY SCREEN (L1) ................................................................................. 50
4.2.5 HARMONIC ANALYSIS IN EXPERT MODE .............................................................................................................. 51
4.3 WAVEFORM MODE
4.3.1 RMS MEASUREMENT ................................................................................................................................................ 52
4.3.1.1 RMS DISPLAY SCREEN (3U) ............................................................................................................................ 52
4.3.1.2 RMS DISPLAY SCREEN (4V) ............................................................................................................................ 53
4.3.1.3 RMS DISPLAY SCREEN (4A) ............................................................................................................................ 53
4.3.1.4 RMS DISPLAY SCREEN (NEUTRAL) ............................................................................................................... 54
4.3.2 THD MEASUREMENT OF TOTAL HARMONIC DISTORTION ................................................................................ 54
4.3.2.1 THD DISPLAY SCREEN (3U) ............................................................................................................................. 54
4.3.2.2 THD DISPLAY SCREEN (3V) ............................................................................................................................. 55
4.3.2.3 THD DISPLAY SCREEN (3A) ............................................................................................................................. 55
4.3.3 MEASUREMENT OF THE PEAK FACTOR (CF) ....................................................................................................... 56
4.3.3.1 CF DISPLAY SCREEN (3U) ............................................................................................................................... 56
4.3.3.2 CF DISPLAY SCREEN (3V) ............................................................................................................................... 57
4.3.3.3 CF DISPLAY SCREEN (3A) ............................................................................................................................... 57
4.3.4 MEASUREMENT OF MIN/MAX/AVERAGE/VOLTAGE/CURRENT VALUES ......................................................... 58
4.3.5 SIMULTANEOUS DISPLAY ....................................................................................................................................... 59
4.3.6 DISPLAY OF PHASOR DIAGRAM ............................................................................................................................. 60
4.4 ALARM MODE
4.4.1 PROGRAMMING AN ALARM ..................................................................................................................................... 61
............................................................................................................................................................... 44
................................................................................................................................................................. 51
.......................................................................................................................................................................... 61
........................................................................................................................................ 38
Power Quality Analyzer PowerPad® III Model 8435
3
Page 6

4.4.2 STARTING AN ALARM ................................................................................................................................................ 62
4.4.3 MANUALLY STOPPING AN ALARM .......................................................................................................................... 62
4.4.4 DISPLAYING AN ALARM LOG ................................................................................................................................... 62
4.4.5 DELETING AN ALARM LOG ....................................................................................................................................... 63
4.5 TREND MODE
4.5.1 PROGRAMMING AND STARTING A RECORDING ................................................................................................. 63
4.5.2 MANUALLY STOPPING A RECORDING ................................................................................................................... 64
4.5.3 DISPLAYING THE RECORDING LIST ...................................................................................................................... 64
4.5.4 DELETING A RECORDING ........................................................................................................................................ 64
4.6 POWER AND ENERGY MODE .............................................................................................................................................. 64
4.6.1 3L FILTER ..................................................................................................................................................................... 65
4.6.1.1 3L POWER FACTOR .......................................................................................................................................... 66
4.6.1.2 3L ENERGY CONSUMED .................................................................................................................................. 66
4.6.1.3 3L ENERGY GENERATED ................................................................................................................................. 67
4.6.2 L1, L2, AND L3 FILTERS ............................................................................................................................................. 68
4.6.2.1 L1, L2, L3 ENERGY METERS ........................................................................................................................... 69
4.6.3 Σ FILTER ...................................................................................................................................................................... 69
4.6.3.1 Σ ENERGY METERS .......................................................................................................................................... 70
4.6.4 STARTING AND STOPPING ENERGY MEASUREMENTS..................................................................................... 71
4.6.5 RESETTING THE ENERGY MEASUREMENT ......................................................................................................... 71
4.7 SNAPSHOT MODE
4.7.1 OPENING A PREVIOUSLY SAVED SNAPSHOT ...................................................................................................... 71
4.7.2 DELETING A SNAPSHOT ........................................................................................................................................... 72
4.8 HELP
........................................................................................................................................................................................ 72
......................................................................................................................................................................... 63
.................................................................................................................................................................. 71
5. DATAVIEW® SOFTWARE ..............................................................................................................................73
5.1 INSTALLING DATAVIEW® ....................................................................................................................................................... 73
5.1.1 USB FLASH DRIVE INSTALL ..................................................................................................................................... 73
5.2 CONNECTING THE MODEL 8435 TO YOUR COMPUTER ................................................................................................. 76
5.3 OPENING THE CONTROL PANEL ........................................................................................................................................ 76
5.4 CONFIGURING THE INSTRUMENT ..................................................................................................................................... 78
5.4.1 SETUP .......................................................................................................................................................................... 78
5.4.2 SENSORS AND RATIOS ............................................................................................................................................ 79
5.4.3 INSTRUMENT DISPLAY ............................................................................................................................................. 79
5.4.4 ALARM CONDITIONS ................................................................................................................................................. 80
5.4.5 RECORDINGS ............................................................................................................................................................ 82
5.4.6 TRANSIENTS............................................................................................................................................................... 83
5.4.7 INRUSH ........................................................................................................................................................................ 84
5.5 REAL-TIME DATA .................................................................................................................................................................... 85
5.5.1 TREND .......................................................................................................................................................................... 85
5.5.2 WAVEFORM ................................................................................................................................................................. 85
5.5.3 HARMONICS ............................................................................................................................................................... 86
5.5.4 POWER ....................................................................................................................................................................... 86
5.5.5 ENERGY ....................................................................................................................................................................... 87
5.6 DOWNLOADING DATA ........................................................................................................................................................... 87
5.6.1 RECORDINGS ............................................................................................................................................................. 88
5.6.2 PHOTOGRAPHS ......................................................................................................................................................... 88
5.6.3 ALARMS ....................................................................................................................................................................... 88
4
Power Quality Analyzer PowerPad® III Model 8435
Page 7

5.6.4 TRANSIENTS............................................................................................................................................................... 88
5.6.5 INRUSH ........................................................................................................................................................................ 88
5.6.6 EDITING DOWNLOADED DATA ................................................................................................................................ 89
6. SPECIFICATIONS .......................................................................................................................................... 90
6.1 REFERENCE CONDITIONS................................................................................................................................................... 90
6.2 ELECTRICAL SPECIFICATIONS ........................................................................................................................................... 91
6.2.1 VOLTAGE INPUTS ...................................................................................................................................................... 91
6.2.2 CURRENT INPUTS ..................................................................................................................................................... 91
6.2.3 ACCURACY SPECIFICATIONS (EXCLUDING CURRENT PROBES) ................................................................... 91
6.2.4 CURRENT PROBE ACCURACY (TO BE ADDED TO THE MODEL 8435’S ACCURACY) .................................... 99
6.2.5 CURRENT PROBES AND SENSORS ..................................................................................................................... 100
6.2.6 THREE-PHASE 5A ADAPTER BOX (3-CHANNEL USE ONLY) ............................................................................ 102
6.2.7 POWER SUPPLY ....................................................................................................................................................... 103
6.3 MECHANICAL SPECIFICATIONS........................................................................................................................................ 103
6.4 ENVIRONMENTAL SPECIFICATIONS ................................................................................................................................ 104
6.5 SAFETY SPECIFICATIONS .................................................................................................................................................. 104
7. MAINTENANCE ........................................................................................................................................... 105
7.1 BATTERY INDICATOR .......................................................................................................................................................... 105
7.2 RECHARGING THE BATTERY ............................................................................................................................................ 105
7.3 CHANGING THE BATTERY .................................................................................................................................................. 105
7.4 CLEANING ............................................................................................................................................................................. 106
7.5 UPDATING SOFTWARE & FIRMWARE .............................................................................................................................. 106
7.6 REPAIR AND CALIBRATION ................................................................................................................................................ 107
7.7 TECHNICAL AND SALES ASSISTANCE ............................................................................................................................. 107
7.8 LIMITED WARRANTY ........................................................................................................................................................... 107
7.9 WARRANTY REPAIRS .......................................................................................................................................................... 108
APPENDIX A .................................................................................................................................................... 109
A.1 MATHEMATICAL FORMULAS FOR VARIOUS PARAMETERS ........................................................................................ 109
A.1.1 NETWORK FREQUENCY AND SAMPLING ........................................................................................................... 109
A.1.2 WAVEFORM MODE .................................................................................................................................................. 109
A.1.2.1 RMS VALUES OF HALF-CYCLE VOLTAGE AND CURRENT (EXCLUDING NEUTRAL) .......................... 109
A.1.2.2 MINIMUM AND MAXIMUM HALF-CYCLE RMS VALUES (EXCLUDING NEUTRAL) .................................110
A.1.2.3 SEVERITY OF SHORT-TERM FLICKER – 10 MINUTES (EXCLUDING NEUTRAL) ................................11 0
A.1.2.4 SEVERITY OF LONG-TERM FLICKER – 2 HOURS (EXCLUDING NEUTRAL) ..........................................110
A.1.2.5 PEAK VALUES (NEUTRAL EXCEPT UPP AND UPM – OVER 250MS) ....................................................... 111
A.1.2.6 PEAK FACTORS (NEUTRAL INCLUDED EXCEPT UCF – OVER ONE SECOND) .................................... 111
A.1.2.7 RMS VALUES (NEUTRAL EXCEPT URMS - OVER ONE SECOND) ........................................................... 111
A.1.2.8 REVERSE UNBALANCES (THREE-PHASE CONNECTION – OVER ONE SECOND) ..............................112
A.1.2.9 FUNDAMENTAL RMS VALUES (EXCLUDING NEUTRAL – OVER ONE SECOND) ..................................113
A.1.2.10 FUNDAMENTAL ANGULAR VALUES (EXCLUDING NEUTRAL – OVER ONE SECOND).......................113
A.1.3 HARMONIC MODE ....................................................................................................................................................113
A.1.3.1 HFFT (NEUTRAL INCLUDED EXCEPT FOR UHARM AND VAHARM) ........................................................11 3
A.1.3.2 HARMONIC DISTORTIONS .............................................................................................................................114
A.1.3.3 HARMONIC LOSS FACTOR (EXCLUDING NEUTRAL – OVER 4 CONSECUTIVE CYCLES) ..................11 4
A.1.3.4 K FACTOR (EXCLUDING NEUTRAL – OVER 4 CONSECUTIVE CYCLES EVERY SECOND) ................115
A.1.3.5 SEQUENCE HARMONICS (OVER 3 × (4 CONSECUTIVE CYCLES) EVERY SECOND) ..........................115
Power Quality Analyzer PowerPad® III Model 8435
5
Page 8

A.1.4 POWERS ...................................................................................................................................................................11 6
A.1.4.1 DISTRIBUTION SYSTEM WITH NEUTRAL ....................................................................................................11 6
A.1.4.2 THREE-PHASE SYSTEM WITHOUT NEUTRAL ............................................................................................117
A.1.4.3 TWO-PHASE SYSTEMS WITHOUT NEUTRAL .............................................................................................119
A.1.5 POWER RATIOS (EXCLUDING NEUTRAL – OVER ONE SECOND) .................................................................. 120
A.1.5.1 DISTRIBUTION SYSTEM WITH NEUTRAL ................................................................................................... 120
A.1.5.2 THREE-PHASE SYSTEM WITHOUT NEUTRAL ........................................................................................... 121
A.1.5.3 TWO-PHASE SYSTEM WITHOUT NEUTRAL ............................................................................................... 121
A.1.6 ENERGY .................................................................................................................................................................. 122
A.1.6.1 DISTRIBUTION SYSTEM WITH NEUTRAL ................................................................................................... 122
A.1.6.2 DISTRIBUTION SYSTEM WITHOUT NEUTRAL ........................................................................................... 124
A.1.7 HYSTERESIS ............................................................................................................................................................ 126
A.1.7.1 SURGE DETECTION ....................................................................................................................................... 126
A.1.7.2 UNDERVOLTAGE OR BLACKOUT DETECTION .......................................................................................... 126
A.1.8 MINIMUM SCALE VALUES FOR WAVEFORMS AND MINIMUM RMS VALUES ............................................... 127
A.1.9 FOUR-QUADRANT DIAGRAM ................................................................................................................................ 127
A.1.10 MECHANISM FOR TRIGGERING TRANSIENT SENSORS .............................................................................. 127
A.1.11 CAPTURE CONDITIONS IN INRUSH CURRENT MODE ................................................................................... 128
A.2 GLOSSARY OF TERMS ....................................................................................................................................................... 129
A.3 SYMBOLS AND ABBREVIATIONS ...................................................................................................................................... 130
6
Power Quality Analyzer PowerPad® III Model 8435
Page 9

1. INTRODUCTION
1.1 RECEIVING YOUR SHIPMENT
NOTE: After receiving your PowerPad® III Model 8435, charge and discharge the instrument one or two cycles to ensure the
proper level display of the battery indicator.
Make sure the contents shipped are consistent with the packing list. Notify your distributor of any missing items. If the
equipment appears damaged, le a claim immediately with the carrier and notify your distributor at once. Save the damaged
packing container to substantiate your claim. Do not use equipment which is damaged or appears to be damaged.
1.2 ORDERING INFORMATION
PowerPad® III Model 8435 (No Sensors - Waterproof IP67) ............................................................................ Cat. #2136.41
PowerPad
Includes extra large tool bag, accessory pouch, 5 ft USB cable, five 10 ft black voltage leads with alligator clips, 110V
US power cord, four water-tight AmpFlex® A196-24-BK (included with Cat. #2136.42 only), NiMH battery, SD-Card,
twelve color-coded input ID markers, quick start guide, and a USB stick containing DataView® software and user manual.
®
III Model 8435 (AmpFlex®- Waterproof IP67 ) ............................................................................... Cat. #2136.42
Only the SR, AmpFlex® and MiniFlex® sensors are rated 600V CAT IV. The MN, MR and SL probes are 300V CAT IV,
600V CAT III. Only AmpFlex® 196-18-BK and 196-24-BK sensors are rated IP67.
1.2.1 ACCESSORIES
10 ft USB cable.................................................................................................................................................. Cat. #2136.80
AC/DC Current Probe Model SL261* (10A-100mV/A, 100A-10mV/A, BNC) .................................................... Cat. #1201.51
* Adapter - BNC Adapter (mandatory if using an SL261 w/ the 8435) ........................................................... Cat. #2140.40
AC Current Probe Model MR193-BK................................................................................................................. Cat. #2140.28
AC Current Probe Model MN93-BK................................................................................................................... Cat. #2140.32
AC Current Probe Model SR193-BK ................................................................................................................. Cat. #2140.33
AC Current Probe Model MN193-BK ................................................................................................................ Cat. #2140.36
MiniFlex® Sensor 10" Model MA193-10-BK ...................................................................................................... Cat. #2140.48
MiniFlex® Sensor 14" Model MA193-14-BK ...................................................................................................... Cat. #2140.50
AmpFlex® Sensor 24" Model A196-24-BK ......................................................................................................... Cat. #2140.75
1.2.2 REPLACEMENT PARTS
Extra Large Classic Tool Bag ............................................................................................................................ Cat. #2133.73
Battery 9.6V NiMH
Set of 12, Color-coded Input ID Markers ........................................................................................................... Cat. #2140.45
5 ft USB cable.................................................................................................................................................... Cat. #2140.46
Accessory Pouch (accessories not included) .................................................................................................... Cat. #2140.72
®
AmpFlex
Lead – One 10 ft (3M) Black Lead (Waterproof cap) {Rated 1000V CAT IV} &
One Black Alligator Clip {Rated 1000V CAT IV, 15A} ....................................................................................... Cat. #2140.73
Power Cord 110V .............................................................................................................................................. Cat. #5000.63
Sensor 24" Model A196-24-BK ......................................................................................................... Cat. #2140.75
............................................................................................................................................. Cat. #2140.19
Power Quality Analyzer PowerPad® III Model 8435
7
Page 10

2. PRODUCT FEATURES
2.1 DESCRIPTION
The easy-to-use, compact and shock-resistant PowerPad® III Model 8435 is a three-phase power quality analyzer
equipped with four current inputs and ve voltage inputs. It is intended for technicians and engineers to measure and
carry out diagnostic work and power quality work on one, two or three phase low voltage networks.
The PowerPad® III Model 8435 has SD Card memory for storing trend data, and internal Flash memory for storing
transient, alarms, and snapshot data. You can store up to 50 screen snapshots, up to 210 captured transients that contain
four cycles for each active input, and 10,000 alarm events from up to 40 dierent parameters. You can also record trend
data for days, weeks, or even months. The Model 8435 is IP67 rated.
Six access buttons quickly display the following functions. Note that these functions can be accessed during a recording.
Waveforms (
inputs on one screen, phase-to-phase or phase-to-neutral. Real-time phasor diagrams can be displayed for volts and
amps, also by phase or for all phases including phase unbalance.
Harmonics ( ) displays harmonics out to the 50th for volts, amps, and VA. Individual harmonics are displayed as a
percentage and value for volts, amps and VA. Harmonic direction and sequencing can also be displayed.
Transients or Inrush Current ( ) sets, captures, and displays transients. You select the threshold and the number of
transients to capture. The Model 8435 then captures four waveforms for each transient; the triggering waveform as well
as one pre-triggered and two post-triggered waveforms. As many as 210 transients, each consisting of 4 waveforms per
channel for up to 8 channels, can be captured. Inrush current is measured when the power is rst turned on. Depending
on the type of load, the Inrush current may be very high for some time when compared with steady state current later on.
Trend ( ) records and displays trend data at user selectable sample rates from 1/sec to 1/15 minutes and user
programmable recording periods into 2GB of memory.
Alarm Events (
Power/Energy (
tangent).
) displays volts, amps, THD, and Crest Factor by phase or for all phases. You can display all the voltage
) provides a list of the alarms recorded according to the thresholds programmed during conguration.
) records and displays power levels and associated parameters (power factor, displacement, and
Recordings can only be downloaded through the USB port. Extremely long recordings will take a long time to download (> 2H
per 100MB).
2.2 KEY FEATURES
■ Voltage ratios: 1V to 500kV individual or grouped conguration of channels
■ Mixed sensors: 10mA to 60kA depending on sensor. Combine as needed. The measurements are performed
simultaneously using several dierent current sensors
■ Transient adjustment level: Adjustment of 1V or 1A increments. Individual or grouped channels
■ Measurement of TRMS voltages up to 1000Vrms AC/DC for two, three, four, or ve-wire systems
■ Measurement of TRMS currents from 1mA to 10kA (sensor dependent)
■ Measurement of DC current up to 1200ADC (with MR193 probe)
■ Automatic probe detection and scaling
■ Frequency measurement (40 to 69Hz systems)
8
Power Quality Analyzer PowerPad® III Model 8435
Page 11

■ Direct measurement of neutral current for WYE congurations
■ Record and display trend data as fast as once per second for one month for up to 25 variables. It is recommended to
limit recordings to under 100MB to reduce downtime
■ Energy assessments
■ Transient detection on all V and I inputs
■ Inrush current detection and measurement
■ Calculation of Crest Factors for current and voltage
■ Calculation of the K Factor for transformers
■ Calculation of short-term icker for voltage
■ Calculation of the phase unbalance for voltage and current (3 phase only)
■ Measurement of harmonic angles and rates (referenced to the fundamental or RMS value) for voltage, current or
power, up to the 50th harmonic
■ Display of harmonic sequencing and direction
■ Calculation of overall harmonic distortion factors
■ Real time display of phasor diagrams including values and phase angles
■ Monitoring of the average value of any parameter, calculated over a period running from 1 sec to 2 hrs
■ Measurement of active, reactive and apparent power per phase and their respective sum total
■ Calculation of power factor, displacement power factor and tangent factor
■ Total power from a point in time, chosen by the operator
■ Recording, time stamping and characterization of disturbance (swells, sags and interruptions, exceedence of power
and harmonic thresholds)
■ Detection of transients and recording of associated waveforms
■ Color-coded input ID markers identify voltage and current inputs
■ Internal SD-Card
■ DataView® analysis software. This includes the PowerPad® III Control Panel for con
guring the instrument and viewing
measurement data in real time, as well as DataView® report generation capabilities.
Power Quality Analyzer PowerPad® III Model 8435
9
Page 12
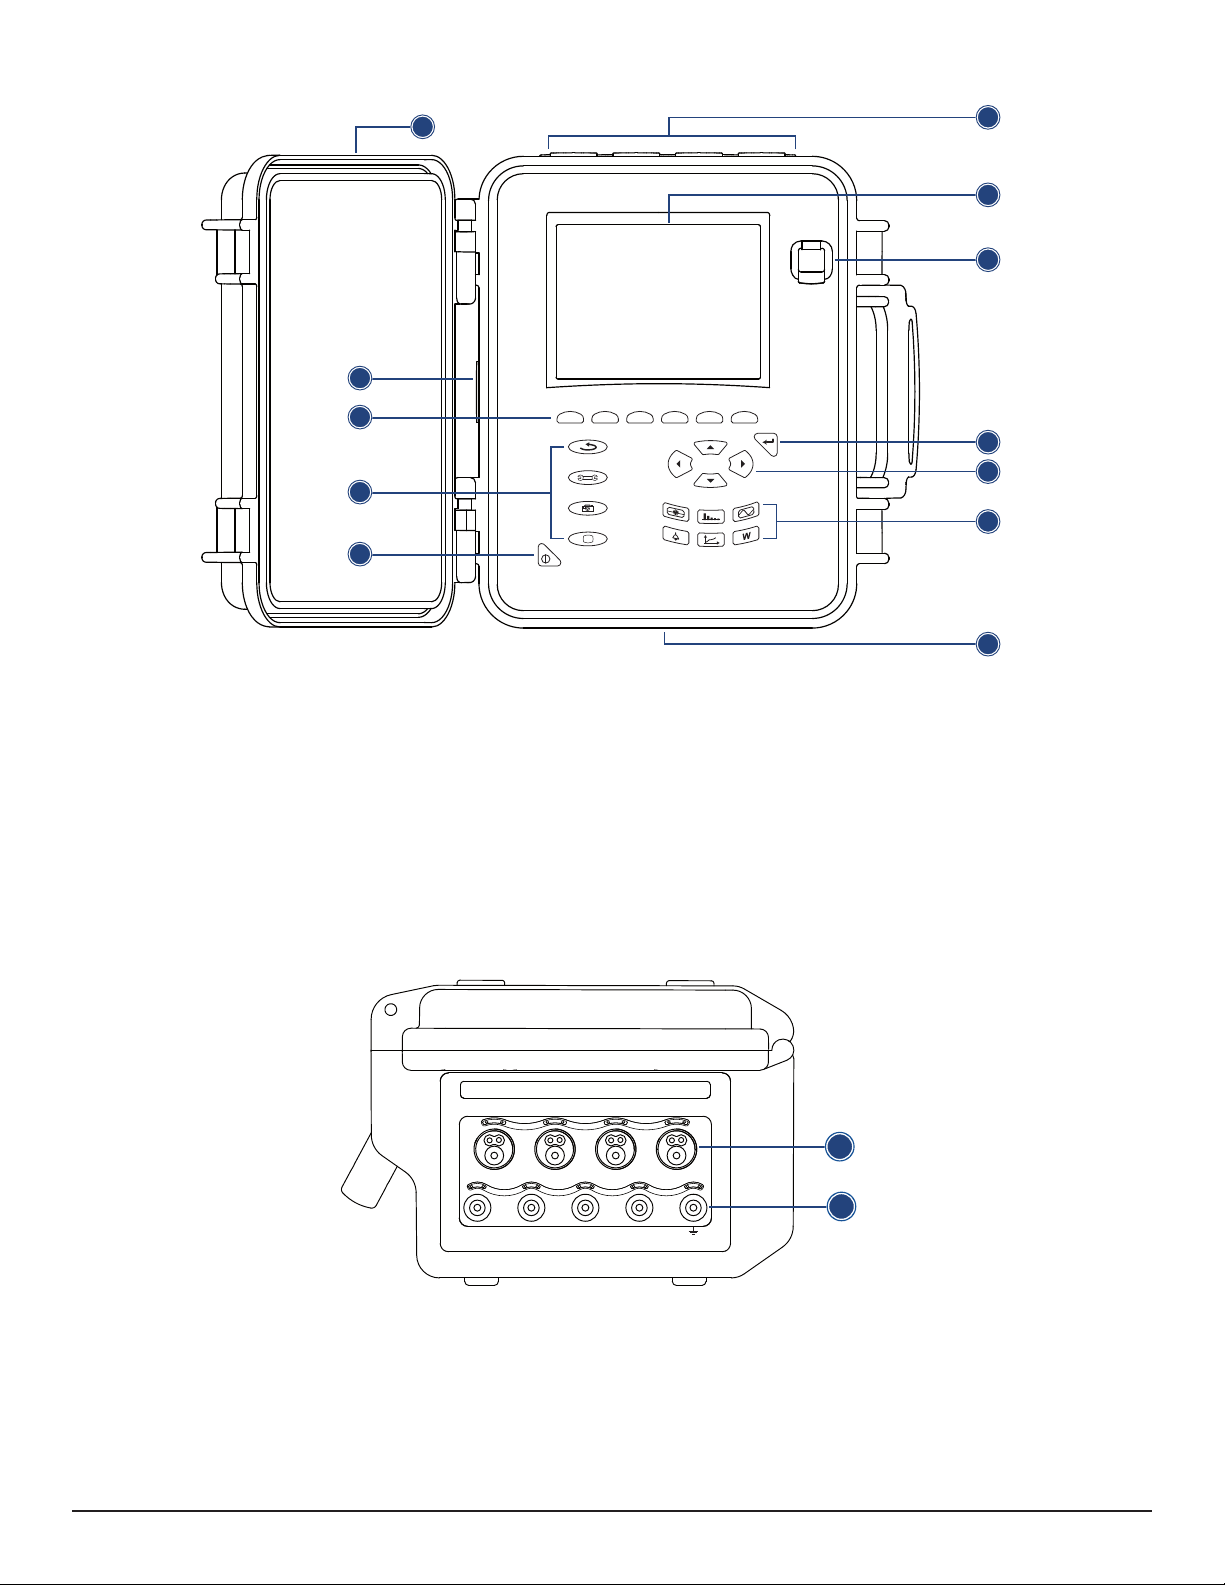
2.3 CONTROL FUNCTIONS
2
3
4
5
1
?
6
7
8
9
10
11
12
1. Protective cover
2. Battery charging connector
3. Six variable function buttons (yellow)
4. Four function buttons (gray)
5. ON/OFF button (gray)
6. Four current inputs and ve voltage inputs
2.4 CONNECTION TERMINALS
N/D
N/D L3/C
L3/C
Figure 2-1
7. LCD Display
8. USB port
9. Conrm/Enter button (gray)
10. Navigation buttons (gray)
11. Six mode buttons (see § 2.6) (purple)
12. Battery compartment and SD-Card slot cover
L2/B L1/A
1
2
L2/B L1/A
E/GN
Figure 2-2
1. Four current inputs on the top of the instrument to enable the use of current sensors (MN, SR, AmpFlex®, MiniFlex®,
and MR probes).
2. Five (5) voltage inputs.
The instrument ships with protective plugs that are designed to be inserted into the connection terminals. The plugs must
be removed to connect the leads, then stored in the pouch inside the front cover. Insert the plugs into unused terminals to
keep the instrument water/air-tight and the terminals clean.
10
Power Quality Analyzer PowerPad® III Model 8435
Page 13

2.5 DISPLAY
4
The Model 8435 includes a 320 x 240 pixel LCD display.
1
2
3
1. Top bar on the display, including:
● Symbol of the tested mode ( , , , etc.)
● Frequency of measured signal
● Memory capacity status bar (only available in certain modes)
● Current date and time
● Battery charge status (see § 7.1)
02/06/14
5
Figure 2-3
2. Measured RMS values associated with waveforms.
3.
Values of signals at an instant “t” at the intersection of cursor and the waveforms. The cursor can be moved along the time
scale by pressing the
◄ and ► buttons
.
4. Measurement selection (refer to chart below)
Calculation of DPF, Tan, KF, Φ, UNB, Min, Max, VAR, Harmonics, PST, and DF parameters and the frequency measurement can
only be performed if voltage or current with a frequency of 40 to 70Hz is applied to the Ch1 voltage input or the A1 current input.
5. Selection of waveforms to be displayed (use the ▲ and ▼ buttons to select):
U: Signies phase-to-phase voltage
V: Signies phase-to-neutral voltage
A: Displays current for each phase
L1, L2, L3: Refer to the phases (A,B,C)
Icon
RMS
THD
CF
V
A
VA
Description
True RMS Measurement
Total Harmonic Distortion
Crest Factor
Display of current values and their min/max extremes
Display all voltage and current measurements simultaneously (RMS, DC, THD, CF, PST, KF, DF) in tabular format
Phasor diagram
Phase-to-neutral voltage mode
Phase-to-neutral current mode
Power mode
Power Quality Analyzer PowerPad® III Model 8435
11
Page 14
Icon
1
2
3
4
1
2
3
4
U
Description
Voltage mode (phase-to-phase)
Zoom in
Zoom out
< > Left/right key prompt
^
^
PF...
W...
Up/down key prompt
Display of PF, DPF and Tan.
Active power
Recording mode
Recording display and selection mode
OK
Validation prompt
Stop function in progress prompt
Display of energy consumed
Display of energy generated
Screen 1 of the help function
Screen 2 of the help function
Screen 3 of the help function
Screen 4 of the help function
Screen 1 of the selected recording parameter
Screen 2 of the selected recording parameter
Screen 3 of the selected recording parameter
Screen 4 of the selected recording parameter
>t=0<
>5=-T<
Moves the cursor to transient triggering time
Moves the cursor to one signal period before the transient triggering date
Activates/deactivates the selection of the transients list display filters
Following page screen
Previous page screen
Trash to delete or remove elements
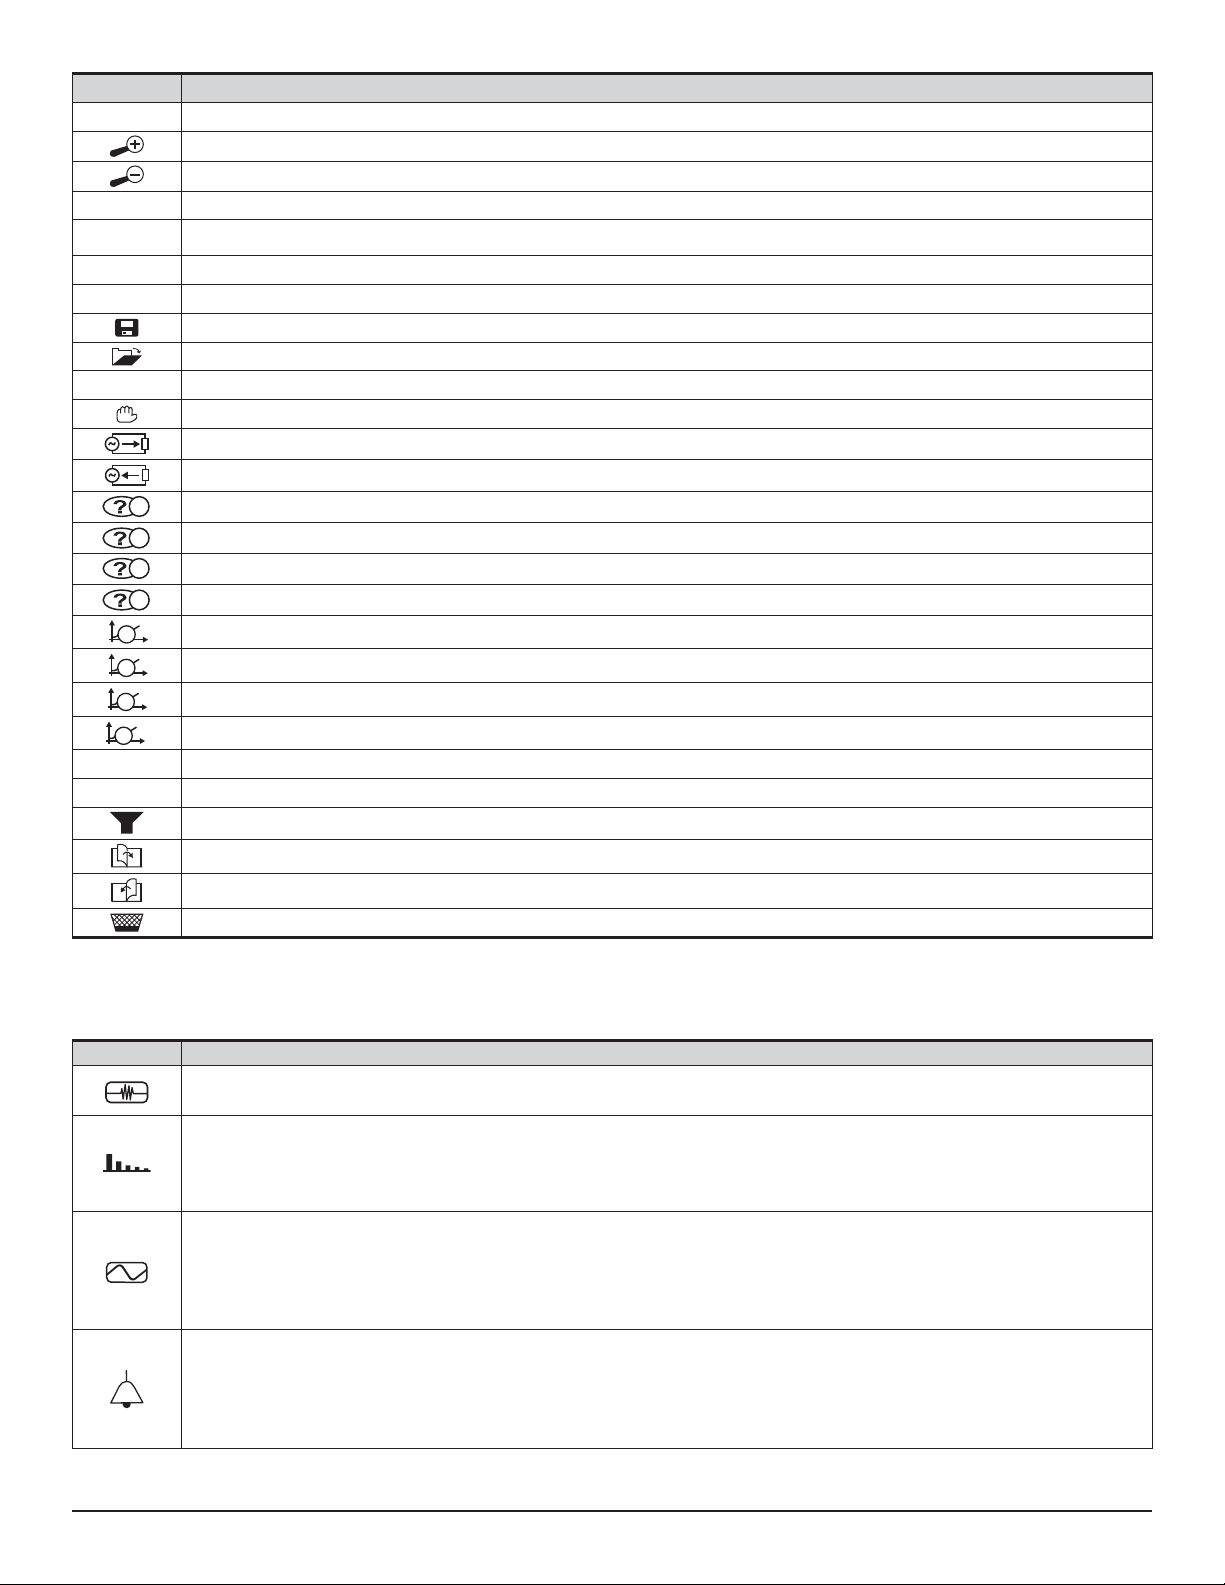
2.6 BUTTON FUNCTIONS
Icon Description
Transients or Inrush Current:
• Sets and views transient and Inrush current waveforms associated with rapid changes in input
Harmonics Mode:
• Displays the harmonics in percent and value ratios for voltage, current, and power for each harmonic through the 50th
• Determines harmonic current produced by non-linear loads
• Analyzes the problems caused by harmonics according to their order (heating of neutrals, conductors, motors, etc.)
Waveforms Mode:
• Displays voltage and current waveforms or vector representation
• Identifies signal distortion signatures
• Displays of amplitude and phase unbalance for voltage and current
• Checks connections for correct phase order
Alarm Events:
• Provides a list of the alarms recorded according to the thresholds programmed during configuration
• Logs interruption with half-cycle resolution
• Determines energy consumption exceedances
• Stores value, duration, date, time and set point for up to 4096 events
12
Power Quality Analyzer PowerPad® III Model 8435
Page 15

Trend Mode:
• Lists all recording trends and views them on the display (Urms, Vrms, Arms, etc.)
Power / Energy:
• Displays power levels and the associated parameters (power factor, displacement, and tangent)
• Energy monitoring
• Four quadrant measurement to discern produced/consumed active energy and inductive/capacitive reactive energy
Return to the choice of measurement view
Configure the PowerPad® III Model 8435 (see § 3.2)
Take a snapshot of the current screen or access snapshots already stored in the memory. Record associated waveform and
power measurement data.
Get help on the current display functions, in the language chosen by the user.
Power Quality Analyzer PowerPad® III Model 8435
13
Page 16
3. OPERATION
3.1 GETTING STARTED
Fully charge the battery before the rst use.
NOTE: A full recharge of a completely discharged battery takes approximately 5 hours.
120V ± 10%, 60Hz
230V ± 10%, 50Hz
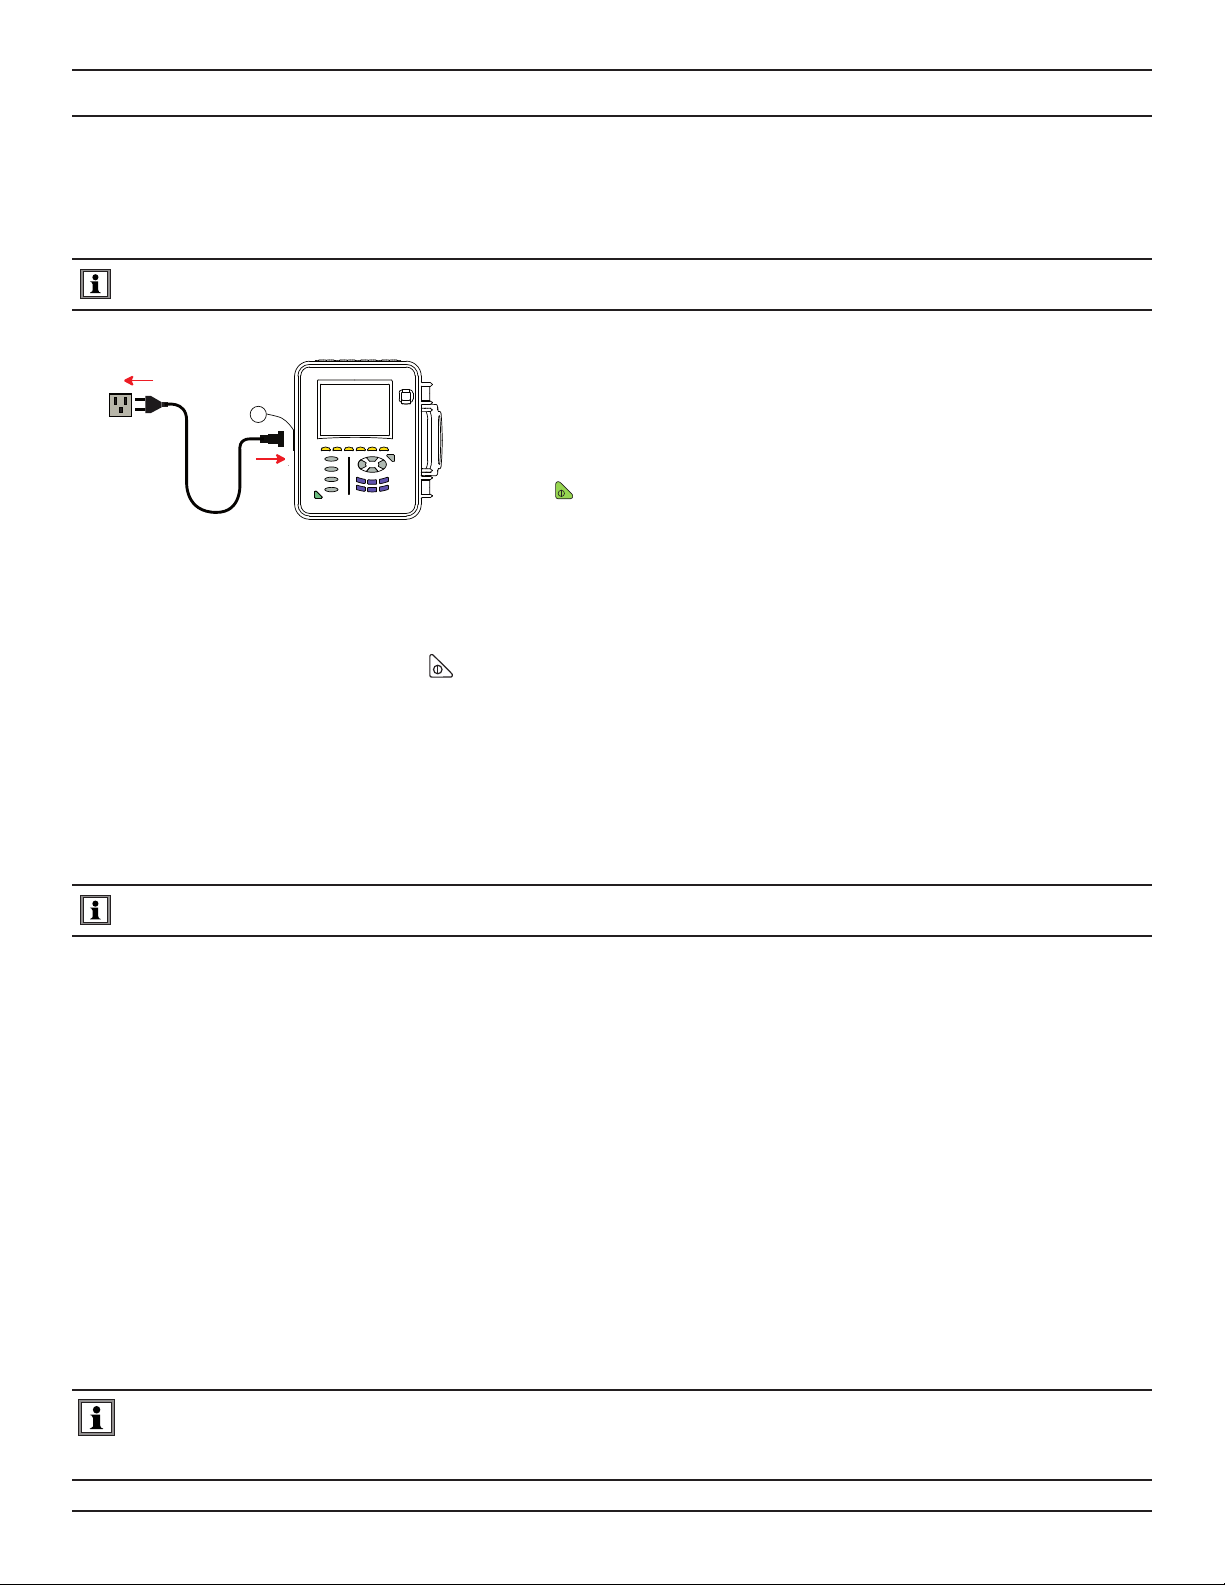
3.1.1 CONNECTING
1. Start the instrument by pressing the button.
2. Congure the unit to obtain the required results and type of network (see § 3.2).
3. Connect the current leads and sensors to the Model 8435.
4. Connect the ground and/or neutral lead to the network ground and/or neutral (when distributed), as well as the
corresponding current sensor.
5. Connect the L1 phase lead to the network L1 phase, as well as the corresponding current sensor.
To recharge the battery:
1. Unscrew the cover of the power charging connector.
2. Connect the supplied power cord to the instrument and AC power.
3. The button lights and will go out when the power cord is
disconnected.
Repeat the procedure for phases L2, L3 and N.
NOTE: Complying with this procedure limits connection errors to a minimum and conserves time.
3.1.2 DISCONNECTING
■ Proceed in the reverse order to connecting, always nishing by disconnecting the ground and/or neutral (when
distributed).
■ Disconnect the unit leads and power it down.
■ Recharge the battery and recover the data registered where necessary.
■ USB sockets can be used to connect the unit to any type of network.
The following precautions for use must be complied with:
■ Do not connect any voltages exceeding 1000Vrms in relation to the ground/earth.
■ When connecting and disconnecting the batteries, check that measuring leads are disconnected.
The instrument operates on batteries. The batteries are charging when the instrument is connected to a 120/240; 60/50Hz
line.
The current probes connected are identified every second. The scaling will automatically reset when a new probe is connected. When installing probes, face the arrow on the probe in the direction of the load.
For the SL261, MN193, and 5A Box, the ratio needs to be programmed from the instrument menu or software.
14
Power Quality Analyzer PowerPad® III Model 8435
Page 17
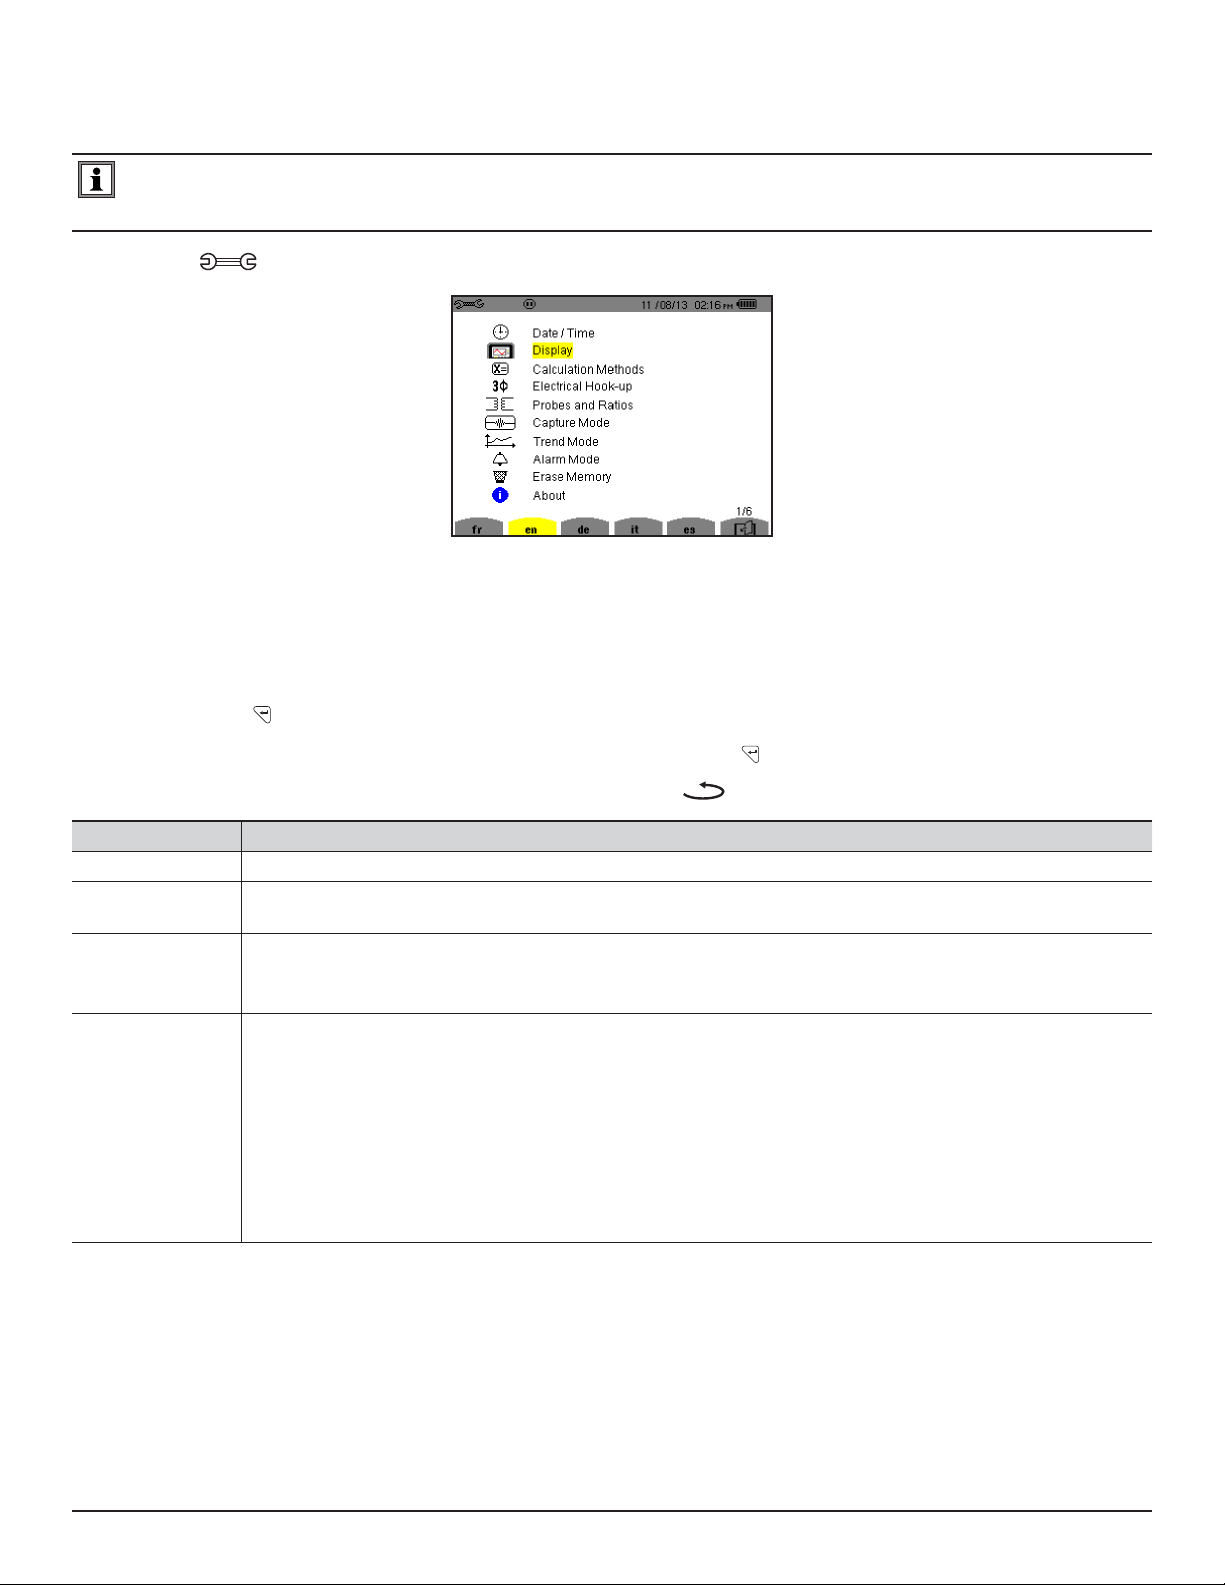
3.2 INSTRUMENT CONFIGURATION (SET-UP MODE)
NOTE: All congurations can also be modied through DataView® software.
The instrument must be configured the first time it is used. The configuration is saved in memory when the instrument is turned
OFF.
1. Press the
2. Set the display language by pressing the yellow button corresponding to the screen language icons.
3. The parameter that is ready to be congured will be highlighted in yellow. To move to a dierent parameter, use the ▲
and ▼ buttons.
4. Press the Enter button to select a parameter.
5. Use the ▲, ▼, ◄, and ► buttons to change a value or setting; and the button to save the setting.
6. When nished, return to the Conguration menu by pressing the
PARAMETER FUNCTION
Date / Time
Display
Calculation
Methods
Electrical Hook-Up
button to congure the unit. The following screen appears:
Figure 3-1
button.
Sets the date and time format (see § 3.2.1)
Adjusts the contrast and brightness of the display
Defines the color of the voltage and current curves (see § 3.2.2)
Determines if harmonics are used or not used in calculations of reactive quantities (power and energy) - (see § 3.2.3)
• With harmonics: Harmonics are taken into account when calculating reactive parameters
• Without harmonics: Only the fundamental part is used for the calculation of reactive parameters
Determines the type of connection to the network (see § 3.2.4)
• 1-Phase 2-Wire
• 1-Phase 3-Wire
• 2-Phase 2-Wire
• 2-Phase 3-Wire
• 2-Phase 4-Wire
• 3-Phase 3-Wire
• 3-Phase 4-Wire
• 3-Phase 5-Wire
Power Quality Analyzer PowerPad® III Model 8435
15
Page 18
Probes and Ratios
Defines the type of current probe to connect (see § 3.2.5)
• MN93: 200A
• MN193: 100A or 5A (with variable ratio)
• SR193: 1000A
• SL261: 10A and 100A range
• AmpFlex® Sensors: 3000A (measures up to 10kA)
• MiniFlex® Sensors: 3000A
• MR193: 1000AAC/1200ADC
• 5A three-phase adapter (3-channel only)
Capture Mode
Trend Mode
Configures the voltage and current thresholds (see § 3.2.66)
Selects the parameters to record (see § 3.2.77)
(Up to four configurations)
Alarm Mode
Erase Memory
About
Defines the parameters of an alarm (see § 3.2.88)
Deletes configurations, alarm settings, snapshots, and recordings (see § 3.2.9)
Displays the serial number, software and hardware version
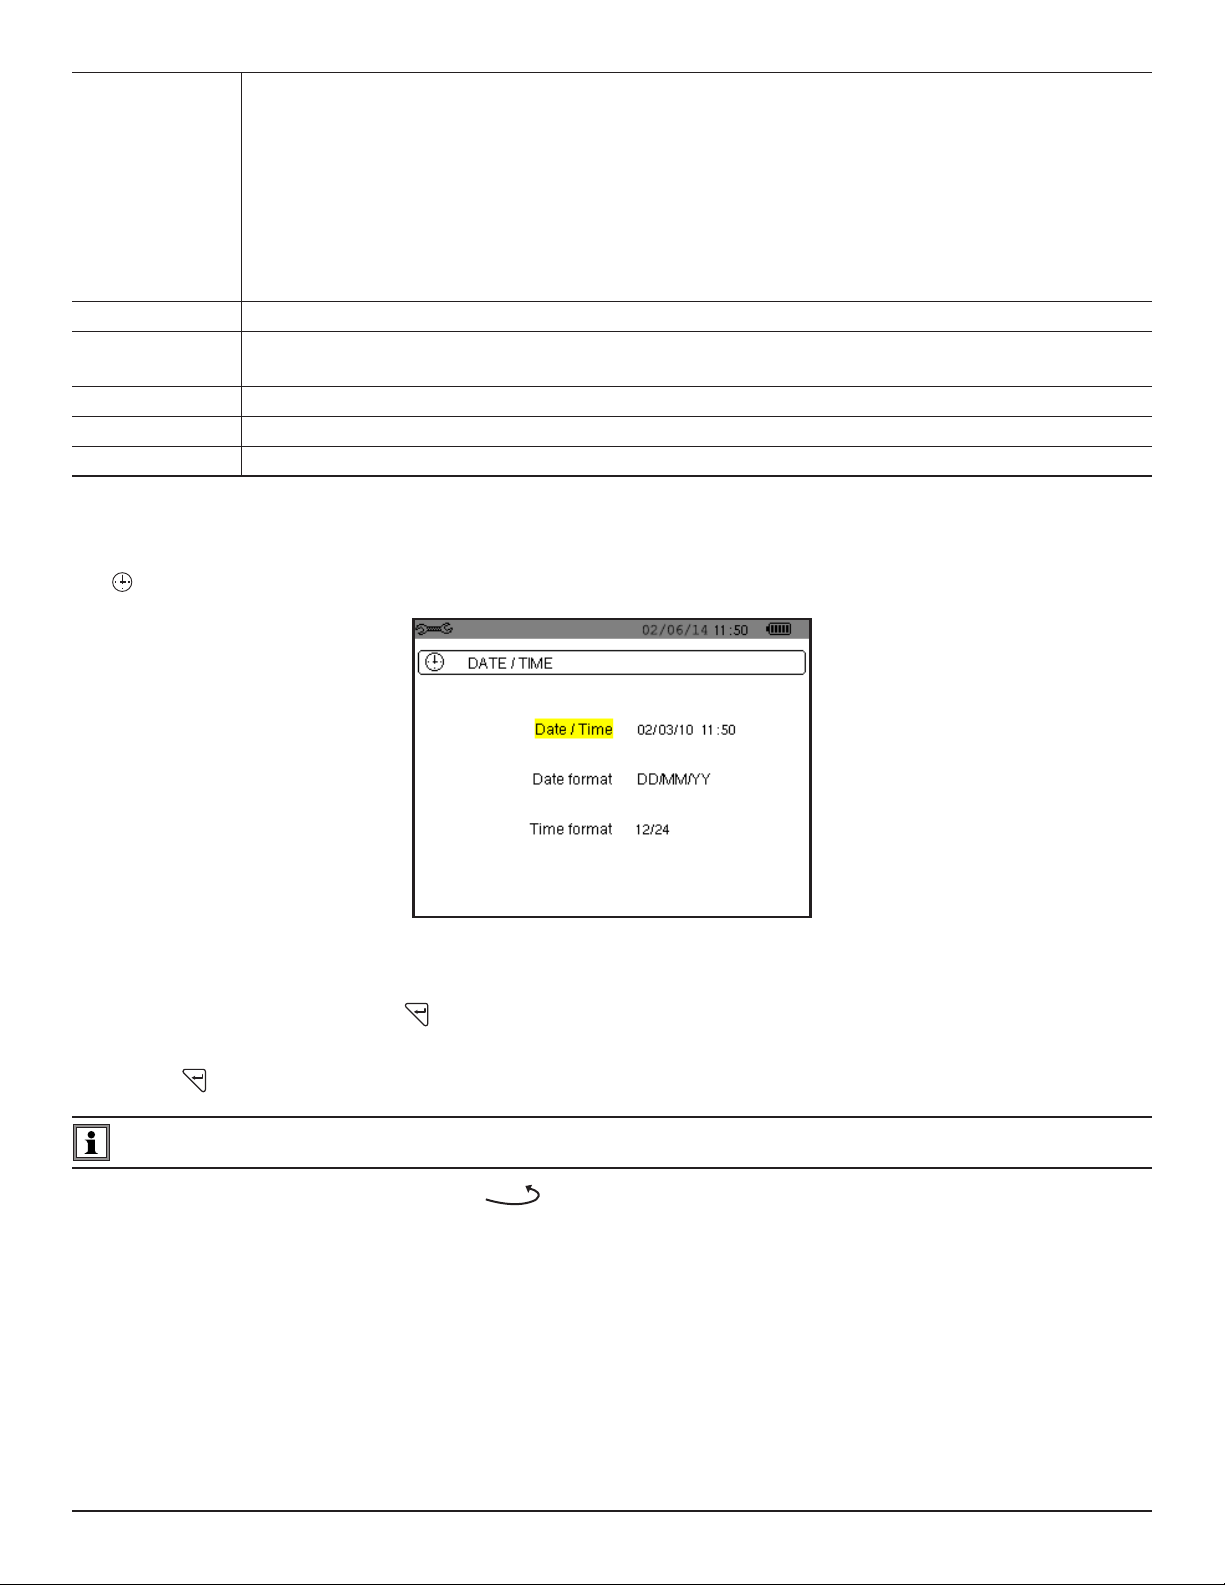
3.2.1 DATE/TIME
The parameter denes the system date and time. The display is as follows:
Figure 3-2
The Date/Time eld is highlighted in yellow.
■ To change the date/time, press the button.
■ To change a value or move from one eld to another, press the ▲ or ▼ button.
■ Press the button to conrm conguration.
NOTE: 12/24: Display of time in 24-hour format. AM/PM: Display of time in 12-hour format. The time is followed by AM or PM.
To return to the Conguration menu, press the
button.
16
Power Quality Analyzer PowerPad® III Model 8435
Page 19
3.2.2 DISPLAY
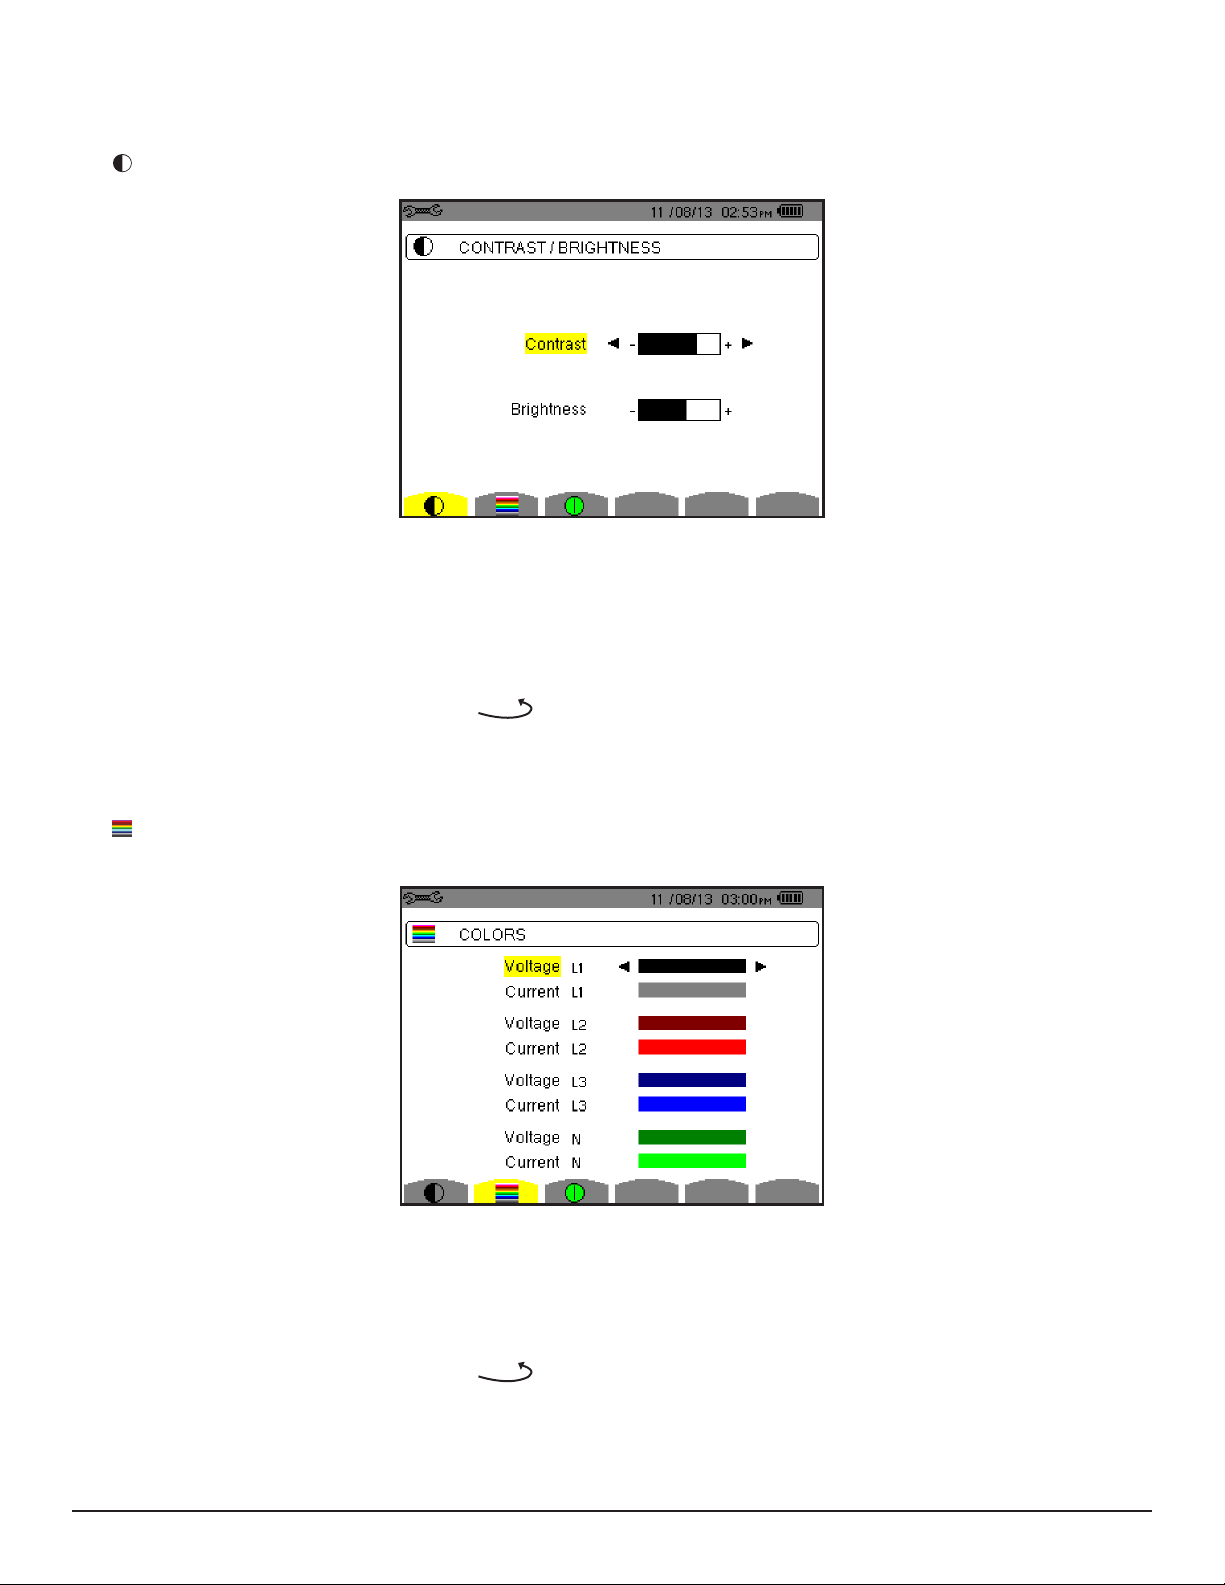
3.2.2.1 CONTRAST/BRIGHTNESS
The menu is used to dene the contrast and brightness of the display unit.
Figure 3-3
The selected eld is highlighted in yellow.
■ To modify the contrast, press ◄ or ►
■ To move to the next eld, press ▲ or ▼
■ To change the brightness, press◄ or ►
■ To return to the Conguration menu, press
3.2.2.2 COLORS
The menu is used to dene the colors of the voltage and current traces on the graph. The colors available are: green,
dark green, yellow, orange, pink, red, brown, blue, turquoise blue, dark blue, light grey, grey, dark grey, and black.
Figure 3-4
The selected eld is highlighted in yellow.
■ To select the color of the voltage and current curves, press ◄ or ►
■ To move to the next eld, press ▲ or ▼
■ To return to the Conguration menu, press
Power Quality Analyzer PowerPad® III Model 8435
17
Page 20
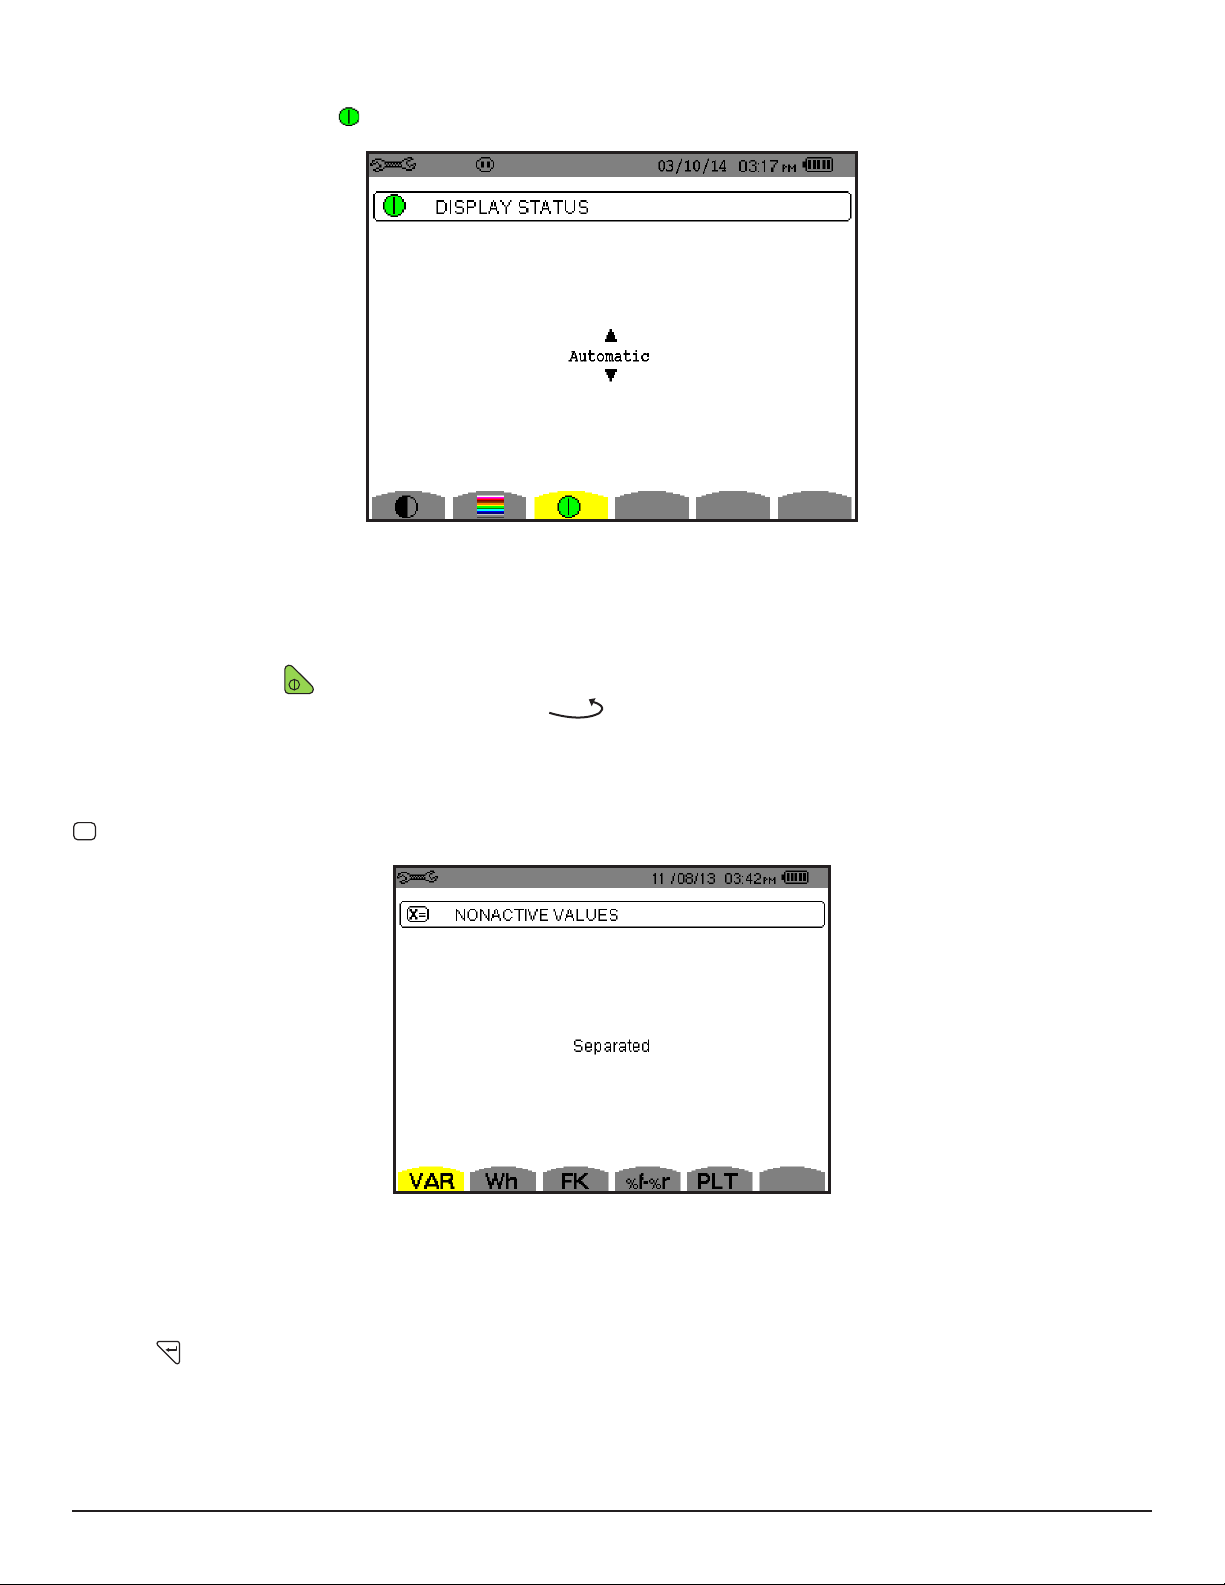
3.2.2.3 DISPLAY SHUTDOWN (AUTO POWER OFF)
X
=
The Display Shutdown button displays a menu that denes the screen shutdown process.
Figure 4-5
Use the up and down arrow buttons to choose Automatic or Never.
■ In Automatic mode the display screen switches OFF automatically after ve minutes of inactivity when the instrument is
powered by the battery and a recording is in progress, and after ten minutes if no recording is in progress.
■ The ON/OFF button blinks to indicate that the instrument is still in operation. Press any button to relight the
screen. To return to the Conguration menu, press
.
3.2.3 CALCULATION METHODS
determines a number of variables used in calculating the reactive parameters (powers and energy).
Figure 3-6
To select Separated or Combined, press ▲ or ▼.
■ Separated: Harmonics are not taken into account when calculating reactive quantities.
■ Combined: Harmonics are included in the reactive values calculations.
Press the button to save the setting and return to the Conguration menu.
18
Power Quality Analyzer PowerPad® III Model 8435
Page 21
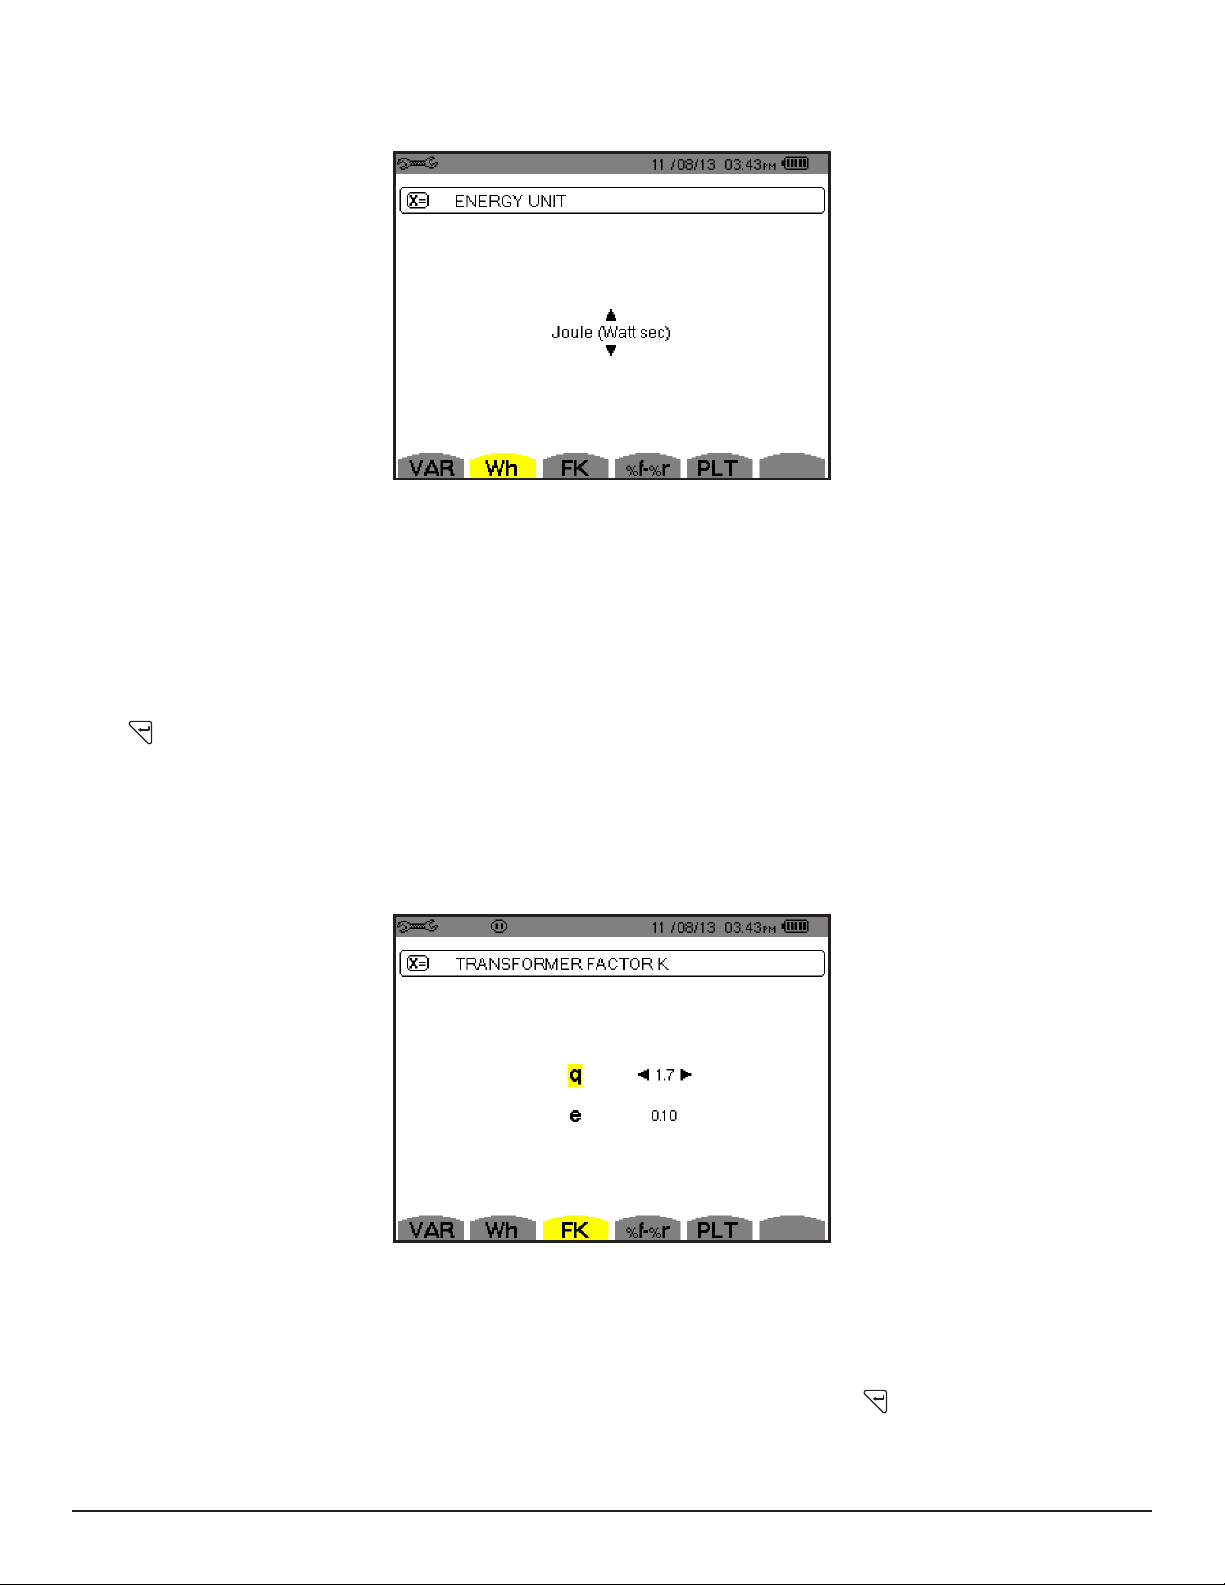
3.2.3.1 ENERGY UNIT
This Wh screen determines the units to be used to display calculation results.
Figure 3-7
To select the units, press ▲ or ▼. Choices are:
■ Wh
■ Joule (Watt/second)
■ Nuclear toe (Tonne Oil Equipment)
■ Non-nuclear toe
■ BTU
Press to save the setting and return to the Conguration menu.
3.2.3.2 K FACTOR
This screen denes the transformer factor K. This value is used for weighting the harmonic load currents in accordance
with their eects on transformer heating. A higher factor K indicates larger harmonic heating eects.
Figure 3-8
This consists of two values, q and e:
■ q (allowable values are 1.5, 1.6, and 1.7)
■ e (allowable values are 0.05, 0.06, 0.07, 0.08, 0.09, and 0.10)
Press ▲ or ▼ to select q or e; press ◄ or ► to select values for these parameters. Press to save the settings and
return to the Conguration menu.
Power Quality Analyzer PowerPad® III Model 8435
19
Page 22

3.2.3.3 PHASE HARMONIC RATIOS
You can choose to calculate, display, and report harmonics as a ratio of the fundamental value, or in absolute value.
Figure 3-9
Press ▲ or ▼ to toggle between Fundamental Value as Reference (%f) and Total Value as Reference (%r). Press
to save the setting and return to the Conguration menu.
3.2.3.4 LONG-TERM FLICKER
This screen denes whether a xed or sliding window is used to calculate long-term icker (rapid uctuations in the power
supply).
Figure 3-10
Press ▲ or ▼ to toggle between Sliding Window and Fixed Window. Press to save the setting and return to the
Conguration menu.
20
Power Quality Analyzer PowerPad® III Model 8435
Page 23
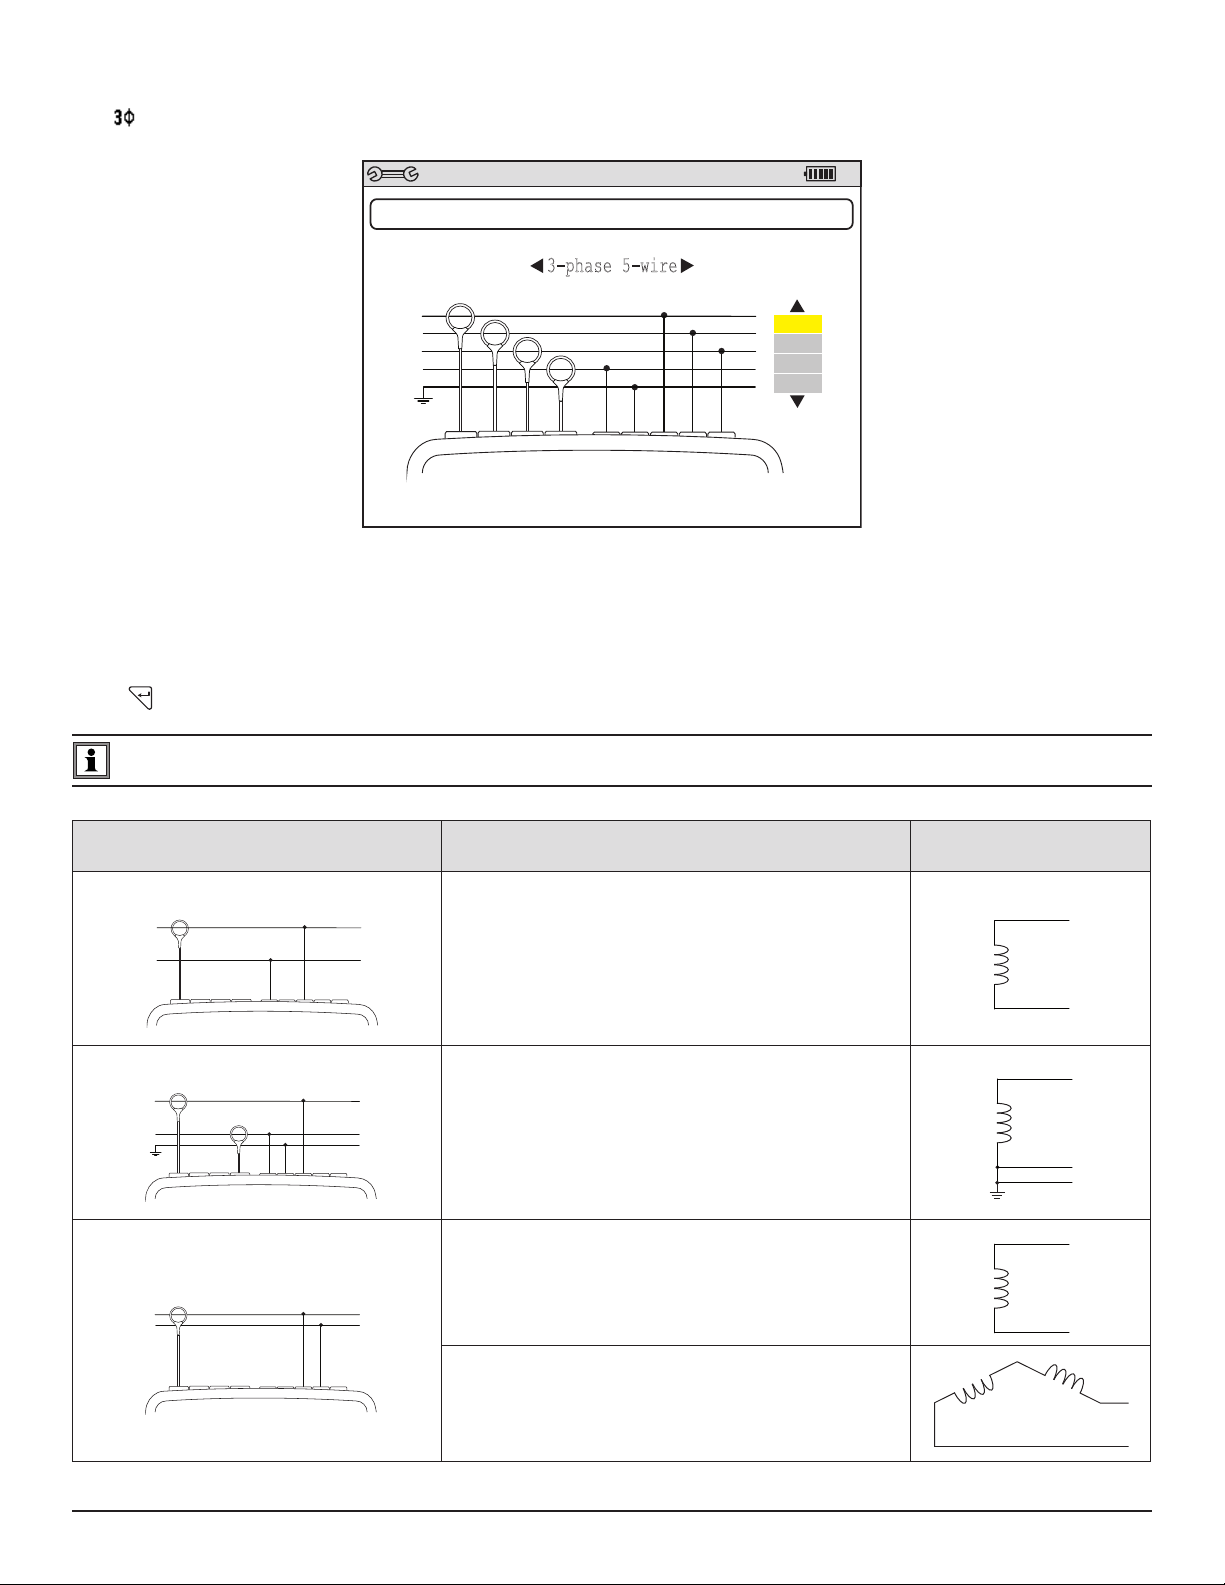
3.2.4 ELECTRICAL HOOK-UP
L1
L2
L3
N
V1V2
3V
V2V3
V3V1
ELECTRICAL HOOK-UP
3-phase 5-wire
3Φ
03/10/14 10:26
am
L1
L1
L1
The menu is used to dene how the instrument is connected, according to the type of network.
Figure 4-11
Several electrical diagrams can be selected. Use the arrow buttons to choose a connection. One or more types of network
correspond to each distribution system.
These connection choices allow you to connect the instrument to all existing networks.
Press to conrm the selection and return to the Conguration menu.
NOTE: This setting cannot be modified when the instrument is recording, and/or searching for alarms.
Distribution System Source
Single-phase 2-wire (L1 and N)
L1
N
Single-phase 3-wire (L1, N and ground)
L1
N
Split-phase 2-wire (L1 and L2)
L1
L2
Single-phase 2-wire non-grounded neutral
Single-phase 3-wire grounded neutral
Split-phase 2-wire
N
N
GND
L2
Power Quality Analyzer PowerPad® III Model 8435
3-phase open star 2-wire
L1
L2
21
Page 24
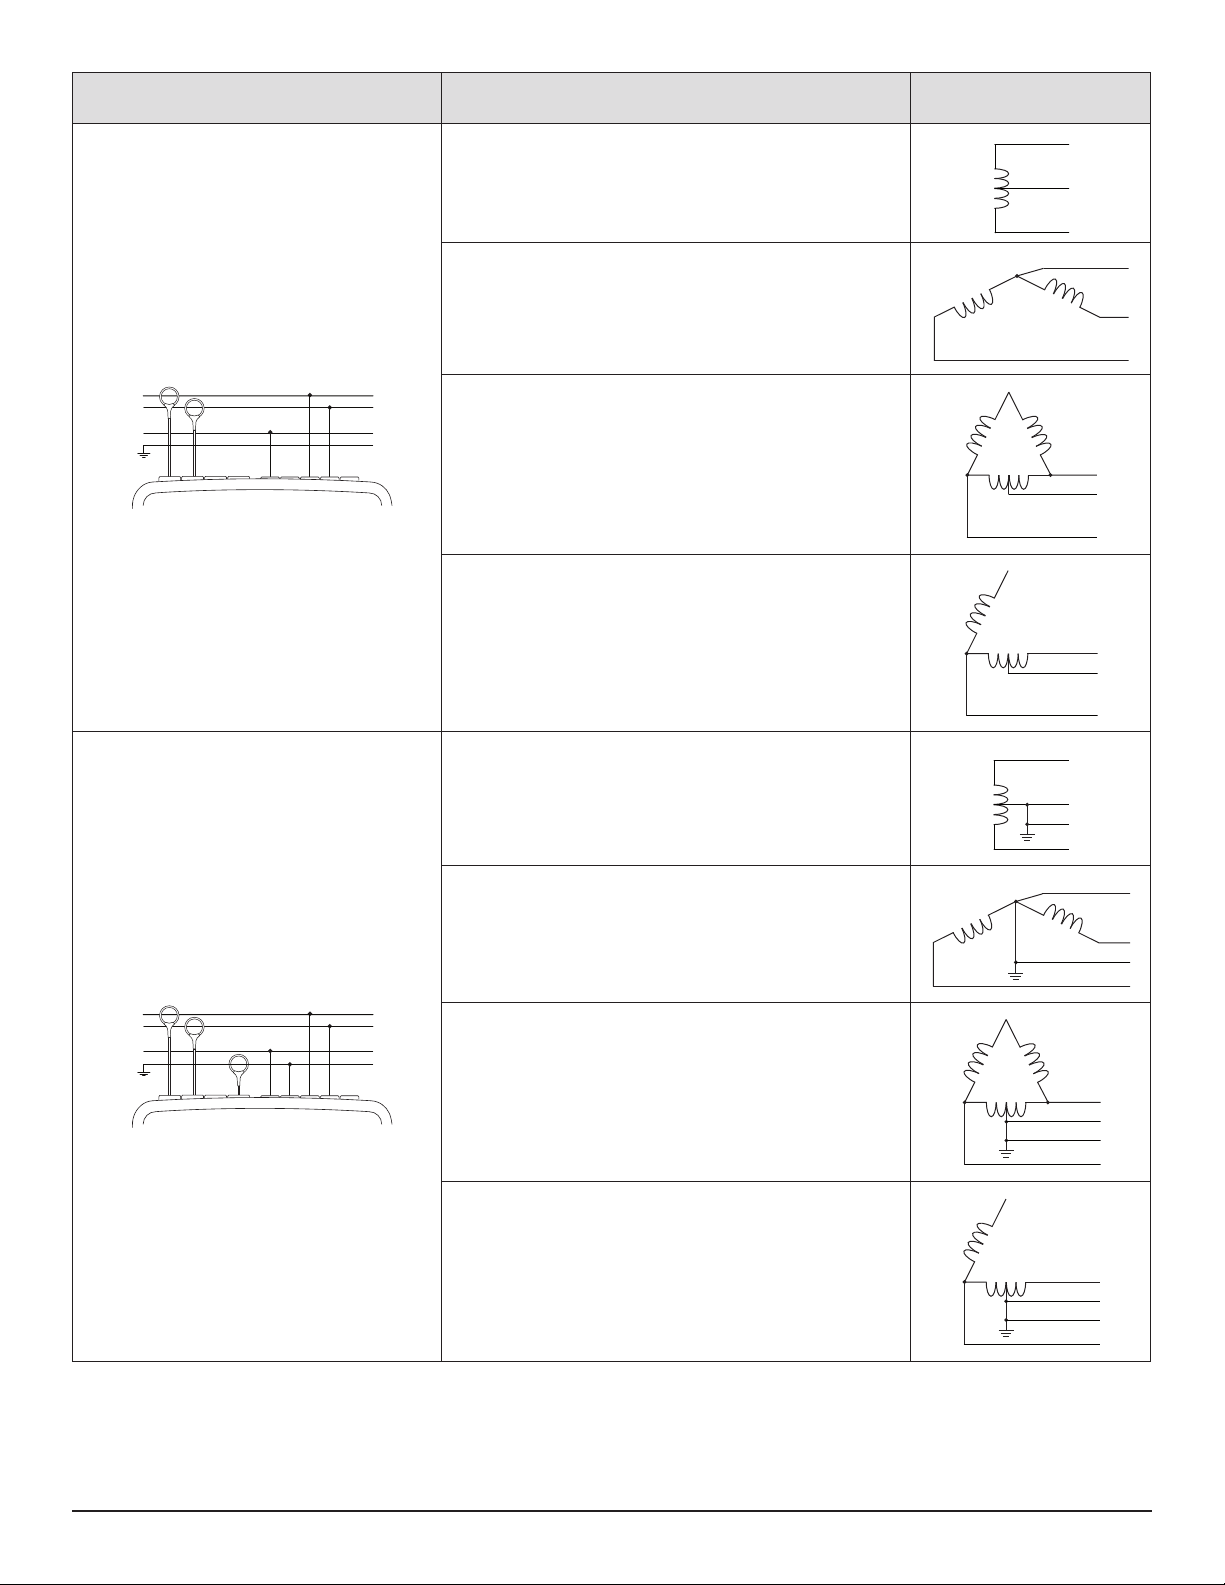
Distribution System Source
L1
N
L1
N
Split-phase 3-wire (L1, L2 and N)
L1
L2
N
Split-phase 3-wire non-grounded neutral
3-phase open star 3-wire non-grounded neutral
3-phase high leg delta 3-wire non-grounded neutral
3-phase open high leg delta 3-wire non-grounded neutral
N
L2
L1
L2
L1
N
L2
L1
N
L2
Split-phase 4-wire (L1, L2, N and ground)
L1
L2
N
Split-phase 4-wire grounded neutral
3-phase open star 4-wire grounded neutral
3-phase high leg delta 4-wire grounded neutral
3-phase open high leg delta 4-wire grounded neutral
N
GND
L2
L1
GND
L2
L1
N
GND
L2
L1
N
GND
L2
22
Power Quality Analyzer PowerPad® III Model 8435
Page 25
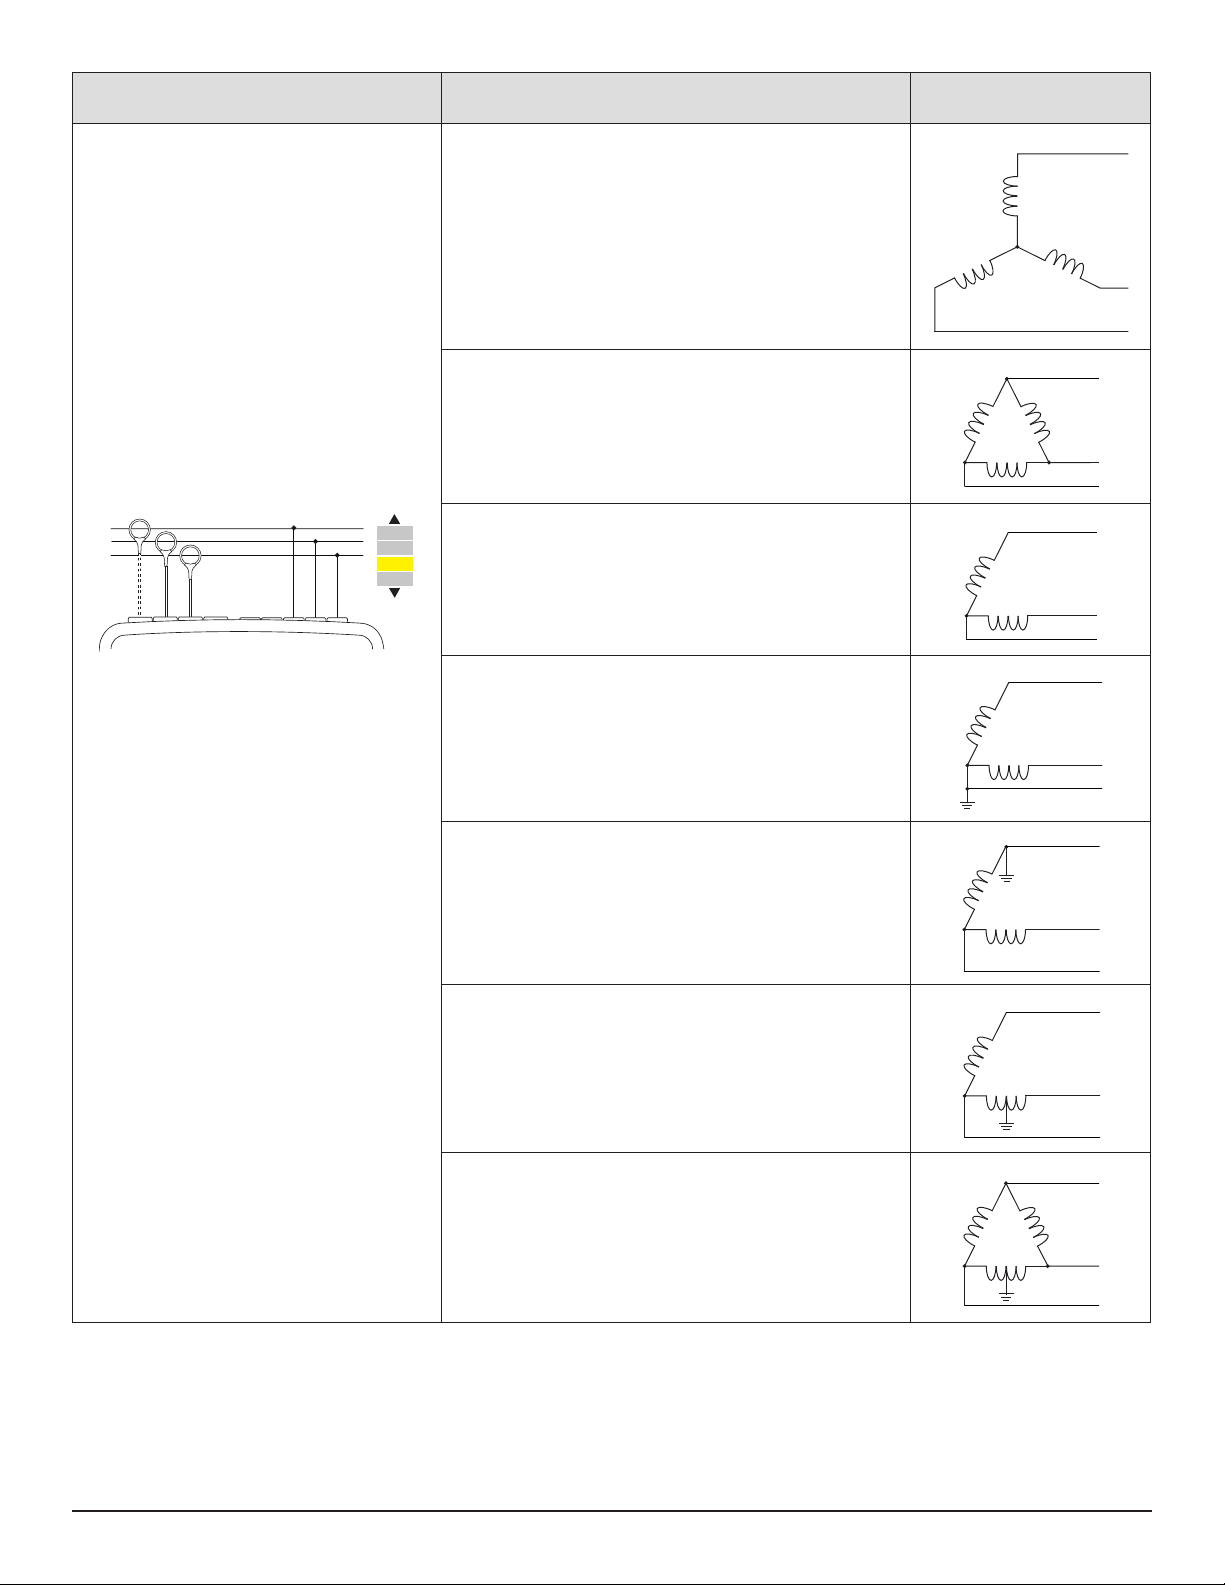
Distribution System Source
L3
L3
L3
L3
3-phase star 3-wire
3-phase delta 3-wire
3-phase 3-wire (L1, L2 and L3)
L1
L2
L1
L2
L1
L2
L3
3A
A1A2
A2A3
A3A1
Indicate which 2 current sensors will be
connected: A1 and A2, or A2 and A3,
or A3 and A1.
Two-wattmeter method or two-element
method or Aron method.
The third sensor is not necessary if the
other two are of the same type, same
range, and same ratio. Otherwise, the third
sensor must be connected to make current
measurements.
L3
3-phase open delta 3-wire
L1
L2
3-phase open delta 3-wire grounded junction of phases
L1
L2
3-phase open delta 3-wire grounded corner of phase
L1
L2
L3
3-phase high leg delta 3-wire
L1
Power Quality Analyzer PowerPad® III Model 8435
3-phase open high leg delta 3-wire
L2
L3
L1
L2
23
Page 26
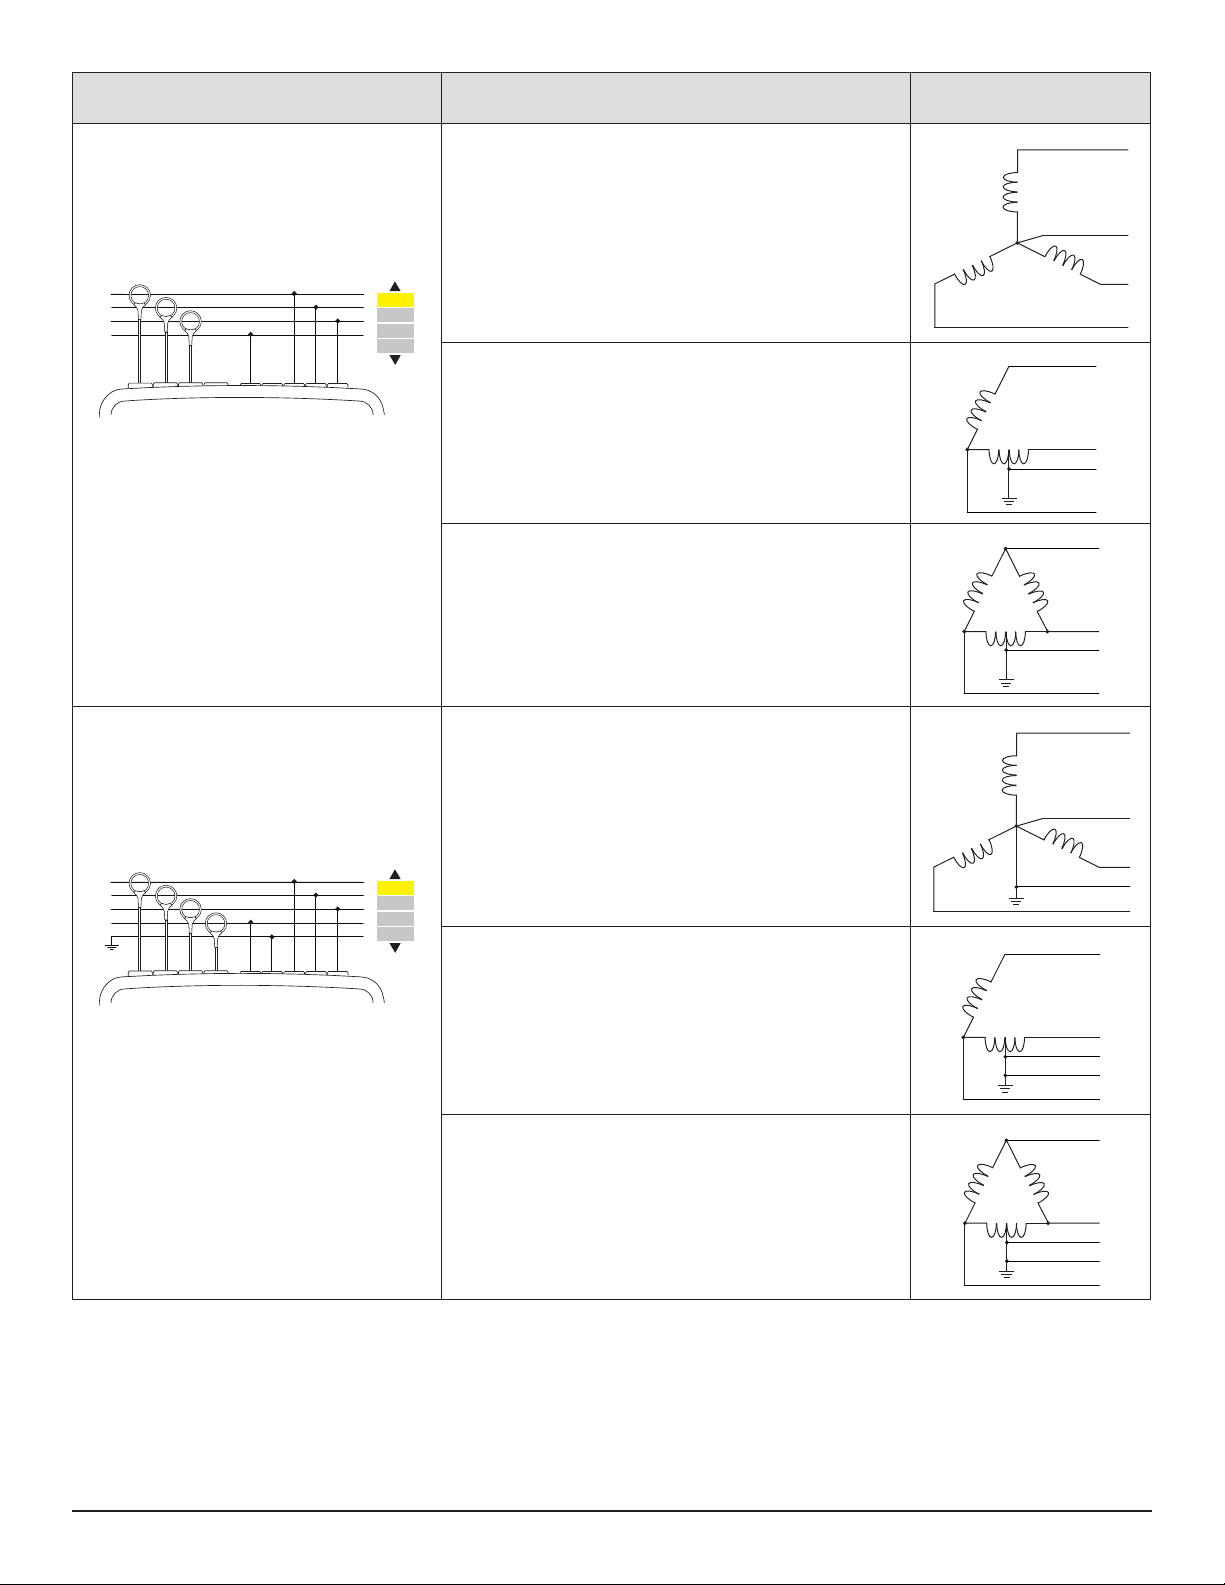
Distribution System Source
L3
L3
L3
L3
L3
L3
3-phase 4-wire (L1, L2, L3 and N)
L1
L2
L3
N
3V
V1V2
V2V3
V3V1
Indicate which voltages will be connected:
all 3 (3V) or only 2 (V1 and V2, or V2 and
V3, or V3 and V1).
If only two of the three voltages are con-
nected, the three phase voltages must be
balanced (2½-element method)
3-phase star 4-wire non-grounded neutral
3-phase open high leg delta 4-wire non-grounded neutral
3-phase high leg delta 4-wire non-grounded neutral
N
L1
L2
L1
N
L2
L1
N
L2
3-phase 5-wire (L1, L2, L3, N and ground)
L1
L2
L3
N
Indicate which voltages will be connected:
all 3 (3V) or only 2 (V1 and V2, or V2 and
V3, or V3 and V1).
If only two of the three voltages are con-
nected, the three phase voltages must be
balanced (2½-element method)
.
3V
V1V2
V2V3
V3V1
3-phase star 5-wire grounded neutral
3-phase open high leg delta 5-wire grounded neutral
3-phase high leg delta 5-wire grounded neutral
N
L1
GND
L2
L1
N
GND
L2
L1
N
GND
L2
24
Power Quality Analyzer PowerPad® III Model 8435
Page 27
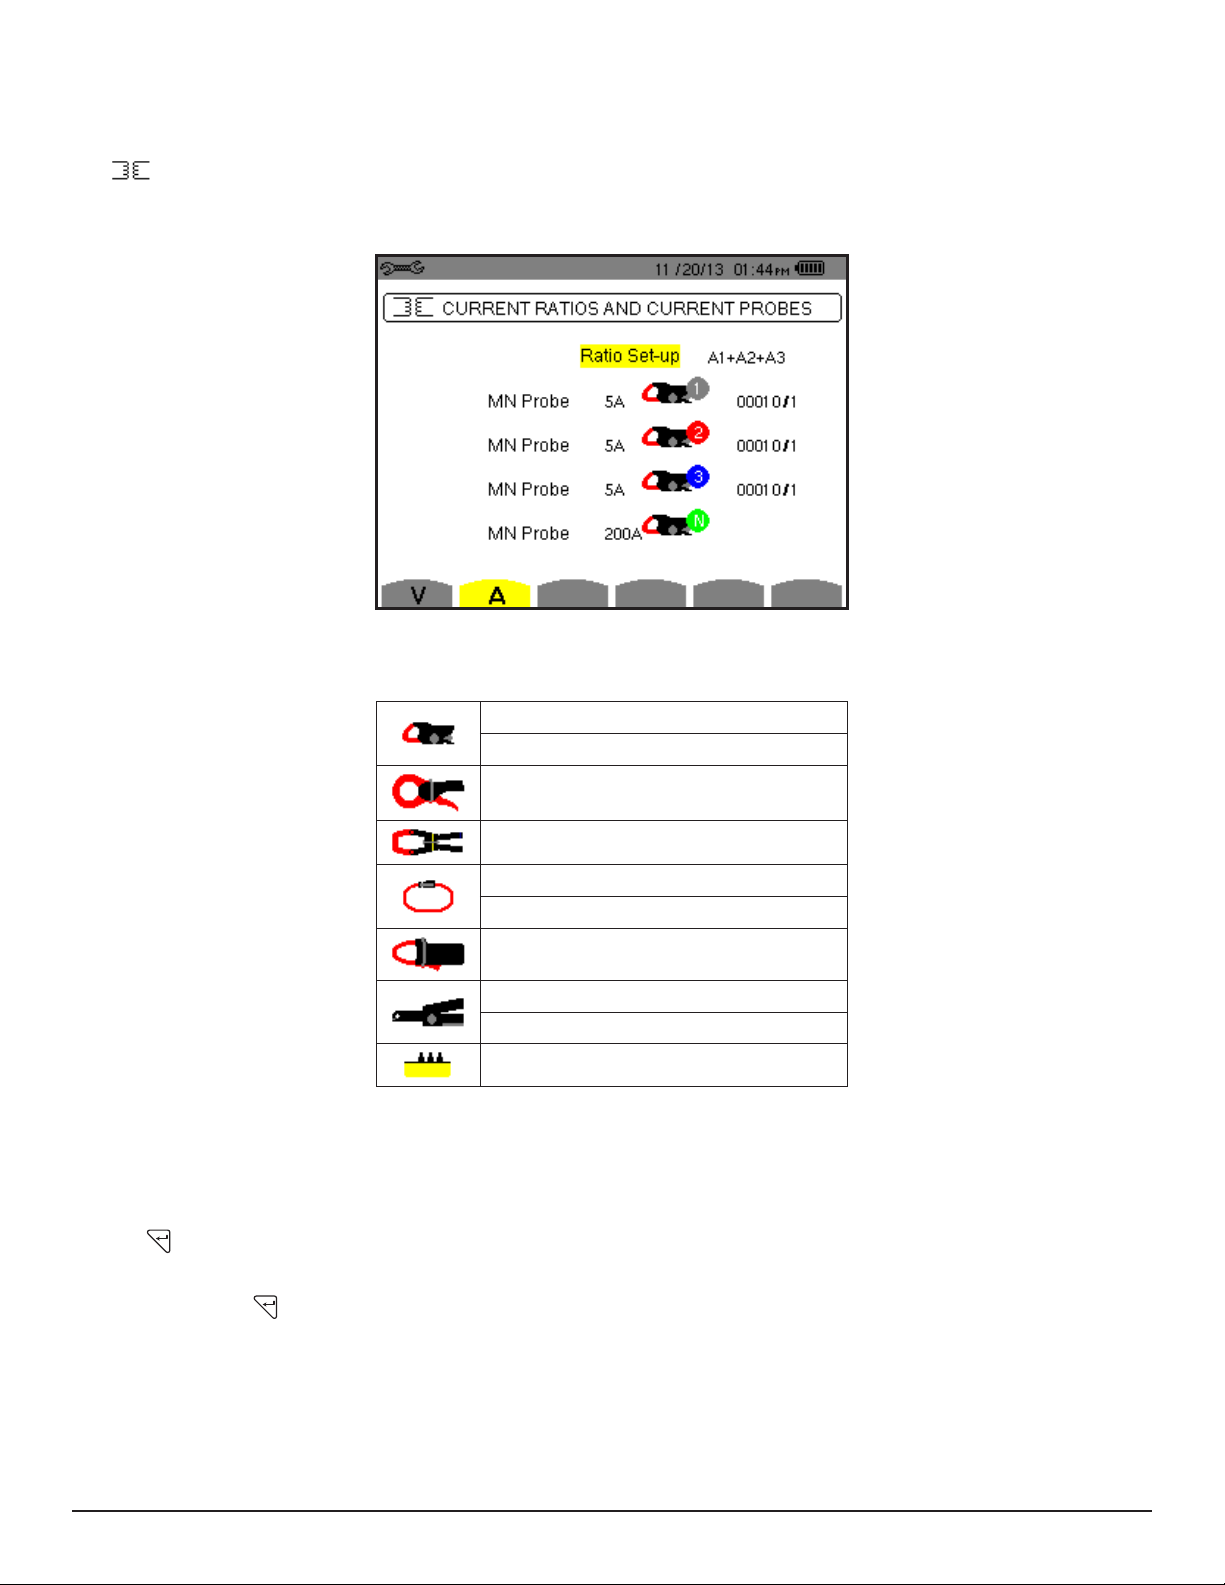
3.2.5 PROBES AND RATIOS
3.2.5.1 CURRENT PROBES
The screen denes the current probes and ratios. It automatically displays the current probe models detected by the
instrument. It can also be used to dene the transformation ratio (sensitivity) of certain current sensors (SL261 clamp). To
select current probes and current ratios settings, press the A button to display the following screen:
Figure 3-12
The probe choices that are available are:
MN93 clamp: 200AAC
MN193 clamp: 100 or 5AAC
SR193 clamp: 1000AAC
J93 clamp: 3500AAC/5000ADC
AmpFlex® A193: 6500AAC/10,000AAC
MiniFlex® MA193: 6500AAC
MR193 clamp: 1000A/1200AAC/DC
SL261 clamp: 100A (sensitivity 10mV/AAC/DC)
SL261 clamp: 10A (sensitivity 100mV/AAC/DC)
Three phase adapter: 5AAC
If an MN193 clamp, 5A range, or an Adapter is used, the current ratio setting is proposed automatically. The conguration
is done as follows:
■ To select the channel, press the ▲ or ▼ buttons.
■ To congure the primary circuit current (1 to 60,000A) / secondary circuit current (1A, 2A or 5A) transformation ratio,
press . To select the elds, use ◄ or ►.
■ To adjust the values, use ▲ or ▼. Proceed in the same way for the primary and secondary circuit currents.
■ To validate, press (the parameters are applied only if conrmed).
The primary current cannot be less than the secondary current.
Power Quality Analyzer PowerPad® III Model 8435
25
Page 28
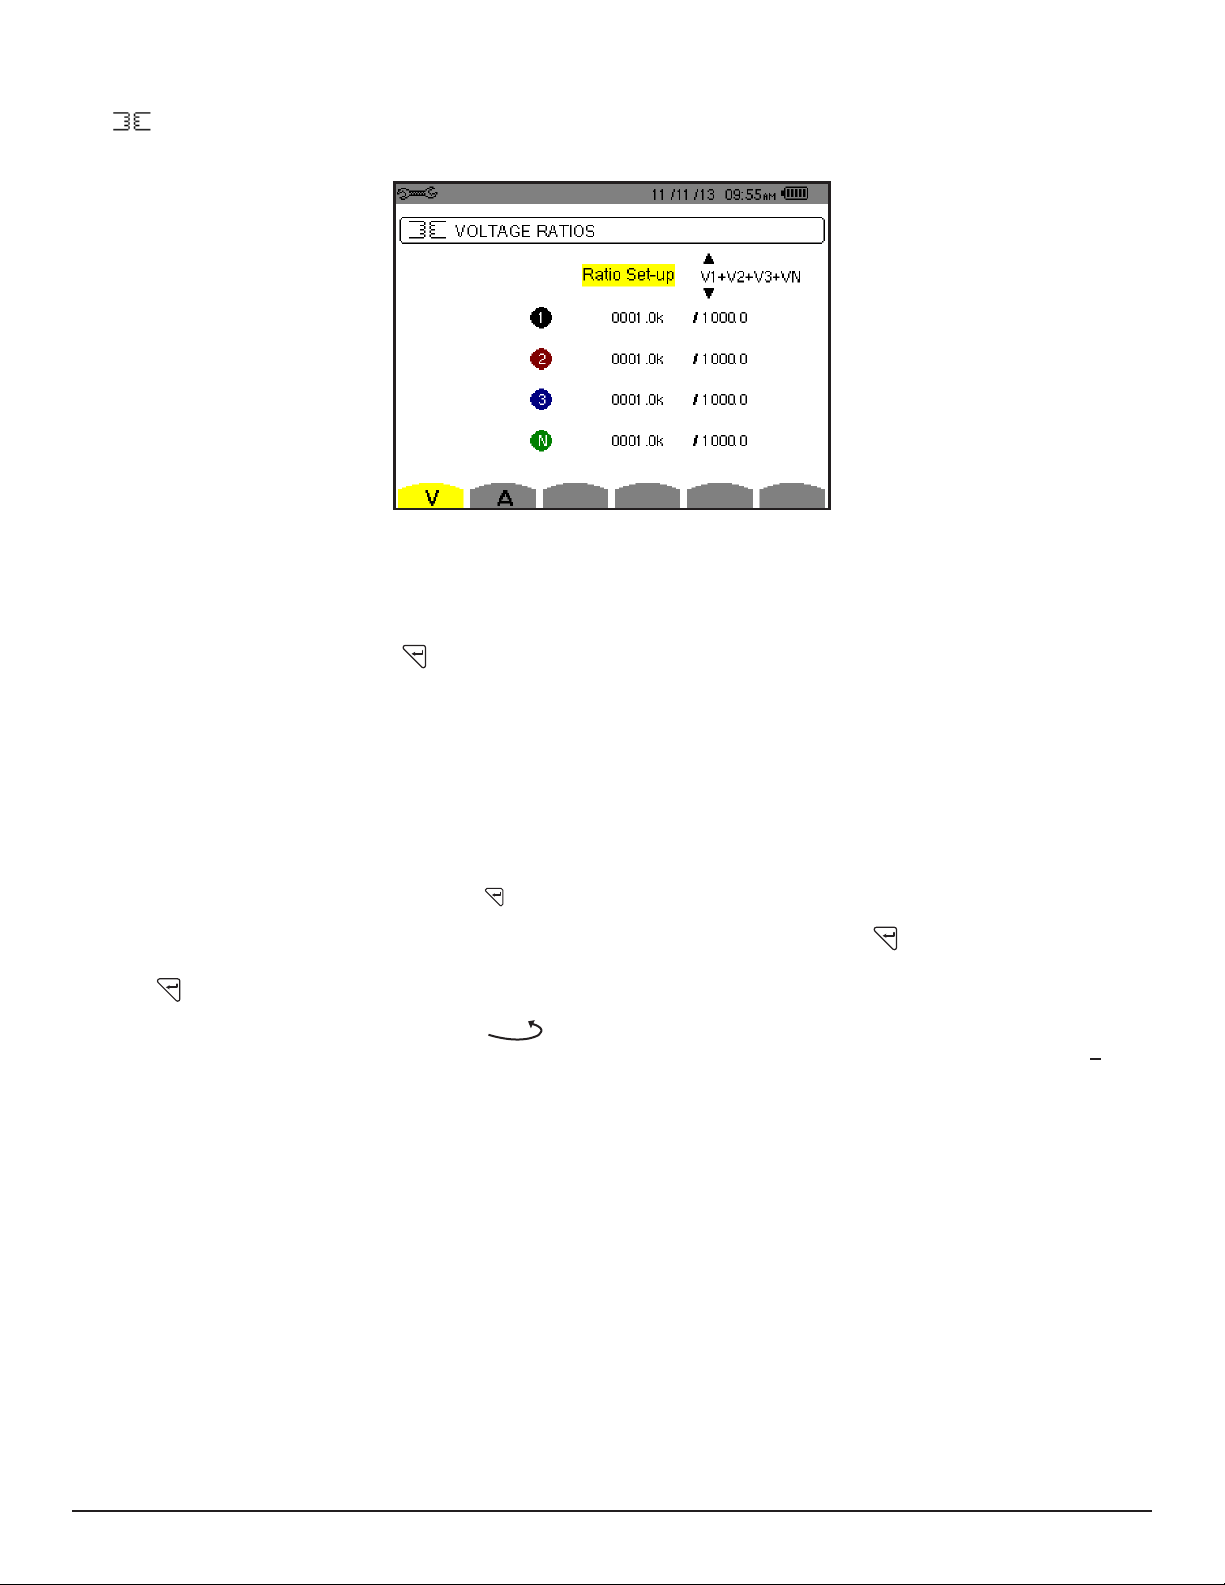
3.2.5.2 VOLTAGE RATIOS
The screen also enables you to dene the voltage ratios. To do this, press the V button to display the following
screen.
Figure 3-13
The ratios can be programmed to be the same in all channels, or dierent in one or more of them. The following steps
describe a 3-phase 5-wire hook-up; the available channels are determined by connection type and may be dierent for
your connection.
1. Highlight Ratio Set-up and press. Then use the ▲ or ▼ buttons to display the available options:
V1+V2+V3+VN: each channel and the neutral has a different ratio. You are prompted to enter a separate ratio for
each channel (1, 2, and 3) and the neutral (N) as shown in Figure 3-13.
3V + VN: all channels have the same ratio and the neutral has a different ratio. You are prompted to enter a ratio for
the channels and another ratio for the neutral.
4V: all channels have the same ratio. You are prompted to enter the ratio that will apply to all.
4V 1/1: all channels have the same 1/1 ratio.
2. Select the set-up and validate by pressing .
3. To select channels, press the ▲ and ▼ buttons to highlight the channel eld and press . Then use the ◄ and ►
buttons to navigate within the field, and the ▲ and ▼ buttons to adjust values. When you are finished with the field,
press to validate (the parameter must be validated to be applied).
4. To return to the Conguration menu, press
.
For the primary voltage (in kV) and the secondary voltage (in V), it is possible to specify the use of the multiplier 1/√3. If
the phase-to-neutral voltage ratios of phases 1, 2, and 3 are not identical; then all measurements and curves concerning
the phase-to-phase voltages are suppressed.
26
Power Quality Analyzer PowerPad® III Model 8435
Page 29
3.2.6 CAPTURE MODE
The
Capture Mode scr
een denes voltage and current thresholds for transient and Inrush captures.
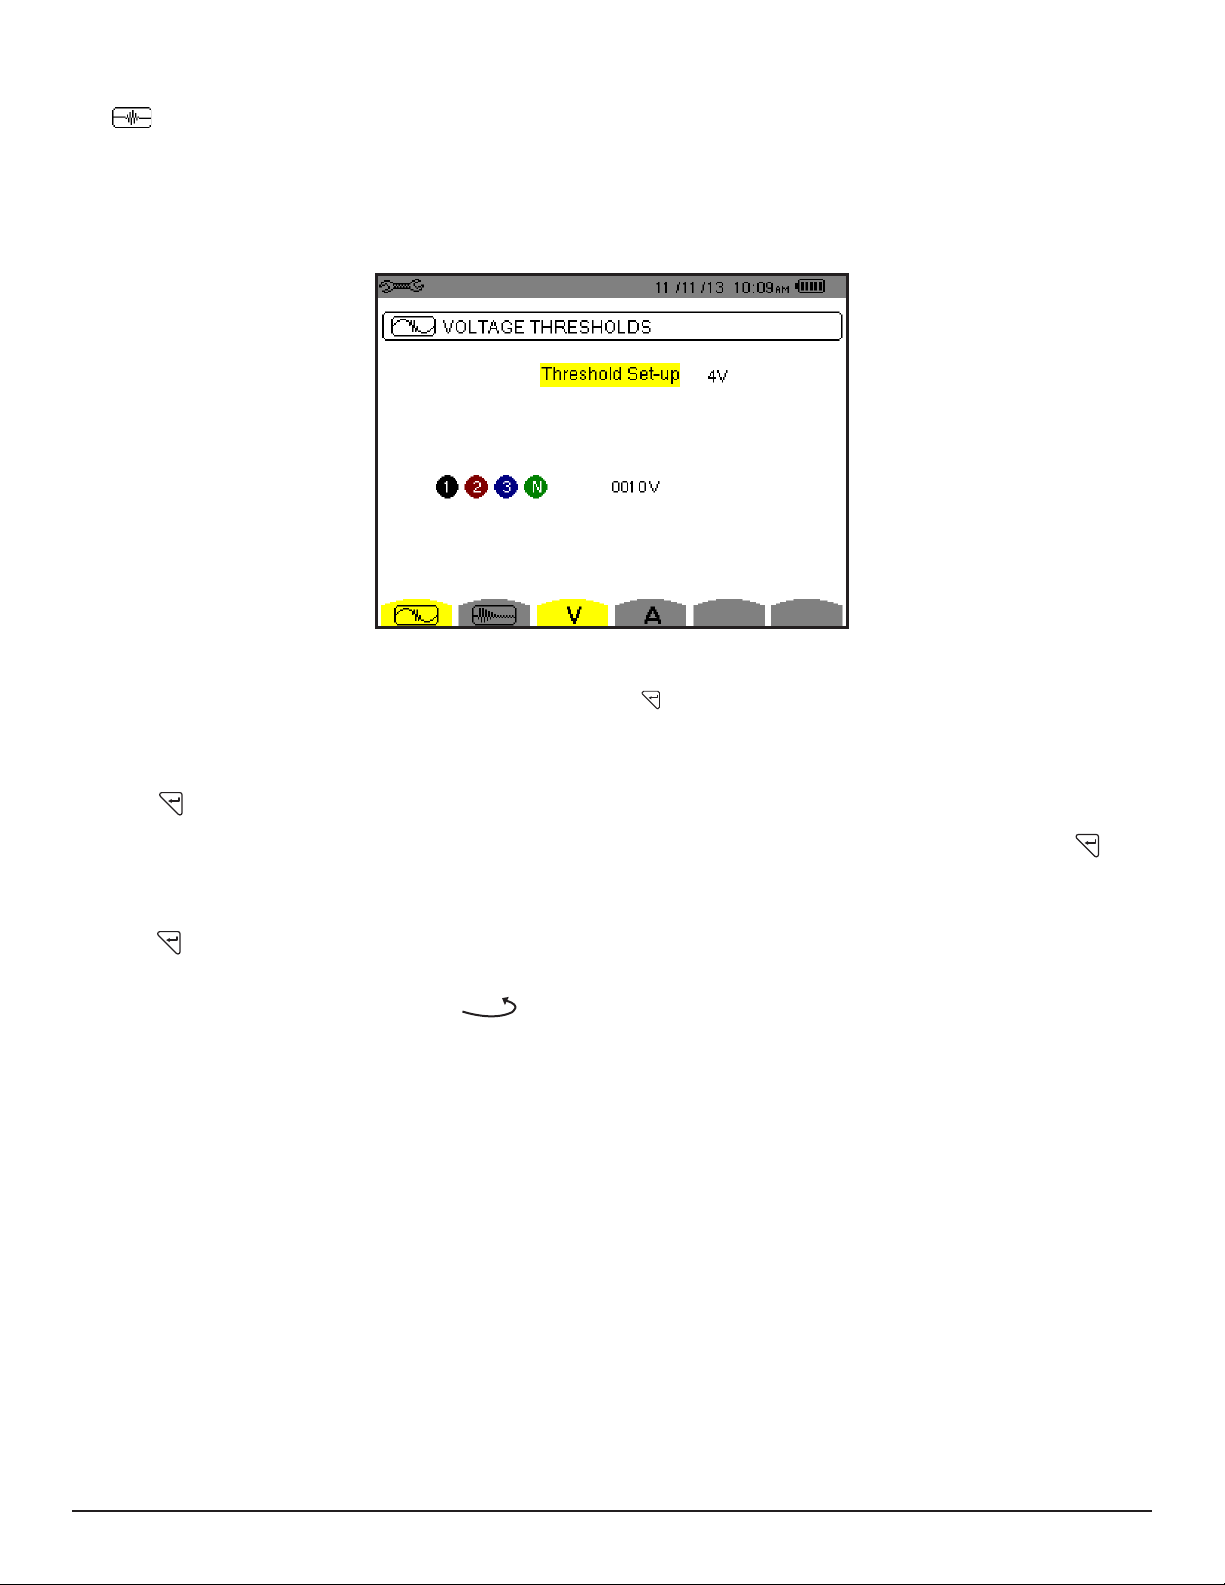
3.2.6.1 TRANSIENT VOLTAGE THRESHOLDS
By default, the Capture Mode screen opens with the Transient Voltage Thresholds screen displayed.
Figure 3-14
1. Select Threshold Set-up, highlighted in yellow, by pressing . The ▲ and ▼ buttons appear in the eld to enable
you to select the threshold conguration.
2. Use the ▲ or ▼ button to go from one type of conguration to another.
3. Press to validate the choice of conguration.
4. Select the eld of the rst threshold using the ▲ or ▼ button. The selected eld is highlighted in yellow. Press to
displays the arrows in the eld.
5. Use the ▲ or ▼ button to increment or decrement a value and ◄ or ► to go to the next digit in the value.
6. Press to validate the programming of the threshold.
To return to the Conguration screen, press
.
The voltage thresholds can be congured in V or in kV.
Power Quality Analyzer PowerPad® III Model 8435
27
Page 30
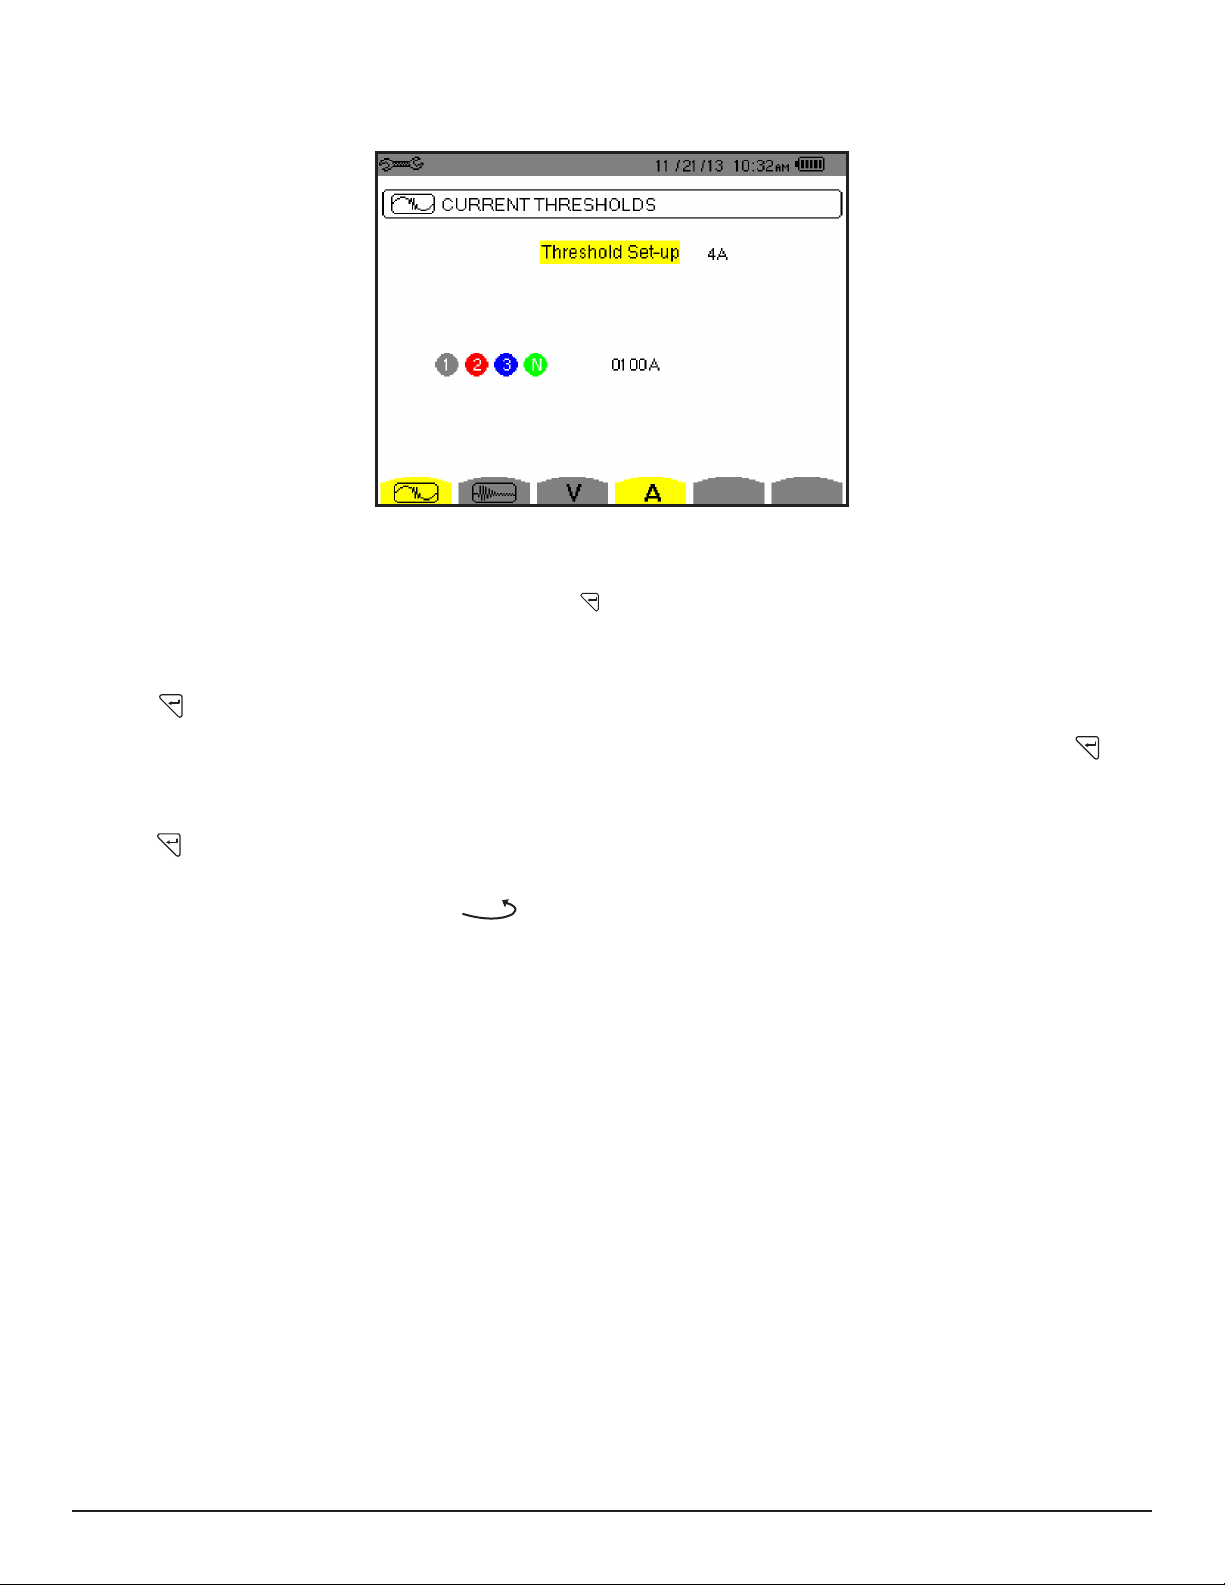
3.2.6.2 TRANSIENT CURRENT THRESHOLDS
To display the Transient Current Thresholds screen, open the Capture Mode screen and press the A button.
Figure 3-15
1. The process for setting the transient current threshold is similar to setting the transient voltage threshold. Select
Threshold Set-up, highlighted in yellow, by pressing . The ▲ and ▼ buttons appear in the eld to enable you to
select the threshold conguration.
2. Use the ▲ or ▼ button to go from one type of conguration to another.
3. Press to validate the choice of conguration.
4. Select the eld of the rst threshold using the ▲ or ▼ button. The selected eld is highlighted in yellow. Press to
displays the arrows in the eld.
5. Use the ▲ or ▼ button to increment or decrement a value and ◄ or ► to go to the next digit in the value.
6. Press to validate the programming of the threshold.
To return to the Conguration screen, press
.
You can congure the current thresholds in mA, A, or kA.
28
Power Quality Analyzer PowerPad® III Model 8435
Page 31

3.2.6.3 INRUSH CURRENT THRESHOLDS
You can also set Inrush current thresholds from the Capture Mode screen To do this, press the button.
Figure 3-16
This screen denes the Inrush current thresholds for each recognized current probe. The thresholds can be the same for
all channels or dierent for some or all of them. To select the Inrush current threshold, proceed as follows:
1. Select Start Threshold, highlighted in yellow, by pressing . The navigation arrows appear in the eld to enable you
to select the appropriate value.
2. Use the ▲ and ▼ buttons to raise or lower the threshold value, and the ◄ and ► buttons to move to a selected digit
in the value.
3. Press to validate the threshold value.
4. Press ▼ to highlight the Hysteresis field. The selected eld is highlighted in yellow. Press to display the arrows in
the eld.
5. Use the ▲ or ▼ button to raise or lower the value.
6. Press to validate the hysteresis percentage.
To return to the Conguration screen, press
.
You can congure the current thresholds in mA, A, or kA.
Power Quality Analyzer PowerPad® III Model 8435
29
Page 32

3.2.7 TREND MODE
The Model 8435 has a recording function button for recording measured and calculated values (Urms, Vrms, Arms,
etc.). Four independent congurations can be congured as needed. To do this, select Trend Mode from the
Conguration menu to display the following screen:
Figure 3-17
The recordable values are:
Value Description
Urms
Vrms
Arms
W
PF
PST
Udc
Vdc
Adc
Wdc
DPF
PLT
Upk+
Vpk+
Apk+
VAR
tan φ
FHL
UpkVpkApk-
VAD
FK
Ucf
Vcf
Acf
VA
Vunb
Uthdf
Vthdf
Phase-to-phase voltage (2φ, 3φ)
Phase-to-neutral voltage
Phase A, B, C, N
Active power
Power factor
Short-term flicker
Direct voltage phase to phase
Direct voltage neutral to ground
Direct currents
Direct powers in W
Fundamental power factors
Long-term flicker
Positive peak phase to phase voltages
Positive peak phase to neutral/ground voltages
Positive peak currents
Reactive power
Tangent
Harmonic loss factors
Negative peak phase to phase voltages
Negative peak phase to neutral ground voltages
Negative peak currents
Distortion powers in var
Factor K
Crest factor of phase voltage (2φ, 3φ)
Crest factor of phase-to-neutral voltage
Crest factor of current
Apparent power
Line voltage unbalance (2φ, 3φ)
Harmonic distortion of line voltage (2φ, 3φ)
Full harmonic distortion of phase-to-neutral voltage
30
Power Quality Analyzer PowerPad® III Model 8435
Page 33

Athdf
Aunb
Uthdr
Vthdr
Athdr
Hz
U-h
V-h
A-h
VA-h
To activate these parameters:
Full harmonic distortion of current
Current unbalance (2φ, 3φ)
Phase to phase voltage total harmonic distortions
Phase to neutral voltage total harmonic distortions
Current total harmonic distortions
Network frequency
Phase-to-phase harmonics
Phase-to-neutral harmonics
Phase current harmonics
Apparent power harmonics
1. Choose one of the four congurations by pressing the yellow buttons corresponding to the
(page down) icons. The selected Trend page number (
the screen.
2. Display the rst page of values listed in the preceding table by pressing the
the bottom left corner of the display, indicating that you are viewing page 1 of 2.
3. Move through the choices with the arrow buttons. As you move through the parameters, each choice in turn will be
highlighted.
4. To activate the selected parameter, press the button. Selected parameters will appear with next to their names;
those not selected will have an unlled . Value names that appear in red type are not applicable to the current
hook-up selection and conguration.
5. After you have nished selecting the values on the rst page, display the second page of values by pressing the
button (“2/2” will appear in the lower left corner of the display). These variables include U-h (phase-to-phase
harmonics), V-h (phase-to-neutral harmonics), A-h (phase harmonics), and VA-h (apparent harmonics).
6. Highlight the value you want to modify using the arrow buttons, then press the button to select it.
7. Use the ► button to move to the rst modiable eld for this parameter. A value from 00 to 50 may be selected using the ▲
and ▼ buttons. Press the button to select the value.
8. Press the ► button to move to the upper value. Use the same process to select the upper limit.
9. Press the ► button again to move to the right to modify the last value needed to complete the denition. Here you will
choose whether to include all harmonics or only the odd harmonics. Use the button to make this selection. The diamond
preceding the Odd Only choice will appear lled in for selected and unlled for not selected. For example:
,
,
, or
appears in the title bar at the top of
)
button. The numbers “1/2” appear in
page up) and
(
Vh 02 → 15 Odd Only
In this user dened condition, all odd voltage harmonics between the 2nd and the 15th will be recorded.
10. Press the button when you have nished selecting all the parameters to be recorded to apply the new setup.
The battery may fully discharge when the instrument is recording for long periods of time while not connected to a power supply.
The Model 8435 will continue to record for some time, even if below the minimum battery charge value. However, the display may
not come back ON, and the instrument will eventually stop saving data when the battery is too low. All data recorded will be saved.
If the instrument is in the Record Mode, and the display does not come ON, do not turn the instrument OFF. Supply power to the Model
8435 with the power cord and the display will come back ON when any button (other than ON/OFF) is pressed.
Power Quality Analyzer PowerPad® III Model 8435
31
Page 34

3.2.8 ALARM MODE CONFIGURATION
The screen denes the alarms used by the Alarm Mode function (see § 4.4). You can congure 40 dierent alarms.
Figure 3-18
1. There are ve user-dened parameters on each page. Initially each parameter name appears as a question mark (?).
Select the alarm number you want to modify using the ▲ and ▼ buttons, then press the button to conrm.
2. Use the ▲ and ▼ buttons to select the alarm channel, then press the button to conrm the choice.
3. To navigate horizontally, use the ◄ and ► buttons, then conrm with . Select the values with the ▲ and ▼ buttons,
then conrm with .
4. When an alarm channel is changed, the Record icon is disabled. To enable the recording of the alarm, select the
alarm number and press .
For each alarm to dene, select:
● The type of alarm (Vah, Ah, Uh, Vh, Tan, PF, DPF, VA, VAR, W, Athd, Uthd, Vthd, KF, Hz, Aunb, Vunb, Vrms, Acf,
Ucf, Vcf, PST, Arms, Urms, and Vrms).
● The harmonics range (between 0 and 50 for Vah, Ah, Uh and Vh).
● The alarm lter (3L: 3 individually monitored phases or N: monitoring neutral or Sigma/2 or Sigma/3 or Sigma).
● The meaning of the alarm (> or < for Arms, Urms, Vrms, Hz only, otherwise the direction is unique).
● The threshold for triggering the alarm (10 possible settings of the alarm in the following cases: W, VAR and VA).
● The minimum duration for exceeding alarm validation threshold (in minutes, seconds, or for Vrms, Urms and
Arms, in hundredths of seconds).
● The hysteresis value (corresponds to the percentage added or taken away from the alarm threshold chosen that
will stop the alarm in the event of overrun - value 1, 2, 5, or 10%).
● Activating the alarm (read item) or deactivating it.
5. After the conguration has been completed, activate the alarm by positioning the yellow cursor in the rst column on
the left using the◄ button, press . Activation is conrmed if there is a lled in to the left of the alarm.
6. To display the alarm screen pages, press the yellow buttons corresponding to the
32
Power Quality Analyzer PowerPad® III Model 8435
and
icons.
Page 35

3.2.9 ERASING MEMORY
When Erase Memory is selected, the following screen appears:
Figure 3-19
There are six types of data stored in the Model 8435 memory:
■ Trend Recordings
■ Transient Detections
■ Inrush Current Capture
■ Alarm Detections
■ Snapshots
■ Set-up
You can erase some or all of this data. To erase all the data at once, press the yellow button corresponding to the icon.
Validation is conrmed by the to the left of all parameters. To erase selected data, highlight it using the ▲ and ▼ buttons,
then press .
To complete the deletion, press the yellow button corresponding to the icon, then press the button to conrm.
WARNING: By choosing to delete all data, all detected alarms, screen snapshots, captured transient states and all recordings
are deleted.
To leave this screen without deleting anything, press the button.
Power Quality Analyzer PowerPad® III Model 8435
33
Page 36

3.2.10 ABOUT
The
About screen displays information about the Model 8435 instrument:
Figure 3-20
34
Power Quality Analyzer PowerPad® III Model 8435
Page 37

4. DISPLAY MODES
To select parameters in all modes, use the ◄ ►▲▼ buttons to move to the desired parameter and use the button to
conrm selections.
4.1 WAVEFORM CAPTURE MODE
Press the Waveform Display mode
Select either the Transient mode (§ 4.1.1) or the Inrush Current mode (§ 4.1.2) using the ▲ and ▼ buttons, then
conrm with
. To return to the Waveform Capture screen, press .
button. The Waveform Capture screen appears.
Figure 4-1
4.1.1 TRANSIENT MODE
This mode enables transients to be recorded. It lists recorded transients to be viewed and (if necessary) deleted. All tracks
are stored in memory for each transient (regardless of the connection conguration). You can record up to 210 transients.
NOTE: When the Transient mode is selected, the display screen will depend on the following conditions:
if … then …
no record has been made the Detection Schedule screen is displayed
transients have been recorded the Recording List screen is displayed
4.1.1.1 PROGRAMMING AND STARTING A SEARCH
To program the search for a transient, select Transient by pressing the button in the Waveform Capture screen (see
Figure 4-1). The Detection Schedule screen is displayed.
Figure 4-2
Power Quality Analyzer PowerPad® III Model 8435
35
Page 38

Item Function
1
Reminder of the mode used
2
Display of sub-mode used
3
Flashing icon: indicates that the search has been started
4
Memory indicator. Black area = used memory; White area = available memory
5
Transients search start time
6
Transients search end time
7
Number of transients
8
Name of transient
To congure and start the programming of a search:
1. Select and set the desired congurations for the start/stop date and time, count, and series name. Use the ▲ and ▼
buttons to navigate from one field to another, the button to select the eld, the ◄ and ► buttons to navigate within
the field, and the ▲ and ▼ buttons to enter numbers and letters into the field. For example, in the Name field the ▲
and ▼ buttons cycle up and down through the alphabet and numbers 0 through 9.
2. To start programming a search between the start and end times which you have dened press the yellow button for
the icon.
● The icon disappears and the
● When the start time is reached the message Detection in progress is displayed.
● When the stop time is reached, the icon is displayed again. It is then possible to program a new search.
i
con appears instead.
Transients are recorded in relation to the voltage and/or the current in accordance with the configured activation thresholds. If
an activation occurs in relation to the current, a record of the current waveform and voltage is made.
4.1.1.2 STOPPING A SEARCH
The search can be manually stopped before the end time and date by pressing the
will reappear in the same location.
i
con’s yellow button. The icon
36
Power Quality Analyzer PowerPad® III Model 8435
Page 39

4.1.1.3 DISPLAYING A TRANSIENT
To display the recorded transient, proceed as follows:
1. Display the Detection List screen by pressing the button.
Figure 4-3
Item Function
1
The displayed value indicates the page number and the number of pages.
These icons let you browse through the previous and next screens. Press the yellow buttons corresponding to these icons to display
2
the pages.
2. Each item in the Detection List represents a search in which transients have been detected. To display a list of
transients, select the search (the name appears in bold text) and press . The Transient List screen appears.
Figure 4-4
3. Use the ▲ and ▼ buttons to scroll through the list. The button activates the set of display lter buttons listed on
the right side of the screen. When these lters are activated, you can select them by pressing the ▲ and ▼ buttons.
4. Press to view the selected transient.
Power Quality Analyzer PowerPad® III Model 8435
37
Page 40

Figure 4-5
Item Function
Selection of display filters
- 4V: displays the 4 single voltages during the transient (here in a 5-wire tri-phase connection)
1
- 4A: displays the 3 phase currents and the neutral current during the transient
- L1, L2 or L3: displays the current and the single voltage successively in relation to phases 1, 2 and 3
- N: displays neutral
2
Instantaneous value of the signals according to the position of the cursor on the scale. To move the cursor use the ◄ and ► buttons.
: Zoom Out - To zoom out press the yellow button for this icon.
3
5. To return to the Transient List screen, press .
4.1.1.4 DELETING A TRANSIENT
1. From the Detection List screen, select the transient to be deleted using the ▲ and ▼ buttons, then press .
2. Press the icon’s yellow button to delete the selected transient.
3. To leave this screen without deleting, press any of the Mode buttons on the Model 8435.
To return to the Waveform Capture screen, press .
: Zoom In - To zoom in press the yellow keypad button for the icon.
4.1.2 INRUSH CURRENT MODE
The
current capture is kept in memory.
NOTE: When Inrush Current mode is selected the display screen will depend on the following conditions:
mode is used to capture (record) Inrush currents and to view and delete the recordings. Only a single Inrush
if … then …
no capture has been made the Capture Schedule screen is displayed
captures have been made the Capture Parameters screen is displayed
38
Power Quality Analyzer PowerPad® III Model 8435
Page 41

4.1.2.1 PROGRAMMING A CAPTURE
To program the capture of an Inrush current, proceed as follows:
1. At the Waveform Capture screen, select Inrush Current. The Capture Schedule screen is displayed.
Figure 4-6
Item Function
1
Reminder of the mode used
2
Display of sub-mode used
3
Current date and time
4
Battery charge level
Rapid programming and starting of a capture. When this button is pressed, the recording starts immediately with a current threshold of
5
0A and a hysteresis of 100%
6
Displays Configuration screen to set triggering thresholds
7
Displays the parameters of the capture
8
Programs the capture
confirms programming of a capture
9
:
: deletes a capture (this icon is displayed if a capture has been made)
2. To program a capture, enter the triggering lter (3A, A1, A2, or A3), the start date and time, and the recording mode
(RMS + PEAK or RMS only).
The RMS + PEAK recording mode is used to produce a trend recording of the half-period RMS values and a trend
recording of the samples (envelopes and waveforms). The maximum duration of such a recording depends on the
frequency and is on average about one minute.
In the RMS only recording mode, the recording of the samples is eliminated in favour of a longer maximum capture
duration. This mode records only the half-period RMS values and its maximum duration is about ten minutes.
3. To modify an item, move the yellow cursor to it using the ▲ and ▼ buttons, then validate with the button. Change
the value using the ◄ ►▲▼ buttons, then validate again.
NOTE: The triggering lter appears in red if it is not available because of an incompatibility with the conguration
(connection, type of sensors, or current ratio).
Power Quality Analyzer PowerPad® III Model 8435
39
Page 42

4.1.2.2 STARTING A CAPTURE
As noted in the preceding table, you can press the button to start a recording immediately. When you do this, the
current threshold is set to 0A and the hysteresis is 100%. To start the capture at a previously specied date and time,
press the button. The icon on the status bar blinks to indicate that the capture has been started. The button
replaces the button and can be used to stop the capture before it is nished.
● When the activation conditions are met and the start time is reached, the message Capture pending is displayed
and the memory indicator appears at the top of the screen.
● The indicator is displayed only during the capture and disappears when the capture is completed.
● If the capture is completed with a stop event or if the memory is full, the capture stops automatically. The Capture
Schedule screen with the button displayed again.
The Model 8435 can keep only a single Inrush capture in memory. If you want to make another capture, delete the previous one
first.
To return to the Waveform Capture screen, press .
4.1.2.3 MANUALLY STOPPING A CAPTURE
The capture can be manually stopped by pressing the icon’s yellow button. The button will reappear in the same
location.
4.1.2.4 DISPLAYING THE PARAMETERS OF A CAPTURE
In capture display mode, two sub-menus RMS and PEAK are available. To display the parameters of a capture, proceed
as follows:
1. Select the sub-menu by pressing the icon’s yellow button. The Capture Parameters screen is displayed.
Figure 4-7
2. Choose the type of display, RMS or PEAK, by pressing the yellow button corresponding to the icon. The Model 8435
displays curves on which you can move the time cursor and zoom in and out.
In the PEAK display, the available information is:
● The instantaneous current and voltage at the time indicated by the cursor (in a “waveform” representation).
● The maximum instantaneous current and voltage in the half-cycle indicated by the cursor (in an “envelope”
representation).
● The maximum instantaneous absolute value of the current and voltage (over the entire capture).
40
Power Quality Analyzer PowerPad® III Model 8435
Page 43

In the RMS display, the available information is:
● The instantaneous frequency at the time indicated by the cursor.
● The minimum, mean, and maximum instantaneous values of the frequency over the entire capture.
● The RMS current and voltage in the half-cycle (or lobe) on which the cursor is positioned.
● The maximum half-cycle RMS current and voltage (over the entire capture).
A voltage must be present on the phase before the motor start-up for a stable and correct frequency control.
4.1.3 TRUE RMS CURRENT AND VOLTAGE
The RMS mode displays the record of the trend of the true half-cycle RMS current and voltage and the frequency trend
curve.
4.1.3.1 RMS DISPLAY SCREEN (3A)
Figure 4-8
Item Function
1
Instantaneous value cursor; change values with the cursor using the ◄ and ► buttons
2
Scale of values
- Maximum half-period RMS value of the Inrush current capture
3
- Indicator of number attributed to the displayed curve
- Value of the measured current
Selection of curves to be displayed:
- 3V: displays the 3 voltages during the Inrush current capture
4
- 3A: displays the 3 phase currents during the Inrush current capture
- L1, L2, L3: display the current and voltage in phases 1, 2, and 3, respectively
- Hz: displays the evolution of the network frequency vs time
- t: relative time position of the cursor
5
(t = 0 corresponds to the start of the Inrush capture)
- Values at the position of the cursor. In the example shown in Figure 4-8, A1, A2, and A3 are the RMS values of currents 1, 2, and 3.
: Zoom Out - Zooms out on the graph at the current cursor position
6
: Zoom In - Zooms in on the graph at the current cursor position
Power Quality Analyzer PowerPad® III Model 8435
41
Page 44

4.1.3.2 RMS DISPLAY SCREEN (L1)
Item Function
1
Instantaneous value cursor; change values with the cursor using the ◄ and ► buttons
- t: relative time position of the cursor
(t = 0 corresponds to the start of the Inrush capture)
2
- Values at the position of the cursor. In the example shown in Figure 4-9, V1: RMS value of voltage 1 in the half-cycle at the position
of the cursor; A1: RMS value of current 1 in the half-cycle at the position of the cursor
- MAX: maximum half-cycle RMS value of the Inrush current capture
3
- V: measured voltage
- A: measured current
Figure 4-9
NOTE: Filters L2 and L3 display the trend of the true half-cycle RMS current and voltage of phases 2 and 3. The screen is
identical to the one displayed for lter L1.
The , , , and buttons are used to go to the rst occurrence of a minimum or maximum voltage or current
value.
42
Power Quality Analyzer PowerPad® III Model 8435
Page 45

4.1.4 INSTANTANEOUS INRUSH CURRENT
The PEAK mode is used to display the envelopes and waveforms of the Inrush current capture.
4.1.4.1 PEAK DISPLAY SCREEN (4A)
The PEAK display of an Inrush current capture provides two possible types: Envelope and Waveform.
Switching between the two types is automatic, and is determined by the zoom. In the case shown, there is enough zoom
in to force the waveform type of representation. The display lters along the right edge of the screen depend on the type
of representation, and on the zoom.
Figure 4-10
Item Function
1
Instantaneous value cursor; change values with the cursor using the ◄ and ► buttons
2
Scale of values
- MAX: absolute value
3
- Indicator of number attributed to the displayed curve
- Value of the measured current
Selection of curves to be displayed:
- 4V: displays the 4 voltages during the Inrush current capture
4
- 4A: displays the 4 currents during the Inrush current capture
- L1, L2, L3: displays the current and voltage in phases 1, 2, and 3, respectively
- N: displays the neutral current and neutral voltage during the Inrush current capture
- t: relative time position of the cursor
(t = 0 corresponds to the start of the Inrush capture)
5
- Values at the position of the cursor. In the example shown in Figure 4-10, A1, A2, A3: instantaneous values of currents 1, 2, and 3 at
the position of the cursor
Power Quality Analyzer PowerPad® III Model 8435
43
Page 46

4.1.4.2 PEAK DISPLAY SCREEN (A1)
Item Function
1
Instantaneous value cursor; change values with the cursor using the ◄ and ► buttons
- t: relative time position of the cursor
(t = 0 corresponds to the start of the Inrush capture)
2
- Values at the position of the cursor. In the example shown in Figure 4-11, A1: maximum instantaneous current of the half-cycle
identified by the cursor
3
- MAX: maximum instantaneous absolute value of the Inrush current capture
Figure 4-11
NOTE: Filters A2 and A3 display the record of the current envelope of phases 2 and 3. The screen is identical to the one
displayed for lter A1.
4.2 HARMONICS MODE
Press the (Harmonic) button to select the type of harmonic analysis.
V - Phase-to-neutral voltage harmonics
A - Harmonics of the current harmonics
VA - Apparent power of the harmonics
U - Phase-to-phase voltage harmonics
The
4.2.1 PHASE-TO-NEUTRAL VOLTAGE HARMONIC
The V sub-menu displays the harmonics of the phase-to-neutral voltage.
NOTE: The choice of curves to be displayed depends on the type of connection (see § 4.2.4):
■ Single-phase: no choice (L1)
■ Split-phase: 2L, L1, L2
■ Three-phase, 3-, 4-, or 5-wire: 3L, L1, L2, L3, -,+
The example screen displays and sub-menus in this section illustrate a three-phase connection.
and buttons allow the user to zoom in or out, in increments of 2%, 5%, 10%, 20%, 50% and 100%.
44
Power Quality Analyzer PowerPad® III Model 8435
Page 47

4.2.1.1 PHASE-TO-NEUTRAL HARMONICS DISPLAY SCREEN (3L)
Figure 4-12
Item Function
Harmonic selection cursor; change values with the cursor using the ◄ and ►buttons
1
The horizontal axis indicates the orders of the harmonics (odd marking). Display of the level of the harmonics as a percentage of the
fundamental (order 1)
2
- DC: DC component
- 1 to 25: harmonics of order 1 to 25; when the cursor exceeds order 25, order 26 to 50 appears
- Vh 05: harmonic number
- %: ratio of the harmonic to the fundamental
3
- V: RMS voltage of the harmonic in question
- +000°: phase shift with respect to the fundamental (order 1)
Display in expert mode -.+ (on the right-hand side) is available for 3-phase hookups by pressing the ▲ and ▼ buttons.
4.2.1.2 PHASE VOLTAGE HARMONICS DISPLAY SCREEN (L1)
Figure 4-13
Item Function
Harmonic selection cursor; change values with the cursor using the ◄ and ►buttons
1
The horizontal axis indicates the orders of the harmonics (odd marking). Display of the level of the harmonics as a percentage of the
fundamental (order 1)
- DC: DC component
2
- 1 to 25: harmonics of order 1 to 25; when the cursor exceeds order 25, order 26 to 50 appears
- : indicator of the presence of non-zero harmonics of order higher than 25
Power Quality Analyzer PowerPad® III Model 8435
45
Page 48

- Vh 03: harmonic number
%: ratio of the harmonic to the fundamental
V: RMS voltage of the harmonic in question
+000°: phase shift with respect to the fundamental (order 1)
3
max – min: maximum and minimum levels of the harmonic in question (reset when the harmonic number is changed or the button
is pressed)
THD: total harmonic distortion
NOTE: Filters L2 and L3 display the harmonics of the phase-to-neutral voltage for phases 2 and 3, respectively. The screen is
identical to the one displayed for lter L1.
4.2.2 CURRENT
The A sub-menu displays the harmonics of the current.
4.2.2.1 CURRENT HARMONICS DISPLAY SCREEN (3L)
Figure 4-14
Item Function
Harmonic selection cursor; change values with the cursor using the ◄ and ►buttons
1
The horizontal axis indicates the orders of the harmonics (odd marking). Display of the level of the harmonics as a percentage of the
fundamental (order 1)
2
- DC: DC component
- 1 to 25: harmonics of order 1 to 25; when the cursor exceeds order 25, order 26 to 50 appears
- Ah 05: harmonic number
- %: ratio of the harmonic to the fundamental
3
- A: RMS current of the harmonic in question
- +000°: phase shift with respect to the fundamental (order 1)
46
Power Quality Analyzer PowerPad® III Model 8435
Page 49

4.2.2.2 CURRENT HARMONICS DISPLAY SCREEN (L1)
Figure 4-15
Item Function
Harmonic selection cursor; change values with the cursor using the ◄ and ►buttons
1
The horizontal axis indicates the orders of the harmonics (odd marking). Display of the level of the harmonics as a percentage of the
fundamental (order 1)
- DC: DC component
2
- 1 to 25: harmonics of order 1 to 25; when the cursor exceeds order 25, order 26 to 50 appears
- : indicator of the presence of non-zero harmonics of order higher than 25
- Ah 05: harmonic number
%: ratio of the harmonic to the fundamental
A: RMS current of the harmonic in question
+000°: phase shift with respect to the fundamental (order 1)
3
max – min: maximum and minimum levels of the harmonic in question (reset when the harmonic number is changed or the button
is pressed)
THD: total harmonic distortion
NOTE: Filters L2 and L3 display the current harmonics of phases 2 and 3, respectively. The screen is identical to the one
displayed for lter L1.
Power Quality Analyzer PowerPad® III Model 8435
47
Page 50

4.2.3 APPARENT POWER
02/06/14
02/06/14
The VA sub-menu displays the harmonics of the apparent power.
4.2.3.1 APPARENT POWER HARMONICS DISPLAY SCREEN (3L)
1
2
Figure 4-16
Item Function
Harmonic selection cursor; change values with the cursor using the ◄ and ►buttons
1
The horizontal axis indicates the orders of the harmonics (odd marking). Display of the level of the harmonics as a percentage of the
fundamental (order 1)
2
- DC: DC component
- 1 to 25: harmonics of order 1 to 25; when the cursor exceeds order 25, order 26 to 50 appears
- Vah 03: harmonic number
- %: ratio of the harmonic to the fundamental
- +000°: phase shift of the voltage harmonic with respect to the current harmonic for the order in question
3
: Indicator of energy generated for this harmonic
: Indicator of energy consumed for this harmonic
3
4.2.3.2 APPARENT POWER HARMONICS DISPLAY SCREEN (L1)
1
2
Figure 4-17
48
3
Power Quality Analyzer PowerPad® III Model 8435
Page 51

Item Function
02/06/14
Harmonic selection cursor; change values with the cursor using the ◄ and ►buttons
1
The horizontal axis indicates the orders of the harmonics (odd marking). Display of the level of the harmonics as a percentage of the
fundamental (order 1)
- DC: DC component
2
- 1 to 25: harmonics of order 1 to 25; when the cursor exceeds order 25, order 26 to 50 appears
: Indicator of energy consumed for this harmonic
- Vah 03: harmonic number
%: ratio of the harmonic to the fundamental
+000°: phase shift of the voltage harmonic with respect to the current harmonic for the order in question
3
max – min: maximum and minimum levels of the harmonic in question (reset when the harmonic number is changed or the button
is pressed)
NOTE: Filters L2 and L3 display the apparent power of the harmonics for phases 2 and 3, respectively. The screen is identical to
the one displayed for lter L1.
4.2.4 PHASE-TO-PHASE VOLTAGE
The U sub-menu is available only for three-phase connections, when the voltage ratios of phases 1, 2, and 3 are equal.
This sub-menu displays the harmonics of the phase-to-phase voltage.
4.2.4.1 PHASE-TO-PHASE VOLTAGE HARMONICS DISPLAY SCREEN (3L)
3
1
2
Figure 4-18
Item Function
Harmonic selection cursor; change values with the cursor using the ◄ and ►buttons
1
The horizontal axis indicates the orders of the harmonics (odd marking). Display of the level of the harmonics as a percentage of the
fundamental (order 1)
2
- DC: DC component
- 1 to 25: harmonics of order 1 to 25; when the cursor exceeds order 25, order 26 to 50 appears
- Uh 03: harmonic number
- %: ratio of the harmonic to the fundamental
3
- V: RMS voltage of the harmonic in question
- +000°: phase shift with respect to the fundamental (order 1)
Power Quality Analyzer PowerPad® III Model 8435
49
Page 52

4.2.4.2 PHASE-TO-PHASE VOLTAGE DISPLAY SCREEN (L1)
Figure 4-19
Item Function
Harmonic selection cursor; change values with the cursor using the ◄ and ►buttons
1
The horizontal axis indicates the orders of the harmonics (odd marking). Display of the level of the harmonics as a percentage of the
fundamental (order 1)
- DC: DC component
2
- 1 to 25: harmonics of order 1 to 25; when the cursor exceeds order 25, order 26 to 50 appears
- : indicator of the presence of non-zero harmonics of order higher than 25
- Uh 03: harmonic number
%: ratio of the harmonic to the fundamental
V: RMS voltage of the harmonic in question
+000°: phase shift with respect to the fundamental (order 1)
3
max – min: maximum and minimum levels of the harmonic in question (reset when the harmonic number is changed or the button
is pressed)
THD: total harmonic distortion
NOTE: Filters L2 and L3 display the harmonics of the phase-to-neutral voltage for phases 2 and 3, respectively. The screen is
identical to the one displayed for lter L1.
50
Power Quality Analyzer PowerPad® III Model 8435
Page 53

4.2.5 HARMONIC ANALYSIS IN EXPERT MODE
The -,+ (Expert) mode is available with a 3-Phase connection only. It is used to display the inuence of the harmonics on
the heating of the neutral and on rotating machines.
Press on the ▲▼ buttons to select “-.+” and then either the V or A sub-menu.
Example of a typical display:
Figure 4-20
■ Column One: The harmonics inducing a negative sequence.
■ Column Two: Those inducing a zero sequence (triplens added into the neutral).
■ Column Three: Those inducing a positive sequence.
4.3 WAVEFORM MODE
This mode displays the current and voltage curves, along with the values measured and those calculated from the
voltages and currents (except for power, energy and harmonics).
Figure 4-21
Item Measurement Type
RMS
THD
Measurement of the true RMS value
Measurement of total harmonic distortion
CF
Measurement of the peak factor
Display of Min/Max, RMS and peak values (see § 4.3.4)
Simultaneous display of voltage and current measurements (see § 4.3.5)
Display of Fresnel diagram of signals (see § 4.3.6)
Power Quality Analyzer PowerPad® III Model 8435
51
Page 54

4.3.1 RMS MEASUREMENT
02/06/14
This sub-menu displays the waveforms over a period of the measured signals and the true eective values of the voltage
and the current.
The choice of graphs to be displayed depends on the type of electrical connection that was set up during the configuration (see
§ 3.2.4).
● Single-phase: no choice (L1)
● Two-phase: 2V, 2A, L1, L2
● Tri-phase 3 or 4 wires: 3U, 3V, 3A, L1, L2, L3
● Tri-phase 5 wires:
- For THD, CF and : 3U, 3V, 3A, L1, L2 and L3
- For RMS, and : 3U, 4V, 4A, L1, L2, L3 and N
The screen captures shown in this section are examples of those obtained with a 3-Phase 5-Wire connection.
4.3.1.1 RMS DISPLAY SCREEN (3U)
This screen displays the three phase-to-neutral voltages of a 3-phase system when the voltage ratios of phases 1, 2, and
3 are equal.
1
Figure 4-22
Item Function
Instantaneous value cursor; change values with the cursor using the ◄ and ► buttons
1
RMS phase-to-phase voltages
2
Instantaneous value of the signals at the intersection of the cursor and the curves
t: time relative to the start of the period (expressed in milliseconds)
U1: instantaneous phase-to-phase voltage between phases 1 and 2 (U12)
3
U2: instantaneous phase-to-phase voltage between phases 2 and 3 (U23)
U3: instantaneous phase-to-phase voltage between phases 3 and 1 (U31)
2
3
52
Power Quality Analyzer PowerPad® III Model 8435
Page 55

4.3.1.2 RMS DISPLAY SCREEN (4V)
02/06/14
02/06/14
This screen displays the three phase-to-phase voltages and the neutral-to-earth voltage of a 3-phase system.
2
1
3
Figure 4-23
Item Function
Instantaneous value cursor; change values with the cursor using the ◄ and ► buttons
1
Effective phase-to-neutral voltages
2
Instantaneous value of the signals at the intersection of the cursor and the curves
t: time relative to the start of the period (expressed in milliseconds)
V1: instantaneous phase-to-neutral voltage of curve 1
3
V2: instantaneous phase-to-neutral voltage of curve 2
V3: instantaneous phase-to-neutral voltage of curve 3
VN: instantaneous neutral voltage
4.3.1.3 RMS DISPLAY SCREEN (4A)
This screen displays the three phase currents and the neutral current of a 3-phase system.
1
Figure 4-24
Item Function
Instantaneous value cursor; change values with the cursor using the ◄ and ► buttons
1
RMS currents
2
Instantaneous value of the signals at the intersection of the cursor and the curves
t: time relative to the start of the period (expressed in milliseconds)
A1: instantaneous current of phase 1
3
A2: instantaneous current of phase 2
A3: instantaneous current of phase 3
AN: instantaneous neutral voltage
Power Quality Analyzer PowerPad® III Model 8435
2
3
53
Page 56

4.3.1.4 RMS DISPLAY SCREEN (NEUTRAL)
02/06/14
02/06/14
This screen displays the neutral voltage relative to earth and the neutral current.
1
Figure 4-25
Item Function
Instantaneous value cursor; change values with the cursor using the ◄ and ► buttons
1
Effective values of currents
2
Instantaneous value of the signals at the intersection of the cursor and the graphs
t: time relative to the start of the period (expressed in milliseconds)
3
VN: instantaneous neutral voltage
AN: instantaneous neutral current
2
3
4.3.2 THD MEASUREMENT OF TOTAL HARMONIC DISTORTION
The THD sub-menu displays the waveforms over a period of the measured signals and the total harmonic distortion rates
for voltage and current.
4.3.2.1 THD DISPLAY SCREEN (3U)
This screen displays the phase-to-phase voltage waveforms for one period and the total harmonic distortion values.
2
1
3
54
Figure 4-26
Power Quality Analyzer PowerPad® III Model 8435
Page 57

Item Function
02/06/14
02/06/14
Instantaneous value cursor; change values with the cursor using the ◄ and ► buttons
1
Harmonic distortion rate for each curve
2
Instantaneous value of the signals at the intersection of the cursor and the curves
t: time relative to the start of the period (expressed in milliseconds)
U1: instantaneous phase-to-phase voltage between phases 1 and 2 (U12)
3
U2: instantaneous phase-to-phase voltage between phases 2 and 3 (U23)
U3: instantaneous phase-to-phase voltage between phases 3 and 1 (U31)
4.3.2.2 THD DISPLAY SCREEN (3V)
This screen displays the phase-to-neutral voltage waveforms for one period and the total harmonic distortion values.
2
1
3
Figure 4-27
Item Function
Instantaneous value cursor; change values with the cursor using the ◄ and ► buttons
1
Harmonic distortion rate for each curve
2
Instantaneous value of the signals at the intersection of the cursor and the curves
t: time relative to the start of the period (expressed in milliseconds)
V1: instantaneous phase-to-neutral voltage of curve 1
3
V2: instantaneous phase-to-neutral voltage of curve 2
V3: instantaneous phase-to-neutral voltage of curve 3
4.3.2.3 THD DISPLAY SCREEN (3A)
This screen displays the phase current waveforms for one period and the total harmonic distortion values.
2
1
Power Quality Analyzer PowerPad® III Model 8435
Figure 4-28
3
55
Page 58

Item Function
02/06/14
Instantaneous value cursor; change values with the cursor using the ◄ and ► buttons
1
Harmonic distortion rate for each curve
2
Instantaneous value of the signals at the intersection of the cursor and the curves
t: time relative to the start of the period (expressed in milliseconds)
A1: instantaneous current of phase 1
3
A2: instantaneous current of phase 2
A3: instantaneous current of phase 3
Note: Filters L1, L2, and L3 display the total current and voltage harmonic distortion for phases 1, 2, and 3, respectively.
4.3.3 MEASUREMENT OF THE PEAK FACTOR (CF)
The CF sub-menu displays the waveforms of the signals measured over one period and the voltage and current peak factors.
4.3.3.1 CF DISPLAY SCREEN (3U)
This screen displays the phase-to-phase voltage waveforms of one period and the peak factors.
2
1
Figure 4-29
Item Function
1
Instantaneous value cursor; change values with the cursor using the ◄ and ► buttons
2
Peak factor for each curve
Instantaneous value of the signals at the intersection of the cursor and the graphs
t: time relative to the start of the period (expressed in milliseconds)
3
U1: instantaneous voltage peak factor between phases 1 and 2 (U12)
U2: instantaneous voltage peak factor between phases 2 and 3 (U23)
U3: instantaneous voltage peak factor between phases 3 and 1 (U31)
3
56
Power Quality Analyzer PowerPad® III Model 8435
Page 59

4.3.3.2 CF DISPLAY SCREEN (3V)
02/06/14
This screen displays the phase-to-neutral voltage waveforms of one period and the peak factors.
02/06/14
2
1
3
Figure 4-30
Item Function
1
Instantaneous value cursor; change values with the cursor using the ◄ and ► buttons
2
Peak factor for each curve
Instantaneous value of the signals at the intersection of the cursor and the curves
t: time relative to the start of the period (expressed in milliseconds)
3
V1: instantaneous phase-to-neutral voltage of phase 1
V2: instantaneous phase-to-neutral voltage of phase 2
V3: instantaneous phase-to-neutral voltage of phase 3
4.3.3.3 CF DISPLAY SCREEN (3A)
This screen displays the current waveforms of one period and the peak factors.
1
Figure 4-31
Item Function
Instantaneous value cursor; change values with the cursor using the ◄ and ► buttons
1
Peak factor for each curve
2
Instantaneous value of the signals at the intersection of the cursor and the graphs
t: time relative to the start of the period (expressed in milliseconds)
A1: instantaneous current of phase 1
3
A2: instantaneous current of phase 2
A3: instantaneous current of phase 3
2
3
Note: L1, L2 and L3 display the peak factors of the current and of the voltage respectively for phases 1, 2 and 3.
Power Quality Analyzer PowerPad® III Model 8435
57
Page 60

4.3.4 MEASUREMENT OF MIN, MAX, AVERAGE, VOLTAGE AND CURRENT VALUES
This sub-menu displays the RMS, maximum, minimum and average values for voltage and current, together with those for
the instantaneous positive and negative voltage and current peaks.
NOTE: The display screen varies depending on which value is selected.
■ 3U: Displays the one-second mean and half-cycle maximum and minimum RMS values and the instantaneous positive
and negative phase-to-phase voltage peaks.
■ 4V: Displays the one-second mean and half-cycle maximum and minimum RMS values and the instantaneous positive
and negative peaks of the phase-to-neutral voltages and of the neutral.
■ 4A: Displays the one-second mean and half-cycle maximum and minimum RMS values and the positive and negative
instantaneous peak values of the phase and neutral currents.
■ L1/L2/L3: Displays the one-second mean and half-cycle maximum and minimum RMS values and the instantaneous
positive and negative peaks of the phase-to-neutral voltage and of the current of phase 1.
■ N: Displays the RMS values and the positive and negative instantaneous peaks of the neutral relative to earth.
Figure 4-32
The columns display the values relative to each voltage, current or neutral graph.
Item Function
MAX
RMS
MIN
PK+
NOTE: The MAX and MIN RMS measurements are calculated every half-period (e.g. every 10ms for a signal at 50Hz).
The measurements are refreshed every 250ms.
To reset the MIN and MAX on the display, press the button.
Maximum RMS value of the voltage or current from powering of the Model 8435 or from the last time the button is pressed.
True effective value of voltage or current
Minimum RMS value of the voltage or current from powering of the Model 8435 or from the last time the button is pressed.
Maximum peak value of the voltage or current
PK-
Minimum peak value of the voltage or current
58
Power Quality Analyzer PowerPad® III Model 8435
Page 61

4.3.5 SIMULTANEOUS DISPLAY
02/06/14
This sub-menu displays all the voltage and current measurements (RMS, DC, THD, DF, CF, PST, KF).
NOTE: The display screen varies depending on which value is selected.
■ 3U: Displays the RMS, DC, THD, DF, and CF values of the phase-to-phase voltages.
■ 4V: Displays the RMS, DC, THD, DF, CF and PST values of the phase-to-neutral voltages and of the neutral.
■ 4A: Displays the RMS, DC, THD, DF, CF, and KF values of the phase and neutral currents.
■ L1/L2/L3: Displays the RMS, THD, DF, and CF values of the phase-to-neutral voltage and of the current, the DC and
PST parameters of the phase-to-neutral voltage, and the DC value (if the current sensor allows) and KF of the current
for phase 1.
■ N: Displays the RMS voltage and current of the neutral, the DC component of the neutral voltage, and (if the current
sensor allows) the DC component of the neutral current.
Figure 4-33
Item Function
RMS
DC
THD
DF
CF
PST
KF
NOTE: L2 and L3 give information concerning simultaneous display of the current and of the voltage respectively for
phases 2 and 3.
True effective value of voltage or current
Direct component
Total harmonic distortion rate
Distortion factor
Peak factor calculated in relation to the displayed waveform
Short-term flicker (over 10 minutes)
K factor - Oversizing of transformer relative to harmonics
Power Quality Analyzer PowerPad® III Model 8435
59
Page 62

4.3.6 DISPLAY OF PHASOR DIAGRAM
This sub-menu displays the absolute values of the voltages and currents at the fundamental frequency, the phase
displacement of the voltages relative to the currents and the unbalances of the voltages and currents.
NOTE: The display screen varies depending on which value is selected.
■ 3U: Displays a vector representation of the fundamentals of the phase-to-phase voltages and of the currents. It
indicates their associated quantities (modulus and phase of the phase-to-phase voltage vectors) and the voltage
unbalance. The reference vector of the representation (at 3 o’clock) is U1.
■ 3V: Displays a vector representation of the fundamentals of the phase-to-neutral voltages and of the currents. It
indicates their associated quantities (modulus and phase of the phase-to-neutral voltage vectors) and the voltage
unbalance. The reference vector of the representation (at 3 o’clock) is V1.
■ 3A: Displays a vector representation of the fundamentals of the phase-to-neutral voltages and of the currents. It
indicates their associated quantities (modulus and phase of the current vectors) and the current unbalance. The
reference vector of the representation (at 3 o’clock) is A1.
■ L1/L2/L3: Displays a vector representation of the fundamentals of the phase-to-neutral voltages and the currents of
one phase. It indicates their associated quantities (modulus and phase of the current and phase-to-neutral voltage
vectors). The reference vector of the representation (at 3 o’clock) is the current vector.
Figure 4-34
Item Function
U1, U2, U3
V1, V2, V3
A1, A2, A3
φ
12
φ
23
φ
31
φ
VA
Unb
NOTE: L2 and L3 display vector representations of the fundamentals of the phase-to-neutral voltages and the currents of
phases 2 and 3, respectively. They indicate their associated quantities (modulus and phase of the current and phase-toneutral voltage vectors of phases 2 and 3, respectively). The reference vector of the representation (at 3 o’clock) is the
current vector (A2 and A3, respectively).
60
Absolute values of the voltages at fundamental frequency
Absolute values of the voltages at fundamental frequency
Absolute values of the current at fundamental frequency
Phase displacement of phase 1 relative to phase 2
Phase displacement of phase 2 relative to phase 3
Phase displacement of phase 3 relative to phase 1
Phase displacement of voltage (V) relative to current (A)
Unbalance of line voltages
Power Quality Analyzer PowerPad® III Model 8435
Page 63

4.4 ALARM MODE
This mode detects the type of alarm that you wish to monitor (Vah, Ah, Uh, Vh, Tan, PF, DPF, VA, VAR, W, Athd, Uthd,
Vthd, KF, Hz, Aunb, Vunb, Vrms, Acf, Ucf, Vcf, PST, Arms Urms and Vrms – see Appendix B: Glossary of Terms).
All alarms recorded can be downloaded to a PC with DataView® software (see § 5). Up to 10,000 alarms can be captured.
4.4.1 PROGRAMMING AN ALARM
1. Press the Alarm mode button . The Detection Schedule screen will appear.
Figure 4-35
Item Measurement Type
Configures alarms
Displays alarm log
Programs an alarm
Validates the programming of an alarm (after is selected, the icon appears)
Manually stops an alarm that is in progress
To program/display alarms, they must first be configured (see § 3.2.8)
2. With the start eld highlighted in yellow, press to enter the date and time.
3. Use the ▲ and ▼ buttons to increase or decrease the value. Use the ◄ and ► buttons to move to the next
parameter.
4. When completed, conrm the Start alarm schedule with .
5. Use the ▼ button to set the Stop alarm settings, then repeat the previous steps.
6. Highlight the Name eld, and use the ▲, ▼, ◄, and ► buttons to enter a name for the alarm detection campaign.
Power Quality Analyzer PowerPad® III Model 8435
61
Page 64

4.4.2 STARTING AN ALARM
1. Press the icon’s yellow button to launch the alarm campaign between the start and end times that you specied.
2. The icon disappears and the icon appears instead.
3. The Detection on standby message is displayed while awaiting start time and the icon blinks on the screen’s top
display bar.
4. The Detection running message is displayed when start time begins.
5. The Detection Schedule screen with the icon are displayed when the end time is reached. You can then program a
new alarm detection campaign.
4.4.3 MANUALLY STOPPING AN ALARM
An alarm can be manually stopped before the stop date and time by pressing the icon’s yellow button. The OK icon will
reappear in the same location.
4.4.4 DISPLAYING AN ALARM LOG
Press the icon’s yellow button to view the alarm log. The log can contain a maximum of 10,920 alarms.
NOTE: The type of connection selected in the configuration mode does not affect the possibilities of alarm filter choice
and monitored parameter. Users are responsible for these choices.
Item Function
1
Alarm date and time
2
Alarm filter
3
Monitored parameter (Vrms, etc.)
4
Amplitude (min or max)
5
Alarm duration
62
Figure 4-36
Power Quality Analyzer PowerPad® III Model 8435
Page 65

4.4.5 DELETING AN ALARM LOG
1. Press the icon’s yellow button.
2. Select the alarm to be deleted using the ▲ or ▼ button, then press the button to conrm deletion.
To leave this screen without deleting any alarm, press the button.
4.5 TREND MODE
4.5.1 PROGRAMMING AND STARTING A RECORDING
NOTE: The ON/OFF light will blink when the recording is in progress. When the recording is done, the ON/OFF light will turn off.
You will need to press it again to restart the instrument.
This mode enables all the parameters previously congured in the Conguration mode
1. Press the Trend mode button - .
Figure 4-37
2. Select the Conguration that was previously set-up (see § 3.2.7) by using the ▲ or ▼ button to highlight Set-up, then
press the button.
to be recorded (see § 3.2).
3. Use the ▲ or ▼ button to choose Conguration 1, 2, 3, or 4, then press .
4. Select the Start eld using the ▼ button. Press to select the date and time eld, then use the appropriate arrow
buttons to change the date and time. Press when nished.
5. Using the same method as steps 1, 2, and 3, use the arrow buttons and the button to change the values for Stop,
Period, and Name.
6. Press the icon’s yellow button to begin recording between your specied start and end times. The icon
disappears and the icon appears.
7. The Recording on Standby message is displayed and the icon blinks on the top display bar. Once the start time has
been reached, the Recording running message is displayed.
8. When the recording is nished, the Programming a recording screen will appear and the icon reappears.
Power Quality Analyzer PowerPad® III Model 8435
63
Page 66

4.5.2 MANUALLY STOPPING A RECORDING
An alarm can be manually stopped by pressing the icon’s yellow button. The icon will reappear in the same location.
4.5.3 DISPLAYING THE RECORDING LIST
Press the icon’s yellow button to view the recording list.
21 3 4
Figure 4-38
Item Function
1
Recording name
2
Memory usage
3
Recording start time
4
Recording end time
4.5.4 DELETING A RECORDING
1. Press the icon’s yellow button
2. Select the recording to be deleted using the ▲ or ▼ button, then press the button to conrm deletion.
To leave this screen without deleting any alarm, press the button.
4.6 POWER AND ENERGY MODE
This screen displays power and energy measurements. Note that the elds in this screen depend on which lter is
selected:
■ For 2- and 3-wire single-phase connections and for the 2-wire two-phase connection, only the lter selection L1 is
available. The lter is therefore not displayed; but the display is the same as for L1.
■ For the 3-wire three-phase connection, only the Σ lter selection is available. The lter is therefore not displayed, but
the display is the same as for Σ.
64
Power Quality Analyzer PowerPad® III Model 8435
Page 67

Figure 4-39
At the bottom of the Power and Energy screen are several buttons:
Item Function
W...
Power
PF...
Wh...
Power Factor (this button is only available for the 3L filter)
Energy Meters (this button is not available for the 3L filter)
Energy consumed (active, reactive, and apparent power) (this button is only available for the 3L filter)
Energy generated (active, reactive, and apparent power) (this button is only available for the 3L filter)
Each of these buttons displays a sub-screen containing power and energy values.
On the right side of the screen are a set of lters: 3L, L1, L2, L3, and Σ. Use the ▲ and ▼ buttons to choose the lter.
The values displayed on the Power and Energy screens are dependent on which of these lters is selected; dierent data
will appear for dierent lters. The following sections describe how these screens appear for the 3L, L1/L2/L3 (all three
display the same elds), and Σ lters.
4.6.1 3L FILTER
By default, the Power and Energy screen opens with the Powers screen displayed (see Figure 4-39). The values in this
screen are as follows:
Item Function
W
Active power
VAR
VAD
Reactive power
Distortion power. This value only appears when the Non-Active Values setting is set to Separated in the VAR tab of the Calculation
Methods screen. If this setting is set to Combined, the VAD value does not appear and the VAR label corresponds to the non-active
power (N). This non-active power is unsigned and has no inductive or capacitive effect.
VA
Apparent power
The screen also shows DC energy if a DC sensor is connected to the Model 8435.
Power Quality Analyzer PowerPad® III Model 8435
65
Page 68

4.6.1.1 3L POWER FACTOR
The PF (Power Factor) screen displays the quantities associated with powers.
Figure 4-40
The values in this screen are as follows:
Item Function
PF
Power factor
cos F
tan F
F VA
Fundamental power factor (also called DPF - displacement factor)
Phase shift of the voltage with respect to current
Phase shift of phase-to-neutral voltage with respect to current
4.6.1.2 3L ENERGY CONSUMED
The Energy Consumed screen displays the meters of energy consumed by the load.
Figure 4-41
66
Power Quality Analyzer PowerPad® III Model 8435
Page 69

The values in this screen are as follows:
Item Function
Wh
Active energy consumed
VARh
VADh
VAh
Reactive energy consumed
Distortion energy. This value only appears when the Non-Active Values setting is set to Separated in the VAR tab of the Calculation
Methods screen. If this setting is set to Combined, the VADh value does not appear and the VARh label corresponds to the non-active
power (N). This non-active power is unsigned and has no inductive or capacitive effect.
Apparent energy consumed
Inductive reactive effect
Capacitive reactive effect
The screen also shows DC energy if a DC sensor is connected to the Model 8435.
4.6.1.3 3L ENERGY GENERATED
The Energy Generated screen displays the meters of the energy generated by the load.
Figure 4-42
The values in this screen are as follows:
Item Function
Wh
Active energy generated
VARh
VADh
VAh
The screen also shows DC energy if a DC sensor is connected to the Model 8435.
Power Quality Analyzer PowerPad® III Model 8435
Reactive energy generated
Distortion energy. This value only appears when the Non-Active Values setting is set to Separated in the VAR tab of the Calculation
Methods screen. If this setting is set to Combined, the VADh value does not appear and the VARh label corresponds to the non-active
power (N). This non-active power is unsigned and has no inductive or capacitive effect.
Apparent energy consumed
Inductive reactive effect
Capacitive reactive effect
67
Page 70

4.6.2 L1, L2, AND L3 FILTERS
The screens that appear when the L1, L2, or L3 lter is selected all display the same variables. When any of these lters
is selected, the Powers screen appears as shown in Figure 4-43:
Figure 4-43
The values in this screen are as follows:
Item Function
W
Active power
VAR
Reactive power
Distortion power. This value only appears when the Non-Active Values setting is set to Separated in the VAR tab of the Calculation
VAD
Methods screen. If this setting is set to Combined, the VAD value does not appear and the VAR label corresponds to the non-active
power (N). This non-active power is unsigned and has no inductive or capacitive effect.
VA
Apparent power
PF
Power factor
cos F
tan F
F VA
Fundamental power factor (also called DPF - displacement factor)
Tangent of the phase shift
Phase shift of voltage with respect to current (Φ is displayed for the 2-wire two-phase set-up.
The screen also shows DC energy if a DC sensor is connected to the Model 8435.
F UA is displayed for the 2-wire 2-phase set-up.
68
Power Quality Analyzer PowerPad® III Model 8435
Page 71

4.6.2.1 L1, L2, L3 ENERGY METERS
The Wh... screen displays the energy meters.
The values in this screen are as follows:
Item Function
Meters of the energy consumed by the load
Meters of the energy generated by the load
Wh
Active energy
VARh
VADh
VAh
Reactive energy
Distortion energy. This value only appears when the Non-Active Values setting is set to Separated in the VAR tab of the Calculation
Methods screen. If this setting is set to Combined, the VADh value does not appear and the VARh label corresponds to the non-active
power (N). This non-active power is unsigned and has no inductive or capacitive effect.
Apparent energy consumed
Figure 4-44
Inductive reactive effect
Capacitive reactive effect
The screen also shows DC energy if a DC sensor is connected to the Model 8435.
Filters L2 and L3 display the same information for phases 2 and 3.
4.6.3 Σ FILTER
When the Σ lter is selected, the W... screen appears as shown in Figure 4-45:
Power Quality Analyzer PowerPad® III Model 8435
Figure 4-45
69
Page 72

The values in this screen are as follows:
Item Function
W
Active power
VAR
Reactive power
Distortion power. This value only appears when the Non-Active Values setting is set to Separated in the VAR tab of the Calculation
VAD
Methods screen. If this setting is set to Combined, the VAD value does not appear and the VAR label corresponds to the non-active
power (N). This non-active power is unsigned and has no inductive or capacitive effect.
VA
Apparent power
PF
Power factor
cos F
tan F
Fundamental power factor (also called DPF - displacement factor)
Tangent
The screen also shows DC energy if a DC sensor is connected to the Model 8435.
4.6.3.1 Σ ENERGY METERS
The Wh... screen displays the energy meters.
Figure 4-46
The values in this screen are as follows:
Item Function
Meters of the energy consumed by the load
Meters of the energy generated by the load
Wh
Active energy
VARh
VADh
VAh
The screen also shows DC energy if a DC sensor is connected to the Model 8435.
For the 3-Phase 3-Wiret set-up, only the display of total quantities is available; the method of calculation of the powers
used is the two-wattmeter method.
Filters L2 and L3 display the same information for phases 2 and 3.
70
Reactive energy
Distortion energy. This value only appears when the Non-Active Values setting is set to Separated in the VAR tab of the Calculation
Methods screen. If this setting is set to Combined, the VADh value does not appear and the VARh label corresponds to the non-active
power (N). This non-active power is unsigned and has no inductive or capacitive effect.
Apparent energy consumed
Inductive reactive effect
Capacitive reactive effect
Power Quality Analyzer PowerPad® III Model 8435
Page 73

4.6.4 STARTING AND STOPPING ENERGY MEASUREMENTS
To start a measurement:
1. Press the button while in an energy display ( , , or Wh...). The date and time at which the measuring
starts will appear in the upper left corner of the screen, and the icon on the screen blinks to indicate that energy
metering is in progress.
2. To stop the measurement, press the button. The date and time at which the measuring stops will appear in the
upper right corner of the screen. The icon is also replaced by the by icon.
3. To resume metering, press the button again.
NOTE: If no recording is in progress, disconnecting the energy metering results in the appearance of the blinking icon in the
status bar (in place of the icon).
4.6.5 RESETTING THE ENERGY MEASUREMENT
To reset the measurement, press the press the button to stop metering. Then press the button, and then to
conrm. All energy values (consumed and generated) are reset.
4.7 SNAPSHOT MODE
This button allows 50 snapshots to be saved for future recall and evaluation.
■ Press the button (for about 3s) to capture the current display.
■ The icon is displayed in the top left corner as soon as the operation is successful.
■ This icon is replaced by if there is no space left in the memory to record the display.
■ The snapshot will record all measurements present at the input of the meter when you press the button.
These screens can be downloaded to a computer using DataView
®
4.7.1 OPENING A PREVIOUSLY SAVED SNAPSHOT
■ A short press (about 1s) on the button gives access to the menu of snapshots that have been saved.
■ The small icon to the left of each snapshot (date and time) tells you what type of data was stored.
02/06/14
Power Quality Analyzer PowerPad® III Model 8435
Figure 4-47
71
Page 74

■ Use the ▲ or ▼ buttons to select the snapshot.
■ To display the snapshot, press the button, then the button.
■ After reviewing the snapshot, press the
button again to return to the list of saved snapshots.
The various storage spaces in the Model 8435 are of a fixed size and are completely independent. There are four memory
spaces available (alarms, snapshot, transients and recordings).
4.7.2 DELETING A SNAPSHOT
1. Press the icon’s yellow button.
2. Select the snapshot to be deleted using the ▲ or ▼ button, then press the button to conrm deletion.
To leave this screen without deleting any alarm, press the button.
4.8 HELP
Press this button to obtain help for the current display mode.
To exit the Help mode, press the button once again.
72
Power Quality Analyzer PowerPad® III Model 8435
Page 75

5. DATAVIEW® SOFTWARE
5.1 INSTALLING DATAVIEW
DO NOT CONNECT THE INSTRUMENT TO THE PC BEFORE INSTALLING THE SOFTWARE AND DRIVERS.
NOTE: When installing, the user must have Administrative access rights during the installation. The users access rights can be
changed after the installation is complete. DataView
®
®
must be reinstalled for each user in a multi-user system.
5.1.1 USB FLASH DRIVE INSTALL
1. Insert the USB stick into an available USB port (wait for driver to be installed).
2. If Autorun is enabled then an AutoPlay window should appear as shown.
Figure 5-1
NOTE: If Autorun is disabled, it will be necessary to open Windows Explorer, then locate and open the USB stick drive labeled
“DataView” to view the files on the drive.
3. In the AutoPlay window, select Open Folder to view Files.
4. Double-click on Setup.exe from the opened folder view to launch the DataView setup program.
NOTE: Depending on your operating system, the User Account Control dialog box may be displayed. Provide a positive
response when prompted to proceed.
5. A Set-up window, similar to the following, will appear.
Power Quality Analyzer PowerPad® III Model 8435
73
Page 76

Figure 5-2
There are several dierent options to choose from. Some options(*) require an internet connection.
● DataView, Version x.xx.xxxx - Installs DataView® onto the PC.
● *Adobe Reader - Links to the Adobe® website to download the most recent version of Adobe® Reader to the
computer. Adobe® Reader is required for viewing PDF documents supplied with DataView®.
● *DataView Updates - Links to the online DataView® software updates to check for new software version
releases.
● *Firmware Upgrades - Links to the online rmware updates to check for new rmware version releases.
● Documents - Shows a list of instrument related documents that you can view. Adobe® Reader is required for
viewing PDF documents supplied with DataView®.
6. DataView, Version x.xx.xxxx option should be selected by default. Select the desired language and then click on
Install.
7. The Installation Wizard window will appear. Click Next.
8.
To proceed, accept the terms of the license agreement and click Next.
9. In the Customer Information window, enter a Name and Company, then click Next.
10.
In the Setup Type window that appears, select the Complete radio button option, then click Next.
11. In the Select Features window that appears, select Power & Quality Analyzers (and any other instrument control
panel(s) that you want to install). You can also deselect any Control Panel that you don’t need. Then click Next.
NOTE: The PDF-XChange option must be selected to be able to generate PDF reports from within DataView®.
74
Power Quality Analyzer PowerPad® III Model 8435
Page 77

Figure 5-3
12. In the Ready to Install the Program window, click on Install.
13. If the instrument selected for installation requires the use of a USB port, a warning box will appear, similar to Figure
5-4. Click OK.
Figure 5-4
NOTE: The installation of the drivers may take a few moments. Windows may even indicate that it is not responding, however
it is running. Please wait for it to finish.
14. When the drivers are nished installing, the Installation Successful dialog box will appear. Click on OK.
15. Next, the Installation Wizard Complete window will appear. Click on Finish.
16. A Question dialog box appears next. Click Yes to read the procedure for connecting the instrument to the USB port
on the computer.
NOTE: The Set-up window remains open. You may now select another option to download (e.g. Adobe® Reader), or close the
window.
17. Restart your computer, then connect the instrument to the USB port on the computer.
18. Once connected, the Found New Hardware dialog box will appear. Windows will complete the driver installation
process automatically.
The DataView folder, containing shortcuts for DataView® and each instrument control panel selected during the
installation process, has been added to your desktop.
NOTE: If you connected your instrument to the computer before installing the software and drivers, you may need to use the
Add/Remove Hardware utility to remove the instrument driver before repeating the process.
Power Quality Analyzer PowerPad® III Model 8435
75
Page 78

5.2 CONNECTING THE MODEL 8435 TO YOUR COMPUTER
The Model 8435 is supplied with a USB cable required for connecting the instrument to the computer.
To connect the instrument to your computer:
1. Connect the USB cable to the port on the front panel of the instrument.
2. Connect the other end of the USB cable to a USB port on your computer.
3. Turn the instrument on.
You are now ready to use the DataView® software with the Model 8435.
5.3 OPENING THE CONTROL PANEL
To open the PowerPad III Control Panel:
1.
Double-click the P
owerPad III icon in the DataView folder created during installation, located on the desktop.
2. The Connection window will appear (see Figure 5-5). Once the communication link is established, DataView® will
automatically identify the instrument that it is connected to.
Figure 5-5
3. Make sure the communications port displayed in the dialog box matches the instrument you plugged the USB cable
into. If the correct port is not selected, click on the drop-down menu to select it.
4. Click Next, then click Finish when DataView® indicates it has successfully connected to the instrument. The
PowerPad III Control Panel appears.
76
Power Quality Analyzer PowerPad® III Model 8435
Page 79

Figure 5-6
The Control Panel user interface consists of multiple components for displaying, modifying, saving, and navigating data
recorded on the Model 8435.
■ At the very top of the Control Panel is the title bar. The title bar displays the name of the application and the path to the
open data le (if any).
■ Below the Title bar is the menu bar. The menu bar contains six drop-down menus: File, Edit, View, Instrument, Tools,
and Help. Each command in these drop-down menus is associated with the menu name. For example, instrument
specic commands are listed under the Instrument menu.
■ Below the menu bar is the toolbar. The toolbar contains iconic representations of menu commands; each icon performs
the same function as its associated menu command when selected.
■ Below the toolbar and to the left is the navigation tree frame. The navigation tree operates much like Windows
Explorer does when exploring the folders on your computer. The selected entry in the navigation tree determines
what information is displayed in the data frame to the right. For example, selecting the My Open Sessions entry in
the navigation tree displays a list of the open sessions (if any) in the data frame. Other data shown in the data frame
includes data recorded from the instrument (recordings, photographs, alarms, transients, inrush), real-time data
currently being reported by the instrument (trend, waveform, harmonics. power, energy), campaigns, and DataView®
reports.
■ Below the navigation and data frames is the status bar. The status bar displays a single line of help information (to the
left) and instrument connection status (to the right).
Power Quality Analyzer PowerPad® III Model 8435
77
Page 80

5.4 CONFIGURING THE INSTRUMENT
The PowerPad III Control Panel also enables you to congure every aspect of the Model 8435. Each eld is identical to
the programmable features available from the instrument’s front panel itself. Several of the functions are congured by
typing the appropriate value in the eld provided. Others are congured by clicking on the appropriate radio button or icon.
To congure the instrument, select Instrument from the menu bar, then click Congure. This displays the Congure
Instrument dialog box.
Figure 5-7
The Congure Instrument dialog box consists of eight tabs: Setup, Sensors and Ratios, Instrument Display, Alarm
Conditions, Recordings, Transients, Inrush, and Schedule.
At the bottom of each of these tabs are a set of buttons that perform the following tasks:
■ Re-Read from Instrument: Reads the current conguration of the connected Model 8435.
■ Save to File: Saves the current conguration. This le will reside on the computer’s disk drive. Saving dierent
conguration setups can be useful for future functions and tests.
■ Load from File: Retrieves a saved le from the computer’s disk drive to be used in programming the Model 8435.
■ OK: Writes the current conguration to the instrument and closes the open dialog box.
■ Cancel: Exits the dialog box without writing the conguration to the instrument.
■ Apply: Programs the instrument using the current settings without closing the window.
■ Help: Opens the online Help.
5.4.1 SETUP
The Setup tab (shown in Figure 5-7) enables you to select the distribution system and associated parameters. This tab
includes the following selections:
■ Distribution System denes the hook-up to be tested. Options are 1-Phase (2 and 3 wire), 2-Phase (2, 3, and 4 wire),
and 3-Phase (3, 4, and 5 wire).
■ Transformer Factor K sets the q and e settings for the factor K (also called K-factor).
■ Nominal Frequency: 50 or 60Hz. This parameter determines the correction coecients used for calculating power
and energy.
78
Power Quality Analyzer PowerPad® III Model 8435
Page 81

■ Phase Harmonics Ratio: Options are Fundamental Value as reference (%f) and Total Value as reference (%r).
■ Long-Term Flicker: Options are Fixed Window and Sliding Window.
5.4.2 SENSORS AND RATIOS
The Sensors and Ratios tab denes the voltage ratios and current ratios (when available) so nal values can be adjusted,
recorded, and displayed with correct magnitudes. The ability to set the current probe ratio is dependent on the type of
probe used.
Figure 5-8
NOTE: For detailed instructions and descriptions for any feature in this and any other Control Panel dialog box, click on the Help
button (lower right-side of the dialog box).
5.4.3 INSTRUMENT DISPLAY
The Instrument Display tab allows you to customize the display (colors, clock, language and contrast) and specify energy
units to use.
Power Quality Analyzer PowerPad® III Model 8435
Figure 5-9
79
Page 82

5.4.4 ALARM CONDITIONS
The Alarm Conditions tab allows you to set up 40 alarm congurations.
Figure 5-10
■ Prev Page & Next Page: Move between the 3 pages of alarms with 16 alarms per page.
■ Data to Capture: The alarm will be triggered based on the value of the selected parameter. Choices include:
None: no alarm
A CF: current crest factor
A DC: DC current PF: power factor VΦ-Φ THDr: harmonic distortion
A Hf: current harmonic factor Plt: long-term severity VΦ-N CF: phase-to-neutral voltage
A rms: current root mean squared
A pk+: maximum peak value of the
current
A pk-: minimum peak value of the
current
A THDf: harmonic distortion of the
current with the RMS value of the
fundamental as reference
A THDr: harmonic distortion of the
current with the total RMS value
without DC as reference
Aunb (u2): unbalance in current VΦ-Φ CF: phase-to-phase
Hz: frequency VΦ-Φ rms: phase-to-phase voltage
root mean squared
P DC (W): Power (DC) VΦ-Φ THDf: harmonic distortion of
the phase-to-phase voltage with the
fundamental RMS value as reference
of the phase-to-phase voltage with
the total RMS value without DC as
reference
crest factor
Pst: short-term severity VΦ-N DC: DC phase-to-neutral
voltage
P (W): power VΦ-N Hf: phase-to-neutral voltage
harmonic factor
Q (var): voltage/ampere
reactive
S (VA): volt/ampere VΦ-N pk-: minimum phase-to-neutral
Tan Φ: Tangent of the phase
shift of the voltage with
respect to the current
voltage crest factor
VΦ-N pk+: maximum phase-toneutral voltage
voltage
VΦ-N rms: phase-to-neutral voltage
root mean squared
VΦ-N THDf: harmonic distortion of
the phase-to-neutral voltage with the
fundamental RMS value as reference
80
Power Quality Analyzer PowerPad® III Model 8435
Page 83

D (var): VΦ-Φ DC: DC phase-to phase
voltage
DPF (cos Φ): displacement factor VΦ-Φ Hf: phase-to-phase
voltage harmonic factor
FHL: harmonic loss factor VΦ-Φ pk+: maximum phase-
to-phase voltage
FK: factor K (K factor) VΦ-Φ pk-: minimum phase-to-
phase voltage
VΦ-N THDr: harmonic distortion of
the phase-to-neutral voltage with
the total RMS value without DC as
reference
VΦ-N unb (2): phase-to-neutral
voltage unbalance
VA Hf: Apparent power harmonic
factor
■ Phases: Options are 3L, N, and 4L.
■ < or >: Determines whether the alarm condiction is triggered when the measurement exceeds or falls below the
threshold alarm setting.
■ Threshold: The value that must be reached to start an alarm. For “>” alarms, the value or higher must be reached. For
“<” alarms, the value or lower must be reached. To the right of this setting is a button that displays a drop-down menu
from which you can select the appropriate unit of measurement.
■ Duration: The alarm will only be recorded if the duration of the parameter meeting the threshold criteria exceeds the
duration. The minimum alarm duration can be in minutes or seconds. In the case of Vrms, Urms, or Arms not using
neutral current, this setting can also be in hundredths of a second. For Vrms, Urms, and Arms, it can be useful to set a
duration of 0 seconds. In that case an event as short as a half cycle can be detected (8 milliseconds at 60Hz). For all
other parameters, the minimum duration that can be detected is 1 second.
■ Hysteresis: This value for alarms is set to prevent multiple recordings of an event that goes above the threshold and a
certain percentage below it at times.
Example: Alarm threshold is 100 Volts or higher, hysteresis is 1%. When the voltage goes up to 100V, the alarm condition starts. When
it goes back down to 99V, the alarm condition stops.
NOTE: You can congure alarms, recordings, Inrush, and transient searches while testing is in progress.
Power Quality Analyzer PowerPad® III Model 8435
81
Page 84

5.4.5 RECORDINGS
The Recordings tab shows the parameters for a recording session.
Figure 5-11
Four dierent congurations are available. More congurations can be saved by pressing Save to File and recalled later
by pressing Load From File.
1. Select the conguration to set up: 1, 2, 3, or 4.
2. Check the box for each parameter desired in the Data to Record section.
3. Congure the harmonic values to be recorded, if desired.
4. Choose an Aggregation Period for the recording, which sets how often the recording updates while it is running.
The Model 8435 loses its scheduled recording if it is powered off before the recording begins. If it is powered off during the
recording, a partial recording will usually still exist but with the first letter of its name changed to “@”. The start and end times
requested for the recording might be adjusted by the Model 8435 to be in even multiples of the averaging period. For instance,
if an integration period of 10 minutes was requested, and the start time was 9:03, the recording might not actually begin until
9:10.
82
Power Quality Analyzer PowerPad® III Model 8435
Page 85

5.4.6 TRANSIENTS
The Transients tab allows you to set up the criteria for capturing transients.
Figure 5-12
1. In the Threshold of Voltage Dierence section of the dialog box, select from the drop-down menu one of the
following options: 4L Same thresholds for all, 3L+N Same except N has its own threshold, or L1+l2+l3+N
Separate thresholds.
2. Based on the preceding selection, ll in appropriate values for L1, L2, L3, and N. (Some of these may be grayed out
and inactive, depending on the selected connection type.)
3. Select Maximum number of transients to nd. If previous transients are stored in the memory, the maximum
available will be reduced appropriately. The information is available on the screen.
4. In the Threshold of Current Dierence section of the dialog box, select the appropriate option in the drop-down
menu. Available options are the same as those in the Threshold of Voltage Dierence drop-down menu.
The conguration settings can be saved to a le by clicking the Save to File button and selecting a le name. A previously
saved conguration can be loaded by clicking the Load From File button. A present conguration in the instrument (if
connected) can be read by clicking Re-Read From Instrument.
Power Quality Analyzer PowerPad® III Model 8435
83
Page 86

5.4.7 INRUSH
The Inrush tab shows the dialog box used to congure the parameters for an Inrush search.
Figure 5-13
Inrush current is measured when the power is rst turned on. Depending on the type of load, the Inrush current may be
very high for some time when compared with steady state current later on. The parameters can be set up here.
■ Mode: Select RMS+ Peak (< ~1 min Capture) or RMS Only (<~10 min Capture).
■ Current Threshold: Type in the appropriate value, and select the units from the adjacent drop-down menu (mA, A, kA).
■ Hysterisis: Select the percentage from the drop-down menu (0, 1, 2, 5, 10, 20, 50, or 100).
■ Channel: Select the number for the the Inrush recording.
Click OK to write the congurations to the instrument and close the Conguration dialog box.
NOTE: For more information about configuring the Model 8435 from the PowerPad III Control Panel, consult the Help file within
the software.
84
Power Quality Analyzer PowerPad® III Model 8435
Page 87

5.5 REAL-TIME DATA
When your setup is completed, you can display dierent views on the screen of real-time data and waveforms.
5.5.1 TREND
Figure 5-14
This display shows a real-time trend of data from the Model 8435. The data is an average of waveforms downloaded to
the PC whose scale adjusts constantly to t all the data it has received.
5.5.2 WAVEFORM
Figure 5-15
You can select the type of data to display using the buttons at the top of the Waveform display. Stop the update with the
(Pause) button, and resume with the
Power Quality Analyzer PowerPad® III Model 8435
(Play) button.
85
Page 88

5.5.3 HARMONICS
Figure 5-16
This screen displays harmonic data up to the 50th harmonic for voltage or current for selected phase(s) of the available
channels or neutral (N). The voltage harmonics can be selected for phase-to-phase voltage or phase-to-neutral voltage or
neutral-to-ground voltage. The Harmonics is displayed as a % of the fundamental (%f) as default. Harmonics are displayed
as absolute voltage by pressing % button. Similarly, the current harmonics can be selected for each phase and neutral.
5.5.4 POWER
Figure 5-17
The Real-time Data Power window displays accumulated power data. The data can be started or stopped using the
(Pause) and
(Play) buttons, and the results can be downloaded to a database and viewed on the screen, selected
by phase.
86
Power Quality Analyzer PowerPad® III Model 8435
Page 89

The data for all available phases are downloaded to a database or spreadsheet, not just what is shown on the screen.
5.5.5 ENERGY
Figure 5-18
The Real-time Data Energy window resembles the Power window. The Energy window displays accumulated energy
data, and can be started or stopped; the results can be downloaded to a database and viewed on the screen, selected by
phase.
5.6 DOWNLOADING DATA
To download recorded data, select Instrument from the menu bar and click Download Recorded Data. The Control
Panel prompts you to conrm that you want to download all the data from the instrument. Click Yes to initiate the
download. The Download dialog box appears.
Figure 5-19
This dialog box lists the recorded sessions, photographs, alarms, transients, and Inrush data stored on the instrument.
The download progress is shown in the Status of download column. When downloading is complete, click Open to view
a list of recorded sessions. These appear under Recorded Sessions on the left side of the Control Panel display. Click on
the listed item to view its recorded data. You can format this data as a DataView® report by opening the File menu and
selecting Create DataView Report. You can also view the data as an Excel-compatible spreadsheet by selecting Export
to a Spreadsheet from the File menu.
Power Quality Analyzer PowerPad® III Model 8435
87
Page 90

From the Downloads dialog box you can delete les listed in the Downloads dialog box by using the buttons Clear (to
delete a selected session) or Clear List (to delete all sessions from the list). Note that this does not aect the les stored
on the Model 8435; any le deleted through the Downloads dialog box remains on the instrument and can be downloaded
at a future time.
5.6.1 RECORDINGS
Recordings in the navigation frame on the left side of the Control Panel lists all recordings downloaded from the Model
8435. A recording can be downloaded to a database on the PC by selecting it and clicking Save or Save As from the File
menu. This saves the session as an .icp le within DataView®. This le can later be opened by selecting File from the
menu bar and clicking Open; this displays a dialog box for locating the le to be opened.
5.6.2 PHOTOGRAPHS
Photographs in the navigation frame displays a list of photographs (snapshots), with the date and time, taken when the
camera button was pressed.
Clicking on a recorded snapshot shows the data at the time the camera button was pressed.
Snapshots can only be initiated using the camera button on the Model 8435 itself, not by DataView®.
5.6.3 ALARMS
Clicking Alarms in the navigation frame displays a list of alarms that were recorded on the Model 8435. Details on the
alarm search are available by clicking on the desired alarm set, which opens up an alarm window with the searches
details. Alarm search data can be selected and downloaded to a spreadsheet or a DataView® report by opening the File
menu and selecting the appropriate commands.
5.6.4 TRANSIENTS
The Transients tab displays transients stored on the Model 8435. It shows the number and name of the recording, and
the time it began and ended. The selected transient(s) can either be downloaded or deleted.
The downloaded data contains many waveforms. Use the navigational buttons in the toolbar (such as zoom in
zoom out
) to view details in the data. These buttons are available in every graph from recorded data.
and
5.6.5 INRUSH
The Inrush tab displays recorded Inrush data that is stored on the Model 8435. Buttons at the top of the data frame are
arranged in three rows. The top row selects the measurement group that can be displayed. The buttons in the second row
vary based on the selected group and selects which channels in the selected group to display. The third row of buttons
selects how the data should be displayed (trend, tabular, bar chart, and so on).
88
Power Quality Analyzer PowerPad® III Model 8435
Page 91

5.6.6 EDITING DOWNLOADED DATA
The Control Panel enables you to augment downloaded data with additional information about the recording session,
such as operator and site. To do this, highlight the downloaded recording, alarm, transient, or Inrush result listed under
Recorded Sessions. Then open the Edit menu and click Edit Address Book. The Session Properties dialog box appears.
Figure 5-20
The Session Properties dialog box allows you to specify the Operator, Site, and Custom parameters that are to be
saved with recorded data. These parameters are used when generating reports. The Operator and Site tabs allow you to
maintain lists of operators and sites, saving you time when specifying parameters for reports. On the left of the Operator
and Site tabs is the list of previously dened operators and sites. On the right of the Operator and Site tabs is a set of
individual parameters that will be saved in an associated database. Only a single set of operator and site elds are saved
in the recording database.
The Custom tab contains a list of user dened parameters. Along side each user dened parameter is a check box. Items
that are checked will be added to an associated database. Only a single set of custom parameters can be maintained
(unlike the Operator and Site lists). The Custom tab allows you to specify any user dened parameters (in addition to the
comments eld of the Site tab) that are to be used in displaying a report.
Power Quality Analyzer PowerPad® III Model 8435
89
Page 92

6. SPECIFICATIONS
6.1 REFERENCE CONDITIONS
Parameter Reference Conditions
Ambient temperature 73°F ± 5°F (23°C ± 3°C)
Humidity (relative humidity) [45%; 75%]
Atmospheric pressure [860 hPa; 1060 hPa]
Phase-to-neutral voltage [50Vrms; 1000Vrms] without DC (< 0.5%)
Standard current circuit input
voltage
®
(except AmpFlex
& MiniFlex®)
Rogowski current circuit input
voltage
®
(Only AmpFlex
& MiniFlex®)
Frequency of electrical network 50/60Hz ± 0.1Hz
Phase shift
Harmonics < 0.1%
Voltage unbalance < 10%
Voltage ratio 1 (unity)
Current ratio 1 (unity)
Power supply Battery only
Electric field < 1 V.m-1
Magnetic field < 40 A.m-1
[30mVrms; 1Vrms] without DC (< 0.5%)
*Anom ⇔ 1Vrms
3 × *Anom ÷ 100 ó 30mVrms
[11.73mVrms; 391mVrms] without DC (< 0.5%)
10kArms ⇔ 391mVrms to 50Hz
300Arms ⇔ 11.73mVrms to 50Hz
0° (active power and energy)
90° (reactive power and energy)
NOTE: The symbol “U” will be used throughout this manual and in the instrument to refer to phase-to-phase voltage measurement.
The symbol “V” will be used for phase-to-neutral voltage measurement.
*The values of Anom are provided in the next table.
Current Sensor
(excluding AmpFlex® & MiniFlex®)
SR clamp 1000
MR clamp 1000
MN93 clamp 200
SL261 clamp (10mV/A) 100
SL261 clamp (100mV/A) 10
MN193 clamp (100A) 100
MN193 clamp (5A) 5
5A adapter 5
Nominal RMS current
(Anom) [A]
90
Power Quality Analyzer PowerPad® III Model 8435
Page 93

6.2 ELECTRICAL SPECIFICATIONS
Sampling Frequency (256 samples per cycle):
12.8kHz samples/sec per channel @ 50Hz
15.36kHz samples/sec per channel @ 60Hz
Waveforms: Displays voltages and currents
Screen Captures: 50 max
Transients: Detection and recording of transients (up to 210)
Inrush Current: Detection and recording of Inrush current (1 max)
Memory: SD Card memory for trend data; additional internal Flash memory for up to 50 screen snapshots, 210
captured transients, and 10,000 alarm events from up to 40 dierent parameters
Alarm Function: 10,000 alarms max
6.2.1 VOLTAGE INPUTS
Range for use: 0 to 1000Vrms AC+DC phase-to-neutral and neutral-to-earth
0 to 2000Vrms AC+DC phase-to-phase
(on condition of compliance with 1000Vrms with respect to earth in CAT III)
Input Impedance: 969kW (between phase and neutral and neutral and earth)
Admissible Overload:
1200Vrms constant
2000Vrms for one second
6.2.2 CURRENT INPUTS
Operating Range: 0 to 1V
Input Impedance:
1MW for current probe circuit
12.4kW for AmpFlex® and MiniFlex® circuit
Overload: 1.7V
6.2.3 ACCURACY SPECIFICATIONS (EXCLUDING CURRENT PROBES)
RMS
Voltage
Direct
Voltage
(6)
(DC)
Measurement
Frequency
Simple
(5)
Compound
Simple
Compound
Measurement range without ratio
(with unity ratio)
Min Max
40Hz 70Hz 0.01Hz ±(0.01Hz)
1V 1200V
1V 2400V
1V 1697V
1V 3394V
(1)
(2)
(3)
(4)
Resolution
(with unity ratio)
V < 1000V
1 V
V ≥ 1000V
U < 1000V
U ≥ 1000V
V < 1000V
V ≥ 1000V
U < 1000V
U ≥ 1000V
0.1V
0.1V
1V
0.1V
1V
0.1V
1V
Accuracy
±(0.5% + 0.2V)
±(0.5% + 1V)
±(0.5% + 0.2V)
±(0.5% + 1V)
±(1% + 0.5V)
±(1% + 1V)
±(1% + 0.5V)
±(1% + 1V)
Power Quality Analyzer PowerPad® III Model 8435
91
Page 94

Measurement
Measurement range without ratio
(with unity ratio)
Min Max
Resolution
(with unity ratio)
0.1A
SR clamp
MR clamp
1A 1200A
A < 1000A
1 A
A ≥ 1000A
MN93 clamp
0.2A 240A 0.1A ±(0.5% + 0.2A)
0.01A
SL261 clamp (10mV/A)
MN193 clamp (100A)
0.1A 120A
A < 100A
0.1A
A ≥ 100A
0.001A
RMS
Current
SL261 clamp (100mV/A)
(5)
MN193 clamp (5A)
or 5A adapter
®
AmpFlex
MiniFlex
(6500A)
®
0.01A 12A
0.005A 6A 0.001A ±(0.5% + 0.002A)
10A 6500A
A < 10A
0.01A
A ≥ 10A
0.1A
A < 1000A
1A
A ≥ 1000A
AmpFlex
MiniFlex
(10kA)
®
®
10A 10kA
1A
A < 10kA
10A
A ≥ 10kA
0.1A
MR clamp
1A 1200A
(4)
A < 1000A
1A
A ≥ 1000A
Direct
Current
(6)
(DC)
SL261 clamp
(10mV/A)
0.1A 169.7A
(3)
0.01A
A < 100A
0.1A
A ≥ 100A
0.001A
SL261 clamp
(100mV/A)
0.01A 16.97A
(3)
A < 10A
0.01A
A ≥ 10A
Peak factor (PF)
(1) In 1000Vrms, CAT III, provided that the voltage between each of the terminals and the ground/earth does not exceed 1000Vrms
(2) 2-Phase (opposite phases) – same note as (1)
((3) 1200 x √2 ≈ 1697; 2400 x √2 ≈ 3394; 120 x √2 ≈ 169.7; 12 x √2 ≈ 16.97
(4) Limitation of the SR clamp
(5) Total RMS value and RMS value of the fundamental
(6) DC harmonic component (n= 0)
1 9.99 0.01
Accuracy
±(0.5% + 0.2A)
±(0.5% + 1A)
±(0.5% + 0.02A)
±(0.5% + 0.1A)
±(0.5% + 0.002A)
±(0.5% + 0.01A)
±(0.5% + 1A)
±(0.5% + 1A)
±(1% + 1A)
±(1% + 0.1A)
±(1% + 0.01A)
±(1% + 2ct)
CF < 4
±(5% + 2ct)
CF ≥ 4
92
Power Quality Analyzer PowerPad® III Model 8435
Page 95

RMS ½
Voltage
Peak
Voltage
RMS ½
Current
Measurement
Simple
Compound
Simple
Compound
SR clamp
MR clamp
MN93 clamp
SL261 clamp (10mV/A)
MN193 clamp (100A)
or 5A adapter
SL261 clamp
(100mV/A)
MN193 clamp (5A)
or 5A adapter
AmpFlex®
MiniFlex
(6500A)
®
AmpFlex®
MiniFlex
(10kA)
®
Measurement range without ratio
(with unity ratio)
Resolution
(with unity ratio)
Accuracy
Min Max
0.1V
1V 1200V
(1)
V < 1000V
1V
±(0.8% + 1V)
V ≥ 1000V
0.1V
1V 2400V
(2)
U < 1000V
1V
±(0.8% + 1V)
U ≥ 1000V
0.1V
1V 1697V
(3)
V < 1000V
1V
±(1% + 1V)
V ≥ 1000V
0.1V
1V 3394V
(3)
U < 1000V
1V
±(1% + 1V)
U ≥ 1000V
0.1A
1A 1200A
A < 1000A
1A
±(1% + 1A)
A ≥ 1000A
0.2A 240A 0.1A ±(1% + 1A)
0.01A
0.1A 120A
A < 100A
0.1A
±(1% + 0.1A)
A ≥ 100A
0.001A
0.01A 12A
A < 10A
0.01A
±(1% + 0.01A)
A ≥ 10A
0.005A 6A 0.001A ±(1% + 0.01A)
0.1A
10A 6500A
A < 1000A
1A
±(1.5% + 5A)
A ≥ 1000A
1A
10A 10kA
A < 10kA
10A
±(1.5% + 5A)
A ≥ 10kA
Power Quality Analyzer PowerPad® III Model 8435
93
Page 96

Measurement range without ratio
Measurement
(with unity ratio)
Resolution
(with unity ratio)
Min Max
1A
SR clamp
MR clamp
1A 1697A
(3)
A < 1000A
1A
A ≥ 1000A
MN93 clamp
0.2A 339.4A
(3)
0.1A ±(1% + 1A)
0.01A
SL261 clamp (10mV/A)
MN193 clamp (100A)
0.1A 169.7A
(3)
A < 100A
0.1A
A ≥ 100A
0.001A
Peak
Current
SL261 clamp
(100mV/A)
MN193 clamp (5A)
or 5A adapter
®
AmpFlex
MiniFlex
(6500A)
®
0.01A 16.97A
0.005A 8.485A
10A 9192A
(3)
(3)
(3)
A < 10A
0.01A
A ≥ 10A
0.001A ±(1% + 0.01A)
0.1A
A < 1000A
1A
A ≥ 1000A
1A
AmpFlex®
MiniFlex
(10kA)
®
10A 14,140A
(3)
A < 10kA
10A
A ≥ 10kA
Severity of Flicker (Pst)
(1) In 1000Vrms, CAT III, provided that the voltage between each of the terminals and the ground/earth does not exceed 1000Vrms
(2) 2-phase (opposite phases) – same note as (1)
(3) 1200 x √2 ≈ 1697; 2400 x √2 ≈ 3394; 240 x √2 ≈ 339,4; 120 x √2 ≈ 169,7; 12 x √2 ≈ 16,97; 6 x √2 ≈8,485; 6500 x √2 ≈ 9192; 10,000 x √2 ≈ 14,140
0 12 0.01
Accuracy
±(1% + 1A)
±(1% + 0.1A)
±(1% + 0.01A)
±(1.5% + 5A)
±(1.5% + 5A)
See the
corresponding table
Active
Power
Reactive
Power
94
Measurement
Excluding
AmpFlex®
MiniFlex
(1)
AmpFlex
MiniFlex
Excluding
AmpFlex®
MiniFlex
(2)
AmpFlex
MiniFlex
Measurement range without ratio
(with unity ratio)
Min Max
Resolution
(with unity ratio)
Accuracy
±(1%)
cos F ≥ 0.8
®
(3)
5mW
®
®
10MW
(4)
4 digits at most
(5)
±(1.5% + 10ct)
0.2 ≤ cos F < 0.8
±(1%)
cos F ≥ 0.8
±(1.5% + 10ct)
0.5 ≤ cos F < 0.8
±(1%)
sin F ≥ 0.5
®
(3)
5mVAR
®
®
10MVAR
(4)
4 digits at most
(5)
±(1.5% + 10ct)
0.2 ≤ sin F < 0.5
±(1.5%)
sin F ≥ 0.5
±(2.5% + 20ct)
0.2 ≤ sin F < 0.5
Power Quality Analyzer PowerPad® III Model 8435
Page 97

Apparent Power
Peak Factor (PF)
(3)
5mVA
-1 1 0.001
10MVA
(4)
4 digits at most
(5)
Excluding
AmpFlex®
®
1mWh 9,999,999MWh
®
(6)
7 digits at most
(5)
Active
Energy
MiniFlex
(1)
AmpFlex®
MiniFlex
Excluding
AmpFlex®
®
1mVARh 9,999,999MVARh
(6)
7 digits at most
(5)
Reactive
energy
MiniFlex
(2)
AmpFlex®
MiniFlex
Apparent energy
(1) The stated uncertainties on the active power and energy measurements are max for |cos F| = 1 and typical for the other phase differences.
(2) The stated uncertainties on the reactive power and energy measurements are max for |sin F| = 1 and typical for the other phase shifts.
(3) With MN193 clamp (5A) or 5A adapter.
(4) With AmpFlex® or MiniFlex®.
(5) The resolution depends on the current sensor used and on the value to be displayed.
(6) The energy is equivalent to more than 146 years of the associated maximum power (unity ratios).
®
1mVAh 9,999,999MVAh
(6)
7 digits at most
(5)
±(1%)
±(1.5%)
cos F ≥ 0.5
±(1.5% + 10 ct)
0.2 ≤ cos F < 0.8
±(1%)
cos F ≥ 0.8
±(1.5%)
0.2 ≤ cos F < 0.8
±(1%)
cos F ≥ 0.8
±(1.5%)
0.5 ≤ cos F < 0.8
±(1%)
sin F ≥ 0.5
±(1.5%)
0.2 ≤ sin F < 0.5
±(1.5%)
sin F ≥ 0.5
±(2%)
0.2 ≤ sin F < 0.5
±(1%)
Measurement
Phase differences of
fundamentals
cos F (DPF)
tan F
Unbalance (UNB)
(1) |tan F| = 32,767 corresponds to F = ±88.25° + k × 180° (k being a natural number)
Measurement Range
Min Max
-179° 180° 1° ±(2°)
-1 1 0.001
(1)
-32.77
0% 100% 0.1% ±(1%)
32.77
Resolution Accuracy
±(1°) for F
±(5ct) for DPF
0.001
(1)
tan F < 10
0.01
±(1°) for F
tan F ≥ 10
Power Quality Analyzer PowerPad® III Model 8435
95
Page 98

Measurement
Voltage Harmonic Ratio (t)
Current Harmonic Ratio (t)
(excluding AmpFlex® & MiniFlex®)
Current Harmonic Ratio (t)
(AmpFlex® & MiniFlex®)
Total Voltage Harmonic Distortion THD
(THD-F)
Measurement Range
Min Max
0% 1600%
0% 1600%
0% 1600%
0% 999.9% 0.1% ±(2.5% + 5ct)
Total current
harmonic distortion
THD (THD-F)
0% 999.9% 0.1%
(excluding AmpFlex® & MiniFlex®)
Total current
harmonic distortion
THD (THD-F)
0% 999.9% 0.1%
(AmpFlex® & MiniFlex®)
Voltage distortion factor
DF (THD-R)
0% 100% 0.1% ±(2.5% + 5ct)
Current distortion factor
DF (THD-R)
0% 100% 0.1%
(excluding AmpFlex® & MiniFlex®)
Current distortion factor
DF (THD-R)
0% 100% 0.1%
(AmpFlex® & MiniFlex®)
K factor (KF)
Phase shifts of harmonics (order n ≥ 2)
N.B. nmax is the highest order for which the harmonic ratio is non-zero.
-179° 180° 1° ±(1.5° + 1° × (n ÷ 12.5))
Resolution Accuracy
0.1%
t < 999.9%
1%
t ≥ 1000%
0.1%
t < 999.9%
1%
t ≥ 1000%
0.1%
t < 999.9%
1%
t ≥ 1000%
1 99.99 0.01
±(2.5 % + 5ct)
±(2% + (n × 0.2%) + 5ct)
n ≤ 25
±(2% + (n × 0.5%) + 5ct)
n > 25
±(2% + (n × 0.3%) + 5ct)
n ≤ 25
±(2% + (n × 0.6%) + 5ct)
n > 25
±(2.5% + 5ct)
si ∀ n ≥ 1. tn ≤ (100 ÷ n) [%]
or
±(2% + (nmax × 0.2%) + 5ct)
nmax ≤ 25
±(2% + (nmax × 0.5%) + 5ct)
nmax > 25
±(2.5% + 5ct)
si ∀ n ≥ 1. tn ≤ (100 ÷ n2) [%]
or
±(2% + (nmax × 0.3%) + 5ct)
nmax ≤ 25
±(2% + (nmax × 0.6%) + 5ct)
nmax > 25
±(2.5% + 5ct)
si ∀ n ≥ 1. tn ≤ (100 ÷ n) [%]
or
±(2% + (nmax × 0.2%) + 5ct)
nmax ≤ 25
±(2% + (nmax × 0.5%) + 5ct)
nmax > 25
±(2.5% + 5ct)
si ∀ n ≥ 1. tn ≤ (100 ÷ n2) [%]
or
±(2% + (nmax × 0.3%) + 5ct)
nmax ≤ 25
±(2% + (nmax × 0.6%) + 5ct)
nmax > 25
±(5% + (nmax × 0.3%) + 5ct)
nmax ≤ 25
±(10% + (nmax × 0.6%) + 5ct)
nmax > 25
96
Power Quality Analyzer PowerPad® III Model 8435
Page 99

Measurement range
Measurement
(with unity ratio)
Minimum Maximum
Display resolution
(with unity ratio)
100 mV
V < 1000V
1V
V ≥ 1000V
100 mV
U < 1000V
1V
RMS
Harmonic
Voltage
(order n
≥ 2)
Simple
Compound
2V 1000V (1)
2V 2000V (2)
U ≥ 1000V
100mA
SR193 clamp
MR193 clamp
1A 1200A
A < 1000A
1A
A ≥ 1000A
MN93 clamp
0.2mA 240A 0.1A
0.01A
SL261 clamp (10mV/A)
MN93A clamp (100A)
0.1A 120A
A < 100A
0.1A
A ≥ 100A
RMS
Harmonic
Current
(order n
≥ 2)
SL261 clamp (100mV/A)
MN193 clamp (5A)
or 5A adapter
0.01A 12A
0.005A 6A 0.001A
0.001A
A < 10A
0.01A
A ≥ 10A
1A
AmpFlex®
MiniFlex
(6500A)
®
10A 10kA
A < 10kA
10A
A ≥ 10kA*
1A
AmpFlex®
MiniFlex
(10kA)
®
10A 10kA
A < 10kA
10A
A ≥ 10kA*
(1) In 1000Vrms, CAT III, provided that the voltage between each of the terminals and earth does not exceed 1000Vrms.
(2) 2-Phase (opposite phases) – same note as (1).
(3) RMS value of the fundamental.
Maximum intrinsic accuracy
±(2.5% + 1V)
±(2.5% + 1V)
±(2% + (n x 0.2%) + 1A)
n ≤ 25
±(2% + (n x 0.5%) + 1A)
n > 25
±(2% + (n x 0.2%) + 1A)
n ≤ 25
±(2% + (n x 0.5%) + 1A)
n > 25
±(2% + (n x 0.2%) + 100mA)
n ≤ 25
±(2% + (n x 0.5%) + 100mA)
n > 25
±(2% + (n x 0.2%) + 10mA)
n ≤ 25
±(2% + (n x 0.5%) + 10mA)
n > 25
±(2% + (n x 0.2%) + 10mA)
n ≤ 25
±(2% + (n x 0.5%) + 10mA)
n > 25
±(2% + (n x 0.3%) + 1A + (Afrms
(3)
x 0.1%))
n ≤ 25
±(2% + (n x 0.6%) + 1A + (Afrms(3) x 0.1%))
n > 25
±(2% + (n x 0.2%) + 30cts)
n ≤ 25
±(2% + (n x 0.5%) + 30cts)
n > 25
Power Quality Analyzer PowerPad® III Model 8435
97
Page 100

Max intrinsic error of the flicker severity measurement (Pst)
Rectangular
variations
per minute
120V lamp
60Hz network
(50% duty cycle)
2
7
39
110
1620
Pst ∈ [1;4] ± 5% Pst ∈ [1;4] ± 5%
Pst ∈ [1;7] ± 5% Pst ∈ [1;4] ± 5%
Pst ∈ [1;12] ± 5% Pst ∈ [1;10] ± 5%
Pst ∈ [1;12] ± 5% Pst ∈ [1;10] ± 5%
Pst ∈ [1;12] ± 15% Pst ∈ [1;10] ± 15%
Ratio Minimum Maximum
Voltage
Current
(1) Only for the MN193 clamp (5 A) and the 5A adapter.
(1)
100
1000 x √3
1 60,000 / 1
Measurement Range
Measurement
Minimum
with minimum ratio(s)
RMS
Simple
58mV 207.8GV
&
RMS ½
Compound
58mV 415.7GV
Voltage
Direct
Voltage
Simple
58mV 293.9GV
(DC) &
Peak
Compound
58mV 587.9GV
Voltage
RMS & RMS ½ Current
Peak Current
Active Power
Reactive Power
Apparent Power
Active Energy
Reactive Energy
Apparent Energy
(1) The energy corresponds to more than 15,000 years of the associated maximum power (max ratios).
5mA 360.0kA
5mA 509.1kA
0.289mW 74.82PW
0.289mVAR 74.82PVAR
0.289mVA 74.82PVA
1mWh 9,999,999EWh
1mVARh 9,999,999EVARh
1mVAh 9,999,999EVAh
230V lamp
50Hz network
9,999,900 x √3
0.1
Maximum
with maximum ratio(s)
(1)
(1)
(1)
98
Power Quality Analyzer PowerPad® III Model 8435
 Loading...