

Page 1
Understanding Power &
AC
Power Quality Measurements
is the actual transformer voltage. This
system is frequently used for power
loads in commercial and industrial
buildings. In such cases, service to the
premises is made at 208V, three-phase.
Feeders carry the power to panel
boards supplying branch circuits for
motor loads. Lighting loads are usually
handled by a separate single-phase
service. The 480V distribution
is often used in industrial buildings
with substantial motor loads.
ACB
A
The threatened limitations of
conventional electrical power sources
have focused a great deal of attention
on power, its application, monitoring
and correction. Power economics
now play a critical role in industry as
never before. With the high cost of
power generation, transmission, and
distribution, it is of paramount concern to
effectively monitor and control the
use of energy.
The electric utility’s primary goal is
to meet the power demand of its
customers at all times and under
all conditions. But as the electrical
demand grows in size and complexity,
modifications and additions to existing
electric power networks have become
increasingly expensive. The measuring
and monitoring of electric power have
become even more critical because of
down time associated with equipment
breakdown and material failures.
For economic reasons, electric power
is generated by utility companies at
relatively high voltages (4160, 6900,
13,800 volts are typical). These
high voltages are then reduced at
the consumption site by step-down
transformers to lower values which may
be safely and more easily used
in commercial, industrial and residential
applications.
Personnel and property safety are
the most important factors in the
operation of electrical system operation.
Reliability is the first consideration
in providing safety. The reliability of
any electrical system depends upon
knowledge, preventive maintenance
and subsequently the test equipment
used to monitor that system.
Typical Voltage Configurations
Single-Phase Systems
Single-phase residential loads are
almost universally supplied through
120/240V, 3-wire, single-phase services.
Large appliances such as ranges,
water heaters, and clothes dryers
are supplied at 240V. Lighting, small
appliances, and outlet receptacles
are supplied at 120V. In this system the
two “hot” or current carrying conductors
are 180° out-of-phase
with respect to the neutral.
A
0
B
LINE (HOT)
NEUTRAL
LINE (HOT)
Figure 1. 1Ø System
Three-Phase, 3-Wire Systems
In this type of system, commonly known
as the “DELTA” configuration, the
voltage between each pair of line wires
t
B
C
Figure 2. 3Ø, 3-wire system
Three-Phase, 4-Wire Systems
Known as the “WYE” type connection,
this is the system most commonly used
in commercial and industrial buildings.
In office or other commercial buildings,
the 480V three-phase,
4-wire feeders are carried to each floor,
where 480V three-phase is tapped to
a power panel or motors. General area
fluorescent lighting that uses 277V
ballasts is connected between each leg
and neutral; 208Y/ 120 three-phase,
4-wire circuits are derived from stepdown transformers for local lighting and
receptacle outlets.
Typical voltage:
phase-to-phase = 208/480V
phase-to-neutral = 120/277V
B
A
Neutral
B
C
Figure 3. 3Ø, 4-Wire System
Understanding Power & Power Quality Instruments (pdf) 05/09
Technical Assistance (800) 343-1391 www.aemc.com 1 of 8
Page 2
Balanced vs. Unbalanced Loads
A balanced load is an AC power
system using more than two wires,
where the current flow is equal in each
of the current carrying conductors.
Many systems today represent an
unbalanced condition due to uneven
loading on a particular phase. This
often occurs when electrical expansion
is affected with little regard to even
distribution of loads between phases or
several nonlinear loads on the
same system.
RMS vs. Average Sensing
The term RMS (root-mean-square)
is used in relation to alternating
current waveforms and simply means
“equivalent” or “effective,” referring
to the amount of work done by the
equivalent value of direct current (DC).
The term RMS is necessary to describe
the value of alternating current, which
is constantly changing in amplitude
and polarity at regular intervals. RMS
measurements provide a more accurate
representation of actual current or
voltage values. This is very important
for nonlinear (distorted) waveforms.
Until recently, most loads were “linear”;
that is, the load impedance remained
essentially constant regardless of
the applied voltage. With expanding
markets of computers, uninterruptible
power supplies, and variable speed
motor drives, resulting nonlinear
waveforms are drastically different.
Measuring nonsinusoidal voltage and
current waveforms requires a True
RMS meter. Conventional meters
usually measure the average value of
amplitudes of a waveform. Some meters
are calibrated to read the equivalent
RMS value (.707 x peak); this type
calibration is a true representation only
when the waveform is a pure sine wave
(i.e., no distortion). When distortion
occurs, the relationship between
average readings and True RMS values
changes drastically. Only a meter which
measures True RMS values gives
accurate readings for a nonsinusoidal
waveform. RMS measuring circuits
sample the input signal at a high
rate of speed. The meter’s internal
circuitry digitizes and squares each
sample, adds it to the previous samples
squared, and takes the square root of
the total. This is the True RMS value.
V
÷
Ø
I
Figure 4. Nonlinear current waveform
Demand
The amount of electrical energy
consumed over time is known as
demand. Demand is the average load
placed on the utility to provide power
(kilowatts) to a customer over a utilityspecified time interval (typically 15 or
30 minutes). If demand requirements
are irregular, the utility must have
more capability available than would
be required if the customer load
requirements remained constant. To
provide for this time-varying demand,
the utility must invest in the proper size
equipment to provide for these power
peaks. Brief high peaks such
as those present when large equipment
initially comes on line are not critical
in the overall equation because the
duration is short with respect to the
demand averaging interval.
Consumption
Watts and vars are instantaneous
measurements representing what is
happening in a circuit at any given
moment. Since these parameters
vary so greatly within any period, it is
necessary to integrate (sum) electrical
usage over time.
The fundamental unit for measuring
usage is the watt hour (Wh), or more
typically the kilowatt hour (kWh). This
value represents usage of 1000W for
one hour. Typical costs in the United
States for one kilowatt hour range
from 8 to 15 cents.
Power Factor
Power factor is the ratio of ACTUAL
POWER used in a circuit to the
APPARENT POWER delivered by a
utility. Actual power is expressed in
watts (W) or kilowatts (kW); apparent
power in voltamperes (VA) or
kilovoltamperes (kVA). Apparent power
is calculated simply by multiplying the
current by the voltage.
Power Factor = Actual Power = kW
Apparent Power kVA
Certain loads (e.g., inductive type
motors) create a phase shift or delay
between the current and voltage
waveforms. An inductive type load
causes the current to lag the voltage by
some angle, known as the phase angle.
On purely resistive loads, there is
no phase difference between the
two waveforms; therefore the power
factor on such a load will be 0 degrees,
or unity.
The following examples of a soldering
iron and a single-phase motor illustrate
how power factor is consumed in
different types of loads. In a soldering
iron, the apparent power supplied by
the utility is directly converted into heat,
or actual power. In this case, the actual
power is equal to the apparent power,
so that the power factor
is equal to “1” or 100% (unity).
KVA
ø
Kw
V
√
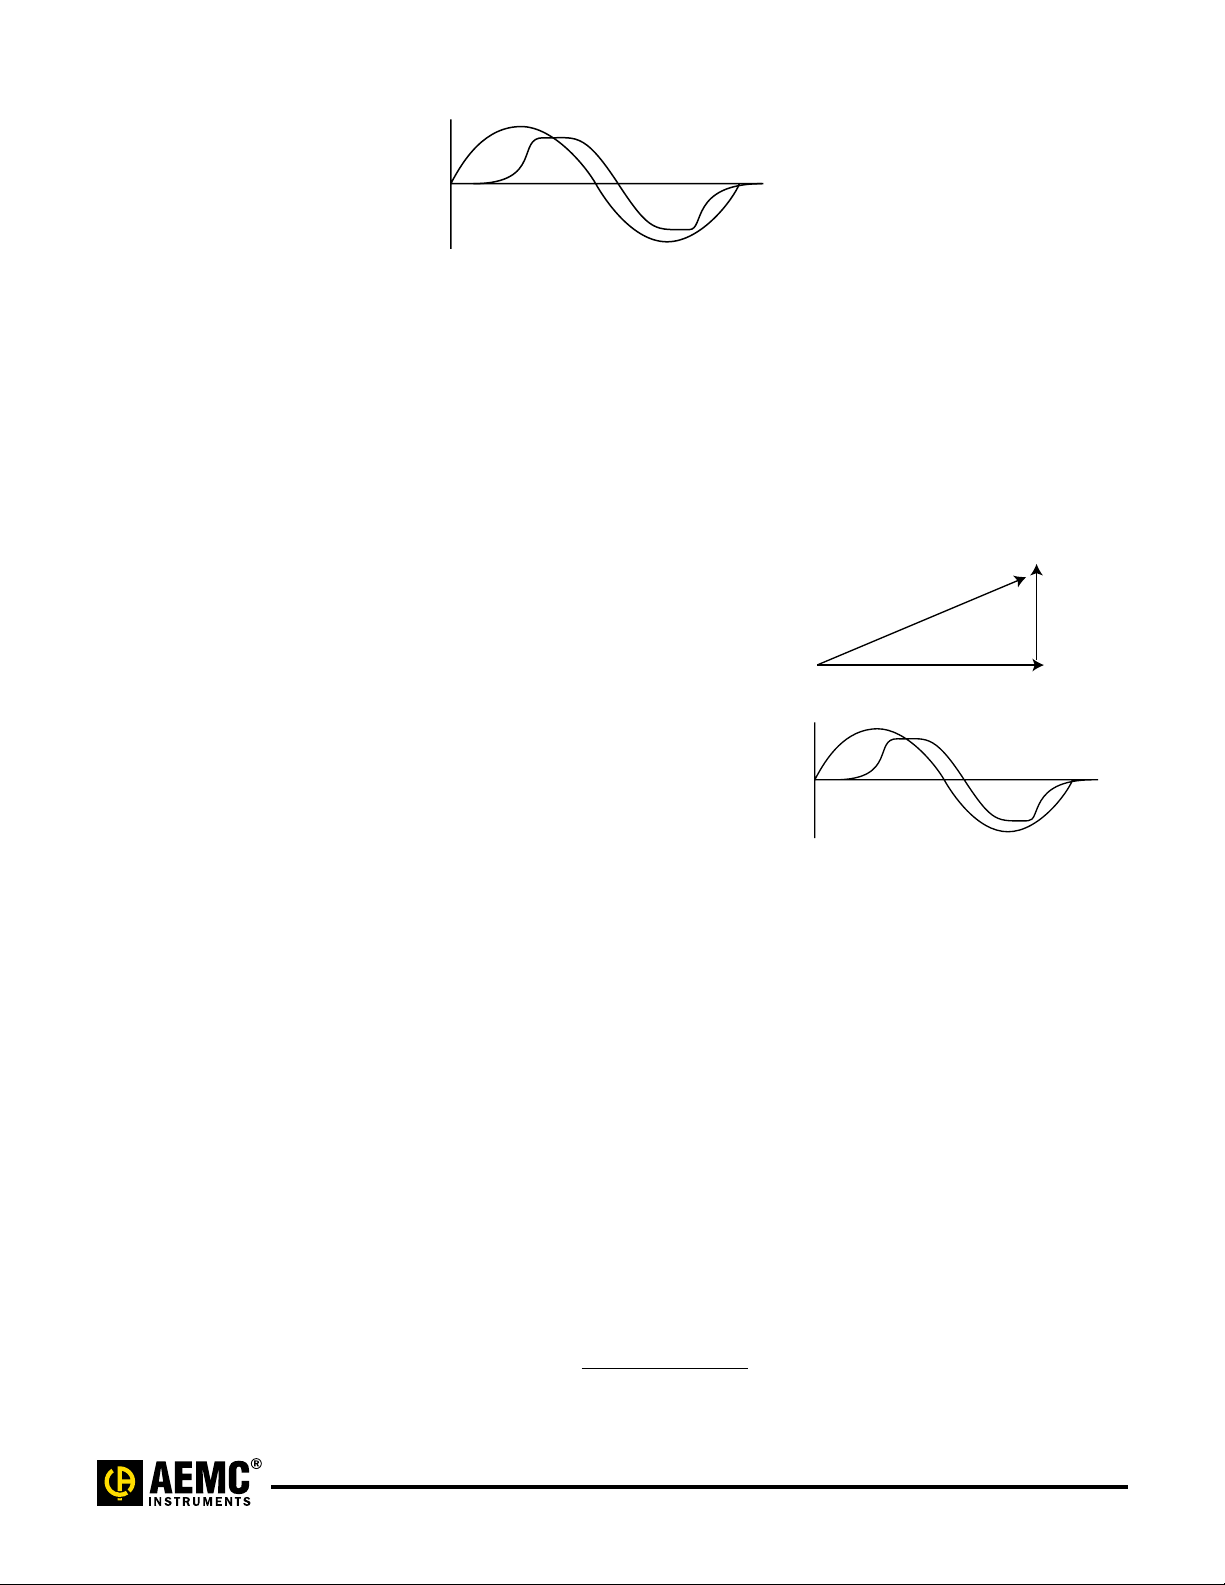
Figure 5. Power factor on nondistorted
sine wave.
Kvar (inductive)
Ø
I
In the case of a single-phase motor,
the actual power is the sum of several
components:
a. the work performed by the system;
that is, lifting with a crane, moving air
with a fan, or moving material, as with
a conveyer.
b. heat developed by the power lost in
the motor winding resistance
c. heat developed in the iron through
eddy currents and hysteresis losses
d. frictional losses in the moor bearings
e. air friction losses in turning the motor
rotor, more commonly known as
windage losses.
We now observe that with a singlephase motor, the apparent power
obtained is greater than the actual
power. This difference is the power
factor.
Understanding Power & Power Quality Instruments (pdf) 05/09
Technical Assistance (800) 343-1391 www.aemc.com 2 of 8
Page 3
Power factor reflects the difference
which exists between loads. The
soldering iron is a purely resistive load
which absorbs the current, which is
then absorbed directly into heat.
The current is called actual current
because it directly contributes to the
production of actual power.
On the other hand, the single-phase
electric motor represents a partially
inductive load consisting of actual
current which will be converted into
actual power, and magnetizing current
which generates the magnetic field
required to operate the electric motor.
This magnetizing current, called the
reactive current, corresponds to an
exchange of energy between the
generator and the motor, but it is not
converted into actual power.
Reactive Compensation Power
Reactive compensation power refers
to the capacitive values required to
correct low power factor to as close
to unity (1.0) as possible. Most
industrial loads are inductive, so the
load current lags the line voltage by
some degree. In order to bring the
value closer to unity, something must
be added to the load to draw a leading
current. This is done by connecting a
capacitor in parallel with the load. Since
a capacitor will not dissipate any real
power, the charge for real power will be
the same.
AEMC recommends consulting a power
factor correction capacitor manufacturer
prior to any installation to reduce
the possible effects of harmonics,
resonance, etc.
Electrical Harmonics
Until fairly recently, power quality
referred to the ability of the electric
utilities to supply electric power
without interruption. Today, the phrase
encompasses any deviation from a
perfect sinusoidal waveform. Power
quality now relates to short-term
transients as well as continuous state
distortions. Power system harmonics
are a continuous state problem with
dangerous results. harmonics can be
present in current, voltage, or both. It is
estimated that as many as 60% of all
electrical devices operate with nonlinear current draw.
Utility companies invest millions of
dollars each year to ensure that voltage
supplied to their customers is as close
as possible to a sinusoidal waveform.
If the power user connects loads to the
system which are resistive, such as
incandescent light bulb, the resulting
current waveform will also be sinusoidal.
However, if the loads are nonlinear,
which is typically the case, the current
is drawn in short pulses and the current
waveform will be distorted. Total current
that is then drawn by the nonlinear load
would be the fundamental as well as all
the harmonics.
Fundamental
3rd Harmonic
Resultant Distorted Waveform
Figure 6. Composite waveform
Harmonic distortion can cause serious
problems for the users of electric
power, from inadvertent tripping
of circuit breakers to dangerous
overheating of transformers and neutral
conductors, as well as heating in motors
and capacitor failure. Harmonics
can cause problems that are easy to
recognize but tough to diagnose.
It is becoming increasingly important
to understand the fundamentals of
harmonics, and to be able to recognize
and monitor the presence of damaging
harmonics. Harmonics within an
electrical system vary greatly within
different parts of the same distribution
system and are not limited simply to
the supply of the harmonic producing
device. Harmonics can interact within
the system through direct system
connections or even through capacitive
or inductive coupling.
A harmonic may be defined as an
integer multiple of a fundamental
frequency. Harmonics are designated
by the harmonic number. For our
discussion, we will focus on the 60Hz
power frequency. The second harmonic
would be two times the fundamental or
120Hz. The third would be three times
the fundamental or 180Hz, and so on.
Nonlinear equipment generates
harmonic frequencies. The nonlinear
nature of a device draws current
waveforms that do not follow the
voltage waveform. Electronic
equipment is a good example. While
this broad category encompasses many
different types of equipment, most of
these devices have one characteristic
in common. They rely on an internal DC
power source for their operation.
Loads which produce harmonic
currents include:
•Electroniclightingballasts
•Adjustablespeeddrives
•Electricarcfurnaces
•Personalcomputers
•Electricweldingequipment
•Solidstaterectifiers
•Industrialprocesscontrols
•UPSsystems
•Saturatedtransformers
•Solidstateelevatorcontrols
•Medicalequipment
This is by no means an exhaustive
list of equipment which generates
harmonics. Any electronic-based
equipment should be suspected of
producing harmonics.
Due to the ever increasing use
of electronics, the percentage of
equipment which generates harmonic
current has increased significantly.
The harmonic problem manifests itself
with proliferation of equipment using
diode capacitor input power supplies.
This type of equipment draws current
in a short pulse only during the peak
of the sine wave. The result of this
action, aside from improved efficiency,
is that high frequency harmonics are
superimposed onto the fundamental
60Hz frequency.
The harmonics are produced by the
diode-capacitor input section which
rectifies the AC signal into DC. The
circuit draws current from the line
only during the peaks of the voltage
waveform, thereby charging a capacitor
to the peak of line voltage.
Understanding Power & Power Quality Instruments (pdf) 05/09
Technical Assistance (800) 343-1391 www.aemc.com 3 of 8
Page 4

The equipment DC requirements
are fed from this capacitor and as a
result the current waveform becomes
distorted.
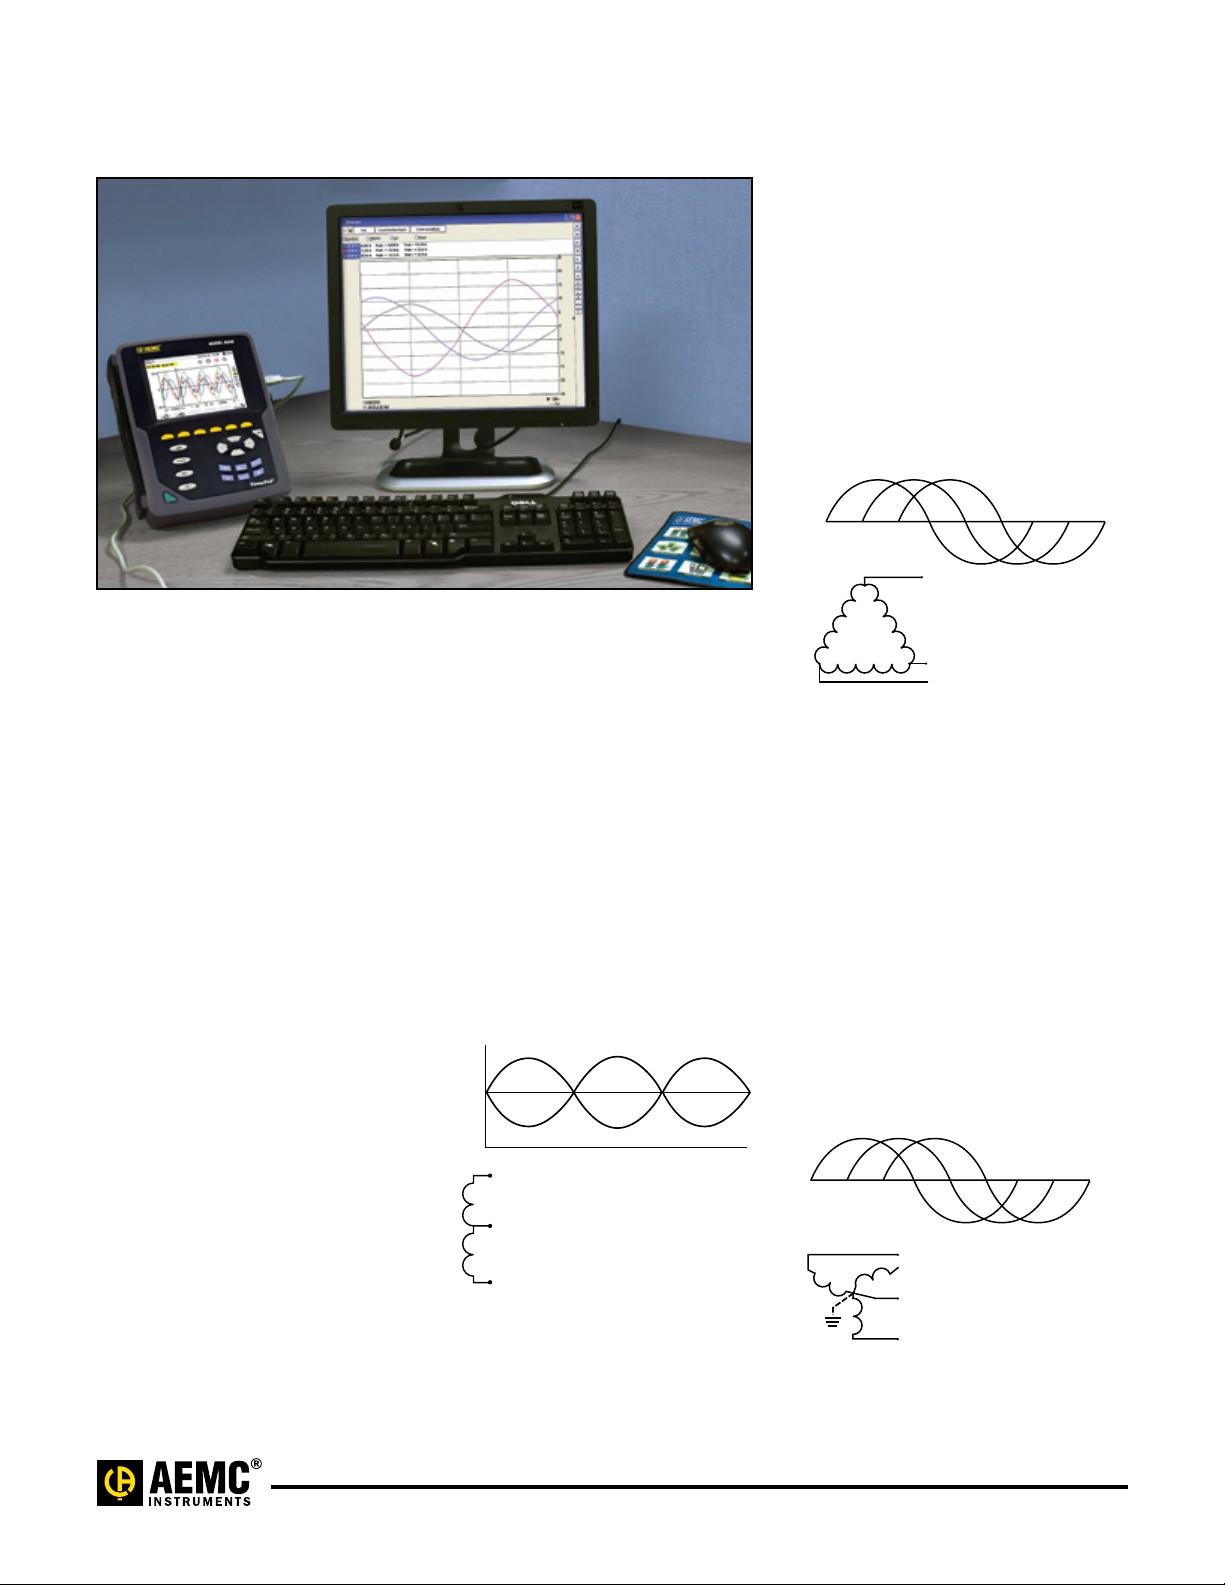
Voltage
Current
Figure 7 Nonlinear current draw
Harmonics in the electric power
system combine with the fundamental
frequency to create distortion. The
level of distortion is directly related to
the frequencies and amplitudes of the
harmonic current. The contribution of
all harmonic frequency currents to the
fundamental current is known as “Total
Harmonic Distortion” or THD. This THD
value is expressed as a percentage of
the fundamental current. THD values of
over 10% are reason for concern.
THD is calculated as the square root of
the sum of the squares of all the
harmonics divided by the fundamental
signal (50 or 60Hz). This calculation
arrives at the value of distortion as a
percentage of the fundamental.
Mathematically, %THD is the ratio
of the sum of the root-mean square
(RMS) of the harmonic content to the
root-mean square (RMS) value of the
fundamental 50 or 60Hz signal, and
expressed as a percentage.
TOTAL HARMONIC DISTORTION
Sum of squares of amplitudes of all harmonics
%THD =
Square of amplitude of fundamental
[
%THD (current) =
%THD (voltage) = [(V2)2 + (V3)2 + (V4)2 + (V5)2 .../(V1)
(I2)2 + (I3)2 + (I4)2 + (I5)2 .../(I
DISTORTION FACTOR
Sum of squares of amplitudes of all harmonics
%DF =
Square of Total RMS
[
%DF (current) =
%DF (voltage) = [(V2)2 + (V3)2 + (V4)2 + (V5)2 .../(V1)
(I2)2 + (I3)2 + (I4)2 + (I5)2 .../(I
Another useful parameter is the
Distortion Factor, or %DF. Distortion
Factor is the Total Harmonic Distortion
referenced to the total RMS signal.
The THD is expressed as a percentage
and may not be greater than the
fundamental. The %DF never exceeds
100%. We provide this term because of
the market need and the requirement
of this value under the international
standard IEC-555. Mathematically,
it is the ratio of the sum of the rootmeansquare (RMS) of the harmonic
content to the root-mean square (RMS)
value of the total signal, and expressed
as a percentage.
Please note that our %DF is not the
same value as the Distortion Factor
as expressed the IEEE standard
519-1992 (in which Distortion Factor
is the same as THD).
Figure 8. Computer current waveform
Wherever there are large numbers of
nonlinear loads, there are sure to be
harmonics in the distribution system.
Harmonic-producing equipment is found
in varied locations from administrative
offices to manufacturing facilities.
In the factory
environment,
electronic power
x 100
converters such
as variable speed
drives, SCR
drives, etc., are the
largest contributors
RMS
2
)
]
x 100
to harmonic
2
]
x 100
distortion. It is not
uncommon to have
THD levels as
high as 25% within
some industrial
settings.
x 100
Most single-phase
office equipment
draws nonlinear
current. While
RMS
2
)
]
x 100
fluorescent lighting
with electronic
ballasts and
2
]
x 100
many types of
office equipment
contribute to creating harmonics,
personal computer power supplies are
the largest contributor within the office
environment. Although THD levels will
be lower than in an industrial setting,
the susceptibility of office equipment to
variations in power quality is extremely
high.
In the industrial environment, there can
be many three-phase, nonlinear loads
drawing high levels of load current. The
most prevalent harmonic frequencies
are the odd integer multiples of the
60Hz frequency. The third harmonic
(180Hz) is always the most prevalent
and troublesome.
Large commercial buildings have many
different sizes and types of loads.
In most installations the power is
distributed with 208/ 120V transformers
in a Delta-Wye configuration. When
multiple loads are
supplied, each
generates triple
harmonic currents on
the neutral conductor
which are sent onto the
transformer secondary
Current Draw
and reflected into the
delta primary. These
currents circulate
within the delta primary
causing overheating and shortened
service life.
Harmonics can cause a variety of
problems to any user of electric power.
For large users, the problems can
be intense. For electronic equipment
that relies on the zero crossing of the
sinusoidal waveform, such as clock
timing devices, heavy harmonic content
can cause a zero crossing point offset.
480V/208V
Transformer
C1
Primary
C2
C3
Figure 9. Delta primary, circulating current
Secondary
A
B
C
Neutral
Odd number harmonics (third, fifth
and seventh) cause the greatest
concern in the electrical distribution
system. Because the harmonic
waveform usually swings equally in
both the positive and negative direction,
the even number harmonics are
mitigated.
Understanding Power & Power Quality Instruments (pdf) 05/09
Technical Assistance (800) 343-1391 www.aemc.com 4 of 8
Page 5

Heating effect causes the greatest
problem in electric equipment. Many
times, electrical distribution equipment
has overheated and failed even when
operating well below the suggested
rating requirements. Temperature
increase is directly related to the
increase in RMS current.
To Source of Power
Main Service
Entrance Switch
Fused
Disconnect
Switch for
Capacitors
To Load
Figure 10. Power factor capacitors at resonant frequency.
voltage drops between neutral and
ground which are well above normal.
Readings above four volts indicate high
neutral current.
False tripping of circuit breakers is also
a problem encountered with the higher
frequencies that harmonics produce.
Capacitors
susceptible equipment (e.g., electronic
equipment, variable speed motors,
etc.). Remember that most distribution
systems are designed specifically to
carry 60Hz.
Most nonlinear harmonic problems
can be detected at the electrical panel.
Excessive current flow on the neutral
can be detected with a True RMS
current meter, but may be indicated
by a resonant buzzing sound or by
discolored connections on the neutral
buss.
Because harmonic frequencies
are always higher than the 60Hz
fundamental frequency, “skin effect” also
becomes a factor. Skin effect is
a phenomenon where the higher
frequency causes the electrons to
flow toward the outer sides of the
conductor, effectively reducing the
cross-sectional diameter of the
conductor and thereby reducing the
ampacity rating of the cable. This effect
increases as the frequency and the
amplitude increase. As a result, higher
harmonic frequencies cause a greater
degree of heating in conductors.
On balanced three-phase systems
with no harmonic content, the line
currents are 120 degrees out-of-phase,
canceling each other and resulting in
very little neutral current. However,
when there is distortion in any one
of the phase currents, the harmonic
currents increase and the cancellation
effect is lessened. The result is typically
a neutral current that is significantly
higher than planned.The triple
harmonics (odd multiples of three) are
additive in the neutral and can quickly
cause dangerous overheating.
In theory, the maximum current that
the neutral will carry is 1.73 times the
phase current. If not sized correctly,
overheating will result. Higher than
normal neutral current will cause
Peak sensing circuit breakers often will
trip even though the amperage value
has not been exceeded. Harmonic
current peak values can be many times
higher than sinusoidal waveforms.
Power factor correction capacitor failure
in many cases can be directly attributed
to harmonic content. Capacitors appear
as extremely low impedance values
and are more susceptible to harmonics.
Inductive reactance varies directly
with frequency (XL = 2pfl). Parallel
resonance between the capacitor
bank and the source impedance can
cause system resonance resulting
in higher than normal currents and
voltages. High harmonic currents have
been known to overheat correction
capacitors, causing premature failure
and sometimes resulting in explosion.
Most harmonic problems result when
the resonant frequency is close to
the fifth or seventh harmonic. These
happen to be the largest harmonic
amplitudenumbersthatadjustable
speed drives create. When this
situation arises, capacitor banks should
be resized to shift the resonant point to
another frequency.
Detection and Measurement
In harmonic analysis, field
measurements are performed to
identify frequency and magnitude
of harmonic currents generated by
Figure 11. Measuring at the service entrance
panel.
Beginning at the service entrance
panel, measure and record the True
RMS current in each phase, as well
as the neutral of the distribution
transformer secondary. Compare
this measured neutral current to the
anticipated current due to phase
imbalance. If the phase currents are
equal, the vector sum of the neutral
currents will add to zero. If there are
excessive amounts of triple harmonics
in the neutral, neutral current may
exceed phase current. Consult the
®
for the maximum ampacity for
NEC
each of the tested conductors.
Measure each feeder for harmonic
content. A high degree at this location
can often be heard as a buzzing sound.
A voltage THD reading is also useful at
this location.
IEEE standard 519-1992 specifies both
maximum distortion levels and recommended correction levels. A harmonic
distortion limit of 5% is the point where
harmonics begin to have
a detrimental effect on electrical
distribution systems.
Harmonic current measurements define
the harmonic generating characteristics
Understanding Power & Power Quality Instruments (pdf) 05/09
Technical Assistance (800) 343-1391 www.aemc.com 5 of 8
Page 6

of the load, so measurements should
be taken at the load when possible.
Voltage measurements define the
system response and are usually taken
at the individual busses.
Effects on the System
To compound the problems that
harmonic currents present to the
system, nonlinear harmonic load also
have an Ohm’s law relationship with
the source impedance of the system to
produce voltage harmonics. Consider
a heavily loaded transformer that is
affected by one branch circuit feeding a
non-linear load. The creation of voltage
harmonics can then be passed down to
all the remaining circuits being fed by
that transformer.
Voltage harmonics may cause havoc
within the electrical system. Motors are
typically considered to be linear loads;
however, when the source voltage
supply is rich in harmonics, the motor
will draw harmonic current. The typical
result is a higher than normal operating
temperature and shortened service life.
Different frequency harmonic currents
can cause additional rotating fields in
the motor. Depending on the frequency,
the motor will rotate in the opposite
direction (counter-torque). The fifth
harmonic, which is very prevalent, is a
negative sequence harmonic causing
the motor to have a backward rotation,
shortening the service life.
Noise can be picked up in
communication equipment and
telephone systems when harmonics
at audio or radio frequencies are
inductively or capacitively coupled into
communication or data lines.
When induction-disc watt-hour meters
are monitoring nonlinear loads,
depending on the content of the
harmonics, the disk may run slower or
faster, resulting in erroneous readings.
Transformer Derating
Most generators and transformers
base their operating characteristics on
undisturbed 60Hz waveforms. When
the waveforms are rich in harmonics,
shortened service or complete failure
often follows.
The derating K factor can be applied
specifically to transformers to ensure
that dangerous heating will not result
due to the transformer supplying load
currents rich in harmonic content.
The K factor is determined by
measuring the True RMS current
of each harmonic, multiplied by the
harmonic order and squared. The
total sum of this is then multiplied by
the harmonic order and squared. The
total sum of this is then multiplied by
the eddy current losses. Transformer
parasitic heating due to harmonic
currents is frequency dependent, i.e.,
higher frequency harmonic currents
cause a higher degree of transformer
heating and failure.
The K factor is basically an index of the
transformer’s ability to handle nonlinear
load current without abnormal heating.
Some distribution transformers are
now being designed with magnetic
cores and windings to accommodate
harmonic content. A K-rated transformer
is specifically designed to handle
nonlinear loads. The higher the K factor
value, the better the transformer’s
ability to handle nonlinear loads.
IEEE C57.110-1986 is a prescribed
procedure used to derate the
transformer loading based on the
specific harmonic content. Each
specific electrical application is unique
in type and amount of harmonic
interaction.
IEEE C57.1200-1987 has proposed a
limit of 5% for transformer harmonic
current factor.
An alternate method for derating
transformers is available for buildings
which supply single phase, 120V
receptacles. This method is established
by The Computer & Business
Equipment Manufacturers Association
(CBEMA).
CBEMA Derating Factor =
Crest Factor
1.414
Meter Readings
Harmonic problems can be analyzed
more easily when the proper test
equipment is used.
The term “True RMS”, or Root-MeanSquare, relates to the equivalent DC
heating value of the current or voltage
waveform. If a pure sine wave and a
distorted sine wave were both applied
to a resistive load, the point where they
both create the same heating value
is the point where they both have the
same RMS value.
True RMS capability is required to
accurately measure systems where
harmonic current is present. Average
responding instruments will yield
erroneous measurement results from
25 to 40% below the actual value when
harmonic distortion is present.
Many instruments on the market
measure average or Peak values of a
waveform and internally multiply by
1.11 or .707 respectively to indicate
RMS values. These devices work well
when measuring a pure sine wave.
Instruments with True RMS converters
sample the waveform at many different
points and provide accurate readings
on distorted waveforms. Microprocessor
based circuits sample, digitize and
square each sample, add it to the
previous sample squared, and take the
square root of the total. This process
yields a True RMS value regardless of
the amount of distortion.
Crest Factor
Crest factor is the ratio of the Peak
value of a sinusoidal waveform to its
RMS value.
Crest Factor (CF) =
RMS value
Peak value
Crest factor indicates the level of
peaking which an instrument can
handle without measurement errors.
For a perfect sine wave the crest factor
would be 1.414. This relates to the
Peak amplitude that an instrument
can measure accurately. Typical crest
factor ratings are from 2.0 to 6.0. The
higher the factor, the more capable the
instrument of measuring a complex
waveform correctly. When harmonics
are present crest factors may be less
than (CF of a square wave = 1) or
greater than 1.414.
Understanding Power & Power Quality Instruments (pdf) 05/09
Technical Assistance (800) 343-1391 www.aemc.com 6 of 8
Page 7

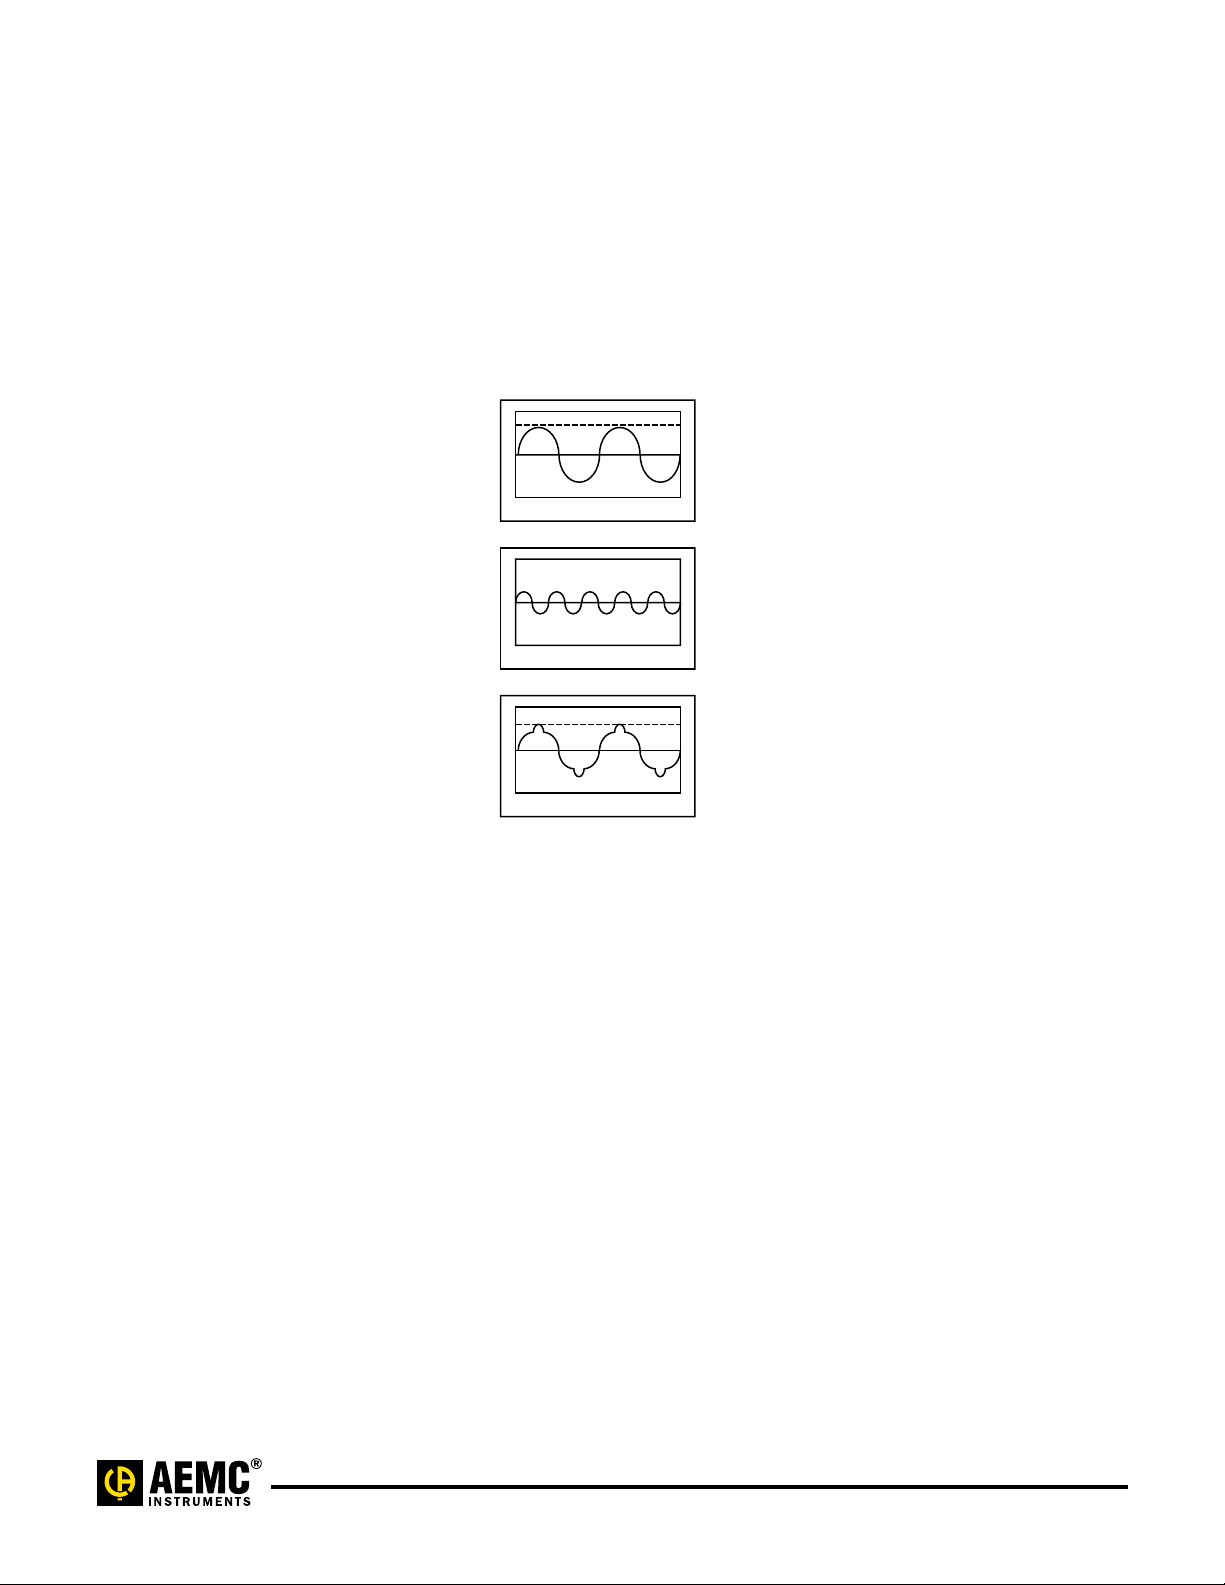
Peak value
RMS value
Average value
Figure 12. RMS — Avg — Peak
Relationship in sine wave
Limiting the Effects of Harmonics
Derating certain types of electrical
equipment is the easiest way to limit
the effects that increased heating has
on the equipment. A 25% derating
for transformers and generators is
commonly employed in industry.
Phase
A
B
C
Figure 13. Single tuned shunt filter.
Reactor
Capacitor
Bank
Filtering is currently the most common
method used to limit the effects that
harmonics present to the rest of the
system. Filters typically consist of tuned
series L — C circuits. Filter impedance
is negligible with respect to the rest
of the system, limiting its interaction
effects for harmonic control. Filters are
sized to withstand the RMS current
as well as the value of current for the
harmonics.
In the future, systems may be available
which will offset the harmonics by
applying signals that are equal in
amplitude but opposite in phase,
thereby canceling or severely limiting
harmonic effects.
©
2002 Chauvin Arnoux® Inc.
d.b.a. AEMC
®
Instruments
Understanding Power & Power Quality Instruments (pdf) 05/09
Technical Assistance (800) 343-1391 www.aemc.com 7 of 8
Page 8

Contact Us
United States & Canada:
Chauvin Arnoux
d.b.a. AEMC
200 Foxborough Blvd.
Foxborough, MA 02035 USA
(508)698-2115•Fax(508)698-2118
www.aemc.com
Customer Support — for placing an order, obtaining price & delivery:
customerservice@aemc.com
Sales Department — for general sales information:
sales@aemc.com
Repair and Calibration Service — for information on repair & calibration, obtaining a user manual:
repair@aemc.com
Technical and Product Application Support — for technical and application support:
techinfo@aemc.com
Webmaster — for information regarding www.aemc.com:
webmaster@aemc.com
®
, Inc.
®
Instruments
South America, Central America, Mexico, Caribbean, Australia & New Zealand:
Chauvin Arnoux
d.b.a. AEMC
®
, Inc.
®
Instruments
15 Faraday Drive
Dover, NH 03820 USA
(978)526-7667•Fax(978)526-7605
export@aemc.com
www.aemc.com
All other countries:
Chauvin Arnoux SCA
190, rue Championnet
75876 Paris Cedex 18, France
33144854528•Fax33146277389
info@chauvin-arnoux.com
www.chauvin-arnoux.com
Understanding Power & Power Quality Instruments (pdf) 05/09
Technical Assistance (800) 343-1391 www.aemc.com 8 of 8
 Loading...