


GB - User’s manual
99 Washington Street
Melrose, MA 02176
Phone 781-665-1400
Toll Free 1-800-517-8431
Visit us at www.TestEquipmentDepot.com
C.A 8436
Three-phase electrical networks analyser
in a eld housing
Thank you for purchasing a C.A 8436 three-phase electrical networks analyser (Qualistar+). To obtain the best service from
your unit:
read these operating instructions carefully,
comply with the precautions for use.
WARNING, risk of DANGER! The operator must refer to these instructions whenever this danger symbol appears.
Equipment protected by double insulation.
Earth. USB socket.
The product is declared recyclable following a life cycle analysis in accordance with standard ISO 14040.
The CE marking indicates conformity with European directives, in particular LVD and EMC.
Chauvin Arnoux has adopted an Eco-Design approach in order to design this appliance. Analysis of the complete
lifecycle has enabled us to control and optimize the effects of the product on the environment. In particular this appliance exceeds regulation requirements with respect to recycling and reuse.
The rubbish bin with a line through it indicates that, in the European Union, the product must undergo selective disposal
in compliance with Directive WEEE 2002/96/EC. This equipment must not be treated as household waste.
Denition of measurement categories
Measurement category IV corresponds to measurements taken at the source of low-voltage installations.
Example: power feeders, counters and protection devices.
Measurement category III corresponds to measurements on building installations.
Example: distribution panel, circuit-breakers, machines or xed industrial devices.
Measurement category II corresponds to measurements taken on circuits directly connected to low-voltage installations.
Example: power supply to domestic electrical appliances and portable tools.
PRECAUTIONS FOR USE
This device is compliant with safety standard IEC 61010-2-030, the leads are compliant with IEC 61010-031, and the current sensors are compliant with IEC 61010-2-032, for voltages up to 600 V in category IV or 1,000 V in category III.
Failure to observe the safety instructions may result in electric shock, re, explosion, and destruction of the instrument and of the
installations.
The operator and/or the responsible authority must carefully read and clearly understand the various precautions to be taken
in use. Sound knowledge and a keen awareness of electrical hazards are essential when using this instrument.
If you use this instrument other than as specied, the protection it provides may be compromised, thereby endangering you.
Do not use the instrument on networks of which the voltage or category exceeds those mentioned.
Do not use the instrument if it seems to be damaged, incomplete, or poorly closed.
Before each use, check the condition of the insulation on the leads, housing, and accessories. Any item of which the insulation
is deteriorated (even partially) must be set aside for repair or scrapping.
Before using your device, check that it is perfectly dry. If it is wet, it must be thoroughly dried before being connected or being
operated in any way.
Use only the leads and accessories supplied. Using leads (or accessories) of a lower voltage or category reduces the voltage
or category of the combined instrument + leads (or accessories) to that of the leads (or accessories).
Use personal protection equipment systematically.
Keep your hands away from the terminals of the device.
When handling the leads, test probes, and crocodile clips, keep your ngers behind the physical guard.
Use only the battery pack supplied by the manufacturer. This pack includes specic safety features.
Some current sensors must not be placed on or removed from bare conductors at hazardous voltages: refer to the sensor
manual and comply with the handling instructions.
2

CONTENTS
1. GETTING STARTED ........................................................ 4
1.1. Delivery condition
1.2. Accessories
1.3. Spare parts
1.4. Charging the battery
1.5. Choice of language
2. DESCRIPTION OF THE DEVICE
2.1. Functions
2.2. Overall view
2.3. On/Off switch
2.4. Display
2.5. Keypad keys
2.6. Connectors
2.7. Power supply
2.8. Abbreviations
3. USE
4. CONFIGURATION
5. WAVEFORM CAPTURE
6. HARMONIC
7. WAVEFORM
8. ALARM MODE ............................................................... 62
9. TREND MODE
...............................................................................17
3.1. Start-up
3.2. Conguration
3.3. Installation of leads
3.4. Functions of the device
4.1. Conguration menu
4.2. Display language
4.3. Date/Time
4.4. Display
4.5. Calculation methods
4.6. Connection
4.7. Sensors and ratios
4.8. Capture Mode
4.9. Trend mode
4.10. Mode Alarm mode
4.11. Erase memory
4.12. About
5.1. Transient mode
5.2. Inrush current mode
6.1. Phase-to-neutral voltage
6.2. Current
6.3. Apparent power
6.4. Phase-to-phase voltage
6.5. Expert mode
7.1. Measurement of true RMS value
7.2. Measurement of total harmonic distortion
7.3. Measurement of the peak factor
7.4. Measurement of extreme and mean voltage and
current
7.5. Simultaneous display
7.6. Display of Fresnel diagram
8.1. Alarm mode conguration
8.2. Programming an alarm campaign
8.3. Display of the list of campaigns
8.4. Display of list of alarms
8.5. Deleting an alarm campaign
8.6. Erasing all alarm campaigns
9.1. Programming and starting recording
9.2. Trend mode conguration
9.3. Viewing the recording list
9.4. Deleting recordings
9.5. Viewing the records
............................................................... 8
................................................................ 11
................................................................ 17
................................................................. 22
.................................................................37
................................................................... 46
................................................................. 47
................................................................... 52
.................................................................56
..............................................................65
..................................................4
...........................................................5
............................................................ 5
.............................................. 6
................................................7
....................................8
......................................................... 10
....................................................... 11
........................................................ 13
.........................................................14
....................................................... 15
....................................................... 15
.......................................................17
.............................................. 18
........................................20
........................................................21
.............................................21
................................................. 21
............................................................21
............................................ 23
..........................................................26
...............................................30
..................................................... 31
.........................................................33
.............................................35
...................................................36
................................................38
.................................................... 38
............................................41
.....................................46
...................................................48
.......................................49
........................................................50
......................... 52
...........54
.......................... 55
...........................................58
.................................. 60
................................... 62
.......................62
........................... 63
........................................63
................................ 64
..............................64
...................65
.................................... 65
..................................... 66
..............................................66
............................................. 66
10. POWER AND ENERGY MODE
10.1. 3L lter
10.2. Filters L1, L2 and L3
10.3. Filter Σ
10.4. Starting energy metering
10.5. Disconnection of energy metering
10.6. Reset of energy metering
11. SCREEN SNAPSHOT MODE
11.1. Screen snapshots
11.2. Handling of screen snapshots
12. HELP KEY
13. DATA EXPORT SOFTWARE
14. GENERAL SPECIFICATIONS
14.1. Environmental conditions
14.2. Mechanical conditions
14.3. Overvoltage categories per IEC 61010-1
14.4. Electromagnetic compatibility
14.5. Power supply
15. FUNCTIONAL CHARACTERISTICS
15.1. Reference Conditions
15.2. Nominal current according to type of sensor
15.3. Electrical characteristics
15.4. Class B under standard IEC 61000-4-30
16. FORMULAS
16.1. Mathematical formulae
16.2. Distribution sources supported by the device
16.3. Hysteresis
16.4. Minimum scale values for waveforms and
minimum RMS values
16.5. Four-quadrant diagram
16.6. Mechanism for triggering transient captures
16.7. Capture conditions in Inrush Current mode
16.8. Glossary
17. MAINTENANCE
17.1. Cleaning the casing
17.2. Maintenance of sensors
17.3. Replacing the battery
17.4. Memory card
17.5. Updating of the internal software
18. WARRANTY
............................................................... 73
..............................................................75
................................................................... 79
..................................................... 82
.................................................................97
........................................................ 114
.......................................................... 11 6
........................................................ 119
.................................................... 121
.............................................................. 123
...................................73
.......................................... 74
...................................76
..................................77
...................................... 78
.............................................. 78
...........................78
....................................... 80
.................................... 81
..................................81
.......................................81
............................ 82
.......................... 84
........................................ 84
................................... 85
.....................................97
...................................... 114
................................... 115
......................................... 119
.................................. 119
....................................... 119
..................... 77
..........81
..... 84
..........96
.. 114
.. 115
..... 115
..................... 122
3

1.1. DELIVERY CONDITION
1. GETTING STARTED
C.A 8436
POWER & QUALITY ANALYSER
➀
➁
x5
x5
➂
➇
English
Safety data sheet Measuring Instrument in CAT II or CAT III or CAT IV (en)
For your safety and to avoid damage to property:
Read what follows carefully and observe these precautions
➉
12
Read the other documents provided carefully, including any documents on the CD-ROM
Meanings of the principal symbols that may be present on your product:
CAUTION! Risk of Danger!
CAUTION! Risk of electric shock!
Refer to this safety datasheet and comply
Refer to this safety datasheet, to the user
with the precautions for use.
manual and comply with the precautions for use.
Current clamp: Can be applied to or
t clamp: Do not apply to or remove from
Curren
removed from non-insulated or bare
conductors at dangerous voltages.
conductors at dangerous voltages.
In the European Union, this product is
subject to selective collection in accordance
CE marking indicates compliance
The
with the European WEEE directive. Do not
with the European "Low Voltage", "EMC",
dispose of it as ordinary waste; contact the
"WEEE", and "RoHS" directives.
manufacturer for information about
collection points.
Ear
th
not dispose of the batteries as ordinary
Do
waste; take them to a collection point.
Doub
le insulation
Conditions of use
Temperature, Humidity: Comply with the values stated in the user manual.
Altitude : 2 000 m
Pollution degree : 2
Precautions for use
These safety instructions must be respected to assure the personal safety and the environment of use. If
you do not comply with them, there is a risk of electric shock, explosion or re.
If you use these instruments other than as specied or without observing the elementary safety rules, the
protection they provide may be compromised, endangering you.
The safety of any system which may include these leads or accessories is the respo
assembler of the system.
Each time before use, always check that the insulation of the leads or accessories is in good
condition. Any element whose insulation is damaged (even partially) must be removed from use and
scrapped. A change of color of the insulating material is an indication of deterioration.
The steady-state voltages, currents, and measurement categories are marked on the instruments, on
the cords, and on the accessories. Comply with these values.
Use specic individual safety protections w
zardous live parts can be accessible in the
hen ha
installation where the measure is performed
Before using your instrument, check that it is in good working order (for example, by measuring a
known dangerous voltage).
If the manual states how to replace the fuse(s) of your instrument, use only the recommended fuses.
Before replacing the batteries (rechargeable or not), disconnect the leads of your instrument.
The use of a measurement instrument, a lead or an accessory with a lower
category or voltage downgrades the use of the assembly (instrument + lead +
accessory) to the lowest category and/or operating voltage.
Using a measuring instrument in a category II or III or IV environment can be dangerous. In such
measurement environments, the operators must be trained and/or accredited and/or informed of the
safety measures to be taken.
Measurement categories:
CAT II: Measurement category II is for measurements performed on circuits directly connected to the
low voltage installation
Examples: measurements on household appliances and portable tools.
CAT III: Measurement category III is for measurement performed in the building installation
Examples: distribution boards, circuit
-breakers, machine or industrial equipment with permanent
connection to the xed installation.
CAT IV: Measurement category IV is for measurements performed at the source of the low-voltage installation.
Example: meters and measurements on primary overcurrent protection devices and ripple
control units.
Cleaning
Disconnect the leads or the test accessories
Use a soft cloth, dampened with soapy water. Rinse with a damp cloth and dry rapidly with a dry
hydrocarbons.
cloth or forced air. Do not use alcohol, solvents, or
Do not modify the leads or accessories. Any non-compliant repairs can cause risks of electric shock
or burns.
1
nsibility of the
QUALI
STAR
+
➆
➅
➄
ATTESTATION DE VERIFICATION
CHECKING ATTESTATION
190, rue Championnet
Numéro de l'appareil :
75876 PARIS Cedex 18
Equipment number
FRANCE
Type /
:
➈
No. Designation Quantity
1
2
3
4
5
6
7
8
9
10
11
12
13
C.A 8436 with or without current sensor depending on the order.
The battery is in place in the instrument.
Black safety leads, 3m, banana-banana, straight-straight, tight and lockable. 5
Black crocodile clips. 5
Type A-B USB cord. 1
Specic mains power unit and mains cord (the plug depends on the country). 1
Power supply cord terminated by two safety-series banana plugs with rear-mounted sockets. 1
No. 22 carrying bag 1
Sets of inserts and rings for marking the leads and current sensors according to phase. 12
Tight plugs for the terminals (mounted on the instrument). 9
User’s manual on CD-ROM. 1
Multilingual safety sheet. 1
Checking attestation. 1
Power Analyser Transfer (PAT2) software on CD-ROM. 1
Model
Désignation de l'instrument :
Instrument designation
Signature :
Vérifié par :
Signature
Tested by
Établi en usine, ce document atteste que le produit ci-dessus a été vérifié et est conforme aux
conditions d'acceptation définies dans nos procédures de fabrication et de contrôle.
Tous les moyens de mesure et d'essai utilisés pour vérifier cet appareil sont raccordés aux
étalons nationaux et internationaux soit par l'intermédiaire d'un de nos laboratoires de métrologie
accrédités COFRAC soit par un autre laboratoire accrédité.
Après sa mise en service, cet instrument doit être vérifié à intervalle régulier
auprès d'un service de métrologie agréé.
Pour tout renseignement veuillez contacter notre service après vente et d'étalonnage.
At the time of manufacture, this document certifies that the above product have been verified and
complies with acceptance conditions defined in our manufacturing and testing procedures.
Every test or measuring equipment used to verify this instrument are related to national
ology certified by french COFRAC
and international standards through one of our laboratories of metr
equivalent to NAMAS in the UK or through another certified laboratory.
After being in use, this instrument must be recalibrated within regular intervals
by an approved metrology laboratory. Please contact our after sales and calibration department:
Service après vente et d'étalonnage TEL: +33 (2) 31 64 51 55 FAX: +33 (2) 31 64 51 72
After sales and calibration department e-mail: info@manumesure.fr
WEB : www.manumesure.com
www.chauvin-arnoux.com
ATTESTATION DE CONFORMITE
COMPLIANCE ATTESTATION
Nous certifions que ce produit a été fabriqué conformément aux spécifications
techniques de constuction applicables.
We certify that this product is manufactured in accordance with applicable
constructing specifications.
907 009 119 - 02/03
➃
11
13
4

1.2. ACCESSORIES
5 A adapter unit (three-phase)
MN93 clamp
MN93A clamp
PAC93 clamp
C193 clamp
MiniFlex
MiniFlex® MA193 350 mm
MiniFlex® MA193 350 mm water- and air-tight. We recommend using water-tight sensors with the C.A 8436.
AmpFlex® A193 450 mm
AmpFlex® A196A 610 mm water- and air-tight. We recommend using water-tight sensors with the C.A 8436.
AmpFlex® A193 800 mm
E3N clamp
E3N clamp adapter
Mains power unit + E3N clamp
Dataview software
®
MA193 250 mm
Pole attachment kit Cord reel
REELINGBOX
1.3. SPARE PARTS
9.6 V 4 Ah NiMH battery pack
USB-A USB-B cord
Specic mains cord
Cord for power supply by the phases
No. 22 carrying bag
No. 21 carrying bag
Set of 5 water- and air-tight black banana / screw-lock banana straight-straight safety cables
Set of 5 black crocodile clips
Set of 12 inserts and rings to identify voltage phases and leads and current phases and leads
Set of 5 plugs for the voltage terminals and 4 plugs for the current terminals
For accessories and spare parts, visit our website:
www.chauvin-arnoux.com
5

1.4. CHARGING THE BATTERY
Before the rst use, start by fully charging the battery.
Unscrew the cover of the connector to charge the battery in the device.
120 V ± 10 %, 60 Hz
230 V ± 10 %, 50 Hz
Connect the specic mains cord and screw it in place.
Then connect the cord to mains.
The button lights; it will go out only when the plug is disconnected.
When the battery is fully discharged, charging takes approximately 5 hours.
IIt is also possible to charge the battery using the voltage on the voltage measurement terminals.
For this, once the cover on the connector is unscrewed, connect the power supply cord to the battery charging connector and the
two safety-series banana plugs with rear-mounted sockets to any two of the phases (L1, L2, L3).
L1
L2
L3
110 ... 1000 V
N
0 ... 440 Hz
PE
6

If you want to make measurements while charging the battery, connect the measurement leads to the terminals and to the safetyseries banana plugs with rear-mounted sockets.
L1 L3
L1
L2
L3
110 ... 1000 V
N
0 ... 440 Hz
PE
1.5. CHOICE OF LANGUAGE
Before using the device, rst choose the language in which you want the device to display its messages.
Press the green button to switch the device on.
Press the Conguration key.
Figure 8: Conguration screen
Press the yellow key on the device corresponding to the desired language.
This key is used to go to the next page.
7

2. DESCRIPTION OF THE DEVICE
2.1. FUNCTIONS
The C.A. 8436 (Qualistar+ in a rugged water-tight eld housing) is a three-phase network analyzer with colour graphic display and
built-in rechargeable battery.
It plays three roles, and can be used:
to measure the RMS values, powers, and perturbations of electric distribution networks.
to deliver a snapshot of the principal characteristics of a three-phase network
to track the variations of various parameters over time.
The measurement uncertainty of the device is better than 1% (not counting the uncertainties due to the current sensors). The
device is also very exible, with a choice of sensors allowing measurements ranging from a few milliamperes (MN93A) to several
kiloamperes (AmpFlex
The device is compact and impact resistant.
The ergonomics and simplicity of its interface make using it pleasant.
The C.A 8436 is intended for the technicians and engineers of electrical installation and network inspection and maintenance teams.
2.1.1. MEASUREMENT FUNCTIONS
The principal measurements made are:
The RMS values of AC voltages up to 1000 V between terminals. By using the ratios, the device can measure voltages up to
hundreds of gigavolts.
The RMS values of AC currents up to 10,000 amperes (neutral included). By using the ratios, the device can measure currents
up to hundreds of kiloamperes.
The DC components of voltages and currents (neutral included).
Minimum and maximum half-cycle RMS voltage and current values (excluding neutral).
Peak voltage and current values (neutral included).
The frequency of 50 Hz and 60 Hz networks.
Current and voltage peak factors (neutral included).
Calculation of the harmonic loss factor (FHL), application to transformers in the presence of harmonic currents.
Calculation of the K factor (KF), application to transformers in the presence of harmonic currents.
Measurement of total harmonic distortion with respect to the fundamental (THD in % f) of the current and of the voltages (ex-
cluding neutral).
Measurement of the total harmonic distortion with respect to the RMS AC value (THD in % r) for the current and the voltages
(neutral included)
Active, reactive (capacitive and inductive), non-active, distortion, and apparent power, by phase and cumulative (excluding
neutral).
Power factor (PF) and displacement factor (DPF or cos Φ) (excluding neutral).
Measurement of the RMS distortion value (d) for the current and the voltages (excluding neutral).
Short-term voltage icker (PST) (excluding neutral).
Measurement of the long-term icker of the voltages (PLT) (excluding neutral).
Active, reactive (capacitive and inductive), non-active, distortion, and apparent energy (excluding neutral).
Current and voltage harmonics (excluding neutral) up to order 50: RMS value, percentage referred to the fundamental, (%f)
(excluding neutral), or the total RMS value (%r), minimum and maximum and sequence harmonics.
Apparent harmonic powe up to order 50 (excluding neutral): percentages referred to the fundamental apparent power (%f) or
the total apparent power (%r), minimum and maximum of a rank.
Inrush currents, starting of motors.
®
).
8

2.1.2. DISPLAY FUNCTIONS
Display of waveforms (voltages and currents).
Display of frequency bar chart (voltages and currents).
Inrush Current function: displays parameters useful for study of the starting of a motor.
Instantaneous current and voltage at the instant designated by the cursor.
Maximum instantaneous absolute value of the current and of the voltage (over the entire starting time).
RMS value of the half-cycle (or lobe) of the current and voltage (excluding neutral) on which the cursor is positioned.
Maximum half-cycle RMS current (over the entire starting time).
Instantaneous network frequency at the instant designated by the cursor.
Maximum, mean, and minimum network frequencies (over the entire starting time).
Time at which starting of motor commenced.
Screen captures (50 maximum).
Transients function. Detection and recording of transients (up to 210) between user-dened start and stop dates and times.
Recording of 4 complete cycles (one before the triggering event and three after) in the 8 acquisition channels.
Trend recording (data logging) function. 2GB memory with date-stamping and user-dened start and stop dates for recording,
with a maximum of 100 recordings. Display, in bar chart or curve form, of the means of many parameters vs. time, with or
without minima and maxima.
Alarm function. List of recorded alarms (up to 16,362) exceeding thresholds dened in the conguration menu. User-dened
alarm monitoring start and stop times.
2.1.3. CONFIGURATION FUNCTIONS
Date and time setting.
Screen brightness setting.
Choice of curve colours.
Choice of management of switching off of the screen.
Choice of display in night mode.
Choice of calculation methods (non-active quantities broken down or not, choice of the unit of energy, choice of the coefcients
of calculation of the K factor, choice of reference for the level of harmonics, PLT calculation (sliding or not).
Choice of distribution system (single-phase, two-phase, three-phase with or without neutral) and of the connection method
(standard, 2-element method or 2½-element method).
Conguration of recording, alarms, inrush currents, and transients.
Erasure of data (total or partial).
Display of software and hardware version numbers.
Choice of language.
Display of current sensors detected not detected, not managed, simulated or impossible to simulate (2-element connection
method) . Setting of voltage and current ratio, of the transduction ratios and of the sensitivity.
9
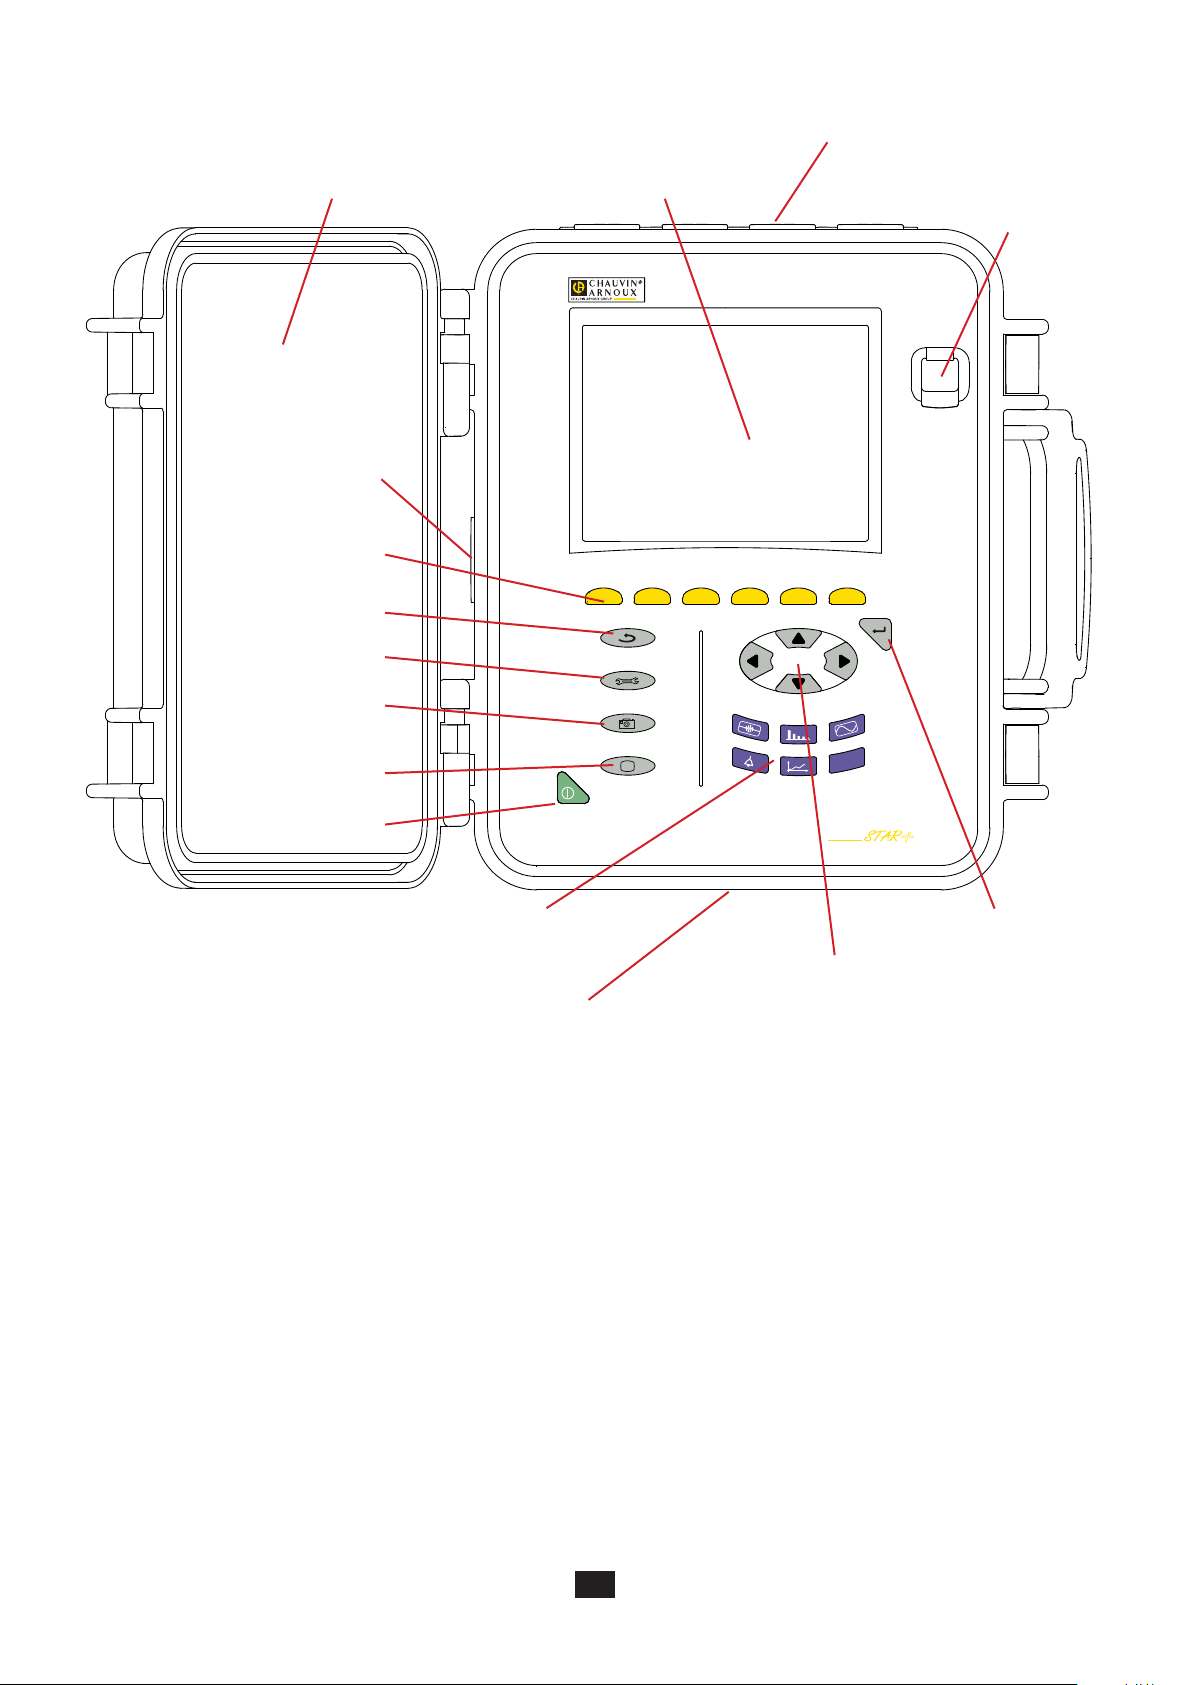
2.2. OVERALL VIEW
Measurement connection terminals
Cover
Battery charging
connector
Function keys
(yellow keys)
Return /previous key
Conguration key
Screen snapshot key
Display
C.A 8436
POWER & QUALITY ANALYSER
USB socket
Help key
On/Off switch
?
Mode keys
(violet keys)
Battery compartment and
memory card slot cover
Figure 1: Overall view of C.A 8435
W
QUALI
STAR
Navigation keys
+
Conrm/Enter key
10

2.3. ON/OFF SWITCH
The device can operate either on its battery or on mains power. Pressing the button powers up the device. . If the device is shut
off suddenly (line power outage in the absence of the battery) or automatically (battery low), an information message is displayed
when it is next started up.
Pressing the switch again turns the device off. If the device is recording, metering energy, or searching for transients, alarms,
and/or inrush current acquisition, it requests conrmation.
Select Yes or No on the corresponding yellow keys, then press the key to validate.
If No is selected, recording will continue.
If Yes is selected, the data recorded until that point are nalized and the device is turned off.
2.4. DISPLAY
2.4.1. PRESENTATION
The backlit 320x240 (1/4 VGA) pixel graphic TFT displays all measurements with their curves, the parameters of the unit, the
curves selected, the instantaneous values of the signals, and the type of measurement selected. When the device is powered up,
it automatically displays the Waveform screen. Information about this screen can be found in §7.
Reminder of the mode.
Active mode screen.
Function keys.
Figure 2: example of a display screen
The management of switching off of the screen is chosen by the user in the Display Conguration Mode menu (see §4.4.3).
Battery charge level.
Current date and time.
Frequency calculated over one second.
11

2.4.2. THE FUNCTION KEY ICONS
The display uses the following icons for the yellow function keys:
Icons Designation
V Phase-to-neutral voltage mode.
A Phase-to-neutral current mode.
S Power mode.
U Phase-to-phase voltage mode.
var Management of the breakdown of the non-active
quantities.
Wh Choice of unit of energy.
FK Choice of coefcients of the K factor.
%f-%r Choice of reference for the level of harmonics
of the phases.
PLT Management of the long-term icker calculation
mode.
CF Display of the peak factors and of the curves.
RMS Display of the RMS values and of the curves.
PEAK Display of the PEAK values and of the curves.
THD Display of the level of harmonic distortion and
of the curves
PF… Display of PF, cos
W… Display of powers and of the associated quantities
(PF, cos
Wh… Display of the energy meters.
Activation and de-activation of the energy calculation.
Zoom in.
Φ, DPF, tan Φ and ΦVA).
Φ (DPF), tan Φ, and Φ.
Icons Designation
Move the cursor to the rst occurrence of the
maximum phase-to-neutral voltage.
Move the cursor to the rst occurrence of the
minimum phase-to-neutral voltage.
Move the cursor to the rst occurrence of the
maximum phase-to-phase voltage.
Move the cursor to the rst occurrence of the
minimum phase-to-phase voltage.
Move the cursor to the rst occurrence of the
maximum current.
Move the cursor to the rst occurrence of the
minimum current.
Move the cursor to the rst occurrence of the
maximum instantaneous frequency.
Move the cursor to the rst occurrence of the
minimum instantaneous frequency.
Move the cursor to the rst occurrence of the
maximum of the measurement displayed.
Move the cursor to the rst occurrence of the
minimum of the measurement displayed.
Simultaneous display of all voltage and current
measurements (RMS, DC, THD, CF, PST, PLT,
FHL, FK).
Select all items.
Unselect all items.
Zoom out.
Management of the contrast.
Choice of colours of the measurement channels.
Management of the switching off of the screen
Display in night mode.
Recording programming mode.
Recording look-up mode.
Start of recording.
Rapid programming and start of recording.
Disconnection of recording.
Shut down function in progress prompt.
Bin for deletions of elements.
Shortcut to the recording parameterizing mode
Activate/deactivate selection of the transients list
display lter.
Display of mean values and extrema.
Transient mode.
Inrush current mode.
Display of Fresnel diagram of the signals.
>t=0< Move cursor to transient triggering time.
>t=-T< Move the cursor to one signal period before the
triggering date of the transient.
Energies consumed by the load.
Energies generated by the load.
Page screen 1 of the help function.
Page screen 2 of the help function.
Page screen 3 of the help function.
Page screen 4 of the help function.
Previous conguration.
Next conguration.
Previous page screen.
Next page screen.
12

2.5. KEYPAD KEYS
2.5.1. FUNCTION KEYS (YELLOW KEYS)
These 6 keys activate the function or tool represented by the corresponding icon on the screen.
2.5.2. NAVIGATION KEYS
A block of 4 arrow keys, a select key and a return key are used for navigation in the menus.
Item Function
2.5.3. MODE KEYS (VIOLET KEYS)
These give access to specic modes:
Item Function See
Up direction or navigation key.
Down direction or navigation key.
Right direction or navigation key.
Left direction or navigation key.
Conrms the selection.
Return key.
Waveform acquisition mode, with two sub-modes: transients mode (blackouts, interference, etc.)
and inrush current mode (starting of motor).
Harmonic curves display mode: representation of voltage, current, and power harmonics, order
by order; determination of harmonic currents produced by nonlinear loads, analysis of problems
caused by harmonics according to their order (overheating of neutrals, conductors, motors, etc.).
Display of voltage and current waveforms, display of minima and maxima of summary tables,
determination of phase rotation.
Alarm mode: list of recorded alarms exceeding the thresholds programmed in the conguration;
recording of network blackouts with half-cycle resolution (Vrms, Arms, Urms), determination of
energy consumption overshoots, monitoring of compliance with a power supply quality contract.
Trend mode: recording of the parameters selected in the Conguration menu. § 9
§ 5
§ 6
§ 7
§ 8
Display of power and energy measurements § 10
Three keys are real-time mode keys:
In each of these modes, the coloured circles on a white ground , in which the channel numbers or types are entered, are indica-
tors of saturation: the ground of the circle is coloured when the channel measured is potentially full
When the identication disc corresponds to a simulated channel (for example in 4-wire three-phase with selection V1V2, 2½-element method, or in 3-wire three-phase with selection A1A2, 2-element method; see connections in §4.6), this channel is potentially
full if at least one channel used in calculating it is potentially full.
Similarly, if the saturation disc corresponds to a phase-to-phase voltage channel, it is potentially full if at least one of the phaseto-neutral voltage channels used in calculating it is potentially full.
, and .
.
13

2.5.4. OTHER KEYS
The other keys have the following functions:
Item Function See
Conguration key. § 4
Snapshot of current screen and retrieval of screens already stored. § 11
Help key: provides information about the functions and the symbols used for the current display
§ 12
mode.
2.6. CONNECTORS
2.6.1. CONNECTION TERMINALS
These are located on one side of the housing. Each terminal is protected by a plug. The plugs must be removed to connect the
leads, then stowed in the pouch in the cover of the device.
In order to keep the device water- and air-tight and the terminals clean, put the plugs back on the unused terminals.
The terminals let the operator:
screw special leads in place to ensure total water-tightness
or to connect standard leads that are slightly less water-tight.
4 current input terminals for cur-
N/D
L3/C
L2/B L1/A
rent sensors (MN clamp, C clamp,
MiniFlex
E3N clamp, etc.).
®
, AmpFlex®, PAC clamp,
N/D L3/C
L2/B L1/A
Figure 3: the connection terminals
5 voltage input terminals.
E/GN
14
2.6.2. SIDE CONNECTORS
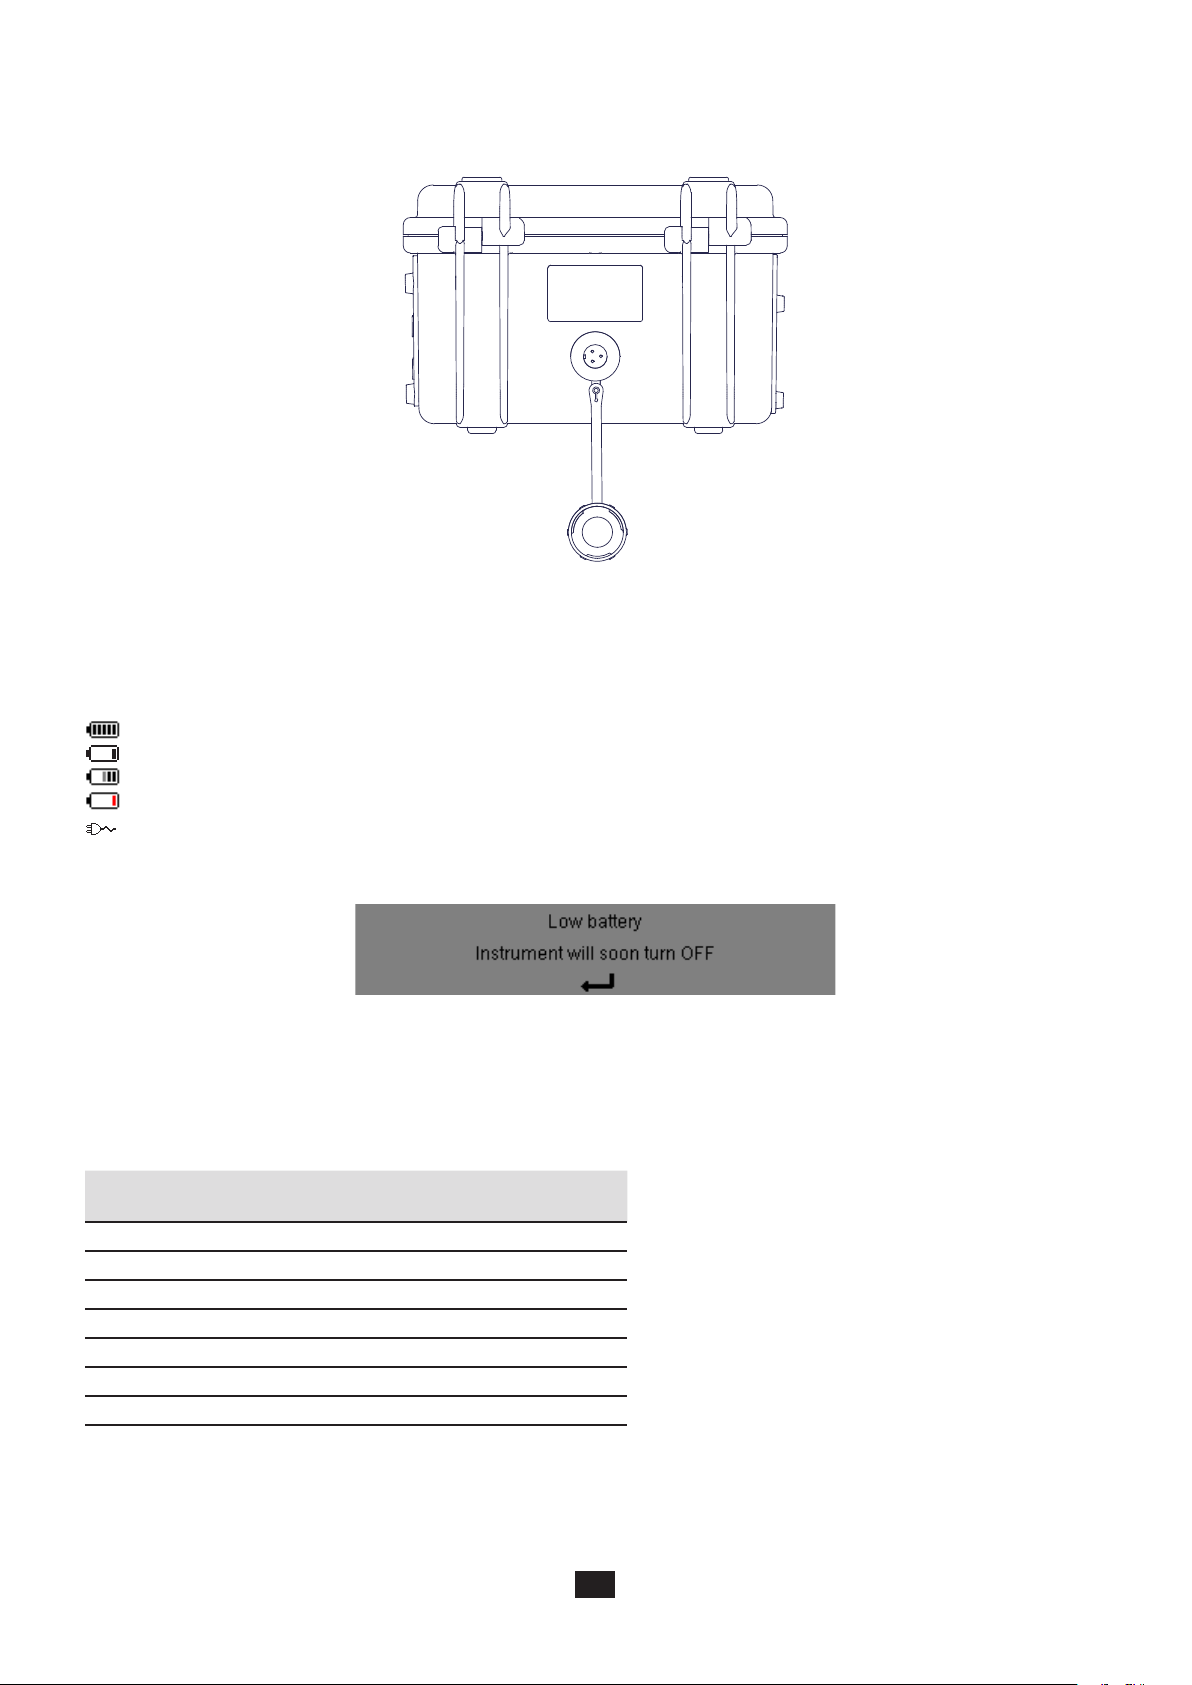
On the right side of the instrument is the connector used to charge the battery and operate the instrument on mains power, or to
supply it from the voltages on the measurement terminals.
Figure 4: the side connector
2.7. POWER SUPPLY
The battery icon in the top right corner of the screen shows the battery level. The number of bars is proportional to the charge level.
Battery charged.
Low battery.
Mobile bars: battery charging.
A red bar: the condition of the battery is unknown because it has never been fully charged.
The device is connected to mains without the battery.
When the battery level is too low, the following message is displayed:
Press
to conrm the information. If you do not connect the device to mains, it switches itself off one minute after this message.
It is therefore necessary to start charging it as soon as possible.
2.8. ABBREVIATIONS
Prexes of International System (SI) units
Prex Symbol Multiplies by
milli m 10
kilo k 10
Mega M 10
Giga G 10
Tera T 10
Peta P 10
Exa E 10
-3
3
6
9
12
15
18
15

Meanings of the symbols and abbreviations used:
Symbol Designation
AC and DC components.
AC component only.
DC component only.
Inductive phase shift.
Capacitive phase shift.
° Degree.
-.+ Expert mode.
| | Absolute value.
Σ
Sum of values.
% Percentage.
%f Fundamental value as reference
%r Total value as reference
ΦVA or Φ
Phase shift of voltage with respect to current.
UA
A Current; also Ampere (unit).
A-h Current harmonic.
Acf Crest (peak) factor of current.
Ad RMS distortion current.
Adc DC current.
Apk+ Maximum peak value of the current.
Apk- Minimum peak value of the current.
Arms True RMS current.
Athdf Total harmonic distortion of current in % f.
Athdr Total harmonic distortion of current in % r.
Aunb Negative-sequence current unbalance rate.
AVG Mean value (arithmetic mean).
CF Peak factor (current or voltage).
cos Φ Cosine of the phase shift of voltage with respect
to current (DPF – fundamental power factor or
displacement factor).
DC DC component (current or voltage).
DPF Displacement factor (cos Φ).
FHL Harmonic loss factor.
FK K factor.
Hz Frequency of network studied.
L Channel (Line).
MAX Maximum value.
MIN Minimum value.
ms Millisecond.
PEAK
or PK
Maximum (+) or minimum (-) peak instantaneous
value of the signal.
PF Power factor.
PLT Long-term icker.
PST Short-term icker.
RMS True RMS value (current or voltage).
Symbol Designation
t Relative date of time cursor.
tan Φ Tangent of the phase shift of voltage with respect
to current.
THD Total harmonic distortion (in %f or in %r).
U Phase-to-Phase voltage.
U-h Phase-to-phase voltage harmonic.
Ucf Phase-to-Phase voltage crest factor.
Ud Phase-to-phase RMS distortion voltage.
Udc Phase-to-phase DC voltage.
Upk+ Maximum peak value of the phase-to-phase voltage.
Upk- Minimum peak value of the phase-to-phase voltage.
Urms True RMS phase-to-phase voltage.
Uthdf Total phase-to-phase voltage harmonic distortion
in %f.
Uthdr Total phase-to-phase voltage harmonic distortion
in %r.
Uunb Negative-sequence phase-to-phase voltage
unbalance rate.
V Phase-to-neutral voltage; also Volt (unit)
V-h Phase-to-neutral voltage harmonic.
S Apparent power.
S-h Apparent harmonic power.
D Distortion power.
Dh Distortion energy.
Sh Apparent energy.
Q
Reactive power (fundamental).
1
N Non-active power
Q1h Reactive energy (fundamental).
Nh Non-active energy.
Vcf Peak factor of the phase-to-ground voltage.
Vd Phase-to-neutral RMS distortion voltage.
Vdc Phase-to-neutral DC voltage.
Vpk+ Maximum peak value of the phase-to-neutral
voltage.
Vpk- Minimum peak value of the phase-to-neutral
voltage.
Vrms True RMS phase-to-neutral voltage.
Vthdf Total harmonic distortion of phase-to-neutral
voltage in %f.
Vthdr Total harmonic distortion of phase-to-neutral
voltage in %r.
Vunb Negative-sequence phase-to-ground voltage
unbalance rate.
P Active power.
Pdc DC power.
Pdch DC energy.
Ph Active energy.
16
3. USE
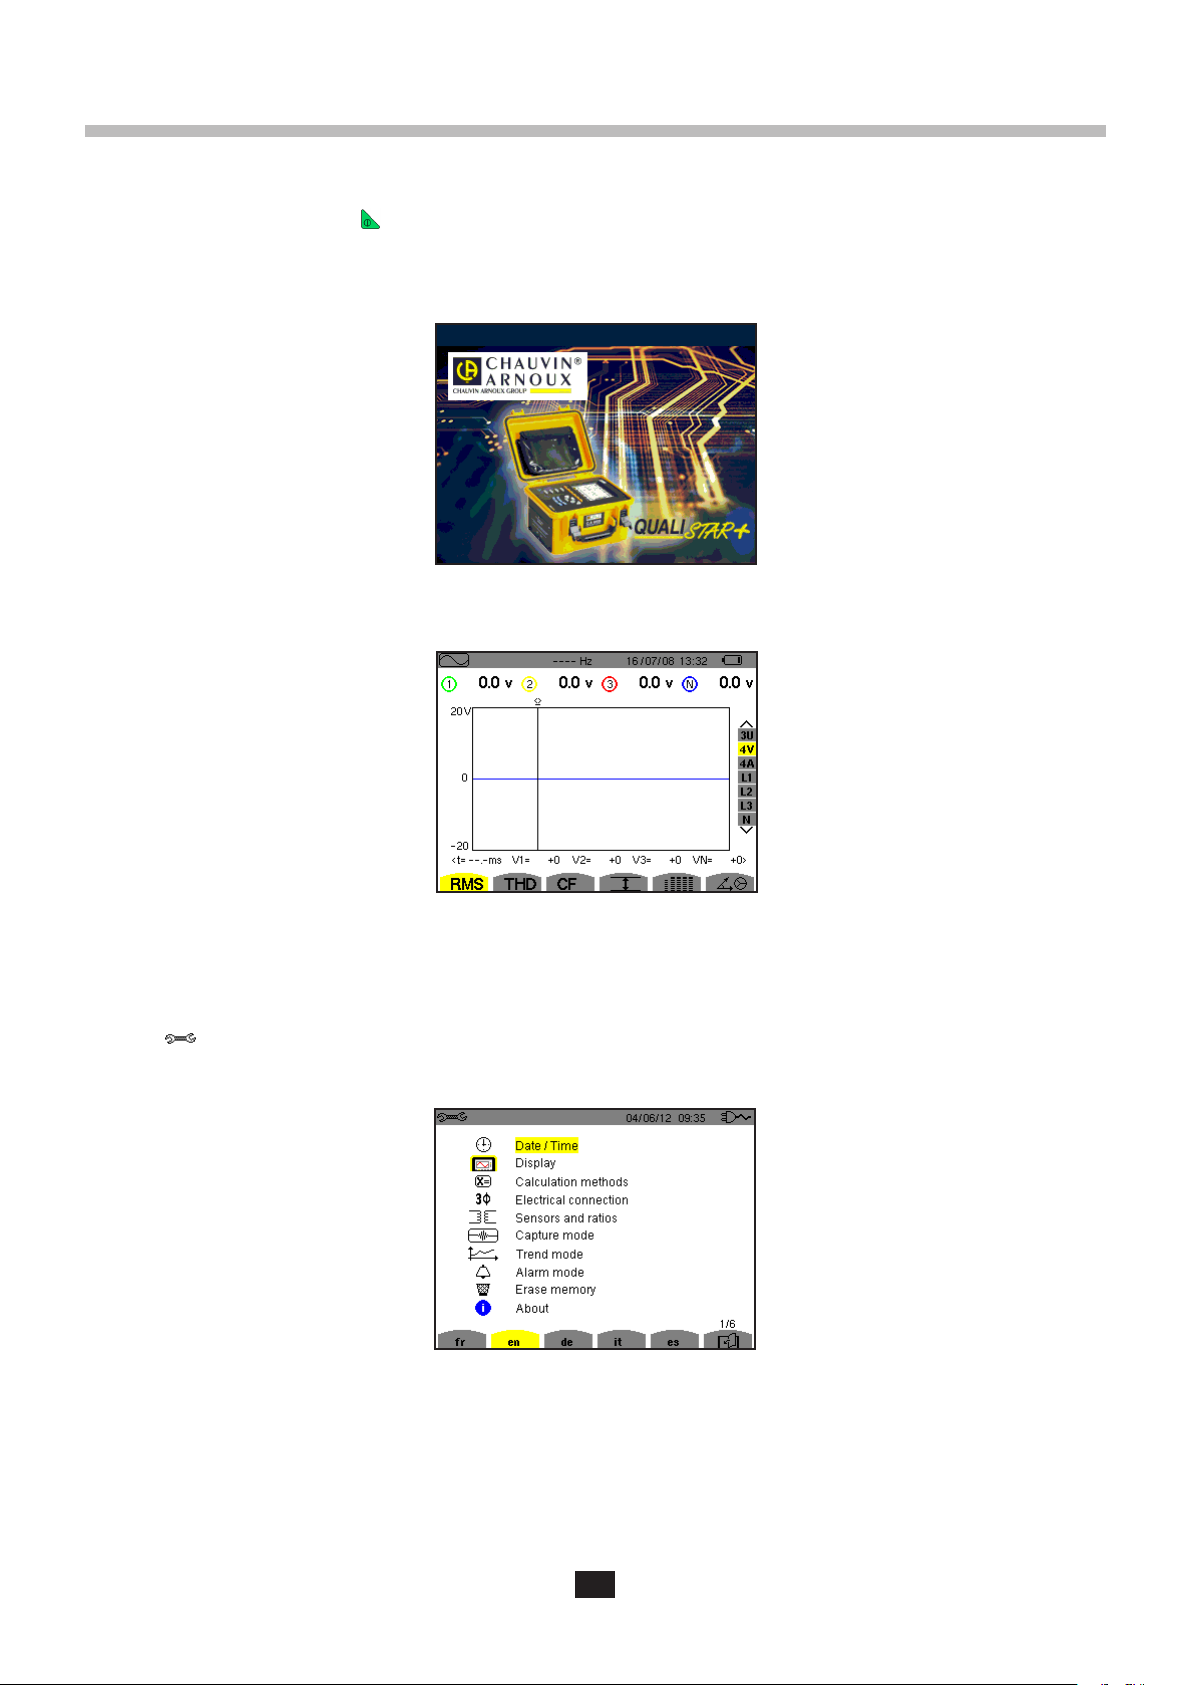
3.1. START-UP
To switch the device on, press the button.
After the software check, the home page is displayed, then the information screen that indicates the software version of the device
and its serial number.
Figure 5: Home page at start-up
Then the Waveform screen is displayed.
Figure 6: Waveform screen
3.2. CONFIGURATION
To congure the device, proceed as follows:
Press . The conguration screen appears.
Press or to select the parameter to be modied. Press to enter the selected sub-menu.
Figure 7: Conguration screen
Then use the arrow keys ( or and or ) and the key to validate. For more details, see §§4.3 to 4.10.
17

The following points must be checked or adapted for each measurement:
Dene the parameters of the calculation methods (see §4.5).
Select the distribution system (single-phase to ve-wire three-phase) and the connection method (2 wattmeters, 2 ½ elements,
standard) (see §4.6).
Program the current ratios according to the type of current sensor connected (see §4.7).
Program the voltage ratios (see §4.7).
Dene the triggering levels (transients mode and inrush current capture) (see §4.8).
Dene the values to be recorded (trend mode) (see §4.9).
Dene the alarm thresholds (see §4.10).
To return to the Conguration screen from a sub-menu, press the key.
3.3. INSTALLATION OF LEADS
To identify the leads and input terminals, you may mark them in accordance with the usual phase/neutral colour code using the
coloured rings and inserts supplied with the device.
Detach the insert and place it in the hole provided for it near the terminal (large insert for a current terminal; small insert for a
voltage terminal).
L3/C
N/D
L2/B L1/A
N/D L3/C
Large insert for
current terminal.
L2/B L1/A
E/GN
Small insert for
voltage terminal.
Rings the same colour as
the terminal.
Figure 8: identication of the leads
Clip rings of the same colour to the ends of the lead you will be connecting to the terminal.
Twelve sets of rings and inserts of different colours are provided to enable you to harmonize the device with any of the phase/
neutral colour codes in force.
Connect the measurement leads to the terminals of the device:
Remember to dene the transformation ratios of the current sensors and of the voltage inputs (see §4.7).
To make a measurement, you must program at least:
the calculation method (see §4.5),
the connection (see §4.6)
and the ratios of the sensors (see §4.7).
18
The measuring leads must be connected to the circuit to be measured as shown by the following diagrams.
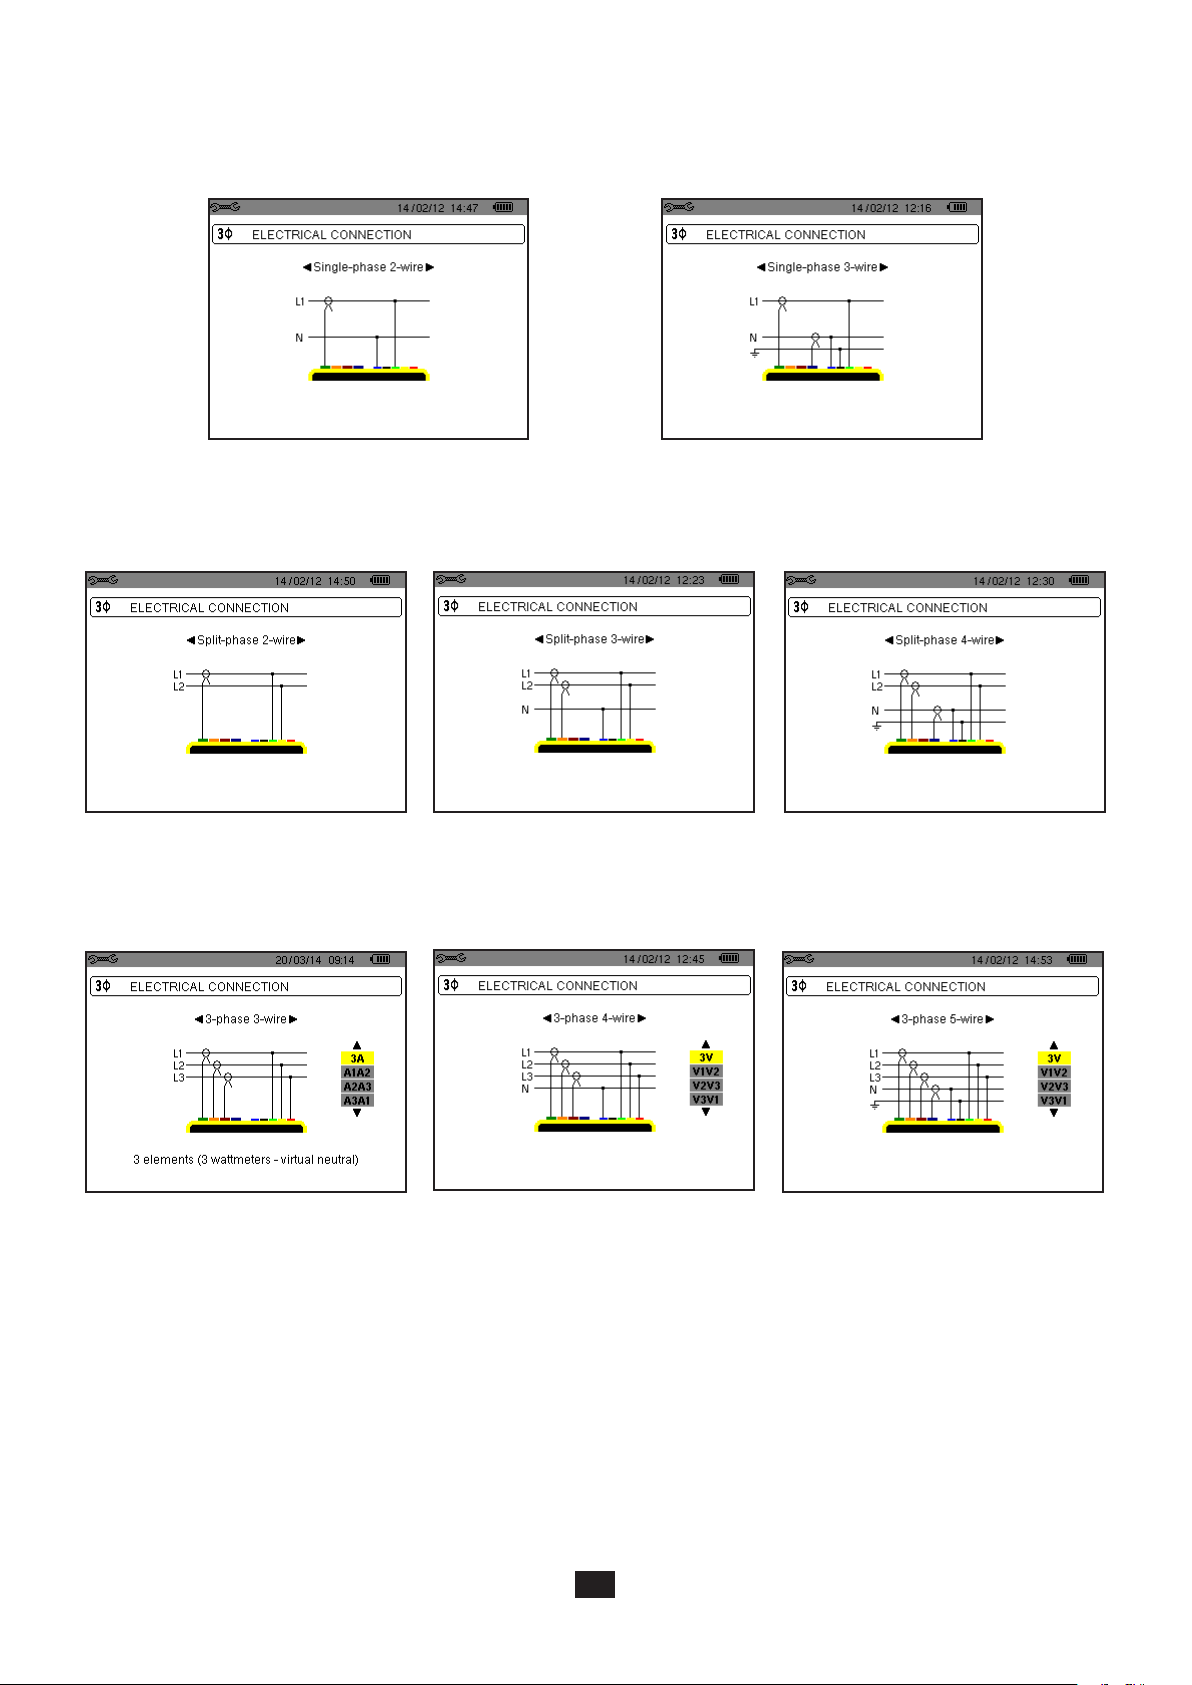
3.3.1. SINGLE-PHASE NETWORK
Figure 9: 2-wire single-phase connection Figure 10: 2-wire single-phase connection
3.3.2. SPLIT-PHASE NETWORK
Figure 11: 2-wire split-phase connection Figure 12: 3-wire split-phase connection Figure 13: 4-wire split-phase connection
3.3.3. THREE-PHASE NETWORK
Figure 14: 3-wire three-phase
connection
In the case of a three-phase network, you are not obliged to connect all of the terminals in voltage or in current.
For 3-wire three-phase, indicate the current sensors that will be connected: all 3 sensors (3A) or only 2 (A1 and A2, or A2 and A3,
or A3 and A1).
For 4- and 5-wire three-phase, indicate the voltages that will be connected: all 3 voltages (3V) or only 2 (V1 and V2, or V2 and
V3, or V3 and V1).
Figure 15: 4-wire three-phase
connection
Figure 16: 5-wire three-phase
connection
19

3.3.4. CONNECTION PROCEDURE
Switch the instrument on.
Congure the device for the measurement to be made and the type of network concerned (see §4),
Connect the leads and current sensors to the unit.
Connect the earth and/or neutral lead to the network earth and/or neutral (when it is distributed) and connect the corresponding
current sensor,
Connect the L1 phase lead to the network L1 phase and connect the corresponding current sensor.
If applicable, repeat the procedure for phases L2 and L3 and for N.
Note: complying with this procedure reduces connection errors to a minimum and avoids wasting time.
Disconnection procedure:
Proceed in the reverse of the order of connection, always nishing by disconnecting the neutral (when distributed).
Disconnect the leads and switch the device off.
3.4. FUNCTIONS OF THE DEVICE
Any screen can be saved (screen snapshot) by pressing the key for 3 seconds (see §11).
You can press the help key at any time. The help screen will inform you about the functions and the symbols used for the
current display mode.
3.4.1. WAVEFORM CAPTURE
With the device powered up and connected to the network, press .
You can display the Transients mode (see §5.1) or the Inrush current mode (see §5.2).
3.4.2. DISPLAY OF HARMONICS
With the device powered up and connected to the network, press .
You can display the phase-to-neutral voltage (see §6.1), the current (see §6.2), the apparent power (see §6.3) or the phase-tophase voltage (see §6.4).
3.4.3. WAVEFORM MEASUREMENTS
With the device powered up and connected to the network, press .
You can display the measurements of the true RMS value (see §7.1), the measurements of the total harmonic distortion (see §7.2),
the measurements of the peak factor (see §7.3), the extreme values in voltage and current (see §7.4), several values at once (see
§7.5), or the Fresnel diagram (see §7.6).
3.4.4. ALARM RECORDING
With the device powered up and connected to the network, press .
You can congure the alarm mode (see §8.1), program an alarm campaign (see §8.2), look it up (see §8.4), or erase it (see §8.6).
3.4.5. RECORDING
With the device powered up and connected to the network, press .
You can congure recordings (see §9.2) and program them (see §9.1). You can also look up or erase recordings (see §4.11).
3.4.6. ENERGY MEASUREMENTS
With the device powered up and connected to the network, press .
You can measure the energies consumed (see §10.1.3) or generated (see §10.1.4, §10.2.2, or §10.3.2).
20

4. CONFIGURATION
The Conguration key is used to congure the device. This must be done before each new type of measurement. The conguration remains in memory, even after the device is switched off.
4.1. CONFIGURATION MENU
The arrow keys (,, , ) are used to navigate in the Conguration menu and to parameterize the device.
A value that can be modied is anked by arrows.
Most of the time, conrmation (
The return key ( ) is used to return to the main menu from a sub-menu.
) is necessary for the changes made by the user to be applied.
Figure 8: the Conguration screen
4.2. DISPLAY LANGUAGE
To select the display language, press the yellow key under the corresponding icon on the screen (Figure 6).
The active language is identied by the icon on the yellow ground.
4.3. DATE/TIME
The menu denes the system date and time. The display is as follows:
Figure 17: Date/Time menu
With the Date/Time eld highlighted in yellow, press
press or . To conrm, press .
Proceed in the same way for the dating system (DD/MM/YY or MM/DD/YY) and the time system (12/24 or AM/PM). You see the
effect immediately in the display of the date.
To return to the Conguration menu, press .
Note: The date and time parameters cannot be congured while the device is recording, metering energy, or searching for tran-
sients, alarms, and/or inrush current acquisition.
. To change a value, press or . To move from one eld to another,
21
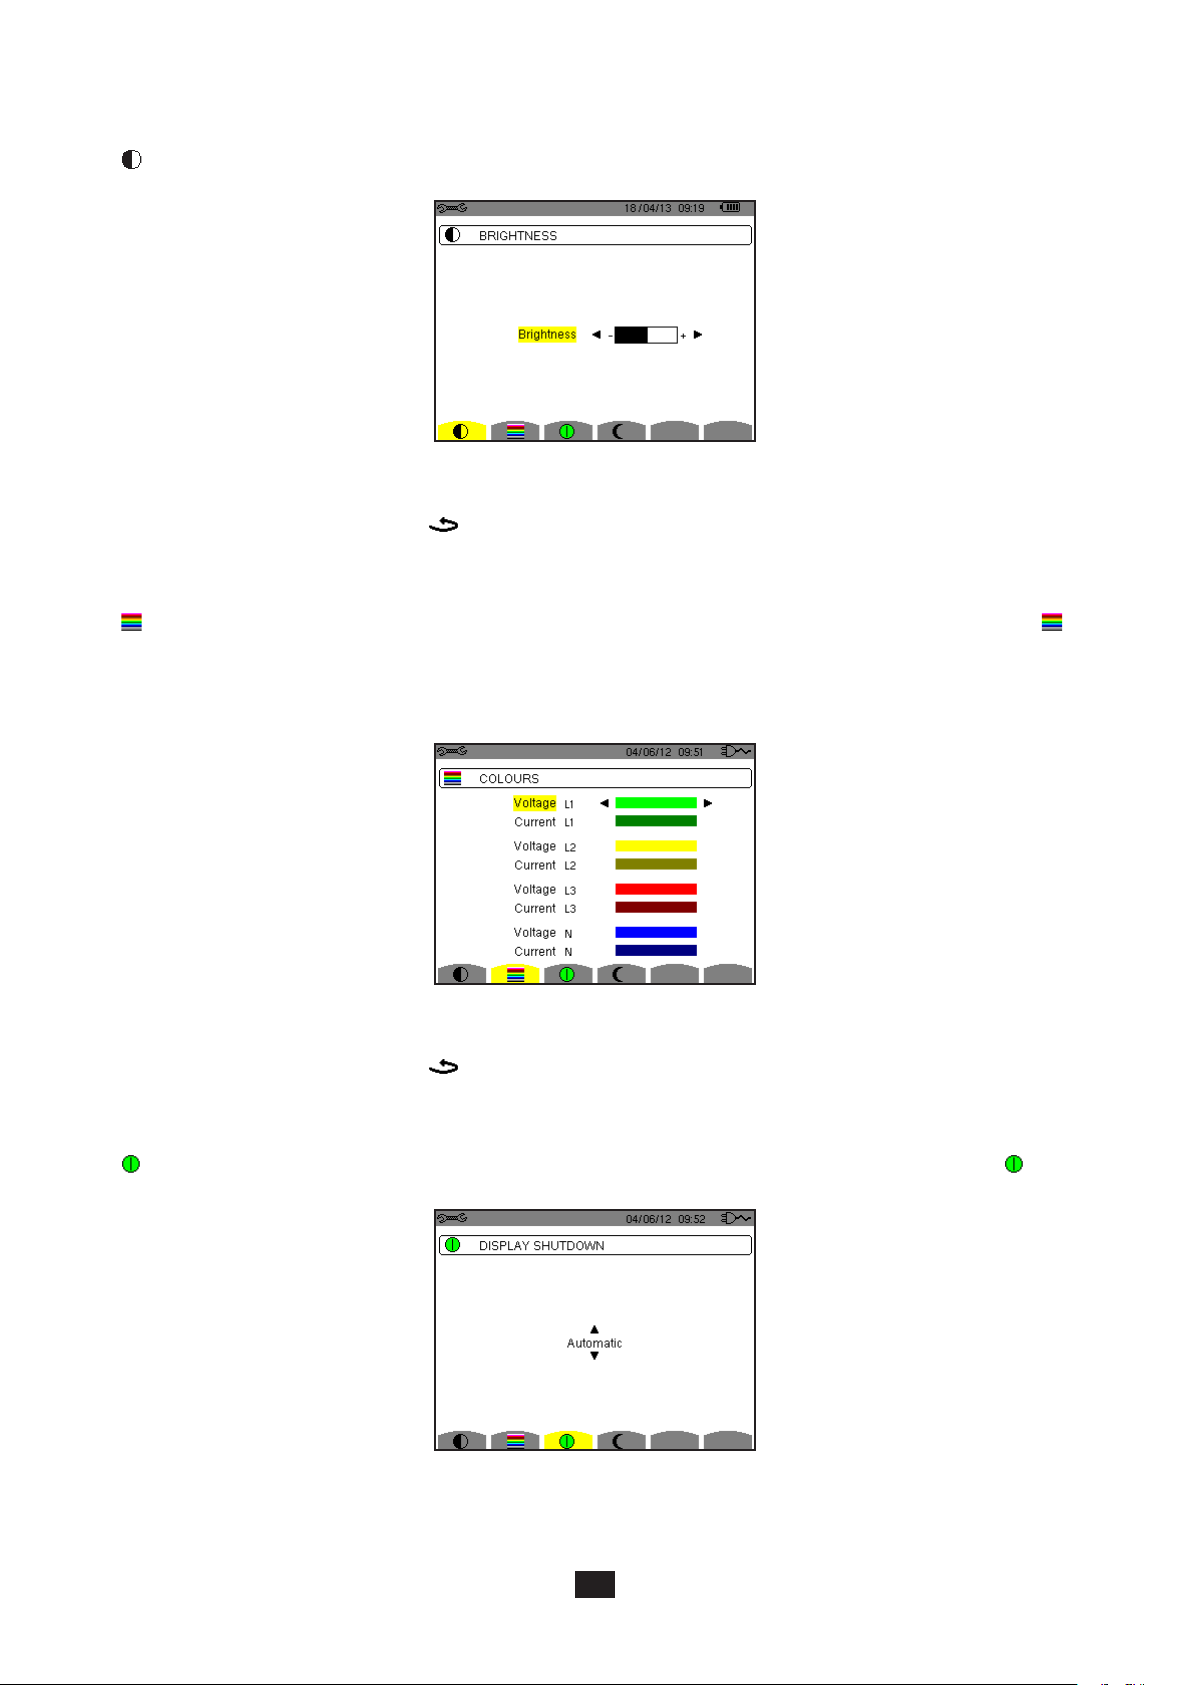
4.4. DISPLAY
4.4.1. BRIGHTNESS
The menu is used to dene the brightness of the display unit. The display is as follows:
Figure 18: the Contrast/Brightness menu
Use the keys (, ) to change the brightness.
To return to the Conguration menu, press .
4.4.2. COLOURS
The menu is used to dene the colours of the voltage and current curves. Press the yellow key corresponding to the icon.
There are 15 colours available: green, dark green, yellow, orange, pink, red, brown, blue, turquoise blue, dark blue, very light grey,
light grey, grey, dark grey, and black.
The display is as follows:
Figure 19: the Colours menu
Use the arrow keys (,, , ) to change the assignments of the colours.
To return to the Conguration menu, press .
4.4.3. MANAGEMENT OF THE SWITCHING OFF OF THE SCREEN
The menu denes the management of the switching off of the screen. Press the yellow key corresponding to the icon.
Figure 124: the Management of Switching off of the Screen menu
Use the arrow keys (,) to choose the screen switching off mode: Automatic or Never.
22
The Automatic mode is used to save the battery. The display screen is switched off automatically after ve minutes without action
X
=
on the keys if the device is powered only by its battery and if recording is in progress and after ten minutes if no recording is in
progress. The On/Off button blinks to indicate that the device is still in operation. Pressing any key on the keypad relights the
screen.
To return to the Conguration menu, press .
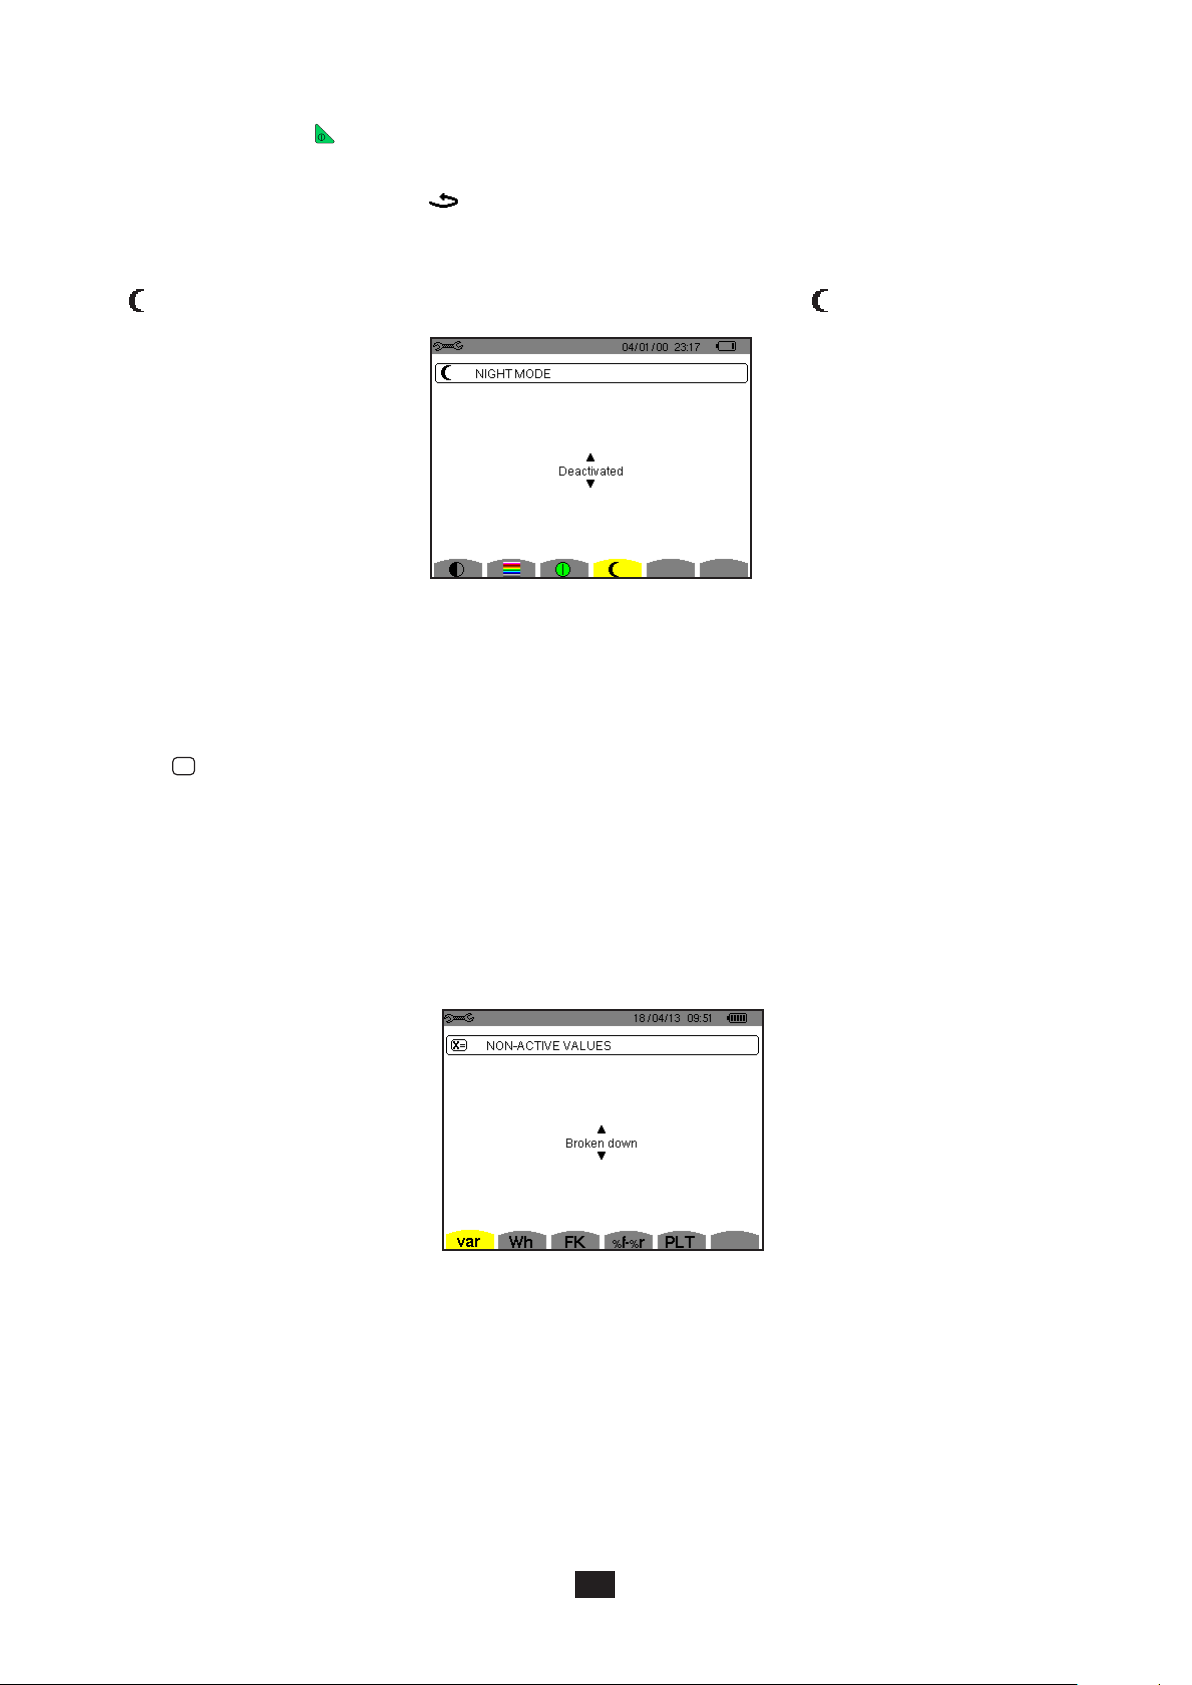
4.4.4. NIGHT MODE
The menu is used to change to night mode. Press the yellow key corresponding to the icon.
Figure 125: the night Mode menu
Use the navigation keys (,) to activate or deactivate night mode. The screen then changes to reverse video and all colours
are changed.
4.5. CALCULATION METHODS
The menu
The choice of breakdown or no breakdown of the non-active quantities,
The choice of unit of energy,
The choice of reference for the level of harmonics of the phases,
The choice of coefcients of calculation for the K factor,
The choice of method of calculation of the long-term icker.
4.5.1. CHOICE OF CALCULATION OF NON-ACTIVE QUANTITIES
The var menu is used to choose whether or not to break down the non-active quantities (powers and energies).
Use the arrow keys (,) to select broken down or not.
Broken down: Non-active power N is broken down into reactive power (fundamental) Q1 and distorting power D. Non-active
energy Nh is broken down into Q1h and Dh.
Not broken down: Non-active power N and non-active energy Nh are displayed.
denes:
Figure 20: the Methods of Calculation of Reactive Quantities menu
Then validate with the key. The device returns to the Conguration menu.
Note: The modication is impossible if the device is recording, metering energy, and/or searching for alarms.
23
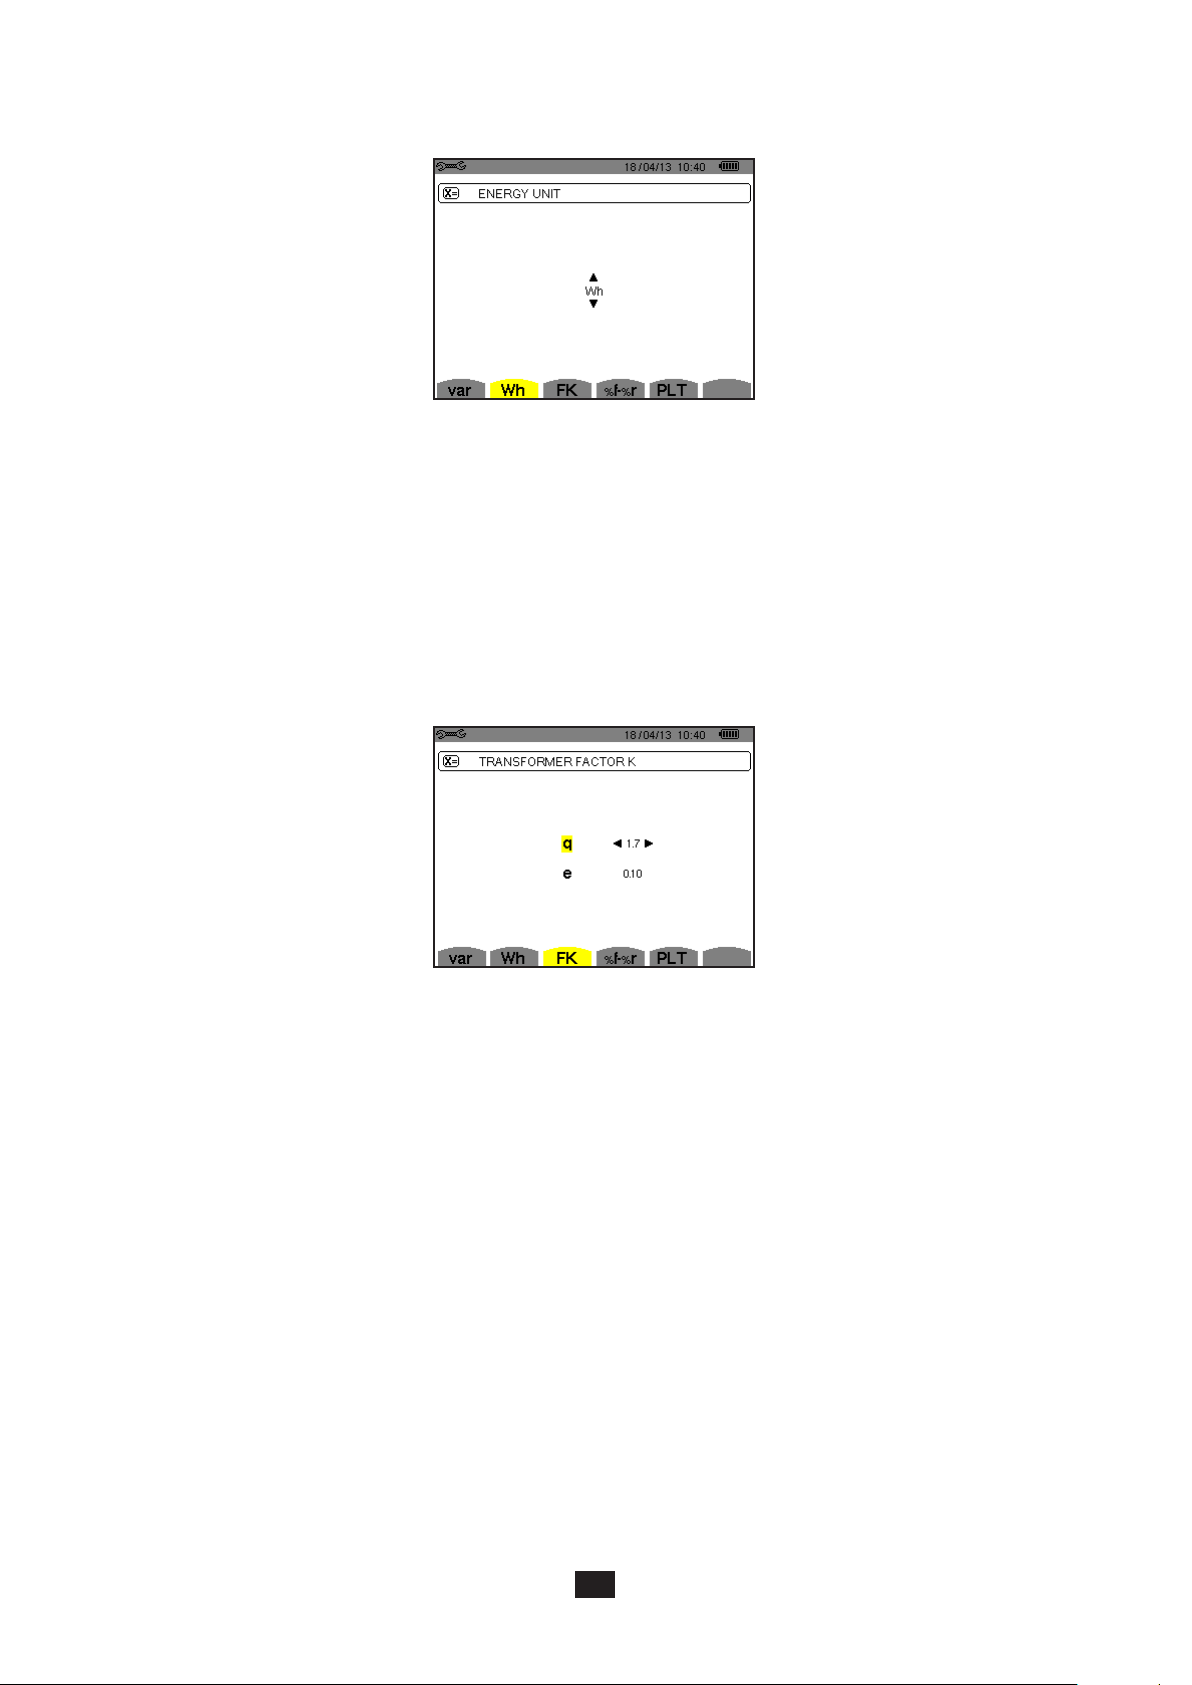
4.5.2. CHOICE OF UNIT OF ENERGY
The Wh menu denes the unit of display of energies.
Figure 21: the Choice of Unit of Energy menu
Use the arrow keys (,) to select the unit:
Wh : watt-hour.
J: joule.
toe (nuclear): nuclear tonne oil equivalent.
toe (non-nuclear): non-nuclear tonne oil equivalent.
BTU: British Thermal Unit.
Then validate with the key . The device returns to the Conguration menu.
4.5.3. CHOICE OF COEFFICIENTS OF CALCULATION OF THE K FACTOR
The FK menu denes the coefcients used for the calculation of the K factor.
Figure 22: the Choice of coefcients of calculation of the K factor menu
Use the arrow keys (,, , ) to x the value of coefcients q and e:
q: exponential constant that depends on the type of winding and the frequency.
The value of q can range from 1.5 to 1.7. The value of 1.7 is suitable for transformers having round or square conductors, in
all types of winding. The value of 1.5 is suitable for those in which the low-voltage windings are in tape form.
e: ratio between the losses linked to eddy currents (at the fundamental frequency) and resistive losses (both evaluated at the
reference temperature). The value of e can range from 0.05 to 0.1.
The default values (q = 1.7 and e = 0.10) are suitable for most applications.
Then validate with the key. The device returns to the Conguration menu.
Note: The modication is impossible if the device is recording and/or searching for alarms.
24
4.5.4. CHOICE OF REFERENCE OF THE LEVEL OF HARMONICS OF THE PHASES
The %f-%r menu denes the reference for the level of harmonics of the phases.
Figure 23: the Choice of Reference for the Level of Harmonics menu
Use the arrow keys (,) to x the reference for the level of harmonics:
%f: the reference is the value of the fundamental.
%r: the reference is the total value.
Then validate with the key. The device returns to the Conguration menu.
In the case of the level of harmonics of the V-h, A-h, and U-h phases, the fundamental and total values are RMS values. In the
case of the level of harmonics of the S-h phases, the fundamental and total values are apparent power values.
Note: The modication is impossible if the device is recording and/or searching for alarms.
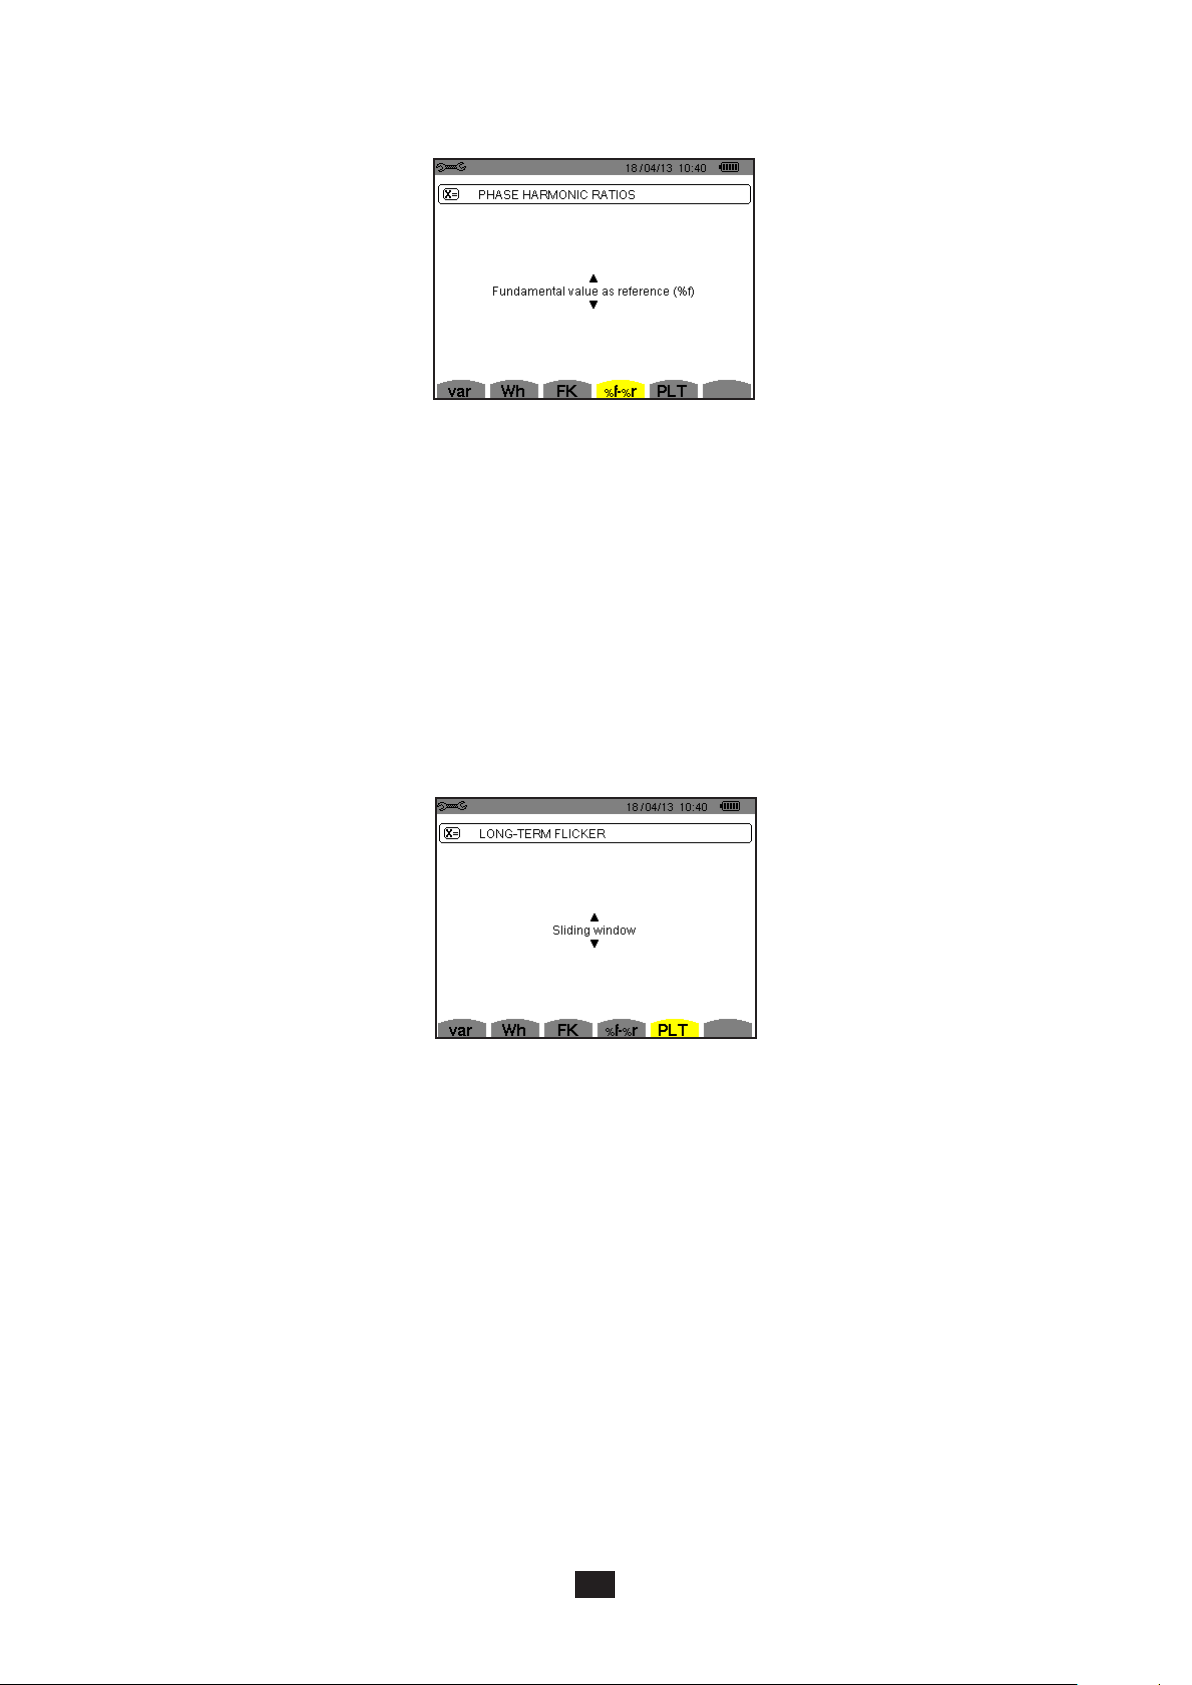
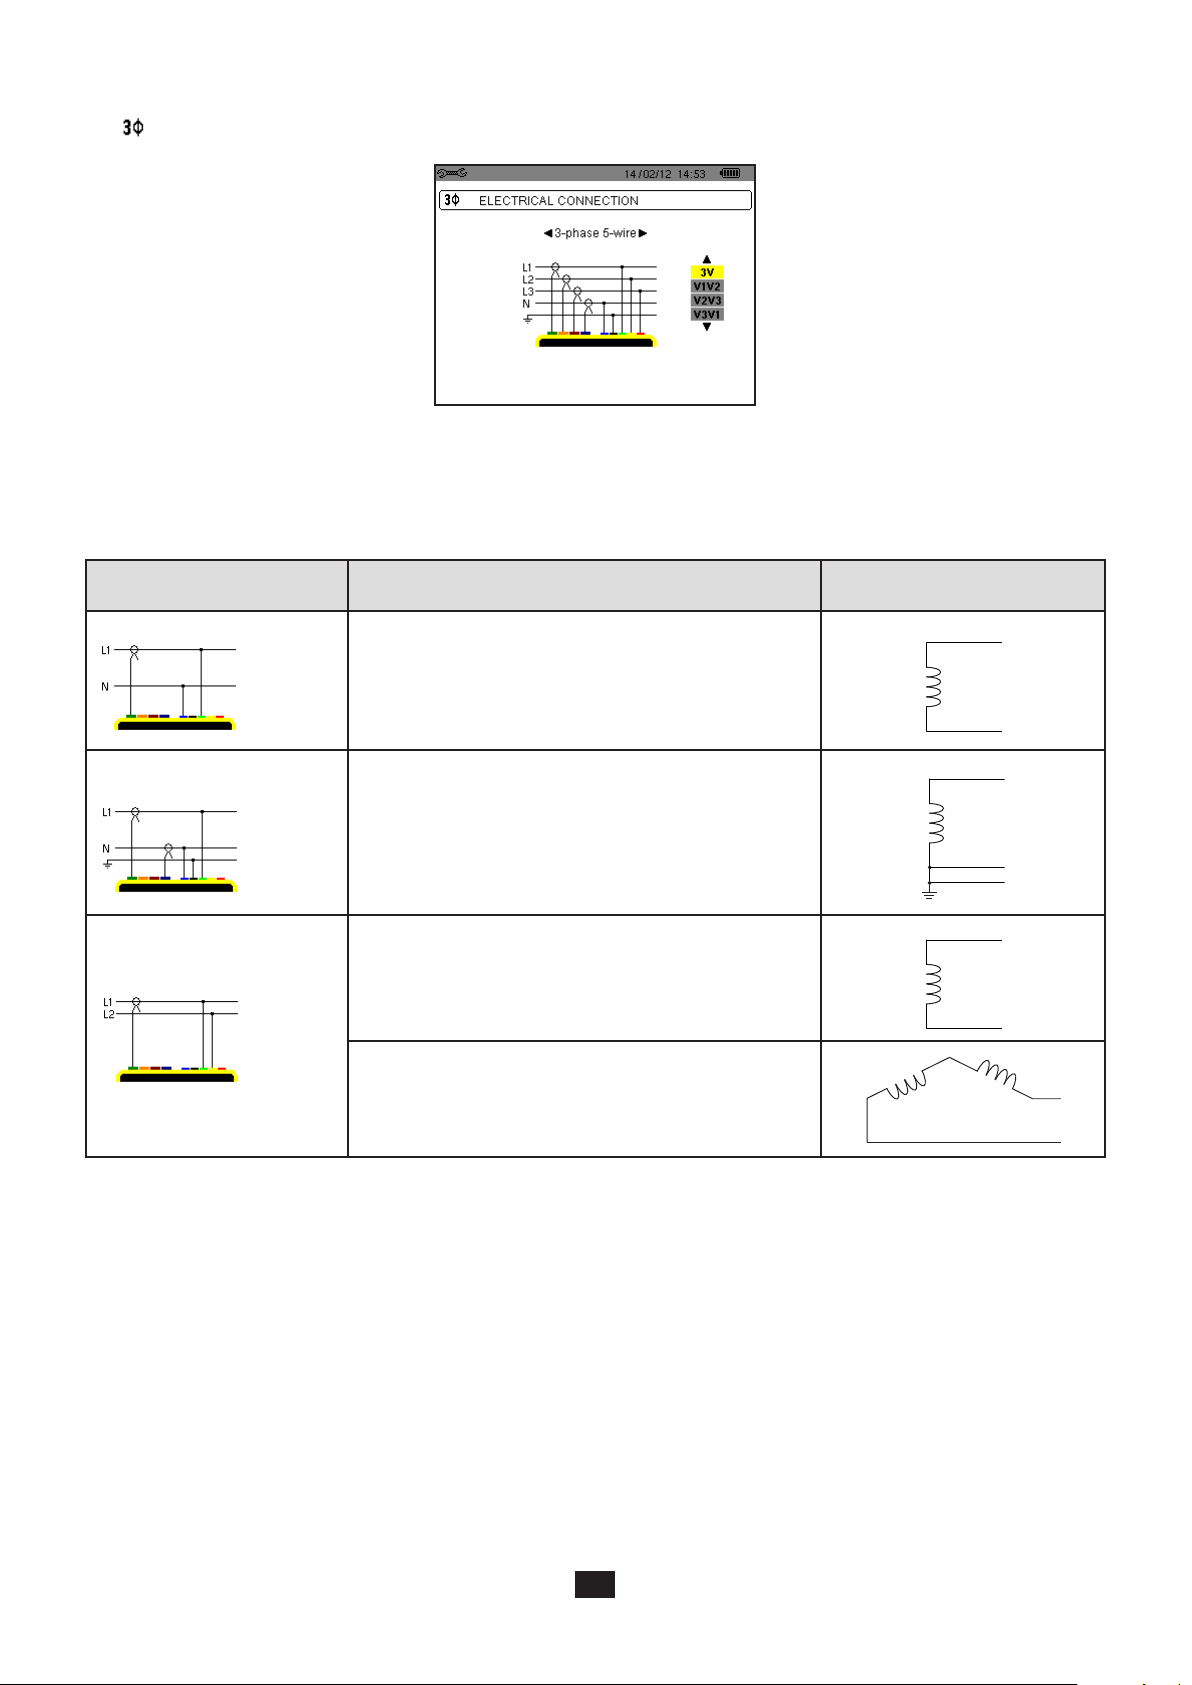
4.5.5. CHOICE OF METHOD OF CALCULATION OF PLT
The PLT menu denes the method used to calculate the PLT (long-term icker).
Figure 24: the Choice of Method of Calculation of PLT menu
Use the arrow keys (,) to choose sliding or non-sliding.
Sliding: the PLT is calculated every 10 minutes. The rst value is available 2 hours after the device is switched on, because it
takes 12 values of PST to calculate the PLT.
Non-sliding: the PLT is calculated every 2 hours.
Then validate with the key . The device returns to the Conguration menu.
Note: The modication is impossible if the device is recording and/or searching for alarms.
25
L1
L1
L1
4.6. CONNECTION
The menu is used to dene how the device is connected, according to distribution system.
Figure 16: the Connection menu
Several electrical diagrams can be selected:
Use the arrow keys (,, , ) to choose a connection.
One or more types of network correspond to each distribution system.
Distribution system Source
Single-phase 2-wire (L1 and N)
Single-phase 3-wire (L1, N and
earth)
Split-phase 2-wire (L1 and L2)
Single-phase 2-wire non-earthed neutral
Single-phase 3-wire earthed neutral
Split-phase 2-wire
3-phase open star 2-wire
N
N
GND
L2
L1
L2
26
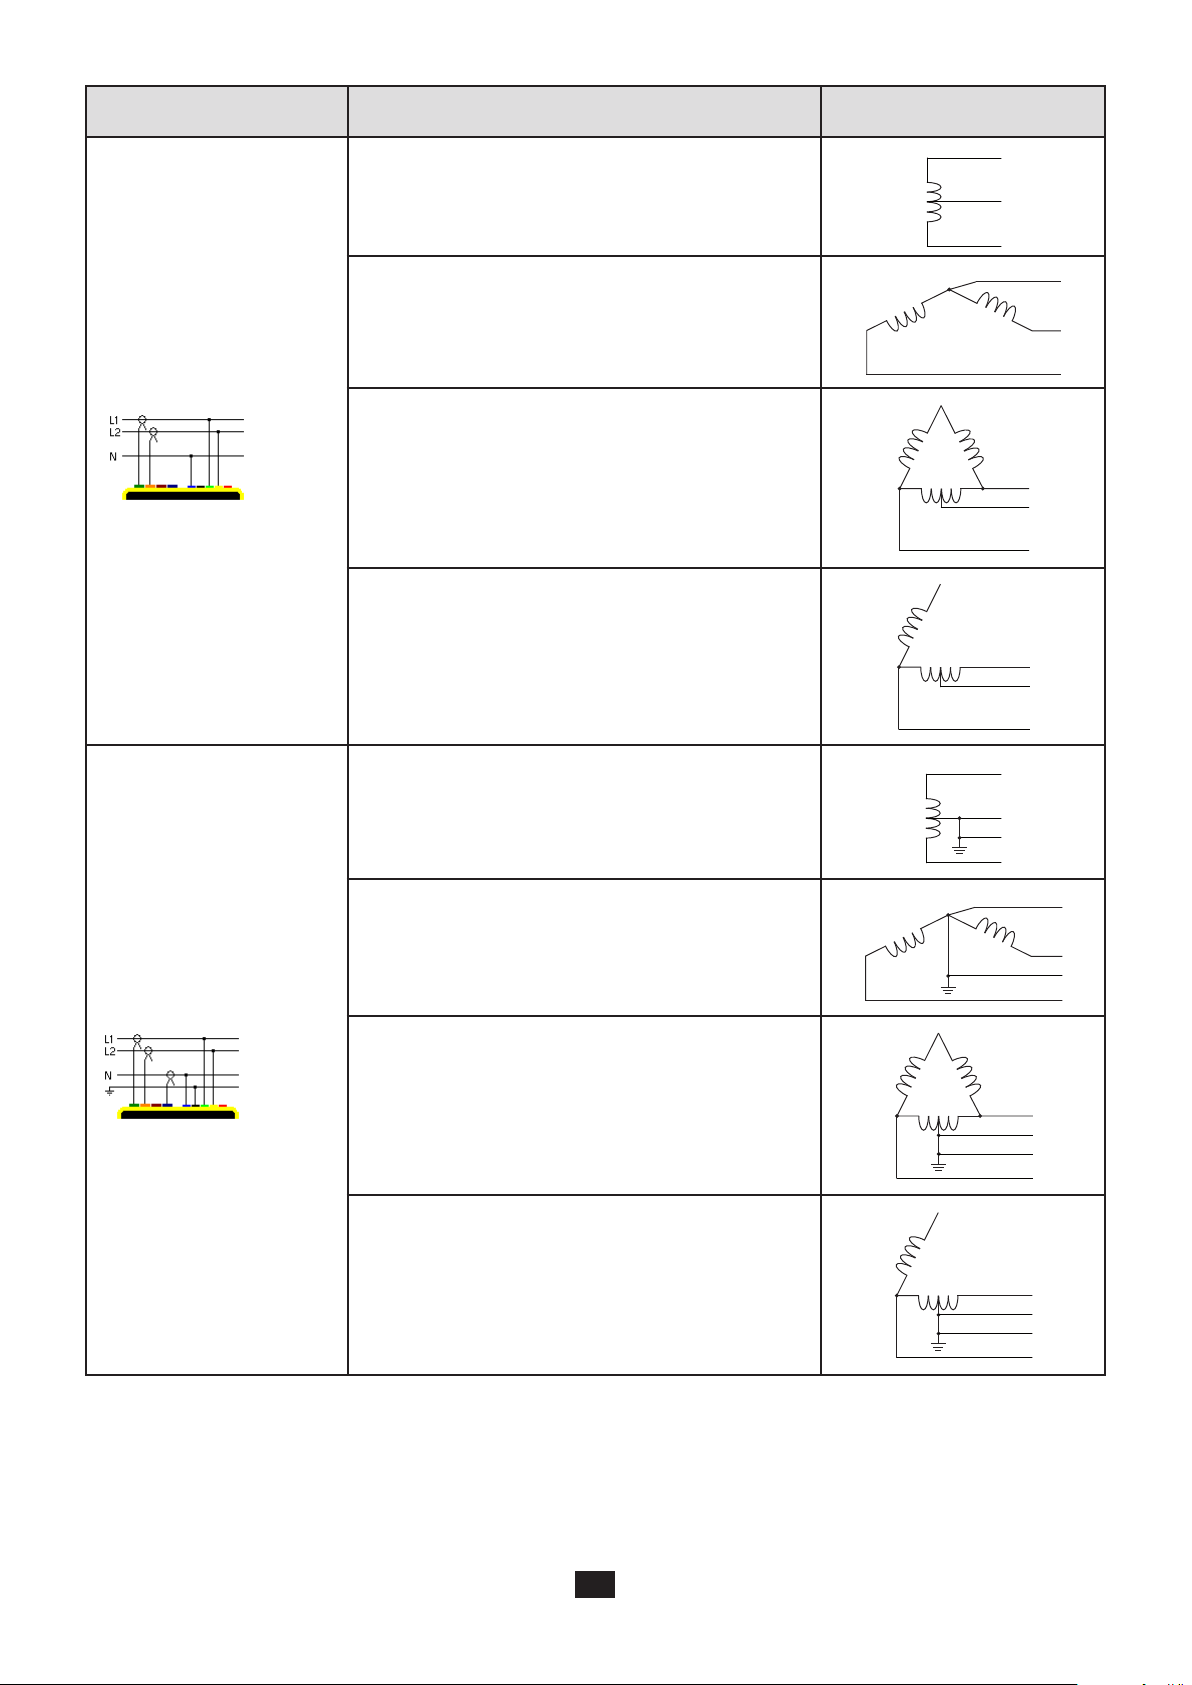
Distribution system Source
L1
L1
N
Split-phase 3-wire (L1, L2 and
N)
Split-phase 3-wire non-earthed neutral
3-phase open star 3-wire non-earthed neutral
3-phase high leg delta 3-wire non-earthed neutral
3-phase open high leg delta 3-wire non-earthed neutral
N
L2
N
L1
L2
L1
N
L2
L1
N
L2
Split-phase 4-wire (L1, L2, N
and earth)
Split-phase 4-wire earthed neutral
3-phase open star 4-wire earthed neutral
3-phase high leg delta 4-wire earthed neutral
3-phase open high leg delta 4-wire earthed neutral
N
GND
L2
L1
GND
L2
L1
N
GND
L2
L1
N
GND
L2
27

Distribution system Source
L3
L3
L3
L3
L3
3-phase star 3-wire
3-phase delta 3-wire
3-phase 3-wire (L1, L2 and L3)
3-phase open delta 3-wire
Indicate which current sensors
will be connected: all 3 (3A) or
only 2 (A1 and A2, or A2 and A3,
or A3 and A1).
L3
L1
L2
L1
L2
L1
L2
Three-wattmeter method with
virtual neutral (with 3 sensors
connected) or two-wattmeter
method or two-element method
or Aron method (with 2 sensors
connected).
A third sensor is not necessary
if two sensors of the same type,
same range, and same ratio are
connected. Otherwise, the third
sensor must be connected to
make current measurements.
3-phase open delta 3-wire earthed junction of phases
L1
L2
3-phase open delta 3-wire earthed corner of phase
L1
L2
3-phase high leg delta 3-wire
L1
L2
L3
3-phase open high leg delta 3-wire
L1
L2
28
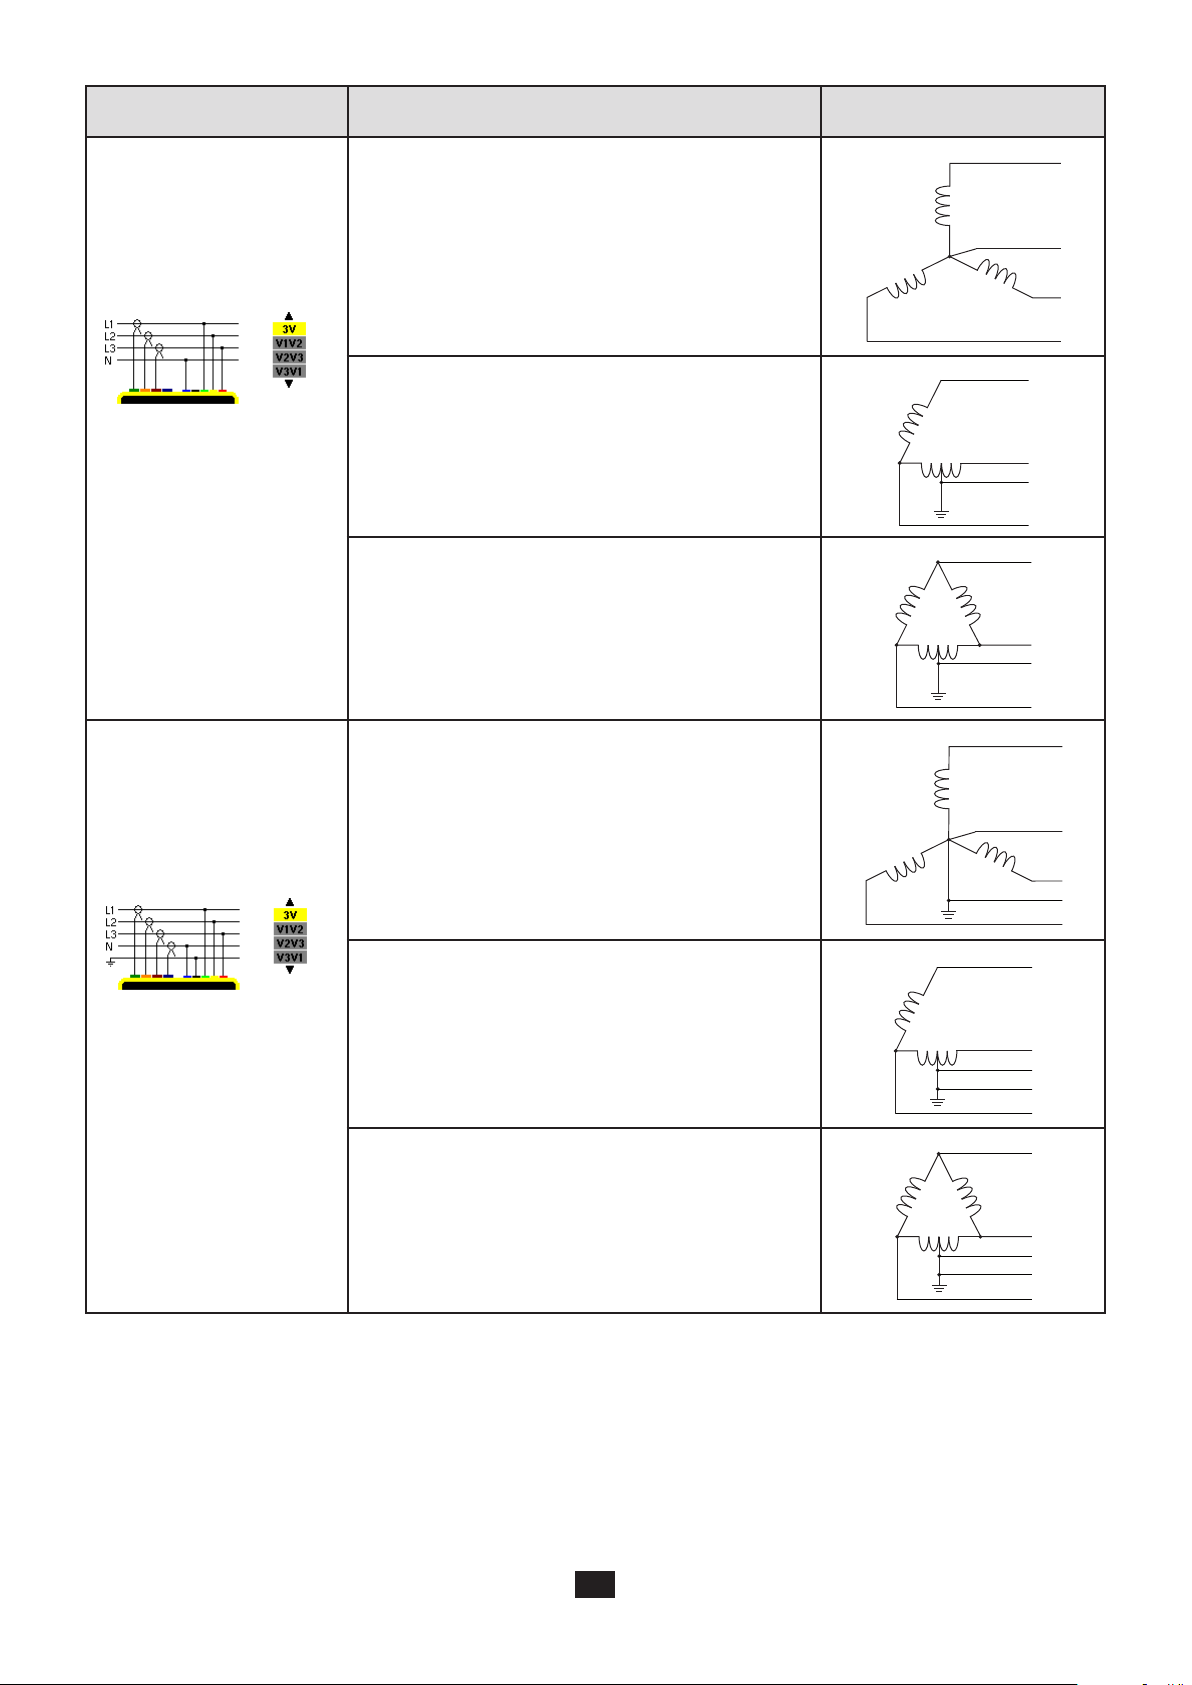
Distribution system Source
L3
L3
L3
L3
L3
L3
3-phase 4-wire (L1, L2, L3
and N)
Indicate which voltages will be
connected: all 3 (3V) or only 2
(V1 and V2, or V2 and V3, or
V3 and V1).
If only two of the three voltages
are connected, the three phase
voltages must be balanced
(2½-element method)
3-phase star 4-wire non-earthed neutral
3-phase open high leg delta 4-wire non-earthed neutral
3-phase high leg delta 4-wire non-earthed neutral
N
L1
L2
L1
N
L2
L1
N
L2
3-phase 5-wire (L1, L2, L3, N
3-phase star 5-wire earthed neutral
and earth)
Indicate which voltages will be
connected: all 3 (3V) or only 2
3-phase open high leg delta 5-wire earthed neutral
(V1 and V2, or V2 and V3, or V3
and V1).
If only two of the three voltages
are connected, the three phase
voltages must be balanced
(2½-element method)
3-phase high leg delta 5-wire earthed neutral
Then validate with the key . The device returns to the Conguration menu.
This makes it possible to connect the device to all existing networks.
N
L1
GND
L2
L1
N
GND
L2
L1
N
GND
L2
Note: It is impossible to select a new connection if the device is recording, metering energy, or searching for transients, alarms,
and/or inrush current acquisitions.
29
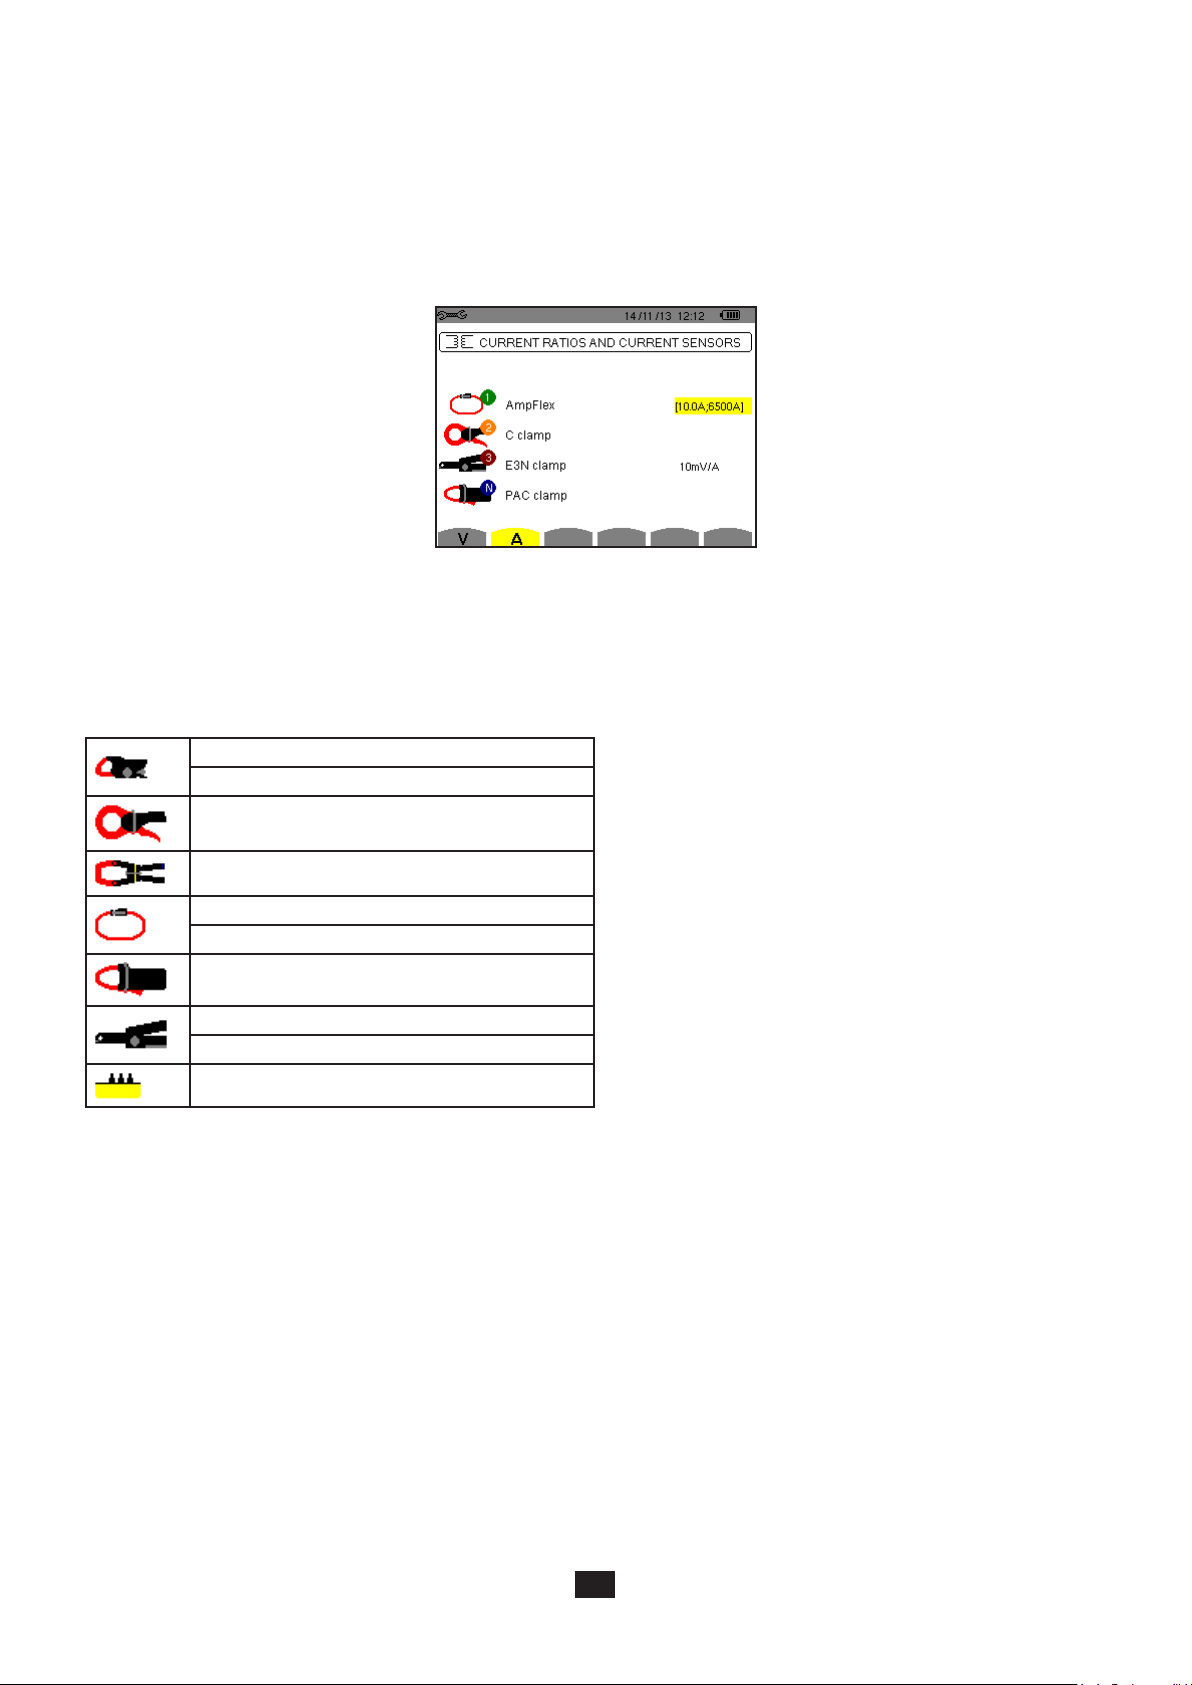
4.7. SENSORS AND RATIOS
Note: The ratios cannot be changed if the device is recording, metering energy, or searching for transients, alarms, and/or inrush
current acquisitions.
4.7.1. CURRENT SENSORS AND RATIOS
A rst screen A is used to dene the current sensors and ratios. It automatically displays the current sensor models detected by
the device. If a sensor is detected but not managed, an error message is displayed.
Figure 25: Current clamp and ratios screen in the Sensors and ratios menu
In the case of a 3-wire three-phase set-up where only two of the three current sensors required are connected, if these two sensors
are of the same type and have the same ratio, the device simulates the third sensor by assuming the same characteristics as for
the two others. The third sensor will be shown in the list as being simulated, or impossible to simulate otherwise.
The various current sensors are:
MN93 clamp: 200 A.
MN93A clamp: 100 A or 5 A.
C193 clamp: 1000 A.
J93 clamp : 3500 A.
AmpFlex®: 100, 6500 or 10000 A.
MiniFlex®: 100, 6500 or 10000 A.
PAC93 clamp: 1000 A.
E3N clamp: 100 A (sensitivity 10 mV/A).
E3N clamp: 10 A (sensitivity 100 mV/A).
Three phase adapter: 5 A.
If an MN93A clamp (5A range) or an Adapter is used, the current ratio setting is proposed automatically.
If an MN93A clamp (5A range), an Adapter, an AmpFlex®, a MiniFlex®, or an E3N clamp is used, adjustment of the ratio, of the
range, or of the sensitivity is proposed automatically.
Use the arrow keys (,, , ) to dene the transformation ratios between the primary current (1A to 60,000A) and the second-
ary current (1A, 2A or 5A), then validate with the key.
The primary current cannot be less than the secondary current.
4.7.2. VOLTAGE RATIOS
A second screen V or U, denes the voltage ratios.
The programming of the ratio or ratios can be different or the same for all or for some channels.
The ratios to be programmed are phase-to-neutral voltage ratios when there is a neutral and phase-to-phase voltage ratios when
there is not.
To change the ratios, press the key.
30

Figure 26: the Voltage Ratios screen in the Sensors and
ratios menu in the case of a set-up without neutral
Use the arrow keys (,) to choose the conguration of the ratios.
3U 1/1 or 4V 1/1: all channels have the same 1/1 ratio.
3U or 4V: all channels have the same ratio, to be programmed.
Press the key, then use the , keys to highlight the ratio in yellow.
Press the key, then use the ,, and keys to change the ratio. The primary voltage is in kV and the secondary
voltage is in V.
3V + VN: all channels have the same ratio and the neutral has a different ratio.
Proceed as when there is only one ratio, but perform the operation twice.
U1+U2+U3 or V1+V2+V3+VN: each channel has a different ratio, to be programmed.
Proceed as when there is only one ratio, but perform the operation several times.
Validate with the key. To return to the Conguration menu, press .
Note: the primary and secondary voltages can each be congured with a multiplier factor of 1/√3.
Figure 27: the Voltage Ratios screen in the Sensors and
ratios menu in the case of a set-up with neutral
4.8. CAPTURE MODE
The mode is used to congure the voltage thresholds, the current thresholds of the transient mode, and the current thresh-
olds of the inrush current mode.
4.8.1. VOLTAGE THRESHOLDS OF THE TRANSIENT MODE
A rst screen, displayed by pressing the V icon (or U, for set-ups without a neutral), is used to congure the voltage thresh-
olds.
The thresholds programmed can be the same for all channels or different for some or all of them.
Figure 28: the Current thresholds screen in the Transient Mode menu
To change the voltage thresholds, press .
Use the arrow keys (,) to choose conguration of the thresholds.
31

4V or 3U: all channels have the same threshold.
Press the key, then use the , keys to highlight the value of the threshold in yellow.
Press the key, then use the ,, and keys to change the threshold. The unit can be the V or the kV.
3V + VN: all channels have the same ratio and the neutral has a different ratio.
Proceed as when there is only one ratio, but perform the operation twice.
V1+V2+V3+VN or U1+U2+U3: each channel has a different ratio, to be programmed.
Proceed as when there is only one ratio, but perform the operation several times.
Validate with the key. To return to the Conguration menu, press .
Note: Changing the thresholds in the transient mode is impossible if the device is searching for transients.
4.8.2. CURRENT THRESHOLDS OF THE TRANSIENT MODE
A second screen, displayed by pressing the A icon, is used to congure the current thresholds (independently of the current
sensors detected by the device).
The thresholds programmed can be the same for all channels or different for some or all of them.
Figure 29: the Voltage thresholds screen in the Transient Mode menu
To change the current thresholds, press .
Use the arrow keys (,) to choose conguration of the thresholds.
4A: all current sensors have the same threshold.
Press the key, then use the , keys to highlight the value of the threshold in yellow.
Press the key, then use the ,, and keys to change the threshold. The unit can be the A, the kA or the mA.
3A + AN: all current sensors have the same threshold and the one connected to the neutral has a different threshold.
Proceed as when there is only one ratio, but perform the operation twice.
A1+A2+A3+AN: each current sensor has a different threshold, to be programmed.
Proceed as when there is only one ratio, but perform the operation several times.
Validate with the key. To return to the Conguration menu, press .
Note: Changing the thresholds in the transient mode is impossible if the device is searching for transients.
32

4.8.3. CURRENT THRESHOLDS OF THE INRUSH CURRENT MODE
A third screen, displayed by pressing the icon, is used to dene the inrush current thresholds. This involves programming
the triggering threshold and the inrush current capture stopping threshold (the stopping threshold being the triggering threshold
less the hysteresis).
Figure 30: the Inrush Current Thresholds screen in the Inrush Current Mode menu
To change the inrush current triggering threshold, press the key.
Use the ,, and keys to change the triggering threshold. The unit can be the A, the kA, or the mA.
Press the key, then use the , keys to highlight the hysteresis in yellow.
Use the ,, and keys to change the hysteresis and press the
Notes: for more information on the hysteresis, refer to §16.3. Conguring the hysteresis at 100% is equivalent to not having a
stop threshold (see §16.7).
Changing the thresholds in inrush current mode is impossible if the device is in inrush current capture.
key to validate.
To return to the Conguration menu, press .
4.9. TREND MODE
The device has a recording function ( key, see §9), used to record measured and calculated values (Urms, Vrms, Arms, etc.).
Press the key of the Conguration mode and select the Trend Mode sub-menu.
Figure 31: The rst screen of the Trend mode Figure 32: The second screen of the Trend mode
There are 4 possible programmable congurations , , and independent of one another. To go from one to the
other, use the or key.
To select the parameter to be recorded, move the yellow cursor to this parameter using the ,, and keys then validate with
the key. The selected parameter is identied by a red spot. The frequency (Hz) is always selected (black spot).
Note: If a quantity is displayed in red, it means that it is incompatible with the conguration chosen (connection selected, sensors
connected, ratios programmed, reference of the level of harmonics of the phases, breakdown of the non-active quantities).
For example, if no current sensor is connected, all current quantities will be in red.
To select all of the parameters of a page, press the key.
To unselect all of the parameters of a page, press the key.
33

To change conguration pages, press the or key.
The recordable values are:
Unit Designation
Urms RMS phase-to-phase voltage.
Udc RMS phase-to-neutral voltage.
Upk+ Maximum peak value of phase-to-phase voltage.
Upk- Minimum peak value of phase-to-phase voltage.
Ucf Crest (peak) factor of phase-to-phase voltage.
Uthdf Harmonic distortion of the phase-to-phase voltage with the RMS value of the fundamental as reference.
Uthdr Harmonic distortion of the phase-to-phase voltage with the total RMS value without DC as reference.
Vrms RMS phase-to-neutral voltage.
Vdc DC phase-to-neutral voltage.
Vpk+ Maximum peak value of the phase-to-neutral voltage.
Vpk- Minimum peak value of the phase-to-neutral voltage.
Vcf Crest factor of phase-to-neutral voltage.
Vthdf Harmonic distortion of the phase-to-neutral voltage with the RMS value of the fundamental as reference.
Vthdr Harmonic distortion of the phase-to-neutral voltage with the total RMS value without DC as reference.
Arms RMS current.
Adc DC current.
Apk+ Maximum peak value of the current.
Apk- Minimum peak value of the current.
Acf Crest factor of current.
Athdf Harmonic distortion of the current with the RMS value of the fundamental as reference.
Athdr Harmonic distortion of the current with the total RMS value without DC as reference.
P Active power.
Pdc DC power.
Q
Reactive power (fundamental).
1
N Non-active power.
D Distortion power.
S Apparent power.
PF Power factor.
cos Φ Cosine of the phase shift of the voltage with respect to the current (displacement factor or fundamental power fac-
tor – DPF).
tan Φ Tangent of the phase shift of the voltage with respect to the current.
PST Short-term icker.
PLT Long-term icker.
FHL Harmonic loss factor
FK K factor.
Vunb
or Uunb
Negative-sequence phase-to-ground voltage unbalance factor (set-up with neutral).
Negative-sequence phase-to-phase voltage unbalance factor (set-up without neutral).
Aunb Negative-sequence current unbalance factor.
Hz Network frequency.
U-h Harmonics in phase-to-phase voltage.
V-h Harmonics in phase-to-neutral voltage
A-h Harmonics in current.
S-h Harmonics in power.
34

The four last lines involve the recording of the harmonics of U, V, A and S. You can select a range of orders of the harmonics to be
recorded (between 0 and 50) for each of these quantities, and within this range, if desired, only odd harmonics.
Note: The level of harmonics of order 01 will be displayed only if they concern values expressed in % r.
To change an order of harmonic, rst select the parameter to be recorded (identied by a red spot), then move the yellow cursor to
this gure using the ,, and keys, then validate with the key. Change the value using the and keys, then validate
with the key.
Figure 33: The second screen of the Trend Mode during modication
Note: If a recording is in progress, the associated conguration cannot be modied and the selected values are identied by black
spots.
To return to the Conguration menu, press .
4.10. MODE ALARM MODE
The screen denes the alarms used by the Alarm Mode function (see §7).
You can dene a alarm on each of the following parameters:
Hz, Urms, Vrms, Arms, |Udc|, |Vdc|, |Adc|, |Upk+|, |Vpk+|, |Apk+|, |Upk-|, |Vpk-|, |Apk-|, Ucf, Vcf, Acf, Uthdf, Vthdf, Athdf, Uthdr,
Vthdr, Athdr, |P|, |Pdc|, |Q1| or N, D, S, |PF|, |cos Φ|, |tan Φ|, PST, PLT, FHL, FK, Vunb (or Uunb for a three-phase source without
neutral), Aunb, U-h, V-h, A-h and |S-h| (see the table of abbreviations in §2.8).
There are 40 programmable alarms.
To activate an alarm, move the yellow cursor to its number using the , keys, then validate with the key. The active alarm is
identied by a red spot. An alarm that is not programmed (“?”) cannot be activated.
To program the alarm, move the yellow cursor using the ,, and keys, then validate with the key. Change the value, then
validate again.
Alarms active.
Alarm inactive.
Alarm not programmed.
Figure 34: The Alarm mode menu
35

To set an alarm, program the following values:
The type of alarm.
The order of the harmonic (between 0 and 50), for |S-h|, A-h, U-h and V-h only.
The target of the alarm:
3L: 3 phases monitored individually,
N: monitoring of neutral,
4L: 3 phases and neutral monitored individually,
Σ: surveillance of the value of the complete system.
The direction of the alarm (>or <) in the case of Hz, Urms, Vrms, Arms, |Udc|, |Vdc|, |Adc|, |Upk+|, |Vpk+|, |Apk+|, |Upk-|, |Vpk-|
and |Apk-|.
The triggering threshold of the alarm (value and unit for Urms, Vrms, Arms, |Udc|, |Vdc|, |Adc|, |Upk+|, |Vpk+|, |Apk+|, |Upk-|,
|Vpk-|, |Apk-|, |P|, |Pdc|, |Q1| or N, D and S).
The triggering delay, or minimum duration above or below the alarm threshold: in minutes or seconds or, in the case of Vrms,
Urms and Arms (excluding the neutral), in hundredths of a second.
The hysteresis: 1%, 2%, 5% or 10% (see §16.3).
To go from one page to the other, press the or key.
Each overshoot of an alarm will be recorded in a campaign of alarms.
Notes: The display in red of an alarm line means that the programmed quantity and/or target is incompatible with the conguration
chosen (connection selected, sensors connected, ratios programmed, calculation methods chosen).
The alarms on the level of harmonics of order 01 concern only the values expressed in % r.
If a search for alarms is in progress, the activated alarms cannot be modied and are identied by black spots. However,
new alarms (not yet programmed or not activated) can be activated.
To return to the Conguration menu, press .
4.11. ERASE MEMORY
The menu partially or totally deletes the data recorded in the device.
Figure 35: Erase memory menu
To select an item to be erased, move the yellow cursor to it using the ,, and keys, then validate with the key. The item
to be erased is identied by a red spot.
To select all items, press .
To unselect all items, press .
To proceed with the erasure, press the key , then conrm with the key.
To return to the Conguration menu, press .
Note: Which erasures are possible depends on the recordings in progress (recording, metering of energy, search for transients,
alarms, and/or inrush current acquisition).
36

4.12. ABOUT
The About screen displays information concerning the device.
Figure 36: the About menu
To return to the Conguration menu, press .
37

5. WAVEFORM CAPTURE
The Waveform capture mode is used to display and to capture transients and inrush currents.
It contains two sub-modes:
The transient mode (see §5.1)
The inrush current mode (see §5.2)
Figure 37: the screen of the Waveform capture mode
To select a sub-mode, move the yellow cursor to it using the and keys, then validate with the key.
To return to the Waveform capture screen, press .
5.1. TRANSIENT MODE
The mode is used to record transients, to look up the list of recorded searches and the list of transients they contain, or erase
them. You can record up to 7 detections and 210 transients.
When the Transient mode is invoked:
If no recording has been made, then the Detection schedule screen is displayed.
If transients have been recorded, then the List of searches for transients is displayed.
Reminder of sub-mode used.
Display of the list of searches for
Memory indicator. The black bar
represents memory used; the white
bar represents memory available.
Shortcut to the Conguration menu
to set the voltage and current triggering thresholds (see §4.8).
Figure 38: the Detection schedule screen in Transient mode
transients (see §5.1.2).
Programming a search (see §5.1.1).
Starting a search.
38

5.1.1. PROGRAMMING AND STARTING A SEARCH
To program a search for a transient, enter the start date and time, the stop date and time, the number of transients to search for,
then the name of the search.
To change an item, move the yellow cursor to it using the and keys, then validate with the key. Change the value using the
,, and keys, then validate again.
The name can be at most 8 characters long. Several searches can bear the same name. The available alphanumeric characters
are the uppercase letters from A to Z and the digits from 0 to 9. The last 5 names given (in the transient, trend, and alarm modes)
are kept in memory. When a name is entered, it may then be completed automatically.
Notes: The start date and time must be later than the current date and time.
The stop date and time must be later than the start date and time.
Once the programming is done, start the search by pressing the key. The icon of the status bar blinks to indicate that the
search has been started. The key replaces the key and can be used to stop the search before it is nished.
The message Detection on standby is displayed until the start time is reached. It is then replaced by the message Detection in
progress. When the stop time is reached, the Detection schedule screen returns with the key . It is then possible to program
another search.
During a search for transients, only the stop date eld can be modied. It is automatically highlighted in yellow.
To return to the Waveform capture screen, press .
5.1.2. DISPLAYING A TRANSIENT
To display the recorded transients, press . The List of Searches for Transients screen is displayed.
Display of sub-mode used.
Memory indicator. The black bar
represents memory used; the white
bar represents memory available.
Figure 39: the screen of the List of Searches for Transients
If the stop date is in red, it means that it does not match the stop date initially programmed:
either because of a power supply problem (battery low or disconnection of the device supplied by mains only),
or because the number of transients has been reached, thereby ending the search.
39

To select a search for transients, move the cursor to it using the and keys. The selected search is bolded. Then validate with
the key. The device then displays a list of transients.
Triggering channel of the transient.
Transient number.
Name of the search for transients.
The icon is used to activate or
deactivate the choice of a transient
list display lter.
Figure 40: The Transient list screen in the case of a 5-wire three-phase set-up
To select a transient, move the cursor to it using the and keys. The selected eld is bolded. Then validate with the key.
The device displays the transients in the form of curves.
Location in the record of the zone
displayed.
Move the cursor to one period of
the signal before the transient triggering time.
Transients display lter:
∀: all transients are displayed.
4 V: the transients triggered by an
event in one of the 4 voltage channels are displayed.
4 A: the transients triggered by an
event in one of the 4 current channels are displayed.
L1, L2, or L3: the transients triggered by an event on a particular
phase are displayed (voltage or
current).
N: the transients triggered by an
event on the neutral current or neutral voltage are displayed.
Reminder of the number assigned to
the curve displayed; here, identication disc 1 is lled in to indicate that
channel V1 triggered capture of the
transient.
Selection of curves to be displayed.
Instantaneous value of the signals
according to the position of the cur-
Move the cursor to the transient triggering time.
Figure 41: example of display of transients in the form of curves with a 5-wire three-phase connection
Note: The curves to be displayed selection lter is dynamic and depends on the connection chosen. For example, it proposes
(3U, 3A) for a 3-wire three-phase set-up
To return to the Transient list screen, press .
5.1.3. DELETING A SEARCH FOR TRANSIENTS
When the list of searches for transients is displayed (see gure 39), select the search to be erased. This is done by moving the
cursor to it using the and keys. The selected search is bolded.
Then press the key. Press
Note: A search for transients can be deleted only if it is not in progress.
To return to the Waveform capture screen, press the key.
5.1.4. DELETE A TRANSIENT
When the list of transients in a search is displayed (see gure 40), select the transient to be erased. This is done by moving the
cursor to it using the and keys. The selected transient is bolded.
to validate or to cancel.
sor on the scale. To move the cursor
use the or key.
Then press the key. Press
To return to the Waveform capture screen, press the key .
to validate or to cancel.
40

5.2. INRUSH CURRENT MODE
Still in the mode, the sub-mode is used to capture (record) inrush currents (voltage and current waveforms, network
frequency, half-cycle RMS voltages and currents except for the neutral) and to view and delete the recordings.
When the Inrush current mode is invoked:
If no capture has been made, then the Capture schedule screen is displayed.
If a capture has been made, then the Capture characteristics screen is displayed.
5.2.1. PROGRAMMING THE CAPTURE
The display of the triggering lter
Display of sub-mode used.
Display of the characteristics of the
capture (see §5.2.2).
Rapid programming and starting of
a capture.
in red means that it is not available
because of an incompatibility with
the conguration (connection, type
of sensors, or current ratio).
Programming of the capture.
Shortcut to the Conguration menu
to set the triggering thresholds (see
§4.8).
Figure 42: the Capture schedule screen in Inrush current mode
To start recording rapidly, press the key. Recording starts immediately with a current threshold of 0 A and a hysteresis of 100%.
Attention: The rapid starting of an inrush current modies the conguration of the current threshold.
To program a capture, enter the triggering lter (3A, A1, A2, or A3), the start date and time, and the recording mode (RMS + PEAK
or RMS only).
The RMS + PEAK recording mode is used to produce a trend recording of the half-period RMS values and a trend recording
of the samples (envelopes and waveforms). The maximum duration of such a recording depends on the frequency network
and is on average about one minute.
In the RMS only recording mode, the recording of the samples is eliminated in favour of a longer maximum capture duration.
This mode records only the half-period RMS values and its maximum duration is about ten minutes.
To modify an item, move the yellow cursor to it using the and keys, then validate with the key. Change the value using the
,, and keys, then validate again.
Notes: For more information on the triggering lter, refer to §16.7.
It is not possible to program an alarm campaign if an inrush current capture is in progress.
Once the programming is done, start the capture by pressing the key. The icon of the status bar blinks to indicate that the
capture has been started. The key replaces the key and can be used to stop the capture before it is nished.
Start of the capture.
Attention: The voltage must be present before the inrush current strictly speaking for a stable and correct frequency lock.
The message capture pending is displayed until the start time is reached and the triggering conditions are satised. It is then
replaced by the message Capture in progress. The memory occupation indicator appears at the top of the screen. The indicator
disappears when the capture is completed.
If the capture is completed with a stop event (see conditions in §16.7) or if the recording memory of the device is full, the capture
stops automatically.
Note: The device can keep in memory only a single inrush current capture. If you wish to make another capture, rst delete the
previous one.
To return to the Waveform capture screen, press .
41

5.2.2. DISPLAYING THE CHARACTERISTICS OF THE CAPTURE
To display the characteristics of the capture, press . The Capture parameters screen is displayed.
Display in PEAK mode (see §5.2.4).
Display in RMS mode (see §5.2.3).
Figure 43: The Capture parameters screen
If a capture duration is displayed in red, it means that it has been cut short:
because of a power supply problem (battery low),
or because the memory is full.
or because of a measurement error.
or because of an incompatibility between the quantity monitored and the conguration of the device (for example withdrawal
of a current sensor).
Choose the type of display, RMS or PEAK, by pressing the yellow key corresponding to the icon. The device then displays the curves.
Note: the PEAK key is not displayed when the inrush current capture recording mode is RMS only.
5.2.3. TRUE RMS CURRENT AND VOLTAGE
The RMS mode displays the record of the trend of the true half-cycle RMS current and voltage and the frequency trend curve.
The display depends on the type of selection lter:
3V: displays the 3 voltages during the inrush current capture for set-ups with neutral.
3U: displays the 3 voltages during the inrush current capture for set-ups without neutral.
3A: displays the 3 currents during the inrush current capture.
L1, L2, L3: display the current and voltage in phases 1, 2 and 3 respectively (for set-ups with neutral only).
Hz: displays the evolution of the network frequency vs. time.
Below, three examples of display.
5.2.3.1. The 3A RMS display screen for a three-phase connection with neutral
Location of the zone displayed in
the record.
Scale of values in amperes.
Time cursor. Use the or key to
move the cursor.
MAX: maximum half-cycle RMS
value of the inrush current capture.
Reminder of number assigned to the
curve displayed. Here, identication
disc 1 is lled in, indicating that chan-
nel A1 triggered the inrush current
capture.
t: relative time position of the cursor
(t=0 corresponds to the start of the
inrush current capture).
Figure 44: The 3A RMS display screen for a three-phase connection with neutral
A1, A2, A3: RMS values of currents
1, 2, and 3 in the half-cycle at the
position of the cursor.
42

5.2.3.2. The 3A RMS display screen for a three-phase connection without neutral
Figure 45: The 3A RMS display screen for a three-phase connection without neutral
5.2.3.3. The L1 RMS display screen for a three-phase connection with neutral
MAX: maximum half-cycle RMS
value of the inrush current capture.
t: relative time position of the cursor
(t=0 corresponds to the start of the
inrush current capture).
Figure 46: The L1 RMS display screen for a three-phase connection with neutral
Note: Filters L2 and L3 are used to display the recording of the true half-cycle RMS current and voltage of phases 2 and 3. The
screen is identical to the one displayed for lter L1.
The , , and keys are used to go to the rst occurrence of a minimum or maximum voltage or current
value.
5.2.3.4. The RMS display screen in Hz for a three-phase connection without neutral
Time cursor of the curve. Use the
or key to move the cursor.
V1: RMS value of voltage 1 in the
half-cycle at the position of the cursor.
A1: RMS value of current 1 in the
half-cycle at the position of the cursor.
Figure 47: The Hz RMS display screen for a three-phase connection without neutral
The and keys are used to go to the rst occurrence of a minimum or maximum frequency value.
43

5.2.4. INSTANTANEOUS INRUSH CURRENT
The PEAK mode is used to display the envelopes and waveforms of the inrush current capture.
The PEAK display of an inrush current capture provides two possible representations:
envelope
waveform.
The change from one of these representations to the other is automatic, as a function of the zoom level. If the zoom in is high
enough, the representation is of the “waveform” type.
The display depends on the type of display lter:
4V: displays the 4 voltages during the inrush current capture for set-ups with neutral (for a waveform type display only).
3U: displays the 3 voltages during the inrush current capture for set-ups without neutral (for a waveform type display only).
4A: displays the 4 currents during the inrush current capture (for a waveform type display only).
L1, L2 or L3: display the voltage and current of phases 1, 2, and 3, respectively (only for set-ups with neutral and for a waveform
type display).
N: displays the neutral current and neutral voltage during the inrush current capture (for a waveform type display only).
V1, V2, V3: displays the 3 voltages during the inrush current capture for set-ups with neutral (for an envelope type display only).
U1, U2, U3: displays the 3 voltages during the inrush current capture for set-ups without neutral (for an envelope type display only).
A1, A2, A3: displays the 3 currents during the inrush current capture (for an envelope type display only).
Below, three examples of display.
5.2.4.1. The 4A PEAK display screen for a 5-wire three-phase connection
Location of the zone displayed in
the record.
MAX |PEAK|: maximum instantaneous absolute value of the inrush
current capture.
Scale of values in amperes.
t: relative time position of the cursor
(t=0 corresponds to the start of the
inrush current capture).
Figure 48: The 4A PEAK display screen for a 5-wire three-phase connection
5.2.4.2. The 3A PEAK display screen for a 3-wire three-phase connection
Reminder of number assigned to
the curve displayed. Here, identication disc 3 is lled in to indicate that
channel A3 triggered capture of the
inrush current.
Time cursor. Use the or key to
move the cursor.
A1, A2, A3: instantaneous values of
currents 1, 2, and 3 at the position
of the cursor.
Figure 49: The 3A PEAK display screen for a 3-wire three-phase connection
44

5.2.4.3. The A1 PEAK display screen for a three-phase connection without neutral
In the case shown, there is enough zoom out to force the envelope type of representation.
MAX |PEAK|: maximum instantaneous absolute value of the inrush
current capture.
t: relative time position of the cursor
(t=0 corresponds to the start of the
inrush current capture).
A1: maximum instantaneous cur-
rent of the half-cycle identied by
the cursor.
Figure 50: The A1 PEAK display screen for a three-phase connection without neutral
Note: Filters A2 and A3 display the record of the current envelope of phases 2 and 3. The screen is identical to the one displayed
for lter A1.
Time cursor of the curve. Use the
or key to move the cursor.
45

6. HARMONIC
The Harmonic mode displays a representation of the harmonic levels of the voltage, current, and apparent power, order by
order. It can be used to determine the harmonic currents produced by nonlinear loads and analyze problems caused by harmonics
according to their order (overheating of neutrals, conductors, motors, etc.).
Analysis of the apparent power of the
harmonics (see §6.3).
Analysis of harmonics of the current
(see §6.2).
Analysis of harmonics of the phaseto-neutral voltage (see §6.1).
Figure 51: Harmonics mode screen
Select the lters and the expert mode
(see §6.5). Use the or key to
select the display.
Analysis of the harmonics of the
phase-to-phase voltage (see §6.4).
6.1. PHASE-TO-NEUTRAL VOLTAGE
The V sub-menu displays the harmonics of the phase-to-neutral voltage only for sources having a neutral.
The choice of curves to be displayed depends on the type of connection (see §4.6):
Single-phase, 2-wire: no choice (L1)
Single-phase, 3-wire: L1, N
Split-phase, 3-wire: 2L, L1, L2
Split-phase, 4-wire: 2L, L1, L2, N
Three-phase, 4-wire: 3L, L1, L2, L3, -,+
Three-phase, 5-wire: 3L, L1, L2, L3, N, -,+
The screen captures shown as examples are those obtained with a 5-wire three-phase connection.
6.1.1. THE 3L PHASE-TO-NEUTRAL VOLTAGE HARMONICS DISPLAY SCREEN
This information concerns the harmonic pointed to by the cursor.
V-h03: harmonic number.
%: level of harmonics with the fun-
damental RMS value as reference
(%f) or the (total) RMS value as
reference (%r).
V: RMS voltage of the harmonic in
question.
+000°: phase shift with respect to the
fundamental (order 1).
Harmonic selection cursor. Use the
or key to move the cursor.
Figure 52: example of 3L phase-to-neutral voltage harmonics display
Display of the 3 phases 3L, of L1,
L2, L3, N, or of the expert mode
(three-phase connection only - see
§6.5). To select the display press the
or key.
The horizontal axis indicates the
orders of the harmonics. The level of
the harmonic is given as a percentage with respect to the fundamental
or to the total RMS value.
DC: DC component. 1 to 25: har-
monics of order 1 to 25. When the
cursor exceeds order 25, order 26
to 50 appears.
46

6.1.2. THE L1 PHASE VOLTAGE HARMONICS DISPLAY SCREEN
This information concerns the harmonic pointed to by the cursor.
V-h03: harmonic number.
%: level of harmonics with the fun-
damental RMS value as reference
(%f) or the (total) RMS value as
reference (%r).
V: RMS voltage of the harmonic in
question.
-143°: phase shift with respect to the
fundamental (order 1).
max – min: maximum and minimum
levels of the harmonic in question.
They are reset when the harmonic
number is changed or the key is
pressed.
THD: total harmonic distortion.
Vd: RMS distortion voltage.
Figure 53: example of display of harmonics of L1 phase-to-neutral voltage
Notes: Filters L2 and L3 display the harmonics of the phase-to-neutral voltage for phases 2 and 3, respectively. The screen is
identical to the one displayed for lter L1.
There is no phase shift or distortion value for the neutral channel.
Harmonic selection cursor. Use the or key
to move the cursor.
Display of the 3 phases 3L, of L1, L2,
L3, N, or of the expert mode (threephase connection only - see §6.5).
To select the display press or .
The horizontal axis indicates the
orders of the harmonics. The level of
the harmonic is given as a percentage with respect to the fundamental
or to the total RMS value.
DC: DC component.
1 to 25: harmonics of order 1 to 25.
When the cursor exceeds order 25,
order 26 to 50 appears.
Indicator of the presence of non-zero
harmonics of order higher than 25.
6.2. CURRENT
The A sub-menu displays the harmonics of the current.
6.2.1. THE 3L CURRENT HARMONICS DISPLAY SCREEN
This information concerns the harmonic pointed to by the cursor.
A-h05: harmonic number.
%: level of harmonics with the fun-
damental RMS value as reference
(%f) or the (total) RMS value as
reference (%r).
A: RMS current of the harmonic in
question.
+179°: phase shift with respect to the
fundamental (order 1).
Harmonic selection cursor. Use the
or key to move the cursor.
Figure 54: example of 3L display of current harmonics
Display of the 3 phases 3L, of L1, L2,
L3, N, or of the expert mode (threephase connection only - see §6.5).
To select the display press or .
The horizontal axis indicates the
orders of the harmonics. The level of
the harmonic is given as a percentage with respect to the fundamental
or to the total RMS value.
Rang DC: DC component.
1 to 25: harmonics of order 1 to 25.
When the cursor exceeds order 25,
order 26 to 50 appears.
47

6.2.2. THE L1 CURRENT HARMONICS DISPLAY SCREEN
This information concerns the harmonic pointed to by the cursor.
A-h05: harmonic number.
%: level of harmonics with the fun-
damental RMS value as reference
(%f) or the (total) RMS value as
reference (%r).
A: RMS current of the harmonic in
question.
+178°: phase shift with respect to the
fundamental (order 1).
max – min: maximum and minimum
levels of the harmonic in question.
They are reset when the harmonic
number is changed or the key is
pressed
THD: total harmonic distortion.
Ad: RMS distortion current.
Notes: Filters L2 and L3 display the current harmonics of phases 2 and 3, respectively. The screen is identical to the one displayed
for lter L1.
There is no phase shift or distortion value for the neutral channel.
Harmonic selection cursor. Use the or
key to move the cursor.
Figure 55: example of L1 display of harmonics of current
Display of the 3 phases 3L, of L1, L2,
L3, N, or of the expert mode (threephase connection only - see §6.5).
To select the display press or .
The horizontal axis indicates the
orders of the harmonics. The level of
the harmonic is given as a percentage with respect to the fundamental
or to the total RMS value.
Rang DC: DC component.
1 to 25: harmonics of order 1 to 25.
When the cursor exceeds order 25,
order 26 to 50 appears.
6.3. APPARENT POWER
The S sub-menu displays the harmonics of the apparent power, for all connections except 3-wire three-phase.
The horizontal axis indicates the orders of the harmonics. The bars of the bar chart above the horizontal centreline signify harmonic
power consumed, those below it harmonic power generated.
6.3.1. THE 3L APPARENT POWER HARMONICS DISPLAY SCREEN
This information concerns the harmonic pointed to by the cursor.
S-h03: harmonic number.
%: level of harmonics with the funda-
mental apparent power as reference
(%f) or the (total) apparent power as
reference (%r).
+006°: phase shift of the voltage
harmonic with respect to the current
harmonic for the order in question.
: Indicator of energy generated
for this harmonic.
: Indicator of energy consumed
for this harmonic.
Harmonic selection cursor. Use the or
key to move the cursor.
Display of the 3 phases 3L, of L1,
L2 or L3. To select the display press
the or .
The horizontal axis indicates the
orders of the harmonics. The level of
the harmonic is given as a percentage of the fundamental apparent
power or the (total) apparent power.
Rang DC: DC component.
1 to 25: harmonics of order 1 to 25.
When the cursor exceeds order 25,
order 26 to 50 appears.
Figure 56: example of 3L apparent power harmonics display
48

6.3.2. THE L1 APPARENT POWER HARMONICS DISPLAY SCREEN
This information concerns the harmonic pointed to by the cursor.
S-h03: harmonic number.
%: level of harmonics with the funda-
mental apparent power as reference
(%f) or the (total) apparent power as
reference (%r).
+045°: phase shift of the voltage
harmonic with respect to the current
harmonic for the order in question.
min–max: maximum and minimum
levels of the harmonic in question.
They are reset when the harmonic
number is changed or the key is
pressed.
Figure 57: example of L1 apparent power of harmonics display
Note: Filters L2 and L3 display the apparent power of the harmonics for phases 2 and 3, respectively. The screen is identical to
the one displayed for lter L1.
Harmonic selection cursor. Use the or
key to move the cursor.
Display of the 3 phases 3L, of L1,
L2 or L3. To select the display press
the or .
The horizontal axis indicates the
orders of the harmonics. The level of
the harmonic is given as a percentage of the fundamental apparent
power or the (total) apparent power.
Rang DC: DC component.
1 to 25: harmonics of order 1 to 25.
When the cursor exceeds order 25,
order 26 to 50 appears.
Indicator of energy consumed
for this harmonic.
6.4. PHASE-TO-PHASE VOLTAGE
The U sub-menu is available for all connections except 2- or 3-wire single-phase.. This sub-menu displays the harmonics of the
phase-to-phase voltage.
6.4.1. THE 3L PHASE-TO-PHASE VOLTAGE HARMONICS DISPLAY SCREEN
This information concerns the harmonic pointed to by the cursor.
U-h03: harmonic number.
%: level of harmonics with the fun-
damental RMS value as reference
(%f) or the (total) RMS value as
reference (%r).
V: RMS voltage of the harmonic in
question.
+000°: phase shift with respect to the
fundamental (order 1).
Harmonic selection cursor. Use the
or key to move the cursor.
Figure 58: example of 3L phase-to-phase voltage harmonics display
Display of the 3 phases 3L, of L1,
L2, L3. To select the display press
or .
The horizontal axis indicates the
orders of the harmonics. The level of
the harmonic is given as a percentage with respect to the fundamental
or to the total RMS value.
Rang DC: DC component.
1 to 25: harmonics of order 1 to 25.
When the cursor exceeds order 25,
order 26 to 50 appears.
49

6.4.2. THE L1 PHASE-TO-PHASE VOLTAGE HARMONICS DISPLAY SCREEN
This information concerns the harmonic pointed to by the cursor.
Uh 03: harmonic number.
%: level of harmonics with the fun-
damental RMS value as reference
(%f) or the (total) RMS value as
reference (%r).
V: RMS voltage of the harmonic in
question.
+000°: phase shift with respect to the
fundamental (order 1).
max – min: indicators of the maximum and minimum of the level of
harmonics or by pressing the
THD: total harmonic distortion.
Ud: phase-to-phase RMS distortion
voltage.
Note: Filters L2 and L3 display the phase-to-phase voltage harmonics for phases 2 and 3, respectively. The screen is identical to
the one displayed for lter L1.
key.
Figure 59: example of L1 phase-to-phase voltage harmonics display
Harmonic selection cursor. Use the or
key to move the cursor.
Display of the 3 phases 3L, of L1,
L2 or L3. To select the display press
or .
The horizontal axis indicates the
orders of the harmonics. The level of
the harmonic is given as a percentage with respect to the fundamental
or to the total RMS value.
Rang DC: DC component.
1 to 25: harmonics of order 1 to 25.
When the cursor exceeds order 25,
order 26 to 50 appears.
6.5. EXPERT MODE
The Expert mode is available with a three-phase connection only. It is used to display the inuence of the harmonics on the
heating of the neutral and on rotating machines. To display expert mode press the or key of the keypad. The selection is
highlighted in yellow and the screen simultaneously displays the expert mode.
From this screen, two sub-menus are available:
V for three-phase set-ups with neutral or U for the three-phase set-up without neutral.
A for the expert mode in current.
Note : The breakdown into sequences shown here is valid only in the case of a balanced load.
6.5.1. THE PHASE-TO-NEUTRAL VOLTAGE EXPERT MODE DISPLAY SCREEN
For three-phase set-ups with neutral, the V sub-menu displays the inuence of the harmonics of the phase-to-neutral voltage on
the heating of the neutral and on rotating machines.
Harmonics inducing a negative
sequence.
Harmonics inducing a zero sequence.
Harmonics inducing a positive sequence.
%: level of harmonics with the fundamental RMS value as reference
(%f) or the (total) RMS value as
reference (%r).
Figure 60: The phase-to-neutral voltage expert mode screen (three-phase set-ups with neutral)
For three-phase set-ups without neutral, the U sub-menu displays the inuence of the harmonics of the phase-to-phase voltage
on the heating of revolving machines.
50

6.5.2. THE CURRENT EXPERT MODE DISPLAY SCREEN
The A sub-menu displays the inuence of the harmonics of the current on the heating of the neutral and on rotating machines.
Harmonics inducing a negative
sequence.
Harmonics inducing a zero sequence.
Harmonics inducing a positive sequence.
%: level of harmonics with the fundamental RMS value as reference
(%f) or the (total) RMS value as
reference (%r).
Figure 61: the current expert mode screen
51

7. WAVEFORM
The Waveform key is used to display the current and voltage curves, along with the values measured and those calculated
from the voltages and currents (except for power, energy, and harmonics).
This is the screen that appears when the device is powered up.
Display of the maximum and minimum RMS values and of the peak
values (see §7.4).
Measurement of the peak factor
(see §7.3).
Measurement of total harmonic distortion (see §7.2).
Measurement of the true RMS value
(see §7.1).
Figure 62: Waveform mode screen
Selection of the display lters. Use
the or key to select the display.
Simultaneous display of the following
measurements: RMS, DC, THD, CF,
PST, PLT, FHL and FK (see §7.5)
Display of the Fresnel diagram of the
signals (see §7.6).
7.1. MEASUREMENT OF TRUE RMS VALUE
The RMS sub-menu displays the waveforms over one period of the signals measured and the true RMS voltage and current.
The choice of curves to be displayed depends on the type of connection (see §4.6):
Single-phase, 2-wire or Split-phase, 2-wire: no choice (L1)
Single-phase, 3-wire:
For RMS, THD, CF, and : 2V, 2A, L1, N
For : no choice (L1)
Split-phase, 3-wire:
For RMS, THD, CF, and : U, 2V, 2A, L1, L2
For : 2V, 2A, L1, L2
Split-phase, 4-wire:
For RMS, THD, CF, and : U, 3V, 3A, L1, L2 N
For : 2V, 2A, L1, L2
Three-phase, 3wire: 3U, 3A
Three-phase, 4-wire: 3U, 3V, 3A, L1, L2, L3
Three-phase, 5-wire:
For RMS, THD, CF, and : 3U, 4V, 4A, L1, L2, L3 and N
For: 3U, 3V, 3A, L1, L2 and L3
The screen snapshots shown as examples are those obtained with a three-phase 5-wire connection.
52

7.1.1. THE 3U RMS DISPLAY SCREEN
This screen displays the three phase-to-neutral voltages of a three-phase system.
RMS phase-to-phase voltages.
Voltage axis with automatic scaling.
Instantaneous value cursor. Use the
or key to move the cursor.
Figure 63: The 3U RMS display screen
7.1.2. THE 4V RMS DISPLAY SCREEN
This screen displays the three phase-to-neutral voltages and the neutral-to-earth voltage of a three-phase system.
RMS voltages.
Voltage axis with automatic scaling.
Instantaneous value cursor. Use the
or key to move the cursor.
Instantaneous values of the signals
at the position of the cursor.
t: time relative to the start of the
period.
U1: instantaneous phase-to-phase
voltage between phases 1 and 2
(U12).
U2: instantaneous phase-to-phase
voltage between phases 2 and 3
(U23).
U3: instantaneous phase-to-phase
voltage between phases 3 and 1
(U31).
Instantaneous values of the signals
at the position of the cursor.
t: time relative to the start of the
period.
V1: instantaneous phase-to-neutral
voltage of curve 1.
V2: instantaneous phase-to-neutral
voltage of curve 2.
V3: instantaneous phase-to-neutral
voltage of curve 3.
VN: instantaneous value of the neutral voltage.
Figure 64: The 4V RMS display screen
7.1.3. THE 4A RMS DISPLAY SCREEN
This screen displays the three phase currents and the neutral current of a three-phase system.
RMS currents.
Current axis with automatic scaling.
Instantaneous value cursor. Use the
or key to move the cursor.
Figure 65: The 4A RMS display screen
Instantaneous values of the signals
at the intersection of the cursor and
of the curves.
t: time relative to the start of the
period.
A1: instantaneous current of phase
1.
A2: instantaneous current of phase
2.
A3: instantaneous current of phase
3.
AN: instantaneous value of the neutral current.
53

7.1.4. THE RMS DISPLAY SCREEN FOR THE NEUTRAL
This screen displays the neutral voltage with respect to earth and the neutral current.
RMS voltage and current.
Instantaneous values of the signals
Current and voltage axis with automatic scaling.
Instantaneous value cursor. Use the
or key to move the cursor.
Figure 66: The RMS display screen for the neutral
Note: Filters L1, L2, and L3 display the current and voltage in phases 1, 2, and 3, respectively. The screen is identical to the one
displayed for the neutral.
at the position of the cursor.
t: time relative to the start of the
period.
VN: instantaneous neutral voltage.
AN: instantaneous neutral current.
7.2. MEASUREMENT OF TOTAL HARMONIC DISTORTION
The THD sub-menu displays the waveforms of the signals measured over one full cycle and the total voltage and current harmonic
distortion. The levels are displayed either with the fundamental RMS value as reference (%f) or with the RMS value without DC as
reference (%r), depending on which reference is chosen in the conguration menu.
7.2.1. THE 3U THD DISPLAY SCREEN
This screen displays the phase-to-phase voltage waveforms for one period and the total harmonic distortion values.
Harmonic distortion for each curve.
Voltage axis with automatic scaling.
Instantaneous value cursor. Use the
or key to move the cursor.
Figure 67: The 3U THD display screen en 3U
7.2.2. THE 4V THD DISPLAY SCREEN
This screen displays the phase-to-neutral voltage waveforms for one period and the total harmonic distortion values.
Harmonic distortion for each curve.
Voltage axis with automatic scaling.
Instantaneous value cursor. Use the
or key to move the cursor.
Instantaneous values of the signals
at the position of the cursor.
t: time relative to the start of the
period.
U1: instantaneous phase-to-phase
voltage between phases 1 and 2
(U12).
U2: instantaneous phase-to-phase
voltage between phases 2 and 3
(U23).
U3: instantaneous phase-to-phase
voltage between phases 3 and 1
(U31).
Instantaneous values of the signals
at the position of the cursor.
t: time relative to the start of the
period.
V1: instantaneous phase-to-neutral
voltage of curve 1.
V2: instantaneous phase-to-neutral
voltage of curve 2.
V3: instantaneous phase-to-neutral
voltage of curve 3.
VN: instantaneous value of the neutral voltage.
Figure 68: the 4V THD display screen
54

7.2.3. THE 4A THD DISPLAY SCREEN
This screen displays the phase current waveforms for one period and the total harmonic distortion values.
Harmonic distortion for each curve.
Current axis with automatic scaling.
Instantaneous value cursor. Use the
or key to move the cursor.
Figure 69: The 4A THD display screen
Note: Filters L1, L2, L3 and N display the total current and voltage harmonic distortion for phases 1, 2 and 3 and the neutral channel.
Instantaneous values of the signals
at the position of the cursor.
t: time relative to the start of the
period.
A1: instantaneous current of phase
1.
A2: instantaneous current of phase
2.
A3: instantaneous current of phase
3.
AN: instantaneous value of the neutral current.
7.3. MEASUREMENT OF THE PEAK FACTOR
The CF sub-menu displays the waveforms of the signals measured over one period and the voltage and current peak factors.
7.3.1. THE 3U CF DISPLAY SCREEN
This screen displays the phase-to-phase voltage waveforms of one period and the peak factors.
Peak factor for each curve.
Voltage axis with automatic scaling.
Instantaneous value cursor. Use the
or key to move the cursor.
Figure 70: The 3U CF display screen
7.3.2. THE 4V CF DISPLAY SCREEN
This screen displays the phase-to-neutral voltage waveforms of one period and the peak factors.
Peak factor for each curve.
Voltage axis with automatic scaling.
Instantaneous value cursor. Use the
or key to move the cursor.
Figure 71: The 3V CF display screen
Instantaneous values of the signals
at the position of the cursor.
t: time relative to the start of the
period.
U1: instantaneous phase-to-phase
voltage between phases 1 and2 (U12).
U2: instantaneous phase-to-phase
voltage between phases 2 and 3 (U23).
U3: instantaneous phase-to-phase
voltage between phases 3 and 1 (U31).
Instantaneous values of the signals
at the position of the cursor.
t: time relative to the start of the
period.
V1: instantaneous phase-to-neutral
voltage of curve 1.
V2: instantaneous phase-to-neutral
voltage of curve 2.
V3: instantaneous phase-to-neutral
voltage of curve 3.
VN: instantaneous value of the
phase-to-neutral voltage of the
neutral.
55

7.3.3. THE 4A CF DISPLAY SCREEN
This screen displays the current waveforms of one period and the peak factors.
Peak factor for each curve.
Current axis with automatic scaling.
Instantaneous value cursor. Use the
or key to move the cursor.
Figure 72: The 4A CF display screen
Note: L1, L2, L3 and N display the current and voltage peak factors for phases 1, 2 and 3, respectively and the neutral channel.
Instantaneous values of the signals
at the position of the cursor.
t: time relative to the start of the
period.
A1: instantaneous current of phase 1.
A2: instantaneous current of phase 2.
A3: instantaneous current of phase 3.
AN: instantaneous value of the cur-
rent of the neutral.
7.4. MEASUREMENT OF EXTREME AND MEAN VOLTAGE AND CURRENT
The sub-menu displays the one-second mean and half-cycle maximum and minimum RMS voltage and current and the instantaneous positive and negative peak voltage and current.
Note: The MAX. and MIN. RMS measurements are calculated every half cycle (i.e. every 10 ms for a 50-Hz signal). The measure-
ments are refreshed every 250 ms.
The RMS measurements are calculated over one second.
7.4.1. THE 3U MAX.-MIN. DISPLAY SCREEN
This screen displays the one-second mean and half-cycle maximum and minimum RMS values and the positive and negative
phase-to-phase voltage peaks.
Columns of values for each curve (1, 2, and 3).
MAX: maximum RMS phase-to-phase voltage since the switching on of the device
or since the last time the key was pressed.
RMS: true RMS phase-to-phase voltage.
MIN: minimum RMS phase-to-phase voltage since the switching on of the device
or since the last time the key was pressed.
PK+: maximum (positive) peak phase-to-phase voltage since the switching on of
the device or since the last time the key was pressed.
PK-: minimum (negative) peak phase-to-phase voltage since the switching on of
the device or since the last time the key was pressed.
Figure 73: The 3U Max.-Min. display screen
56

7.4.2. THE 4V MAX.-MIN. DISPLAY SCREEN
This screen displays the one-second mean and half-cycle maximum and minimum RMS values and the positive and negative
peaks of the phase-to-neutral voltages and of the neutral.
Column of values for the neutral: RMS, PEAK+ and PEAK- parameters.
Columns of values for each voltage curve (1, 2 and 3).
MAX: maximum RMS phase-to-neutral voltage since the switching on of the device
or since the last time the key was pressed.
RMS: true RMS phase-to-neutral voltage.
MIN: minimum RMS phase-to-neutral voltage since the switching on of the device
or since the last time the key was pressed.
PK+: maximum peak phase-to-neutral voltage since the switching on of the device
or since the last time the key was pressed.
PK-: minimum peak phase-to-neutral voltage since the switching on of the device
or since the last time the key was pressed.
Figure 74: The 4V Max.-Min. display screen
7.4.3. THE 4A MAX.-MIN. DISPLAY SCREEN
This screen displays the one-second mean and half-cycle maximum and minimum RMS values and the positive and negative peak
values of the phase and neutral currents.
Column of values for the neutral: RMS, PEAK+ and PEAK- parameters.
Columns of values for each current curve (1, 2 and 3).
MAX: maximum RMS current since the switching on of the device or since the last
time the key was pressed.
RMS: true RMS current.
MIN: minimum RMS current since the switching on of the device or since the last
time the key was pressed.
PK+: maximum peak current since the switching on of the device or since the last
time the key was pressed.
PK-: minimum peak current since the switching on of the device or since the last
time the key was pressed.
Figure 75: The 4A Max.-Min. display screen
7.4.4. THE L1 MAX.-MIN. DISPLAY SCREEN
This screen displays the one-second mean and half-cycle maximum and minimum RMS values and the positive and negative
peaks of the phase-to-neutral voltage and of the current of phase 1.
The same information as for the phase-to-neutral voltage, but for the current.
Column of voltage values.
MAX: maximum RMS phase-to-neutral voltage since the switching on of the device
or since the last time the key was pressed.
RMS: true RMS phase-to-neutral voltage.
MIN: minimum RMS phase-to-neutral voltage since the switching on of the device
or since the last time the key was pressed.
PK+: phase-to-neutral maximum peak voltage since the switching on of the device
or since the last time the key was pressed.
PK-: phase-to-neutral minimum peak voltage since the switching on of the device
or since the last time the key was pressed.
Figure 76: The L1 Max.-Min. display screen
Note: L2 and L3 display the RMS, maximum, minimum, and mean values and the positive and negative peak values of the phase-
to-neutral voltage and of the current for phases 2 and 3, respectively.
57

7.4.5. THE NEUTRAL MAX.-MIN. DISPLAY SCREEN
This screen displays the RMS values and the positive and negative peaks of the neutral relative to earth.
Column of voltage values.
RMS: true RMS voltage.
PK+: maximum peak voltage since
the switching on of the device or
since the last time the key was
pressed.
PK-: minimum peak voltage since
the switching on of the device or
since the last time the key was
pressed.
Figure 77: The neutral Max.-Min. display screen
The same information as for the voltage, but for the current.
7.5. SIMULTANEOUS DISPLAY
The sub-menu displays all of the voltage and current measurements (RMS, DC, THD, CF, PST, PLT, FHL and FK).
7.5.1. 3U SIMULTANEOUS DISPLAY SCREEN
This screen displays the RMS, DC, THD, and CF values of the phase-to-phase voltages.
Column of phase-to-phase voltages (phases 1, 2, and 3).
RMS: true RMS value calculated over 1 second.
DC: DC component.
THD: total harmonic distortion with the fundamental RMS value as reference (%f)
or with the total RMS value without DC as reference (%r).
CF: peak factor calculated over 1 second.
Figure 78: 3U simultaneous display screen
7.5.2. 4V SIMULTANEOUS DISPLAY SCREEN
This screen displays the RMS, DC, THD, CF, PST and PLT values of the phase-to-neutral voltages and of the neutral.
Column of RMS and DC values along with the CF and the THD (%r) concerning
the neutral.
Column of voltages simple (phases 1, 2, and 3).
RMS: true RMS value calculated over 1 second.
DC: DC component.
THD: total harmonic distortion with the fundamental RMS value as reference (%f)
or with the total RMS value without DC as reference (%r).
CF: peak factor calculated over 1 second.
PST: short-term icker calculated over 10 minutes.
PLT : long-term icker calculated over 2 hours.
Figure 79: 4V simultaneous display screen
58

7.5.3. 4A SIMULTANEOUS DISPLAY SCREEN
This screen displays the RMS, DC (only if at least one of the current sensors can measure direct current), THD, CF, FHL and FK
values of the phase and neutral currents.
Column of RMS values and (if the current sensor allows) DC values along with the
CF and the THD (%r) concerning the neutral.
Columns of current values (phases 1, 2 and 3).
RMS: true RMS value calculated over 1 second.
DC: DC component.
THD: total harmonic distortion with the fundamental RMS value as reference (%f)
or with the total RMS value without DC as reference (%r).
CF: peak factor calculated over 1 second.
FHL: harmonic loss factor. For the oversizing of transformers to allow for harmonics.
FK: K factor. Derating of the transformer as a function of the harmonics.
Figure 80: 4A simultaneous display screen
Note: To make it possible to adjust the zero of current sensors measuring DC, the DC values are never cancelled.
7.5.4. L1 SIMULTANEOUS DISPLAY SCREEN
This screen displays the RMS, DC, THD, and CF values of the phase-to-neutral voltage and of the current, PST and PLT of the
phase-to-neutral voltage, and FHL and FK of the current for phase 1.
Column of voltage values simple.
RMS: true RMS value calculated
over 1 second.
DC: DC component.
THD: total harmonic distortion with
the fundamental RMS value as reference (%f) or with the total RMS value
without DC as reference (%r).
CF: peak factor calculated over 1
second.
PST: short-term icker calculated
over 10 minutes.
PLT: long-term flicker calculated
over 2 hours.
Figure 81: L1 simultaneous Display screen
Notes: The DC value of the current of phase 1 is displayed only if the associated current sensor can measure direct current.
L2 and L3 provide the simultaneous display of the current and voltage for phases 2 and 3, respectively.
7.5.5. SCREEN FOR SIMULTANEOUS DISPLAY OF NEUTRAL
This screen displays the RMS, THD and CF voltage and current of the neutral, the DC component of the neutral voltage, and (if
the current sensor allows) the DC component of the neutral current.
Current column.
RMS, DC (if the current sensor allows), THD and CF values.
FHL: harmonic loss factor. For the
oversizing of transformers to allow
for harmonics.
FK: K factor. Derating of the transformer as a function of the harmonics.
59

7.6. DISPLAY OF FRESNEL DIAGRAM
The sub-menu displays a vector representation of the fundamentals of the voltages and currents. It indicates their associated
quantities (modulus and phase of the vectors) and the negative-sequence voltage and current unbalance rates.
Note: To allow the display of all vectors, those of which the modulus is too small to be pictured are shown even so, but their name
is followed by an asterisk (*).
7.6.1. THE 3V FRESNEL DIAGRAM DISPLAY SCREEN
This screen displays a vector representation of the fundamentals of the phase-to-neutral voltages and of the currents. It indicates
their associated quantities (modulus and phase of the phase-to-neutral voltage vectors) and the negative-sequence voltage unbalance rate. The reference vector of the representation (at 3 o’clock) is V1.
Column of values for each vector (1,
2, and 3).
|V1|, |V2| and |V3|: module of the
vectors of the fundamentals of the
phase-to-neutral voltages (phases
1, 2 and 3).
Φ12: phase angle of the fundamental
of phase 1 with respect to the fundamental of phase 2.
Φ23: phase angle of the fundamental
of phase 2 with respect to the fundamental of phase 3.
Φ31: phase angle of the fundamental
of phase 3 with respect to the fundamental of phase 1.
Vunb: negative-sequence voltage unbalance rate.
Discs indicating potential saturation
of the channel.
Fresnel diagram.
Figure 82: The screen Displaying the Fresnel diagram in 3V
7.6.2. THE 3U FRESNEL DIAGRAM DISPLAY SCREEN
This screen displays a vector representation of the fundamentals of the phase-to-phase voltages and of the currents. It indicates
their associated quantities (modulus and phase of the phase-to-phase voltage vectors) and the negative-sequence voltage unbalance rate. The reference vector of the representation (at 3 o’clock) is U1.
The information displayed is identical to that described in §7.6.1 but relative to the phase-to-phase voltage.
7.6.3. THE 3A FRESNEL DIAGRAM DISPLAY SCREEN
For sources having a neutral, this screen displays the vector representation of the fundamental component of the phase-to-neutral
voltages and of the current. For 3-wire three-phase (source without neutral), this screen displays only the vector representation
of the fundamental components of the current. It indicates their associated quantities (modulus and phase of the current vectors)
and negative-sequence current unbalance rate. The reference vector of the representation (at 3 o’clock) is A1.
The information displayed is identical to that described in §7.6.1 but relative to the current.
60

7.6.4. THE L1 FRESNEL DIAGRAM DISPLAY SCREEN
In the presence of the neutral, this screen displays a vector representation of the fundamentals of the phase-to-neutral voltages
and the currents of one phase. It indicates their associated quantities (modulus and phase of the current and phase-to-neutral
voltage vectors). The reference vector of the representation (at 3 o’clock) is the current vector.
|V1|: modulus of the vector of the
fundamental of the phase-to-neutral
voltage of phase 1.
Discs indicating potential saturation
of the channel.
|A1|: modulus of the vector of the
fundamental of the current of phase 1.
ΦVA: phase angle of the fundamental
of the phase-to-neutral voltage of
phase 1 relative to the fundamental
of the current of phase 1.
Figure 83: The L1 Fresnel diagram display screen
Note: L2 and L3 display vector representations of the fundamentals of the phase-to-neutral voltages and the currents of phases
2 and 3, respectively. They indicate their associated quantities (modulus and phase of the current and phase-to-neutral
voltage vectors of phases 2 and 3, respectively). The reference vector of the representation (at 3 o’clock) is the current
vector (A2 and A3, respectively).
In the absence of the neutral (2-wire two-phase):
|U1|: modulus of the vector of the
fundamental component of the
phase-to-phase voltage between
phases 1 and 2 (U12 ).
|A1|: modulus of the vector of the
fundamental of the current of phase 1.
ΦUA: phase shift of the fundamental
component of the phase-to-phase
voltage between phases 1 and 2
(U
) with respect to the fundamental
12
component of the current of phase 1.
Figure 84: the Fresnel diagram display screen in 2-wire two-phase
Discs indicating potential saturation
of the channel.
61

8. ALARM MODE
The Alarm mode detects overshoots of thresholds on each of the following parameters:
Hz, Urms, Vrms, Arms, |Udc|, |Vdc|, |Adc|, |Upk+|, |Vpk+|, |Apk+|, |Upk-|, |Vpk-|, |Apk-|, Ucf, Vcf, Acf, Uthdf, Vthdf, Athdf, Uthdr,
Vthdr, Athdr, |P|, |Pdc|, |Q1| or N, D, S, |PF|, |cos Φ|, |tan Φ|, PST, PLT, FHL, FK, Vunb, Uunb (for a three-phase source without
neutral) Aunb, U-h, V-h, A-h and |S-h| (see the table of abbreviations in §2.8).
The alarm thresholds:
must have been programmed in the Conguration / Alarm mode screen (see §4.10).
must be active (marked with a red spot on that same screen).
Stored alarms can subsequently be transferred to a PC via the PAT2 application (see §13). You can capture over 16,000 alarms.
List of alarm campaigns (see §8.3).
Access to Alarm mode conguration
(see §8.1).
Programming an alarm campaign
(see §8.2).
Figure 85: The Alarm Mode screen
The and icons have the following functions:
: Validating the programming of a campaign and starting the alarm campaign.
: Voluntary stoppage of alarm campaign.
8.1. ALARM MODE CONFIGURATION
The submenu displays the list of alarms congured (see §4.10). This shortcut key lets you dene or change alarm congurations.
The following information is displayed.
Press to return to the Programming a campaign screen.
8.2. PROGRAMMING AN ALARM CAMPAIGN
The submenu is used to specify the start and stop times for an alarm campaign (see gure 66).
To program an alarm campaign, enter the start date and time, the stop date and time, and the name of the campaign.
To modify an item, move the yellow cursor to it using the and keys, then validate with the key. Change the value using the
,, and keys, then validate again.
The name can be at most 8 characters long. Several campaigns may have the same name. The available alphanumeric characters
are the uppercase letters from A to Z and the digits from 0 to 9. The last 5 names given (in the transient, trend, and alarm modes)
are kept in memory. When a name is entered, it may then be completed automatically.
Notes: The start date and time must be later than the current date and time.
The stop date and time must be later than the start date and time.
It is not possible to program an alarm campaign if an inrush current capture is in progress.
Once the programming is done, start the campaign by pressing the key. The icon of the status bar blinks to indicate that the
campaign has been started. The key replaces the key and can be used to stop the campaign before it is nished. Alarms
in progress (not yet ended) are recorded in the campaign if their duration is equal to or greater than their programmed minimum
duration.
62

The Campaign on standby message is displayed until the start time is reached. It is then replaced by the message Campaign
running . When the stop time is reached, the Programming a Campaign screen returns with the key. You can then program
another campaign.
During an alarm campaign, only the stop date eld can be modied. It is automatically highlighted in yellow.
8.3. DISPLAY OF THE LIST OF CAMPAIGNS
To display the list of campaigns performed, press the key. The List of Alarm Campaigns screen is displayed. The list can
contain up to 7 campaigns.
Name of the campaign.
Start date and time of the campaign.
Stop date and time of the campaign.
Figure 86: list of campaigns display screen
If the stop date of the campaign is in red, it means that it does not match the stop date initially programmed:
either because of a power supply problem (battery low or disconnection of the device supplied by mains only),
or because the memory is full.
8.4. DISPLAY OF LIST OF ALARMS
To select a campaign, move the cursor to it using the and keys. The selected eld is bolded. Then validate with the key.
The device then displays the alarms in list form.
Level of lling dedicated to the alarm
mode. The black part of the bar corresponds to the fraction of memory
used.
Alarm date and time.
Target of the alarm detected.
Type of alarm detected.
Figure 87: Alarm list screen
If an alarm duration is displayed in red, it means that it was cut short:
because of a power supply problem (battery low),
or because of a manual stoppage of the campaign (press on ) or deliberate switching off of the device (press on the key).
or because the memory is full.
or because of a measurement error.
or because of an incompatibility between the quantity monitored and the conguration of the device (for example withdrawal
of a current sensor).
Alarm duration.
Extremum of the alarm detected
(minimum or maximum depending
on the programmed alarm direction).
The choice of lter is dynamic. It
depends on the connection chosen.
In the last two cases, the extremum is also displayed in red.
To return to the List of campaigns screen, press .
63

8.5. DELETING AN ALARM CAMPAIGN
When the list of campaigns performed is displayed (see gure 86), select the campaign to be erased. This is done by moving the
cursor to it using the and keys. The selected campaign is bolded.
Then press the key. Press
Note: It is not possible to delete the alarm campaign in progress.
to validate or to cancel.
8.6. ERASING ALL ALARM CAMPAIGNS
Erasing all of the alarm campaigns is possible only from the Conguration menu, in the Erasure of Data sub-menu (see §4.11)
64

9. TREND MODE
The Trend mode records changes to parameters previously specied in the Conguration / Trend mode screen (see §4.9).
This mode manages up to 2 GB of data.
Memory card usage.
Rapid programming and starting of
recording (see §9.1).
Access to Trend mode conguration
(see §4.9).
Figure 88: Trend mode screen
List of records (see §9.3).
Programming a recording (see §9.1).
Starting a recording (see §9.1).
9.1. PROGRAMMING AND STARTING RECORDING
The submenu species the characteristics of a recording (see gure 88).
To start a recording rapidly, press the key. Recording starts immediately; all measurements are recorded every second until
the memory or completely full. The conguration displayed is .
To program recording, before starting it, choose conguration to , enter the start date and time, the stop date and time,
the period, and the name of the recording.
To modify an item, move the yellow cursor to it using the and keys, then validate with the key. Change the value using the
,, and keys, then validate again.
The integration period is the time over which the measurements of each recorded value are averaged (arithmetic mean). Possible
values for the period are: 1 s, 5 s, 20 s, 1 min, 2 min, 5 min, 10 min and 15 min.
The name can be at most 8 characters long. Several recordings may have the same name. The available alphanumeric characters
are the uppercase letters from A to Z and the digits from 0 to 9. The last 5 names given (in the transient, trend, and alarm modes)
are kept in memory. When a name is entered, it may then be completed automatically.
Notes: The start date and time must be later than the current date and time.
The stop date and time must be later than the start date and time.
Once the programming is done, start recording by pressing the key. If not enough memory is available, the device so indicates.
The icon of the status bar blinks to indicate that recording has begun. The key replaces the key and can be used to
stop the recording before it is nished.
The Recording on standby message is displayed until the start time is reached. It is then replaced by the message Recording
running . When the stop time is reached, the Program a Record screen returns with the key. You can then program a new record-
ing.
During the recording of a trend, only the stop date eld can be modied. It is automatically highlighted in yellow.
9.2. TREND MODE CONFIGURATION
The submenu displays the list of trend recording congurations (see §4.9). This shortcut key lets you specify or modify the
trend recording congurations.
65

9.3. VIEWING THE RECORDING LIST
The submenu displays the recording list already made.
Recording list memory usage. The
black part of the bar corresponds to
the fraction of memory used.
Recording name.
Recording start time.
Figure 89: Recording list display screen
If the stop date is in red, it means that it does not match the stop date initially programmed, because of a power supply problem
(battery low or disconnection of the device supplied by mains only).
Recording stop time.
9.4. DELETING RECORDINGS
When the list of records is displayed (see gure 89), select the recording to be erased. This is done by moving the cursor to it using
the and keys. The selected recording is bolded.
Then press the key. Press
to validate or to cancel.
9.5. VIEWING THE RECORDS
9.5.1. CHARACTERISTICS OF THE RECORD
When the list of records is displayed (see gure 89), select the record to be displayed. This is done by moving the cursor to it using
the and keys. The selected recording is bolded. Then press
to validate.
The icon is used to navigate in
the following screen pages. It is also
Types of measurement chosen in the
conguration used.
Figure 90: Recording list display screen
If a measurement does not appear in the tabs, it is because calculation of this measurement was incompatible with the conguration chosen (connection, types of sensors, ratios programmed).
For example, if the calculation mode chosen during the programming is Non-active Quantities not broken down (see §4.5.1), the
D tab does not appear.
Press a yellow key to display the curve.
possible to use the or key.
66

9.5.2. TREND CURVES
Date of the cursor.
This screen is a partial view of the
trend curve. There are other screens
before and after the visible part.
Use the or key to move the
cursor.
Figure 91: Vrms (4L) without MIN-AVG-MAX
The display period of this curve is one minute. Since the period of the record is one second, each point of this curve corresponds
to a value recorded in a one-second window once a minute. There is therefore a substantial loss of information (59 values out of
60), but the display is rapid.
Notes: Values of the cursor in red indicate saturated values.
Black dashes - - - - indicate erroneous values.
Red dashes - - - - indicate values that are not calculated (following the end of calculation of the MIN-MAX-AVG mode when
is pressed).
Position of the viewing window in
the record.
To select the display lter, press the
or key.
The MIN-AVG-MAX mode has been
activated.
Figure 92: Vrms (4L) with MIN-AVG-MAX
The display period of this curve is one minute. But with the MIN-AVG-MAX mode activated, each point of this curve represents the
arithmetic mean of 60 values recorded every second. This display is therefore more precise, because there is no loss of informa-
tion, but slower (see the table of gure 108).
To stop the calculation of the MIN-AVG-MAX mode, press .
Remarks: While MIN-AVG-MAX mode is being calculated, a progress bar is displayed for this calculation in the status strip instead
of the recording display window positioning bar.
The MIN-AVG-MAX mode is not available while a trend is being recorded.
To return to the Characteristics of the Record screen, press .
To place the cursor on the rst occurrence of the minimum value.
To change the scale of the display
between 1 minute and 5 days.
To place the cursor on the rst occurrence of the maximum value.
Figure 93: Vrms (N) without MIN-AVG-MAX
Pressing the or key automatically sets the zoom in to the highest level (display period identical to the recording period)
and de-activates the MIN-AVG-MAX mode if it was activated.
67

Curve of the maxima.
Curve of the mean.
Curve of the minima.
Figure 94: Vrms (N) with MIN-AVG-MAX
The display period of this curve is one minute. Each point of the mean curve represents the arithmetic mean of 60 values recorded
every second. Each point of the curve of the maxima represents the maximum of the 60 values recorded every second. Each point
of the curve of the minima corresponds to the minimum of the 60 values recorded every second.
This display is therefore more precise than the previous one.
Date of the cursor.
This screen is a partial view of the
trend curve. There are other screens
before and after the visible part.
Use the or key to move the
cursor.
Values of the cursor (minimum,
mean, and maximum).
Position of the viewing window in
the record.
To select the display lter, press the
or key.
Figure 95: Vrms (L1) without MIN-AVG-MAX
For each of the phases (L1, L2, and L3), at each recording of a value over one second (recording period), the device also records
the minimum half-cycle RMS value over one second and the maximum half-cycle RMS value over one second. These are the
three curves shown in the gure above.
The MIN-AVG-MAX mode has been
activated.
Figure 96: Vrms (L1) with MIN-AVG-MAX
This curve differs slightly from the previous one because, with the MIN-AVG-MAX mode, there is no loss of information.
68

Note: For the quantities (P, Pdc, VAR, S, D, PF, cos Φ and tan Φ) and for a three-phase source without neutral, only the total
quantities are represented.
Figure 97: tan Φ (L1) without MIN-AVG-MAX for a three-phase connection with neutral
Figure 98: tan Φ (L1) with MIN-AVG-MAX
The sum of the powers of the three
phases (Σ) is presented in bargraph
form.
To change the scale of the display
between 1 minute and 5 days.
Figure 99: P (Σ) without MIN-AVG-MAX
For the energy curves, the quantities are expressed in Wh, J, toe, or BTU, depending on the unit chosen in the conguration of
the device (see §4.5.2).
Figure 100: P (Σ) with MIN-AVG-MAX
This curve differs slightly from the previous one because, with the MIN-AVG-MAX mode, there is no loss of information.
The MIN-AVG-MAX mode can be activated for the powers to display, above the curve, the mean power value at the cursor date
along with the maximum and minimum power values in the display period. Note that, in contrast with the other quantities, only the
bar chart of mean values is represented.
69

Starting date of the selection.
Energy calculation mode. Pressing
this key lets you dene the start of
the selection.
Figure 101: Ph (Σ) without MIN-AVG-MAX
The display period of this bar chart is one minute. Since the recording period is one second, each bar of this bar chart represents
a value recorded in a one-second window once a minute.
The energy calculation mode determines the sum of the powers on the selected bars.
Date of the cursor (ending date of
the selection). Use the or keys
to move the cursor.
Figure 102: Ph (Σ) with MIN-AVG-MAX
With the MIN-AVG-MAX mode activated, the display differs slightly from the previous one because there is no loss of information.
Date of the cursor.
This screen is a partial view of the
trend curve. There are other screens
before and after the visible part.
Use the or keys to move the
cursor.
Figure 103: cos Φ (L1) without MIN-AVG-MAX
The period of display of this curve is two hours. Since the recording period is one second, each point of this curve represents a
value recorded every second taken every two hours. There is therefore a substantial loss of information (7,199 out of 7,200), but
the display is rapid.
Position of the viewing window in
the record.
To select the display lter, press the
or key.
The MIN-AVG-MAX mode has been
activated.
Figure 104: cos Φ (L1) with MIN-AVG-MAX
70

This curve differs considerably from the previous one, because the MIN-AVG-MAX mode is activated. Each point of the mean
curve represents the arithmetic mean of 7,200 values recorded every second. Each point of the curve of the maxima represents
the maximum of the 7,200 values recorded every second. Each point of the curve of the minima corresponds to the minimum of
the 7,200 values recorded every second.
This display is therefore more precise, because there is no loss of information, but slower (see the table in gure 108).
The user can stop the loading of the
recorded values and the calculation
of the values displayed at any time
by pressing this key.
Figure 105: cos Φ (L1) loading/calculation of values.
The dashes indicate that the value
is not available at the cursor position
because it was not calculated.
Figure 106: cos Φ (L1) loading/calculation of values aborted.
Display of the record is not complete because construction was stopped before the end.
Figure 107: cos Φ (L1) loading/calculation of complete values without MIN-AVG-MAX
for a three-phase connection with neutral.
The display has not been stopped and is therefore complete.
To change the scale of the display
between 1 minute and 5 days.
71

The following table indicates the time needed to display the curve on screen as a function of the width of the display window for
a recording period of one second:
Typical waiting time for
Width of display window
(60 points or increments)
5 days 2 hours
2,5 days 1 hour
15 hours 15 minutes
10 hours 10 minutes
5 hours 5 minutes
1 hour 1 minute
20 minutes 10 seconds
5 minutes 5 seconds
1 minute 1 second
These times can be long, so it has been made possible to stop the display at any time by pressing the key.
It is also possible, at any time:
to press the or key to change the scale of the display,
to press the or key to move the cursor,
to press the or key to change the display lter.
But note that this may restart the loading and/or calculation of the values from the beginning.
Grid increment
Figure 108: Display Times table
display with the
MIN-AVG-MAX mode
deactivated
11 seconds
6 seconds
2 seconds
2 seconds
1 second
1 second
1 second
1 second
1 second
Typical waiting time for
display with the
MIN-AVG-MAX mode
activated
10 minutes
5 minutes
1 minute 15 seconds
50 seconds
25 seconds
8 seconds
2 seconds
1 second
1 second
72

10. POWER AND ENERGY MODE
The key displays power- and energy-related measurements.
The sub-menus available depend on the lter.
For 2- and 3-wire single-phase connections and for the 2-wire two-phase connection, only selection L1 is available. The lter
is therefore not displayed, but the display is the same as for L1.
For the 3-wire three-phase connection, only the Σ selection is available. The lter is therefore not displayed, but the display is
the same as for Σ.
10.1. 3L FILTER
10.1.1. THE POWERS DISPLAY SCREEN
The W... sub-menu is used to display the powers.
Active power.
DC power (only if a DC current
sensor is connected).
Reactive power.
Distortion power.
Apparent power.
Figure 109: the 3L Powers screen.
Note: This screen corresponds to the choice “non-active quantities broken down” in the AR tab of the Calculation Methods menu of
the Conguration mode. If the choice had been “non-active quantities not broken down”, then the D label (distortion power)
would have disappeared and the Q1 label would have been replaced by the N label. This non-active power is unsigned and
has no inductive or capacitive effect.
10.1.2. THE QUANTITIES ASSOCIATED WITH THE POWERS DISPLAY SCREEN
The PF sub-menu... displays the quantities associated with the powers.
Power factor.
Fundamental power factor (also
called displacement factor - DPF).
Tangent of the phase shift.
Phase shift of the voltage with
respect to the current.
Figure 110: the Quantities Associated with the Powers screen in 3L
73

10.1.3. THE ENERGIES CONSUMED DISPLAY SCREEN
The sub-menu displays the meters of energy consumed by the load.
Active energy.
DC energy (only if a DC current sensor is connected).
Reactive energy.
Distortion energy.
Apparent energy.
Figure 111: the Energies Consumed display screen in 3L
Note: This screen corresponds to the choice “non-active quantities broken down” in the VAR tab of the Calculation Methods menu
of the Conguration mode. If the choice had been “non-active quantities not broken down”, then the Dh label (distortion
energy) would have disappeared and the Q1h label would have been replaced by the Nh label. This non-active energy has
no inductive or capacitive effect.
10.1.4. THE ENERGIES GENERATED DISPLAY SCREEN
The sub-menu displays the meters of the energy generated by the load.
Active energy.
DC energy (only if a DC current sensor is connected).
Inductive reactive effect .
Capacitive reactive effect .
Inductive reactive effect .
Reactive energy.
Distortion energy.
Apparent energy.
Figure 112: the Energies Generated display screen in 3L
Note: This screen corresponds to the choice “non-active quantities broken down” in the VAR tab of the Calculation Methods menu
of the Conguration mode. If the choice had been “non-active quantities not broken down”, then the Dh label (distortion
energy) would have disappeared and the Q1h label would have been replaced by the Nh label. This non-active energy has
no inductive or capacitive effect.
Capacitive reactive effect .
10.2. FILTERS L1, L2 AND L3
10.2.1. THE POWERS AND ASSOCIATED QUANTITIES DISPLAY SCREEN
The W... sub-menu displays the powers and associated quantities.
Active power.
Power factor (PF).
DC power.
Fundamental power factor (also
Reactive power.
Distortion power.
called displacement factor - DPF).
Tangent of the phase shift.
Apparent power.
Figure 113: the Powers and Associated Quantities display screen in L1
Phase shift of voltage with respect
to current.
74

Notes: This screen corresponds to the choice “non-active quantities broken down” in the VAR tab of the Calculation Methods
menu of the Conguration mode. If the choice had been “non-active quantities not broken down”, then the D label (distortion power) would have disappeared and the Q1 label would have been replaced by the N label. This non-active power has
no inductive or capacitive effect.
Filters L2 and L3 display the same information for phases 2 and 3.
Φ
is displayed for the 2-wire two-phase set-up.
UA
10.2.2. THE ENERGY METERS DISPLAY SCREEN
The Wh... sub-menu displays the energy meters.
Meters of the energy consumed by
the load.
Meters of the energy generated by
the load.
Active energy.
DC energy (only if a DC current sensor is connected).
Inductive reactive effect .
Reactive energy.
Distortion energy.
Capacitive reactive effect .
Apparent energy.
Figure 114: the Energies Consumed and Generated display screen in L1
Notes: This screen corresponds to the choice «non-active quantities broken down» in the VAR tab of the Calculation Methods
menu of the Conguration mode. If the choice had been «non-active quantities not broken down», then the Dh label (distortion energy) would have disappeared and the Q1h label would have been replaced by the Nh label. This non-active energy
has no inductive or capacitive effect.
Filters L2 and L3 display the same information for phases 2 and 3.
10.3. FILTER Σ
10.3.1. THE TOTAL POWERS AND ASSOCIATED QUANTITIES DISPLAY SCREEN
The W... sub-menu displays the powers and associated quantities.
Total active power.
Total DC power.
Total reactive power.
Total power factor.
Total fundamental power factor (also
called displacement factor - DPF).
Total distortion power.
Total apparent power.
Total tangent.
Figure 115: the Total Powers and Associated Quantities display screen in Σ
Note: This screen corresponds to the choice “non-active quantities broken down” in the VAR tab of the Calculation Methods menu
of the Conguration mode. If the choice had been “non-active quantities not broken down”, then the D label (distortion
power) would have disappeared and the Q1 label would have been replaced by the N label. This non-active power has no
inductive or capacitive effect.
75

10.3.2. THE TOTAL ENERGY METERS DISPLAY SCREEN
The Wh... sub-menu displays the energy meters.
Meters of energy consumed by the
load.
Total active energy.
Total DC energy (only if a DC current
sensor is connected).
Total reactive energy.
Total distortion energy.
Total apparent energy.
Figure 116: the Total Energies Consumed and Generated display screen in Σ
Notes: This screen corresponds to the choice “non-active quantities broken down” in the VAR tab of the Calculation Methods menu
of the Conguration mode. If the choice had been “non-active quantities not broken down”, then the Dh label (distortion
energy) would have disappeared and the Q1h label would have been replaced by the Nh label. This non-active energy has
no inductive or capacitive effect.
For the 3-wire three-phase set-up, only the display of total quantities is available, the method of calculation of the powers
used is the two-wattmeter method (with 2 sensors connected) or the three-wattmeter method with virtual neutral (with 3
sensors connected) (see Appendix, §16.1.4.3).
Meters of the energy generated by
the load.
Total inductive reactive effect .
Total capacitive reactive effect .
10.4. STARTING ENERGY METERING
To start an energy metering, press the key in an energies display screen ( , , or Wh...).
The start date and time of the energy
metering.
The icon is used to suspend the
energy metering.
Figure 117: the Energy Metering Start-up screen in Wh
The blinking symbol indicates that
energy metering is in progress.
Figure 118: the Energy Metering screen in varh
The diagram used is the 4-quadrant diagram (see §16.5).
Note: The non-nullity threshold is 11.6 kWh for non-nuclear toe and 3.84 kWh for nuclear toe.
76

10.5. DISCONNECTION OF ENERGY METERING
To suspend energy metering, press .
The stop date and time of the metering are displayed alongside the start
date and time.
Figure 119: the Energy Metering screen in varh
A disconnection of the metering is not denitive. It can be resumed by pressing the key again.
Note: If no recording is in progress, then disconnecting the energy metering leads to the appearance of the blinking symbol in
the status bar (in place of the symbol). Disconnecting the energy metering also leads to the replacement of the key
by the key.
10.6. RESET OF ENERGY METERING
To suspend the metering, press the key. Then, to reset energy metering, press the key and validate with the key. All
energy values (consumed and generated) are then reset.
77

11. SCREEN SNAPSHOT MODE
The key can be used to take up to 50 screen snapshots and display the recorded snapshots.
Saved screens may then be transferred to a PC using the PAT2 application (Power Analyser Transfer).
11.1. SCREEN SNAPSHOTS
Press the key for approx. 3 seconds to shoot any screen .
When a screen snapshot is taken, the icon of the active mode ( , , , , , , ) in the top strip of the display
unit is replaced by the icon. You can then release the key .
The device can record only 50 screen snapshots. If you want to record a 51st screen, the device informs you that snapshots must
be deleted by displaying the icon in place of .
11.2. HANDLING OF SCREEN SNAPSHOTS
To enter screen snapshot mode, briey press the key. The device then displays a list of recorded screen snapshots.
Indicator of available image memory.
The black bar represents memory
used and the white bar represents
memory available.
Icons for browsing in screen pages.
Figure 120: the List of Screen Snapshots display screen
11.2.1. VIEWING A SNAPSHOT FROM THE LIST
To view a snapshot, select it in the list of screen snapshots using the , , and keys. The date and time of the selected
snapshot are bolded.
Press
the snapshot was taken ( , , , , , , ).
Press to return to the list of screen snapshots.
11.2.2. DELETING A SNAPSHOT FROM THE LIST
To delete a snapshot, select it in the list of screen snapshots using the , , and keys. The date and time of the selected
snapshot are bolded.
to display the selected snapshot. The icon is displayed in alternation with the icon for the mode that was active when
List of saved snapshots. Each icon
represents the type of screen recorded. It is followed by the date and
time of the screen snapshot.
Display of the list of screen snapshots.
Deleting a screen snapshot.
Press the key and validate by pressing . The snapshot then disappears from the list.
To cancel the deletion, press rather than .
78

12. HELP KEY
The key provides information about the key functions and symbols used in the current display mode.
The following information is displayed:
Reminder of the mode used.
Help in progress.
List of information concerning the
Help page 2.
Help page 1.
Figure 121: The help screen for the powers and energies mode, page 1
keys and icons.
List of symbols used on the page.
Figure 122: the screen of the help page for the powers and energies mode, page 2
79

13. DATA EXPORT SOFTWARE
The PAT2 (Power Analyser Transfer 2) data export software supplied with the device is used to transfer the data recorded in the
device to a PC.
To install it, load the installation CD in the CD drive of your PC, then follow the instructions on screen.
Then connect the device to the PC using the USB cord supplied, after removing the cover that protects the USB port on the device.
C.A 8436
POWER & QUALITY ANALYSER
QUALI
STAR
+
Switch the device on by pressing the key and wait for your PC to detect it.
The PAT2 transfer software automatically denes the communication rate between the PC and the device.
Note: All measurements recorded in the device can be transferred to the PC via the USB link, using the PAT2 program. The transfer
does not erase the recorded data unless the user explicitly asks it to.
The data stored in the memory card can also be read on a PC, using an SD card reader and the PAT2 program. For an
explanation of how to withdraw the memory card, refer to §17.4.
For directions for using the data export software, use its Help function or refer to its user manual.
80

14. GENERAL SPECIFICATIONS
14.1. ENVIRONMENTAL CONDITIONS
The following chart shows conditions relating to ambient temperature and humidity:
%RH
95
85
75
3 4
45
10
-20 0 20 26 35 42,5 50 70
2
1
Caution: at temperatures above 40°C, the device must be powered by the battery alone OR by the mains power unit alone. The
device must not be used with both the battery AND the mains power unit.
1 = Reference range.
2 = Range for use.
3 = Range for storage with batteries.
4 = Range for storage without batteries.
°C
Altitude :
Use < 2 000 m
Storage < 10 000 m
Degree of pollution : 2.
Use indoors.
14.2. MECHANICAL CONDITIONS
Dimensions (L x W x H) 270 mm x 250 mm x 180 mm
Weight approximately 3.7 kg
Screen 118 mm x 90 mm, diagonal 148 mm
Ingress protection IP 67 as per EN 60529 with the housing closed and the protecting plugs on the terminals.
IP 54 with cover open, instrument not in operation (terminals not connected and nothing pressed on
the keyboard).
IP 50 with cover open and instrument in operation.
Fall 100 mm on each edge as per IEC 61010-1
14.3. OVERVOLTAGE CATEGORIES PER IEC 61010-1
The device is compliant with IEC 61010-1, 600 V category IV or 1000 V category III.
the use of AmpFlex® or of MiniFlex® or C193 clamps keeps the “device + current sensor” system at 600 V category IV or 1000
V category III.
the use of PAC93, J93, MN93, MN93A, or E3N clamps downgrades the “device + current sensor” system to 300 V category IV
or 600 V category III.
the use of the 5 A adapter unit downgrades the “device + current sensor” system to 150 V category IV or 300 V category III.
Double insulation between the inputs/outputs and earth.
Double insulation between the voltage inputs, the power supply, and the other inputs/outputs.
81

14.4. ELECTROMAGNETIC COMPATIBILITY
Emissions and immunity in an industrial setting compliant with IEC 61326-1.
As regards electromagnetic emissions, the device belongs to group 1, class A, under standard EN55011. Class A devices are
intended for use in industrial environments. There may be difculties ensuring electromagnetic compatibility in other environments,
because of conducted and radiated disturbance.
As regards immunity to radio frequency elds, the device is equipment intended for use at industrial sites under standard IEC61326-1.
For the AmpFlex® and MiniFlex® sensors:
An (absolute) inuence of 2% may be observed on the current THD measurement in the presence of a radiated electric eld.
An inuence of 0.5 A may be observed on the RMS current measurement in the presence of conducted radio frequencies.
An inuence of 1 A may be observed on the RMS current measurement in the presence of a magnetic eld.
14.5. POWER SUPPLY
14.5.1. EXTERNAL POWER SUPPLY
Range of use: 110 to 1,000 V and DC to 440 Hz.
Input current: 0.8 ARMS max.
14.5.2. BATTERY POWER SUPPLY
The device is supplied by a 9.6 V, 4000 mAh battery pack, comprising 8 rechargeable NiMH elements.
Battery 8 NiMH storage cells.
Capacity 4000 mAh nominal.
Nominal voltage 1,2 V per cell, or a total of 9.6 V.
Life at least 300 charge-discharge cycles.
Charging current 1 A.
Charging time approx. 5 hours
Service T° [0 °C ; 50 °C].
Charging T° [10 °C ; 40 °C].
Storage T° storage ≤ 30 days: [-20 °C ; 50 °C].
storage for 30 to 90 days: [-20 °C ; 40 °C].
storage for 90 days to 1 year: [-20 °C ; 30 °C].
If the device is to be left unused for an extended period, remove the battery (see § 17.3).
14.5.3. CONSUMPTION
Typical consumption of the device
on mains (mA)
Active power (W) 17 6
Apparent power (VA) 30 14
RMS current (mA) 130 60
14.5.4. BATTERY LIFE
Battery life is 10 hours when the battery delivered with the device is fully charged, with the display screen on. If the display screen
is off (saving energy), battery life is more than 15 hours.
Battery being
charged
Battery charged
82

14.5.5. DISPLAY UNIT
The display unit is an active matrix (TFT) LCD type having the following characteristics:
5.7” diagonal
resolution 320 x 240 pixels (1/4 VGA)
colour
minimum luminosity 210 cd/m², typical 300 cd/m²
response time between 10 and 25 ms
angle of view 80° in all directions
excellent rendering from 0 to 50°C
83

15. FUNCTIONAL CHARACTERISTICS
15.1. REFERENCE CONDITIONS
This table indicates the reference conditions of the quantities to be used by default in the characteristics indicated in § 15.3.4.
Parameter Reference conditions
Ambient temperature 23 ± 3 °C
Humidity (relative humidity) [45 %; 75 %]
Atmospheric pressure [860 hPa ; 1060 hPa]
Phase-to-neutral voltage [50 Vrms ; 1000 Vrms] without DC (< 0.5 %)
Standard current circuit input voltage
(Except Flex® type current sensors)
Unamplied Rogowski current circuit input voltage
(Flex® type current sensors)
Amplied Rogowski current circuit input voltage
(Flex® type current sensors)
Frequency of electrical network 50 Hz ± 0,1 Hz or 60 Hz ± 0,1 Hz
Phase shift
Harmonics < 0,1 %
Voltage unbalance < 10 %
Voltage ratio 1 (unity)
Current ratio 1 (unity)
Voltages measured (not calculated)
Current sensors actual (not simulated)
Power supply Battery only
Electric eld
Magnetic eld < 40 A.m-1 DC (earth’s magnetic eld)
(1) The values of A
are given in the table below.
nom
[30 mVrms ; 1 Vrms] without DC (< 0.5 %)
(1)
A
⇔ 1 Vrms
nom
3 × A
(1)
÷ 100 ó 30 mVrms
nom
[11.73 mVrms ; 391 mVrms] without DC (< 0,5 %)
10 kArms ⇔ 391 mVrms to 50 Hz
300 Arms ⇔ 11.73 mVrms to 50 Hz
[117.3 µVrms ; 3.91 mVrms] without DC (< 0,5 %)
100 Arms ⇔ 3.91 mVrms to 50 Hz
3 Arms ⇔ 117.3 µVrms to 50 Hz
0° (active power and energy)
90° (reactive power and energy)
< 1 V.m-1 for [80 MHz ; 1 GHz[
≤ 0,3 V.m-1 for [1 GHz ; 2 GHz[
≤ 0,1 V.m-1 for [2 GHz ; 2,7 GHz]
15.2. NOMINAL CURRENT ACCORDING TO TYPE OF SENSOR
Current sensor
(except Flex®)
J93 clamp 3500 105
C193 clamp 1000 30
PAC93 clamp 1000 30
MN93 clamp 200 6
MN93A clamp (100 A) 100 3
E3N clamp (10 mV/A) 100 3
E3N clamp (100 mV/A) 10 0.3
MN93A clamp (5 A) 5 0.15
5 A adapter 5 0.15
Essailec® adapter 5 0.15
Nominal RMS current
(A
) [A]
nom
84
Lower limit of the reference range
(3 × A
nom
÷ 100) [A]

15.3. ELECTRICAL CHARACTERISTICS
15.3.1. VOLTAGE INPUT CHARACTERISTICS
Range for use: 0 Vrms to 1000 Vrms AC+DC phase-to-neutral and neutral-to-earth.
0 Vrms to 2000 Vrms AC+DC phase-to-phase.
(on condition of compliance with 1000 Vrms with respect to earth in Cat III).
Input impedance: 1195 kW (between phase and neutral and between neutral and earth).
Admissible overload: 1200 Vrms constant.
2000 Vrms for one second.
15.3.2. CURRENT INPUT CHARACTERISTICS
Operating range: [0 V ; 1 V]
Input impedance: 1 MW.
Admissible overload: 1.7 Vrms constant.
Flex® type current sensors (AmpFlex® and MiniFlex®) switch the current input to an integrator assembly (amplied or unamplied
Rogowski channel) capable of interpreting the signals from Rogowski sensors. The input impedance is reduced to 12.4 kW in this
case.
15.3.3. BANDWIDTH
Measurement channels: 256 points per period, i.e.:
At 50 Hz: 6.4 kHz (256 × 50 ÷ 2).
At 60 Hz: 7.68 kHz (256 × 60 ÷ 2).
The analogue 3-dB bandwidth: 76 kHz.
85

15.3.4. CHARACTERISTICS OF THE DEVICE ALONE (EXCLUDING THE CURRENT SENSOR)
Quantities concerning currents and voltages
Measurement range without ratio
Measurement
(with unity ratio)
Minimum Maximum
(7)
40 Hz 70 Hz 10 mHz ±10 mHz
(1)
(2)
(3)
RMS
voltage
Frequency
simple 2 V 1,000 V
(5)
compound 2 V 2,000 V
simple 2 V 1,200 V
Direct
voltage
(6)
(DC)
compound 2 V 2,400 V
simple 2 V 1,000 V
(3)
(1)
RMS ½
voltage
compound 2 V 2,000 V
simple 2 V 1,414 V
(2)
(4)
Peak
voltage
compound 2 V 2,828 V
(4)
Severity of short-term icker (PST) 0 12 0.01
Severity of long-term icker (PLT) 0 12 0.01 Uncertainty of PST
Peak factor (PF)
(voltage and current)
1 9.99 0.01
Display resolution
(with unity ratio)
100 mV
V < 1000 V
1 V
V ≥ 1000 V
100 mV
U < 1000 V
1 V
U ≥ 1000 V
100 mV
V < 1000 V
1 V
V ≥ 1000 V
100 mV
U < 1000 V
1 V
U ≥ 1000 V
100 mV
V < 1000 V
1 V
V ≥ 1000 V
100 mV
U < 1000 V
1 V
U ≥ 1000 V
100 mV
V < 1000 V
1 V
V ≥ 1000 V
100 mV
U < 1000 V
1 V
U ≥ 1000 V
Maximum intrinsic
error
±(0.5 % + 200 mV)
±(0.5 % + 1 V)
±(0.5 % + 200 mV)
±(0.5 % + 1 V)
±(1 % + 500 mV)
±(1 % + 1 V)
±(1 % + 500 mV)
±(1 % + 1 V)
±(0.8 % + 1 V)
±(0.8 % + 1 V)
±(3 % + 2 V)
±(3 % + 2 V)
See the correspond-
ing table
±(1 % + 5 ct)
CF < 4
±(5 % + 2 ct)
CF ≥ 4
(1) Limitation of the PAC93 and E3N clamps
(2) Two-phase (opposite phases) – same note as (1).
(3) Limitation of the voltage inputs.
(4) 1000 x √2 ≈ 1414; 2000 x √2 ≈ 2828;
(5) Total RMS value and RMS value of the fundamental
(6) DC harmonic component (n= 0)
(7) For voltages > 5 V.
86

Measurement
Measurement range without ratio
(with unity ratio)
Minimum Maximum
Display resolution
(with unity ratio)
Maximum intrinsic
error
J93 clamp 3 A 3,500 A 1 A ±(0.5 % + 1 A)
C193 clamp
PAC93 clamp
1 A 1,000 A
100 mA
A < 1000 A
1 A
A ≥ 1000 A
±(0.5 % + 200 mA)
±(0.5 % + 1 A)
MN93 clamp 200 mA 200 A 100 mA ±(0.5 % + 200 mA)
RMS
current
E3N clamp (10 mV/A)
MN93A clamp (100 A)
100 mA 100 A
E3N clamp (100 mV/A) 10 mA 10 A
(2)
MN93A clamp (5 A)
5 A adapter
5 mA 5 A 1 mA ±(0.5 % + 2 mA)
10 mA
A < 100 A
100 mA
A ≥ 100 A
1 mA
A < 10 A
10 mA
A ≥ 10 A
±(0.5 % + 20 mA)
±(0.5 % + 100 mA)
±(0.5 % + 2 mA)
±(0.5 % + 10 mA)
Essailec® adapter
AmpFlex®
MiniFlex®
(10 kA)
AmpFlex®
MiniFlex®
(6500 A)
AmpFlex®
MiniFlex®
(100 A)
(4)
(4)
(4)
(4)
(4)
(4)
10 A 10 kA
10 A 6,500 A
100 mA 100 A
1 A
A < 10 kA
10 A
A ≥ 10 kA
100 mA
A < 1000 A
1 A
A ≥ 1000 A
10 mA
A < 100 A
100 mA
A ≥ 100 A
±(0.5 % + 3 A)
±(0.5 % + 3 A)
±(0.5 % + 30 mA)
J93 clamp 3 A 5,000 A 1A ±(1 % + 1 A)
100 mA
PAC93 clamp 1 A 1,300 A
(1)
A < 1000 A
1 A
±(1 % + 1 A)
A ≥ 1000 A
Direct
current
(3)
(DC)
E3N clamp (10 mV/A) 100 mA 100 A
(1)
10 mA
A < 100 A
100 mA
±(1 % + 100 mA)
A ≥ 100 A
1 mA
E3N clamp (100 mV/A) 10 mA 10 A
(1)
A < 10 A
10 mA
±(1 % + 10 mA)
A ≥ 10 A
(1) In 1,000 Vrms, category III, provided that the voltage between each of the terminals and earth does not exceed 1,000 Vrms.
(2) Total RMS value and RMS value of the fundamental
(3) DC harmonic component (n= 0)
(4) Sensors compatible with the instrument (see §1.2).
87

Measurement
Measurement range without ratio
(with unity ratio)
Minimum Maximum
Display resolution
(with unity ratio)
Maximum intrinsic error
J93 clamp 1 A 3,500 A 1 A ± (1 % + 1 A)
100 mA
C193 clamp
PAC93 clamp
1 A 1,200 A
A < 1,000 A
1 A
±(1 % + 1 A)
A ≥ 1,000 A
MN93 clamp 200 mA 240 A 100 mA ±(1 % + 1 A)
10 mA
E3N clamp (10 mV/A)
MN93A clamp (100 A)
0.1A 120 A
A < 100 A
100 mA
±(1 % + 100 mA)
A ≥ 100 A
1 mA
A < 10 A
10 mA
A ≥ 10 A
±(1 % + 10 mA)
RMS ½
current
E3N clamp (100 mV/A) 10 mA 12 A
MN93A clamp (5 A)
5 A adapter
5 mA 6 A 1 mA ±(1 % + 10 mA)
Essailec® adapter
AmpFlex®
MiniFlex®
(2)
(2)
10 A 10 kA
(10 kA)
AmpFlex
MiniFlex®
® (2)
(2)
10 A 6,500 A
(6500 A)
AmpFlex®
MiniFlex®
(2)
(2)
100 mA 100 A
(100 A)
J93 clamp 1 A 4,950 A
(1)
1 A
A < 10 kA
10 A
±(2.5 % + 5 A)
A ≥ 10 kA
100 mA
A < 1000 A
1 A
±(2.5 % + 5 A)
A ≥ 1000 A
10 mA
A < 100 A
100 mA
±(2.5 % + 200 mA)
A ≥ 100 A
1 A ±(1 % + 2 A)
1 A
C193 clamp
PAC93 clamp
1 A 1,414 A
(1)
A < 1,000 A
1 A
±(1 % + 2 A)
A ≥ 1,000 A
MN93 clamp 200 mA 282.8 A
(1)
100 mA ±(1 % + 2 A)
10 mA
E3N clamp (10 mV/A)
MN93A clamp (100 A)
100 mA 141.4 A
(1)
A < 100 A
100 mA
±(1 % + 200 mA)
A ≥ 100 A
1 mA
A < 10 A
10 mA
±(1 % + 20 mA)
A ≥ 10 A
1 mA ±(1 % + 20 mA)
Peak
current (PK)
E3N clamp (100 mV/A) 10 mA 14.14 A
MN93A clamp (5 A)
5 A adapter
5 mA 7.071 A
(1)
(1)
Essailec® adapter
AmpFlex®
MiniFlex®
(10 kA)
AmpFlex®
MiniFlex®
(6500 A)
AmpFlex®
MiniFlex®
(100 A)
(2)
(2)
(2)
(2)
(2)
(2)
10 A 14.14 kA
10 A 9,192 kA
100 mA 141.4 A
(1)
(1)
(1)
1 A
A < 10 kA
10 A
A ≥ 10 kA
100 mA
A < 1,000 A
1 A
A ≥ 1,000 A
10 mA
A < 100 A
100 mA
A ≥ 100 A
±(3 % + 5 A)
±(3 % + 5 A)
±(3 % + 600 mA)
(1) 3,500 x √2 ≈ 4,950; 1000 x √2 ≈ 1,414; 200 x √2 ≈ 282.8; 100 x √2 ≈ 141.4; 10 x √2 ≈ 14.14; 10,000 x √2 ≈ 14,140;
6,500 x √2 ≈ 9192;
(2) Sensors compatible with the instrument (see §1.2).
88

Quantities concerning powers and energies
Measurement range without ratio
Measurement
(with unity ratio)
Minimum Maximum
Excluding Flex
Active
power (P)
(1)
AmpFlex
MiniFlex
Excluding Flex
Reactive
power (Q1)
(2)
and non-active (N)
AmpFlex
MiniFlex
Distortion power (D)
(7)
Apparent power (S) 10 mVA
DC power (Pdc) 20 mVA
®
(3)
10 mW
®
®
®
10 mvar
®
®
10 mvar
(3)
(3)
(3)
(8)
10 MW
10 Mvar
10 Mvar
10 MVA
6 MVA
(4)
(4)
(4)
(4)
(9)
Peak factor (PF) -1 1 0.001
Excluding Flex
Active
energy (Ph)
(1)
AmpFlex
MiniFlex
and
(2)
Excluding Flex
AmpFlex
Reactive
energy
(2)
(Q1h)
non-active
energy (N)
MiniFlex
Distortion energy (Dh) 1 mvarh 9,999,999 Mvarh
Apparent energy (Sh) 1 mVAh 9,999,999 MVAh
DC energy (Pdch) 1 mWh 9,999,999 MWh
®
1 mWh 9,999,999 MWh
®
®
®
1 mvarh 9,999,999 Mvarh
®
®
(6)
(6)
(6)
(6)
(10)
(1) The stated uncertainties on the active power and energy measurements are maxima for |cos Φ| = 1 and typical for the other phase differences.
(2) The stated uncertainties on the reactive power and energy measurements are maxima for |sin Φ| = 1 and typical for the other phase shifts.
(3) With MN93A clamp (5 A) or 5 A adapter or Essailec® adapter.
(4) With AmpFlex® or MiniFlex® for a 2-wire single-phase connection (phase-to-ground voltage).
(5) The resolution depends on the current sensor used and on the value to be displayed.
(6) The energy is equivalent to more than 114 years of the associated maximum power (unity ratios).
(7) n
is the highest order for which the harmonic ratio is non-zero.
max
(8) With E3N clamp (100 mV/A)
Display resolution
(with unity ratio)
4 digits at most
4 digits at most
4 digits at most
4 digits at most
4 digits at most
7 digits at most
7 digits at most
7 digits at most
7 digits at most
7 digits at most
(5)
(5)
(5)
(5)
(5)
(5)
(5)
(5)
(5)
(5)
Maximum intrinsic error
±(1 %)
cos Φ ≥ 0.8
±(1.5 % + 10 ct)
0.2 ≤ cos Φ < 0.8
±(1 %)
cos Φ ≥ 0.8
±(2.5 % + 20 ct)
0.5 ≤ cos Φ < 0.8
±(1 %)
sin Φ ≥ 0.5
±(1.5 % + 10 ct)
0.2 ≤ sin Φ < 0.5
±(1.5 %)
sin Φ ≥ 0.5
±(2.5 % + 20 ct)
0.2 ≤ sin Φ < 0.5
±(4 % + 20 ct)
if ∀ n ≥ 1, τn ≤(100 ÷ n) [%]
or
±(2 % +(n
±(2 % +(n
× 0,5 %) + 100 ct)
max
THDA ≤ 20 %f
× 0,7 %) + 10 ct)
max
THDA > 20 %f
±(1 %)
±(1.5 %)
cos Φ ≥ 0.5
±(1.5 % + 10 ct)
0.2 ≤ cos Φ < 0.5
±(1 %)
cos Φ ≥ 0.8
±(1.5 %)
0.2 ≤ cos Φ < 0.8
±(1 %)
cos Φ ≥ 0.8
±(1.5 %)
0.5 ≤ cos Φ < 0.8
±(1 %)
sin Φ ≥ 0.5
±(1.5 %)
0.2 ≤ sin Φ < 0.5
±(1.5 %)
sin Φ ≥ 0.5
±(2.5 %)
0.2 ≤ sin Φ < 0.5
±(5.5 %)
THDA ≤ 20 %f
±(1.5 %)
THDA > 20 %f
±(1 %)
89

(9) With J93 clamp, for a 2-wire single-phase connection (phase-to-ground voltage).
(10) The energy corresponds to more than 190 years at maximum power Pdc (unit ratios).
Quantities associated with power
Measurement
Phase differences of fundamentals
cos Φ (DPF) -1 1 0.001
Measurement range
Minimum Maximum
Display resolution Maximum intrinsic error
-179° 180° 1° ±2°
±1° for Φ
±5 ct for cos Φ
0.001
tan Φ -32.77
(1)
32.77
(1)
tan Φ < 10
0.01
±1° for Φ
tan Φ ≥ 10
±3 ct
Voltage unbalance (UNB) 0 % 100 % 0.1 %
UNB ≤ 10%
±10 ct
UNB > 10%
Current unbalance (UNB) 0 % 100 % 0.1 % ±10 ct
(1) |tan Φ| = 32,767 corresponds to Φ = ±88.25° + k × 180° (k being a natural number)
90

Quantities concerning the spectral composition of the signals
Measurement
Voltage harmonic ratio (τn) 0 %
Current harmonic ratio (τn)
(non-Flex®)
Current harmonic ratio (τn)
(AmpFlex® & MiniFlex®)
Total voltage harmonic distortion (THD)
(referred to the fundamental) of voltage
Total current harmonic distortion (THD)
(referred to the fundamental) of current
(non-Flex®)
Total current harmonic distortion (THD)
(referred to the fundamental) of current
(AmpFlex® & MiniFlex®)
Total voltage harmonic distortion (THD)
(referred to the signal without DC) of
voltage
Total current harmonic distortion (THD)
(referred to the signal without DC) of
current (non-Flex®)
Total current harmonic distortion (THD)
(referred to the signal without DC) of
current (AmpFlex® & MiniFlex®)
Harmonic loss factor (FHL) 1 99.99 0.01
K factor (FK) 1 99.99 0.01
Phase shifts of harmonics (order ≥ 2) -179° 180° 1° ±(1.5° + 1° x (n ÷ 12.5)
Measurement range
Minimum Maximum
Display resolution Maximum intrinsic error
0.1 %
1500 %f
100 %r
τn < 1000 %
1 %
±(2.5 % + 5 ct)
τn ≥ 1000 %
0 %
0 %
1500 %f
100 %r
1500 %f
100 %r
0.1 %
τn < 1000 %
1 %
τn ≥ 1000 %
0.1 %
τn < 1000 %
1 %
τn ≥ 1000 %
±(2 % + (n × 0.2 %) + 10 ct)
n ≤ 25
±(2 % + (n × 0.6 %) + 5 ct)
n > 25
±(2 % + (n × 0.3 %) + 5 ct)
n ≤ 25
±(2 % + (n × 0.6 %) + 5 ct)
n > 25
0 % 999.9 % 0.1 % ±(2.5 % + 5 ct)
±(2.5 % + 5 ct)
if ∀ n ≥ 1. τn ≤ (100 ÷ n) [%]
or
0 % 999.9 % 0.1 %
±(2 % + (n
±(2 % + (n
× 0.2 %) + 5 ct)
max
n
max
× 0.5 %) + 5 ct)
max
n
max
±(2.5 % + 5 ct)
if ∀ n ≥ 1. τn ≤ (100 ÷ n2) [%]
or
0 % 999.9 % 0.1 %
±(2 % + (n
±(2 % + (n
× 0.3 %) + 5 ct)
max
n
max
× 0.6 %) + 5 ct)
max
n
max
0 % 100 % 0.1 % ±(2.5 % + 5 ct)
±(2.5 % + 5 ct)
if ∀ n ≥ 1. τn ≤ (100 ÷ n) [%]
or
0 % 100 % 0.1 %
±(2 % + (n
±(2 % + (n
× 0.2 %) + 5 ct)
max
n
max
× 0.5 %) + 5 ct)
max
n
max
±(2.5 % + 5 ct)
if ∀ n ≥ 1. τn ≤ (100 ÷ n2) [%]
or
0 % 100 % 0.1 %
±(2 % + (n
±(2 % + (n
±(5 % + (n
±(10 % + (n
±(5 % + (n
±(10 % + (n
× 0.3 %) + 5 ct)
max
n
max
× 0.6 %) + 5 ct)
max
n
max
× 0.4 %) + 5 ct)
max
n
max
× 0.7 %) + 5 ct)
max
n
max
× 0.4 %) + 5 ct)
max
n
max
× 0.7 %) + 5 ct)
max
n
max
≤ 25
> 25
≤ 25
> 25
≤ 25
> 25
≤ 25
> 25
≤ 25
> 25
≤ 25
> 25
Note : n
is the highest order for which the harmonic ratio is non-zero.
max
91

RMS
harmonic
voltage
(order n ≥ 2)
RMS
distortion
voltage
RMS
harmonic
current
(order n ≥ 2)
Measurement range
Measurement
(with unity ratio)
Minimum Maximum
simple 2 V 1000 V
Display resolution
(1)
(with unity ratio)
V < 1000 V
V ≥ 1000 V
compound 2 V 2000 V
(2)
U < 1000 V
U ≥ 1000 V
simple (Vd) 2 V 1000 V
(1)
V < 1000 V
V ≥ 1000 V
compound (Ud) 2 V 2000 V
(2)
U < 1000 V
U ≥ 1000 V
J93 clamp 1 A 3500 A 1 A
C193 clamp
PAC93 clamp
1 A 1000 A
A < 1000 A
A ≥ 1000 A
MN93 clamp 200 mA 200 A 100 mA
E3N clamp (10 mV/A)
MN93A clamp (100 A)
E3N clamp (100
mV/A)
100 mA 100 A
10 mA 10 A
MN93A clamp (5 A)
5 A adapter
5 mA 5 A 1 mA
Essailec® adapter
AmpFlex
MiniFlex
® (4)
® (4)
10 A 10 kA
(10 kA)
AmpFlex
MiniFlex
(6500 A)
AmpFlex
MiniFlex
® (4)
® (4)
® (4)
® (4)
10 A 6,500 A
100 mA 100 A
A < 1,000 A
A ≥ 1,000 A
(100 A)
100 mV
1 V
100 mV
1 V
100 mV
1 V
100 mV
1 V
100 mA
1 A
10 mA
A < 100 A
100 mA
A ≥ 100 A
1 mA
A < 10 A
10 mA
A ≥ 10 A
1 A
A < 10 kA
10 A
A ≥ 10 kA
100 mA
1 A
10 mA
A < 100 A
100 mA
A ≥ 100 A
Maximum intrinsic error
±(2.5 % + 1 V)
±(2.5 % + 1 V)
±(2.5 % + 1 V)
±(2.5 % + 1 V)
±(2 % + (n x 0.2%) + 1 A)
n ≤ 25
±(2 % + (n x 0.2%) + 1 A)
n ≤ 25
±(2 % + (n x 0.5%) + 1 A)
n > 25
±(2 % + (n x 0.2%) + 1 A)
n ≤ 25
±(2 % + (n x 0.5%) + 1 A)
n > 25
±(2 % + (n x 0.2%) + 100 mA)
n ≤ 25
±(2 % + (n x 0.5%) + 100 mA)
n > 25
±(2 % + (n x 0.2%) + 10 mA)
n ≤ 25
±(2 % + (n x 0.5%) + 10 mA)
n > 25
±(2 % + (n x 0.2%) + 10 mA)
n ≤ 25
±(2 % + (n x 0.5%) + 10 mA)
n > 25
±(2 % + (n x 0.3%) + 1 A + (Afrms
n ≤ 25
±(2 % + (n x 0.6%) + 1 A + (Afrms
n > 25
±(2 % + (n x 0.3%) + 1 A + (Afrms
n ≤ 25
±(2 % + (n x 0.6%) + 1 A + (Afrms
n > 25
±(2 % + (n x 0.2%) + 30 pt)
n ≤ 25
±(2 % + (n x 0.5%) + 30 pt)
n > 25
(3)
x 0.1%))
(3)
x 0.1%))
(3)
x 0.1%))
(3)
x 0.1%))
(1) n
is the highest order for which the harmonic ratio is non-zero.
max
(2) Two-phase (opposite phases) – same note as (1).
(3) RMS value of the fundamental.
(4) Sensors compatible with the instrument (see §1.2).
92

Measurement range
Measurement
(with unity ratio)
Minimum Maximum
J93 clamp 1 A 3500 A 1 A ±((n
Display resolution
(with unity ratio)
Maximum intrinsic error
x 0.4%) + 1 A)
max
100 mA
C193 clamp
PAC93 clamp
1 A 1000 A
A < 1000 A
1 A
±((n
max
x 0.4%) + 1 A)
A ≥ 1000 A
MN93 clamp 200 mA 200 A 100 mA ±((n
x 0.4%) + 1 A)
max
10 mA
E3N clamp (10 mV/A)
MN93A clamp (100 A)
0.1A 100 A
A < 100 A
100 mA
±((n
x 0.4%) + 100 mA)
max
A ≥ 100 A
1 mA
A < 10 A
10 mA
A ≥ 10 A
1 A
A < 10 kA
10 A
A ≥ 10 kA
100 mA
A < 1,000 A
1 A
A ≥ 1,000 A
10 mA
A < 100 A
100 mA
A ≥ 100 A
±((n
x 0.4%) + 10 mA)
max
x 0.4%) + 10 mA)
max
±((n
x 0.4%) + 1 A)
max
±((n
x 0.4%) + 1 A)
max
±(n
x 0.5%) + 30 pt)
max
RMS
distortion
current
(1)
(Ad)
E3N clamp (100
mV/A)
MN93A clamp (5 A)
5 A adapter
Essailec® adapter
AmpFlex®
MiniFlex®
(2)
(2)
(10 kA)
AmpFlex®
MiniFlex®
(2)
(2)
(6500 A)
AmpFlex®
MiniFlex®
(2)
(2)
(100 A)
10 mA 10 A
5 mA 5 A 1 mA ±((n
10 A 10 kA
10 A 6,500 A
100 mA 100 A
(1) In 1,000 Vrms, category III, provided that the voltage between each of the terminals and earth does not exceed 1,000 Vrms.
(2) Sensors compatible with the instrument (see §1.2).
Severity of short-term icker
Maximum intrinsic error of the short-term icker severity measurement (PST)
Rectangular variations
per minute
(50% duty cycle)
120 V lamp
60 Hz network
1 PST ∈ [0.5 ; 4] ± 5% PST ∈ [0.5 ; 4] ± 5%
2 PST ∈ [0.5 ; 5] ± 5% PST ∈ [0.5 ; 5] ± 5%
7 PST ∈ [0.5 ; 7] ± 5% PST ∈ [0.5 ; 8] ± 5%
39 PST ∈ [0.5 ; 12] ± 5% PST ∈ [0.5 ; 10] ± 5%
110 PST ∈ [0.5 ; 12] ± 5% PST ∈ [0.5 ; 10] ± 5%
1620 PST ∈ [0.25 ; 12] ± 15% PST ∈ [0.25 ; 10] ± 15%
Range of current and voltage ratios
Ratio Minimum Maximum
Voltage
Current
(1)
100
1,000 x √3
1 60,000 / 1
(1) Only for the MN93A clamp (5 A), the 5 A adapter and the Essailec
9,999,900 x √3
0,1
®
adapter.
230 V lamp
50 Hz network
93

Measurement ranges after application of the ratios
Measurement
Minimum
with minimum ratio(s)
RMS
& RMS ½ voltage
simple 120 mV 170 GV
compound 120 mV 340 GV
Measurement range
Maximum
with maximum ratio(s)
Direct voltage (DC)
simple 120 mV 200 GV
compound 120 mV 400 GV
simple 160 mV 240 GV
Peak voltage (PK)
compound 320 mV 480 GV
RMS & RMS ½ current 5 mA 300 kA
Direct current (DC) 10 mA 5 kA
Peak current (PK) 7 mA 420 kA
Active power (P) 600 µW 51 PW
DC power (Pdc) 1,2 mW 1 PW
Reactive power (Q1)
non-active (N)
600 µvar 51 Pvar
(3)
(3)
(3)
and distortion power (D)
Apparent power (S) 600 µVA 51 PVA
Active energy (Ph) 1 mWh 9 999 999 EWh
DC energy (Pdch) 1 mWh 9 999 999 EWh
Reactive energy (Q1h)
non-active (Nh)
1 mvarh 9 999 999 Evarh
(3)
(1)
(2)
(1)
and distortion energy (Dh)
Apparent energy (Sh) 1 mVAh 9 999 999 EVAh
(1)
(1) The energy corresponds to more than 22,000 years of the associated maximum power (maximum ratios).
(2) The energy Pdch corresponds to more than 1 million years at maximum power Pdc (maximum ratios).
(3) Maximum value calculated for a 2-wire single-phase connection (phase-to-ground voltage).
94

15.3.5. CURRENT SENSOR CHARACTERISTICS (AFTER LINEARIZATION)
Sensor errors are offset by a typical correction inside the device. This typical correction, applied to the phase and amplitude, depends on the type of sensor connected (detected automatically) and the gain in the current acquisition channel used.
The RMS current measurement error and phase error are additional errors (which must therefore be added to the device errors),
indicated as inuences on the calculations carried out by the analyser (powers, energies, power factors, tangents, etc.).
Type of sensor RMS current (Arms) Maximum error for Arms Maximum error for Φ
AmpFlex®
(1)
6500 A / 10 kA
MiniFlex®
(1)
6500 A / 10 kA
AmpFlex®
(1)
100 A
MiniFlex®
(1)
100 A
[10 A ; 100 A[ ±3 % ±1°
[100 A ; 10 kA] ±2 % ±0.5°
[10 A ; 100 A[ ±3 % ±1°
[100 A ; 10 kA] ±2 % ±0.5°
[100 mA ; 100 A] ±3 % ±1°
[100 mA ; 100 A] ±3 % ±1°
[3 A ; 50 A[ - -
[50 A ; 100 A[ ±(2 % + 2.5 A) ±4°
J93 clamp
3500 A
[100 A ; 500 A[ ±(1.5 % + 2.5 A) ±2°
[500 A ; 2000 A[ ±1 % ±1°
[2000 A ; 3500 A] ±1 % ±1.5°
]3500 A ; 5000 A] DC ±1 % -
[1 A ; 10 A[ ±0.8 % ±1°
C193 clamp
1000 A
[10 A ; 100 A[ ±0.3 % ±0.5°
[100 A ; 1000 A] ±0.2 % ±0.3°
[1 A ; 10 A[ ±(1.5 % + 1 A) -
[10 A ; 100 A[ ±(1.5 % + 1 A) ±2°
PAC93 clamp
1000 A
[100 A ; 200 A[ ±3 % ±1.5°
[200 A ; 800 A[ ±3 % ±1.5°
[800 A ; 1000 A[ ±5 % ±1.5°
]1000 A ; 1300 A] DC ±5 % -
[200 mA ; 500 mA[ - -
[500 mA ; 10 A[ ±(3 % + 1 A) -
MN93 clamp
200 A
[10 A ; 40 A[ ±(2.5 % + 1 A) ±3°
[40 A ; 100 A[ ±(2.5 % + 1 A) ±3°
[100 A ; 200 A] ±(1 % + 1 A) ±2°
MN93A clamp
100 A
E3N clamp (10 mV/A)
100A
E3N clamp (100 mV/A)
10A
[100 mA ; 1 A[ ±(0.7 % + 2 mA) ±1.5°
[1 A ; 100 A] ±0.7 % ±0.7°
[100 mA ; 40 A[ ±(2 % + 50 mA) ±0.5°
[40 A ; 100 A] ±7.5 % ±0.5°
[10 mA ; 10 A] ±(1.5 % + 50 mA) ±1°
[5 mA ; 50 mA[ ±(1 % + 100 µA) ±1.7°
Clamp MN93A
5 A
[50 mA ; 500 mA[ ±1 % ±1°
[500 mA ; 5 A] ±0.7 % ±1°
[5 mA ; 50 mA[ ±(1 % + 1.5 mA) ±1°
5 A adapter
Essailec® adapter
[50 mA ; 1 A[ ±(0.5 % + 1 mA) ±0°
[1 A ; 5 A] ± 0.5 % ±0°
(1) Sensors compatible with the instrument (see §1.2).
95

Note: This table does not take into account possible distortion of the measured signal (THD) because of the physical limitations
of the current sensor (saturation of the magnetic circuit or of the Hall-effect cell). Class B under standard IEC61000-4-30.
15.4. CLASS B UNDER STANDARD IEC 61000-4-30
15.4.1. CONFORMITY OF THE DEVICE
The device and its Power Analyzer Transfer 2 operating software are compliant with class B of standard IEC61000-4-30 for the
following parameters:
Industrial frequency,
Supply voltage amplitude,
Flicker,
Supply voltage brownouts,
Temporary overvoltages at industrial frequency,
Supply voltage blackouts,
Voltage transients,
Supply voltage unbalance,
Voltage harmonics.
Remark: To ensure this compliance, trend recordings (Trend mode) must be made with:
A recording period of one second,
The quantities Vrms and Urms selected,
The quantities V-h01 and U-h01 selected.
15.4.2. UNCERTAINTIES AND MEASUREMENT RANGES
Parameter Range Uncertainty U
din
Industrial frequency [42,5 Hz ; 69 Hz] ±10 mHz [50 V ; 1000 V]
Supply voltage amplitude [50 V ; 1000 V] ±1 % of U
din
Flicker [0.25 ; 12] See the corresponding tables
Supply voltage brownouts
Temporary overvoltages at industrial frequency
Supply voltage blackouts
Residual voltage [5 % of U
Duration [10 ms ; 65,535 days]
Maximum ampli-
tude
[U
; 150 % of U
din
Duration [10 ms ; 65,535 days]
Duration [10 ms ; 65,535 days]
; U
] ±2 % of U
din
din
80 ppm ±10 ms (maximum)
30 ppm ±10 ms (typical)
] ±2 % of U
din
80 ppm ±10 ms (maximum)
30 ppm ±10 ms (typical)
80 ppm ±10 ms (maximum)
30 ppm ±10 ms (typical)
din
din
[50 V ; 1000 V]
V ∈ {120 V ; 230 V}
U ∈ {207 V ; 400 V}
[50 V ; 1000 V]
[50 V ; 1000 V]
[50 V ; 1000 V]
Supply voltage unbalance [0 % ; 10 %] ±0.3 % or ±3 ct [50 V ; 1000 V]
Voltage harmonics
Rate [0 % ; 1500 %] ±(2.5 % + 5 ct)
Voltage [2 V ; 1000 V] ±(2.5 % + 1 V)
[50 V ; 1000 V]
15.4.3. UNCERTAINTY OF THE REAL-TIME CLOCK
The uncertainty of the real-time clock is 80 ppm at most (device 3 years old used at an ambient temperature of 50°C). With a new
device used at 25°C, this uncertainty is only 30 ppm.
96

16. FORMULAS
This section presents the mathematical formulae used in calculating various parameters.
16.1. MATHEMATICAL FORMULAE
16.1.1. NETWORK FREQUENCY AND SAMPLING
Sampling is controlled by (locked to) the network frequency so as to deliver 256 samples per cycle from 40 Hz to 70 Hz. This
locking is essential for many calculations, including reactive power, distorting power, fundamental power factor, unbalance, and
harmonic factors and angles.
The instantaneous frequency is measured by analysing eight consecutive positive-going zero crossings on the signal in question
after digital low-pass ltering and digital suppression of the DC component (i.e. 7 periods ltered). The time of the zero crossing
is determined precisely by linear interpolation between two samples.
The device is capable of calculating an instantaneous frequency simultaneously on each of the 3 phases in voltage (phase-to-neutral
for distribution systems with neutral and phase-to-phase for distribution systems without neutral) or in current. It then chooses one
from among two or three of them as the ofcial instantaneous frequency.
The network frequency over one second is the harmonic mean of the instantaneous frequencies.
The signals are acquired using a 16-bit converter and (for current acquisition) dynamic gain switches.
16.1.2. WAVEFORM MODE
16.1.2.1. RMS values of half-cycle voltage and current (excluding neutral)
Half-cycle RMS phase-to-neutral voltage of phase (i+1) with i ∈ [0; 2].
1) (
−
[ ] [ ][ ]
Vdem
i
Half-cycle RMS phase-to-phase voltage of phase (i+1) with i ∈ [0 ; 2].
[ ] [ ][ ]
Udem
i
Half-cycle RMS current of phase (i+1) with i ∈ [0 ; 2].
[ ] [ ][ ]
Adem
i
Notes: these values are calculated for each half-cycle so as not to miss any fault.
NechDemPer is the number of samples in the half cycle.
16.1.2.2. Minimum and maximum half-cycle RMS values (excluding neutral)
Minimum and maximum RMS phase-to-neutral voltages of phase (i+1) with i ∈ [0 ; 2].
Vmax [i] = max(Vdem[i]), Vmin[i] = min(Vdem[i])
Minimum and maximum RMS phase-to-phase voltages of phase (i+1) with i ∈ [0 ; 2].
Umax [i] = max(Udem[i]), Umin[i] = min(Udem[i])
1
NechDemPer
1
NechDemPer
1
NechDemPer
suivantZéro
⋅=
∑
=
Zéron
suivantZéro
⋅=
∑
=
Zéron
suivantZéro
⋅=
∑
=
Zéron
2
niV
1) (
−
2
niU
−
1) (
2
niA
Minimum and maximum RMS currents of phase (i+1) with i ∈ [0 ; 2].
Amax [i] = max(Adem[i]), Amin[i] = min(Adem[i])
Note: The duration of the evaluation is left to the user’s discretion (reset by pressing the key in the MAX-MIN mode).
97

16.1.2.3. DC quantities (neutral included except Udc – reassessment every second)
[ ] [ ][ ]
∑
−
=
⋅=
1
0
1
Vdc
NechSec
n
niV
NechSec
i
[ ] [ ][ ]
∑
−
=
⋅=
1
0
1
Udc
NechSec
n
niU
NechSec
i
[ ] [ ][ ]
∑
−
=
⋅=
1
0
1
Adc
NechSec
n
niA
NechSec
i
[ ]
[ ][ ]
3
11
0
3
12
∑
==n
niPST
iPLT
Phase-to-ground DC voltage of phase (i+1) with i ∈ [0; 3] (i = 3 ∈ neutral-ground voltage)
Phase-to-phase DC voltage of phase (i+1) with i ∈ [0 ; 2]
DC current of phase (i+1) with i ∈ [0; 3] (i = 3 ∈ neutral current)
Remark: The value NechSec is the number of samples per second.
16.1.2.4. Severity of Short-term icker – 10 minutes (excluding neutral)
Method based on the IEC61000-4-15 standard.
The input values are half-period RMS voltages (phase-to-neutral for distribution systems with neutral, phase-to-phase for distribu-
tion systems without neutral). Blocks 3 and 4 are generated digitally. The classier of block 5 has 128 levels.
The value of PST[i] is updated every 10 minutes (phase (i+1) with i ∈ [0; 2]).
Note: The user can reset the PST calculation by pressing the key in the Summary mode. It is important to note that the
10-minute intervals do not necessarily start on an integer multiple of 10 minutes of universal time coordinated (UTC).
16.1.2.5. Severity of LONG-term icker – 2 hours (excluding neutral)
Method based on the IEC61000-4-15 standard.
11
12
The values of PST[i][n] are consecutive and 10 minutes apart. The value of PLT[i] (phase (i+1) with i ∈ [0; 2]) calculated in a twohour window is updated either:
every 10 minutes (Sliding long-term icker – Conguration >Calculation methods >PLT)
or every 2 hours (Non-sliding long-term icker – Conguration >Calculation methods >PLT)
Note: The user can reset the PLT calculation by pressing the key in the Summary mode. It is important to note that the
2-hour intervals do not necessarily start on an integer multiple of 10 minutes (sliding PLT) or of 2 hours (non-sliding PLT)
of universal time coordinated (UTC).
16.1.2.6. Peak values (neutral included except Upp and Upm – reassessment every second
Positive and negative phase-to-neutral peak voltages of phase (i+1) with i ∈ [0; 3] (i = 3 ⇔ neutral).
Vpp[i] = max(V[i][n]), Vpm[i] = min(V[i][n]) n ∈ [0; N]
Positive and negative phase-to-phase peak voltages of phase (i+1) with i ∈ [0 ; 2].
Upp[i] = max(U[i][n]), Upm[i] = min(U[i][n]) n ∈ [0 ; N]
Positive and negative peak currents of phase (i+1) with i ∈ [0; 3] (i = 3 ⇔ neutral).
App[i] = max(A[i][n]), Apm[i] = min(A[i][n]) n ∈ [0; N]
Note: The duration of the evaluation is left to the user’s discretion (reset by pressing the key in the MAX-MIN mode).
98

16.1.2.7. Peak factors (neutral included except Ucf – over one second)
[ ] [ ]
[ ]
[ ]
[ ]
[ ][ ]
∑
−
=
⋅
=
1
0
2
1
)iUpm,iUppmax(
Ucf
NechSec
n
niU
NechSec
i
[ ] [ ]
[ ] [ ][ ]
∑
−
=
⋅=
1
0
2
1
Vrms
NechSec
n
niV
NechSec
i
[ ] [ ][ ]
∑
−
=
⋅=
1
0
2
1
Urms
NechSec
n
niU
NechSec
i
[ ] [ ][ ]
∑
−
=
⋅=
1
0
2
1
Arms
NechSec
n
niA
NechSec
i
e=a
[ ] [ ] [ ]
)2VFrmsa1VFrmsa0VFrms(
3
1
Vrms
2
⋅+⋅+=
+
[ ] [ ] [ ]
)2VFrmsa1VFrmsa0VFrms(
3
1
Vrms
2
⋅+⋅+=
−
Peak factor of phase-to-neutral voltage of phase (i+1) with i ∈ [0; 3] (i = 3 ⇔ neutral).
0
0
−
1
[ ][ ]
−
1
[ ][ ]
)iVpm,iVppmax(
2
niV
)iApm,iAppmax(
2
niA
[ ]
=
Vcf
i
NechSec
Peak factor of phase-to-phase voltage of phase (i+1) with i ∈ [0 ; 2].
Peak factor of current of phase (i+1) with i ∈ [0; 3] (i = 3 ⇔ neutral).
[ ]
=
Acf
i
NechSec
Note: NechSec is the number of samples in the second. The duration of evaluation of the peak values here is one second.
16.1.2.8. Rms values (neutral included except Urms – over one second)
RMS phase-to-neutral voltage of phase (i+1) with i ∈ [0; 3] (i = 3 ⇔ neutral).
NechSec
1
⋅
∑
=
n
NechSec
1
⋅
∑
=
n
RMS phase-to-phase voltage of phase (i+1) with i ∈ [0 ; 2].
RMS current of phase (i+1) with i ∈ [0; 3] (i = 3 ⇔ neutral).
Note: NechSec is the number of samples in the second.
16.1.2.9. Negative-sequence unbalance rates (three-phase connection – over one second)
These are calculated from the ltered RMS vector values (over one second) VFrms[i] and AFrms[i] for distribution systems with
neutral and UFrms[i] and AFrms[i] for distribution systems without neutral. (Ideally the fundamental vectors of the signals). The
formulas used make use of Fortescue’s symmetrical components from Fortescue’s negative-sequence transformation.
π
2
j
Note: The operations are vector operations in complex notation with
Positive-sequence fundamental symmetrical phase-to-ground voltage (vector) in a distribution system with neutral
3
Negative-sequence fundamental symmetrical phase-to-ground voltage (vector) in a distribution system with neutral
99

Negative-sequence unbalance factor of the phase-to-ground voltages in a distribution system with neutral
3
3
[ ] [ ] [ ]
)2AFrmsa1AFrmsa0AFrms(
3
1
Arms
2
⋅+⋅+=
+
[ ] [ ] [ ]
)2AFrmsa1AFrmsa0AFrms(
3
1
Arms
2
⋅+⋅+=
−
Vrms
=Vunb
Remark: The following quantities are saved with the negative-sequence unbalance factor in a trend recording: Vns = |Vrms-|
Positive-sequence phase-to-phase fundamental symmetrical voltage (vector) in a distribution system without neutral
Urms
+
Negative-sequence phase-to-phase fundamental symmetrical voltage (vector) in a distribution system without neutral
Urms
−
Negative-sequence unbalance factor of the phase-to-phase voltages in a distribution system without neutral
=Uunb
Remark: The following quantities are saved with the negative-sequence unbalance factor in a trend recording: Uns = |Urms-|
−
Vrms
+
and Vps = |Vrms+| (the norms of the negative-sequence and positive-sequence fundamental symmetrical components,
respectively).
1
1
Urms
Urms
and Ups = |Urms+| (the norms of the negative-sequence and positive-sequence fundamental symmetrical components,
respectively).
[ ] [ ] [ ]
2
[ ] [ ] [ ]
−
+
2
⋅+⋅+=
⋅+⋅+=
)2UFrmsa1UFrmsa0UFrms(
)2UFrmsa1UFrmsa0UFrms(
Positive-sequence fundamental symmetrical current (vector)
Reverse-sequence fundamental symmetrical current (vector)
Negative-sequence unbalance rate of the current
Arms
=Aunb
Remark: The following quantities are saved with the negative-sequence unbalance factor in a trend recording: Ans = |Arms-|
16.1.2.10. Fundamental rms values (excluding neutral – over one second)
These are calculated from the ltered vector (instantaneous) values. A digital lter made up of 6 low-pass order 2 innite pulse
response Butterworth lters and one high-pass order 2 innite pulse response Butterworth lter is used to extract the fundamental
components.
16.1.2.11. Fundamental angular values (excluding neutral – over one second)
These are calculated from the ltered vector (instantaneous) values. A digital lter made up of 6 low-pass order 2 innite pulse
response Butterworth lters and one high-pass order 2 innite pulse response Butterworth lter is used to extract the fundamental
components. The angular values calculated are those between:
2 phase-to-neutral voltages
2 line currents
2 phase-to-phase voltages
One phase-to-neutral voltage and one line current (distribution systems with neutral)
One phase-to-phase voltage and one line current (2-wire two-phase distribution systems)
−
Arms
+
and Aps = |Arms+| (the norms of the negative-sequence and positive-sequence fundamental symmetrical components,
respectively).
100
 Loading...