

Page 1
a-eberle
PQI-DA
Operating Manual
Software - Version:
PQI-DA
Power Quality Interface
& Disturbance Recorder
GB
PQI-DA Operating Manual
Edition 01
Version Feb. 2010
1
Page 2

a-eberle
PQI-DA
PQI-DA
Power Quality Interface & Disturbance Recorder
Operating Manual
Version: October 2009
Copyright 2003 by A. Eberle GmbH & Co. KG
Published by
A. Eberle GmbH & Co. KG
Aalener Straße 30/32
90441 Nuremberg
Germany
Tel.: +49 (0) 911 / 62 81 08 0
Fax: +49 (0) 911 / 62 81 08 96
E-mail: info@a-eberle.de
Internet: www.a-eberle.de
The company A. Eberle GmbH & Co. KG cannot be held liable for any damages
or losses resulting from printing errors or changes in this operating manual.
Furthermore, A. Eberle GmbH&Co. KG does not assume responsibility for any
damages and losses resulting from faulty devices or from devices altered by
the user.
PQI-DA Operating Manual
2
Page 3

a-eberle
PQI-DA
Inhaltsverzeichnis
Information: ................................................................................................................... 7
1. Technical Concept ...................................................................................................
1.1 Application .....................................................................................................8
1.2 Features of the Power-Quality-Interface & Disturbance Recorder ..................
1.3 Description ...................................................................................................
10
10
2. Application ............................................................................................................ 11
2.1 PQI-DA as a Recorder (Fault Recorder) ......................................................... 11
2.1.1 Recorder A ..............................................................................................................11
2.1.2 Recorder B ..............................................................................................................
2.1.3 Recorder C ..............................................................................................................
2.1.4 Events .....................................................................................................................
2.2 PQI-DA as System Component .................................................................... 16
12
14
15
3. Technical Data ...................................................................................................... 17
3.1 Standards ..................................................................................................... 17
3.2 Voltage inputs ...............................................................................................
3.3 Current inputs ...............................................................................................
3.4 Binary inputs (BI) ...........................................................................................
17
18
18
8
3.5 Binary outputs (BO) ......................................................................................
3.6 Limit value monitoring ...................................................................................
3.7 Measurement quantities ...............................................................................
3.8 Reference conditions ....................................................................................
3.9 Measurement data acquisition ......................................................................
3.10 Storage of measured values .........................................................................
3.11 Electromagnetic Compatibility .......................................................................
3.12 Electrical safety .............................................................................................
3.13 Operating voltages .......................................................................................
3.14 Power supply ...............................................................................................
3.15 Environmental conditions ..............................................................................
3.16 Data storage .................................................................................................
19
19
19
20
20
20
21
21
22
22
22
23
4. Mechanical Design ...............................................................................................23
4.1 Housing ........................................................................................................23
4.1.1 PQI-DA 4U / 4I .........................................................................................................24
4.1.2 PQI-DA 8U ...............................................................................................................
4.1.3 PQI-DA 4U/4I und 8U ............................................................................................
25
26
PQI-DA Operating Manual
3
Page 4

a-eberle
PQI-DA
5. Serial interfaces .................................................................................................... 28
5.1 RS232 interfaces .......................................................................................... 28
5.2 TCP/IP .........................................................................................................
5.3 RS485 Interfaces ..........................................................................................
5.4 E-LAN (Energy - Local Area Network) ...........................................................
5.4.1 Features ...................................................................................................................29
5.4.2 Configuration Information .........................................................................................
28
28
29
29
5.5 Time Synchronisation and Measurement Trigger ........................................... 32
5.5.1 Measurement trigger ................................................................................................33
5.6 Parameterisation ........................................................................................... 34
5.6.1 Parameterising the Device ........................................................................................34
5.6.1.1 Transformer configuration ........................................................................................ 34
5.6.1.2 Measurement range ................................................................................................
5.6.1.3 Network frequency ..................................................................................................
5.6.1.4 System time ............................................................................................................
5.6.1.5 Definition of measurement channels for interval data andevent-triggered measurement
data ......................................................................................................................... 35
5.6.1.6 Configuration of the recording of the measurement data ..........................................
34
35
35
35
5.7 Hardware-orientated device versions ............................................................ 35
5.8 Application Examples (a selection) ................................................................
5.9 Block diagram PQI-DA 4 U/4 I ......................................................................
5.10 Block diagram PQI-DA 8xU .........................................................................
36
37
37
6. Characteristics of the Voltage Supply ................................................................... 38
6.1. Limit Values Specified in EN 50160 ...............................................................38
7. Measurement Circuits ........................................................................................... 40
7.1 Connection Possibilities ................................................................................ 41
7.2 Current Transformer Connections .................................................................
7.2.1 PQI-DA Current Transformer Connection .................................................................43
7.2.2 PQI-DA Current Transformer Connection .................................................................
42
44
7.3 Voltage Transformer Connections .................................................................44
7.3.1 PQI-DA Voltage Transformer Connection..................................................................45
8. Management of Process Data within the Device .................................................. 46
8.1 Classification of the Data .............................................................................. 46
8.2 Monitoring the Voltage Quality and Managing the Process Data ....................
8.2.1 Overview ..................................................................................................................47
8.2.2 Terminology .............................................................................................................
8.2.3 Measurement Data Classes .....................................................................................
8.3 Events .......................................................................................................... 49
8.3.1 Start / Stop Events...................................................................................................50
8.3.2 Interval Events
8.3.3 Linking Events ..........................................................................................................
..........................................................................................................50
47
47
49
51
PQI-DA Operating Manual
4
Page 5

a-eberle
PQI-DA
8.4 Relative Frequency ....................................................................................... 51
8.4.1 Displaying the Week and Year Values ....................................................................... 51
8.5 Availability .....................................................................................................52
8.6 Adherence to the Specified Supply Voltage Range .......................................
8.7 Asymmetry ...................................................................................................
8.8 Harmonics ....................................................................................................
8.9 Flicker ...........................................................................................................
8.10 Frequency, Narrow Range ............................................................................
8.11 Frequency, Wide Range ................................................................................
8.12 Controls for Recording Measurement Data ...................................................
8.13 Interval Status Word .....................................................................................
8.14 Controls for the Event Evaluation ..................................................................
8.15 Event Filtering ...............................................................................................
8.16 Suppressing Interval Events ..........................................................................
8.17 Triggering of Fault Recorders A and B ...........................................................
8.18 Triggering of Fault Recorders A, B and C ......................................................
8.19 Parameterising the Fault Record ...................................................................
8.19.1 Fault Record Sequences ..........................................................................................59
52
54
54
54
55
55
56
56
57
57
58
58
58
59
8.20 Background Memory Recorders A and B ..................................................... 59
8.21 Supply Quality Signals ..................................................................................
60
8.22 Parameterising the Signal Output
8.23 Signal Output Operating Modes
.................................................................. 61
.................................................................... 61
9. Definition of the Measurement Quantities ............................................................ 62
9.1 Sampling, Synchronisation ...........................................................................63
9.2. Primary Sampling Values ..............................................................................
9.2.1 Deduced Sampling Values .......................................................................................64
9.2.1.1 External conductor voltages .................................................................................... 64
9.2.1.2 Neutral earth voltage ............................................................................................... 64
9.2.1.3 Phase voltages towards the virtual phase point ....................................................... 64
9.2.1.4 Outer conductor to earth voltages ........................................................................... 64
9.2.1.5 Outer conductor to phase point voltages ................................................................. 65
9.2.1.6 Linked conductor currents in a three-phase system ................................................. 65
9.2.1.7 Sum current, neutral conductor current ...................................................................65
9.2.1.8 Active power of the phase ....................................................................................... 65
9.2.2 R.M.S. Voltage Values ..............................................................................................66
9.2.2.1 Half-period r.m.s. voltage values .............................................................................. 66
9.2.2.2 10/12-period r.m.s. voltage values ........................................................................... 67
9.2.2.3 150/180-period r.m.s voltage values ........................................................................
9.2.2.4 10-minute r.m.s. voltage values ...............................................................................
9.2.2.5 2-hour r.m.s. voltage values ..................................................................................... 68
9.2.3 R.M.S. Current Values ..............................................................................................68
9.2.3.1 10/12-period r.m.s. current values ........................................................................... 68
9.2.3.2 150/180-period r.m.s. current values ....................................................................... 69
9.2.3.3 10-minute r.m.s. current values
9.2.3.4 2-hour r.m.s. current values ..................................................................................... 69
9.2.4 Linear Average Values .............................................................................................. 70
................................................................................ 69
64
67
68
PQI-DA Operating Manual
5
Page 6

a-eberle
PQI-DA
9.2.5 Network Frequency ..................................................................................................71
9.2.6 Spectral Analysis ......................................................................................................
9.2.7 Active Powers ..........................................................................................................77
9.2.8 Active Energies ........................................................................................................
9.2.9 Reactive Energies ....................................................................................................
9.2.10 Interval Average Values of the Active Powers ...........................................................
9.2.11 Average Value of the Conductor Currents with the Sign of the Active Power of the Net
9.2.12 Apparent Powers .....................................................................................................
9.2.13 Reactive Powers ......................................................................................................
9.2.14 Active Factors ..........................................................................................................
9.2.15 Reactive Factors ......................................................................................................
9.2.16 Active Factor Display Function .................................................................................
9.2.17 Flicker Magnitude .....................................................................................................
9.2.18 Asymmetrical Voltage ...............................................................................................
9.2.4.1 10/12-period average values ................................................................................... 70
9.2.4.2 150/180-period average values ............................................................................... 70
9.2.4.3 10-minute average values ........................................................................................ 70
9.2.4.4 2-hour average values ............................................................................................. 71
71
9.2.6.1 Complex harmonics ................................................................................................ 72
9.2.6.2 Phase difference between the reference voltge and the measurementvoltage (basic
frequency) ............................................................................................................... 73
9.2.6.3 Direction of the power flow of the harmonics ...........................................................74
9.2.6.4 R.m.s. values of the harmonics ................................................................................ 74
9.2.6.5 R.m.s. values of the interharmonics .........................................................................
9.2.6.6 R.m.s. values of all the harmonics ...........................................................................
9.2.6.7 Total Harmonic Distortion THD................................................................................. 75
9.2.6.8 Phase difference between the voltage and the current(basic frequency) ................... 75
9.2.6.9 Direction of the rotating field .................................................................................... 76
work ........................................................................................................................80
74
74
78
78
79
80
81
81
81
82
82
82
-
10. Commissioning ..................................................................................................... 83
10.1 Safety Information ......................................................................................... 83
10.2 Procedure .....................................................................................................
83
11. Applications .......................................................................................................... 84
11.1 Application-Specific Programming ................................................................ 84
12. Updating the Firmware ......................................................................................... 84
13. Scope of Delivery ..................................................................................................
14. Storage Information ..............................................................................................
15. Guarantee .............................................................................................................
16. Ordering Information .............................................................................................
85
85
85
86
PQI-DA Operating Manual
6
Page 7

a-eberle
PQI-DA
Information:
Please note that the following operating manual cannot describe the latest
version of the device in all cases. For example, if you download a more recent
version of the firmware from the internet, the following description is no longer
accurate in every point.
In this case, either contact us directly or refer to the most recent version of the
operating manual available on our website (www.a-eberle.de).
PQI-DA Operating Manual
7
Page 8

a-eberle
PQI-DA
1. Technical Concept
1.1 Application
The Power Quality-Interface for low-, medium- and high-voltage networks PQI-DA
is the central component of a system, which executes all the measurement tasks
in electrical networks.
The PQI-DA can be used both as Power Quality-Interface according DIN EN 50160
and as measuring device for all physically defined measured variables in threephase systems.
The unit is mainly adapted for monitoring and recording certain supply qualities
or quality objectives between utility and customer and, furthermore to provide the
data for evaluation and storage.
Modern voltage-quality measurement devices operate according to IEC 61000-4-30.
This standard defines measuring methods in order to establish a comparable basis
for the user.
Devices from different manufacturers, operating according to this standard, have
to provide approximately the same measurement results.
The standard distinguishes between two classes of measurement devices.
Class A measurement devices are mainly used for contractual measurements in
customer-supplier relations, whereas class B measurement devices can be used
to determine statistical quality values. For measurements according to EN50160
a class B device is sufficient.
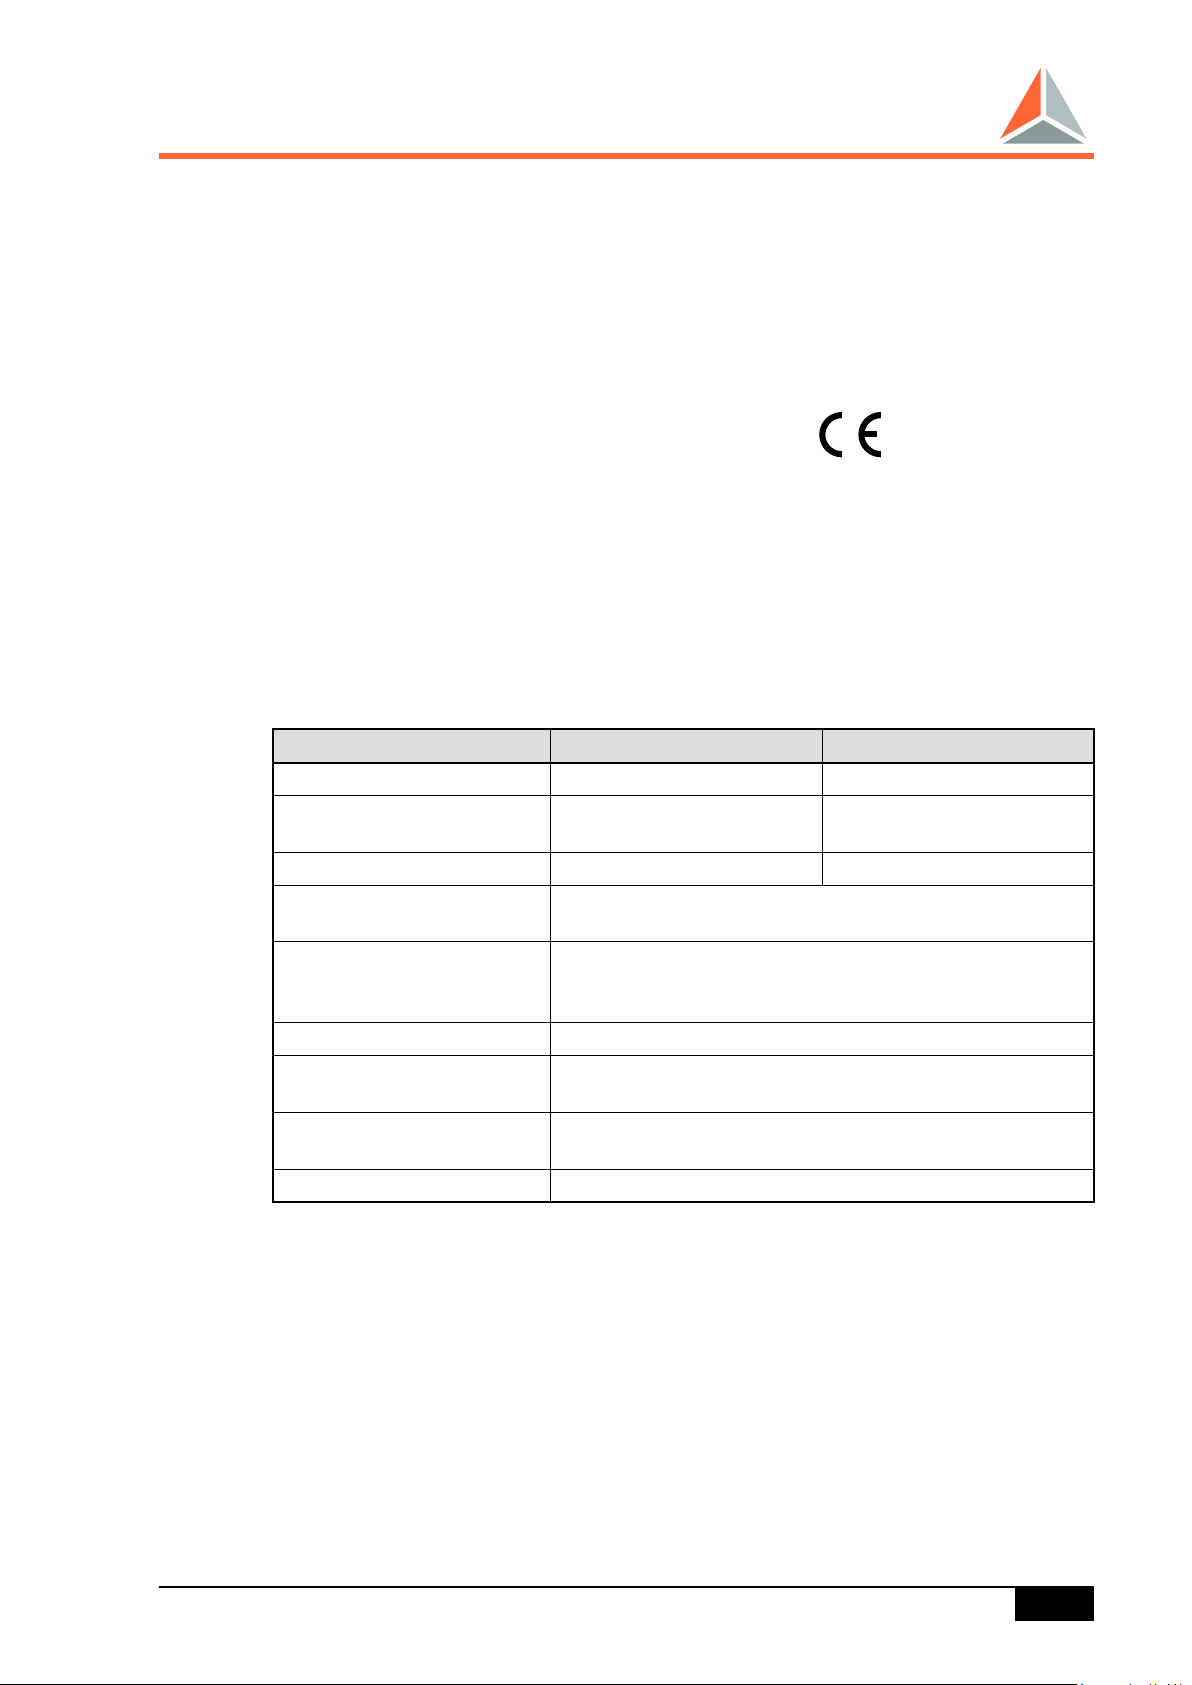
For the following parameters PQI-DA fulfills the requirements of IEC 61000-4-30
for class A devices.
Parameter Class
• Accuracy of voltage measurement A
• Determination of time intervals A
• Marking of measured values at events A
• Harmonics, interharmonics A
• Frequency A
• Voltage asymmetry A
• Event recording A
• Time synchronization A
In addition, three different fault recorders can be used.
(with DCF77 or GPS)
The oscilloscope recorder collects fault records consisting of 100 µs-sampling
values whose length (pre-event and post-event history) is freely selectable.
The r.m.s. recorder collects fault records consisting of r.m.s. values of half-period
values (10ms). The length of the fault record (pre-event and post-event history) is
also freely selectable.
PQI-DA Operating Manual
8
Page 9

a-eberle
PQI-DA
When exceeding a limiting value (harmonic or THD of a voltage), the harmonic
recorder registers the corresponding spectrum of all harmonics from 2nd to 50
harmonic.
All fault records are triggered by a freely definable event. Phase-phase and phaseearth events can be recorded simultaneously.
The signal-voltage-recorder registers a freely adjustable frequency (e.g. ripple
control frequency) over a period that can be selected.
Limit violations can be signalled via relays, if required.
On the input-side (U, I) the interface is available in different hardware-versions.
Current inputs are available for the measuring circuit (C20, C30) and for the protection circuit (C21, C31).
The following input characteristics can be selected:
• 4 voltage transformers for common power-quality applications
• 8 voltage transformers for power-quality applications in double-busbar systems
(code C10)
• 4 voltage transformers and 4 current transformers for power quality and general
measuring tasks (code C20, C21, C30, C31)
(code C00)
th
Theoretically, up to 255 devices can be interlinked via the system bus (E-LAN).
Even connections to devices of the voltage regulator system REGSys™, the Peterson-coil controller REG-DP, the earthfault detection system EORSys and the
collapse prediction system CPSys are possible.
Each device offers two RS 232 interfaces (COM1 and COM2) and two E-LAN
(Energy Local Area Network) interfaces.
Optional the PQI-DA can be equipped with an integrated TCP/IP-interface. In this
case COM 2 is not available.
Possible firmware-updates can be easily made via a pushbutton, prevented against
unintentional touch.
PQI-DA Operating Manual
9
Page 10
RS232
RS232
COM 1
COM 2 / RJ 45 (TCP / IP)
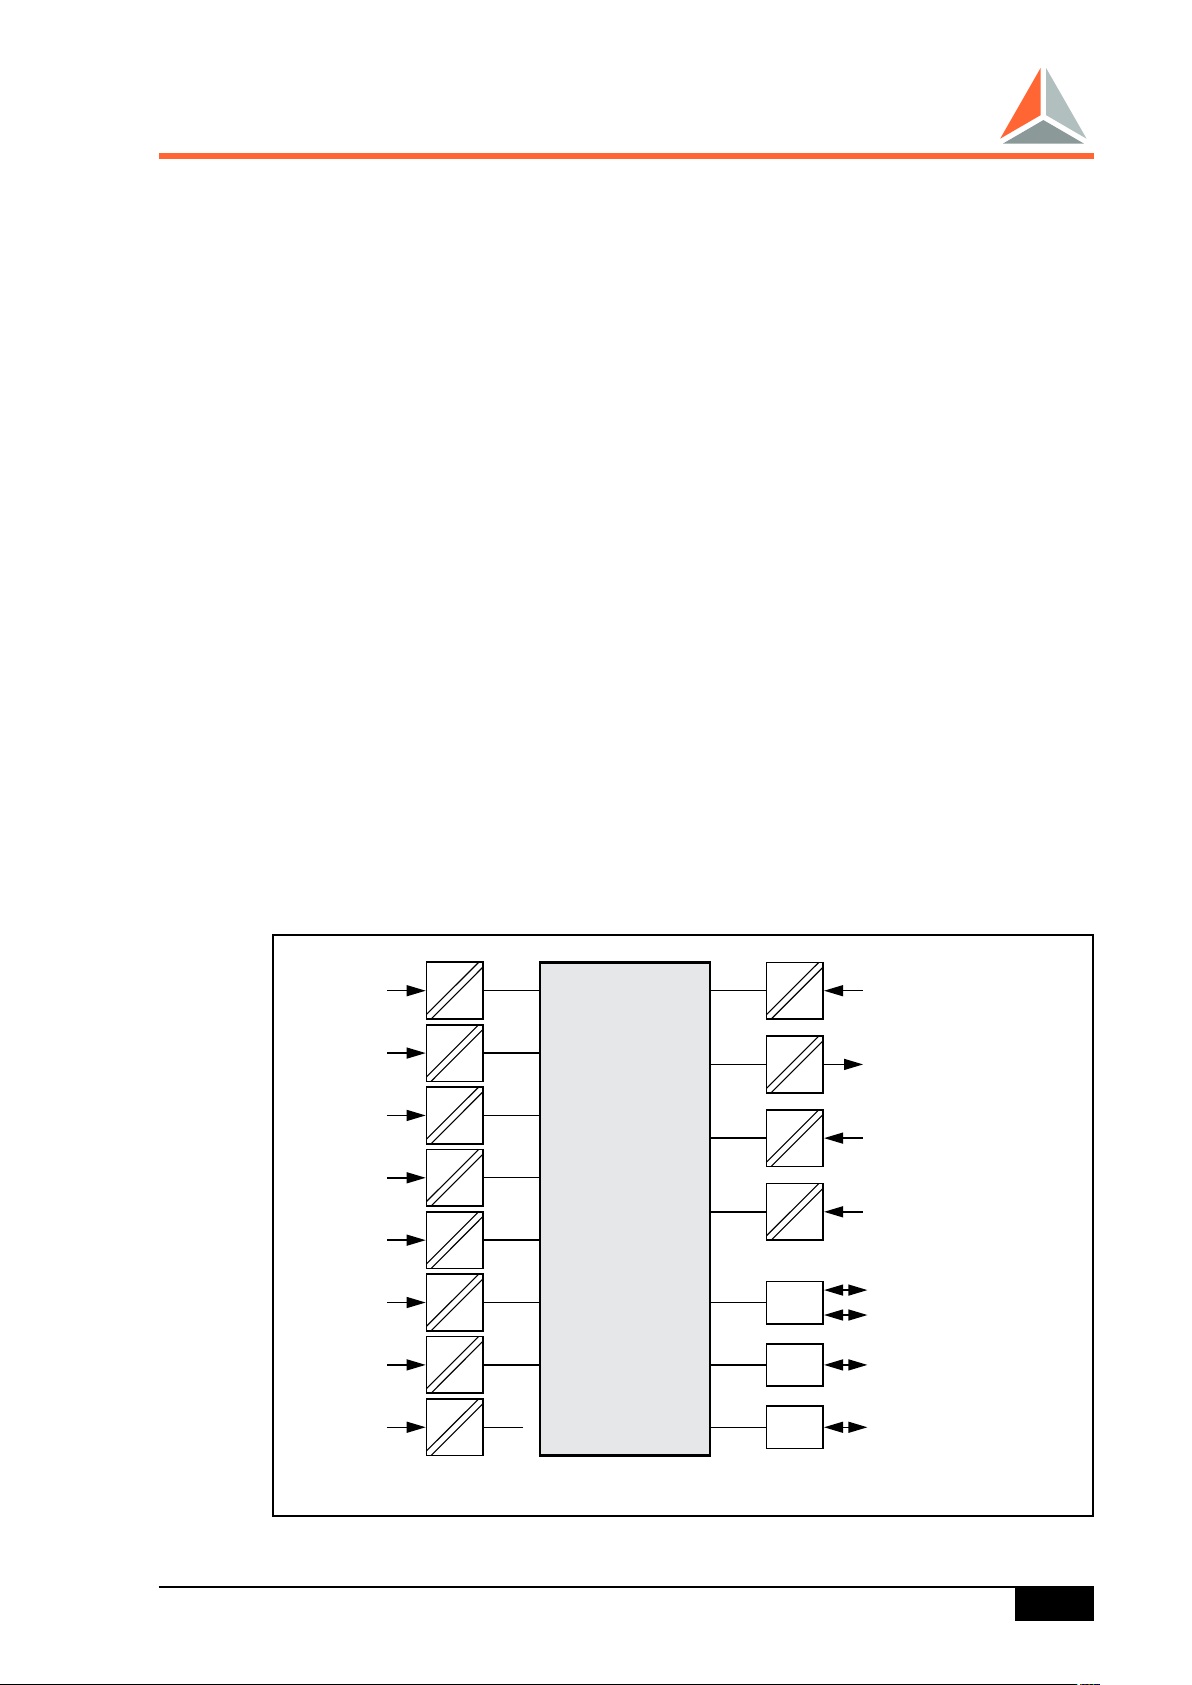
U1
U2
U3
UNE
DSP*
µP
LCD
LED´s
RAM
ROM
CLOCK
E-LAN-L
E-LAN-R
Binary inputs (BI)
Binary outputs (BO)
DCF 77
Trigger input
E-LAN
I1 (U1)
I2 (U2)
I3 (U3)
I0 (U4)
* DSP : digital signal processor
a-eberle
PQI-DA
1.2 Features of the Power-Quality-Interface & Disturbance Recorder PQI-DA
• Recording of the voltage quality according to DIN EN 50160
• Class A device according to IEC 61000-4-30
• Sampling frequency 10,24 kHz
• Fault recording function up to 20 x In
• Phase-phase and phase-earth measurements are possible simultaneously
• Voltage measurement channels for U
• Measurement of currents I1, I2, I3, I
• Acquisition of more than 3000 measured values
• Freely programmable limiting values and output via insulated contacts.
• Freely programmable binary inputs to start or stop measurements
• Data analysis via WinPQ software, using a mySQL-supported database
• Version with integrated TCP/IP-interface available
• Connection to SCADA according IEC 870-5-101
• Connection to SCADA according IEC 61850 in preparation
1.3 Description
, U23, U31, U
12
0
NE
Function of Power Quality-Interfaces
PQI-DA Operating Manual
10
Page 11
a-eberle
PQI-DA
2. Application
2.1 PQI-DA as a Recorder (Fault Recorder)
Fault records are stored in the recorders A, B and C each time a fault occurs.
Trigger condition is either the falling below or exceeding a voltage limit or an external trigger signal. When the system is triggered, the pre-event and the post-event
history of the voltage and current shape is recorded. You can choose between
three different recorders.
2.1.1 Recorder A
Recorder A stores fault records of the events before and after the fault occurs using,
for example, 2048 sampling values for each of the 8 measurement channels (1024
before, 1024 after). The measurement value acquired in each channel is dependent
on the configuration of the transformer and the version of the device.
Recorder A
8 voltages are sampled if 8 voltage inputs are used. If the measurement task
requires four voltage inputs and four current inputs, then four voltages and four
currents are measured accordingly.
8 simultaneously sampled momentary values are available every 100 µs, based
on a sampling frequency of 10.24 kHz. These can be used to reconstruct a
“fingerprint” of a particular event.
The number of events, the total recording time and the position of the trigger point
within the time slice can all be individually specified.
PQI-DA Operating Manual
11
Page 12

a-eberle
PQI-DA
The selection of the trigger point specifies how many periods (seconds) of information before the fault and how many periods of information after the fault should
be recorded per event.
Example: The total length of the record is specified as 2000 sampling points
(approximately 200 ms). This represents 10 periods for a network frequency of
50 Hz. If the pre-trigger is set to 1000, the information before the event and the
information after the event are both 5 periods, or 100 ms, long.
The total number of permissible trigger events must be chosen carefully since
records stored with recorder A require a very large amount of memory.
If the specified number of events is exceeded, either the oldest events will be
overwritten or no further records will be stored.
The desired behaviour can be chosen using Win PQ.
The trigger conditions which cause recorder A to be used can also be freely specified, i.e. they are not constrained to the limit values specified in EN 50160.
The trigger condition is created by linking selected events together with OR conditions.
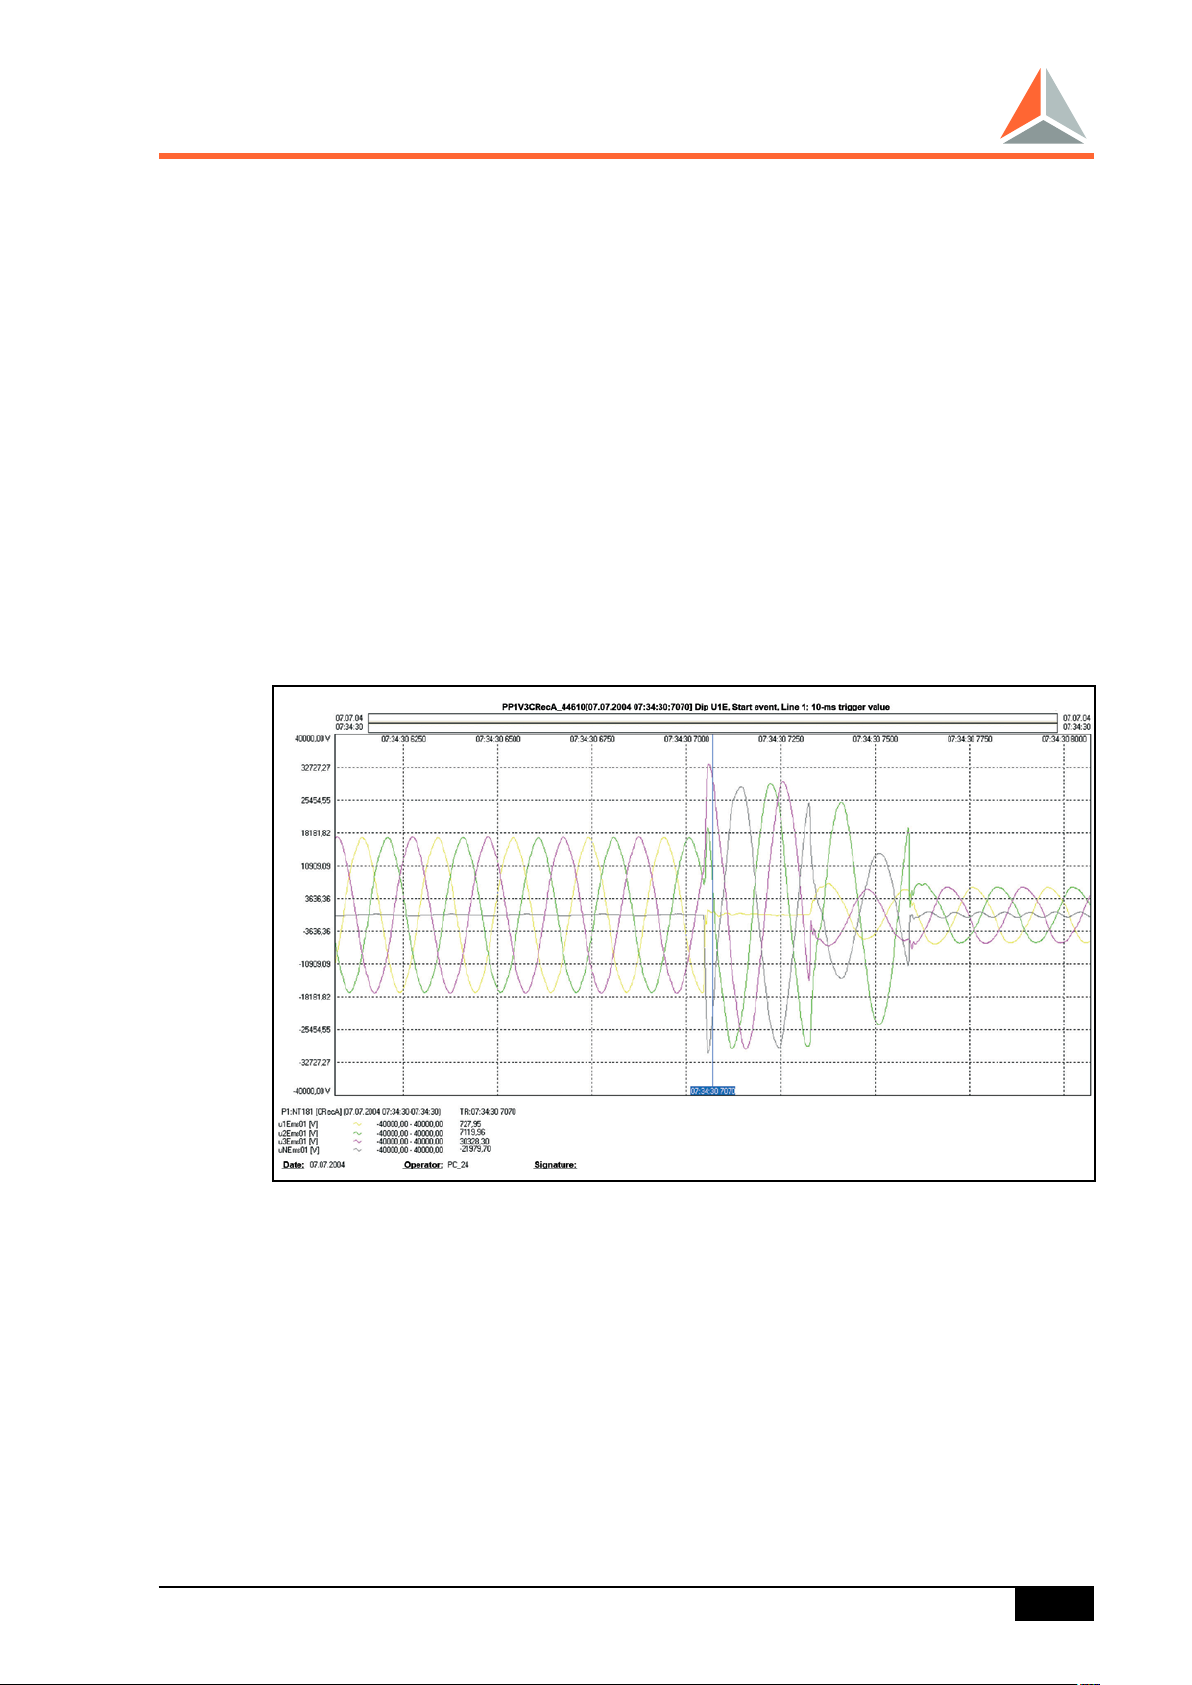
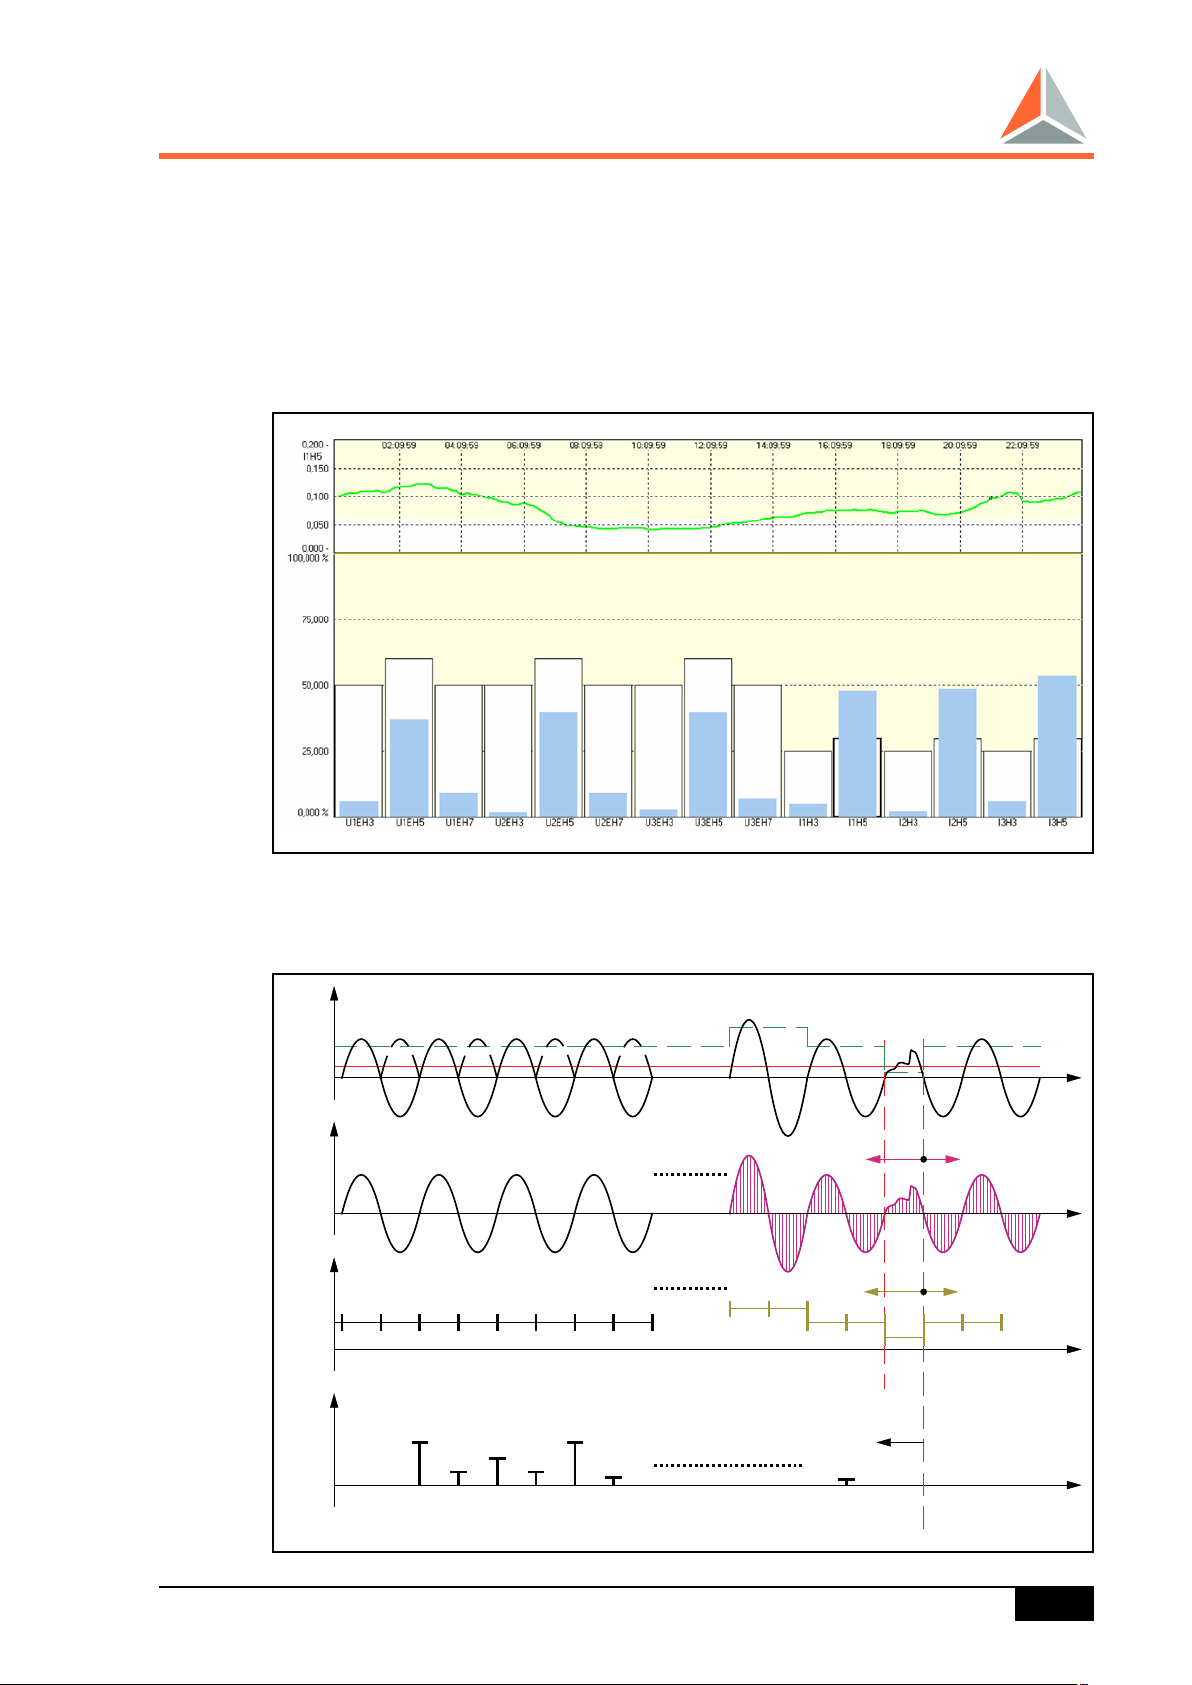
The record shows the single-pole earth fault, which changes to a 2-pole earth
fault a short time later.
This could be caused by the events described in the following account.
A mistake occurred in the cable duct: a hydraulic cutter was used to cut a cable
which was still connected to a voltage supply instead of one that was disconnected.
As the edge of the blade touched the first phase, it caused a single-pole earth
fault and an increase in the neutral earth voltage. A short time later, two phases
were short-circuited by the blade (phase-phase fault).
The subsequent progress of the fault process is explained in conjunction with
recorder B.
2.1.2 Recorder B
Recorder B stores fault records for the 1/2-period r.m.s. (root mean square) values
of phase and delta voltages. A record consists of a specifiable number of 1/2period r.m.s. values. Thus 10-ms values are recorded if the operating frequency
is 50 Hz.
The trigger condition is created by linking selected events together with OR conditions.
The number of events, the total recording time and the position of the trigger point
within the time slice can all be individually specified.
PQI-DA Operating Manual
12
Page 13
a-eberle
PQI-DA
The selection of the trigger point specifies how many half-period values (10-ms
values) should be recorded before and after the fault per event.
Recorder B
Example:
The total length of the record is specified as 500 10-ms values (approximately 5 s).
If the pre-trigger is set to 250, the information before the event and the information
after the event are both approximately 2.5 s long.
The total number of permissible trigger events must be chosen carefully. Records
stored with recorder B require a large amount of memory.
If the specified number of events is exceeded, either the oldest events will be
overwritten or no further records will be stored.
The desired behaviour can be selected using Win PQ.
The trigger conditions which cause recorder B to be used can be freely specified,
i.e. they are not constrained to the limit values specified in EN 50160.
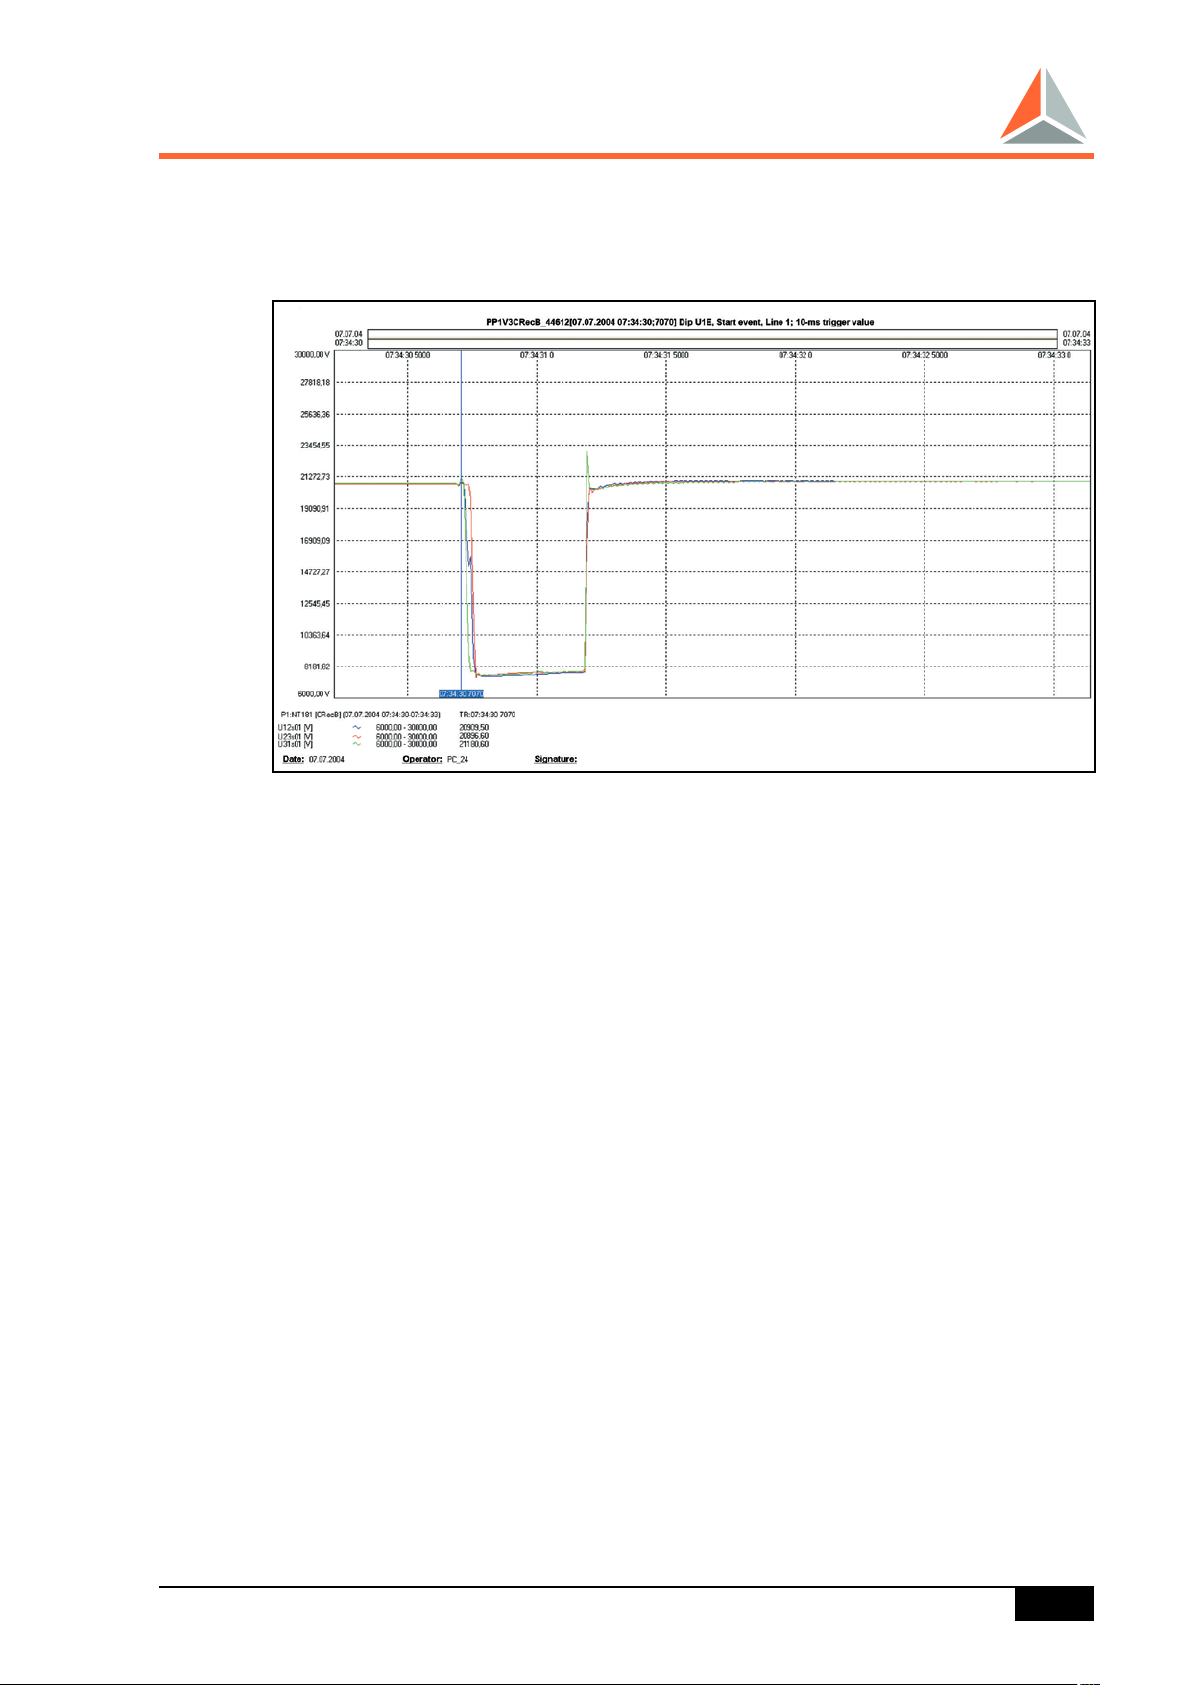
The record (see page 13) shows the fault illustrated on page 10 with a reduced
resolution (10-ms r.m.s. value).
Due to the resolution it is no longer possible to recognise the path to the fault, i.e.
the route from a single-pole to a 2-pole fault. However, one can see the effect of
the overcurrent relay which disconnected the faulty cable from the busbar after
approximately 400 ms.
PQI-DA Operating Manual
13
Page 14
Rec A
Rec B
Rec C
2. 3. 5. 7. 9. 11. 40.
t
0-1
t
0
t
0-1
t
0
TRMS
Event
Input signal
After the eventBefor the event
10-minute average values
of the harmonics
LV
After the eventBefor the event
T.R.M.S. = True Root Mean Square value, LV = limit value
a-eberle
PQI-DA
2.1.3 Recorder C
Recorder C stores the corresponding harmonic spectrum (10-minute harmonic
values) of a voltage if a harmonic limit or the THD (Total Harmonic Distortion,
10-minute value) of the voltage is exceeded.
The trigger condition is created by linking selected events together with OR conditions.
Recorder C
The comparison shows the three recorders A, B and C again as they are triggered
by a dip in the voltage between time t
and time t0.
0-1
PQI-DA Operating Manual
14
Page 15
a-eberle
PQI-DA
After the zero point (t0), recorders A and B store information regarding the time
period before and after the event, whereas recorder C only stores the 10-minute
harmonics values of the information before the event.
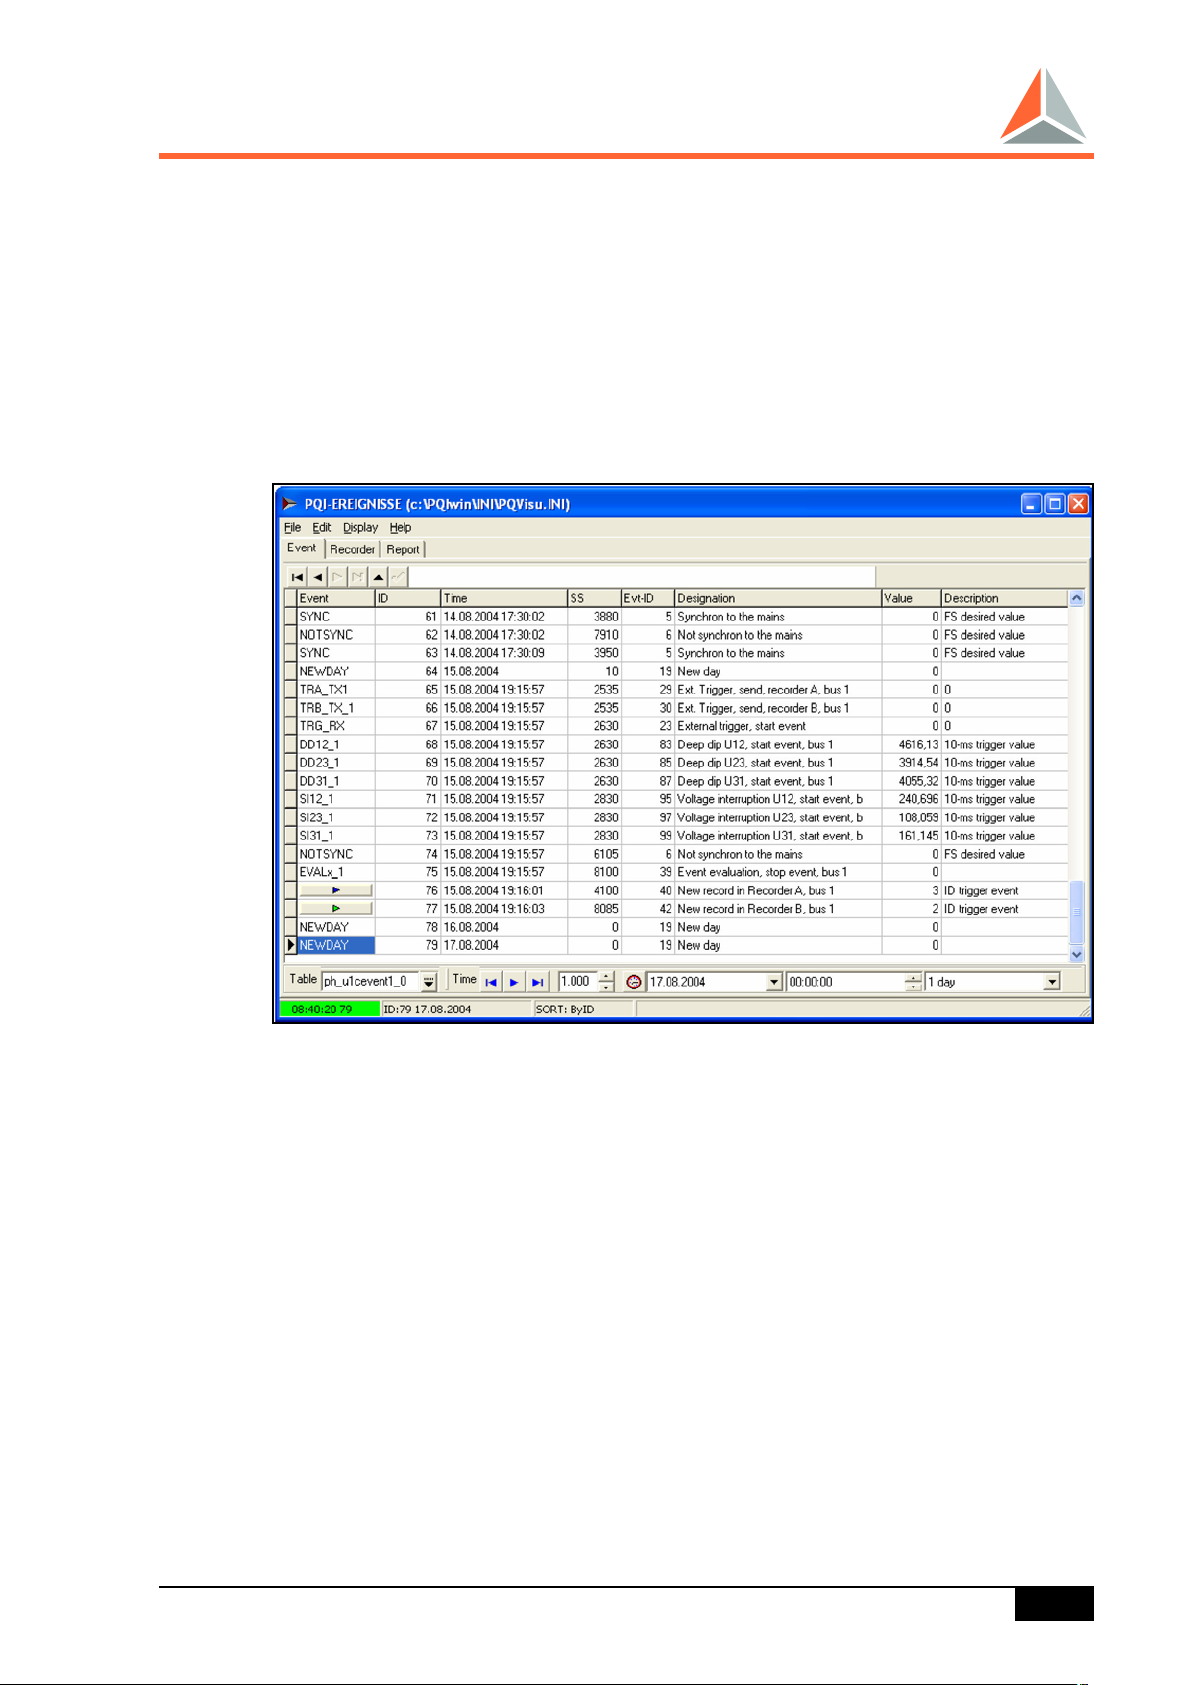
2.1.4 Events
By definition, an “event” occurs every time a measurement quantity exceeds the
threshold value specified in EN 50160 or any other predefined value
Each event is stored in the event memory along with the start and stop time.
Events which permanently exceed the threshold value are re-triggered at the end
of every 10-minute or 2-hour interval.
On the other hand, events which permanently exceed the threshold value are not
re-triggered at the end of every 10-ms interval or at the end of 1/2, 10, 12, 150
or 180-period values.
In these cases, only a stop event is recorded when the threshold value is no longer
exceeded.
To create time sums in these cases, the duration of the event is calculated from
the difference between the start and the stop time of the event, and is then stored
in the event memory.
PQI-DA Operating Manual
15
Page 16

a-eberle
PQI-DA
2.2 PQI-DA as System Component
The PQI-DA can be connected to all devices in the XXX-DX series (REG-D, REG-DA,
REG-DM, PAN-D, REG-DP, MMU-D, EOR-D etc.) from A. Eberle GmbH&Co KG
to create a measurement-, registration- and/or control-system.
The individual devices are connected to each other via the E-LAN system bus, and
up to 255 different devices can communicate with each other via one E-LAN.
If multiple transformers feed energy into a network in a transformer station and
each is equipped with a PQI-DA, the partial power of the individual transformers
can also be measured by the corresponding PQI-DAs. They transmit the partial
power to a particular PQI-DA via E-LAN, which then outputs the total power using
a virtual measurement channel.
Furthermore, freely programmable binary inputs can be linked with measurement
values or limit values, and also output as a binary signal.
PQI-DA Operating Manual
16
Page 17
a-eberle
PQI-DA
3. Technical Data
3.1 Standards
IEC 61010-1 / DIN EN 61010-1
IEC 60255-4 / DIN EN 60255-4
IEC 61326-1 / DIN EN 61326-1
IEC 60529 / DIN EN 60529
IEC 60068-1 / DIN EN 60068-1
IEC 60688 / DIN EN 60688
IEC 61000-6-2 / DIN EN 61000-6-2
IEC 61000-6-4 / DIN EN 61000-6-4
3.2 Voltage inputs
Option*) E1 E2
Un 100V 230V
Full scale range
(FSR),sinus
Impedance 360 kΩ 810 kΩ
Fundamental magnitude
error limit
Fundamental phase error limit ± 0.15°
Bandwidth DC…3kHz
Harmonics 2nd..50
error limit
Interharmonics 2nd..49
error limit
Insulation CAT III / 300V
th
th
200V 460V
±0.1% of U
over 10% ~ 150% of U
over 50% ~ 150% of U
over f
±5% of reading over Um = 1% ~ 16% of U
±0.05% of U
±5% of reading over Um = 1% ~ 16% of U
±0.05% of U
over Um < 1% of U
din
over Um < 1% of U
din
nom
din
din
din
±15%
din
din
din
din
PQI-DA Operating Manual
17
Page 18
a-eberle
PQI-DA
3.3 Current inputs
Option*) C20 C21 C30 C31
In 1A 5A
Full scale range (FSR)
sinus
Load (In) < 0.1 VA < 0.5 VA
Fundamental magnitude
error limit
Fundamental phase
error limit
Bandwidth 25Hz…3kHz
Harmonics 2nd...50
error limit
Interharmonics 2nd...49
error limit
Overload capacity
Continuous
≤ 10s
≤ 1s
≤ 5ms
Insulation CAT III / 300V
th
th
0 < I ≤ 2A 0 < I ≤ 20A 0 < I ≤ 10A 0 < I ≤ 100A
± 0.1% of FSR
over FSR
± 0.15° over
10% ~ 100%
of FSR
±5% of reading over Im = 1% ~ 16% of In
±0.05% of In over Im < 1% of I
±5% of reading over Im = 1% ~ 16% of In
±0.05% of In over Im < 1% of In
5A
10A
30A
100A
± 0.15° over
5% ~ 50%
of FSR
over f
± 0.15° over
10% ~ 100%
of FSR
±15%
nom
n
10A
30A
100A
500A
± 0.2% of FSR
over FSR
± 1.0° over
5% ~ 10%
of FSR
±10% of reading
over
Im = 1% ~ 16%
of In ±0.1%
of In over
Im < 1% of In
±10% of reading
over
Im = 1% ~ 16%
of In ±0.1%
of In over
Im < 1% of In
*) Note:
Codese.g.“E1,E2,C20,C31…“;seecharacteristicsonpage86
3.4 Binary inputs (BI)
Control signals Ust In the range
48 V ... 230 V AC/DC
Waveform Rectangular, sinusoidal
H – Level > 35 V
L – Level < 20 V
Signal frequency up to 60 Hz DC
Switching delay Selectable from 1...999 s
Input resistance 108 k
Electrical isolation Optocoupler; always two earthed
PQI-DA Operating Manual
Ω
18
Page 19

a-eberle
PQI-DA
3.5 Binary outputs (BO)
Electrical isolation isolated from all internally potentials
Type of relay Changeover contact Status,
R2, R3 Galvanically isolated from each other
R4, R5 Earthed
Contact load AC: 250 V, 5 A (cos
AC: 250 V, 3 A (cos
DC: 220 V, 150 W
switching capacity
No. of switching operations
LED display
Operation Green
Error Red
3.6 Limit value monitoring
Limit values Programmable
Response times Programmable
ϕ = 1.0)
ϕ = 0.4)
≥ 1.104 electrical
3.7 Measurement
(selection from over 3000 measurement quantities)
TRMS voltages U
TRMS current I1, I2, I3, I
Active power P
Reactive power Q
Apparent power S
Power factors cos
Harmonics U/I up to the 50
Interharmonics U/I up to the 49th
Frequency f
Flicker Pst, Plt
Dips, Swells, Interruptions
Voltage unbalance
Mains signalling voltages
, U2N, U3N, UNE, U12, U23, U
1N
0
ϕ
th
31
PQI-DA Operating Manual
19
Page 20

a-eberle
PQI-DA
Aggregation intervals:
½-cycle
10/12-cycle (fnom = 50/60Hz)
150/180-cycle (fnom = 50/60Hz)
5 / 6 / 6.67 / 7.5 / 10
2 h
Error limits:
Frequency: ± 5mHz over f
Flicker, Pst,Plt: ±5% of reading over 0.02% ~ 20% of
Dip residual voltage: ±0.2% of U
Dip duration: ±20ms over 10% ~ 100% of U
Swell residual voltage: ±0.2% of U
Swell duration: ±20ms over 100% ~ 150% of U
Interruption duration: ±20ms over 1% ~ 100% of U
Voltage unbalance: ±0.15% over 1% ~ 5% of reading
Mains signalling voltage: ±5% of reading over U
±0.15% of U
3.8 Reference conditions
Reference temperature 23°C ± 1 K
/ 12 / 15 / 20 / 30 min
±15% (f
nom
over 10% ~ 100% of U
din
over 100% ~ 150% of U
din
m
over Um = 1% ~ 3% of U
din
= 50Hz/60Hz)
nom
din
din
din
= 3% ~ 15% of U
∆U/U
din
din
din
din
Input parameters U = Un ± 10%
I = In ± 10%
Auxiliary voltage H = H
Frequency = f
Other IEC 60688 - Part 1
3.9 Measurement data acquisition
Sampling rate: 10240 Hz
ADC resolution: 24bit
Anti-Aliasing-Filters: Analog filter : 3
Digital filter : sinc
Nominal frequency: f
Fundamental frequency range: f
3.10 Storage of measured values
Permanent 4 MB
± 1%
n
± 1%
nom
= 50Hz, 60Hz
nom
±15 % (f
nom
rd
order Butterworth filter
5
decimation filter (ADC)
= 50 Hz / 60 Hz)
nom
Volatile 48 MB
PQI-DA Operating Manual
20
Page 21

a-eberle
PQI-DA
3.11 Electromagnetic Compatibility
CE conformity
- Electromagnetic Immunity
EN 61326
EN 61000-6-2
- Emitted interference
EN 61326
EN 61000-6-4
ESD
IEC 61000-4-2 8 kV / 16 kV
IEC 60 255-22-2
Electromagnetic fields
IEC 61000-4-3 10 V/m
IEC 60 255-22-3
Burst
IEC 61000-4-4 4 kV / 2 kV
IEC 60 255-22-4
Surge 1 MHz burst
IEC 61000-4-5 4 kV / 2 kV
IEC 61000-4-12 2.5 kV, class III
IEC 60 255-22-1
Conducted high frequency magnetic fields
IEC 61000-4-6 10 V, 150 kHz ... 80 MHz
IEC 61000-4-8 100 A/m continuous
All positions 1000 A/m 1 s
Voltage dips
IEC 61000-4-11 30 % 0.02s, 60 % 1 s
Emitted interference
EN 61326
EN 61000-6-4
- Housing
At a distance of 10 m 30 ... 230 MHz, 40 dB
230 ... 1000 MHz, 47 dB
- AC supply connection
At a distance of 10 m 0.15 ... 0.5 MHz, 79 dB
0.5 ... 5 MHz, 73 dB
5 ... 30 MHz, 73 dB
3.12 Electrical safety
Degree of protection I
Degree of pollution 2
Measuring category CAT III / 300 V
Optional CAT III / 500 V
PQI-DA Operating Manual
21
Page 22
a-eberle
PQI-DA
3.13 Operating voltages
50 V 230 V
E-LAN,
COM-Server,
COM1 ... COM2
Time- /
Trigger- BUS
3.14 Power supply
Feature H0 H1
AC (internal) - -
AC 85 … 264 V -
DC 88 … 280 V 18 … 72 V
Power
consumption
Frequency 40 … 70 Hz -
Miniature fuse T1 250 V T2 250 V
Auxiliary voltage
Binary inputs
Relay outputs
≤ 15 W ≤ 15 W
The following applies to all features:
Voltage interruptions ≤ 80 ms do not cause a fault or loss of data.
3.15 Environmental conditions
Temperature range
Function -15 ... +55°C
Transport und storage -25 ... +65°C
Humidity
No condensation
on 30 days/year 95 % rel.
Dry, cold
IEC 60068-2-1 -15°C / 16 h
Dry, hot
IEC 60068-2-2 +55°C / 16 h
Constant humid heat
IEC 60068-2-3 + 40 °C/93 % / 2 days
Cyclical humid heat
IEC 60068-2-30 12+12h, 6 cycles, +55°C/93%
Toppling
IEC 60068-2-31 100 mm drop, unwrapped
Vibration
IEC 60255-21-1 Class 1
Impact
IEC 60255-21-2 Class 1
PQI-DA Operating Manual
22
Page 23
132.05
204
216
80
147.2
www.a-eberle.de
PQI-DA
SERVICE
FAULT
RESET
class A
a-eberle
PQI-DA
3.16 Data storage
Device settings Serial EEPROM with
≥ 1000 k read/write cycles
RAM data Li battery laser-welded
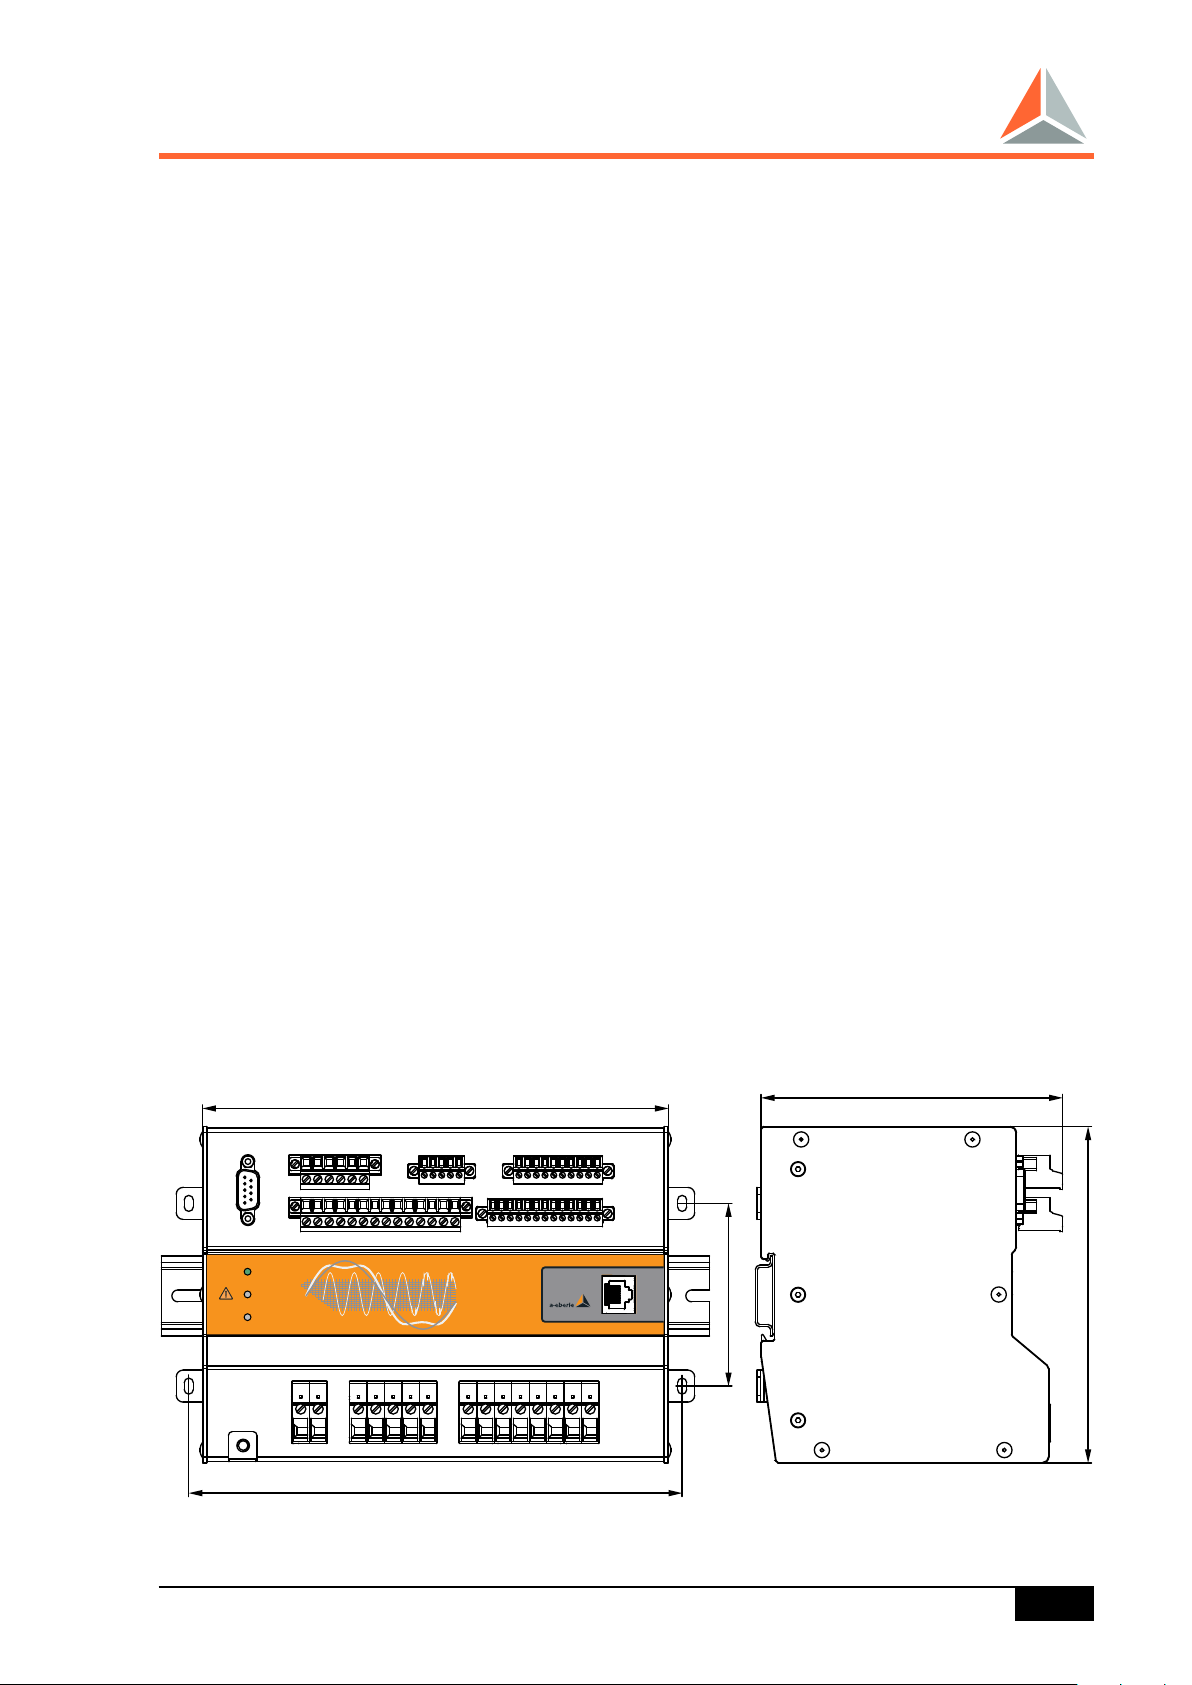
4. Mechanical Design
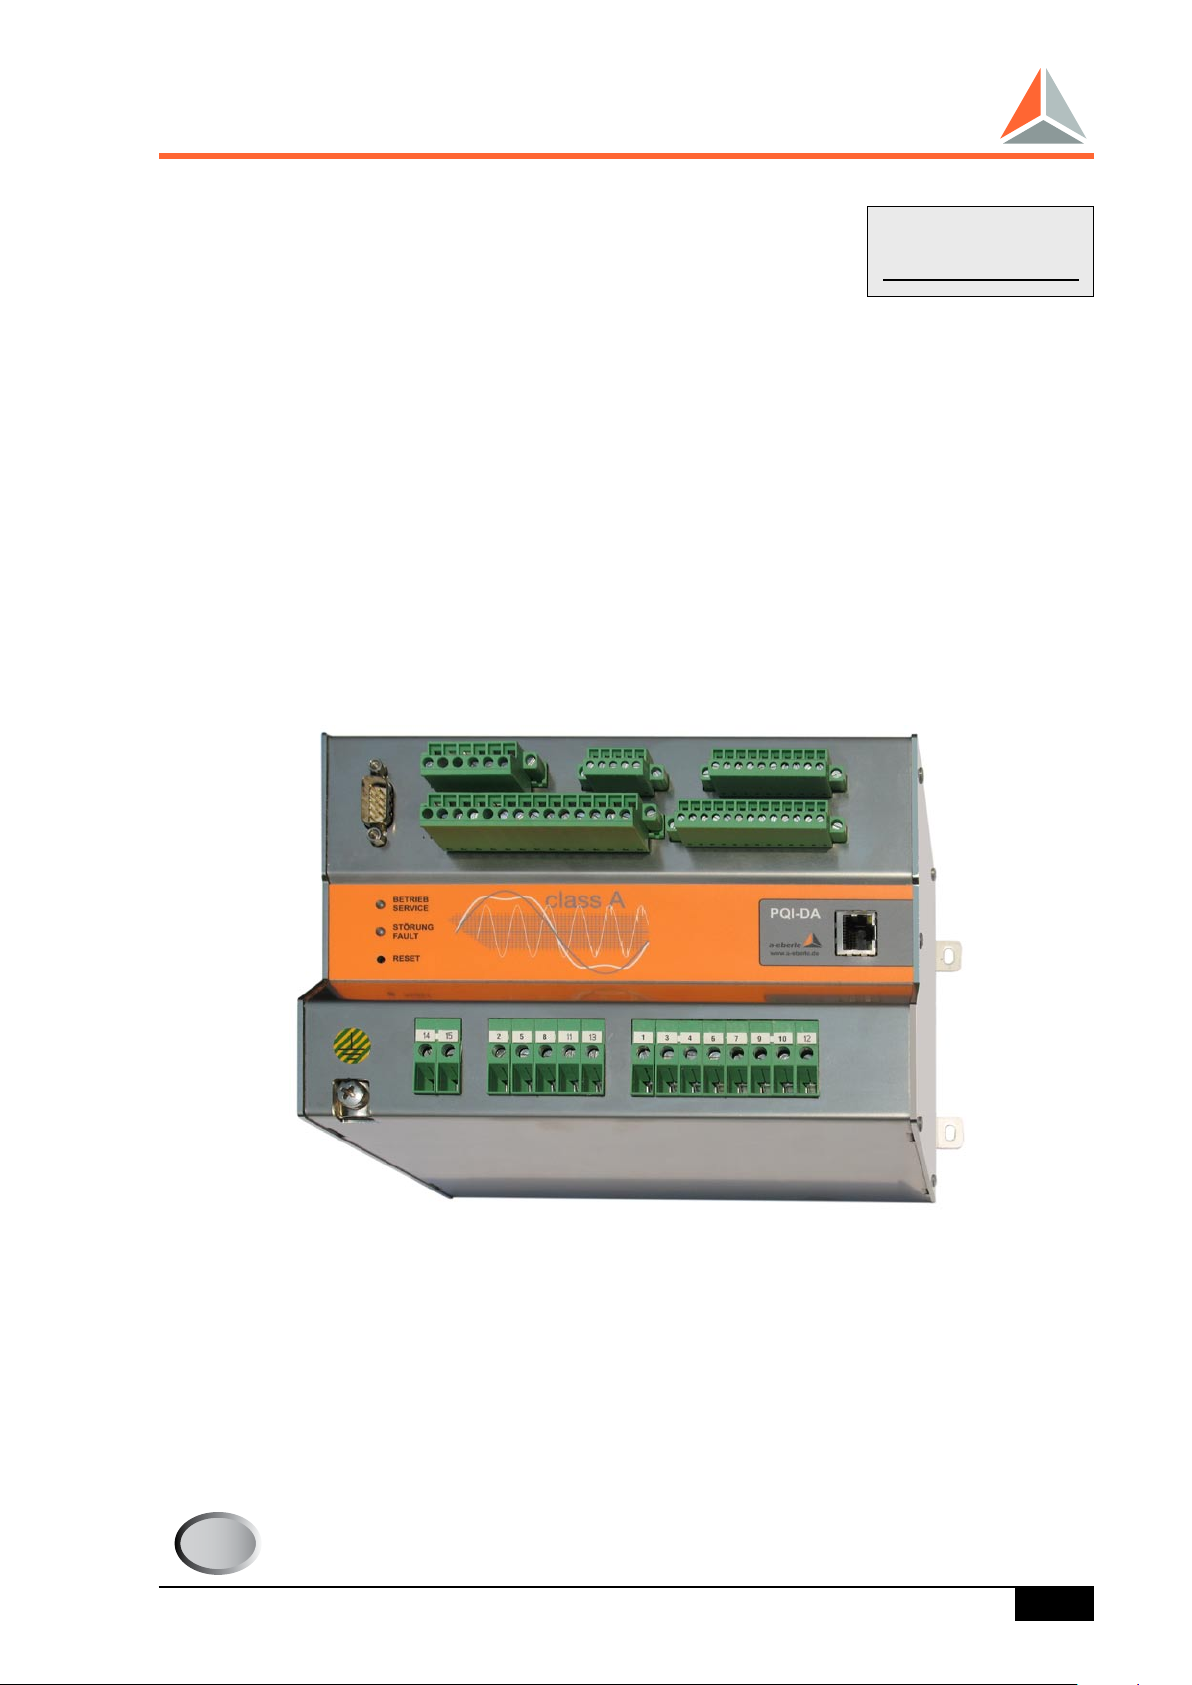
4.1 Housing
The Power Quality-Interface PQI-DA is kept in a rugged stainless steel case.
All connections are accessible via Phoenix terminals. The connections are made
in plug-in/clamping technology, except the current and voltage inputs.
If the option COM-Server (code T1) is selected, a RJ 45-connection is available.
The PQI-DA is applicable both as wall mountable as well as DIN rail mountable
housing.
Material stainless steel
Degree of protection
Housing IP 40
Terminals IP 20
Mass
≤ 2 kg
Dimensions see fig. below
Connection elements Screw terminals
Dimensions
PQI-DA Operating Manual
23
Page 24
4
6
1
3
7
9
10
12
I
3k
I
2k
I
1k
I
3l
I
2l
I
1l
I4kI
4l
x3
U L(+)HU L(-)
H
14 15
x1
2
5
8
11 13
U
1
U
2
U
3
x2
U
4
GND
PE
14 15
x1 x3
1
3
4 6
7
9 10
12
30 31
32 33 34 35
x7
59
606162
63
x8
36
37
38
39
40
41424344
45
x9
16
17
18 19
20
21 222324
25 26
27
28 29
x5
46 47
48
49
50
5152 53545556 57
58
x6
x2
2
5
8
11 13
a-eberle
PQI-DA
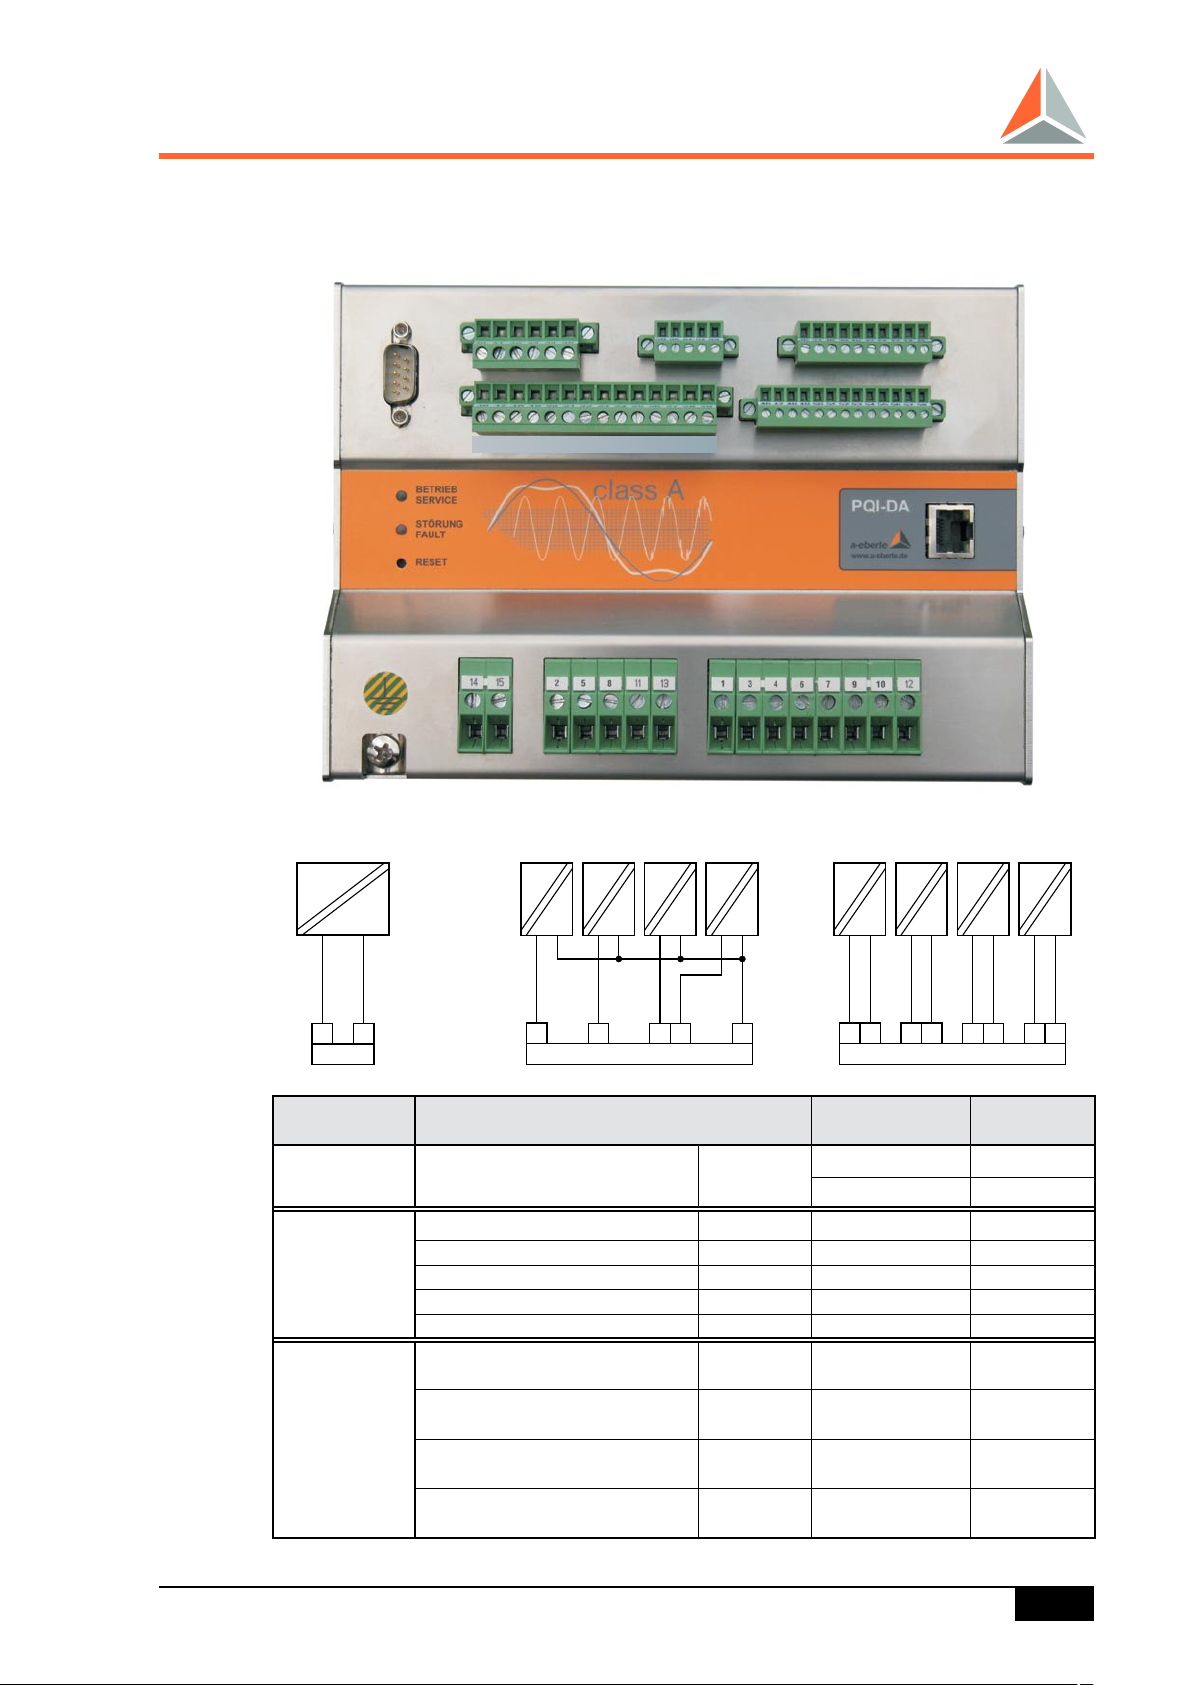
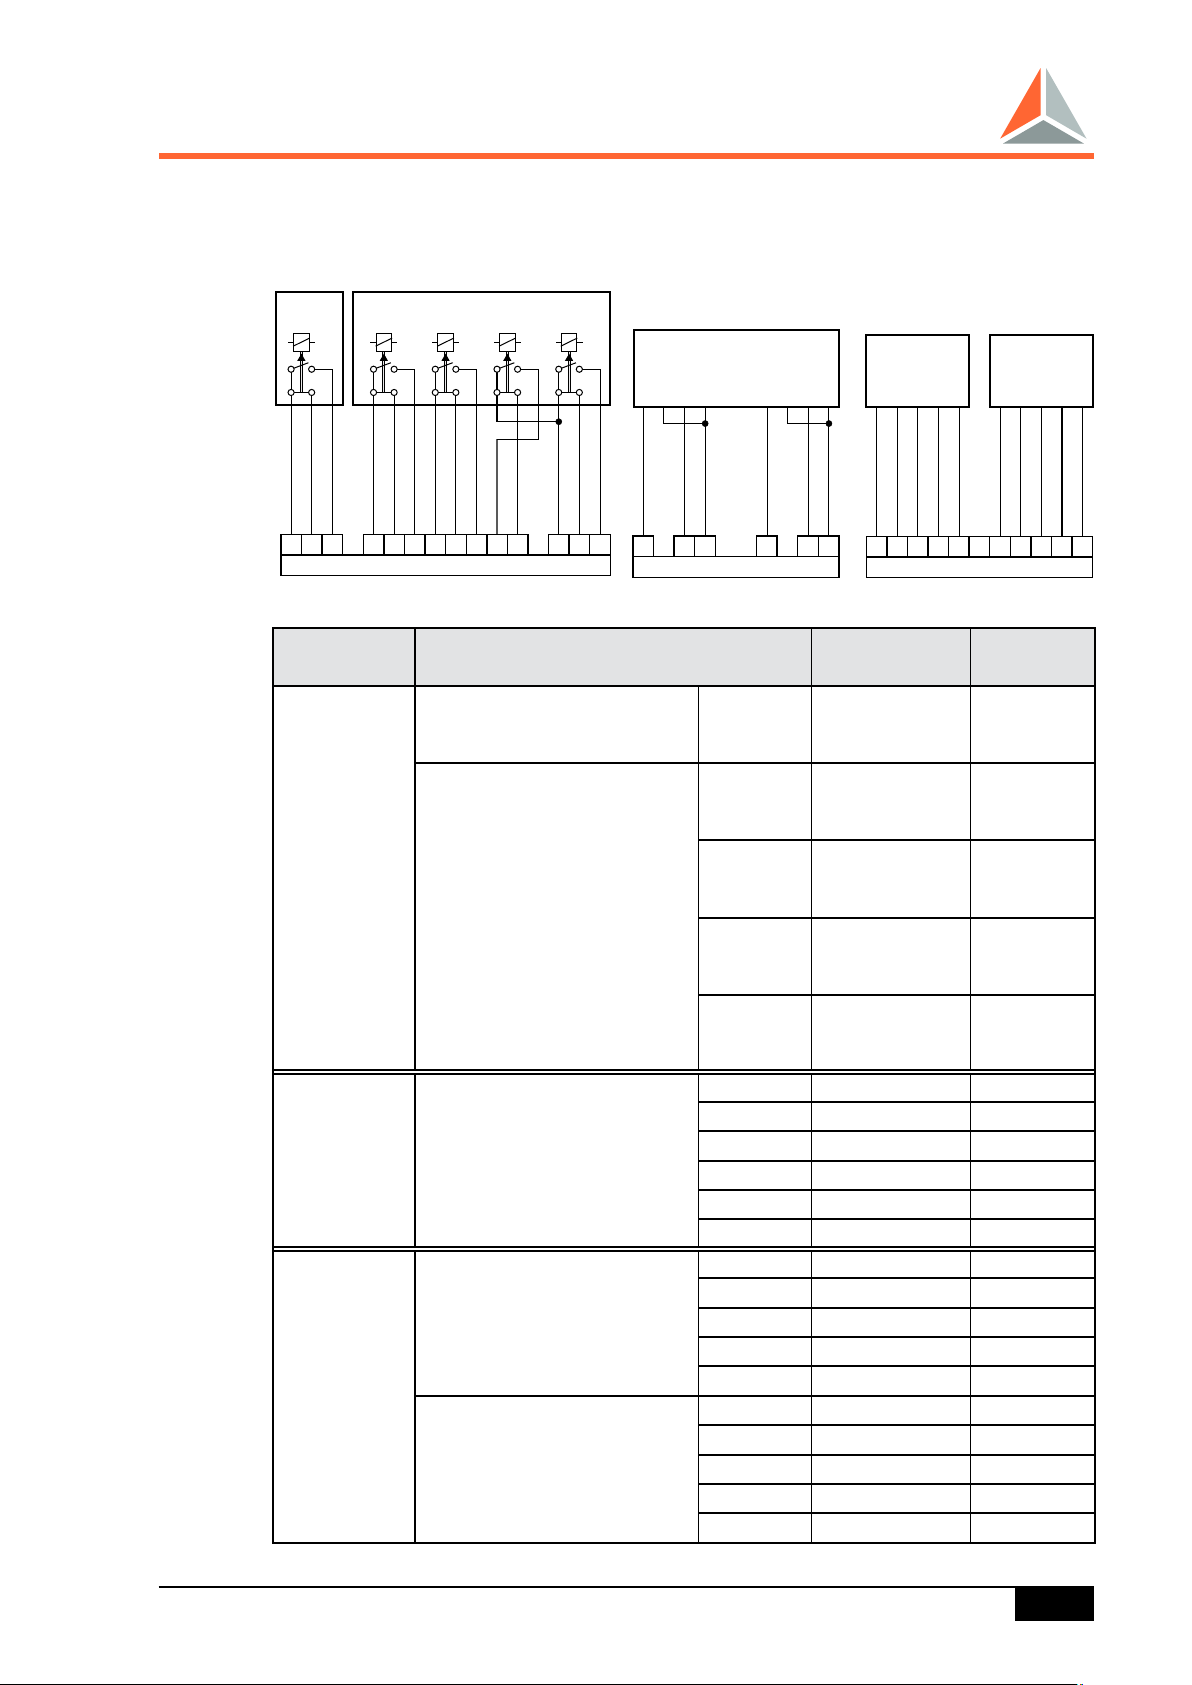
4.1.1 PQI-DA 4U / 4I
Assignment of the terminal blocks x1 … x3
Terminal
block no.
Description Function
x1 Auxiliary voltage U
Phase voltage L1 (AC) U
Phase voltage L2 U
x2
Phase voltage L3 U
Neutral voltage U
H
1
2
3
4
Terminal
no.
L (+) 14
L (-) 15
L1 2
L2 5
L3 8
N 11
Ground GND E 13
Phase Current L1 I1
Phase Current L2 I2
x3
Phase Current L3 I3
Neutral-current I4
PQI-DA Operating Manual
k 1
l 3
k 4
l 6
k 7
l 9
k 10
l 12
24
Page 25
30 31
32 33 34 35
x7
59
606162
63
x8
36
37
38
39
40
41424344
45
x9
46 47
48
49
50
5152 53545556 57
58
x6
16
17
18 19
20
21 222324
25 26
27
28 29
x5
2.1
5.1
8.1
11.1
x2 / line 1
2.2
5.2
8.2
11.2
x2 / line 2
14 15
x1
PE
GND
U L(+)HU L(-)
H
14 15
x1
2.2
5.2
8.2
11.2
GND
2.1
5.1
8.1
11.1
13
U
1
U
2
U
3
x2
U
1
U
2
U
3
U
4
U
4
a-eberle
PQI-DA
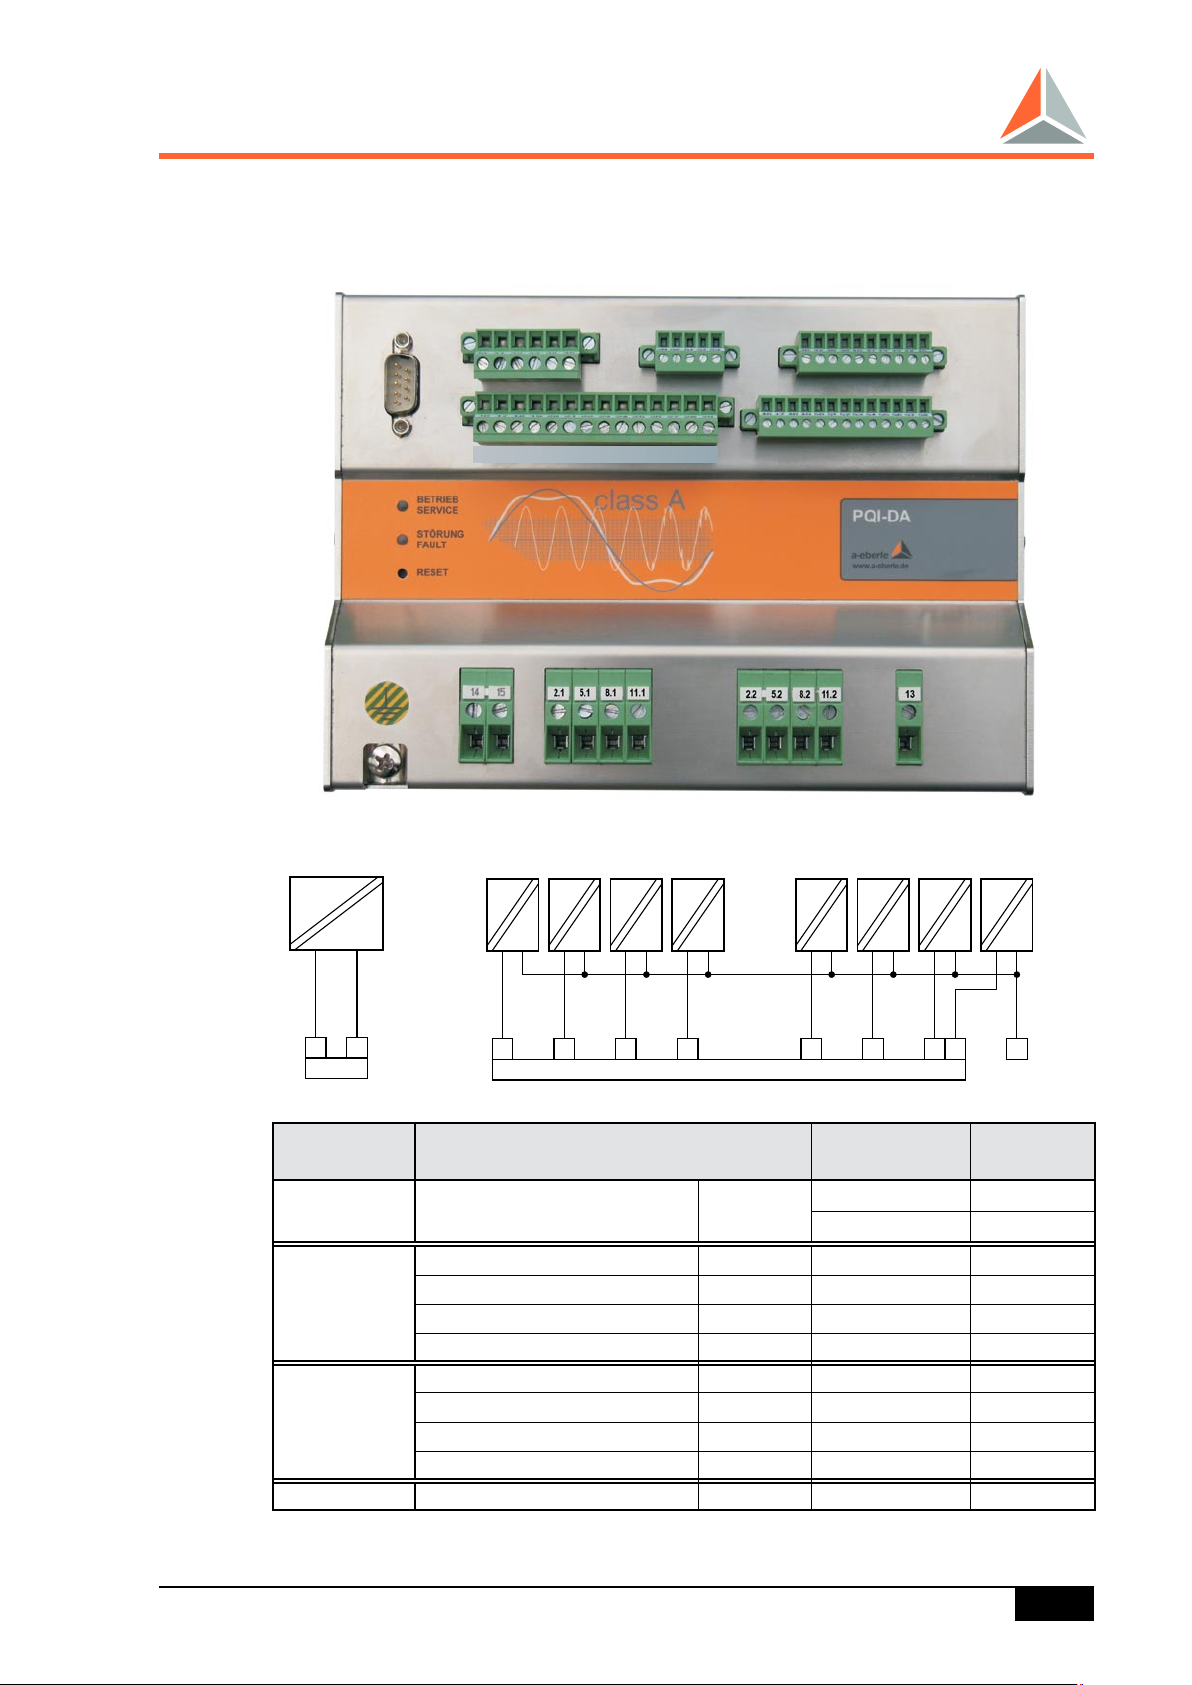
4.1.2 PQI-DA 8U
Assignment of terminal blocks x1 … x2
Terminal
block no.
Description Function
x1 Auxiliary voltage U
Phase voltage U
x2
line 1
Phase voltage U
Phase voltage U
Neutral voltage U
Phase voltage U
x2
line 2
Phase voltage U
Phase voltage U
Neutral voltage U
H
1
2
3
4
1
2
3
4
Terminal
no.
L (+) 14
L (-) 15
L1 2.1
L2 5.1
L3 8.1
N 11.1
L1 2.2
L2 5.2
L3 8.2
N 11.2
Ground GND E 13
PQI-DA Operating Manual
25
Page 26
prog.
prog.
prog.
prog.
R5
Binary outputs 230 V
Status
R2
R3
R4
16 19
22
25
17
20
23
26 28
18
21 24 27 29
x5
R1
Binary inputs 230 V
+-+ + +
- - -
E1 E2 E3 E4
30 31 32 33 34 35
prog.
prog.
prog.
prog.
x7
E-LAN
R
E-LAN
L
414042
39433844374536
E-
GND
E+
EA+
EA-
EA-
EA+
E+
GND
E-
x9
a-eberle
PQI-DA
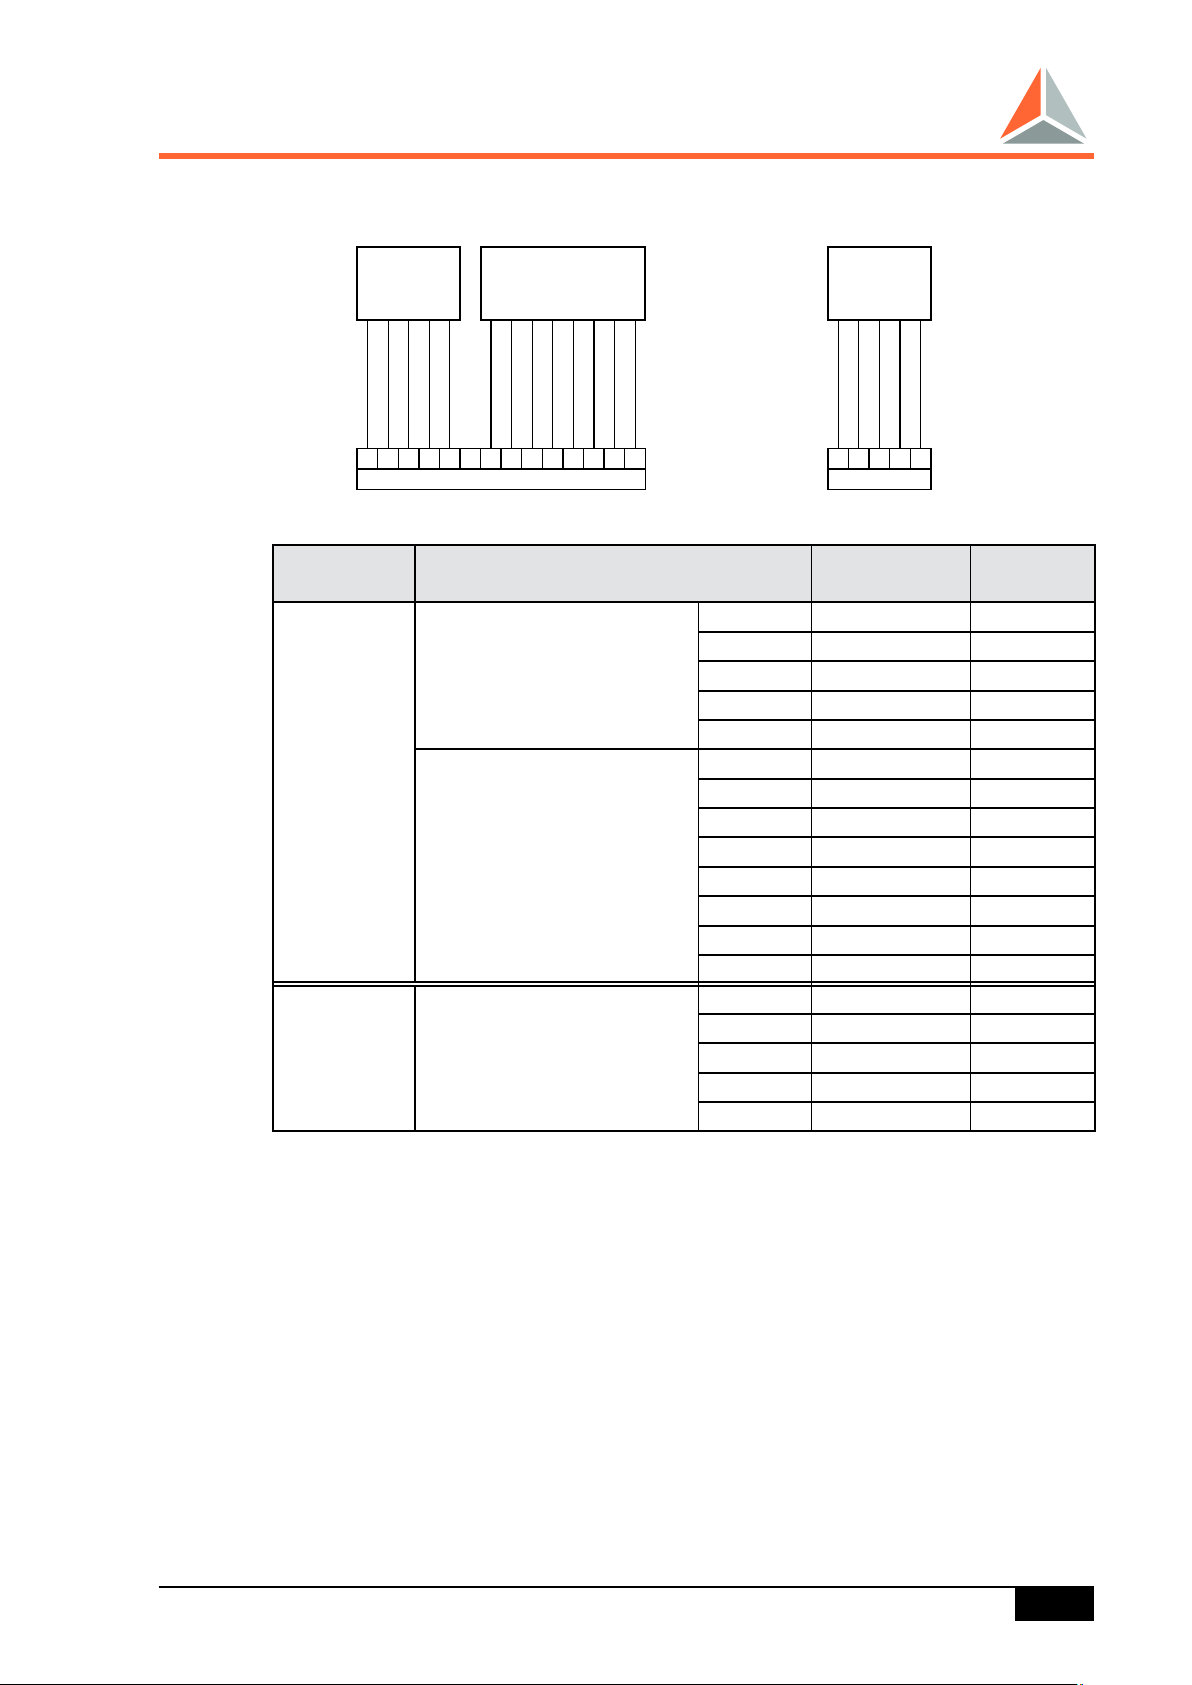
4.1.3 PQI-DA 4U/4I und 8U
Assignment of terminal blocks x5 … x9
PQI-DA Operating Manual
Terminal
block no.
Description Function
Status R1
x5
Binary outputs 230 V
x7 Binary inputs 230 V
E-LAN R (right)) E- 36
x9
E-LAN L (left) E- 41
Terminal
no.
Pole
NC contact
NO contact
Pole
R2
NC contact
NO contact
Pole
R3
NC contact
NO contact
Pole
R4
NC contact
NO contact
Pole
R5
NC contact
NO contact
E1 + 30
E2 + 31
E1 / E2 GND 32
E3 + 33
E4 + 34
E3 / E4 GND 35
E+ 37
EA- 38
EA+ 39
GND 40
E+ 42
EA- 43
EA+ 44
GND 45
16
17
18
19
20
21
22
23
24
27
26
25
27
28
29
26
Page 27
Trigger
GPS
IRIG-A
IRIG-B
58
57
56
55
54
53
5251504948
47
46
GND
Term TxB
TxB
TxA
Term TxA
RxB
Term RxA
RxA
GND
Term B
B
A
Term A
x6
(optional)
COM 2
RS232
63
62616059
TxD
RxD
GND
RTS
CTS
x8
a-eberle
PQI-DA
Terminal
block no.
x6
x8
Description Function
GPS,
IRIG-A
IRIG-B adapter card
Term A 46
Terminal
no.
A 47
B 48
Term B 49
GND 50
Trigger RxA 51
Term RxA 52
RxB 53
Term TxA 54
TxA 55
TxB 56
Term TxB 57
GND 58
COM 2
RS 232
CTS 59
RTS 60
GND 61
RxD 62
TxD 63
PQI-DA Operating Manual
27
Page 28

a-eberle
PQI-DA
5. Serial interfaces
5.1 RS232 interfaces
Each PQI-DA has two RS 232 interfaces referred to as COM 1 and COM 2.
COM 1 can be used as a parameterisation and programming interface via a 9-pole
SUB-D plug.
COM 2 can be wired via a plug-in terminal block.
If option T1 (COM server / TCP/IP) is selected, an RJ 45 connection is available
instead of COM 2.
Connection elements
COM 1 Pin strip, Sub Min D
on the front of the device,
pin assignment as on PC
COM 2 Terminal strip x8
Connection options PC, terminal, modem, PLC
Number of data bits / protocol Parity 8, even, off, odd
Transfer rate bit / s 1200, 2400, 4800, 9600, 19200,
38400, 57600, 76800, 115200
Handshake RTS / CTS or X
5.2 TCP/IP
The TCP/IP or COM server interface is galvanically isolated from all other electrical
circuits.
Communication via this interface is possible with a baud rate of 100 MBaud.
Parameterisation of the connection (IP address etc.) is carried out using the WinPQ
parameterisation software.
5.3 RS485 Interfaces
ON
/ X
OFF
Each PQI-DA is equipped with a double E-LAN interface as standard. It provides the bus connection to PQI-DAs, REG-D voltage regulators, REG-DP
Petersen coil regulators, or an EORSys earth fault locating system.
PQI-DA Operating Manual
28
Page 29

a-eberle
PQI-DA
5.4 E-LAN (Energy - Local Area Network)
5.4.1 Features
• 255 bus stations can be addressed
• Multimaster structure
• Integrated repeater function
• Open ring, bus or combination of bus and ring possible
• Log based on SDLC/HDLC framework
• Transfer rates of 62.5 or 125 kbit/s
• Telegram length 10 to 30 Bytes
• Average throughput approx. 100 telegrams / s
5.4.2 Configuration Information
The E-LAN (Energy- Local- Area- Network)) is a powerful bus which is used to
communicate with all the other bus devices, and which can be operated as either
a 2-wire or a 4-wire bus.
The bus controller can store up to 255 addresses. This means that theoretically
up to 255 A. Eberle GmbH & Co. KG devices can be operated by one E-LAN,
and they can all be read and parameterised using a single COM 1 or COM 2
(RS232) interface.
The transfer speed ranges from 15.6 to 375 kBaud.
It is possible to use either a 2-wire and 4-wire line-to-line connection, or to operate up to 32 devices in parallel using a dedicated 2-wire line like a standard bus
connection.
Mixtures of the two topologies are possible, as is the conversion to other bus
protocols and other physical media (LWL connection, coaxial cable, etc.).
The line-to-line topology has an E-LAN characteristic which is particularly useful
for distributed installed devices.
Two RS485 devices can be separated by up to 1.2 km according to the specification of the RS485 driver.
However, since all PQI-DA, like all other bus components, is equipped with a double
interface (E-LAN left and E-LAN right), each device acts as a repeater, meaning
the distance to be bridged can be increased by a further 1.2 km.
Figure 14 shows a configuration in which four PQI-DAs, with addresses <A> to
<D>, are operating on a dedicated 2-wire line using the standard bus technology.
The distance between these four devices may not exceed 1.2 km.
A second bus line is opened from address <B>. In this example, it leads to two
bus stations – a REG-D voltage regulator (address <E>) and a Peterson coil regulator (address <F>).
PQI-DA Operating Manual
29
Page 30

a-eberle
PQI-DA
In this example, an EOR-D is connected to the right hand E-LAN interface of the
PQI-DA with address <D> using a 4-wire connection.
The question “Which device should be connected to the right interface, and which
to the left interface?” is easily answered: both are acceptable. The system can
detect which sort of device is connected to which interface (left or right) and enters
the corresponding bus station (address, type of device, type of connection) into
its own bus index.
Therefore, the bus type doesn’t have to be taken into consideration when planning
an E-LAN. However, one must ensure that each E-LAN component has a unique
address (A...A9, B...B9, C...C9.....Z...Z4) and that the transfer speed and bus
topology are identical between two devices that are connected with each other.
Furthermore, one must ensure that if a two-wire connection is used, the first and
last bus connection are terminated with a resistance as this prevents reflections
from occurring. The resistances are available in every device (as hardware) and
can be activated or deactivated using WinPQ.
E-LAN connections that are not used should either be terminated or operated in
the 4-wire mode.
PQI-DA Operating Manual
30
Page 31

b8
b6
z8
z6
b8
b6
z8
z6
z8
z6
b8
b6
z8
z10
z12
z6
b8
b6
b10
b12
EOR-D
COM1
Status
Reset
PQI-D
COM1
Status
Reset
PQI-D
COM1
Status
Reset
2 wire BUS
z8
z6
BUS-L
BUS-L
BUS-L
BUS-L
BUS-L
BUS-R
BUS-R
BUS-R
BUS-R
BUS-R
BUS-R
4-wire
line to line
2-wire
line to line
2-wire line to line
<A>
<C>
<B>
<D>
<E>
<F>
<G>
PQI-DA
PQI-DA
PQI-D
PQI-D
REG-D
REG-DP
EOR-D
Example of linking using
E-LAN
<A>
PQI-D
PQI-DA
REG-D
REG-DP
EOR-D
Int. term.
BUS address
Power-Quality-Interface
Power-Quality-Interface &
Disturbance Recorder
Voltage regulator
Peterson coil regulator
Earth-fault locating relay
Interface must be terminated
with a resistance
Int. term.
Int. term.
Suitable for fibre optic cable transmission
lengths and RS 485 boosters
Int. term.
Int. term.
www.a-eberle.de
PQI-DA
BETRIEB
STÖRUNG
RESET
class A
www.a-eberle.de
PQI-DA
BETRIEB
STÖRUNG
RESET
class A
AUTO
local
remote
ESC
MENU
F5
F4
F3
F2
F1
Status
< U
> U
> I
REG-D
COM1
a-eberle
Display
X = 81,15
y = 76,95
B = 67,818 mm
H = 67,818 mm
AUTO
local
remote
ESC
MENU
F5
F4
F3
F2
F1
Status
REG-DP
COM1
a-eberle
M
x9
x9
a-eberle
PQI-DA
PQI-DA Operating Manual
31
Page 32

www.a-eberle.de
PQI-DA
BETRIEB
STÖRUNG
RESET
class A
www.a-eberle.de
PQI-DA
BETRIEB
STÖRUNG
RESET
class A
www.a-eberle.de
PQI-DA
BETRIEB
STÖRUNG
RESET
class A
x6 x6 x6
a-eberle
PQI-DA
5.5 Time Synchronisation and Measurement Trigger
The PQI-DA has an accurate quartz real time clock (RTC), which continues to run
even if the auxiliary voltage is interrupted. The synchronisation of multiple devices
is achieved by linking the PQI-DAs via the so-called time synchronisation bus
(RS 232) and/or E-LAN.
A device defined as the time master cyclically transmits its local time via E-LAN
to all the other PQI-DAs. The master also sends additional pulses each second
via the time synchronisation bus to achieve sub-second accuracy. Thus, the real
time clock of each synchronised PQI-DA will exactly match that of the master
PQI-DA.
If the master PQI-DA is synchronised by connecting a radio time signal (e.g. the
MSF signal in Great Britain), this signal is also applied to all the PQI-DAs it synchronises.
Multiple PQI-DAs can also be synchronised by assigning a radio time signal receiver
or GPS receiver to each PQI-DA.
Figure 15: Bussynchronisation,examplesfor3PQI-DAslinkedbya4-wireline.
PQI-DA Operating Manual
32
Page 33

a-eberle
PQI-DA
5.5.1 Measurement trigger
The PQI-DA can record fault records triggered by events and multiple PQI-DAs can
simultaneously store fault records when they are all connected to the measurement
trigger bus. If an event occurs in a PQI-DA that triggers its internal fault recording
to start, this unit sends a trigger pulse to the measurement trigger bus. This pulse
is then detected by the other PQI-Ds and they will also begin to store fault records,
if external triggering has been enabled.
The time trigger can, for example, also be used to deduce how a particular event
at input 1 affected the voltage quality at output 5.
The measurement trigger should always be activated if the exact time sequence
of events is required. Time differences of a few tens of milliseconds may occur
if time-critical data is transmitted over the E-LAN, due to the running time of the
bus.
From the electrical point of view, the time synchronisation bus and the measurement
trigger bus exhibit the same characteristics as the E-LAN (RS 485). However, in
contrast to the E-LAN, the interfaces of the first two can only be configured using
jumpers.
All PQI-DAs are supplied with the termination switched off.
The default values do not have to be altered if one or more PQI-DAs are operated
in a single housing or 19” mounting rack. The first and last device on the bus must
be correctly terminated if multiple housings or mounting racks are used (causing
the bus length to be longer than 50 cm). For time and measurement signals there
is a difference between active and passive termination.
Active termination terminates the bus with the wave resistance at the start of the
cable and at the same time applies the driving voltage to the appropriate bus
segment. On the other hand, a passively terminated bus station is normally located at the end of the cable, and is simply terminated with the wave resistance in
order to prevent reflections.
Due to this, the first device on the bus must be set to active termination and the
last device to passive termination. The termination remains switched off for all the
intermediate devices, i.e. they remain in the default status.
The jumpers for the two signals are located on an additional board which is mounted on the circuit board CPU (see Figure 16).
This method can be used to connect up to 32 devices to each other.
The specification of RS 485 drivers stipulates that the maximum separation of two
devices should not exceed 1.2 km.
PQI-DA Operating Manual
33
Page 34

a-eberle
PQI-DA
5.6 Parameterisation
The PQI-DA Power Quality Interface & Disturbance Recorder can be connected to
the E-LAN just like all other REGSys devices. A PC is used for the parameterisation
and the management of the synchronisation as well as to display the measurement
data of the networked devices. It is connected to one or more PQI-DAs using
the COM interface. REG-L commands are used for communication and both the
WinPQ and the ParaPQ programs can be utilised.
The data management of the system encompasses both the internal and external
management of the measurement and parameterisation data (within the device
and using a PC respectively). The user can only access the settings, statuses
and measurement data of the devices by using a PC (serial interface) since the
PQI-DAs do not contain an operator interface.
However, the units do not require any external computer to carry out the measurements.
Each PQI-DA can record measurement data for a certain amount of time, after
which the information must be transferred to a PC (database) as offline data.
A selection of online data can also be transferred to the PC, either continuously
or all at once. The selection is not affected by the configuration of the recording of
the measurement data. Both online and offline data can be displayed, but in order
to use the device memory and transfer capacity efficiently, the user must specify
which of the measurement quantities should be permanently displayed.
5.6.1 Parameterising the Device
The PQI-DA offers a wide range of measurement possibilities, and not all measurement quantities are required all the time.
However, the parameterisation principle is the same for all of them.
The following parameterisation steps are required:
5.6.1.1 Transformer configuration
The PQI-DA offers complete freedom with regard to configuring the transformer.
Voltage transformers and current transformers can be parameterised independently of each other, ensuring that (almost) every type of measuring circuit can
be achieved using PQI-DAs.
5.6.1.2 Measurement range
PQI-DAs are particularly suited for use in medium and high voltage networks.
However, their use in low voltage networks (230 V → custom value) is also possible without restrictions.
PQI-DA Operating Manual
34
Page 35

a-eberle
PQI-DA
5.6.1.3 Network frequency
The acceptable frequency range for fundamental current and voltage oscillations
is 45...65Hz.
The WinPQ software can be used to configure the triggering options of an event
or fault record for the individual measurement quantities.
5.6.1.4 System time
The system time can be entered into the PQI-DA or controlled by a radio time
signal (real time clock), e.g. in Great Britain, the MSF signal.
A “time drift” of up to 12 minutes per year may occur if a radio clock synchronisation system is not used.
5.6.1.5 Definition of measurement channels for interval data and
event-triggered measurement data
Specific measurement quantities that are appropriate to the type of task being
carried out can be selected and assigned to a measurement channel. Over 3,000
measurement quantities are available.
5.6.1.6 Configuration of the recording of the measurement data
The available memory can be divided according to the type of task being carried
out. If records or events are of particular interest, a significant part of the memory
can be used for these items.
5.7 Hardware-orientated device versions
The flexibility of the system, i.e. precisely matching specific requirements, can
also be achieved using the hardware characteristics of the input and output configuration.
Table 1 shows the different possibilities.
Measurement inputs
Feature
C00 4 voltage inputs (100 V / 230 V)
C10 2 x 4 voltage inputs (100 V / 230 V) for double busbar system
C20 to C31 4 voltage inputs (100 V / 230 V),
Table 1
PQI-DA Operating Manual
4 current inputs (1 A / 5 A)
35
Page 36

PQI-DA
Results according to EN50160
BB1
4 x U
COM1
T1
4 freely programmable limit
value outputs plus status
4 freely programmable
binary inputs (measurement
start, stop etc.)
PQI-DA
BB1
3 x I4 x U
COM1
T1
Results according to EN50160
4 freely programmable limit
value outputs plus status
4 freely programmable
binary inputs (measurement
start, stop etc.)
PQI-DA
4 x U
4 x U
BB2
COM1
T1
BB1
T2
Results according to EN50160
4 freely programmable limit
value outputs plus status
4 freely programmable
binary inputs (measurement
start, stop etc.)
PQI-DA
4 x U
4 x U
BB1
COM1
T1
Results according to EN50160
4 freely programmable limit
value outputs plus status
4 freely programmable
binary inputs (measurement
start, stop etc.)
MV
HV
PQI-DA
4 x U
4 x U
LV
COM1
T1
MV
Results according to EN50160
4 freely programmable limit
value outputs plus status
4 freely programmable
binary inputs (measurement
start, stop etc.)
a-eberle
PQI-DA
5.8 Application Examples (a selection)
There are 5 typical applications using feature “C”
PQI-DA Operating Manual
36
Page 37

RS232
COM 1
D-sub plug connector
front side
6
1 2 3 4 5
7 8 9
GND
RI
DTR
CTS
TXD
RTS
RXD
DSR
DCD
µP
LED
CLOCK
RAM/ROM
Display
DSP
E-LAN
R
E-LAN
L
414042
39 433844374536
E-
GND
E+
EA+
EA-
EA-
EA+
E+
GND
E-
x9
(optional)
COM 2
RS232
63
62616059
TxD
RxD
GND
RTS
CTS
x8
230 V binary inputs
+-+ + +
- - -
E1 E2 E3 E4
30 31 32 33 34 35
prog.
prog.
prog.
prog.
x7
Trigger
GPS
IRIG-A
IRIG-B
585756
55
54
53
52515049484746
GND
TermTxB
TxB
TxA
TermTxA
RxB
Term RxA
RxA
GND
Term B
B
A
TermA
x6
Strip no.
Terminal no.
prog.
prog.
prog.
prog.
R5
230 V binary outputs
Status
R2
R3
R4
16 19
22
17
20
23
2625 28
18
21 24 27 29
x5
R1
4
6
1
3
7
9
10
12
I
3k
I
2k
I
1k
I
3l
I
2l
I
1l
I
4k
I
4l
x3
2
5
8
11
13
GND
U
1
U
2
U
3
x2
U
4
Auxilliary voltag
AC or DC
U L(+)
H
U L(-)
H
14 15
x1
Strip no.
Terminal no.
RS232
COM 1
6
1 2 3 4 5
7 8 9
GND
RI
DTR
CTS
TXD
RTS
RXD
DSR
DCD
µP
LED
RAM/ROM
DSP
E-LAN
R
E-LAN
L
414042
39 433844374536
E-
GND
E+
EA+
EA-
EA-
EA+
E+
GND
E-
x9
(optional)
COM 2
RS232
63
62616059
TxD
RxD
GND
RTS
CTS
x8
+-+ + +
- - -
E1 E2 E3 E4
30 31 32 33 34 35
prog.
prog.
prog.
prog.
x7
Trigger
GPS
IRIG-A
IRIG-B
585756
55
54
53
52515049484746
GND
TermTxB
TxB
TxA
TermTxA
RxB
Term RxA
RxA
GND
Term B
B
A
TermA
x6
prog.
prog.
prog.
prog.
R5
Status
R2
R3
R4
16 19
22
17
20
23
2625 28
18
21 24 27 29
x5
R1
2.2
5.2
8.2
11.2
GND
2.1
5.1
8.1
11.1
13
U
1
U
2
U
3
x2
U
1
U
2
U
3
U
4
U
4
U L(+)
H
U L(-)
H
14 15
x1
D-sub plug connector
front side
Strip no.
Terminal no.
CLOCK
Display
230 V binary inputs
Strip no.
Terminal no.
230 V binary outputs
Auxilliary voltag
AC or DC
a-eberle
PQI-DA
5.9 Block diagram PQI-DA 4 U/4 I
FeaturesC20,C21,C30,C31
5.10 Block diagram PQI-DA 8xU
Features C10
PQI-DA Operating Manual
37
Page 38

a-eberle
PQI-DA
6. Characteristics of the Voltage Supply
The trend to permanently monitor the quality of the network is constantly increasing.
This is, on the one hand, due to the original specification of the task – the desire
to have fixed monitoring – and, on the other, due to the standards and regulations
that have arisen as a result of this desire.
Previously, a transportable device was installed in the system after a fault occurred.
The time t0 was deduced from the measurement between t1 and t2. If no fault
was detected between t1 and t2, one concluded that a fault also did not occur
between time t0 and t1.
This argument is both false and unscientific.
Due to this, EN 50160 defined a sequence of measurement intervals, which require
continuous measurement.
EN 50160 specifies average values that span 10 minutes, days, weeks and up to
a year. Measurements that last months or years can obviously only be achieved
using permanently installed devices.
The range of values and evaluation parameters for low voltage and medium voltage
networks are listed in the following tables.
6.1. Limit Values Specified in EN 50160
DIN EN 50160 “Voltage characteristics of electricity supplied by public distribution
systems”: 2008 generally leaves the precise specification of limits to be jointly
agreed upon by the energy supplier / distributor and the consumer.
This is to be expected, since this area is not uniform throughout Europe.
A feature that is essential for one recipient could have a much lower priority for a
different recipient.
Therefore, it is not only sensible, but also essential, that the voltage quality that
is to be supplied is defined in the negotiations between the energy suppliers and
the consumers.
Table 1 summarises the quality parameters specified in EN 50160 that are most
frequently used.
An example based on the row in Table 1 labelled “Random long interruptions to
the supply (>3 minutes )” (highlighted in grey) shows that the standard is only
applicable via negotiations between the energy supplier and the recipient.
For example, the Standard permits 10 to 50 interruptions of random length to the
voltage supply per year that may each last > 3 minutes.
There are 8760 hours in a year, and if one defines a voltage interruption as 175.2
hours (permissible since 175.2 hours > 3 minutes), it would be possible to not
supply any energy for an entire year and still remain within the framework of EN
50160 (8760 hours = 50 interruptions * 175.2 hours).
PQI-DA Operating Manual
38
Page 39

a-eberle
PQI-DA
This extreme example shows that the regulation only specifies the framework,
within which an individual voltage quality can be defined.
The PQI-DA Power Quality Interface & Disturbance Recorder measures all the
quality parameters and enables the user to define his/her own limit values.
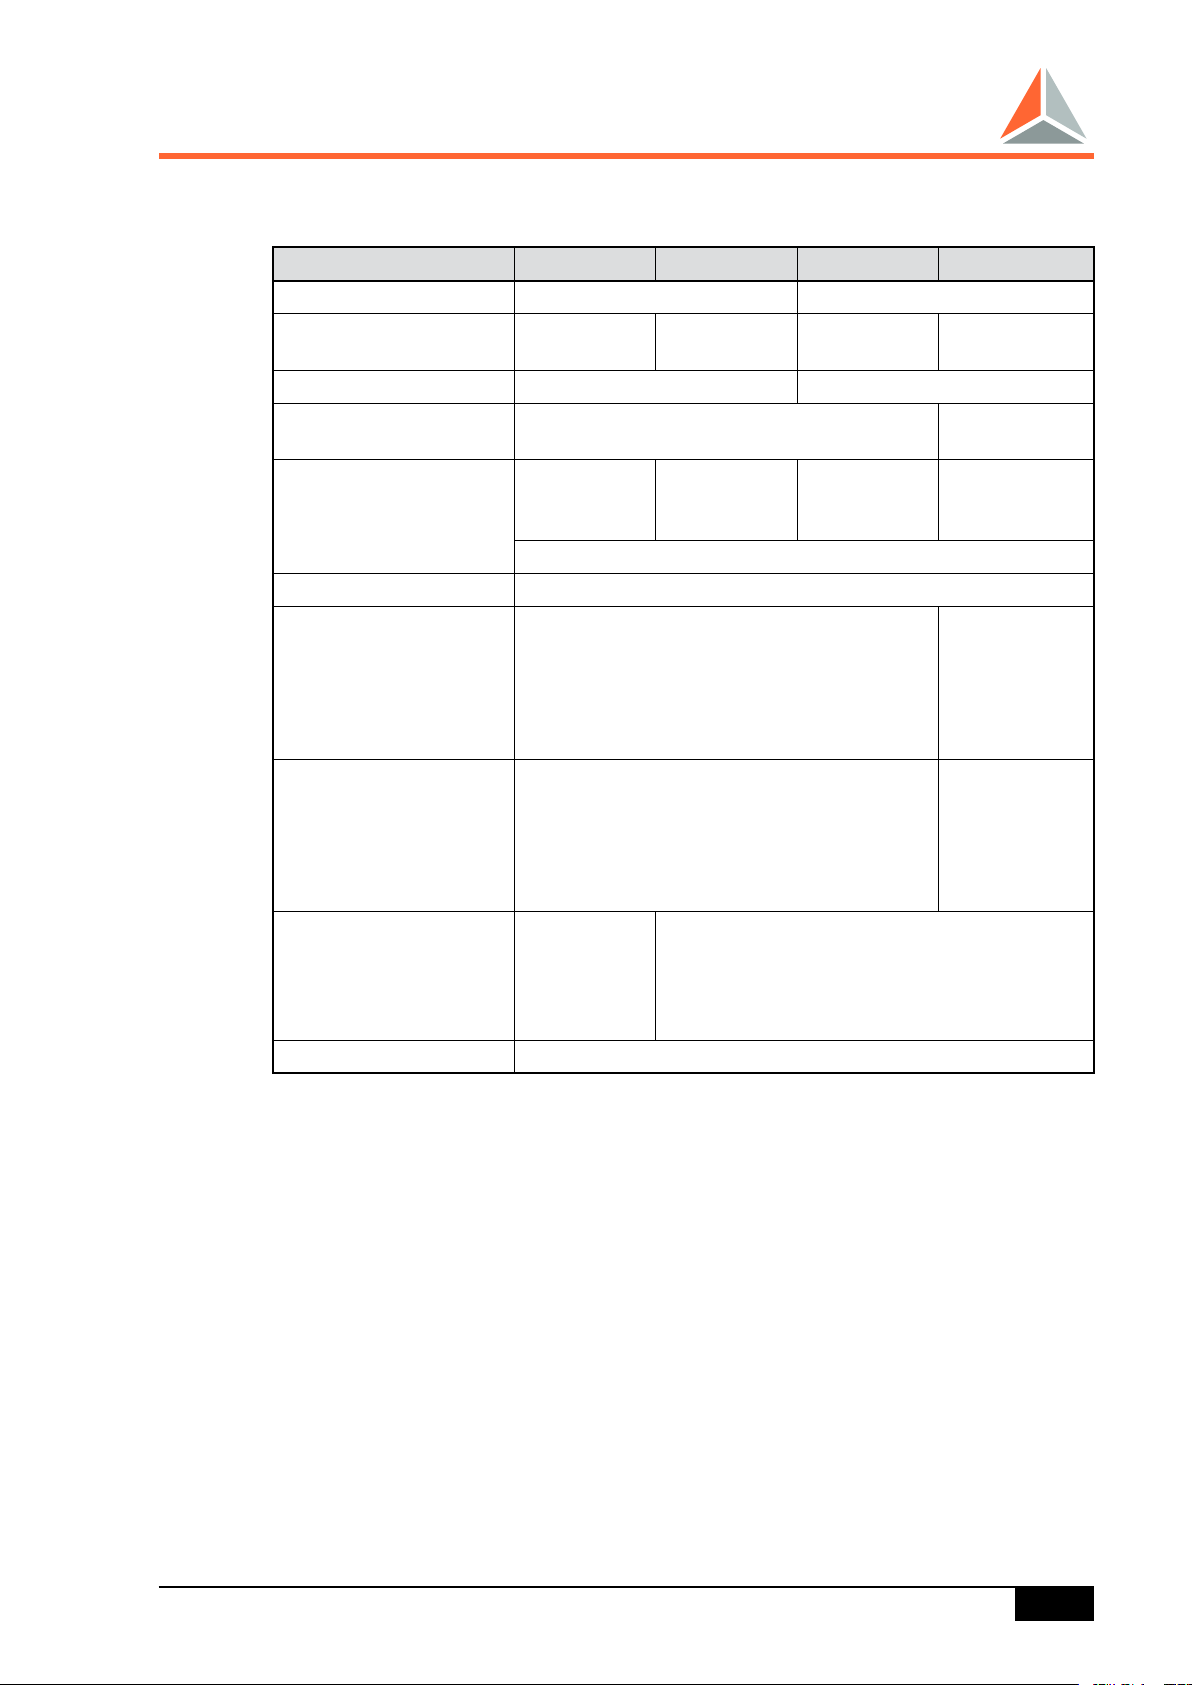
Summary of the important specifications contained in EN 50160
Characteristics of the
supply voltage
Frequency (when connected
to integrated network)
Slow voltage change 230 V
Fast voltage change 5 % 4 % R.m.s. value 10 min 1 day often
Flicker (specification only for
long flicker)
Voltage dips *)
(< 1 min)
Short interruptions to the
supply (< 3 min)
Random long interruptions to
the supply (>3 min)
Intermittent overvoltage at
the network frequency
(extern. conductor - earth)
Transient overvoltage
(extern. conductor - earth) Normally < 6 kV
Voltage asymmetry
(relationship between with
system and contra-system)
Harmonic voltage
(reference Un or Uc)
Inter-harmonic voltage Values not yet available Values not yet available
Signal voltages
(reference value, Un or Uc)
Values / ranges of values Measurement & evaluation params.
Low voltage Medium voltage
49.5 Hz to 50.5 Hz
47 Hz to 52 Hz
Uc
10 %
P = 1
10 to 1000 per year
(under 85 % Uc)
10 to 50 per year R.m.s. value 10 ms 1 year 100 %
10 to 50 per year
(under 1 % U)
Normally < 1.5 kV
Normally 2 %
In special cases up 3 %
Total harmonic distortion
(THD) = 8 %
(MS: 9 to 95 kHz range
not yet available)
±10 %
1.7 to 2.0 Uc
(depending. on
neutral-point
handling)
depending on
isolation
coordination
Basic
quantity
Integration
Interval
Average
value
R.m.s. value 10 s 1 week 95 %
Flicker
algorithm
R.m.s. value 10 ms 1 year 100 %
R.m.s. value 10 ms 1 year 100 %
R.m.s. value 10 ms None 100 %
R.m.s. value None None 100 %
R.m.s. value 10 min 1 week 95 %
R.m.s. value 10 min 1 week 95 %
R.m.s. value 3 s 1 day 99 %
10 s 1 year
2 h 1 week 95 %
Monitoring
period
99.5 %
100 %
Required
percentage
*) IEC 61000-4-30
Table 1
PQI-DA Operating Manual
39
Page 40

a-eberle
PQI-DA
7. Measurement Circuits
Transformer Configuration
In general:
If the neutral earth voltage UNE is not available, terminal “N” must be con-
nected to terminal “E”.
The choice of the type of connection is made via WinPQ.
Voltage transformer configuration and current transformer configuration can
be set independently of each other and therefore they can be adjusted to
any network situation.
Information:
WinPQ offers a button to carry out this procedure as simple as possible.
PQI-DA Operating Manual
40
Page 41

d10
z8
L1
E
d14
z12
L2
E
d18
z16
L3
E
d22
z20
N
E (PE)
d10
z8
L1
d14
z12
L2
d18
z16
L3
d22
z20
E (PE)
d6
z4
PQI-DA simplified connections
Conditions:
- U4 is not required and is therefore short-circuited
- Reference voltage is connected in parallel to L1
- Common zero point
PQI-DA voltage connections
U4
U3
U2
U1 U1
U2
U3
U4
U
sync
PQI-DA current connections
5
6
k
l
I1
I1
3
4
k
l
I2
I2
1
2
k
l
I3
I3
5
6
k
l
IS
I0
d10
z8
L1'
E'
d14
z12
L2'
E'
d18
z16
L3'
E'
d22
z20
N'
E (PE)'
PQI-DA voltage connections
U4
U3
U2
U1
Terminal strip 1 Terminal strip 1
Only characteristic C2 - terminal strip 2
Only characteristic C1 - terminal strip 2
Only characteristic C2 - terminal strip 3
a-eberle
PQI-DA
7.1 Connection Possibilities
Pin assignment for the voltage and current inputs of the PQI-DA
PQI-DA Operating Manual
41
Page 42

a-eberle
PQI-DA
7.2 Current Transformer Connections
Each PQI-DA Power Quality Interface & Disturbance Recorder has four current
inputs. In general, inputs I1 to I3 can be used to measure the line currents.
The fourth current can be used as a sum current or as a neutral conductor current
input.
For sum current measurements, it is irrelevant if the sum current is created using
a sum current transformer (core balance transformer) or a Holm-Green circuit.
Only two currents are required in an Aron circuit, because in “healthy” threeconductor networks the third current can be calculated if the other two currents
are already known (a healthy network is one in which the vector sum of all three
currents is zero).
Normally, an Aron circuit is applied in such a way that the currents in L1 and L3
are measured and are then used to calculate L2.
The PQI-DA is not limited in this case either, since the appropriate input configuration is prepared regardless of which phases have a current transformer available.
Only one current transformer needs to be connected in equally loaded networks.
In this case the PQI-DA transmits the total power, by multiplying the phase power
by 3 (the three individual powers are the same if the network is equally loaded).
The appropriate input configuration is prepared in this case too, regardless of
which phase contains the current transformer.
PQI-DA Operating Manual
42
Page 43

I
1
I
2
I
3
I
0
L2
L3
L1
k
I1
Only characteristic C2: Socket connector 2
6 5
l
Socket connector 3
S1 S2
P1 P2
k
I2
l
S1 S2
P1 P2
k
I3
l
S1 S2
P1 P2
k
l
S1 S2
4 3 2 1 6 5
I
ALAKBLBKCL
CK
I-configuration 1, 3-phase
I
1
I
2
I
3
I
0
L2
L3
N
L1
X
x
k
I1
6 5 6 5
l
S1 S2
P1 P2
X
x
k
I2
l
S1 S2
P1 P2
X
x
k
I3
l
S1 S2
P1 P2
k
I
N
l
4 3 2 1
I-configuration 2, 4-phase
I
1
I
2
I
3
I
0
L2
L3
N
L1
k
I1
6 5
l
S1 S2
P1 P2
k
I2
l
S1 S2
P1 P2
k
I3
l
S1 S2
P1 P2
k
I
N
l
S1 S2
P1 P2
4 3 2 1 6 5
I
1
I
2
I
3
I
0
L2
L3
L1
X
x
k
I1
6 5 6 5
l
S1 S2
P1 P2
X
x
k
I2
l
S1 S2
P1 P2
X
x
k
I3
l
S1 S2
P1 P2
k
l
4 3 2 1
I-configuration 2, 3-phase
I
I
1
I
2
I
3
I
0
L2
L3
L1
k
I1
6 5
l
X
x
k
I2
l
S1 S2
P1 P2
X
x
k
I3
l
S1 S2
P1 P2
k
l
S1 S2
4 3 2 1 6 5
I
ALAKBLBKCL
CK
I-configuration 3, 3-phase
I
1
I
2
I
3
I
0
L2
L3
N
L1
x
k
I1
I-configuration 3, 4-phase
6 5
l
X
x
k
I2
l
S1 S2
P1 P2
X
x
k
I3
l
S1 S2
P1 P2
X
x
k
I
N
l
S1 S2
P1 P2
4 3 2 1 6 5
Only characteristic C2: Socket connector 2
Socket connector 3
I-configuration 1, 4-phase
Only characteristic C2: Socket connector 2
Socket connector 3
Only characteristic C2: Socket connector 2
Socket connector 3
Only characteristic C2: Socket connector 2
Socket connector 3
Only characteristic C2: Socket connector 2
Socket connector 3
a-eberle
PQI-DA
7.2.1 PQI-DA Current Transformer Connection
PQI-DA Operating Manual
43
Page 44

I
1
I
2
I
3
I
0
L2
L3
L1
X
x
k
I1
6 5
l
S1 S2
P1 P2
k
I2
l
X
x
k
I3
l
S1 S2
P1 P2
k
l
S1 S2
4 3 2 1 6 5
I
ALAKBLBKCL
CK
I
1
I
2
I
3
I
0
L2
L3
N
L1
X
x
k
I1
6 5
l
S1 S2
P1 P2
x
k
I2
l
X
x
k
I3
l
S1 S2
P1 P2
X
x
k
I
N
l
S1 S2
P1 P2
4 3 2 1 6 5
I
1
I
2
I
3
I
0
L2
L3
L1
X
x
k
I1
6 5
l
S1 S2
P1 P2
X
x
k
I2
l
S1 S2
P1 P2
k
I3
l
k
l
S1 S2
4 3 2 1 6 5
I
ALAKBLBKCL
CK
I
1
I
2
I
3
I
0
L2
L3
N
L1
X
x
k
I1
6 5
l
S1 S2
P1 P2
X
x
k
I2
l
S1 S2
P1 P2
k
I3
l
X
x
k
I
N
l
S1 S2
P1 P2
4 3 2 1 6 5
Only characteristic C2: Socket connector 2
Socket connector 3
Only characteristic C2: Socket connector 2
Socket connector 3
Only characteristic C2: Socket connector 2
Socket connector 3
Only characteristic C2: Socket connector 2
Socket connector 3
I-configuration 4, 3-phase I-configuration 4, 4-phase
I-configuration 5, 3-phase I-configuration 5, 4-phase
a-eberle
PQI-DA
7.2.2 PQI-DA Current Transformer Connection
7.3 Voltage Transformer Connections
The PQI-DA offers different configurations for the voltage measurement.
Which type of connection has to be selected is determined by the structure of the
system. Three single-pole as well as two double-pole isolated voltage transformers
can be used. Of course, using the PQI-DA also single-phase measurements are
possible.
The fourth measurement input is designated for measuring the neutral-to-earth
voltage UNE.
Information: The PQI-DA can also calculate the neutral-to-earth voltage out of
the three phase-to-neutral voltages; a physical connection of the neutral-to-earth
voltage is not mandatory. Thus, the fourth input can be used for another voltage
measurement, delivering additional information.
PQI-DA Operating Manual
44
Page 45

U1E U2E U3E UNE
Usync
L2
L3
N
PE
L1
L1 PEL2 L3
Socket connector 1
z8 d10
z12 d14 z16 d18
z20
d22 z4 d6
U-configuration 1, 4-phase
N
U1E U2E U3E UNE
Usync
L2
L3
L1
A
X
x
a
L1 E
B
X
x
b
L2
C
X
x
c
L3
z8 d10
z12 d14 z16 d18
z20
d22 z4 d6
N
L2
L3
L1
B
a
L1
E
A
X
x
b
L2
A
X
x
L3
z8 d10
z12 d14 z16 d18
z20
d22 z4 d6
B
a
b
U1E U2E U3E UNE
Usync
N
U
NE
L2
L3
L1
A
b
L1 E
B
X
x
a
L2
B
X
x
L3
Federleiste 1
z8 d10
z12 d14 z16 d18
z20
d22 z4 d6
A
b
a
U1E U2E U3E UNE
Usync
N
U
NE
L2
L3
L1
A
b
L1 E
B
X
x
a
L2
A
X
x
L3
z8 d10
z12 d14 z16 d18
z20
d22 z4 d6
B
a
b
U1E U2E U3E UNE
Usync
U
NE
N
U1E U2E U3E UNE
Usync
L2
L3
L1
A
X
x
a
L1
B
X
x
b
L2
C
X
x
c
L3
z8 d10
z12 d14 z16 d18
z20
d22 z4 d6
EN
U
NE
Socket connector 1
U-configuration 1, 3-phase
Socket connector 1 Socket connector 1
Socket connector 1 Socket connector 1
U-configuration 2 U-configuration 3
U-configuration 4 U-configuration 5
a-eberle
PQI-DA
7.3.1 PQI-DA Voltage Transformer Connection
Information:
If UNE is not required, both terminals of input UNE must be short-circuited.
PQI-DA Operating Manual
45
Page 46

a-eberle
PQI-DA
8. Management of Process Data within the Device
When the PQI-DA is operating, it generates a large amount of continuous and
event-triggered data, of which only a certain proportion can be measured and
saved within a limited time period. The length of the saving process is dependent
on the amount to be saved as well as on how often the data is transferred to the
PC database.
The selection of the data, as well as the method of displaying it, must be configurable so that the device memory and transfer capacity resources can be used
as flexibly and efficiently as possible. Therefore, all the configuration parameters
are readable and stored in the device so that the process data are uniquely identifiable at all times when accessed using a PC.
8.1 Classification of the Data
The transferred data can be assigned to one of the following categories:
Settings (parameters)
10/12* periods (0.2 s) – process data
150/180* periods (3 s) – process data
10-minute process data
2-hour process data
Day-long process data
Event data
Fault records
* 10/12 and 150/180 correspond to 50 Hz and 60 Hz networks and specify the
number of measured periods.
Example:
One period in a 50 Hz network lasts 0.02 s. Therefore, an integration over 150
periods produces a total measurement time of 3 s. On the other hand, 180 periods
are required in 60 Hz networks to (approximately) achieve a 3-second average
value, since each period lasts 16.666 ms.
The measurement times differ from 3 s if the frequencies fluctuate by a large
amount.
Example:
If the frequency is 49 Hz, the measurement time is not 3 seconds, but 150 x
1/49Hz =3.06 seconds.
A data class can contain different types of measurement values:
The 10-minute and day-long process data consist of both average values and
extreme values, whereas the fault records contain µs sampling values, ½-period
values and spectra.
10-minute process data: Average values, extreme values
Day-long process data: Average values, extreme values
Fault records: Sampling value, ½-period values, spectra
PQI-DA Operating Manual
46
Page 47

a-eberle
PQI-DA
8.2 Monitoring the Voltage Quality and Managing the Process Data
Sources: EN 50160:2008
IEC 61000-4-30:2008
A. Eberle internal sources
8.2.1 Overview
Terminology
Measurement data classes
Events
Statistical quantities
Features of the supply quality
Parameterising the recording of measurement data
Parameterising the evaluation and display of events
Parameterising the fault records
Signals and their outputs
Analogue outputs
New features of Version x.0.10
8.2.2 Terminology
Supply voltage (EN 50160):
R.m.s. value of the voltage at the transfer point.
Agreed supply voltage Uc (EN 50160):
Nominal voltage, unless an alternative is agreed upon between the power
supply company and the customer.
Normal operating conditions (EN 50160):
Describes the operating status in a distributed network in which current
supply requirements are met, switching operations are carried out and faults
are rectified using automatic protection systems without any unusual
circumstances arising due to external influences or large bottlenecks in the
supply.
Slow voltage change (EN 50160):
Changes in the r.m.s. value of the voltage due to changes in the load.
Fast voltage change (EN 50160):
An individual fast change to the r.m.s. voltage between two successive
voltage levels having a definite, but non-specific.
PQI-DA Operating Manual
47
Page 48

a-eberle
PQI-DA
Flicker (EN 50160):
Voltage dip (EN 50160):
Planned/random voltage interruption (EN 50160):
Intermittent overvoltage at the network frequency (EN 50160):
nth order harmonic voltage:
This describes fluctuations in the supply voltage which cause the visual
brightness of an attached lamp to change by a certain amount.
Short-term flicker magnitude Pst : 10-minute interval value Long-term flicker
magnitude Plt : quadratic 2-hour average value of 12 Pst values
Drop in the r.m.s. voltage to 90%..1% of Uc.
R.m.s. value of the voltage < 1% of Uc.
Duration >= 3 minutes : Long-term interruption < 3 minutes : Short-term
interruption
R.m.s. voltage increases to >170% of Uc.
Spectral components with a frequency n times the basic frequency of a
periodic voltage.
THD (= Total Harmonic Distortion):
R.m.s. value of harmonic voltages n=2..40 based on the r.m.s. value of
basic frequency.
Asymmetrical voltage:
The amount the basic frequency voltage vectors differ from the symmetrical situation is measured using the relationship between the with-system
and contra-system components (where symmetrical means two successive
phases have the same amplitude and phase difference).
Voltage dip (IEC 61000-4-30):
Temporary reduction of the voltage at a point in the electrical system below
a threshold. An interruption is a special case of a voltage dip.
Minimum voltage and the duration are important characteristic values.
Voltage swell (IEC 61000-4-30):
Temporary increase of the voltage at a point in the electrical system above a
threshold.
Maximum voltage and the duration are important characteristic values.
PQI-DA Operating Manual
48
Page 49

a-eberle
PQI-DA
8.2.3 Measurement Data Classes
Sampling values
97.7-us interval at a network frequency of 50 Hz, 3.54 Gbytes /
(day * measurement channel)
Half-period r.m.s. values
10-ms interval at a network frequency of 50 Hz, 34.6 Mbytes /
(day * measurement channel)
10-period average values
200-ms interval at a network frequency of 50 Hz, 1.73 Mbytes /
(day * measurement channel)
150-period average values
3-second interval at a network frequency of 50 Hz, 115 Kbytes /
(day * measurement channel)
10-second average values
34.6 kByte / (day * measurement channel), frequency only
10-minute average values
10-minute limit interval e.g. 8:30:00, 8:40:00...,
576 bytes / (day * measurement channel)
2-hour average values
2-hour limit interval e.g. 8:00:00, 10:00:00...,
48 bytes / (day * measurement channel)
Daily values
1-day interval, max. 4 bytes / (day * measurement channel)
8.3 Events
General features
Identifier: indicates type,
Time stamp: the time event was triggered,
Event value: dependent on type of event (see below).
Interval events:
Interval events are triggered at the end of a 10-minute / 2-hour interval if an
event continuously exceeds the limit value. They are re-triggered each time
the interval elapses if the event persists.
Event value = measurement value when comparing limit values.
Start / stop events:
Start and stop events are created at the beginning and end of a limit value violation respectively, and at the end of a measuring period if it lasts
<10 minutes. They are not repeated during a continuous limit value violation.
Event value (start event) = measurement value when comparing limit values.
Limit value (stop event) = extreme value since start event, i.e.
maximum value for the maximum limit value,
minimum value for the minimum limit value.
PQI-DA Operating Manual
49
Page 50

Measurement value
Threshold
t
Events
Start
Stop
Event duration
Minimum
t
Average value
Threshold
t
Events
t
Interval time
18:29:59:999
18:39:59:999
18:49:59:999
18:59:59:999
19:09:59:999
19:29:59:999
19:19:59:999
Measurement value
a-eberle
PQI-DA
8.3.1 Start / Stop Events
8.3.2 Interval Events
PQI-DA Operating Manual
50
Page 51

Day
n
n+1
7 or 365 days
m
m+1
Start day m
End day m
7 or 365 days
Start day m+1
End day m+1
Event U12
Event U23
Event U31
Network event
1
0
1
0
1
0
1
0
a-eberle
PQI-DA
8.3.3 Linking Events
Phase events mode : Recording events U12, U23, U
Network events mode : Recording events U12, U
8.4 Relative Frequency
Start / stop events:
Relative frequency = Total event length / total measurement time
Interval events:
Relative frequency = Number of event intervals / number of measurement
intervals
8.4.1 Displaying the Week and Year Values
31
23
PQI-DA Operating Manual
51
Page 52

a-eberle
PQI-DA
8.5 Availability
Feature: Interruption to the supply
Events: Start / stop
Measurement quantities: Half-period r.m.s. voltage values
Parameters:
Threshold (EN 50160) = 0.01*UC, Default value = 0.4*UC
Maximum length of short interruption to the supply (EN 50160) = 180 s
Default value = 180 s
Statistical quantities: Number and duration
Short interruptions to the supply
Number per day, week and year
Integration over days, weeks and years
Long interruptions to the supply
Number per day, week and year
Integration over days, weeks and years
Reference value for number per year according to EN 51060:
Short interruption to supply: “tens to several hundred”,
default value = 30
Long interruption to supply: “from fewer than 10 to up to 50”,
default value = 10
8.6 Adherence to the Specified Supply Voltage Range
Feature: slow voltage change
Event: 10 -minute interval, range exceeded
Measurement quantities: 10 min. average values of the r.m.s. voltage
Parameters:
Thresholds (EN 50160) = (1 ± 0.1)*UC
Default value of lower threshold: 0.9*UC
Default value of upper threshold: 1.5*UC
Statistical quantities:
Number per day, week and year
Max. relative frequency per week
according to EN 50160: 5%
Default value: 5%
PQI-DA Operating Manual
52
Page 53

a-eberle
PQI-DA
Feature: Voltage dip
Events: Start / stop
Measurement quantities: Half-period r.m.s. voltage values
Parameters:
Statistical quantities: Number and duration
Reference value for number per year according to EN 51060:
Feature: Fast voltage change
Note: The definition of a fast voltage change specified in EN 50160
Threshold (EN 50160) = 0.04..0.9*UC, Default value = 0.9*UC
Number per day, week and year
Integration over days, weeks and years
“tens to 1000” default value = 100
does not serve as the measurement principle for actual implementation.
In the PQI-D, EN 50160 is replaced by voltage dip and voltage swell
(IEC 61000-4-30) .
Events: Start / stop
Measurement quantities: Half-period r.m.s. voltage values
Parameters:
Thresholds (EN 50160) = ± 0,04..0.06)*UC
Default threshold for the voltage dip = 0.94*UC
Default threshold for the voltage swell = 1.06*UC
Statistical quantities: Number and duration
Number per day, week and year
Integration over days, weeks and years
Reference value for number per day according to EN 51060:
“several possible under certain conditions”, default setting = 10
Number per year: Default value = 3650
Feature: Intermittent overvoltage at the network frequency
between the outer conductor and earth
Events: Start / stop
Measurement quantities: Half-period r.m.s. voltage values
Parameters: Threshold (EN 50160) = 1.7..0.2*UC, Default value = 1.7*UC
Statistical quantities: Number and duration
Number per day, week and year
Integration over days, weeks and years
Reference value for number per year according to EN 51060: None
Default value = 10
PQI-DA Operating Manual
53
Page 54

a-eberle
PQI-DA
8.7 Asymmetry
Feature: Asymmetrical voltage
Event: 10-minute interval, range exceeded
Measurement quantities: 10-minute average values of the
asymmetrical r.m.s. voltage
Parameters:
Threshold (EN 50160) = 2..3%
Default value: 2%
Statistical quantities:
Number per day, week and year
Max. relative frequency in each week according to EN 50160: 5%
Default value: 5%
8.8 Harmonics
Feature: Harmonic voltages, THD
Event: 10-minute interval, at least one harmonic voltage
or the THD is exceeded.
Measurement quantities: 10-minute average values of the harmonic
voltages (r.m.s.), THD
Parameters:
Thresholds (EN 50160) = Harmonic : see Table 2 in EN 50160
THD: 8%
Default value: according to EN 50160
Statistical quantities:
Number per day, week and year
Max. relative frequency in each week according to EN 50160: 5%
Default value: 5%
8.9 Flicker
Feature: Flicker
Event: 2-hour interval, range exceeded
Measurement quantities: Long-term flicker magnitude Plt (2-hour average
value)
Parameters:
Thresholds (EN 50160) = 1.0
Default value: 1.0
Statistical quantities:
Number per day, week and year
Max. relative frequency per week according to EN 50160: 5%
Default value: 5%
PQI-DA Operating Manual
54
Page 55

a-eberle
PQI-DA
8.10 Frequency, Narrow Range
Feature: Network frequency
Events: Start / stop
Measurement quantities: 10-second average value
Parameters:
Thresholds (EN 50160, synchronised connection to the integrated network)
= 50 Hz ± 0.5 Hz.
Default value of lower threshold: = 49.5 Hz
Default value of upper threshold: 50.5 Hz
Statistical quantities: Number and duration
Number per day, week and year
Integration over days, weeks and years
Reference value for relative frequency per year according to
EN 51060: 0.5%
Default value: 0.5%
8.11 Frequency, Wide Range
Feature: Network frequency
Events: Start / stop
Measurement quantities: 10-second average value
Parameters:
Thresholds (EN 50160), synchronised connection to the integrated
network = 47 Hz, 52 Hz.
Default value of lower threshold: = 47.0 Hz
Default value of upper threshold: 52.0 Hz
Statistical quantities: Number and duration
Number per day, week and year
Integration over days, weeks and years
Reference value for relative frequency according to EN 51060: 0%
Default value: 0%
PQI-DA Operating Manual
55
Page 56

Input 1
Input 2
Input 16
On
Parameter index
0
1
2
16
Recording on/off
Individual release
Measurement data
Recording
Data classes
a-eberle
PQI-DA
8.12 Controls for Recording Measurement Data
8.13 Interval Status Word
Each interval sampling point contains a status word with the maximum interference
level for the interval.
Status parameters
Transient interference level U1N, line 1
Transient interference level U2N, line 1
Transient interference level U3N, line 1
Transient interference level U12, line 1
Transient interference level U23, line 1
Transient interference level U31, line 1
Synchronisation status
Status of the measurement range limiting
Transient interference level U1N, line 2
Transient interference level U2N, line 2
Transient interference level U3N, line 2
Transient interference level U12, line 2
Transient interference level U23, line 2
Transient interference level U31, line 2
PQI-DA Operating Manual
56
Page 57

Input 1
Input 2
Input 16
Reg-L
Parameter index
0
1
2
16
Event evaluation on/off
Recording 1
Transformer config. 1
Event 1
Evaluation 1 : on/off
Mode 1 : network events/all
Evaluation 1
Filter 1
Transformer config. 2
Event 2
Evaluation 2 : on/off
Mode 2 : network events/all
Evaluation 2
Filter 2
Recording 2
Note: Elements for line 2 are only available for
a PQI-D with 8 voltage inputs
a-eberle
PQI-DA
8.14 Controls for the Event Evaluation
8.15 Event Filtering
PQI-DA Operating Manual
57
Page 58

Recorder 1 trigger
Recorder 2 trigger
Eval. 1 on/off
Eval. 2 on/off
Trigger 1
Trigger 2
Event 1
Event 2
Note: Elements for line 2 and the cross-coupling are only
available for a PQI-D with 8 voltage inputs
a-eberle
PQI-DA
8.16 Suppressing Interval Events
The interval events are discarded if the largest transient (of the corresponding
measurement quantity) that occurs in an interval is larger than the specified limit
value.
For level 3, the results the interval events are always retained, regardless of transient faults.
All PQI events are discarded if a synchronisation fault occurs or the measurement
range is exceeded.
Level Transient fault
0 None
1 Dip, swell
2 Voltage dip, transient overvoltage
3 Voltage interruption
8.17 Triggering of Fault Recorders A and B
Recorders A and B have several individual trigger thresholds.
Upper and lower trigger limits are related to the agreed voltage.
The individual trigger thresholds are for conductor-earth and conductor
conductor voltages.
The trigger threshold for the neutral earth voltage is the same for both
recorder A and recorder B.
The trigger thresholds can be enabled or disabled for each voltage.
Current threshold values and phase jumps can also be used as triggers.
8.18 Triggering of Fault Recorders A, B and C
PQI-DA Operating Manual
58
Page 59

Recorder-buffer
Operating mode: linear
(NV-RAM)
Background memory
(RAM)
Data
Fill level
Data
Buffer-Reset
COM
Read procedure
4 MB
48 MB
Before the event
After the event
Recording length
Pre-trigger time
Retrigger window
Threshold
Pre-trigger time
Fault record trigger
Fault record sequence
0 M K N-1 Recording point n
N = number of recording points
Trigger point M = index of the first recording point after the triggering, where 0 < M < N-1
Retrigger point K = index of the first recording point that can trigger a follow-up fault record,
where M < K < N-1
a-eberle
PQI-DA
8.19 Parameterising the Fault Record
8.19.1 Fault Record Sequences
Fault record sequences consist of a trigger fault record and
one or more follow-up fault records if required.
The fault records within a sequence are seamless and do not overlap.
Trigger fault records can be re-triggered within the time period between
the re-trigger point and the pre-trigger time.
Follow-up fault records can be re-triggered within the time period
between the end of the fault record and the pre-trigger time.
Trigger fault records contain a trigger time and a trigger event.
8.20 Background Memory Recorders A and B
PQI-DA Operating Manual
59
Page 60

a-eberle
PQI-DA
8.21 Supply Quality Signals
Frequency change of narrow tolerance, line 1 (, line 2)
Frequency change of wide tolerance, line 1 (, line 2)
Intermittent overvoltage at the network frequency, line 1 (, line 2)
Fast voltage change, line 1 (, line 2)
Voltage dip, line 1 (, line 2)
Short interruption to the voltage, line 1 (, line 2)
Long interruption to the voltage, line 1 (, line 2)
Slow voltage deviation (10 minutes), line 1 (, line 2)
Harmonic distortion exceeded (10 minutes), line 1 (, line 2)
Voltage symmetry exceeded (10 minutes), line 1 (, line 2)
PST exceeded (10 minutes), line 1 (, line 2)
PLT exceeded (2 hours), line 1 (, line 2)
Narrow tolerance range too frequently exceeded by the frequency
[week], line 1 (, line 2)
Narrow tolerance range too frequently exceeded by the frequency
[year], line 1 (, line 2)
Maximum number of intermittent overvoltages at the network frequency
exceeded [year], line 1 (, line 2)
Maximum number of fast voltage changes exceeded [day], line 1 (, line 2)
Maximum number of fast voltage changes exceeded [year], line 1 (, line 2)
Maximum number of voltage dips exceeded [year] , line 1 (, line 2)
Maximum number of short supply interruptions exceeded
[year], line 1 (, line 2)
Maximum number of long supply interruptions exceeded
[year], line 1 (, line 2)
Range exceeded too frequently by slow voltage changes
[week], line 1 (, line 2)
Range exceeded too frequently by harmonic distortions
[week], line 1 (, line 2)
Range exceeded too frequently by asymmetrical voltage
[week], line 1 (, line 2)
Range exceeded too frequently by flicker [week], line 1 (, line 2)
PQI-DA Operating Manual
60
Page 61

? 1
Signal 1
Signal 2
Signal 32
In
Out
Operation
mode
Reg-L
Delay time
Output status (1)
Output status (0)
1
0
Output status
LED, relay
Status of the logic gate
Signal
Satus of the logic gate for operating mode
0
REG-L
1
T
h
T
h
2
T
h
T
h
3
T
h
T
h
a-eberle
PQI-DA
8.22 Parameterising the Signal Output
8.23 Signal Output Operating Modes
PQI-DA Operating Manual
61
Page 62

i
1
i
2
i
3
Energiequelle
Generator, Transformator
u
1N
Z
3
Z
2
Z
1
R
1
u
10
E
N
R2R
3
u20u
30
u
NE
u
12
u
31
u
23
Energiewandlung
Verbraucherschaltung
u
2N
u
3N
N"
u1Eu2Eu
3E
0
1
2
3
Z
E
a-eberle
PQI-DA
9. Definition of the Measurement Quantities
A three-phase current contains several different measurement quantities which in
the past were indicated by different designations and/or indices.
This is particularly clear in the designation of the neutral earth voltage which,
depending on mood and operating version, was referred to as En voltage, Uo
voltage, Uv voltage or even as E or N voltage. Therefore, Figure 17 is shown below
at the beginning of the explanation of the measurement quantities to ensure an
unambiguous and consistent terminology.
It illustrates the basic quantities for measurements in three-phase current systems. The designations are based upon the terminology specified in DIN 40110-2
“Quantities used in alternating current theory - Part 2: Multi-line circuits”.
Figure 17:
PQI-DA Operating Manual
62
Page 63

msT
SN
200=
20482
11
= = M
S
S
T
M
f =
Hzf
SN
10240=
a-eberle
PQI-DA
9.1 Sampling, Synchronisation
The sampling frequency is generated via synchronisation with one of the 3 input
voltage frequencies (reference channel). The synchronisation cycle spans 10 periods for 50 Hz networks and 12 periods for 60 Hz networks. Thus the nominal
cycle time is:
The synchronisation frequency can fluctuate by up to ± 10% of the nominal value
(i.e. 45 Hz ... 55 Hz and 54 Hz ... 66 Hz respectively).
All input signals are sampled simultaneously. The number of samples per input
signal (current, voltage) and synchronisation cycle is:
Thus, for a cycle time TS, the sampling frequency is
The nominal sampling frequency for the corresponding frequency of the nominal
cycle time is therefore:
Sampling Frequency Synchronisation
Signal processing is always based on a fixed number of sampling values, which
in turn depend on the type of measurement quantity to be calculated. The length
of the associated measurement interval must correspond to a whole number of
periods of the present network frequency in order to prevent beats occurring in the
measurement quantities (“leakage effect”). To achieve this, the sampling frequency
constantly tracks the network frequency so that they have a fixed relationship. The
reference quantity for this is the frequency of the voltage at the reference voltage
input. If the reference input voltage is interrupted for < 10 s, the last valid sampling
frequency is used. The nominal value is used if the interruption lasts for > 10 s.
The A/D transformer has a 24 bit resolution, including the (plus-minus) signs.
The r.m.s. width of the measurement band is 2.5 kHz.
PQI-DA Operating Manual
63
Page 64

( ) ( ) ( ) ( ) ( ) ( ) ( )
( ) ( ) ( ) ( ) ( ) ( ) ( )
( ) ( ) ( ) ( ) ( ) ( ) ( )
)(
)(
)(
2312131331
1231323223
312321211 2
nununununununu
nununununununu
nununununununu
NNEE
NNEE
NNEE
+ − = − = − =
+ − = − = − =
+ − = − = − =
( )
( ) ( ) ( )
3
321
nununu
nu
EEE
NE
+ +
=
( )
( )
( )
3
)()(2
3
)()(2
3
)()(
3
)()(2
3
)()(2
3
)()(
3
)()(2
3
)()(2
3
)()(
122312312331
3
311 231231223
2
233123123112
1
nunununununu
nu
nunununununu
nu
nunununununu
nu
N
N
N
+ ⋅
− =
+ ⋅
=
−
=
+ ⋅
− =
+ ⋅
=
−
=
+ ⋅
− =
+ ⋅
=
−
=
( ) ( ) ( )
( ) ( ) ( )
( ) ( ) ( )
nununu
nununu
nununu
NENE
NENE
NENE
+ =
+ =
+ =
33
22
11
a-eberle
PQI-DA
9.2. Primary Sampling Values
9.2.1 Deduced Sampling Values
9.2.1.1 External conductor voltages
9.2.1.2 Neutral earth voltage
9.2.1.3 Phase voltages towards the virtual phase point
u10(n), u20(n), u30(n) are mapped onto u1E(n), u2E(n), u3E(n)
in a three-phase system
9.2.1.4 Outer conductor to earth voltages
PQI-DA Operating Manual
64
Page 65

( ) ( ) ( )
( ) ( ) ( )
( ) ( ) ( )
nununu
nununu
nununu
NEEN
NEEN
NEEN
− =
− =
− =
33
22
11
( ) ( ) ( ) ( )
)(
32/1
nininini
N
+ − =
Σ
( ) ( ) ( ) ( )
)(
13/2
nininini
N
+ − =
Σ
( ) ( ) ( ) ( )
)(
21/3
nininini
N
+ − =
Σ
( ) ( ) ( ) ( )
nininini
N 321/
+ + =
Σ
( ) ( )
ninunp
N 111
)( ⋅ =
( ) ( )
ninunp
N 222
)( ⋅ =
( ) ( )
ninunp
N 333
)( ⋅ =
a-eberle
PQI-DA
9.2.1.5 Outer conductor to phase point voltages
9.2.1.6 Linked conductor currents in a three-phase system
9.2.1.7 Sum current, neutral conductor current
The value i
iN(n) in a four-phase system and
in a three-phase system iΣ(n)
(n) represents
Σ/N
9.2.1.8 Active power of the phase
PQI-DA Operating Manual
65
Page 66

max
min
max
min
2
)2/(
n
nn
n
n
nn
n
Trms
w
nuw
U
2
)(
2
)2/(
2
1
)2/1(
nU
U
Trms
n
rms
∑
=
=
a-eberle
PQI-DA
9.2.2 R.M.S. Voltage Values
The sampling values of all the voltages are recorded continuously and without
overlapping when calculating the r.m.s. (root mean square) value.
9.2.2.1 Half-period r.m.s. voltage values
The original signal is represented by a step function. The height of the step is the
present value of the ADC and the width of the step is the measurement interval.
First, the half-period r.m.s. voltage values are calculated for continuous, half-period-long, time slices. The sampling is not synchronised with the time slices and
this results in beats (flicker) occurring. This can be minimised by including the
corresponding weighting factors of the combined sampling values of consecutive
time slices in the calculation of both r.m.s. values. The resulting r.m.s. value is then
used as the input value for the flicker algorithm.
This results in 512 (256) sampling points or 5 (3) r.m.s. values per period for 50
Hz (60 Hz) networks.
The average of two consecutive r.m.s. values that is calculated every half-period
is known as the average half-period r.m.s. value.
It is used as a trigger quantity for start / stop events and is also a quantity stored
by recorder B.
It is calculated as follows:
For transformer configurations 3..5, the calculated sampling values are applied to
PQI-DA Operating Manual
the virtual neutral point to calculate the r.m.s. phase voltages.
66
Page 67

mab
UU ⋅ =
2048
)(
2048
1
2
12/10
∑
=
−
=
n
rms
nu
U
( )
15
15
1
2
12/10
180/150
∑
=
−
−
=
n
rms
rms
nU
U
a-eberle
PQI-DA
For transformer configurations 6..11, the unavailable voltages Uab are replaced
with the value of the measured voltage Um, after a correction factor α (see Table
5) has been applied to it.
9.2.2.2 10/12-period r.m.s. voltage values
R.m.s. values > 1.5 Un and < 0.5 Un are highlighted.
For transformer configurations 3..5, the calculated sampling values are applied to
the virtual neutral point to calculate the r.m.s. phase voltages.
For transformer configurations 6..11, the unavailable voltages Uab are replaced
with the value of the measured voltage Um, after a correction factor α (see Table 5)
has been applied to it.
9.2.2.3 150/180-period r.m.s voltage values
The 150/180-period r.m.s. values are each calculated from 15 consecutive
10/12-period r.m.s. values. Each 10/12-period r.m.s. value is included exactly
once in a 150/180-period r.m.s. value calculation.
If more than 7 of the 15 10/12-period r.m.s. values are highlighted or are not
available, the corresponding 150/180-period r.m.s. value is also highlighted.
PQI-DA Operating Manual
67
Page 68

( )
N
nU
U
N
n
rms
rms
∑
=
−
−
=
1
2
180/150
min10
( )
12
12
1
2
min10
2
∑
=
−
−
=
n
rms
hrms
nU
U
2048
)(
2048
1
2
12/10
∑
=
−
=
n
rms
ni
I
a-eberle
PQI-DA
9.2.2.4 10-minute r.m.s. voltage values
The 10-minute r.m.s. values are calculated from the N 150/180-period r.m.s. values
that occur in every 10-minute interval. The 10-minute limits of the system time
are calculated simultaneously, and each 150/180-period r.m.s. value is included
exactly once in a 10-minute r.m.s. value.
N can deviate from the nominal value of 200 since the 150/180-period r.m.s values and the 10-minute time period are not synchronised. If more than half the
150/180-period r.m.s. values in a 10-minute time interval are highlighted or not
available, the corresponding 10-minute r.m.s value is also highlighted.
9.2.2.5 2-hour r.m.s. voltage values
The 2-hour r.m.s. values are calculated from the twelve 10-minute r.m.s. values
that occur in every 2-hour interval. The 2-hour limits of the system time are calculated simultaneously, and each 10-minute r.m.s. value is included exactly once
in a 2-hour r.m.s. value.
If more than 5 of the twelve 10-minute r.m.s. values in a 2-hour time interval are
highlighted or not available, the corresponding 2-hour r.m.s value is also highlighted.
9.2.3 R.M.S. Current Values
The sampling values of all the currents are recorded continuously and without
overlapping when calculating the r.m.s. value.
9.2.3.1 10/12-period r.m.s. current values
PQI-DA Operating Manual
68
Page 69

( )
15
15
1
2
12/10
180/150
∑
=
−
−
=
n
rms
rms
nI
I
( )
N
nI
I
N
n
rms
rms
∑
=
−
−
=
1
2
180/150
min10
( )
12
12
1
2
min10
2
∑
=
−
−
=
n
rms
hrms
nI
I
a-eberle
PQI-DA
For current transformer combinations 8..10, the value of the measured phase is
applied in place of the phase currents of the unavailable conductor.
9.2.3.2 150/180-period r.m.s. current values
The 150/180-period r.m.s. values are each calculated from 15 consecutive 10/12period r.m.s. values. The 10/12-period r.m.s. value is given by
9.2.3.3 10-minute r.m.s. current values
The 10-minute r.m.s. values are calculated from the N 150/180-period r.m.s. values
that occur in every 10-minute interval. The 10-minute limits of the system time
are calculated simultaneously, and each 150/180-period r.m.s. value is included
exactly once in a 10-minute r.m.s. value.
N can deviate from the nominal value of 200 since the 150/180-period r.m.s values
and the 10-minute time period are not synchronised.
9.2.3.4 2-hour r.m.s. current values
The 2-hour r.m.s. values are calculated from the twelve 10-minute r.m.s. values
that occur in every 2-hour interval. The 2-hour limits of the system time are calculated simultaneously, and each 10-minute r.m.s. value is included exactly once
in a 2-hour r.m.s. value.
PQI-DA Operating Manual
69
Page 70

( )
2048
2048
1
12/10
∑
= = n
nx
X
( )
15
15
1
20/10
180/150
∑
= = n
nX
X
( )
N
nX
X
N
n
∑
= = 1
180/150
min10
a-eberle
PQI-DA
9.2.4 Linear Average Values
The calculation of the linear average takes place in the same time frame as the
quadratic average value (= r.m.s. value) and can be applied to various measurement quantities (see below).
9.2.4.1 10/12-period average values
9.2.4.2 150/180-period average values
The 150/180-period average values are each calculated from 15 consecutive
10/12-period average values, and each 10/12-period average value is included
exactly once in a 150/180-period average value.
9.2.4.3 10-minute average values
The 10-minute average values are calculated from the N 150/180-period average
values that occur in every 10-minute interval. The 10-minute limits of the system
time are calculated simultaneously, and each 150/180-period average value is
included exactly once in a 10-minute average value.
N can deviate from the nominal value of 200 since the 150/180-period average
values and the 10-minute time period are not synchronised.
PQI-DA Operating Manual
70
Page 71

( )
12
12
1
mi n10
2
∑
= = n
h
nX
X
T
N
f
s= 10
a-eberle
PQI-DA
9.2.4.4 2-hour average values
The 2-hour average values are calculated from the twelve 10-minute average values that occur in every 2-hour interval. The 2-hour limits of the system time are
calculated simultaneously, and each 10-minute average value is included exactly
once in a 2-hour average value.
9.2.5 Network Frequency
The network frequency is calculated from the duration T of a whole number of
periods N within a maximum of 10 seconds, using
The 10-minute and 2-hour values of the network frequency are calculated as
linear average values.
9.2.6 Spectral Analysis
Please also refer to: EN 61000-4-30:2008
The direct Fourier transform (DFT) spectra of all the phase voltages and input
currents are calculated from the 2048 sampling values of each input quantity as
10/12-period values per fast Fourier transform (FFT) algorithm. The spectra of the
linked quantities are calculated from the spectra of the measured quantities.
The spectral r.m.s. values for measurement quantities which have to be deduced
(since they are not otherwise available) are treated in the same way as the r.m.s.
values calculated directly from the sampling values.
The imaginary components of the discrete spectrum are contained in the frequencies
PQI-DA Operating Manual
71
Page 72

S
k
T
k
f =
Nnk ⋅ =
{ }
( )
⋅
⋅ ⋅ ⋅ =
∑
=
1024
sin
1024
1
Re
2047
0
mk
mxC
m
k
π
{ }
( )
⋅
⋅ ⋅ ⋅ =
∑
=
1024
cos
1024
1
Im
2047
0
mk
mxC
m
k
π
{ }
{ }
kkn
CCC
22
12/10
ImRe + =
−
( ) ( )
( )
( ) ( ) ( )
2
2
2
2
2
2
2
2
1
211
kkkk
bbaaA Ω ⋅ + Ω ⋅ ⋅ − + ⋅ Ω ⋅ + = Ω
a-eberle
PQI-DA
where k = 0, 1,....1023
The nth order harmonic represents the spectral component with index
where N = number of sampled periods per synchronisation period (10 or 12).
The spectral values are separated by 5 Hz at the nominal value of the network
frequency. The imaginary DFT spectral components Ck are defined by
9.2.6.1 Complex harmonics
Absolute value of the complex harmonics n
with k = n · N
The analogue frequency responses of the measurement channels are compensated using the correction factor tables.
The correction factors are calculated using
and
PQI-DA Operating Manual
72
Page 73

c
k
k
f
f
= Ω
( )
{ }
{ }
=
−
k
k
n
C
C
Carc
Re
Im
arctan
12/10
{ }
0Re >
k
Cfür
( )
{ }
{ }
π
+
=
−
k
k
n
C
C
Carc
Re
Im
arctan
12/10
{ }
0Re <
k
Cfür
( ) { }
)Im(
2
12/10 kn
CSgnCarc ⋅ =
−
π
{ }
0Re =
k
Cfür
UCTVSIGC
sig
⋅ =
:
sigrms
CC ≥
( ) ( )
12/10112/10112/101 − − −
− = CrefarcCarcϕ
:
sigrms
CC <
0
12/101= −
ϕ
a-eberle
PQI-DA
where
fc = limit frequency
a1, a2, b2 = filter coefficients
Phase of the complex harmonics n (with respect to reference value)
where k = n · N
9.2.6.2 Phase difference between the reference voltge and the measurement voltage (basic frequency)
The phase difference between the measurement voltages and the reference voltage
is calculated from the phase angle of the 10/12-period fundamental waves, when
the r.m.s. values exceed the corresponding significance threshold C
sig
.
The 150/180-period,10-minute and 2-hour values are calculated as linear average
values.
PQI-DA Operating Manual
73
Page 74

{ } { } { } { }
)ImImReRe(
nLnLNnLnLNnL
IUIUSgnFD
− − − − −
⋅ + ⋅ =
∑
+ ⋅
− ⋅ =
−
=
1
1
2
12/10
Nn
Nnk
kn
CC
∑
− ⋅ +
+ ⋅ =
− +
=
1)1(
1
2
12/105.0
Nn
Nnk
kn
CC
a-eberle
PQI-DA
9.2.6.3 Direction of the power flow of the harmonics
U
= complex harmonic n of the phase voltage and I
LN-n
of the conductor current (10/12-period values).
9.2.6.4 R.m.s. values of the harmonics
The two immediately neighbouring spectral components are also included in the
calculation of the r.m.s. value of a harmonic:
= complex harmonic n
L-n
The harmonics with n=1..50 are calculated.
The 150/180-period, 10-minute and 2-hour values of the harmonics are also
defined as r.m.s. values.
9.2.6.5 R.m.s. values of the interharmonics
All the nonharmonic spectral components between order n and n+1 are grouped
under interharmonics of order “n+0.5”.
The interharmonics between 0+0.5..49+0.5 are calculated, and the 150/180period, 10-minute and 2-hour values of the harmonics are also defined as r.m.s.
values.
9.2.6.6 R.m.s. values of all the harmonics
The harmonic distortion is calculated for the phase voltages, delta voltages and
input currents using the 10/12-period values and the corresponding r.m.s. values
of the fundamental wave.
PQI-DA Operating Manual
74
Page 75

∑
=
− −
=
40
2
2
12/1012/10
n
ndis
CX
:
min112/101 − −
≥ CC
12/101
12/10
12/10
−
−
=
C
X
THD
dis
:
min112/101 − −
< CC
0
12/10
= THD
:
min12/10 − −
≥
LL
SS
( ) ( )
12/10112/10112/10 − − − − −
− =
LLNL
IarcUarc
ϕ
:
min12/10 − −
<
LL
SS
0
12/10= − L
ϕ
a-eberle
PQI-DA
The 150/180-period, 10-minute and 2-hour values are calculated as r.m.s.
values.
9.2.6.7 Total Harmonic Distortion THD
The 10/12-period values of the harmonics with n = 2..40, and the corresponding
r.m.s. values of the fundamental wave are used to calculate the harmonic distortion
for the phase voltages, delta voltages and input currents.
The 150/180-period, 10-minute and 2-hour values are calculated as r.m.s.
values.
9.2.6.8 Phase difference between the voltage and the current (basic frequency)
Asymmetrical networks
with
L Index of the conductor
U
LN-1-10/12
I
L-1-10/12
Complex fundamental wave of the phase voltage
Complex fundamental wave of the conductor current
Symmetrical networks with a phase voltage and current of the same conductor:
The value of the measured phase (see above) is also applied to the other two
phases.
Symmetrical networks whose voltage and current have different phases:
A correction angle is subtracted from the phase difference that is measured
PQI-DA Operating Manual
75
Page 76

:
min12/10 − −
≥
LL
SS
( ) ( )
ϕϕ
− − =
− − − 12/10112/10112/101
IarcUarc
:
min12/10 − −
<
LL
SS
0
12/101= −
ϕ
{ } { } { } { } ( )
11131113
ImReReIm
− − − −
⋅ − ⋅ =
NNNN
UUUUSgnrot
a-eberle
PQI-DA
between the voltage and the current (see Table 1).
The value of the measured phase is also assigned to the other two phases
(see above).
Table 1 : Correction angle φ
I
U
U
U
U
U
U
U
The 150/180-period, 10-minute and 2-hour values are calculated as linear
average values.
1-10/12
1-10/12
1E
2E
3E
12
23
31
(0°) 120° -120°
-120° (0°) 120°
120° -120° (0°)
30° 150° -90°
-90° 30° 150°
150° -90° 30°
9.2.6.9 Direction of the rotating field
Voltage transformer configurations 1..4 :
I
1
I
2
I
3
red = +1 : Direction of the rotating field = 123
red = -1 : Direction of the rotating field = 321
U
= complex fundamental wave of the phase voltage (10/12-period values)
LN-1
Voltage transformer configurations 6..11 :
red = 0 : Direction of the rotating field cannot be measured
PQI-DA Operating Manual
76
Page 77

2048
)(
2048
1
12/10
∑
=
−
=
n
L
L
np
P
12/10312/10212/10112/10 − − −
+ + = PPPP
12/1012/10312/10212/101 − − − −
= = =
n
PPPP
12/10312/10212/10112/10 − − −
+ + = PPPP
)cos(
12/10112/1012/10 −
⋅ =
ϕ
SP
11.2.9.:
12/10
sS
7.6.2.9.:
12/101s−
ϕ
a-eberle
PQI-DA
9.2.7 Active Powers
Asymmetrical networks:
The 10/12-period values of the active power of the phase are calculated from the
sampling values of a synchronisation cycle using
where L = phase index
The 10/12-period values of the active power of the network are defined using
Symmetrical network with a phase voltage and a phase current of the same conductor Ln:
The measured active power Pn (see above) of phase Ln is also applied to the two
unavailable phases.
The active power of the network corresponds to the sum of the active powers of
the phases.
Symmetrical networks whose voltage and current have different phases:
The active power of the network is calculated from the apparent network power
using
where
1/3 of the active power of the network is assigned to each of the active powers
of the phases:
PQI-DA Operating Manual
77
Page 78

3
12/10
12/10312/10212/101
P
PPP = = =
− − −
∑
=
⋅ =
m
n
SSmL
nTnPttW
0
0
)()(),(
),(),(),(),(
0302010 mmmm
ttWttWttWttW + + =
( ) ( )
nPnP
LS 12/10−
=
( ) ( )
nPnP
LS 12/10−
=
0)(:
12/10≥ −
nPfür
L
0)( = nP
S
0)(:
12/10< −
nPfür
L
( ) ( )
nPnP
LS 12/10−
− =
0)(:
12/10< −
nPfür
L
0)( = nP
S
0)(:
12/10≥ −
nPfür
L
∑
=
⋅ =
m
n
SSmL
nTnQttWr
0
0
)()(),(
a-eberle
PQI-DA
The 150/180-period, 10-minute and 2-hour values are calculated as linear average values.
9.2.8 Active Energies
The sum of the 10/12-period values of the active power multiplied by the corresponding synchronisation cycle time is calculated. This represents the active
energies within a time interval defined by t0 (reset time point) and tm (measurement
point) and is described using
for the active energies of the phases. For the active energy of the network this
is
for the total active energy it is
for the supplied active energies it is
and for the drawn active energies it is
9.2.9 Reactive Energies
The sum of the 10/12-period values of the reactive power multiplied by the corresponding synchronisation cycle time is calculated. This represents the reactive
energies within a time interval defined by t0 (reset time point) and tm (measurement
point) and is described using
PQI-DA Operating Manual
78
Page 79

),(),(),(),(
0302010 mmmm
ttWrttWrttWrttWr + + =
( ) ( )
nQnQ
LS 12/10−
=
( ) ( )
nQnQ
LS 12/10−
=
0)(:
12/10≥ −
nPfür
L
0)( = nQ
S
0)(:
12/10< −
nPfür
L
( ) ( )
nQnQ
LS 12/10−
=
0)(:
12/10< −
nPfür
L
0)( = nQ
S
0)(:
12/10≥ −
nPfür
L
mn
mLnL
LI
tt
ttWttW
P
−
−
=
),(),(
00
mn
mn
I
tt
ttWttW
P
−
−
=
),(),(
00
a-eberle
PQI-DA
for the reactive energies of the phases. For the reactive energy of the network
this is
for the total reactive energy it is
for the supplied reactive energies it is
and for the drawn reactive energies it is:
9.2.10 Interval Average Values of the Active Powers
The average values of the active powers are calculated using any externally defined time interval. The interval limits tm and tn can be specified using an external
synchronisation signal using either software or hardware. When the synchronisation signal is detected the average value for the interval that has just ended is
calculated.
Active power of the phase:
Active power of the network:
PQI-DA Operating Manual
79
Page 80

3
)(
12/10312/10212/101
12/1012/10
− − −
−
+ +
⋅ =
rmsrmsrms
MS
III
PSgnI
12/1012/1012/10 − − −
⋅ =
LrmsLNrmsL
IUS
∑ ∑
⋅ = IUS
12/10
( )
2
12/103
2
12/102
2
12/101
2
12/1031
2
12/1023
2
12/1012
4
1
− − − − − − ∑
+ + + + + ⋅ =
NrmsNrmsNrmsrmsrmsrms
UUUUUUU
2
12/10
2
12/103
2
12/102
2
12/101 − − − − ∑
+ + + =
Nrmsrmsrmsrms
IIIII
( )
2
12/1031
2
12/1023
2
12/1012
3
1
− − − ∑
+ + ⋅ =
rmsrmsrms
UUUU
2
12/103
2
12/102
2
12/101 − − − ∑
+ + =
rmsrm srms
IIII
12/10− ∑
=
LLrms
UU
12/103− ∑
⋅ =
Lrms
II
a-eberle
PQI-DA
9.2.11 Average Value of the Conductor Currents with the Sign of the Active Power of the Network
The arithmetic mean is calculated from the 10/12-period r.m.s. values of the conductor currents using
The 150/180-period, 10-minute and 2-hour values are calculated from the corresponding current values.
9.2.12 Apparent Powers
Apparent powers of the phase:
Collective apparent power as specified in DIN40110 :
Asymmetrical 4-phase networks:
Asymmetrical 3-phase networks:
Symmetrical network:
The 150/180-period, 10-minute and 2-hour values are calculated from the corresponding voltage and current values.
PQI-DA Operating Manual
80
Page 81

( )
2
12/10
2
12/1012/1012/10 − − − −
− ⋅ =
LLLL
PSSgnQ
ϕ
( )
2
12/10
2
12/1012/10112/10
PSSgnQ − ⋅ =
−
ϕ
:
min180/150 − −
≥
LL
SS
180/150
180/150
180/150
−
−
−
=
L
L
L
S
P
PF
:
min180/150 − −
<
LL
SS
1
180/150= − L
PF
:
min180/150
SS ≥
180/150
180/150
180/150
S
P
PF =
:
min180/150
SS <
1
180/150
= PF
:
min180/150 − −
≥
LL
SS
180/150
180/150
180/150
−
−
−
=
L
L
L
S
Q
QF
:
min180/150 − −
<
LL
SS
0
180/150= − L
QF
:
min180/150
SS ≥
180/150
180/150
180/150
S
Q
QF =
:
min180/150
SS <
0
180/150
= QF
a-eberle
PQI-DA
9.2.13 Reactive Powers
The 150/180-period, 10-minute and 2-hour values are calculated from the corresponding values of the active powers, apparent powers and the phase angles.
9.2.14 Active Factors
The 10-minute and 2-hour values are calculated from the corresponding values
for the active powers and apparent powers.
9.2.15 Reactive Factors
The 10-minute and 2-hour values are calculated from the corresponding values
for the reactive powers and apparent powers.
PQI-DA Operating Manual
81
Page 82

)1()()(
180/150180/150180/150180/150 − − − −
− ⋅ ⋅ =
LLLL
PFSgnPSgnY
ϕ
)1()()(
180/150180/1501180/150180/150
PFSgnPSgnY − ⋅ ⋅ =
−
ϕ
:
2
min1
2
131
2
123
2
112 − − − −
≥ + + CUUU
β
β
+
−
=
1
1
u
u
22
131
2
123
2
112
4
131
4
123
4
112
)(
63
− − −
− − −
+ +
+ +
⋅ − =
UUU
UUU
β
:
2
min1
2
131
2
123
2
112 − − − −
< + + CUUU
0=
u
u
0=
u
u
a-eberle
PQI-DA
9.2.16 Active Factor Display Function
The active factors between
0 (cap.) ... +1 ... 0 (ind.) and 0 (cap.) ... -1 ... 0 (ind.)
are mapped onto Y = -1 ... 0 ... +1 irrespective of what is drawn / supplied.
The 10-minute and 2-hour values are calculated from the corresponding values
of the active powers, active factors and the phase angles.
9.2.17 Flicker Magnitude
The short-term flicker magnitude Pst (10 minutes) and the long-term flicker magnitude Plt (2-hours) are calculated for the phase and delta voltages. Pst and Plt
are defined in EN 61000-4-15.
In symmetrical networks, the measured values are applied to the quantities that
are not available (see section 7.1.4).
9.2.18 Asymmetrical Voltage
Voltage transformer configurations 1..5:
10-minute average values can be formed for the fundamental wave r.m.s. values
of the delta voltages. These 10-minute average values are used to calculate the
voltage symmetry.
where
Voltage transformer configurations 6..11:
PQI-DA Operating Manual
82
Page 83

a-eberle
PQI-DA
10. Commissioning
10.1 Safety Information
Before you begin to use the device, you should be aware of some of the dangers
that may occur if the device is used improperly.
The device belongs to safety class I. Please connect the device’s protective
earth conductor to your system’s earthing system before the device is connected to a voltage supply.
The device may not be used to carry out measurements on circuits that contain
corona discharges.
The device must be removed from the network immediately if it is determined
that the device can no longer be operated safely due to a mechanical or electrical fault.
Please note: if the Power Quality Interface & Disturbance Recorder is installed
in a housing, the secondary circuits of the current transformer must be shortcircuited before the terminal connections of the current transformer are removed
from the device. Devices in 19” enclosures are protected against short circuits
via a device built in to the terminal block. The modules can be plugged in and
out at will without having to short circuit the current transformer(s) first.
Please note that there is a danger to life wherever a voltage with an amplitude
> 30 V r.m.s. is present.
10.2 Procedure
Preparation:
Please look at the nameplate and confirm that the supplied device conforms to
your requirements.
Is the voltage supply correct?
Information: Changes to the voltage supply range can only be carried out in
our factory.
Are the measurement quantities for the input current (1A/5A) of the applica-
tion correct?
Are the voltage and current connected correctly?
Check the connection using the phase powers. All the powers must have
the same sign (plus or minus). It should be a plus “+” if energy is being
drawn, and minus “-” if energy is being supplied.
If the polarities are not the same, the error is usually due to the current connections being incorrect.
Part of the WinPQ program is specifically designed for the parameterisation and
programming of the analogue outputs, binary inputs and the LEDs.
PQI-DA Operating Manual
83
Page 84

a-eberle
PQI-DA
11. Applications
11.1 Application-Specific Programming
Programs for specific tasks can either be written yourself using REG-L or can be
requested from our headquarters.
An example of an application-specific program is shown in section 2.3.
12. Updating the Firmware
The PQI-DA must be disconnected from the power supply before updating the
firmware.
The reset button must remain pressed in when the voltage supply is connected.
The status LED changes colour to indicate that the device is in the update
mode.
If it is red, it means the device is ready to be updated.
The firmware update must be carried out directly on the device itself, and requires
the following steps:
Establish a physical connection between the PQI-D and the zero modem
cable.
The program “COMM.EXE” can be found in the “Firmware” folder, which is
located in the directory containing the WinPQ program. To upload the new
firmware, select a transfer speed of 115 baud and “RTS/CTS” for the hardware protocol.
Then switch the station into the firmware upload mode (by pressing the
reset button for at least 5 seconds), and the status LED changes to red.
Select “Terminal / Send firmware with reset” in the menu of the COMM.EXE
program.
The familiar Windows “Open file” dialogue is displayed. Use this to open the
correct firmware file (e.g. PQI-UU.MOT). The data transfer begins immediately and the progress of the upload can be seen in the program’s status bar.
Verify the version number once the upload is complete (3 to 5 minutes).
When the “VER” command is issued, the system replies (for example):
“PQI-DA: Version 2.0.10 from 23.07.04”
Finally enter “SYSRESET=590” and the station will restart. The status LED
will light up again after approximately 8 seconds.
The stations parameterisation can then also be remotely restored using the “PQPara” section of the program.
PQI-DA Operating Manual
84
Page 85

a-eberle
PQI-DA
13. Scope of Delivery
PQI-D corresponding to the characteristics specification
Operating manual
Supplement
14. Storage Information
The devices should be stored in clean, dry rooms. The devices and their respective
replacement modules can be stored between -25 °C and +65 °C.
The relative humidity must not cause the formation of either condensation or
ice.
We recommend that the storage temperature remains between +0 °C to +55 °C
to ensure that the built-in electrolytic capacitor does not age prematurely.
We also recommend that the device be connected to an auxiliary voltage every
two years to reform the electrolytic capacitors. This procedure should also be
carried out before the device is put into operation. Under extreme climatic conditions (tropics), this also simultaneously ensures “pre-heating” and helps to avoid
the formation of condensation.
The device should be stored in the service room for at least two hours prior to
being connected to the voltage for the first time so that it can become accustomed to the ambient temperature there and to avoid the formation of moisture
and condensation.
15. Guarantee
The guarantee is valid for three years from the date of delivery.
PQI-DA Operating Manual
85
Page 86

a-eberle
PQI-DA
16. Ordering Information
When ordering please note:
• Only one code with the same capital letter is possible
• If the capital letter is followed by the number 9, additional details in plain text
are required
• If the capital letter is followed by 0, the code can be omitted.
CHARACTERISTIC CODE
Power Quality Interface
for medium and high voltage systems
according to DIN EN-50160 und IEC 61000-4-30 (class A)
with 4 binary in- and outputs plus life-contact
with two E-LAN interfaces for communication with
other REGSys- components like REG-D(A), PAN-D, REG-DP(A)
as wall- and/or DIN-rail mounting enclosure (204x142x132) mm
Power Supply:
Input Configuration:
AC 85V..110V..264V oder DC
88V..220V..280V
DC 18V...60V...72V
4 VTs
2 x 4 VTs
4 VTs, 4 CTs In=1 A (Imax < 2x In)
4 VTs, 4 CTs In=1 A (Imax < 20 x In)
4 VTs, 4 CTs In= 5 A (Imax < 2 x In)
4 VTs, 4 CTx In= 5 A (Imax < 20 x In)
PQI-DA
H0
H1
C00
C10
C20
C21
C30
C31
Additional Interface:
as COM-Server (RJ 45)
Rated Input Values:
other rated values (e.g. 4 x 100V and 4 x 400V)
Please note: E9 can only be chosen together with C10!!
Binary Inputs:
4 programmable binary inputs (AC/DC 48…250V)
4 programmable binary inputs (DC 10…48V)
4 programmable binary inputs with other input voltages
Operating Manual:
as RS 232 (COM 2)
100/110V
230/400V
German
English
French
Spanish
Italian
T0
T1
E1
E2
E9
M1
M2
M9
G1
G2
G3
G4
G5
PQI-DA Operating Manual
86
Page 87

a-eberle
PQI-DA
CHARACTERISTIC CODE
Software WinPQ
in order to parameterize, to archive and evaluate PQI-DA measured values,
with the following basic functions:
32-bit Windows programming interface
SQL-data base for the recording of the measured values per measuring
point
Data access via TCP/IP
All measured values can be visualized both as a function of time and as
statistical figure
One further licence is included in the price
Licences
as licence for more than 10 PQI-D
Language
Additional licence for WinPQ for up to three PCs
Software ParaPQ
in order to parameterize PQI-DA and to read-out PQI-DA measured values
as licence for 2 PQI-D
as licence for 2 to 10 PQI-D
German
English
WinPQ
L0
L1
L2
A1
A2
ParaPQ
as single licence
Additional licence for ParaPQ
ACCESSORIES CODE
TCP/IP Adapter; bit rate 10 Mbit REG-COM
DIN-rail 35 mm with power supply unit AC 230 V A01
TCP/IP Adapter; with extended bit rate 100 Mbit
radio clock DCF 77
USB- Adapter for zero- modem cable
Tele- or Least-Line-Modem, industrial version
power supply AC20..264V/ DC14..280V
IRIG-DCF77 - Converter (10 TE)
AC 85V ... 110V ... 264V / DC 88V ... 220V ... 280V
DC 18V ... 60V ... 72V
A90
111.9024
111.9046
111.9030.17
IRIG-DCF
H1
H2
Instruction manual
PQI-DA Operating Manual
as wall mounting version 20TE B2
German
English
G1
G2
87
Page 88

a-eberle
PQI-DA
A.Eberle GmbH & Co. KG
Aalener Str. 30/32
D-90441 Nürnberg
Tel.: +49 (0) 911 / 62 81 08-0
Fax: +49 (0) 911 / 62 81 08 96
http://www.a-eberle.de
info@a-eberle.de
PQI-DA Operating Manual
überreicht durch:
B627D201-06.indd
88
 Loading...