

Page 1

ADVANTEST
ADVANTEST CORPORATION
R4131 Series
Spectrum Analyzer
Operation Manuai
MANUAL NUMBER FOE-8324154N01
Applicable models
R4131C
R4131CN
R4131D
R4131DN
(C) 1988 ADVANTEST CORPORATION
AH rig hts reserved. Printed in Japan
First printing February 17,1988
Page 2

Page 3

MANUAL CHANGES
ADVANTEST
ADVANTEST CORPORATION
Date
Manual No. Manual Change No. EMC-01
Parts of the Operatio n Manual was changed as follows.
Page 8-6 : Us ing ambient c on d it io ns was changed.
\.
Using ambient co nditi ons
: Less than 0°C to 50°C and 85% RH
4
Using ambient co nd ition s
: 0°C to 50 ° C and less than 85% RH
Sep 5/96
1*
Page 4

Page 5

No. ESIOO
Safety Summary
To ensure thorough understanding o f all functions and to ensure efficient use of this instrument, please read the
manual carefully before using. Note that Advantest bears absolutely no responsibility for the result of operations
caused due to incorrect or inappropriate use o f this instrum ent.
Tf the equipment is used in a manner not specified by Advantest, the protection provided by the equipment may
be impaired.
• Warning Labels
Warning labels arc applied to Advantest products in locations where specific dangers exist. Pay
careful attention to these labels during handling. Do not remove or tear these labels. If you have
any questions regarding warning labels, please ask your nearest Advantest dealer. Our address
and phone number are listed al the end of this manual.
Symbols o f those w arning labels are shown below together with ihcir meaning.
DANGER: Indicates an imminently hazardous situation which will result in death or serious
personal injury.
WARNING: Indicates a potentially hazardous situation which will result in death or serious
personal injury.
CAUTION: Indicates a potentially hazardous situation which will result in personal injury or
• Basic Precautions
Please observe the following precautions to prevent fire, bum, electric shock, and personal inju
ry-
• Use a power cable rated for the voltage in question. Be sure however to use a power cable
conforming to safety standards of your nation when using a product overseas.
• W hen inserting the plug into the electrical outlet, first turn the power switch OFF and then
insert the plug as far as it will go.
• W hen removing the plug from the electrical outlet, first turn the power switch OFF and then
pull it out by gripping the plug. Do not pull on the power cable itself. M ake sure your hands
are dry at this time.
• Before turning on the power, be sure to check that the supply voltage m atches the voltage
requirem ents of the instrument.
• Connect the power cable to a power outlet that is connected to a protected ground term inal.
Grounding will be defeated if you use an extension cord which does not include a protected
ground terminal.
• Be sure to use fuses rated for the voltage in question.
a damage to property including the product.
• Do not use this instrument with the case open.
• Do not place anything on the product and do not apply excessive pressure to the product. Al
so, do not place flow er pots or other containers containing liquid such as chemicals near this
Safety-1
Page 6

Safety Summary
product.
• When the product has ventilation outlets, do not stick or drop m etal or easily flammable ob
jects into the ventilation outlets.
• When using the product on a cart, fix it with belts to avoid its drop.
• W hen connecting the product to peripheral equipment, turn the power off.
• Caution Symbols Used Within this Manual
Sym bols indicating items requiring caution which arc used in this manual arc shown below to
gether with their meaning.
DANGER: Indicates an item where there is a danger o f serious personal injury (death or seri
ous injury).
WARNING: Indicates an item relating to personal safety or health.
CAUTION: Indicates an item relating to possible damage to the product or instrument or relat
ing to a restriction on operation.
• Safety Marks on the Product
The following safety marks can be found on A dvantest products.
&
ATTEN TION - Refer to manual.
Protcclivc ground (earth) icrminal.
DANGER - H igh voltage.
f-
CAUTION - Risk of electric shock.
• Replacing Parts with Limited Life
The following parts used in the instrum ent are main parts with limited life.
Replace the parts listed below before their expected lifespan has expired to maintain the perfor
mance and function of the instrument.
Note that the estimated lifespan for the parts listed below may be shortened by factors such as
the environm ent w here the instrument is stored or used, and how often the instrument is used.
The parts inside are not user-replaceable. For a part replacement, please contact the Advantest
sales office for servicing.
Safcty-2
Each product may use parts with lim ited life.
For more information, refer to the section in this docum ent where the parts with limited life are
described.
Page 7

Main Paris with Limited Life
Part name Life
Unit pow er supply 5 years
Safety Summary
Fan motor
Electrolytic capacitor 5 years
LCD display 6 years
LCD backlight 2.5 years
Floppy disk drive 5 years
Memory backup battery
• Hard Disk Mounted Products
The operational warnings are listed below.
• Do not move, shock and vibrate the product while the power is turned on.
Reading or writing data in the hard disk unit is performed with the memory disk turning at a
high speed. It is a very delicate process.
• Store and operate the products under the follow ing environm ental conditions.
An area with no sudden tem perature changes.
An area away from shock or vibrations.
An area free from moisture, dirt, or dust.
An area away from magnets or an instrum ent which generates a magnetic field.
5 years
5 years
• Make back-ups o f im portant data.
The data stored in the disk may becom e dam aged if the product is mishandled. The hard disc
has a limited life span which depends on the operational conditions. Note that there is no
guarantee for any loss o f data.
• Precautions when Disposing of this Instrument
When disposing of harmful substances, be sure dispose of them properly with abiding by the
state-provided law.
Harmful substances: (1) PCB (polycarbon biphenyl)
(2) Mercury
(3) Ni-Cd (nickel cadm ium)
(4) Other
Items possessing cyan, organic phosphorous and hexadic chromium
and items which may leak cadmium or arsenic (excluding lead in sol
der).
Example: fluorescent tubes, batteries
Safeiy-3
Page 8

Environmental Conditions
This instrument should be only be used in an area which satisfies the following conditions:
• An area free from corrosive gas
• An area away from direct sunlight
• A dust-free area
• An area free from vibrations
• Altitude o f up to 2000 m
Operating position
A d ear space of 10 centimeters or more
must be kept around the air vents.
Front
The instrument must be used in a hor
izontal position.
A cooling fan, which prevents the in
ternal temperature from rising, is
equipped with the instrument.
The air vents on the case must be un
blocked.
Figure-2 Operating Position
Storage position
Front
1 1
-----------
This instrument should be stored in a horizontal
position.
When placed in a vertical (upright) position for
storage or transportation, ensure the instrument is
stable and secure.
-Ensure the instrum ent is stable.
-Pay special attention not to fall.
Figure-3 Storage Position
• The classification of the transient over-voltage, which exists typically in the m ain pow er supply, and
the pollution degree is defined by 1EC61010-1 and described below.
Impulse withstand voltage (over-voltage) category 11 defined by 1EC60364-4-443
Safely-4
Pollution Degree 2
Page 9

Types of Power Cable
Replace any references to the power cable type, according to the following table, with the appropriate power cable
type for your country.
Plug configuration
( D l n 0
\ e r'
lo)
( D l n Q
\ E /
\ o /
(b e
Standards
PSE: Japan
Electrical A ppliance and
Material Safely Law
UL: United States of America
CSA: Canada
CEE: Europe
DEMKO: Denm ark
NEMKO: Norway
VDE: Germany
KEMA; The Netherlands
CEBEC: Belgium
OVE: Austria
F1MKO: Finland
SEM KO: Sweden
Rating, color
and length
125 V at 7 A
Black
2 m (6 ft)
125 V at 7 A
Black
2 m (6 ft)
250 V at 6 A
Gray
2 m (6 ft)
Model number
(Option number)
Straight: A 01402
Angled: A 01412
Straight: A 0 1403
(Option 95)
Angled: A 0 1413
Straight: AO 1404
(Option 96)
Angled: AO 1414
< h 4>
( § | )
r
(^Um\
J
______
/ ® ® \
\ n® @ y
SEV: Switzerland 250 V at 6 A
Gray
2 m (6 ft)
SAA: Australia, New Zealand 250 V at 6 A
Gray
2 m (6 ft)
BS: United Kingdom 250 V at 6 A
\
)
CCC:China 250 V at 10 A
Black
2 m (6 ft)
Black
2 m (6 ft)
Straight: AO 1405
(Option 97)
Angled: AO 1415
Straight: AO 1406
(Option 98)
Angled:
Straight: AO 1407
Angled: A01417
Straight: A 114009
Angled: A114109
----------
(Option 99)
(Option 94)
Safety-5
Page 10

Page 11

Certificate of Conformity
This is to certify, that
_____
complies with the provisions of the EMC Directive 89/336/EEC in accordance with
EN50081-1 and EN50082-1 and Low Voltage Directive 73/23/EEC in accordancc with
EN61010.
Spectrum Analyzer
R4131 Series
instrument, type, designation
____ __
___
ADVANTEST Corp. ROHDE&SCHWARZ
Tokyo, Japan Engineering and Sales GmbH
Munich, Germany
4131.00
Page 12

Page 13

Tab le of Power Cable Options
There are six power cable options (refer to following table).
Order power cable options by M odel number.
No. ECA01
Plug configuration
Standards
JIS: Japan
Law on Electrical Appliances
UL: United States of America
CSA: Canada
CEE:
DEMKO:
NEMKO:
VDE:
KEM A:
CEBEC:
OVE:
FIMK O:
SEM KO:
SEV: Switzerland
Europe
Denmark
Norway
Germany
The Netherlands
Belgium
Austria
Finland
Sweden
Rating, color
and length
125 V at 7 A
Black
2 m (6 ft)
125 V at 7 A
Black
2 m (6 ft)
250 V at 6 A
Gray
2 m (6 ft)
250 V at 6 A
Gray
2 m (6 ft)
Model number
(Option number)
Straight: A01402
Angled: AO 1412
Straight: A 0 1403
(Option 95)
Angled: AO 1413
Straight: A 01404
(Option 96)
Angled: AO 1414
Straight: AO 1405
(Option 97)
Angled: A01415
SAA : Australia, N ew Zealand 250 V at 6 A
Gray
2 m (6 ft)
BS: United Kingdom 250 V at 6 A
Black
2 m (6 ft)
Straight: A 0 1406
(Option 98)
Angled:
Straight: A01407
Angled: A01417
----------
(Option 99)
Cable-1*
Page 14

Page 15

R4131 SERIES
SPECTRUM ANALYZER
INSTRUCTION MANUAL
Preface
PREFACE
This Instruction Manual describes the following spectrum analyzers
collectively:
Spectrum analyzers: R4131C, R4131CN
R4131D, R4131DN
The R4131C, R4131CN, R4131D, R4131DN suits safety Class I of the IEC
Publication 348 (safety Publication of the electronic measurement
instrument).
The description of product outline views, screen displays, etc. in this
manual refers to the R4131D unless otherwise clearly indicated.
All information contained in this manual that refers to the R4131 or the
equipment is common to each of the R4131C/CN/D/DN.
In several parts of this manual, the term ATT. refers to "attenuator."
Preface
May 31/94
Page 16

Page 17

R4131 SERIES
SPECTRUM ANALYZER
INSTRUCTION MANUAL
TABLE OF CONTENTS
Table of Contents
1 . GENERAL DESCRIPTION
1.1 How to Use this Operation Manual
1.2 Outline of Products
1.3 Before Starting the Use ...........................................1 - 4
1.3.1 Appearance Check and Accessory Check
1.3.2 Environmental Conditions for Use
1.3.3 Before turning This Analyzer
(1) Power Supply Condition .......................................1 - 5
(2) Check for Fuse
(3) Check for Power Supply Cable
(4) Maximum Input
2. USING R4131 FOR THE FIRST TIME .....................................2 - 1
2.1 Screen of Spectrum Analyzer ......................................2 - 2
2.2 Basic Operating Procedure ........................................2 - 3
(1) Initialization Screen ........................................2 - 3
(2) Input of Measurement Signal
(3) Setting of Center Frequency
(4) Setting of Frequency Span ....................................2 - 5
(5) Setting of Reference Level ...................................2 - 6
(6) How to Use the MARKER Key ....................................2 - 8
(7) How to Improve Frequency Accuracy According to
the Correction Routine .......................................2 - 9
(8) Warm-up Time
.................................................1 - 1
............................... ..
...............................................1 - 3
....................... ..
............................1 - 5
............................... ..
...............................................1 - 6
................................1 - 7
.................................................1 ~ 8
.................................2 - 3
.................................2 - 4
.................................................2 - 9
1 - 2
1 - 4
1 - 5
3. DESCRIPTION OF PANEL SURFACE AND CRT DISPLAY
3.1 Description of Front Panel .......................................3 - 2
3.2 Description of Each Key (in the NORMAL mode)
3.3 Description of Each Key (in the SHIFT mode)
3.4 Description of Rear Panel ........................................3 - 7
3.5 How to Read CRT Display Indication
4. OPERATING METHOD
4.1 Initialization
4.2 Center Frequency
4.3 Function to Improve Center Frequency Accuracy
(1) AFC Function (only in R4131D/DN)
(2) ZERO CALibration
(3) CF CALibration
(4) CF ADJustment
4.4 Frequency Span
(1) What Is Zero Span (Displayed in the Time Axis)?
4.5 Interlocking Function (AUTO) .....................................4 - 10
4.6 Resolution Bank Width (RBW) ......................................4 - 11
4.7 Reference Level and Ordinate Axis Scale
(1) Reference Level
...................................................4 - 1
...................................................4 - 2
.................................................4 - 4
.............................................4 - 6
...............................................4 - 6
................................................4 - 7
...................................................4 - 9
..............................................4 - 12
..............................3 - 10
............................4 - 6
......................3 - 1
....................3 - 5
.....................3 - 6
...................4 - 6
............4 - 9
.........................4 - 12
C - 1 May 31/94
Page 18

R4131 SERIES
SPECTRUM ANALYZER
INSTRUCTION MANUAL
Table of Contents
(2) Quadrature Axis Scale (dB/DIV)
(3) Reference Level Step Width (COARSE/FINE)
(4) Unit (UNITS)
(5) Calibration of Ordinates Axis Level
4.8 RF Input Attenuator
4.9 Display Line .......................................................4 - 16
4.10 Marker Function
(1) Display of Marker
(2) Erasing of Marker
(3) PEAK Search
(4) MarKer Center Frequency
(5) SIGnal TRacK
(6) MARKER PAUSE
(7) Measurement of NOISE/Hz .......................................4 - 21
4.11 Video Filter Band Width (VIDEO FiLTeR)
4.12 Setting of Sweep Time ............................................4 - 23
4.13 Selection of Sweep Mode/Trigger Mode
4.14 Display Detection Mode ...........................................4 - 25
(1) SAMPLE DETection
(2) POSi PeaK DETection ...........................................4 - 25
(3) NORMAL DETection (POSI/NEGA DET)
4.15 Selection of Trace Mode ..........................................4 - 28
(1) WRITE ..........................................................4 - 28
(2) STORE ..........................................................4 - 28
(3) VIEW ...........................................................4-28
(4) WRITE and VIEW (2-screen display)
(5) MAX HOLD .......................................................4 - 31
4.16 Setting Conditions and SAVE/RECALL of Displayed Waveform
(1 ) SAVE ...........................................................4 - 34
(2) RECALL .........................................................4 - 35
4.17 Automatic Setting at Power ON ....................................4 - 36
4.18 Electric Field Intensity Measurement (dBu/m)
4.19 QP Value Measurement (Quasi-peak Value Measurement)
4.20 Normalize .........................................................4 - 42
4.21 Occupied Frequency Band Width (OBW)
Measurement (only for R4131D) ....................................4 - 47
4.22 3dB DOWN,3dB DOWN LOOP,NEXT PEAK Function
(only for R4131D)
4.23 Plotter Output
..................................................4 - 14
...............................................4 - 15
..................................................4 - 17
.............................................4 - 17
.............................................4 - 17
...................................................4 - 17
..................................................4 - 19
..................................................4 - 20
..............................................4 - 25
................................................4 - 49
................................................. ..
...............................4 - 12
.....................4 - 14
..........................4 - 14
...................................4 - 18
..........................4 - 22
............................4 - 24
.............................4 - 26
............................4 - 29
.......4-33
....................4 - 37
............4 - 39
4 - 52
5. APPLIED MEASURING METHOD
5.1 Measurement of Modulation Frequency and Index of AM Signal
5.1.1 Measurement of AM Wave When the Modulation Frequency Is Low
and Modulation Index Is Large
5.1.2 Measurement of AM Wave When Modulation Frequency is High and
Modulation Index is Small .....................................5 - 7
5.2 Measurement of FM Wave ............................................5 - 10
5.2.1 Measurement of FM Wave When Modulation Frequency Is Low .... 5-10
5.2.2 Measurement of FM Wave for High Modulation Frequency
5.2.3 Measurement of Peak Deviation ( f peak) of FM Wave
5.2.4 How to Obtain Modulation Index m when FM Modulation Index m
Is Small ......................................................5 - 17
............................................5 - 1
....
..5 - 2
..............................
......
.........5 - 15
C - 2
..5 - 3
..5-13
May 31/94
Page 19

R4131 SERIES
SPECTRUM ANALYZER
INSTRUCTION MANUAL
Table of Contents
6. GPIB CONNECTION AND ITS PROGRAMMING
6.1 Outline of GPIB
6.2 Standards .........................................................6 - 4
6.2.1 GPIB Specifications ..........................................6 - 4
6.2.2 Interface Function ...........................................6 - 5
6.3 GPIB Handling Method
6.3.1 For Connection to Component Devices
6.3.2 Setting of ADDRESS S W
6.3.3 Programming ................................................. ..6 - 7
6.4 Setting of Each Function ..........................................6 - 8
6.4.1 Setting of Center Frequency
(1) When the Center Frequency Is Set Using the Command
for Setting the TUNING Knob
(2) When the Value of Center Frequency is Set Dir ect ly
6.4.2 Setting of Frequency Span ....................................6 - 11
(1) When Using the Command Corresponding to the Key
on Front Panel
(2) When the Value of Frequency Span Is Set Directly
6.4.3 Setting of Reference Level ..................................
(1) When Using the Command Corresponding to the Key
on Front Panel .............................................. ..6 - 13
(2) When the Value of the Reference Level Is Set Directly
6.4.4 Setting of Marker
(1) When Using the Command Corresponding to the Data Knob
(2) When the Value of Marker Frequency Is Set Directly
6.4.5 Setting of Resolution Band Width
(1) When Using the Command Corresponding to the K e y ..............6 - 16
(2) When the Resolution Band Width Is Set Directly...............6 - 17
6.4.6 Setting of VIDEO FiLTeR Band Width
(1) When Using the Command Corresponding to the K e y ..............6 - 18
(2) When the Value of VIDEO FiLTeR Band Width Is Set Directly .. 6-19
6.4.7 Setting of Sweep Time (SWEEP TIME/DIV)
(1) When Using the Command Corresponding to the K e y ..............6 - 20
(2) When the Sweep Time Is Set Directly
6.5 Output of Setting Conditions ......................................6 - 22
6.5.1 "OP" Command
6.5.2 Format of Output Data .........................................6 - 23
(1) Header .........................................................6 - 24
(2) Block Delimiter
6.5.3 Mode String
6.6 Input/Output of Trace Data ........................................6 - 30
6.6.1 Output of Trace Data ..........................................6 - 31
(1) Method to Output the Trace Data with ASCII C o d e ..............6 - 31
(2) Method to Output Data with the Binary C o d e
6.6.2 Input of Trace Data ...........................................6 - 34
(1) Method to Input the Trace Data with the ASCII C o d e
(2) Method to Input the Trace Data with the Binary Code
6.7 Service Request
(1) Status Byte
(2) Output of Status Byte .........................................6 - 38
................................................6 - 2
.............................................6 - 6
.........
...............................................6 - 11
.............................................6 - 14
..................................................6 - 22
...............................................6-26
...................................................6-27
...................................................6-37
...................................................6 - 37
...............................6 - 1
.........................6 - 6
............................. ..6 - 6
..................................6 - 9
................................ ..
.........6-10
...........6 - 12
.......6 - 14
.......6 - 14
..........6 - 15
.............................6 - 16
......................... ..
.......................
........................ ..
...................6 - 32
..........6-34
.........6-35
6 - 9
..6 - 12
6 - 18
6 - 19
6-21
C - 3
Oct 20/89
Page 20

R4131 SERIES
SPECTRUM ANALYZER
INSTRUCTION MANUAL
Table of Contents
6.8 Notes in Programming
(1) Noteworthy Points in Sending a Command
(2) Noteworthy Points in Spectrum Analysis when the Frequency
Span Is Made Narrower .........................................6 - 39
(3) Noteworthy Points for the Setting of Center Frequency
When the Frequency Span Is Less Than 10 MHz ................
6.9 List of GPIB Codes ...............................................6 - 41
7. INSPECTION AND MAINTENANCE ..........................................7 - 1
7.1 Defects and Abnormal stresses ....................................7 - 2
7.2 Notes in Storing and Shipping this Equipment
8. TECHNICAL DATA OF FUNCTION AND ACCESSORIES
8.1 Technical Data of Function .......................................8 - 2
(1) Frequency Specification ......................................8 - 2
(2) Amplitude Specification ......................................8 - 3
(3) Sweep Specification ..........................................8 - 5
(4) Input Specification ..........................................8 - 5
(5) Display Unit Specification ...................................8 - 5
(6) Output Specification .........................................8 - 6
(7) General Specifications .......................................8 - 6
8.2 Accessories .......................................................8 - 7
9. FUNCTIONAL DESCRIPTION
9.1 Outline ...........................................................9 - 2
9.1.1 Basic Operations
9.1.2 R4131 Series Configuration
9.2 RF Block ..........................................................9 - 7
9.2.1 First Mixer
(1) 3.6 GHz Low-pass Filter ......................................9 - 8
(2) 4.0 GHz Band Pass Filter .....................................9 - 8
(3) First Mixer
9.2.2 Second Mixer
(1) 4.0 GHz Band Pass Filter .....................................9 - 9
(2) Second Local Oscillator ......................................9 - 9
(3) Second Mixer
9.2.3 Third and Fourth Mixers ......................................9 - 9
(1 ) 226.42 MHz Preamplifier ......................................9 - 9
(2) Third Mixer
(3) 200 MHz Crystal Oscillator ...................................9 - 10
(4) Gain Control Amplifier .......................................9 - 10
(5) 30 MHz Crystal Oscillator ....................................9 - 11
9.3 YT0_C0NT/IF Board
9.3.1 IF Filter
(1) Input 3.58 MHz Band Pass Filter
(2) Gain Adjust Amplifier ........................................9 - 13
(3) Crystal Filter
(4) LC Filter
(5) Step Amplifier
....................................................9-12
....................................................9 - 15
..............................................6 - 39
.......................6 - 39
..6 - 40
.....................7 - 3
........................8 - 1
.............................................9 - 1
.............................................9 - 2
..................................9 - 5
..................................................9 - 8
..................................................9 - 8
.................................................9 - 8
.................................................9 - 9
..................................................9 - 9
................................................9 - 12
.............................9 - 13
...............................................9 - 15
...............................................9 - 16
C - 4
May 31/94
Page 21

R4131 SERIES
SPECTRUM ANALYZER
INSTRUCTION MANUAL
Table of Contents
9.3.2 YTO Controller and AFC ...................................... 9 - 17
(1 ) YTO Controller
(2) AFC .......................................................... 9-29
9.4 Analog Board .................................................... 9 - 21
9.4.1 Log Amplifier ............................................... 9 - 21
9.4.2 Ramp Generator .............................................. 9 - 24
(1 ) Current Source .............................................. 9 - 25
(2) Ramp Generator .............................................. 9 - 26
9.4.3 A/D Converter ............................................... 9-28
(1) X-axis A/D Converter .................................... 9 - 39
(2) Y-axis A/D Converter ........................................ 9 - 39
9.4.4 Analyzer Test
10. CALIBRATION AND ADJUSTMENTS ....................................... 10 - 1
10.1 Preparation .................................................... 10 - 2
10.2 A/D Adjustment (Analog Board) (BLR-015117) .................... 10 - 4
10.3 LOG Amplifier Adjustment (Analog Board) (BLR-015117)
10.4 IF Filter Adjustment (YTO_CONT/IF Board
10.4.1 3.58 MHz BPF Adjustment .................................... 10-8
10.4.2 Crystal Filter Adjustment .................................. 10 - 9
10.4.3 LC Filter Adjustment ....................................... 10 - 11
10.4.4 Resolution Bandwidth Level Adjustment
10.4.5 Step Amplifier Adjustment
10.5 YTO_CONT Adjustment (YTO_CONT/IF Board) (BLR-015116)
10.6 RF Block Adjustment
10.6.1 Third Local Oscillator Adjustment
10.6.2 Second Local Oscillator Adjustment
10.6.3 Fourth Local Oscillator Adjustment
10.7 Location Diagram of YTO CONT/IF Board
10.8 Location Diagram of Analog Board
.............................................. 9 - 18
............................................... 9-30
.........
.......................
.....................
.................................
.........
............................................ 10 - 19
.........................
........................
........................
.........................
..............................
10 - 6
10 - 8
10 - 12
10 - 13
10 - 15
10 - 19
10 - 19
10 - 19
10 - 20
10 - 21
1 1 . PERFORMANCE TESTING
11.1 preparation ................................................... 11 - 2
11.2 General Precautions ........................................... 11 - 3
11.3 Frequency Span Accuracy ....................................... 11 - 4
11.4 Center Frequency Readout Accuracy
11.5 Residual F M
11.6 Noise Sidebands
11.7 Resolution Bandwidth Accuracy
11.8 Resolution Bandwidth Selectivity
11.9 Resolution Bandwidth Switching Accuracy
11.10 LOG Linearity and LIN L inea rity
11.11 Reference Level Accuracy ..................................... 11 - 29
11.12 Residual Responses
11.13 Gain Compression ............................................. 11 - 32
11.14 Frequency Response ........................................... 11 - 34
11.15 Average Noise Level .......................................... 11 - 37
11.16 Sweep Time Accurac y.......................................... 11 - 39
11.17 Calibrated Output Accuracy ................................... 11 - 42
............................................... 11 - 1
............................
...................................................
............................................... 11 - 15
................................
.............................
......................
......................... 11 - 26
........................................... 11 - 31
C - 5
11 - 10
11 - 12
11 - 17
11 - 22
11 - 24
Oct 20/89
Page 22

R4131 SERIES
SPECTRUM ANALYZER
INSTRUCTION MANUAL
Table of Contents
12. MAINTENANCE DATA
12.1 preparation
12.2 Location Diagram (Top & Bottom)
12.3 Location Diagram for RF ........................................ 12 - 6
12.4 Block Diagram
12.5 Self Test ....................................................... 12 - 8
APPENDIX
A . 1 Explanation of Terminologies .................................... A - 2
A. 2 Level Conversion Table .......................................... A - 9
A.3 Parts Location and Circuit Diagrams
List of Figures ........................................................ F - 1
List of Tables ......................................................... T - 1
List of E xampl es
External View
..................................................
....................................................
............................... 12 - 4
..................................................
............................
.....
................................................. E - 1
12 - 1
12 - 2
12 - 7
A - 10
C - 6* Oct 20/89
Page 23

R4131 SERIES
SPECTRUM ANALYZER
INSTRUCTION MANUAL
LIST OF FIGURES
List of Figures
No. Title
1-1 Check for Fuse ......................................
1-2 Plug and Adaptor of Power Supply Cable
1-3 Input of Excessive Signal Level
2-1 Screen of Spectrum Analyzer
2-2 Initialization screen
2-3 Input the Calibration Signal
2-4 Setting Center Frequency to 200 MHz ................
2-5 Setting the Frequency Span to 2 MHz ................
2-6 Setting the Reference Level to -30 dB ..............
2-7 Setting the Marker to the Peak of the
Measured Signal .....................................
3-1 Description of Front Panel
3-2 Description of Each Key in the NORMAL Mode
3-3 Description of Each Key in the SHIFT Mode
3-4 Rear Panel ..........................................
3-5 Indication of CRT Display
4-1 Initial Screen ......................................
4-2 Change in Center Frequency
4-3 CF ADJ
CF ADJ (cont'd) .....................................
4-4 Making the Frequency Span Narrow and
Spectrum Expand .....................................
4-5 ZERO SPAN Mode ......................................
4-6 Change in Resolution Band Width
4-7 Change in Reference Level
4-8 Ordinates Axis Scale
4-9 Input Attenuator Displaying Position ...............
4-10 Display Line ........................................
4-11 Operation of Marker
4-12 PEAK Search .........................................
4-13 MarK eR— > Center Frequency
4-14 SIGnal TRacK ........................................
4-15 MARKER PAUSE ........................................
4-16 Setting of NOISE/Hz
4-17 VIDEO Fi L Te R........................................
4-18 Sweep Time ..........................................
4-19 SAMPLE DET (R4131)
4-20 POSI PK DET (R4131)
4-21 NORMAL DET (R41 31B/BN/D/DN)
4-22 Setting the Measured Signal to the
Center Frequency ....................................
4-23 Two-screen Display with a New WRITE Waveform
..............................................
..............................
...............................
................................
................................
.................................
................................
_________________________
............
....................
........................
.......................
.........................
........
......... .......
..........................
.........................
....................
..........................
.........................
........................
......
Page
.......
.......
.......
.......
.......
.......
.......
.......
.......
.......
.......
.......
.......
.......
.......
.......
.......
.......
.......
.......
.......
.......
.......
.......
.......
.......
.......
.......
.......
.......
.......
.......
.......
.......
.......
.......
.......
.......
1
1 - 7
1 - 8
2 - 2
2 - 3
2 - 4
2 - 5
2 - 6
2 - 7
2 - 8
3 - 2
3 - 5
3 - 6
3 - 7
3 - 10
4 - 3
4 - 5
4 - 7
4 - 8
4 - 9
4 - 10
4-11
4 - 12
4 - 13
4-15
4 - 16
4 - 17
4 - 18
4 - 19
4 - 20
4 - 21
4 - 21
4 - 22
4 - 23
4 - 26
4 - 26
4 - 27
4 - 29
4-30
F - 1
Sep 27/93
Page 24

R4131 SERIES
SPECTRUM ANALYZER
INSTRUCTION MANUAL
List of Figures
No.
4-24 Two-Screen Display of Secondary Harmonic Wave and
4-25 MAX HOLD
4-26 Two-screen Display of the Maximum Hold Contents
4-27 SAVE/RECALL Waveform M em o ry
4-28 SAVE Screen .........................................
4-29 RECALL Screen .......................................
4-30 Relationship between Frequency and Calibration Factor
4-31 Direct Connection between Tracking Generator
4-32 Moving the through Wa vefor m
4-33 Moving the Display Line
4-34 Normalize
4-35 Connection of Measured Cable
4-36 Cable Loss Characteristic
4-37 Reading the Characteristic of Waveform from the
4-38 Example of OBW Measurement
4-39 PLOT Function Selection Screen
5-1 AM Signal Wave ......................................
5-2 Set-up in Measurement of Modulation W a v e
5-3 Setting the Center Frequency to the Frequency of
5-4 Setting the Ordinates Axis Scale to LINEAR
5-5 Reading the Time Display of Marker
5-6 Reading the Difference from the Time Indication of
5-7 Reading the Emax ....................................
5-8 Reading the Emin ....................................
5-9 Measurement of AD Wave When Modulation Frequency is
5-10 Relationship Between the Value of (Sideband Level
5-11 Measurement of FM Wave When Modulation Frequency
5-12 Putting the Marker on the Peak of Demodulation Wave
5-13 Obtaining the Time Interval T(s) of
5-14 Measurement of FM Wave When Modulation Frequency
5-15 Reading the Modulation Frequency by Indication of
5— 16 Waveform When Afpeak is Small
________________________Title_________________________ Page
STORE Wa ve for m......................................
............................................
and WRITE Wavef or m
in the half-wave dipole antenna
and System ..........................................
...........................................
Marker Display ......................................
the Measured Signal
the Adjacent Peak
High and Modulation Index is Small
Egg - Carrier Level Eq ) and Modulation
Index m (%) .........................................
I s Low
and Reading Its Time Indication
Demodulation Wave
Is High
the Marker ..........................................
..............................................
.............................................
.................................
........................
....................
........................
............................ .......
.......................
..........................
.........................
.....................
..........
................................ .......
........
.................
.................................. .......
.................
....................
.................................. .......
......................
.......
.......
.......
.......
.......
.......
.......
.......
.......
.......
.......
.......
.......
.......
.......
.......
.......
.......
.......
.......
.......
.......
.......
.......
.......
.......
.......
.......
4 - 30
4 - 31
4 - 32
4 - 34
4 - 34
4 - 35
4 - 41
4 - 42
4 - 43
4 - 43
4 - 44
4 - 45
4-45
4 - 46
4 - 48
4-52
5 - 2
5 - 3
5 - 3
5 - 4
5 - 5
5 - 6
5 - 6
5 - 6
5 - 7
5 - 9
5 - 11
5-12
5 - 13
5 - 14
5 - 14
5 - 15
F - 2
Oct 20/89
Page 25

R41 31 SERIES
SPECTRUM ANALYZER
INSTRUCTION MANUAL
List of Figures
No.
5-17 Waveform When Afpea^ is Large ...................... 5 - 16
5-1 8 How to Obtain Modulation Index m When FM Modulation
6-1 Outline of GPIB ..................................... 6 - 3
6-2 Signal Line Termination
6-3 GPIB Connector Pins Assignment Diagram
6-4 ADDRESS Switch ...................................... 6 - 7
6-5 Correlation Between Screen Grids and Trace Data .... 6-30
6-6 GPIB Code for each Key
9-1 Block Diagram of This Equipment
9-2 RF Block
9-3 First Mixer Block Diagram
9-4 Second Mixer Block Diagram
9-5 Second Local Oscillator
9-6 Double-balanced Mixer
9-7 Gain Control Amplifier
9-8 IF Filter
9-9 Gain Adjust Amplifier
9-10 Crystal Filter ...................................... 9 - 15
9-1 1 LC Filter
9-12 Step Amplifier ...................................... 9 - 16
9-13 YTO Controller & AFC
9-14 SAMP & HOLD ......................................... 9 - 19
9-15 Flowchart for AFC ................................... 9 - 20
9-16 Log Amplifier Schematic Di ag ra m
9-17 One Stage of 10 dB Amplifier
9-18 Block Diagram ....................................... 9 - 24
9-19 Current Source Circuit
9-20 Ramp Generator ...................................... 9 - 26
9-21 A/D Converter
9-22 Analyzer Test ....................................... 9 - 30
9-23 Analyzer Test Display
________________________Title_________________________ Page
Index m Is Small .................................... 5 - 18
............................
............
.............................
....................
............................................ 9 - 7
..........................
.........................
............................
..............................
.............................
........................................... 9 - 12
..............................
........................................... 9 - 15
...............................
....................
.......................
.............................
...................................... 9 - 28
..............................
6 - 4
6 - 5
6 - 43
9 - 4
9 - 8
9 - 8
9 - 9
9 - 10
9 - 10
9 - 14
9 - 17
9 - 21
9 - 22
9 - 25
9 - 31
10-1 Log Amplifier Adjustment
1 0-2 3.58 MHz BPF Adjustment
10-3 Waveform of 3.58 MHz BPF
10-4 Crystal Filter Adjustment
1 0-5 Waveform of Crystal Filter
1 0-6 LC Filter Adjustment
10-7 Step AMP Adjustment
10-8 Analyzer Test Display
10-9 Adjustment for Main Span
1 0-1 0 Location Diagram of YTO CONT/IF B o a r d ..............
10-11 Location Diagram of Analog Board
........................... ......
............................ ......
........................... ......
.......................... ......
.........................
............................... ......
................................
.............................. ......
...........................
...................
F - 3
......
......
......
......
......
10 - 6
10 - 8
10-9
10 - 9
10 - 10
10 - 11
10 - 13
10 - 15
10 - 16
10 - 20
10-21
Oct 20/89
Page 26

R4131 SERIES
SPECTRUM ANALYZER
INSTRUCTION MANUAL
List of Figures
No.
1-1 Frequency Span 4 GHz Test ...........................
1-2 Frequency Span Test Se t u p ...........................
1-3 Frequency Span 500 MHz Test
7-4 Frequency Span 200 kHz Test
1-5 Center Frequency Readout Accuracy Test Setup
1-6 Center Frequency Readout Accuracy Test
1-7 Residual FM Test S e t up ..............................
1-8 Residual FM Test
1-9 Residual FM to AM Conversion Di sp la y
1-10 Noise Sidebands Test S e tup
1-11 Noise Sidebands Measurement
1-12 Resolution Bandwidth Accuracy Test Setup
1-13 Resolution Bandwidth Accuracy T e s t
1-14 Resolution Bandwidth Selectivity Test Setup ........
1-15 Resolution Bandwidth Switching Accuracy Test Setup . 11-24
1-16 LOG/LIN Linearity Test Set u p
1-17 Reference Level Accuracy Test Setup
1-18 Gain Compression Test Setup
1-19 Frequency Response Test Setup
1-20 Frequency Response (100 kHz - 3.6 GHz)
1-21 Maximum Noise
1-22 Average Noise Level Test ............................
1-23 Sweep Time Accuracy Test S e tu p
1-24 Sweep Time Accuracy Test ..................................11 - 41
1-25 Calibrated Output Accuracy Test Setup ..............
________________________Title_________________________ Page
......
......
........................
........................
......
...................
....................................
............... ......
.........................
........................
.................
................. ......
.......................
................ ......
........................
......................
.............
....................................... ......
.....................
......
......
......
......
......
......
......
......
......
......
......
......
......
......
......
11 - 5
11 - 6
11 - 7
11 - 9
11-10
11-11
11 - 12
11 - 13
11 - 14
11 - 15
11 - 16
11-18
11 - 19
11 - 22
11 - 27
11-29
11 - 33
11 - 35
11 - 36
11 - 38
11 - 38
11 - 40
11-43
2-1 Location Diagram (Bottom View)
2-2 Location Diagram (Top View) .........................
2-3 Location Diagram for RF .............................
2-4 Block Diagram
A—1 IF Bandwidth
A-2 Noise Sideband
A-3 Bandwidth Selectivity ............................... A - 5
A-4 Bandwidth Switching Accuracy
A-5 Reference Level
A-6 V.S.W.R............................................... A - 7
A-7 Spurious Response
A-8 Level Conversion Table .............................. A - 9
....................................... ......
........................................
......................................
.....................................
...................................
...........................
.......................
12 - 4
......
......
A - 2
A - 4
A - 6
A - 6
A - 8
12 - 5
12 - 6
12 - 7
F - 4* Oct 20/89
Page 27

R4131 SERIES
SPECTRUM ANALYZER
INSTRUCTION MANUAL
LIST OF TABLES
List of Tables
No.
1-1 Major Function of R4131 .............................
1-2 R4131C/D Standard Accessories
1-3 R4131CN/DN Standard Accessories
1-4 Power Supply Conditions .............................
4-1 Initialization Condition ............................
4-2 SAVE/RECALL Enabled Panel Setting
4-3 Screen Stored in Each Trace Mode
4-4 CISPR Standards for QP Value Measurement Basic
4-5 PLOT TYPE of Each Plotter ...........................
6-1 Interface Function
6-2 Standard Bus Cables (To Be Purchased Separately) ... 6 - 6
6-3 Setting of ADDRESS Switch ...........................
6-4 List of GPIB Codes
6-5 GPIB Code Corresponding to Each Key
6-6 Direct Set GPIB Codes ...............................
6-7 Unit Display GPIB Codes .............................
6-8 Numeric Value Code in Setting Condition Input
6-9 Mode String
6-10 Status Byte
________________________
Characteristic ......................................
.........................................
.........................................
Title
_________________________
......................
....................
..................
...................
..................................
..................................
................
.....
Page
......
......
......
......
......
......
......
......
......
......
......
......
......
......
......
......
......
......
1 ~ 3
1 - 4
1 _ 4
1 - 6
4 - 2
4 - 33
4 - 34
4-39
4 - 53
6 - 5
6 - 7
6 - 41
6-42
6 - 44
6 - 44
6-45
6 - 45
6 - 45
9-1 Tune Voltage Data
10-1 Equipment and Tools Required for Calibration
and Adjustment ......................................
10-2 Maintenance Tools Required for Calibration
and Adjustment ......................................
10-3 TR20, TP21, TP22 Voltage Adjustment Values
10-4 Step Amplifier Adjustment
11-1 Equipment Required for Performance Testing
11-2 Frequency Span 500 MHz to 500 kHz Test
11-3 Tests for Frequency Spans of 200 kHz or Less
11-4 Resolution Bandwidth Test 1 MHz to 10 kHz
11-5 Resolution Bandwidth Accuracy Test 3 kHz to 1 kHz .. 11-21
11-6 Bandwidth Switching Uncertainty
11-7 LOG Linearity
11-8 Reference Level Accuracy ............................
11-9 Sweep Time Accuracy
1 2-1 Equipment and Tools Required For
12-2 Maintenance Tools Required for Troubleshooting
...................................
.........
..........................
........ ......
.............
.......
..........
....................
.......................................
................................
...................
....
......
......
......
......
......
......
......
......
......
......
......
......
......
......
9 - 18
10 - 2
10 - 2
10-4
10 - 14
11 - 2
11 - 8
11-9
11 - 20
11 - 25
11 - 28
11 - 30
11 - 4 0
12-2
12-3
T - 1*
May 31/94
Page 28

Page 29

R4131 SERIES
SPECTRUM ANALYZER
INSTRUCTION MANUAL
LIST OF EXAMPLES
List of Examples
No.
6-1 Setting the Center Frequency to 500 MHz and
6-2 Setting the Center Frequency to 1 GHz .............. 6 - 9
6-3 Setting the Center Frequency to 1 GHz Directly
6-4 Setting the Frequency Span to 20 MHz ............... 6-11
6-5 Setting the Frequency Span to 20 MHz Directly
6-6 Setting the Reference Level to -30 d B m ............. 6-13
6-7 Setting the Reference Level to -30 dBm Directly .... 6-14
6-8 Setting the Marker Frequency to 1 GHz
6-9 Setting the Marker Frequency to 1 GHz Directly
6-10 Setting the Resolution Band Width to 10 kHz
6-11 Setting the Resolution Band Width to
6-12 Making the Resolution Band Width into the Automatic
6-13 Setting the VIDEO FiLTeR Band Width to 100 Hz
6-14 Setting VIDEO FiLTeR Band Width to 100 Hz Directly . 6-19
6-15 Setting the Sweep Time to 200 ms/DIV................ 6-20
6-16 Setting the Sweep Time to 200 ms/DIV Directly
6-17 Setting the Value of the Center Frequency and
6-18 Setting the Header to OFF and Fetching the Value of
6-19 Detecting the Value of Attenuator by Making the Mode
6-20 Output the trace data in memory with ASCII code, and
6-21 The trace data in the memory is output with the
6-22 The trace data is assumed to be provided in numeric
6-23 The trace data is assumed to be provided in the
6-24 ZERO CAL is judged to be ended by reading the
________________________
Frequency Span to 2 MHz
10 kHz Directly ..................................... 6 - 17
Setting Mode ........................................ 6 - 17
Reference Level, and Making These Data Display
by Reading It from This Equipment
Center Frequency as a Character String. Next,
Setting the Header to ON and Fetching the Value of
Center Frequency as a Character String
String Output ....................................... 6 - 29
store in array variable
binary code to be stored in an array variable
array variable A(I). The data in A(I) is then input
to the VIEW screen memory of this equipment with
the ASCII code....................................... 6-34
numeric array variable A(I). The data in A(I) is
then input in the VIEW screen memory of this
equipment with the binary code
status byte.......................................... 6-38
Title
_________________________ Page
............................
.....
.............
.......
.....
.....
.................. 6-23
.............
.............................
......
......................
6 - 8
....
6-10
6-12
6-14
....
6-15
6-16
6-18
6-21
6-25
6-32
6-33
6 - 35
E - 1
Oct 20/89
Page 30

R4 7 3 7 SERIES
SPECTRUM ANALYZER
INSTRUCTION MANUAL
List of Examples
No.
6-25 A command is delimited with a space (>_<) or comma (,)
6-26 The frequency span is made narrow up to 50 kHz for
6-27 When the Frequency of the 200 MHz Reference Signal
________________________
and sent to this equipment
the 200 MHz reference signal
Is Read
............................................. 6 - 40
Title
..........................
_________________________
........................
Page
6 - 39
6 - 39
E - 2*
Oct 20/89
Page 31

R4131 SERIES
SPECTRUM ANALYZER
INSTRUCTION MANUAL
____________________________________________________________ 1 . General Description
1. GENERAL DESCRIPTION
Information and notes necessary to use this instrument for Operating
Manual safety are written. Read before this instrument is used.
1 - 1
Jan 27/94
Page 32
R4131 SERIES
SPECTRUM ANALYZER
INSTRUCTION MANUAL
___________________________________________1.1 How to Use this Operation Manual
1.1 How to Use this Operation Manual
This manual proceeds from basic knowledge to application so that anyone
can master the abundant functions of this equipment even when using such
an intelligent spectrum analyzer for the first time. Those who are
accustomed to using an intelligent spectrum analyzer can start the
measurement at once merely by referring to [Chapter 4. OPERATING
PROCEDURE]. The functional description of each key is given in [Chapter
3. DESCRIPTION OF PANEL SURFACE LAYOUT AND DISPLAY].
1 - 2
Oct 20/89
Page 33
R41 31 SERIES
SPECTRUM ANALYZER
INSTRUCTION MANUAL
__
1.2 Outline of Products
1.2 Outline of Products
The R4131 covers a band-width as wide as 10 kHz to 3500 kHz and is
controlled by a microcomputer. This analyzer features easy confirmation
of all measuring conditions, since its
frequency span is 4 GHz to 50 kHz,
resolution is 1 MHz to 1 kHz,
level data resolution by a marker is 0.05 dB,
tube surface dynamic range is 80 dB,
and the setting conditions of the its major functions are shown on its CRT
display.
The panel of this equipment enables its three major functions (center
frequency, frequency span, and reference level) to be independent of each
other, and its layout makes for excellent operability. In addition, the
resolution band, sweep time and input attenuator values are set
automatically by its AUTO feature.
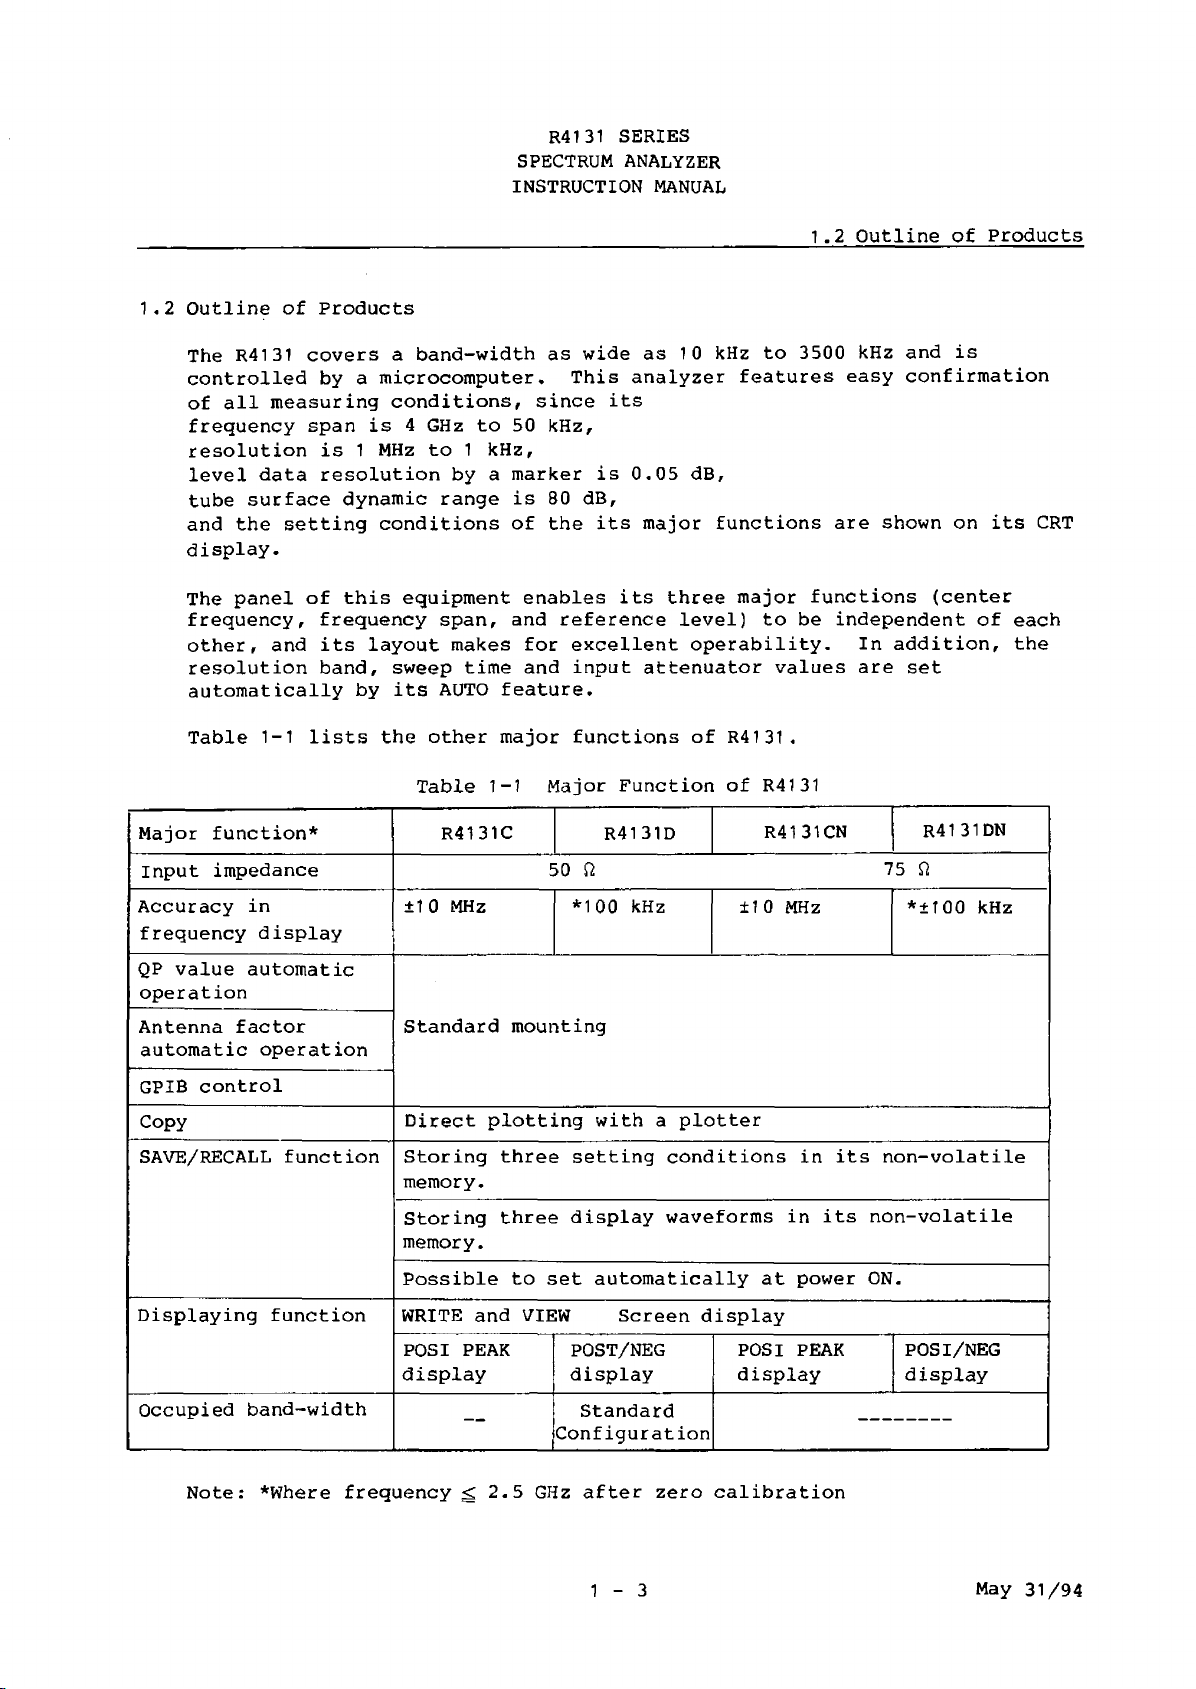
Table 1-1 lists the other major functions of R4131.
Table 1-1 Major Function of R4131
Major function*
Input impedance
Accuracy in
frequency display
QP value automatic
operation
Antenna factor
automatic operation
GPIB control
Copy
SAVE/RECALL function Storing three setting conditions in its non-volatile
Displaying function
R4131C
±10 MHz
Standard mounting
Direct plotting with a plotter
memory.
Storing three display waveforms in its non-volatile
memory.
Possible to set automatically at power ON.
WRITE and VIEW Screen display
POSI PEAK
display
R4131D
so n 75 n
*100 kHz
POST/NEG
display
R4131CN
±10 MHz
POSI PEAK
display
R41 31DN
*±100 kHz
POSI/NEG
display
Occupied band-width
Note: *Where frequency^ 2.5 GHz after zero calibration
—
Standard
Configuration
1 - 3
May 31/94
Page 34
R4131 SERIES
SPECTRUM ANALYZER
INSTRUCTION MANUAL
1.3 Before Starting the Use
1.3.1 Appearance Check and Accessory Check
After R4131 was received, first check flaws or damage in appearance
that could have occurred during its transportation.
Next, check the standard accessories for their quantity and standards,
referring to Table 1-2 for R4131C/D and to Table 1-3 for R4131CN/DN.
If any flaw, damage, shortage in accessories, etc., is found, contact
the nearest dealer or the sales and support offices.
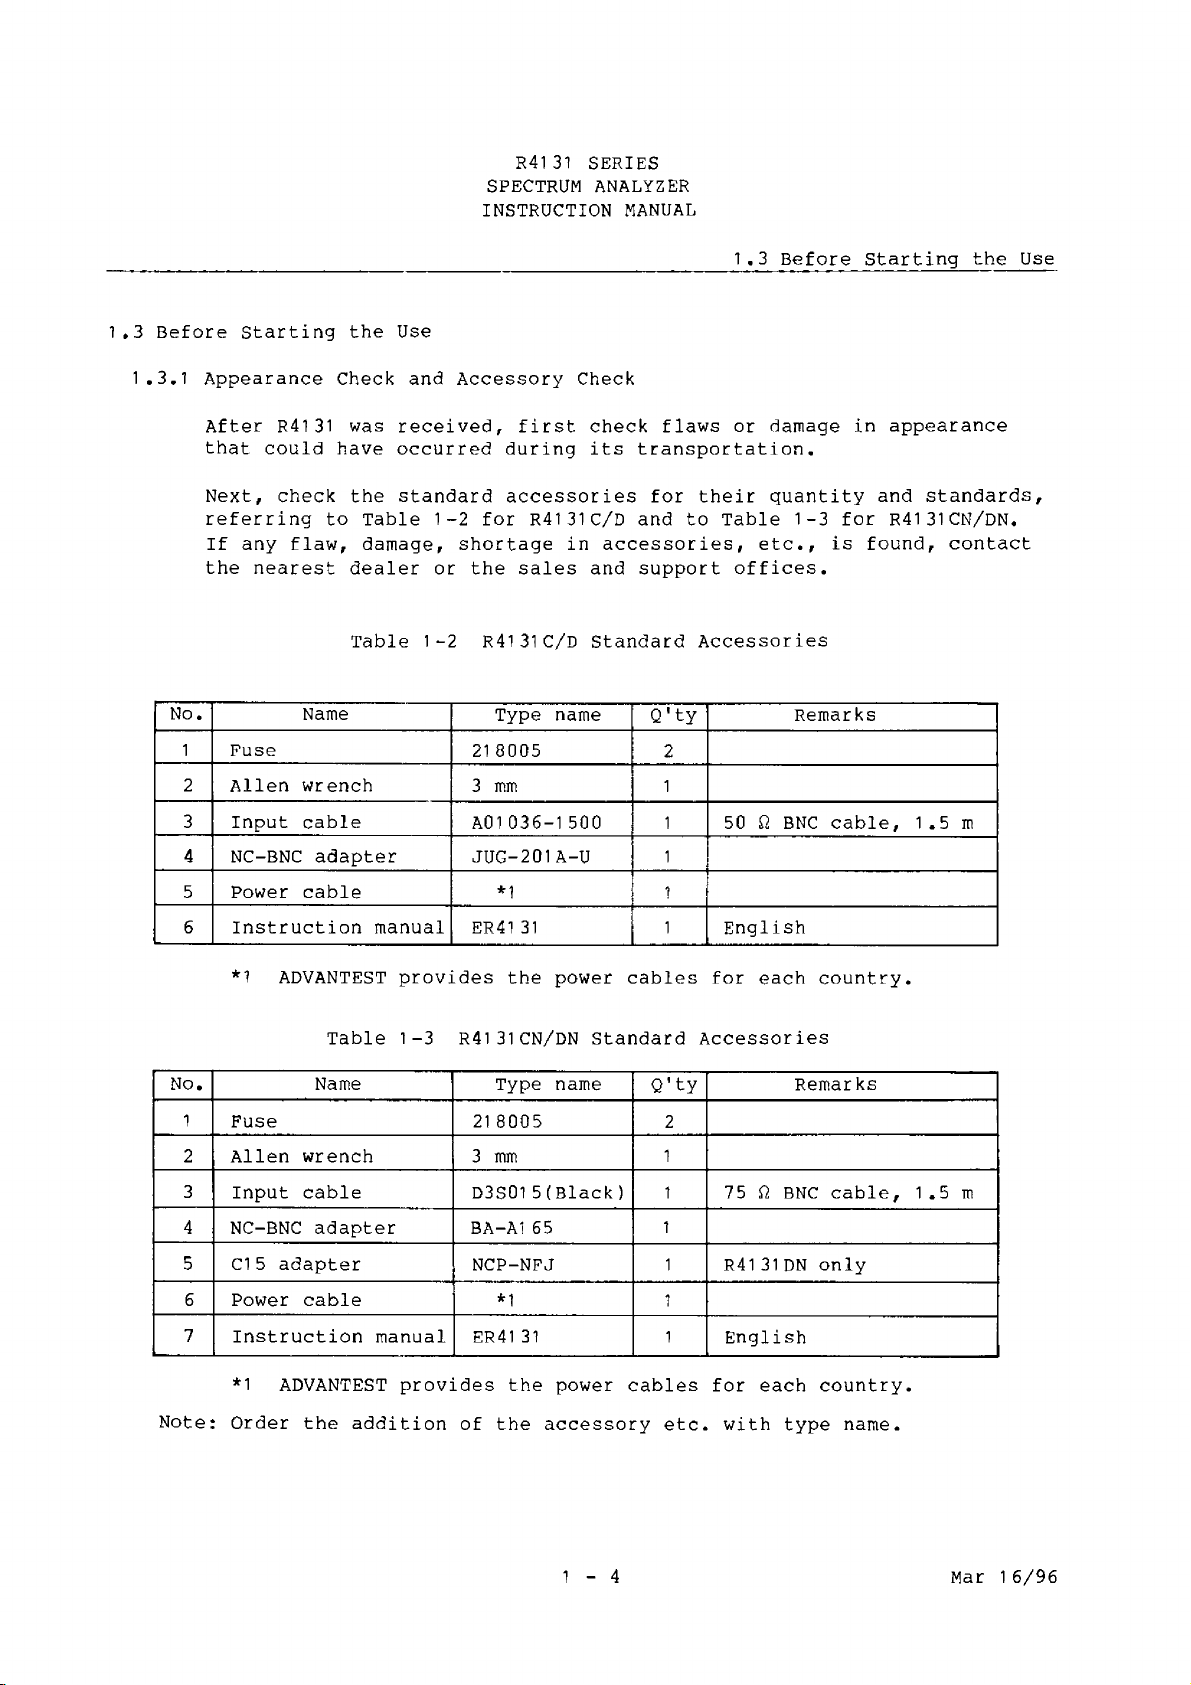
Table 1-2 R4131 C/D Standard Accessories
1.3 Before Starting the Use
No.
1 Fuse
2 Allen wrench
3 Input cable
4 NC-BNC adapter
5
Power cable
6 Instruction manual ER41 31 1 English
*1 ADVANTEST provides the power cables for each country.
No. Name
1
Fuse 21 8005
2 Allen wrench 3 mm
3
Input cable D3S015 (Black) 1 75 ft BNC cable, 1.5 m
4 NC-BNC adapter BA-A1 65
5
C1 5 adapter
Name
Table 1-3 R4131CN/DN Standard Accessories
Type name Q'ty Remarks
218005
3 mm 1
A01 036-1 500 1 50 ft BNC cable, 1.5m
JUG-201A-U
Type name
NCP-NFJ 1 R4131DN only
2
1
1
Q ’ty
2
1
1
Remarks
6 Power cable
7
Instruction manual ER4131 1
*1 ADVANTEST provides the power cables for each country.
Note: Order the addition of the accessory etc. with type name.
*1 1
English
1 - 4 Mar 16/96
Page 35

R4131 SERIES
SPECTRUM ANALYZER
INSTRUCTION MANUAL
______________________________________________
1.3.2 Environmental Conditions for Use
(T)
Refrain from using this equipment in a place subject to much vibration
direct sunlight, and where corrosive gas is generated.
The unit is designed for indoor use.
Also, do not use it where the ambient temperature is outside Ooc to
50oc an(3 relative humidity is less than 85%.
If may occasionally be subjected to temperatures between (K>c and
-10o q without degradation of its safety.
(2) Since this equipment employs a suction type cooling fan to prevent the
internal temperature from rising, install this equipment 10 cm or more
from the wall, and do not place anything close to its back nor use
this equipment in an incorrect position.
(3) Although the equipment design for noise from the AC power supply line,
use it allows where there is low noise as far as possible, and use a
noise filter for noisy places.
(4) The storage temperature range for this equipment is -200^ to
+700(2^ when this equipment is not used for a long period of time,
store it in a dry place away from direct sunlight, covered with vinyl
or placed in a cardboard box.
1.3 Before Starting the Use
1.3.3 Before turning This Analyzer on
-----------------------------------
1. Before any other connection is made, make sure this instrument has
been properly grounded through the protective conductor of the AC
power cable to a socket outlet provided with protective earth
contact. Any interruption of the protective (grounding) conductor,
inside or outside the instrument, or disconnection of the protective
earth terminal can result in personal injury.
2. Before turning this analyzer on, make sure that it is set to the
voltage of the power supply (Refer to Table 1-4.).
3. If the fuse rating is not as specified, this unit may be broken.
(1) Power Supply Condition
The power supply conditions of R4131 are given in Table 1-4.
WARNING -------------------------------
1 - 5
Jan 27/94
Page 36

R4131 SERIES
SPECTRUM ANALYZER
INSTRUCTION MANUAL
1.3 Before Starting the Use
Table 1-4 Power Supply Conditions
Power supply
Input voltage
Frequency
Power consumption
When the power supply does not conform the conditions given in
Table 1-4, this equipment could break down.
(2) Check for Fuse
The fuse of the power supply AC line is T5 A/250 V for either 90 V to
132 V or 198 V to 250 V in input voltage.
Check the fuse set in the power connector of the rear panel as shown
in Figure 1-1.
90 V to 132 V or 198 V to 250 V rmp
48 to 66 Hz
Less than 120 VA
CAUTION
Condition
Figure 1-1 Check for Fuse
-------------------------------- CAUTION ------------------------------
When used with a fuse not in the specified value, this equipment could
break down.
1 - 6
Jan 27/94
Page 37
R4131 SERIES
SPECTRUM ANALYZER
INSTRUCTION MANUAL
________________________________________________ 1.3 Before Starting the Use
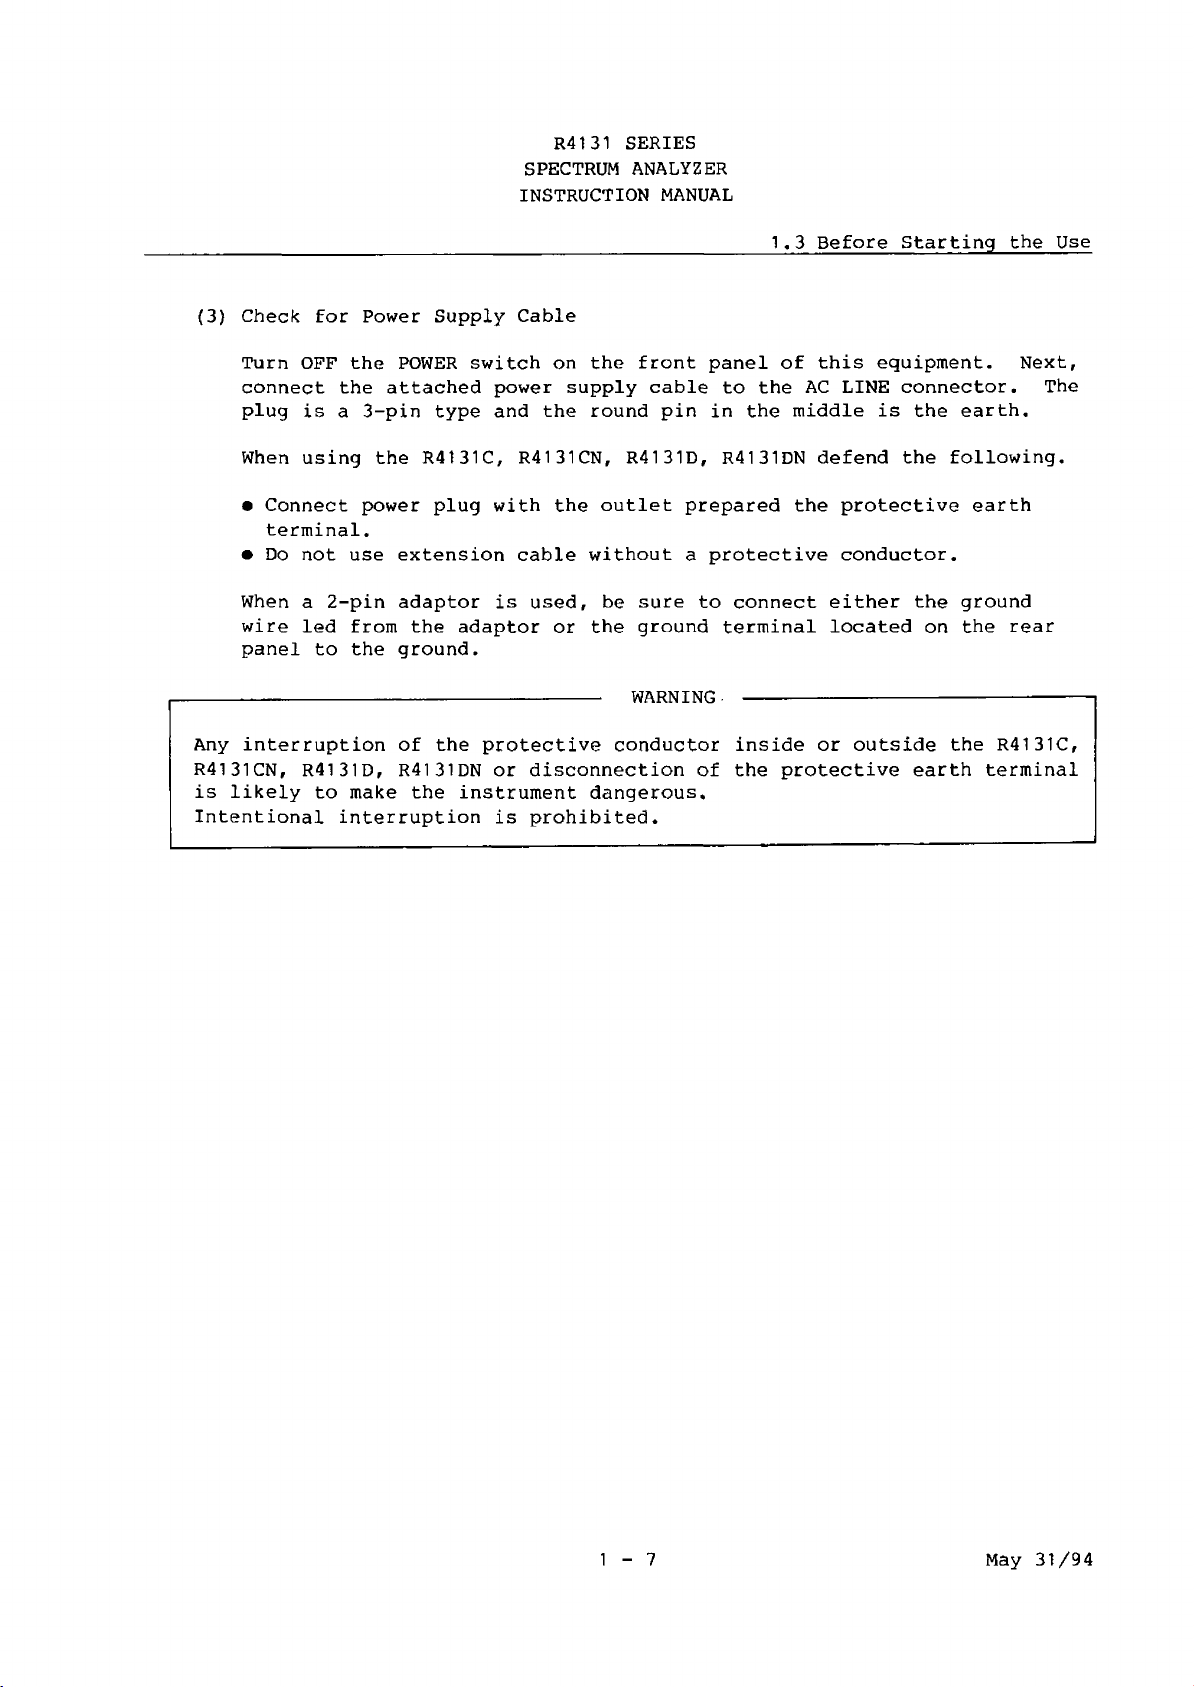
(3) Check for Power Supply Cable
Turn OFF the POWER switch on the front panel of this equipment. Next,
connect the attached power supply cable to the AC LINE connector. The
plug is a 3-pin type and the round pin in the middle is the earth.
When using the R4131C, R4131CN, R4131D, R4131DN defend the following.
• Connect power plug with the outlet prepared the protective earth
terminal.
• Do not use extension cable without a protective conductor.
When a 2-pin adaptor is used, be sure to connect either the ground
wire led from the adaptor or the ground terminal located on the rear
panel to the ground.
------------------------------------ WARNING - —
Any interruption of the protective conductor inside or outside the R4131C,
R4131CN, R4131D, R4131DN or disconnection of the protective earth terminal
is likely to make the instrument dangerous.
Intentional interruption is prohibited.
--------------------------
1 - 7 May 31/94
Page 38

R4131 SERIES
SPECTRUM ANALYZER
INSTRUCTION MANUAL
1.3 Before Starting the Use
(4) Maximum Input
CAUTION
The maximum level that can be input to the INPUT connector of this
equipment is as follows. When a voltage beyond this level is input,
the input mixer unit, etc., breaks down, entailing heavy repair
expense. When the input signal level might exceed the maximum input
level for this equipment, be sure to lower the signal level
sufficiently by using an external attenuator, etc., and then input it.
R4131 C/D
R4131CN/DN
Maximum input level:
AC coupe :
Maximum input level:
AC couple :
+20 dBm (INPUT ATT 20 dB or
more)
±25 VDC max.
+ 127 dBjJ (INPUT ATT 20 DB or
more)
±25 VDC
Figure 1-2 Input of Excessive Signal Level
1 - 8*
May 31/94
Page 39
R4131 SERIES
SPECTRUM ANALYZER
INSTRUCTION MANUAL
_______________
2. USING R4131 FOR THE FIRST TIME
This chapter describes the fundamentals of operating R4131 for those using
for the first time.
Note: Before turning ON the power for this equipment, read through
Section 1.3, Before Use.
2. Using R4131 for the First Time
2 - 1
Oct 20/89
Page 40
R4131 SERIES
SPECTRUM ANALYZER
INSTRUCTION MANUAL
2.1 Screen of Spectrum Analyzer
2.1 Screen of Spectrum Analyzer
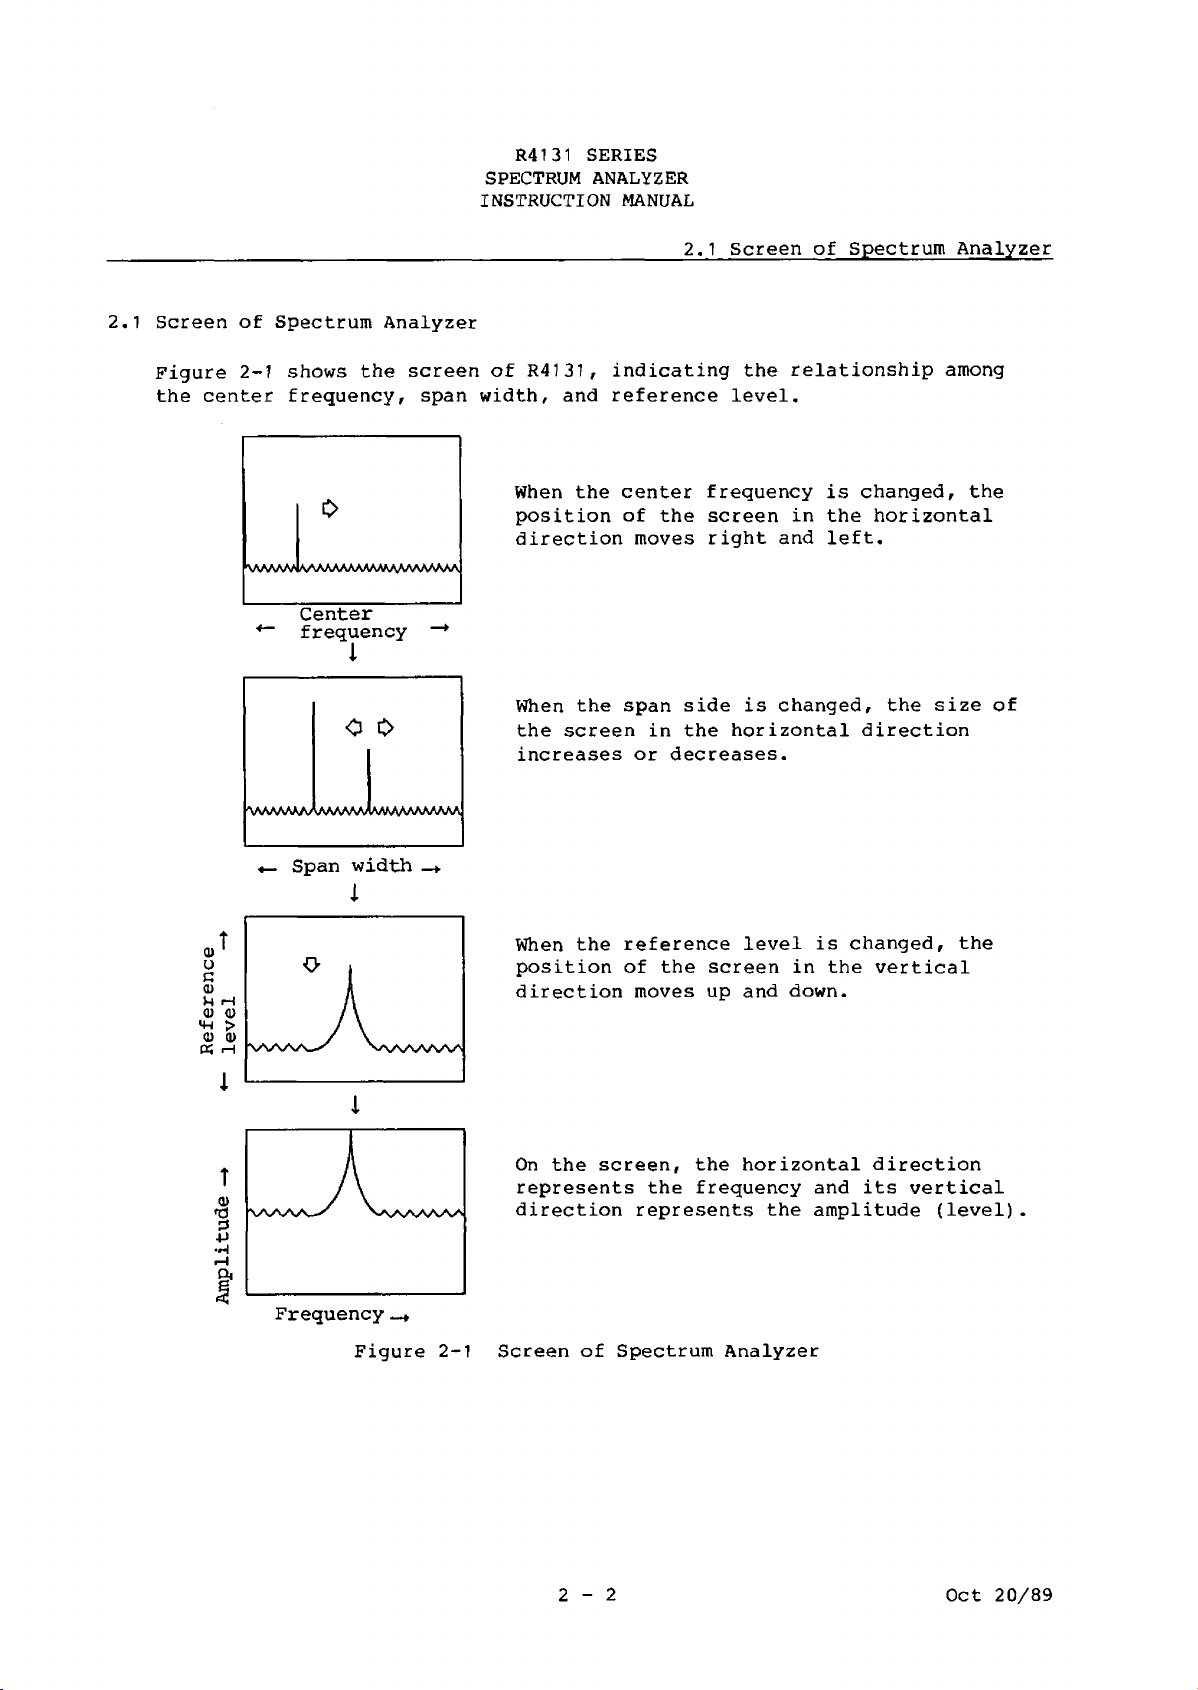
Figure 2-1 shows the screen of R4131, indicating the relationship among
the center frequency, span width, and reference level.
When the center frequency is changed, the
position of the screen in the horizontal
direction moves right and left.
Center
frequency
1
When the span side is changed, the size of
the screen in the horizontal direction
increases or decreases.
«— Span width
i
i
Frequency
Figure 2-1 Screen of Spectrum Analyzer
When the reference level is changed, the
position of the screen in the vertical
direction moves up and down.
On the screen, the horizontal direction
represents the frequency and its vertical
direction represents the amplitude (level).
2 - 2
Oct 20/89
Page 41
R4131 SERIES
SPECTRUM ANALYZER
INSTRUCTION MANUAL
2.2 Basic Operating Procedure
2.2 Basic Operating Procedure
While operating actually using the calibration signal of this equipment,
learn how to use the most important keys.
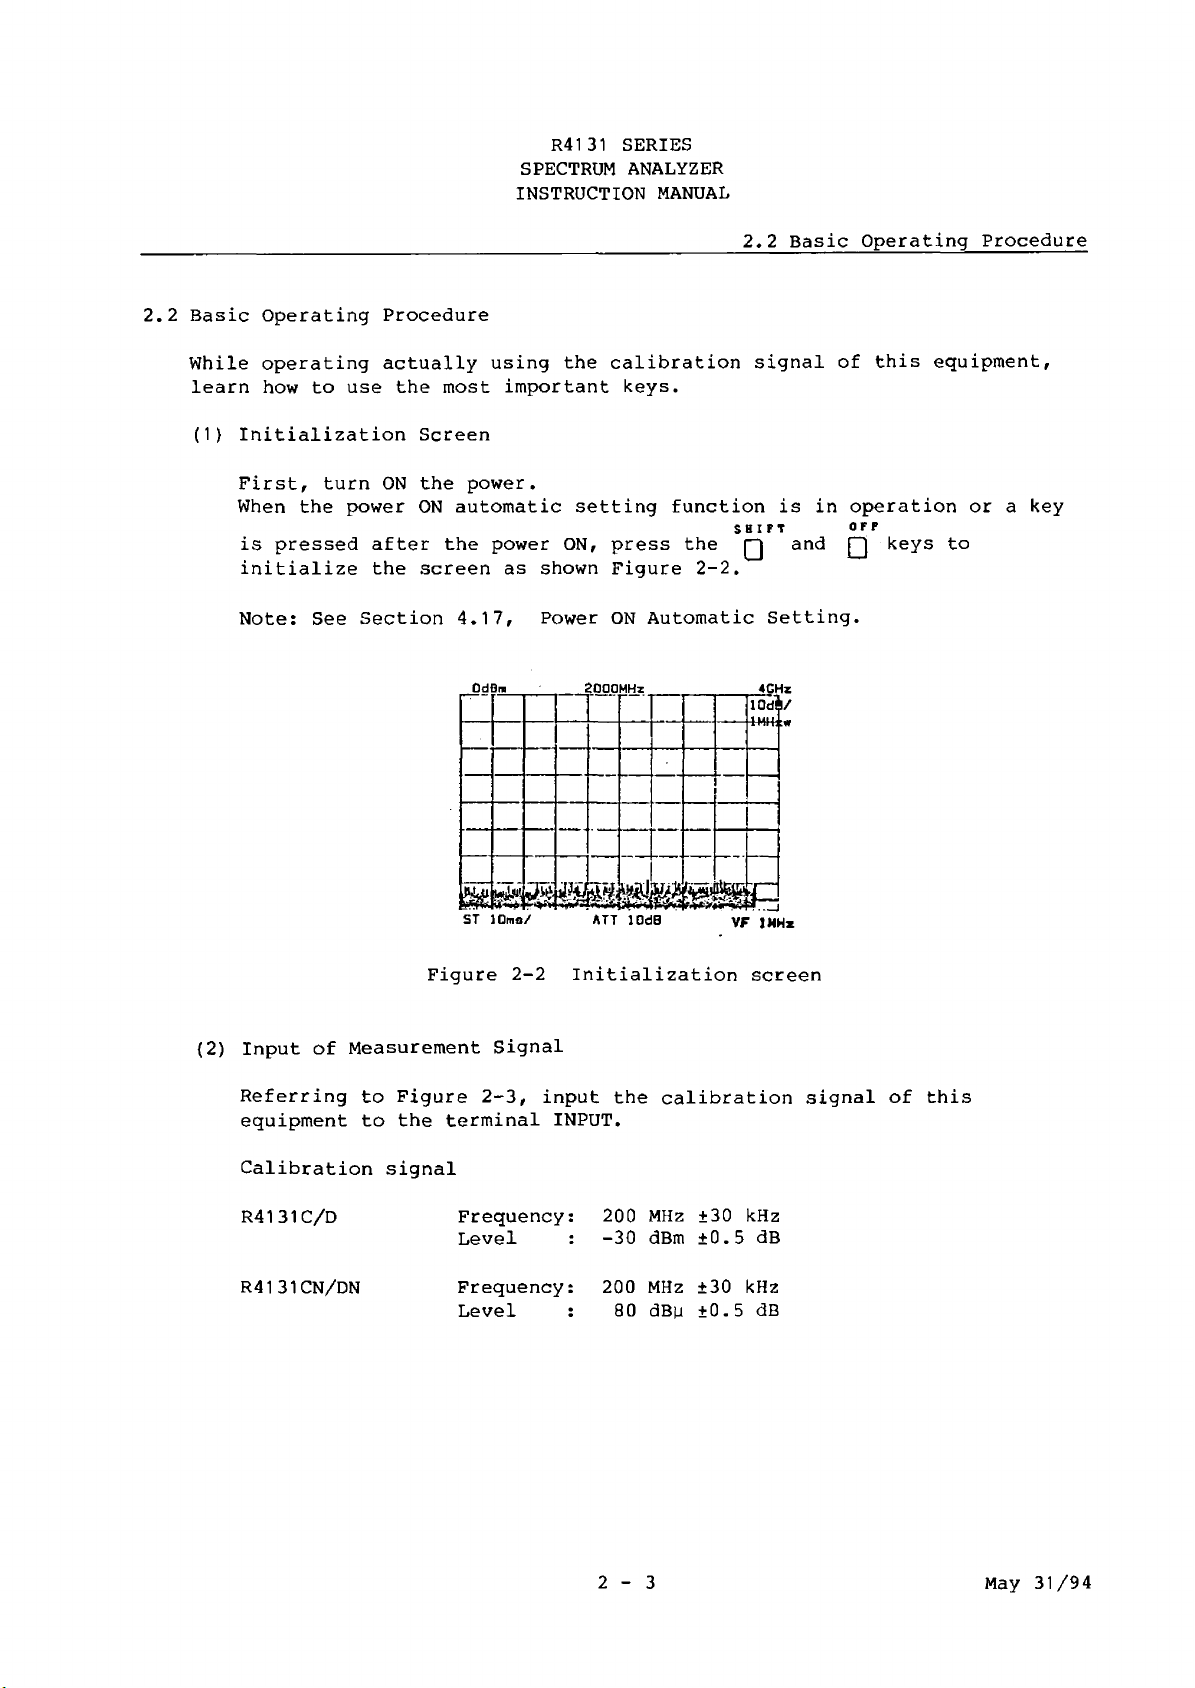
(1) Initialization Screen
First, turn ON the power.
When the power ON automatic setting function is in operation or a key
is pressed after the power ON, press the Q and Q keys to
SHIF T OFF
initialize the screen as shown Figure 2-2.
Note: See Section 4.17, Power ON Automatic Setting.
Figure 2-2 Initialization screen
(2) Input of Measurement Signal
Referring to Figure 2-3, input the calibration signal of this
equipment to the terminal INPUT.
Calibration signal
R4131C/D
Frequency: 200 MHz ±30 kHz
Level : -30 dBm ±0.5 dB
R4131CN/DN
Frequency: 200 MHz ±30 kHz
Level : 80 dBu ±0.5 dB
2 - 3 May 31/94
Page 42

R4131 SERIES
SPECTRUM ANALYZER
INSTRUCTION MANUAL
2.2 Basic Operating Procedure
Figure 2-3 Input the Calibration Signal
(3) Setting of Center Frequency
Since the calibration signal is already known to be 200 MHz in
frequency and -30 dBM in output, set the center frequency to 200 MHz.
Turn the data knob counterclockwise to set the spectrum of the input
signal to the center of the CRT.
2 - 4
Oct 20/89
Page 43

R41 31 SERIES
SPECTRUM ANALYZER
INSTRUCTION MANUAL
___________________2.2 Basic Operating Procedure
Turn the data knob, then the waveform moves in the horizontal
direction (Figure 2-4).
Center frequency
OdBm 200MHz 4GHz
i
IDdl
-
--
—
Jl
ST 10 ma/ ATT lGdB VF I MHz
Figure 2-4 Setting Center Frequency to 200 MHz
(4) Setting of Frequency Span
Since the frequency span of this equipment is set very wide to 4 GHz
on initialization, change it to 2 MHz.
i t \iJX
j V i t f tl A’
I,
M i l h !
! f «U
-----------------
Press the PL0T key, then the frequency span becomes narrower in steps
of 1-2-5 (Figure 2-5).
S I
2 - 5
c
Oct 20/89
Page 44

R4131 SERIES
SPECTRUM ANALYZER
INSTRUCTION MANUAL
__________________________________________2.2 Basic Operating Procedure
If the spectrum deviates from the center in this case, turn the data
knob to change the center frequency and make it narrower while seizing
the spectrum in the center.
Frequency span
i
Figure 2-5 Setting the Frequency Span to 2 MHz
Since the is selected at initialization in the resolution band
width, it is set to the maximum value automatically according to the
setting condition of the frequency span.
(5) Setting of Reference Level
The reference level of this equipment — the horizontal line on the
top of the screen grid — is set to 0 dB at initialization.
Change it to -30 dB and set the spectrum of the calibration signal to
the reference level.
2 - 6
Oct 20/89
Page 45

R4131 SERIES
SPECTRUM ANALYZER
INSTRUCTION MANUAL
2.2 Basic Operating Procedure
REFERENCE LEVELL
o o
I 0 dB /DI V 2 d B/DI V
■ Cl
[COARSE
|F I NE
□J
o
1 0 <J B/D I V 2d B/D I v
When the REFERENCE LEVEL key is pressed, the
reference level goes up and down in steps of 10 dB,
It is set to 10 dB/DIV at initialization.
When the COARSE or FINE key is pressed and FINE is
selected, the LED on the upper right of this key
lights and the mode is set to FINE.
The 10DB/DIV or 2DB/DIV key is used to change the
set value in 1-dB steps.
II i«h F3
pgnnjgi
a
REFERENCE LEVEL key
and FINE STEP key
b
o
Reference
level
I
Figure 2-6 Setting the Reference Level to -30 dB
2 - 7
Oct 20/89
Page 46

R4131 SERIES
SPECTRUM ANALYZER
INSTRUCTION MANUAL
2.2 Basic Operating Procedure
(6) How to Use the MARKER Key
By using the MARKER, you can read the frequency directly at the
displayed marker point and level data.
The following is a description of this procedure:
MARKER
When the Q key is pressed, the LED on its upper lights and the
marker ( O ) appears on the center frequency axis.
Move the marker with the data knob to set the marker to the measured
signal (Figure 2-7). The data of the signal can be read directly
according to the marker frequency and its level.
OFF
When the marker is cleared, press the Q key.
± \
- PEAK search
When the Q key is pressed, the marker moves to the maximum level
waveform displayed.
- MarKeR — ► Center Frequency
When the Q key is pressed, the marker frequency becomes the
center frequency and the marker returns to the center.
o o •
* 0
j s
0- 33 ,
■0
T 3
D
U
k»
r~1
Mk TIK ^
PEAK
O
E3 m
tfM i
Jli 0
M K R ► C F
D
MARKER Key and
MARKER OFF key
PEAK key and
MKR— *CF key
3
Marker level
Marker frequency
-20dBm 200.OOMHz
ST lQma/
2MHz
1 Cdk/
GkHU
VF 1 MHz
Figure 2-7 Setting the Marker to the Peak of the Measured Signal
2 - 8 Oct 20/89
Page 47

R4131 SERIES
SPECTRUM ANALYZER
INSTRUCTION MANUAL
______
2.2 Basic Operating Procedure
(7) How to Improve Frequency Accuracy According to the Correction Routine
s h i r t r-j
When the Q , zero cal key is pressed, the frequency correction
routine, ZERO CAL, is executed. (Then, the "ZERO CAL" is displayed on
the bottom right of the CRT.) When the ZERO CAL is executed before
measurement starts, the center frequency accuracy is improved as shown
below:
R4131C/CN Center frequency accuracy 0 to 3.5 GHz : ±10MHz
R4131D/DN Center frequency accuracy 0 to 2.5 GHz : ±100kHz
2.5 GHz to 3.5 GHz: ±10MHz
(8) Warm-up Time
To use this equipment at the specified accuracy, take 30 minutes or
more for its warm-up.
2-9* May 31/94
Page 48

Page 49

R4131 SERIES
SPECTRUM ANALYZER
INSTRUCTION MANUAL
3. Description of
Panel Surface and CRT Display
DESCRIPTION OF PANEL SURFACE AND CRT DISPLAY
This chapter describes each section on the panel and display screen of
this equipment.
3 - 1
Oct 20/89
Page 50
3.1 Description of Front Panel
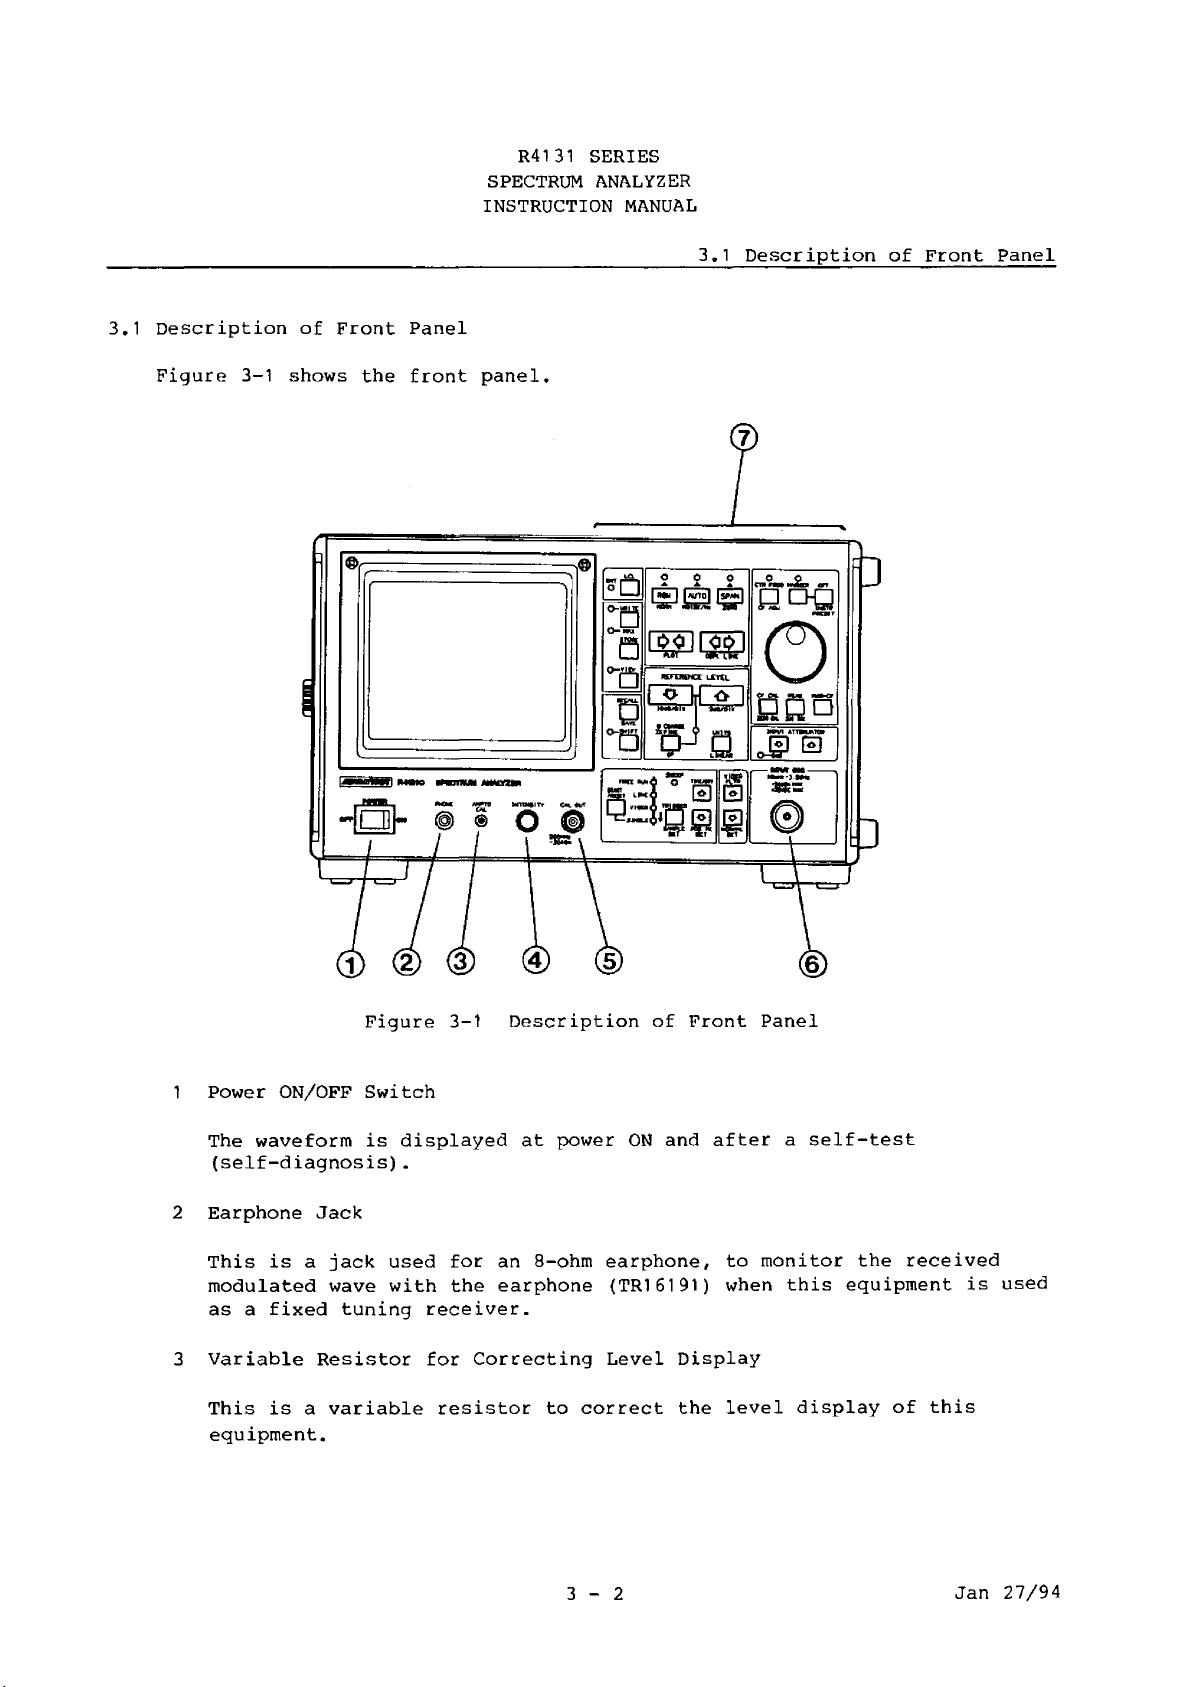
Figure 3-1 shows the front panel.
R4131 SERIES
SPECTRUM ANALYZER
INSTRUCTION MANUAL
3.1 Description of Front Panel
1 Power ON/OFF Switch
The waveform is displayed at power ON and after a self-test
(self-diagnosis).
2 Earphone Jack
This is a jack used for an 8-ohm earphone, to monitor the received
modulated wave with the earphone (TR16191) when this equipment is used
as a fixed tuning receiver.
3 Variable Resistor for Correcting Level Display
This is a variable resistor to correct the level display of this
equipment.
3 - 2
Jan 27/94
Page 51

R4131 SERIES
SPECTRUM ANALYZER
INSTRUCTION MANUAL
_____________________________________________3.1 Description of Front Panel
(4) Variable Resistor for Adjusting Brightnes
This is a variable resistor to correct
the brightness of the CRT display.
(5) Output Connector of Correction Signal
For R4131C/D
Outputs the signal of 200 MHz and -30 dB.
For R4131CN/DN
Outputs the signal of 200 MHz and 80 dB.
(§) Input Connector
For R4131C/D
The maximum input level is +20 dBm and
±25 VDC max. when the input attenuator is
more than 20 dB.
is
CAL OUT
200MHz
-30dBm
CAL OUT
200MHz
80dB
INPUT 5 0 A
10kHz-3. 5GHz
+ 20dBm MAX
± 25VDC MAX
For R4131CN/DN
INPUT 75 n
10kHz-3.5GHz
The maximum input level is +127 dB]j and
±25 VDC max. when the input attenuator is
more than 20 dB.
-----------------------------
Note that the 75 ft input connector is vulnerable when using
R4131CN/DN. Unless the 75 ft NC-BNC type is used for the BNC adaptor,
the input connector breaks down very easily.
(7) Analyzer Control Key
Three basic keys of the spectrum analyzer — center frequency, span
width, and amplitude level — and this equipment are separated into
three sections to be independent of each other for excellent
operability.
— CAUTION -----------------------------
127 d B MAX
± 25VDC MAX
3 - 3
May 31/94
Page 52
R4131 SERIES
SPECTRUM ANALYZER
INSTRUCTION MANUAL
3.1 Description of Front Panel
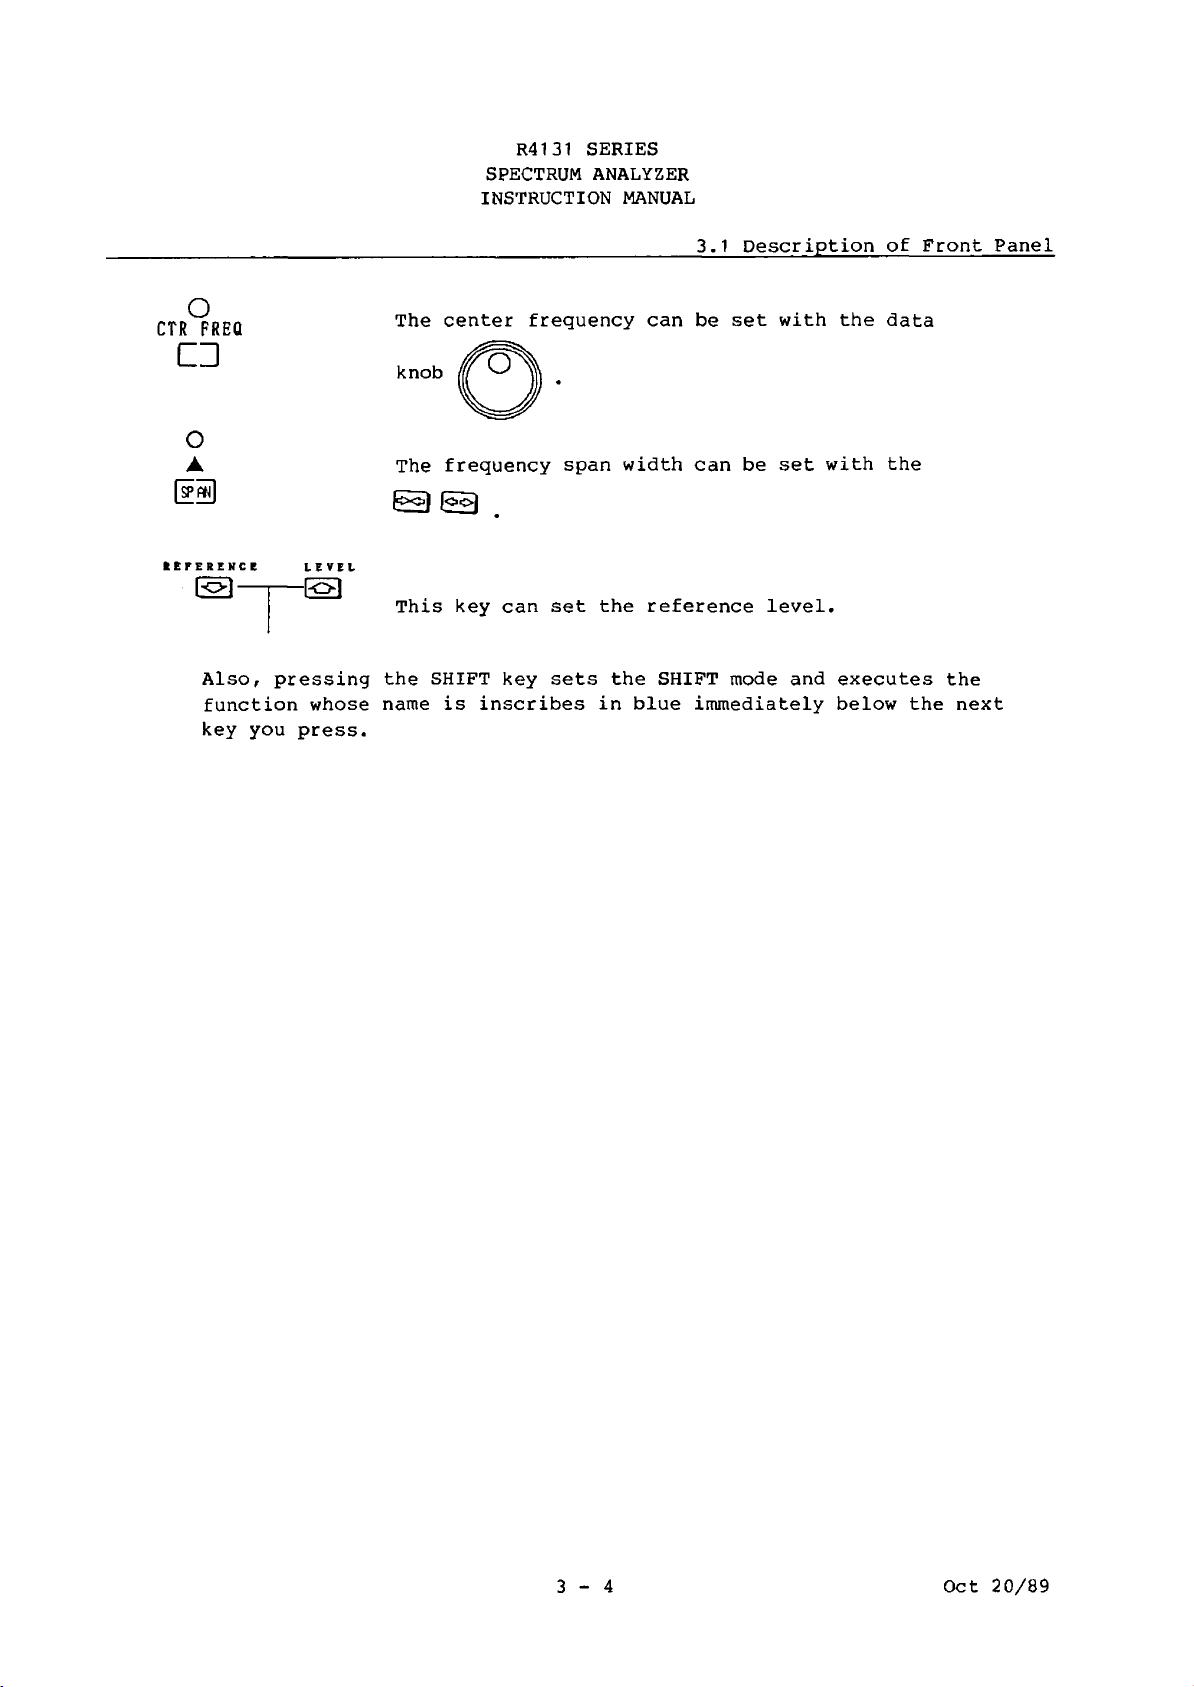
o
CTR FREQ
C D
IEFERINCC
Also, pressing the SHIFT key sets the SHIFT mode and executes the
function whose name is inscribes in blue immediately below the next
key you press.
The center frequency can be set with the data
knob
The frequency span width can be set with the
BED EEI
This key can set the reference level.
3 - 4 Oct 20/89
Page 53

R4131 SERIES
SPECTRUM ANALYZER
INSTRUCTION MANUAL
3.2 Description of Each Key (in the NORMAL mode)
3,2 Description of Each Key {in the NORMAL mode)
The function of each key is the NORMAL mode
is as described in Figure 3-2.
Selects the resolution band width setting mode.
(Indicated with LED.)
LOCAL mode setting:
Rewrites the displayed
waveform for each sweeping,
(Indicated with LED.)
Makes the waveform
stand still and
stores it.
Displays the stored
waveform. (Indi
cated with LED.)
Interrupts the external control
to enable the key input. (In
dicated with LED in the REMOTE
mode.)
Sets the frequency
span and RBW.
Automatically sets, resolution band width (RBW),
sweep time and VIDEO FILTER band.width according
to the frequency span. (Indicated with LED.)
Selects the FREQUENCY SPAN SET
mode. (Indicated with LED.)
Selects the CENTER FREQUENCY SET
mode. (Indicated with LED.)
Displays the marker.
(Indicated with LED.)
Erases the marker.
(Indicated with LED.)
Sets the data knob: center fre
quency and the marker frequency.
Clears the tuning error of the
internal tuning transmitter.
Puts the analyzer into the
RECALL mode and displays the
memory select screen.
Sets the SHIFT mode.
(Indicated with LED.)
Repeats the START or
RESET in the SINGLE
TRIGGER mode.
Changes the reference
level step.
Selects the TRIGGER mode.
(The selected trigger mode Sets the sweep tirpe.,
is indicated with the LED.)
Sets the marker frequency to
the center frequency.
Moves the marker to the highest
level peak on the screen.
Sets the input attenuator.
Sets the reference level.
Selects the level unit.
Sets the VIDEO FILTER band width.
Figure 3-2 Description of Each Key
in the NORMAL Mode
3-5
Oct 20/89
Page 54

R4131 SERIES
SPECTRUM ANALYZER
INSTRUCTION MANUAL
(in the SHIFT mode)
3.3 Description of Each Key (in the SHIFT mode)
3.3 Description of Each Key
The function of each key in the SHIFT mode
is as described in Figure 3-3.
Sets the NORMALIZE mode. Sets the NOISE/H
Displays the plotter
output menu screen.
Draws the display waveform
as MAX HOLD. (Indicated with
LED.)
Displays the memory selection
screen as the SAVE mode.
Indicates the display line.
Executes the ZERO SPAN.
Puts the analyzer into the
OPERATION mode of the occupied
Excutes the band width. (RU131D only)
Sets the initialization condition
Executes ZERO
CAL.
Operates the SIGNAL
TRACK function.
Turn ON/OFF the AFC
mode (RU131D/DN only)
Sets the INPUT
ATT. to 0 dB.
Sets the QP VALUE
MEASUREMENT mode.
Selects the DISPLAY
DETECTION mode to
SAMPLE DET.
Selects the DISPLAY
DETECTION mode to
POS PK DT.
Selects the DISPLAY DETECTION
mode to POS/NEGA PK DT (for
R4131D/DN only). POS PK DT
for the RU131C/CN.
Sets the scale of the
axis of ordinates
to 2 dB/DIV.
Sets the scale of the
axis of ordinates to
10 dB/DIV.
Sets the scale of the
axis ordinates to
LINEAR.
Figure 3-3 Description of Each Key
in the SHIFT Mode
3 _ 6 May 31/94
Page 55
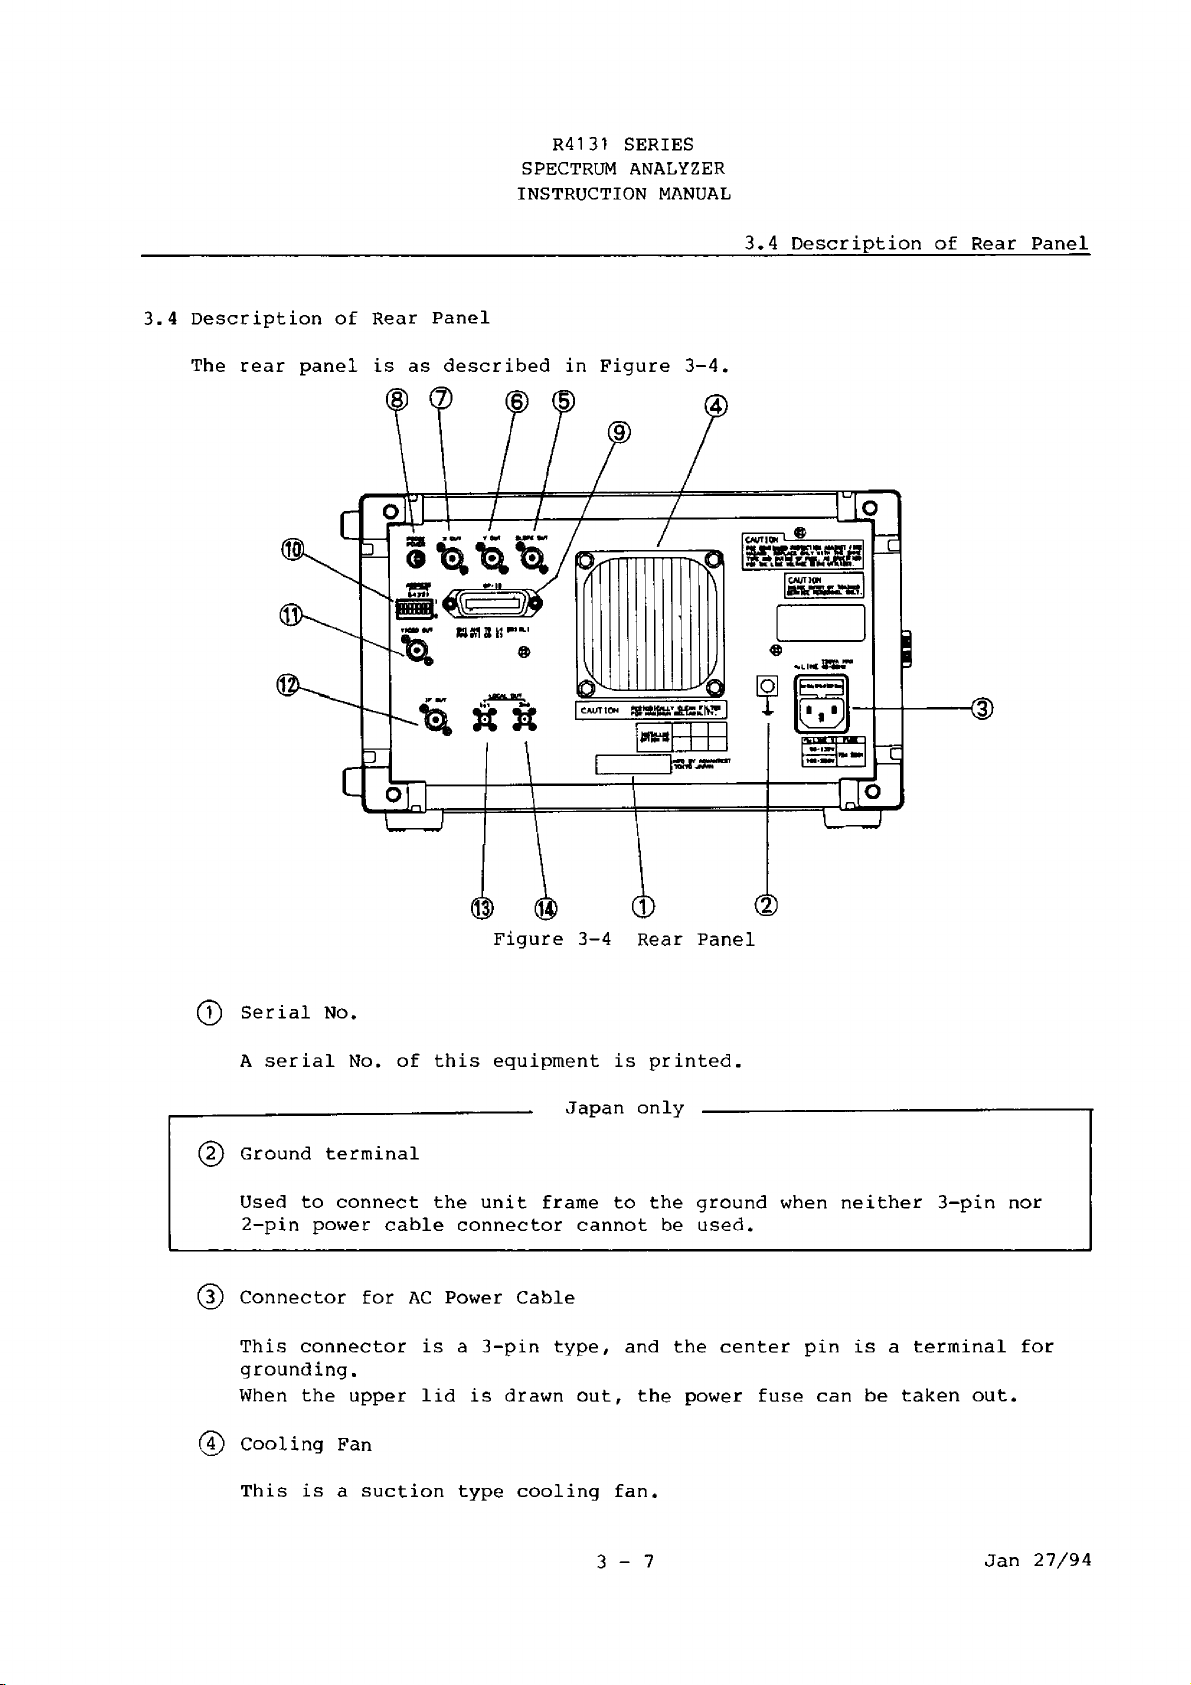
R4131 SERIES
SPECTRUM ANALYZER
INSTRUCTION MANUAL
____________________3,4 Description of Rear Panel
3.4 Description of Rear Panel
The rear panel is as described in Figure 3-4.
(7) Serial No.
A serial No. of this equipment is printed.
______________________—----
(2) Ground terminal
Used to connect the unit frame to the ground when neither 3-pin nor
2-pin power cable connector cannot be used.
(3) Connector for AC Power Cable
This connector is a 3-pin type, and the center pin is a terminal for
grounding.
When the upper lid is drawn out, the power fuse can be taken out.
(4) Cool ing Fan
This is a suction type cooling fan.
Japan only
-----------------------
3 - 7 Jan 27/94
— — —
-----
Page 56
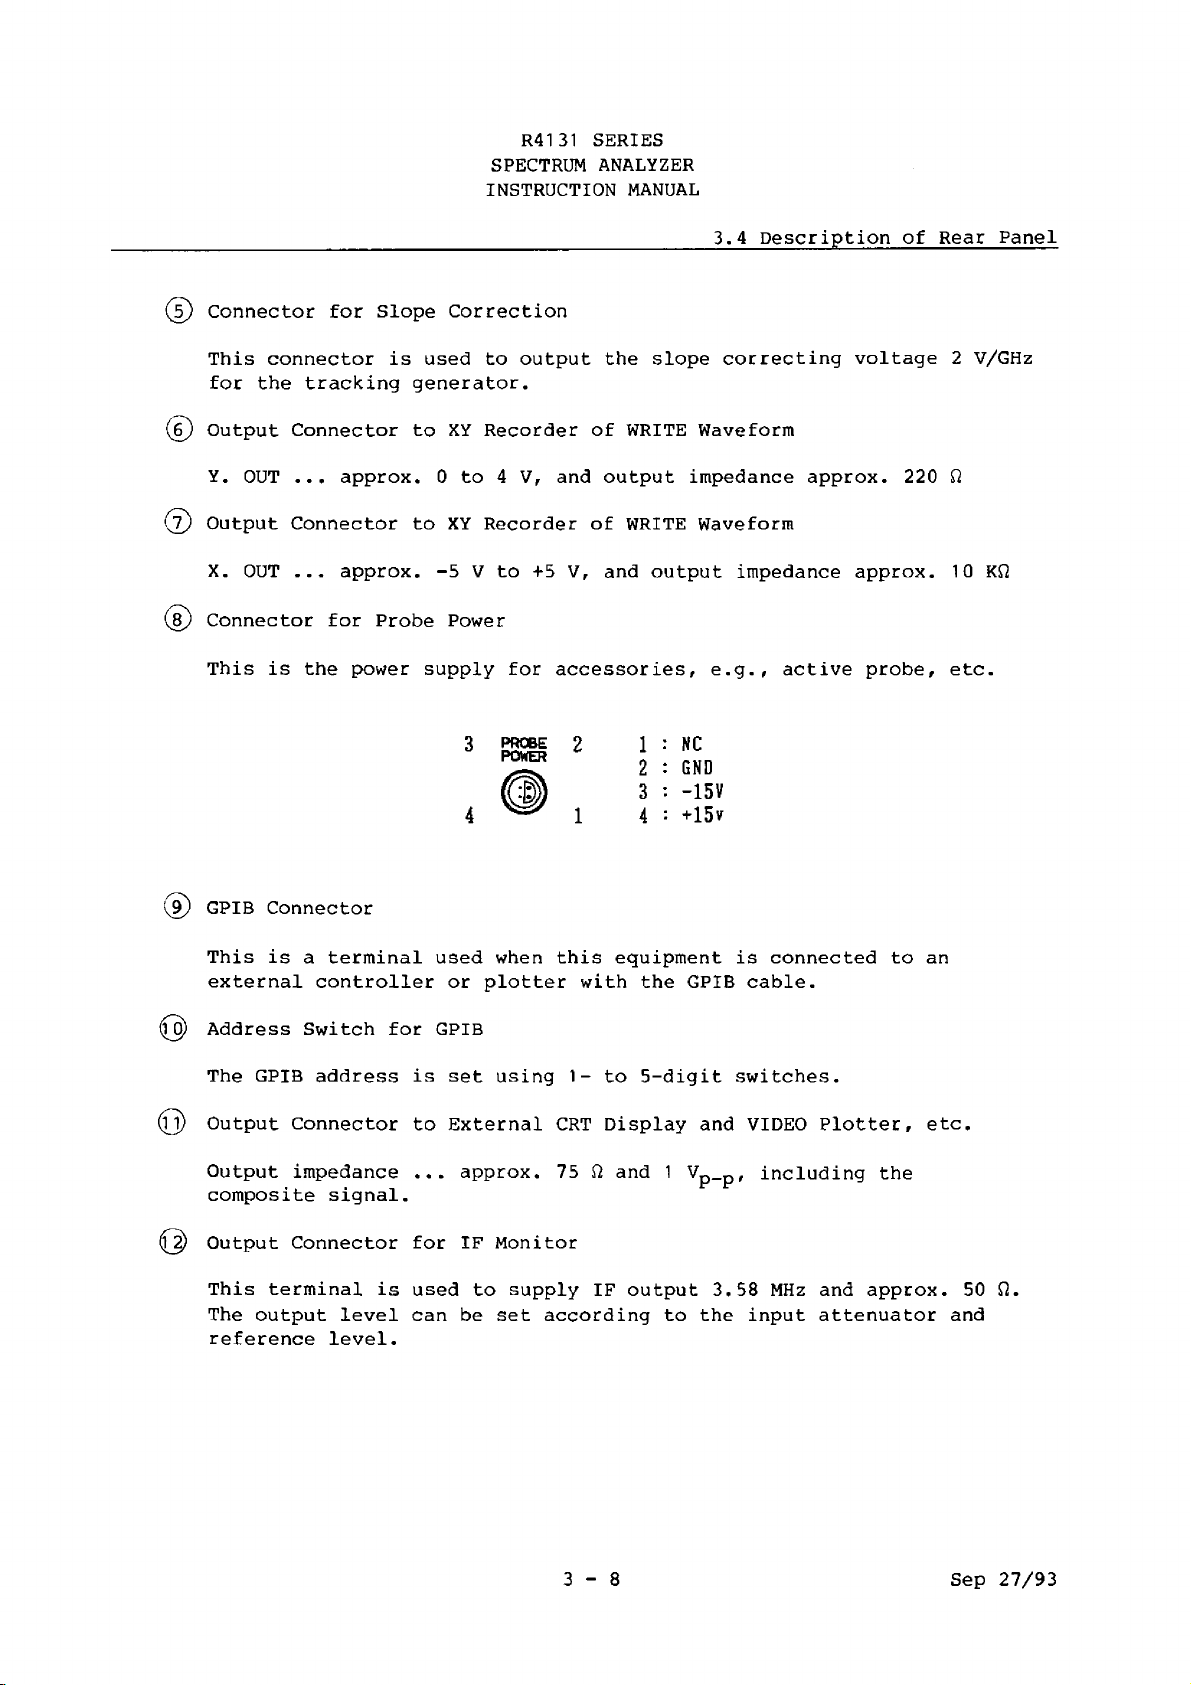
R4131 SERIES
SPECTRUM ANALYZER
INSTRUCTION MANUAL
3.4 Description of Rear Panel
(5) Connector for Slope Correction
This connector is used to output the slope correcting voltage 2 V/GHz
for the tracking generator.
((T) Output Connector to XY Recorder of WRITE Waveform
Y. OUT ... approx. 0 to 4 V, and output impedance approx. 220 ft
(7) Output Connector to XY Recorder of WRITE Waveform
X. OUT — approx. -5 V to +5 V, and output impedance approx. 10 Kft
(8) Connector for Probe Power
This is the power supply for accessories, e.g., active probe, etc.
3 2 1
POWER g
1 4
(9) GPIB Connector
This is a terminal used when this equipment is connected to an
external controller or plotter with the GPIB cable.
(£0) Address Switch for GPIB
The GPIB address is set using 1- to 5-digit switches.
(fj) Output Connector to External CRT Display and VIDEO Plotter, etc.
Output impedance ... approx. 75 ft and 1 vp-p, including the
composite signal.
(£2) Output Connector for IF Monitor
This terminal is used to supply IF output 3.58 MHz and approx. 50 ft.
The output level can be set according to the input attenuator and
reference level.
NC
GND
-15V
3
+15 v
3 - 8 Sep 27/93
Page 57

R4131 SERIES
SPECTRUM ANALYZER
INSTRUCTION MANUAL
_______
{f3) LOCAL OUT Connector for Tracking Generator
1st LOCAL OUT ... more than -5 dBm at 4 GHz to 7.5 GHz
(Q) LOCAL OUT Connector for Tracking Generator
2nd LOCAL COUT ... more than -5 dBm at 3.77 GHz.
---------------------------------
When connector (f3) a n d (f|) for the tracking generator is used while
opened, accurate measurement can not be occasionally done.
______________________3.4 Description of Rear Panel
CAUTION ---------------------------------
Connect with the tracking generator or if you do not use the
connector, install attached terminal instrument.
3 - 9
Sep 27/93
Page 58

R4131 SERIES
SPECTRUM ANALYZER
INSTRUCTION MANUAL
3.5 How to Read CRT Display Indication
3.5 How to Read CRT Display Indication
Various setting conditions are displayed on the screen. Their indication
and the contents of each indication are shown in Figure 3-5.
UNCAL message
This message is output when the
display data level becomes too
low , in such cases where the sweep
ing is too fast or the resolution
band width is too narrow compared
Reference level
Center frequency
with the frequency span.
Frequency span
Marker
freq uenc y"
Level
----
PAUSE time-
Displayed in
the SIGNAL
TRACK only
Displays the
level of the
display line
- l O d B m
MK f200.01MHz
mkp Iau se:
-. SlS fcl AL
S T 0 . 5 s /
Sweep time
10MHz
lOdEj!/.
3Gk-H2W.
A T T 2 0 d B
4
Input attenuator video filter band
width
VF 100Hz\
Ordinates
■a x i s scale
- Resolution
band width
Displayed in
the SAMPLE
only in the
detection
mode
Displayed
during the
ZERO cali
bration
Displayed
during the AFC
operation
(R4131D/DN)
Figure 3-5 Indication of CRT Display
3-10*
May 31/94
Page 59
R4131 SERIES
SPECTRUM ANALYZER
INSTRUCTION MANUAL
_______________________________________________________________4. Operating Method
4. OPERATING METHOD
This chapter describes the basic operating method of this equipment with
same measuring examples included.
4 - 1
Oct 20/89
Page 60

R4131 SERIES
SPECTRUM ANALYZER
INSTRUCTION MANUAL
4.1 Initialization
4.1 Initialization
shi ft □
When the Q , pVeV et key is pressed, the equipment is set to the initial
values as shown in Table 4-1.
Table 4-1 Initialization Condition
Set item
Center frequency
Frequency span
Reference level
2000 MHz
4 GHz
0 dBm (:R4131 C/D)
110 dBU (:R4131CN/DN)
Resorution band width 1 MHz
VIDEO FLTR band width 1 MHz
SWEEP TIME
1 0 mS
INPUT ATT. 10 dB
TRIGGER MODE
Marker
Ordinates axis scale
DETECTION MODE
FREE RUN
OFF
10 dB/DIV
POSI-NEGA PEAK (:R4131D/DN)
POSI PEAK (:R4131C/CN)
TRACE MODE WRITE
Initialization condition
4 - 2
May 31/94
Page 61

R4131 SERIES
SPECTRUM ANALYZER
INSTRUCTION MANUAL
4.1 Initialization
ST 10ms/
M u
(a) R4131C
t*}*)
ATT lOdB
1 Odi
DdBm 2000MHz
in n ::
ACHz
ITcdi/
4lMH*w
±
..
1 -
VF 1MHz
Hyi is#*®*1
ST 10ms/ ATT lOdB
(B) R4131D
VF 1MHz
(c) R4131CN
(d) R4131DN
Figure 4-1 Initial Screen
3
May 31/94
Page 62

R4131 SERIES
SPECTRUM ANALYZER
INSTRUCTION MANUAL
_____________________________
4.2 Center Frequency
The equipment is set to the CTR FREQ CHANGE mode at the initialization of
the data knob. However, when it is set to the MARKER CHANGE mode, press
CTR F R E ft
the Q key. Then the LED on the key lights and the equipment is set
to the CTR FREQ SET mode.
When the data knob is turned, the center frequency changes in a range from
0 MHz to 3620 MHz.
The set resolution is 1/200 of the frequency span.
-----------------------
The center frequency accuracy becomes the following range after the
execution of the ZERO CAL in the local feed through (zero waveform):
R4131C/CN 0 Hz to 3.5 GHz : +10 MHz or less
R4131D/DN 0 Hz to 2.5 GHz : +100 kHz or less
Center Frequency Accuracy
2.5 GHz to 3.5 GHz: ±10 MHz or less
-------------------
4.2 Center Frequency
4 - 4
May 31/94
Page 63

R4131 SERIES
SPECTRUM ANALYZER
INSTRUCTION MANUAL
Display of center frequency
I
CTR F R E ft
□
4.2 Center Frequency
Data knob
OdBm
2 D0 MHz
4 GHz
10dh/
B4Ht«
ST 1 0 ma/ ATT lOdB
Figure 4-2 Change in Center Frequency
VF 1MHz
4 - 5
Oct 20/89
Page 64
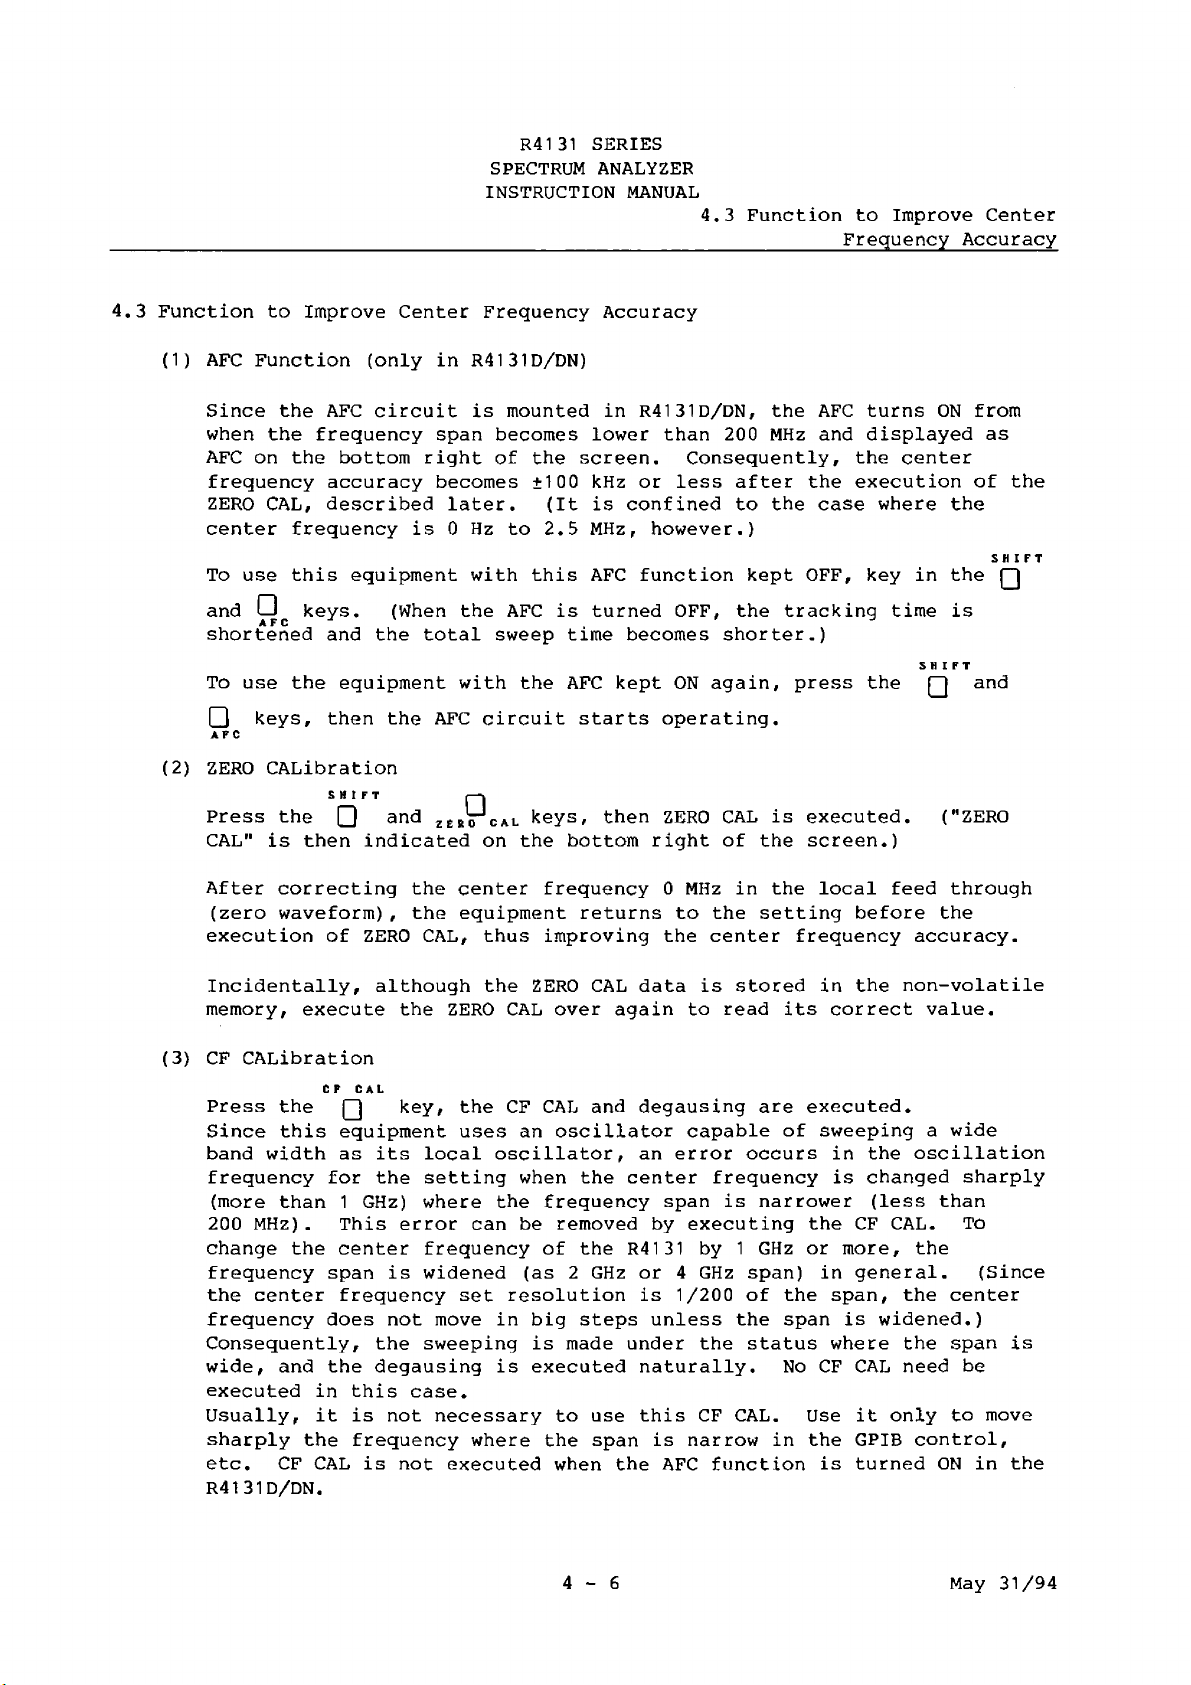
R4131 SERIES
SPECTRUM ANALYZER
INSTRUCTION MANUAL
4.3 Function to Improve Center
Frequency Accuracy
4.3 Function to Improve Center Frequency Accuracy
(1) AFC Function (only in R4131D/DN)
Since the AFC circuit is mounted in R4131D/DN, the AFC turns ON from
when the frequency span becomes lower than 200 MHz and displayed as
AFC on the bottom right of the screen. Consequently, the center
frequency accuracy becomes +100 kHz or less after the execution of the
ZERO CAL, described later. (It is confined to the case where the
center frequency is 0 Hz to 2.5 MHz, however.)
To use this equipment with this AFC function kept OFF, key in the Q
and □ keys. (When the AFC is turned OFF, the tracking time is
shortened and the total sweep time becomes shorter.)
To use the equipment with the AFC kept ON again, press the Q and
□ keys, then the AFC circuit starts operating.
AFC
SHIFT
SHIFT
(2) ZERO CALibration
SHIFT ||
Press the Q and ZEBo Cal keys, then ZERO CAL is executed. ("ZERO
CAL" is then indicated on the bottom right of the screen.)
After correcting the center frequency 0 MHz in the local feed through
(zero waveform), the equipment returns to the setting before the
execution of ZERO CAL, thus improving the center frequency accuracy.
Incidentally, although the ZERO CAL data is stored in the non-volatile
memory, execute the ZERO CAL over again to read its correct value.
(3) CF CALibration
Press the Q key, the CF CAL and degausing are executed.
Since this equipment uses an oscillator capable of sweeping a wide
band width as its local oscillator, an error occurs in the oscillation
frequency for the setting when the center frequency is changed sharply
(more than 1 GHz) where the frequency span is narrower (less than
200 MHz). This error can be removed by executing the CF CAL. To
change the center frequency of the R4131 by 1 GHz or more, the
frequency span is widened (as 2 GHz or 4 GHz span) in general. (Since
the center frequency set resolution is 1/200 of the span, the center
frequency does not move in big steps unless the span is widened.)
Consequently, the sweeping is made under the status where the span is
wide, and the degausing is executed naturally. No CF CAL need be
executed in this case.
Usually, it is not necessary to use this CF CAL. Use it only to move
sharply the frequency where the span is narrow in the GPIB control,
etc. CF CAL is not executed when the AFC function is turned ON in the
R4131D/DN.
C F CAL
4 - 6 May 31/94
Page 65

R4131 SERIES
SPECTRUM ANALYZER
INSTRUCTION MANUAL
4.3 Function to Improve Center
Frequency Accuracy
(4) CF ADJustment
Press the Q , cp^adj keys, then CF ADJ is executed.
By using this function, the center frequency accuracy can be improved
further using the known input signal.
The following is a description of the case where 2.2 GHz (11 times of
CAL OUT 200 MHz) is used as the known frequency signal to read the
value of an unknown frequency in the vicinity of 2.2 GHz.
(T) Set the center frequency to 2.2 GHz. (See Figure 4-3 (a).)
(2) Make the frequency span narrow in a range from which the spectrum
does not protrude from the tube surface. (See Figure 4-3 (b).)
(3) When the Q , cf^adj keys are pressed, the frequency display
remains unchanged, but the spectrum moves to the center and the
center frequency accuracy becomes 11 times the CAL OUT signal
accuracy. (See Figure 4-3 (c).)
(4) Input an unknown frequency and read the frequency. (See Figure 4-3
(d) .)
Although the value of the unknown frequency is obtained as 2199.5 MHz
in this example, care should be taken, because value indicates the
error of the CAL OUT signal and also the marker error.
SHIFT
SHIFT
(a)
O
CTR FREQ
□
Data knob
OdBm 2200MHz 4GHz
;
m
$
ST 10m s/ ATT lOdB VF 1MHz
Figure 4-3 CF ADJ
Uy?
l if e
S£
10d£
__
4-7
Oct 20/89
Page 66
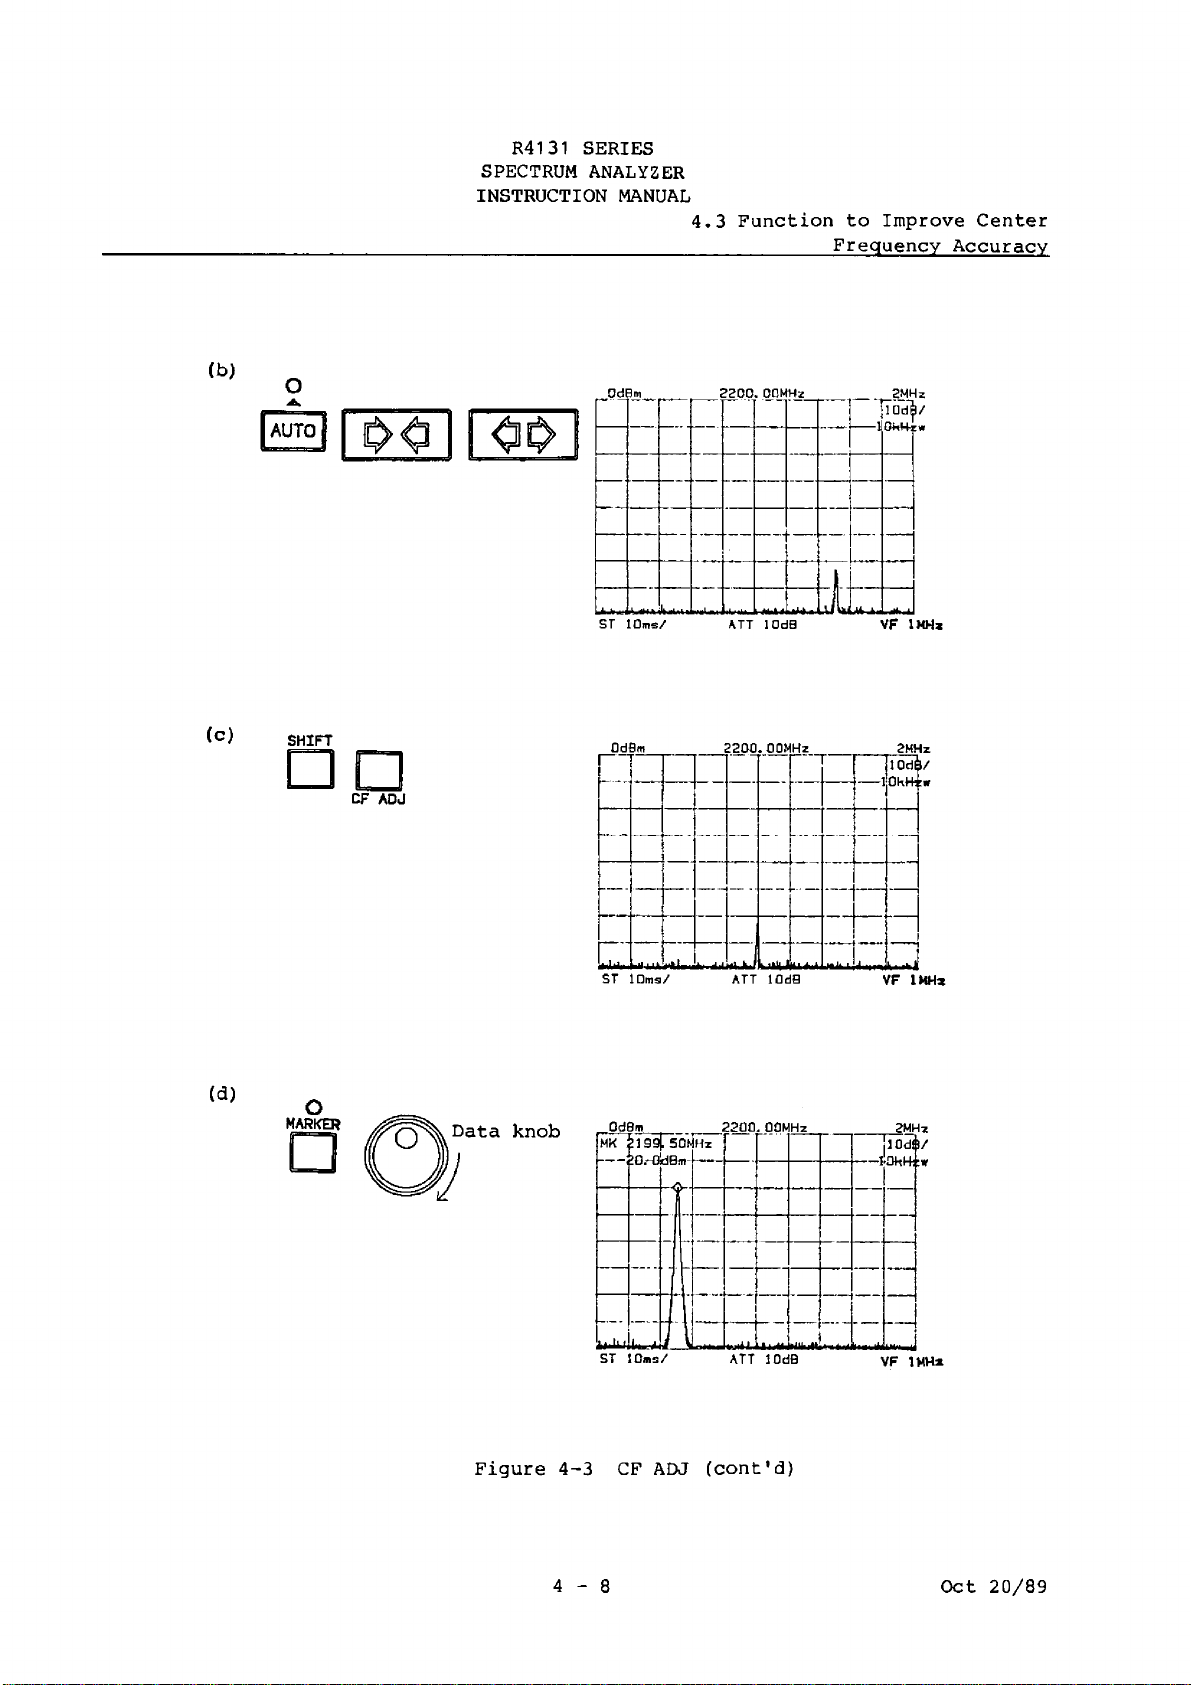
R4131 SERIES
SPECTRUM ANALYZER
INSTRUCTION MANUAL
4.3 Function to Improve Center
Frequency Accuracy
(b)
(c ) SHIFT
O
a
n^ =a i
AUTO
□ □
CF ADJ
OdBm 2200.00MHz 2MHz
ST IOms/ ATT 10d9 VF 1MHz
lOdS/
llQkH-zw
itwVkLW^J.<w.^.
(d)
O
marker
Data knob
Figure 4-3 CF ADJ (cont'd)
4 - 8 Oct 20/89
Page 67
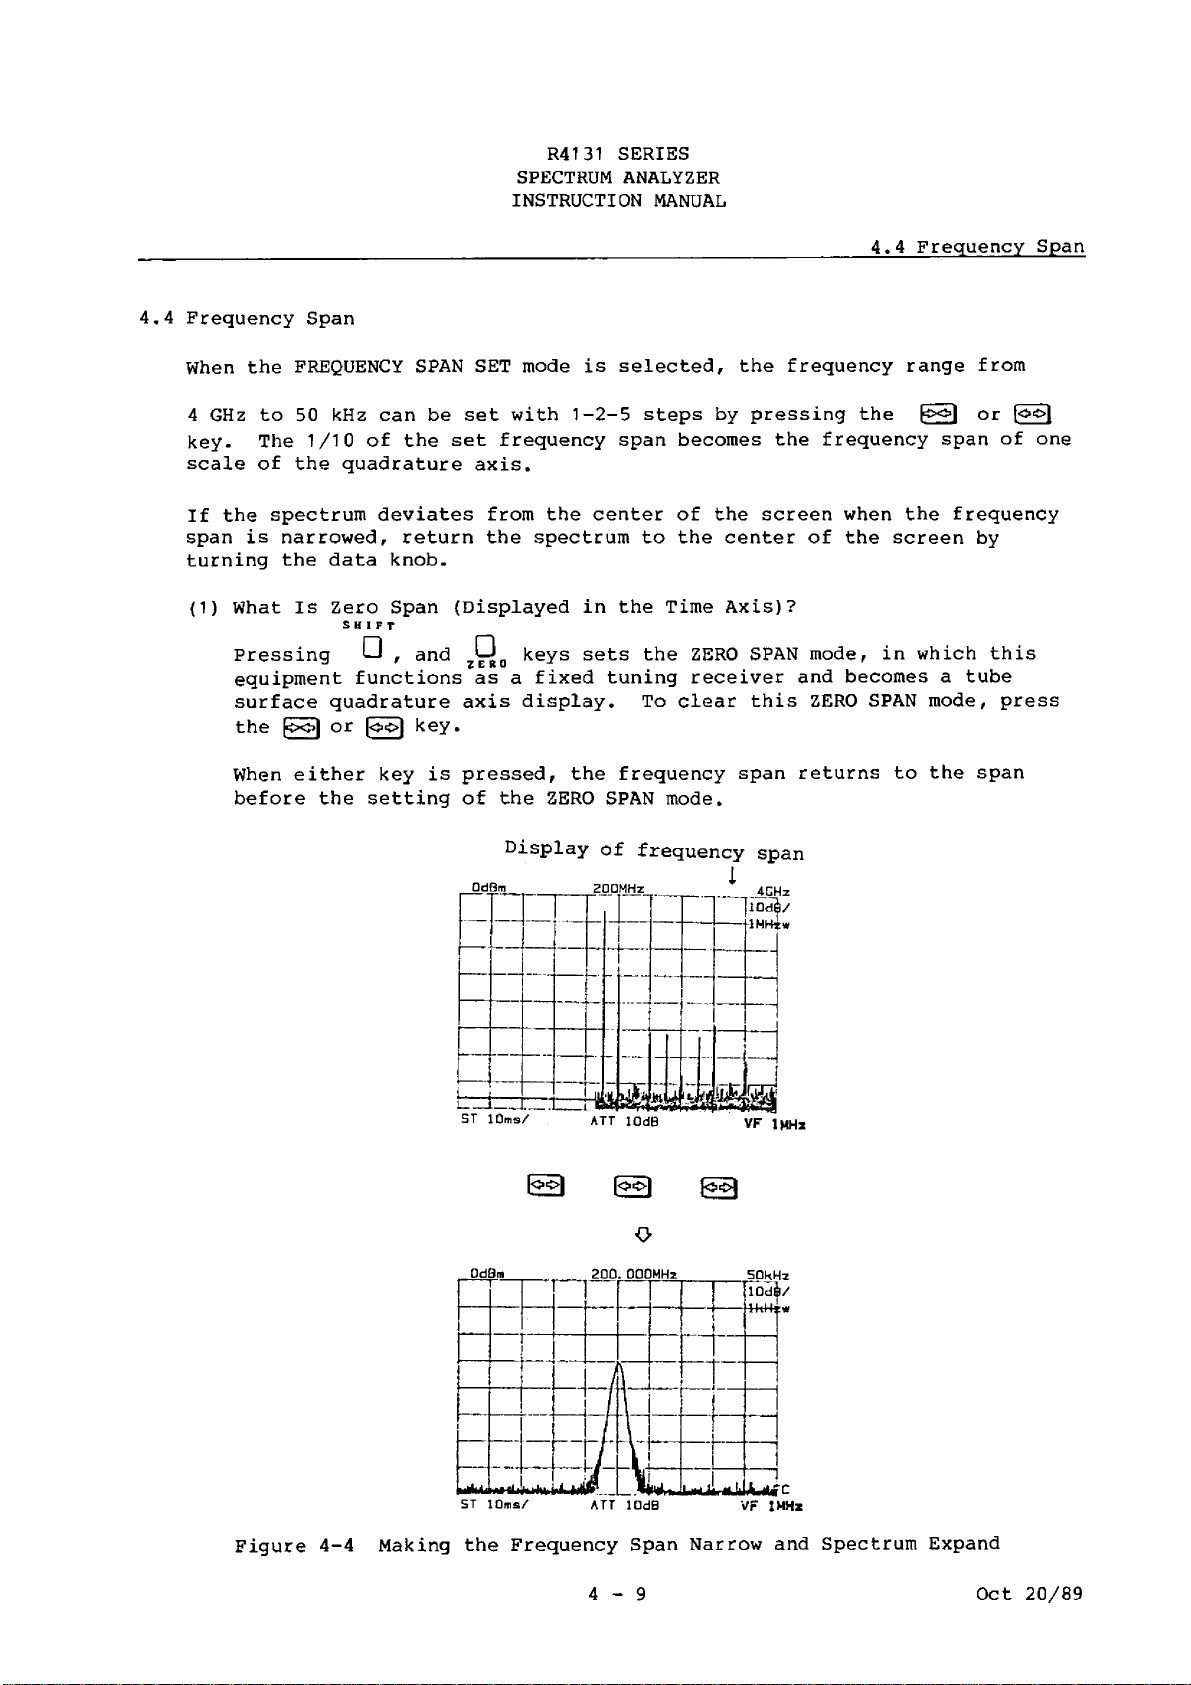
R4131 SERIES
SPECTRUM ANALYZER
INSTRUCTION MANUAL
4.4 Frequency Span
4.4 Frequency Span
When the FREQUENCY SPAN SET mode is selected, the frequency range from
4 GHz to 50 kHz can be set with 1-2-5 steps by pressing the H><H or (o»l
key. The 1/10 of the set frequency span becomes the frequency span of one
scale of the quadrature axis.
If the spectrum deviates from the center of the screen when the frequency
span is narrowed, return the spectrum to the center of the screen by
turning the data knob.
(1) What Is Zero Span {Displayed in the Time Axis)?
SHIFT
Pressing Q , and zQ q keys sets the ZERO SPAN mode, in which this
equipment functions as a fixed tuning receiver and becomes a tube
surface quadrature axis display. To clear this ZERO SPAN mode, press
the [oo| or \<$o\ key.
When either key is pressed, the frequency span returns to the span
before the setting of the ZERO SPAN mode.
Display of frequency span
OdBm
200MHz
1
- ,1 GH z
lOdl/
IMHzw
r± z
ST 10ms/
ATT lOdB
VF 1MHz
Figure 4-4 Making the Frequency Span Narrow and Spectrum Expand
4 - 9
Oct 20/89
Page 68
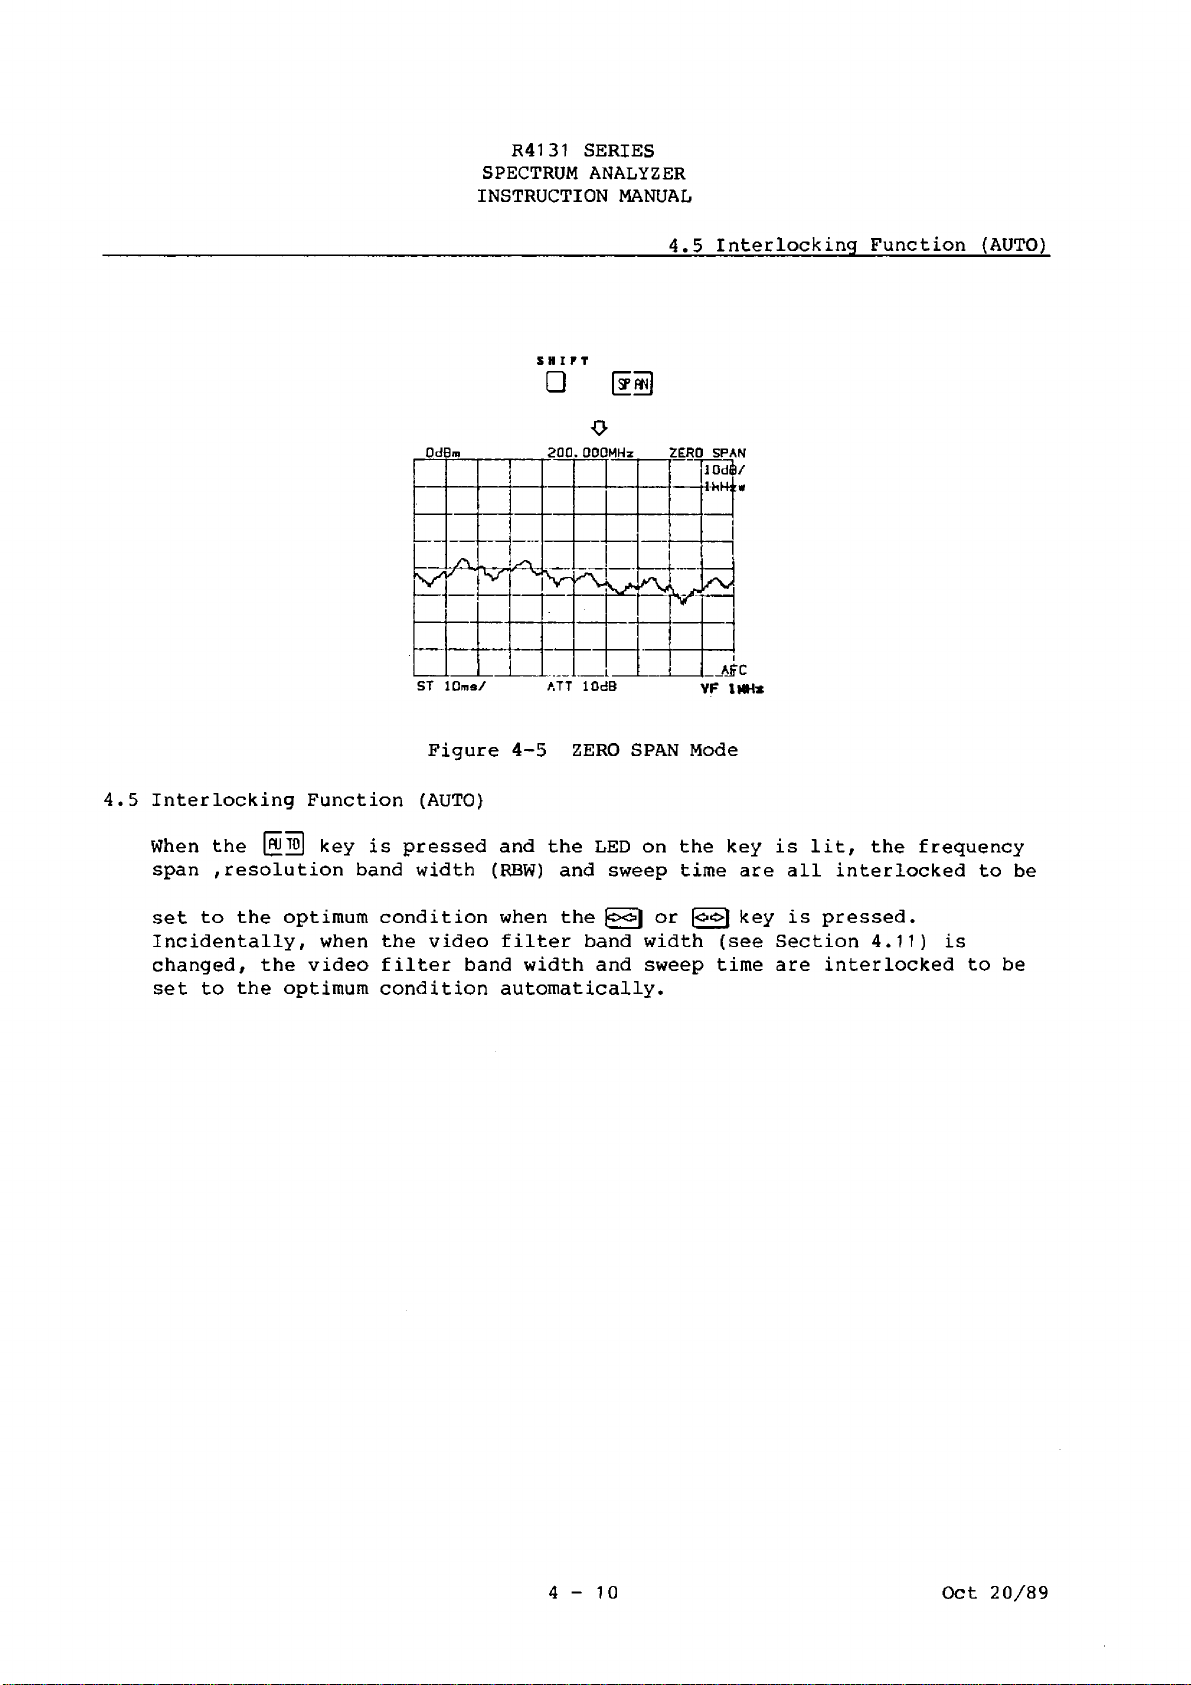
R4131 SERIES
SPECTRUM ANALYZER
INSTRUCTION MANUAL
________________4.5 Interlocking Function (AUTO)
SHIFT
Q
o
Figure 4-5 ZERO SPAN Mode
4.5 Interlocking Function (AUTO)
When the [nto] key is pressed and the LED on the key is lit, the frequency
span ,resolution band width (RBW) and sweep time are all interlocked to be
set to the optimum condition when the )oo| or \<“>\ key is pressed.
Incidentally, when the video filter band width (see Section 4.11) is
changed, the video filter band width and sweep time are interlocked to be
set to the optimum condition automatically.
4-10
Oct 20/89
Page 69
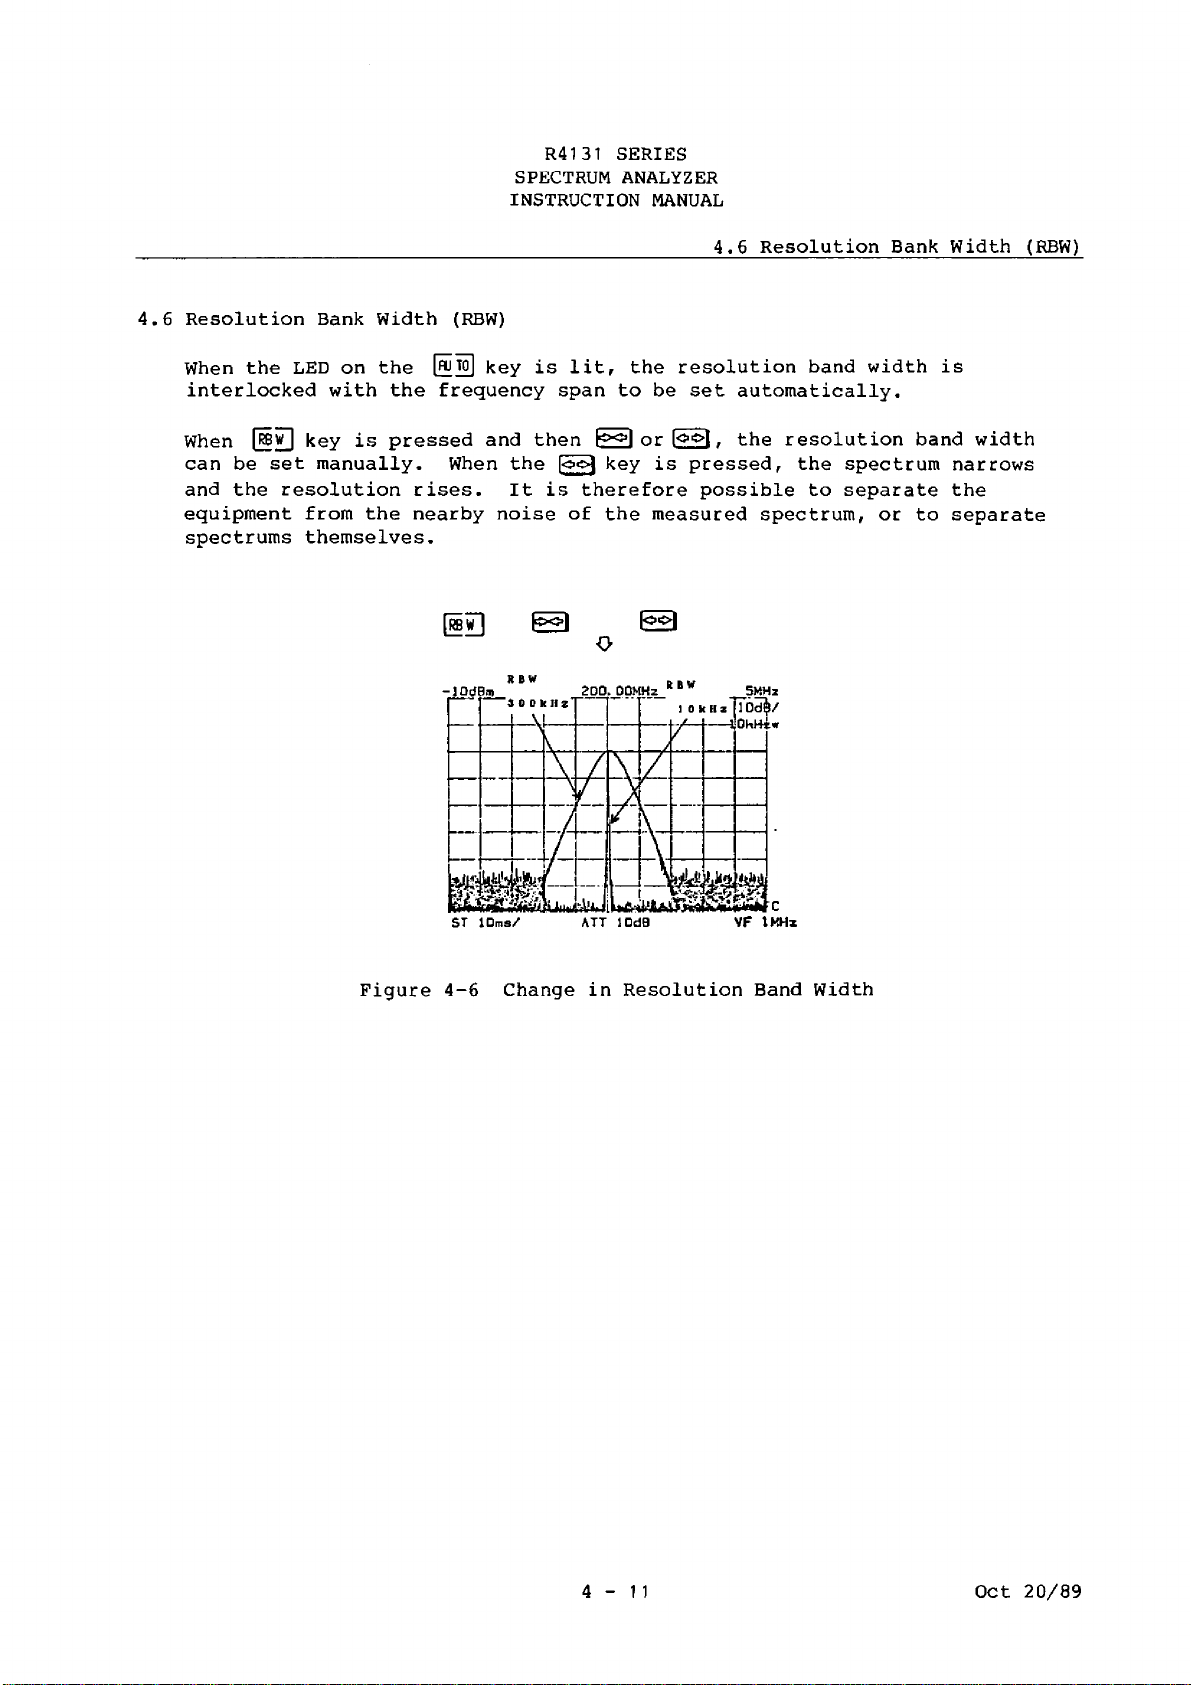
R4131 SERIES
SPECTRUM ANALYZER
INSTRUCTION MANUAL
_________________4.6 Resolution Bank Width (RBW)
4.6 Resolution Bank Width (RBW)
When the LED on the [ Sto] ' key is lit, the resolution band width is
interlocked with the frequency span to be set automatically.
When key pressed and then or [ o o l . the resolution band width
can be set manually. When the key is pressed, the spectrum narrows
and the resolution rises. It is therefore possible to separate the
equipment from the nearby noise of the measured spectrum, or to separate
spectrums themselves.
fii w]
O
ST 10ms/ ATT 10d8 VF IKH *
Figure 4-6 Change in Resolution Band Width
4-11 Oct 20/89
Page 70
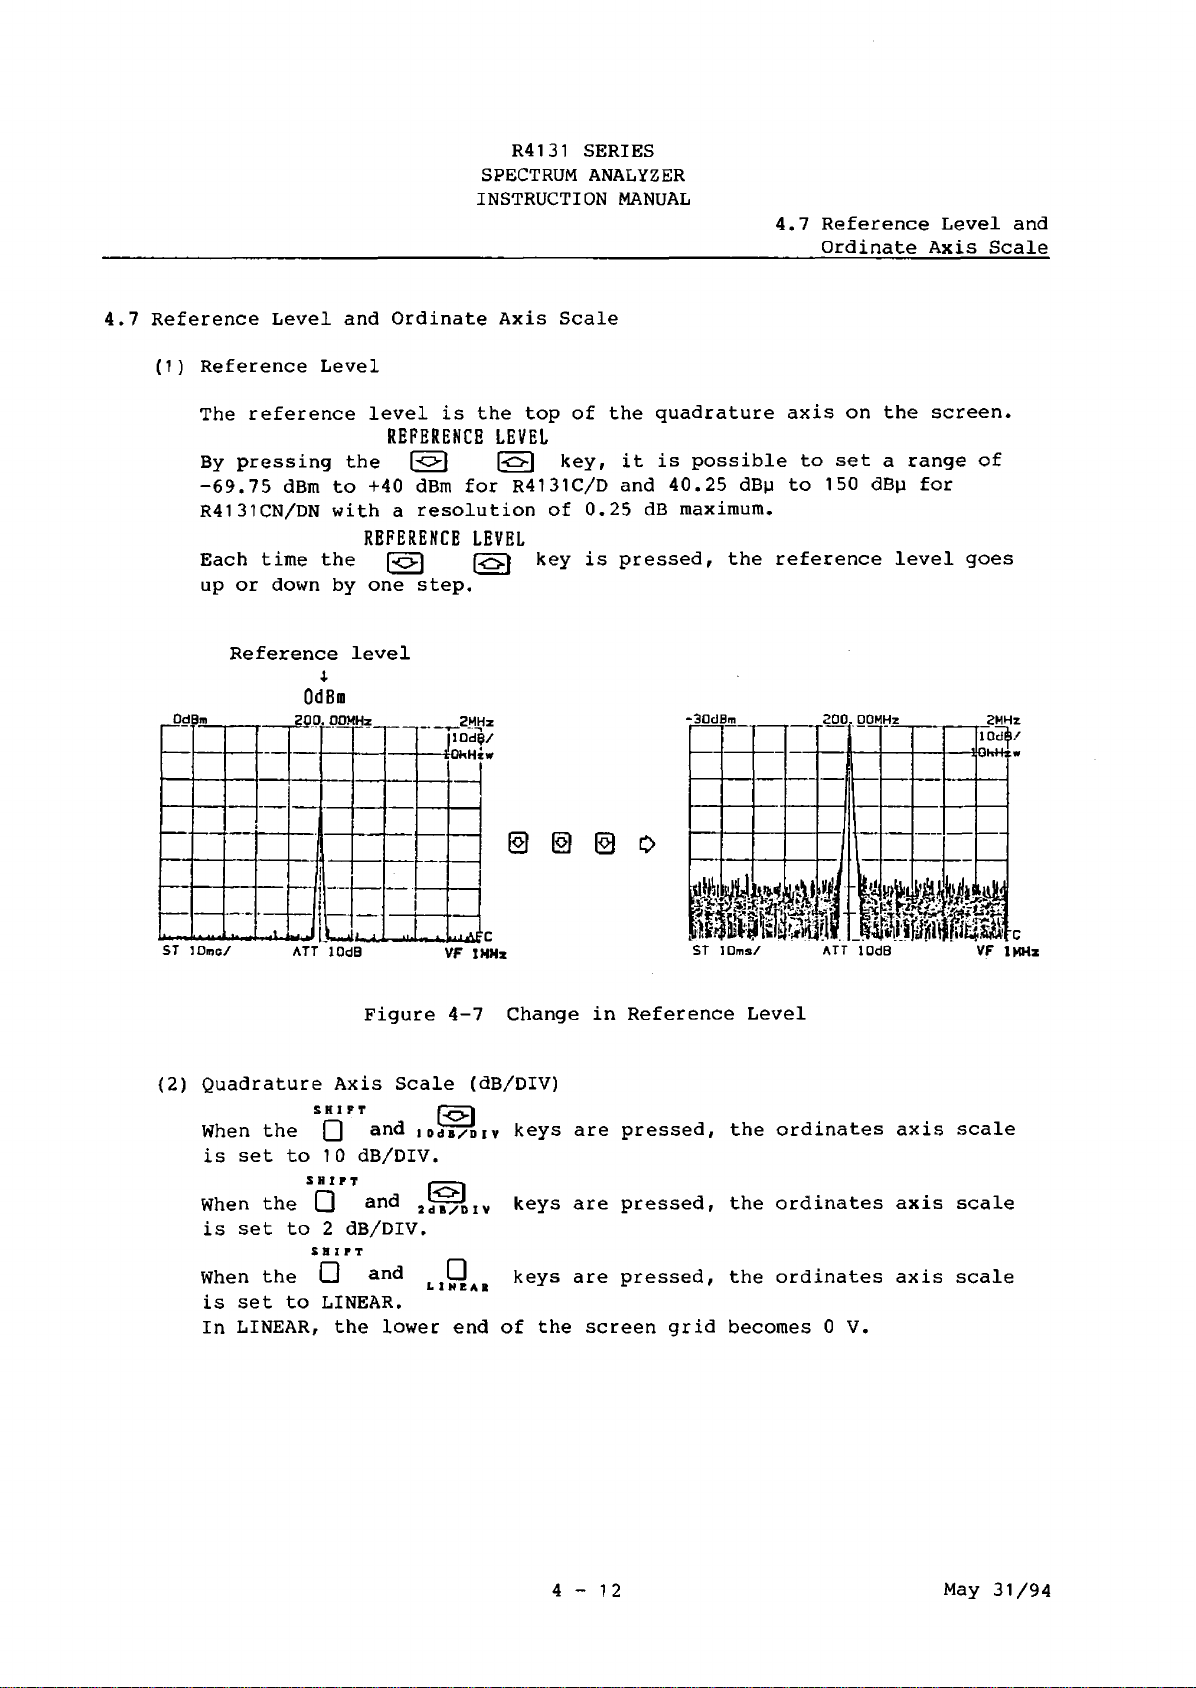
R4131 SERIES
SPECTRUM ANALYZER
INSTRUCTION MANUAL
4.7 Reference Level and Ordinate Axis Scale
(1) Reference Level
The reference level is the top of the quadrature axis on the screen.
REFERENCE LEVEL
By pressing the [p| |o| key, it is possible to set a range of
-69.75 dBm to +40 dBm for R4131C/D and 40.25 dBp to 150 dBp for
R4131CN/DN with a resolution of 0.25 dB maximum.
REFERENCE LEVEL
Each time the (si is) key is pressed, the reference level goes
up or down by one step.
Reference level
OdBm
OdBm
200. OOMHz
2MHz
llOd?/
-tOhHtw
4.7 Reference Level and
Ordinate Axis Scale
ST 10ms/
ATT lOdB
VF IHHz
Figure 4-7 Change in Reference Level
(2) Quadrature Axis Scale (dB/DIV)
When the (_) and idIJTTdiv keys are pressed, the ordinates axis scale
siiFT
is set to 10 dB/DIV.
SHIFT
-
---
1
When the Q and keys are pressed, the ordinates axis scale
is set to 2 dB/DIV.
SHIFT
When the
O and D keys are pressed, the ordinates axis scale
L I NEAR
is set to LINEAR.
In LINEAR, the lower end of the screen grid becomes 0 V.
4-12
May 31/94
Page 71
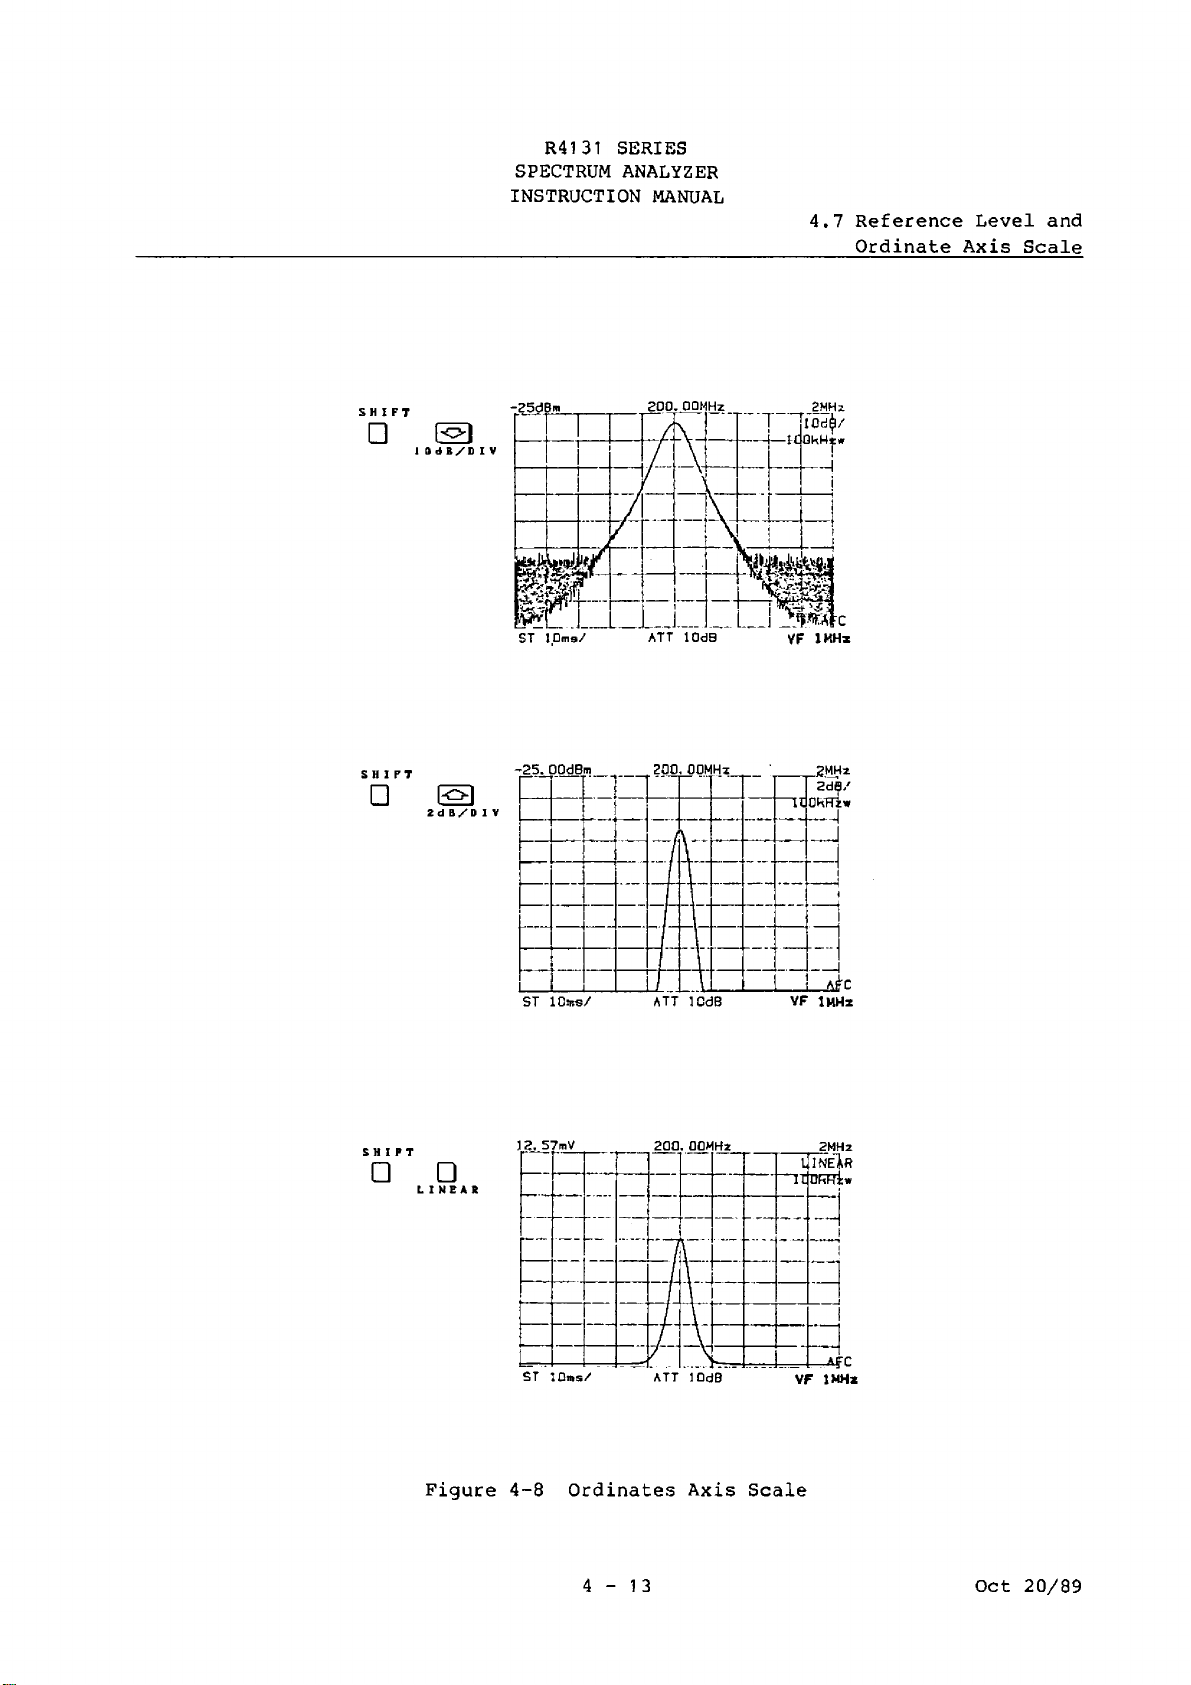
R4131 SERIES
SPECTRUM ANALYZER
INSTRUCTION MANUAL
4.7 Reference Level and
____________________________
Ordinate Axis Scale
SHIFT
□ Pol
1 0 d B/D I V
SHIFT
□ S
ST 1. 0 m s/
200.00MHz
ATT 1OdB
2MHz
VF lH H i
Figure 4-8 Ordinates Axis Scale
4-13
Oct 20/89
Page 72

R4131 SERIES
SPECTRUM ANALYZER
INSTRUCTION MANUAL
4.7 Reference Level and
_________________________ Ordinate Axis Scale
(3) Reference Level Step Width (COARSE/FINE)
e COARSE
XI FINE
When COARSE/FINE is selected in | j {the LED lights when
selected to FINE), the step width becomes as shown in the table below
at 10 dB/DIV and 2 DB/DIV:
Ordinates axis scale (dB/DIV)
Step width
COARSE FINE
10 dB/DIV
2 dB/DIV
10 dB
1 dB
1 dB
0.25 dB
{4) Unit (UNITS)
UNITS
When the Q key is pressed, four types of units, dBm, dBjj, dBji/m (A
through D) and dBmV can be selected in the reference level.
The dBp/m is described in Section 4.18 Measurement of Electric Field
Intensity.
(5) Calibration of Ordinates Axis Level
The ordinates axis level can be calibrated by setting the signal level
to -30 dBm using the variable resistor for calibrating the level
display on the front panel with the calibration signal 200 MHz CAL.
The ordinates axis level may change later in some cases if the
calibration is executed before the equipment has warmed up for 30
minutes.
Care should also be taken because the ordinates axis level can change
when the working temperature changes sharply.
4-14
Oct 20/89
Page 73

R4131 SERIES
SPECTRUM ANALYZER
INSTRUCTION MANUAL
_________________________4.8 RF Input Attenuator
4.8 RF Input Attenuator
INPUT ATTENUATOR
Pressing the 0 r 0 key sets the value of RF ATT between the INPUT
connector and first mixer from 10 DB to 50 dB in steps of 10 dB. It is
usually interlocked with the reference level to be set automatically.
Also, when the equipment is initialized the 10 dB attenuator is always set
for the protection of the first mixer.
t
Input attenuator value
Figure 4-9 Input Attenuator Displaying Position
--------------------------------
The attenuator can be set to 0 dB by pressing the □ - @
keys. However, set it after making sure that there is no excessive
input signal throughout the frequency band width.
CAUTION -------------------------------
SHIFT INPUT ATTENUATOR
Oct 20/89
Page 74

R4131 SERIES
SPECTRUM ANALYZER
INSTRUCTION MANUAL
4.9 Display Line
4.9 Display Line
When the O , keys are pressed, the display line is displayed
. DSPL LINE
on the screen.
The display line is a horizontal cursor line for the level comparison of
waveform. Its data is displayed on the screen as "DL = xx dBm". (See
Figure 4 — 70.) Each time the \ o \ and \ o \ keys are pressed, the display
line can be moved up and down.
As in the reference level, the display line can be changed by selecting
the COARSE/FINE using the
COARSE: 1 DIV
FINE : 1/10 DIV
To erase the display line, press the Q r loc>i again.
Also, the display line is used for the reference line in the normalizing
function and for the level setting in the signal tracking function.
SHIFT
O COARSE A
XX F I N E Q
key with the following step widths:
SHIFT
DSPL LINE
Display
line
Level display
Figure 4-10 Display Line
4-16
Oct 20/89
Page 75
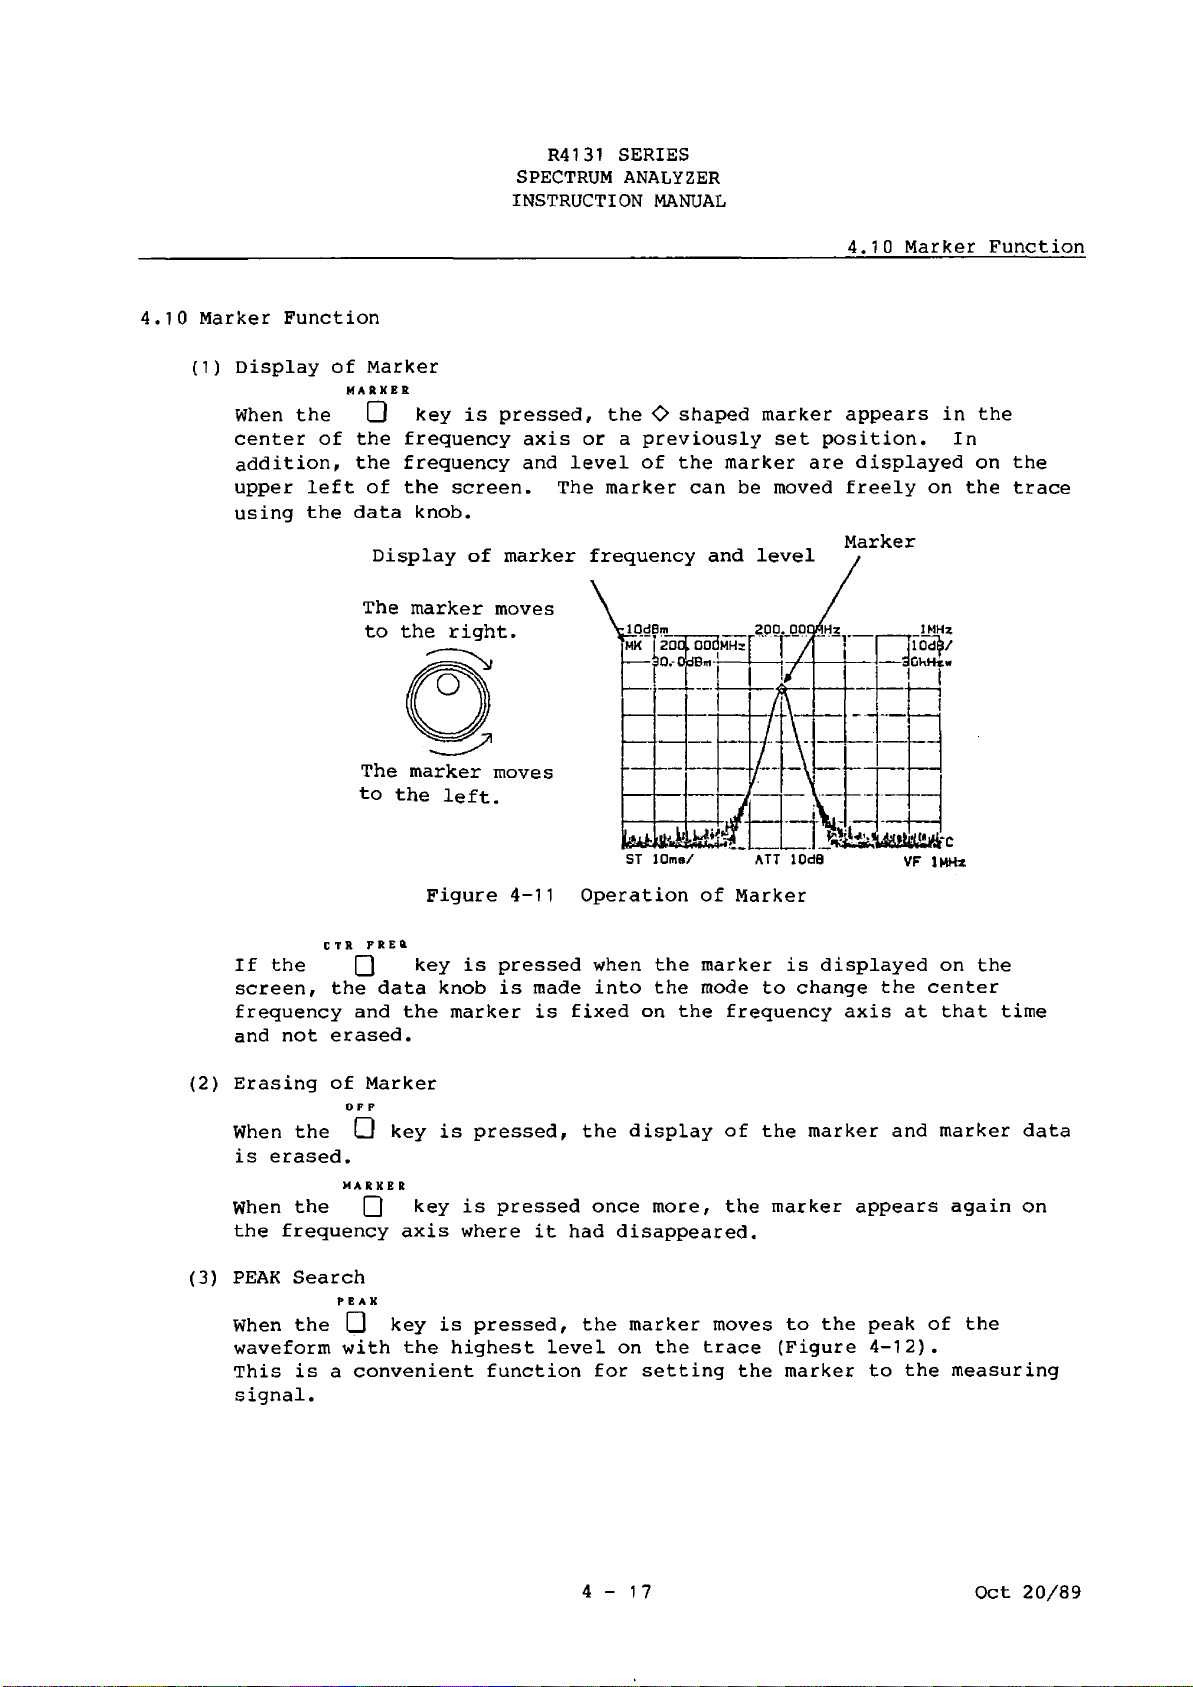
4.10 Marker Function
Display of Marker
(D
MARXES
When the CD key is pressed, the O shaped marker appears in the
center of the frequency axis or a previously set position. In
addition, the frequency and level of the marker are displayed on the
upper left of the screen. The marker can be moved freely on the trace
using the data knob.
The marker moves
R4131 SERIES
SPECTRUM ANALYZER
INSTRUCTION MANUAL
Display of marker frequency and level
to the right.
4.10 Marker Function
Marker
The marker moves
to the left.
Figure 4-11
ST 10ms/ ATT lOdB
Operation of Marker
VF 1MHz
CTR F R E ft
If the Q key is pressed when the marker is displayed on the
screen, the data knob is made into the mode to change the center
frequency and the marker is fixed on the frequency axis at that time
and not erased.
(2) Erasing of Marker
OFF
When the Q key is pressed, the display of the marker and marker data
is erased.
MARKER
When the Q key is pressed once more, the marker appears again on
the frequency axis where it had disappeared.
(3) PEAK Search
PEAK
When the Q key is pressed, the marker moves to the peak of the
waveform with the highest level on the trace (Figure 4-12).
This is a convenient function for setting the marker to the measuring
signal.
4-17 Oct 20/89
Page 76

R4131 SERIES
SPECTRUM ANALYZER
INSTRUCTION MANUAL
-1OdBm 370MHz 500MHz
PEAK
□
O
-1OdBm 370MHz 500MHz
4.10 Marker Function
Figure 4-12 PEAK Search
(4) MarKeR— ► Center Frequency
MK I)—► C F
When the Q key is pressed, the marker and spectrum on which the
marker is present move to the center of the screen to coincide with
the center frequency. (Figure 4-13)
The spectrum can also be moved to the center of the screen by setting
the center frequency using the known data. When this key is used, the
spectrum can be moved to the center very quickly.
4-18
Oct 20/89
Page 77

R4131 SERIES
SPECTRUM ANALYZER
INSTRUCTION MANUAL
4.10 Marker Function
-20dBm
1610.0MHz
MK R— r C F
50MHz
.....I._. L_ Afc
VF lOhHz
□
o
-20dBm __ 1600.0MHz _ __ 50MHz
[m k 1 sooj. OMhiz | 1 I f I TlQ d f e /
r -57i 2ttBrn j -
---
- j -' I...r-3qOKH*w
L —
ST 10ms/
Figure 4-13 MarKeR— ►Center Frequency
(5) SIGnal TRacK
SHIFT
When the Q and Q keys are pressed, the signal tracking
function operates.
When this function is used, the frequency with the highest peak on the
screen is automatically set as the center frequency each time the
sweeping is done and when adopted makes it possible to always seize
the signal in the center of screen, even if the signal drifts.
The signal tracking function of this equipment merely performs the
PEAK searching on the screen and repeats it for each sweeping as
MKR CF. However, the PEAK searching level can be selected by the
display line. It is therefore possible to track only the signal which
is higher in level than the display line.
4-19
Oct 20/89
Page 78

R4131 SERIES
SPECTRUM ANALYZER
INSTRUCTION MANUAL
4.10 Marker Function
By this, the center frequency never flies off due to noise without
tracking the signal, even if the input signal is missed temporarily.
SHIFT
Press the 0 and
on the screen.
EE)
DSPL LINE
keys, and the display line is displayed
Then, move the display line using the 10 dVB/DIV and 2 dB/DIV keys to
determine the level for PEAK searching.
SHIFT
When the ^ and sig^trk keys are pressed, the signal above the value
determined by the display line is tracked. {See Figure 4-14.)
Even if the display line is erased, the signal tracking is still
carried out with the value determined earlier. To clear the signal
tracking function, press the Q and Q keys over again, or
MARKER OFF SIC TDK
SHIFT
press the Q KEY.
DSPL LINE
I Od B/DI V 2d B/DI V
□ □
SIC T R X
-lOdBm
MK 200
»Q=-0
JiM
si n i
rt[_
•6 5 d
ST 10ms/
. 00K
TRAr K
20 0.POMHz 2MHz
Hz
—
i
r
i
U U j J
ATT 10d9
UAL]JAM M U'
--
10d4
— -
VF 1MHz
Figure 4-14 SIGnal TRacK
(6) MARKER PAUSE
After making the marker display on the screen, press the Q and
MARKER
TIHE/DIV MARKER TIME/DIV
J5) keys, or □ and (g keys in succession, then the MARKER
PAUSE function operates.
This function stops the sweeping temporarily at the position of the
marker. Although the stop time is 1 sec at first under the MARKER
PAUSE status, it can be changed from 1 sec, in steps of 0.5 sec. It
can be set in steps of 0.5 sec between 0 and 10.0 sec. (See
Figure 4-15).
To clear this MARKER PAUSE function, set the stop time to 0 sec by
MASKER TIME/DIV MARKER OFF
repeatedly pressing the Q and (£) keys, or press the Q
key.
4-20
Oct 20/89
Page 79

R4131 SERIES
SPECTRUM ANALYZER
INSTRUCTION MANUAL
4.10 Marker Function
OdBm
MK j 200t OMhi z
O ^O df ir tr
20 0. 0MHz
20HHz
Todl/
MKPAUSe 1.0s
MARKER TIME/DIV
□ • a
ST 10ms/ ATT lOdB
«
Figure 4-15 MARKER PAUSE
(7) Measurement of NOISE/Hz
SHIFT
After displaying the marker on the screen, press the Q and [mra]
keys in succession, then the NOISE/Hz function operates.
This function can measure the rms of the noise level which is
normalized by the noise voltage band width of 1 Hz at the marker
position.
n o T S T 7 h *
The display detection mode at this time is automatically set to the
SAMPLE DET. (See Figure 4-16.)
SHIFT
To clear the NOISE/Hz function, press the Q and t!! ijD keys again.
N 0 ISE/K z
SHIFT
Q . GSto)
noTST/h z
Figure 4-16 Setting of NOISE/Hz
4-21
Oct 20/89
Page 80

R4131 SERIES
SPECTRUM ANALYZER
INSTRUCTION MANUAL
4.11 Video Filter Band Width (VIDEO FiLTeR)
4.11 Video Filter Band Width (VIDEO FiLTeR)
Each time the g) key is pressed, the video filter band width can be
VIDEO
FLTR
Q
changed with seven steps of 1 MHz — ^300 kHz —— 7 00 kHz ► 10 kHz ►
1 kHz -— " 1 00 Hz — "■ 1 0 Hz.
Also, the video filter band width is interlocked with the sweep time to be
set automatically to the optimum sweep time.
When the video filter band width is made smaller step by step, the signal
which is buried in noise can be searched for, but it takes a long sweep
time.
Video filter band width
Figure 4-17 VIDEO FiLTeR
t
4-22 Oct 20/89
Page 81
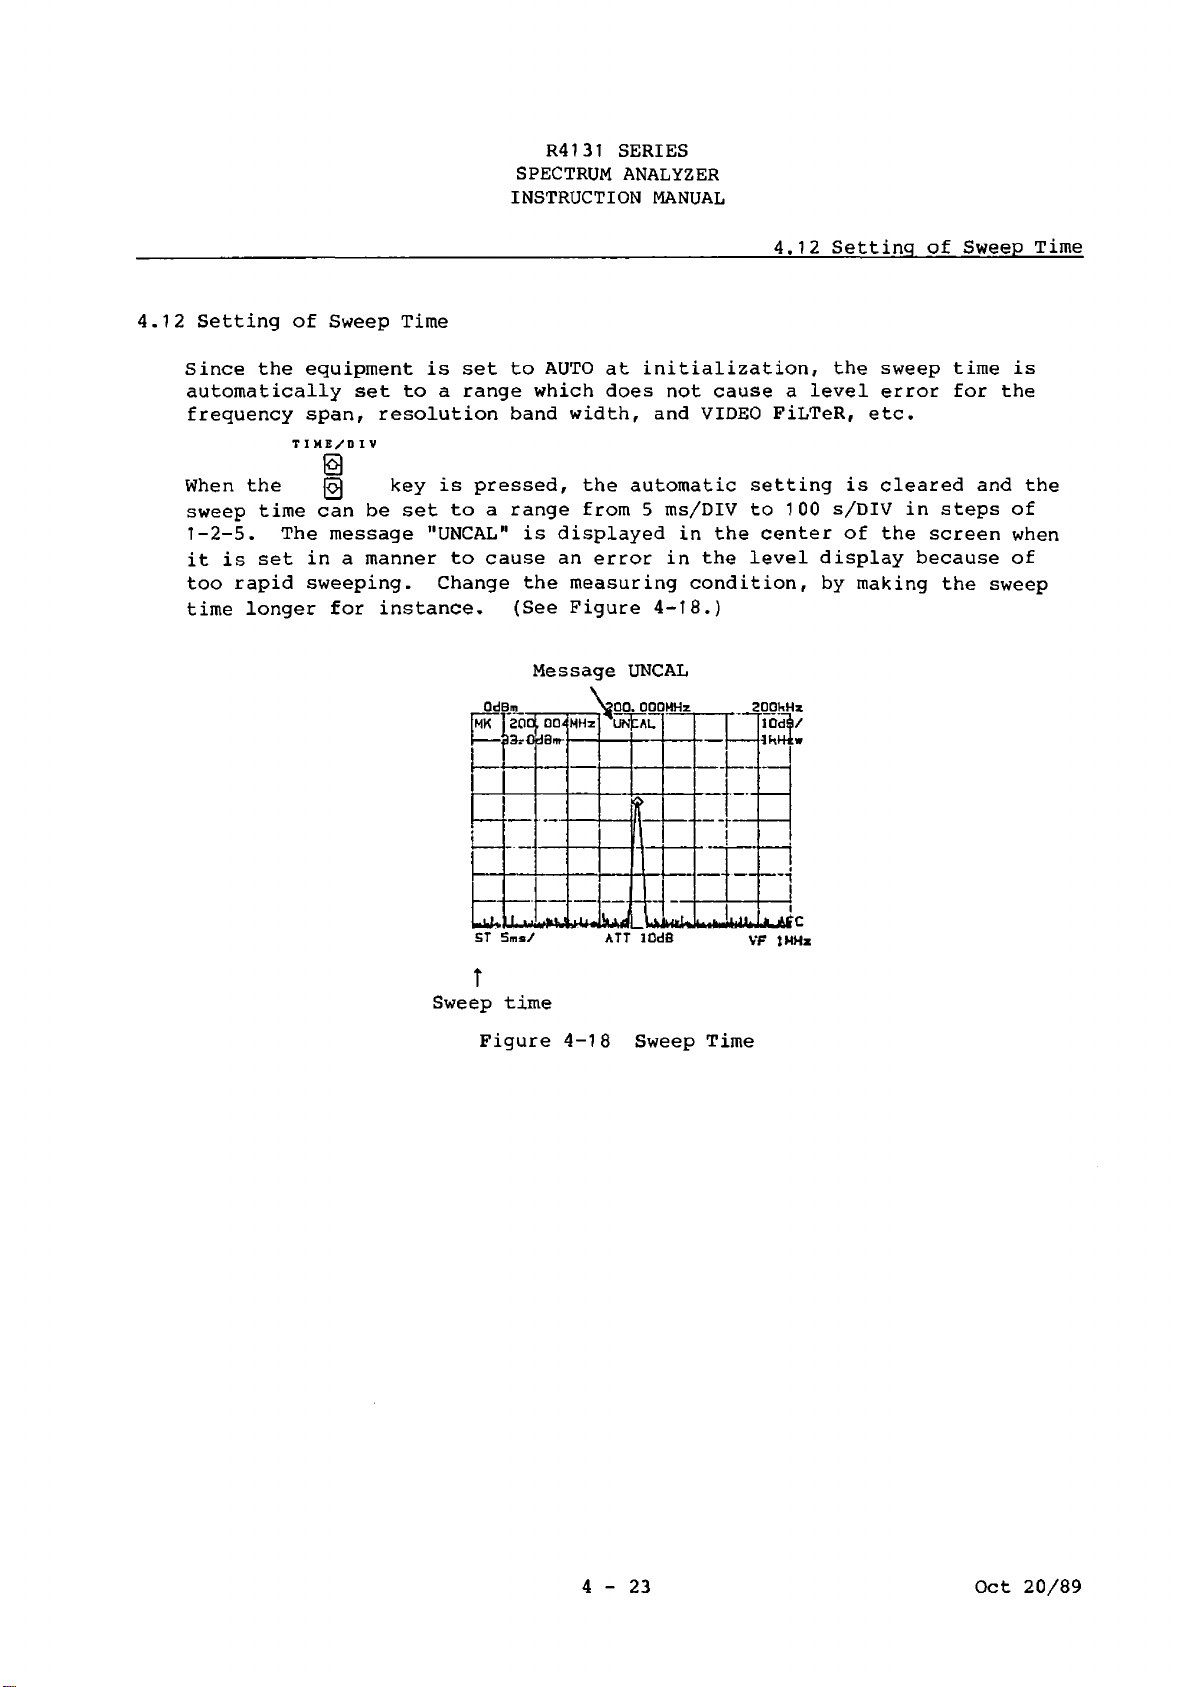
R4131 SERIES
SPECTRUM ANALYZER
INSTRUCTION MANUAL
4.12 Setting of Sweep Time
4.12 Setting of Sweep Time
Since the equipment is set to AUTO at initialization, the sweep time is
automatically set to a range which does not cause a level error for the
frequency span, resolution band width, and VIDEO FiLTeR, etc.
TI ME/D I V
sweep time can be set to a range from 5 ms/DIV to 1 00 s/DIV in steps of
1-2-5. The message "UNCAL" is displayed in the center of the screen when
it is set in a manner to cause an error in the level display because of
too rapid sweeping. Change the measuring condition, by making the sweep
time longer for instance. (See Figure 4-18.)
Message UNCAL
OdB m .
MK 200.00j MHz
133rOdBnr
ST 5ms/
\^00.
[ DO. 000MH z .
LIN EA L
ATT lOdB VF 1MHz
r
Sweep time
Figure 4-18 Sweep Time
SQOkHz
10dS/
IhHiw
4-23
Oct 20/89
Page 82

R4131 SERIES
SPECTRUM ANALYZER
INSTRUCTION MANUAL
4.13 Selection of Sweep Mode/Trigger Mode
4.13 Selection of Sweep Mode/Trigger Mode
FREE RUN
LINE
VIDEO
TRIGGER
Each time the SINGLEQ J,Q keys are pressed, the TRIGGER mode is
select in the order of FREE R UN— >• LINE— *- VIDEO— ► SINGLE. The LED
corresponding to the selected mode will then light.
FREE RUN:
Line :
VIDEO :
SINGLE :
This is a continuous sweep mode to automatically repeat the
sweeping internally.
This is a mode to repeat the sweeping in synchronism with the
AC power supply frequency.
Triggered by the waveform which detected the IF signal.
START
/'RESET
This is a single sweep mode and controlled by the Q key.
START
/RESET
When the Q key is pressed in the single sweep mode, the
sweeping is executed once.
START
When the /R^ ET key is pressed in the middle of sweeping, the
sweeping is reset for the next single sweeping. This function
is used to retry sweeping during screen rewriting when the
sweep time is long.
4-24
Oct 20/89
Page 83
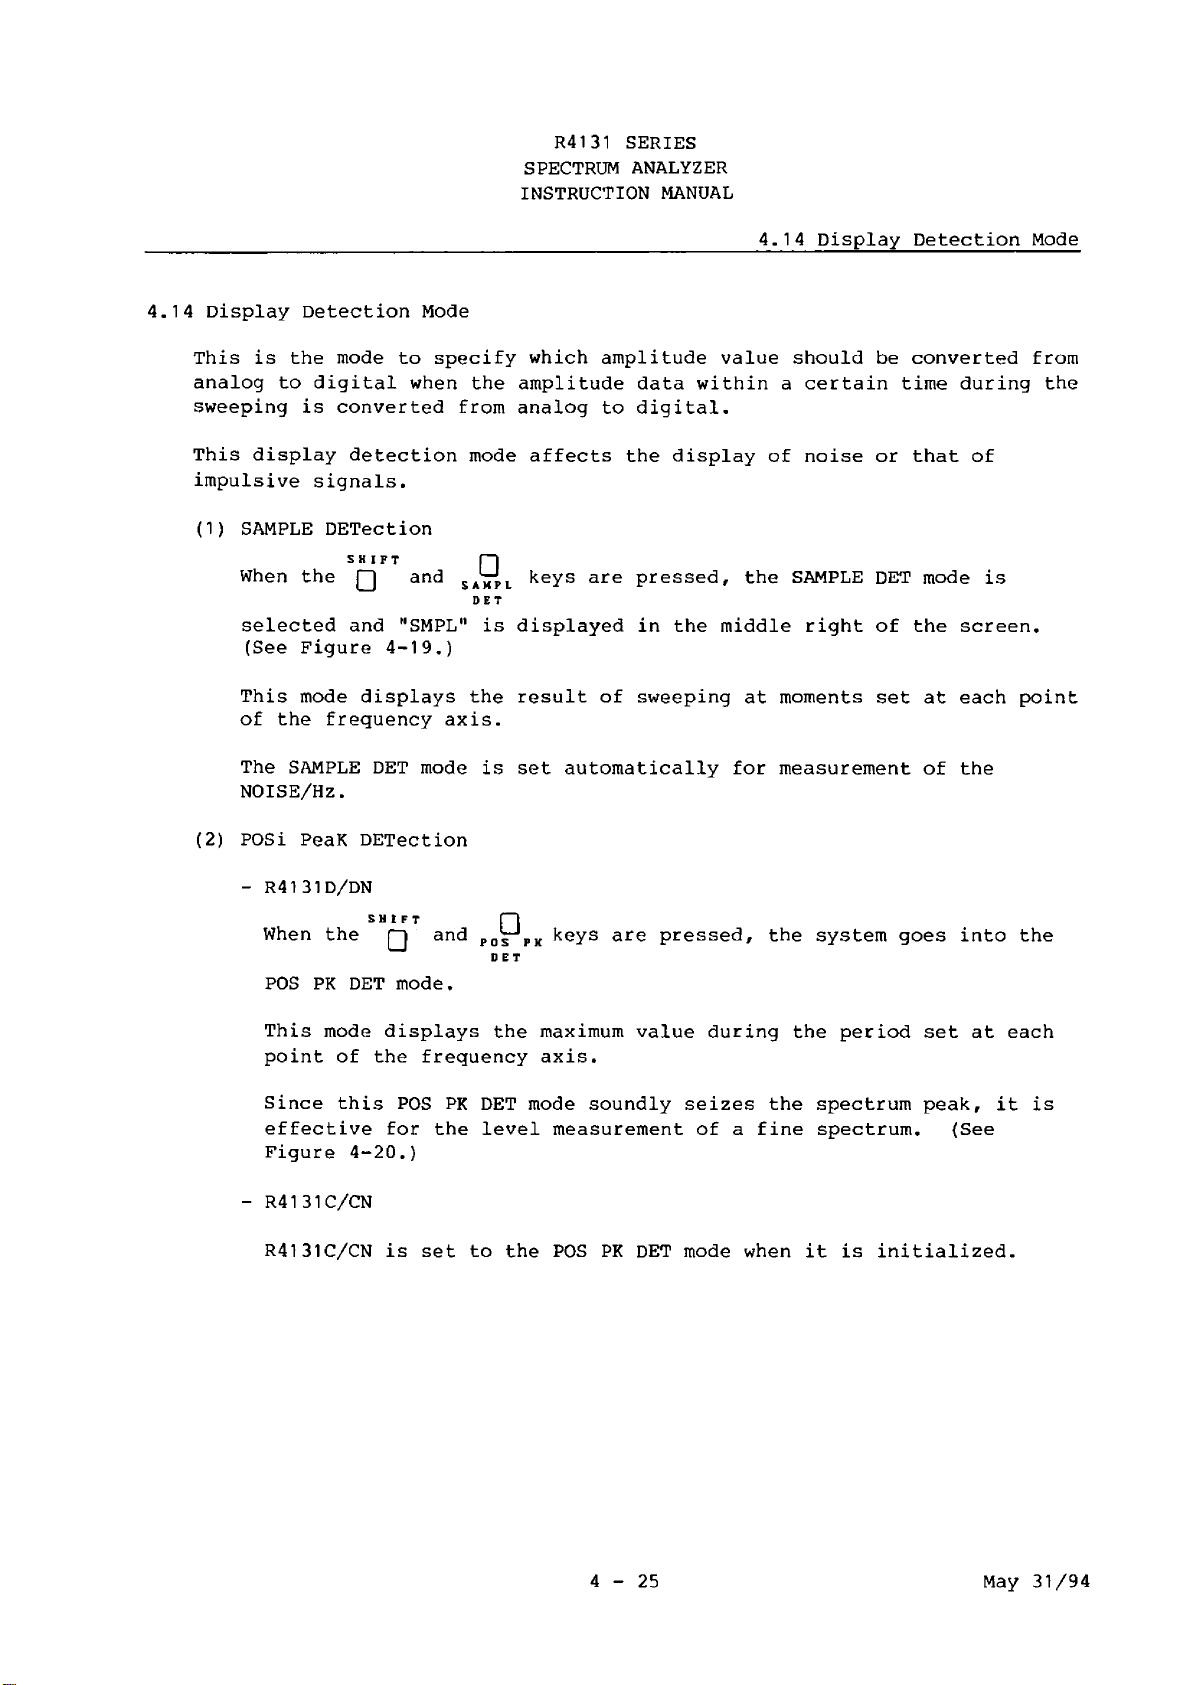
R4131 SERIES
SPECTRUM ANALYZER
INSTRUCTION MANUAL
____________________4.14 Display Detection Mode
4.14 Display Detection Mode
This is the mode to specify which amplitude value should be converted from
analog to digital when the amplitude data within a certain time during the
sweeping is converted from analog to digital.
This display detection mode affects the display of noise or that of
impulsive signals.
(1) SAMPLE DETection
SHIFT r“|
When the Q and SA^j>L keys are pressed, the SAMPLE DET mode is
DET
selected and "SMPL" is displayed in the middle right of the screen.
(See Figure 4-19.)
This mode displays the result of sweeping at moments set at each point
of the frequency axis.
The SAMPLE DET mode is set automatically for measurement of the
NOISE/Hz.
(2) POSi PeaK DETection
- R4131D/DN
SHIFT pi
When the q and POs PK keys are pressed, the system goes into the
DET
POS PK DET mode.
This mode displays the maximum value during the period set at each
point of the frequency axis.
Since this POS PK DET mode soundly seizes the spectrum peak, it is
effective for the level measurement of a fine spectrum. (See
Figure 4-20.)
- R4131C/CN
R4131C/CN is set to the POS PK DET mode when it is initialized.
4-25
May 31/94
Page 84

R4131 SERIES
SPECTRUM ANALYZER
INSTRUCTION MANUAL
(3) NORMAL DETection (POSI/NEGA DET)
- R4131D/DN
4.14 Display Detection MQde
DET
S AMP L
DET
□
When
POSI/NEGA PK DET mode.
This mode displays the maximum value or minimum value of the periods
set at each point of the frequency axis. (See Figure 4-21.)
R4131D/DN is set to the NORMAL (POSI/NEGA) DET mode when it is
initialized.
- R4131C/CN
When the q and N0^ AL keys are pressed, the system enters the POSI
PK DET mode.
the g and N07mAL keys are pressed, the system enters the
SHIFT
□ □
Figure 4-19 SAMPLE DET (R4131)
□ □
POS PK
DET
Figure 4-20 POSI PK DET (R4131)
4-26 May 31/94
Page 85

R4131 SERIES
SPECTRUM ANALYZER
INSTRUCTION MANUAL
4.14 Display Detection MOde
Figure 4-21 NORMAL DET (R4131B/BN/D/DN)
4-27
Oct 20/89
Page 86

R4131 SERIES
SPECTRUM ANALYZER
INSTRUCTION MANUAL
4.15 Selection of Trace Mode
4.15 Selection of Trace Mode
The trace memory of this equipment provides two memories. One is the
WRITE memory which rewrites the data for each sweeping the other is the
VIEW memory which stores the waveform for any screen of the WRITE memory.
The waveform of the WRITE memory or VIEW memory can be called, or both can
be displayed on the screen to make a two-screen display.
WKITE
□
MAX
STORE
□
VIEW
□
(1) WRITE
WRITE
When the Q key is pressed, the memory contents are rewritten at
each sweeping.
The waveform of the WRITE mode is rewritten for each sweeping. The
trace mode at initialization is set to this WRITE mode.
(2) STORE
STORE
When the Q key is pressed, the waveform data written in the WRITE
mode at that time is held in the memory. The screen displays the
waveform data held in the memory and then holds still. In other
words, the system enters the VIEW mode and the leftward LED of the
VIEW
□ key lights.
(3) VIEW
VIEW
The Q key is used to call the waveform stored in the WRITE memory
in the WRITE mode. Since the stored waveform data keeps its contents
until new waveform data is stored again in the WRITE mode, this
function is convenient for the comparative survey between the WRITE
waveform after a change in setting conditions and the stored waveform
data (the VIEW data).
4-28 Oct 20/89
Page 87

R4131 SERIES
SPECTRUM ANALYZER
INSTRUCTION MANUAL
4.15 Selection of Trace Mode
(4) WRITE and VIEW (2-screen display)
When the display data, which is rewritten each sweeping by means of
WRITE STORE
the Q key, is stored and the Q key is pressed again, both
VIEW WRITE
leftward LEDs of the Q and Q keys light and the stored waveform
data and the sweep data in the WRITE mode are displayed in two
screens. To return the two screens to a single screen, erase the
unnecessary screen using the "q 76 or Vq " key.
The following describes how to use this function taking the
comparative measurement of the secondary harmonic level as an example.
Operating procedure
(?) Input the signal of CALibration OUTput, 200 MHz and -30 dBm, of
this equipment,
(2) Set as follows:
Center frequency 200 MHz
Reference level -30 dBm
Frequency span 10 MHz
In addition, set the POS PK DET to make it easier to compare two
screens.
(3) Set the spectrum of the measured signal to the center of the
screen (Figure 4-22).
-3QdBm
20 0. QOMHz
10MHz
jlO d b/
-30 k H *w
' -J
' -I
ST lOtnsa/
ATT lOdB
Figure 4-22 Setting the Measured Signal
to the Center Frequency
STORE
(4) Press the Q key.
Then, the trace mode becomes VIEW. The sweeping stops, the last
sweep waveform is displayed, and the screen stands
still. This data is stored in the internal memory.
WRITE
(5) Press the Q key.
Then, a new WRITE waveform data is displayed together with the
waveform of the memory (Figure 4-23).
_. .a £c
VF 1KH*
4-29
Oct 20/89
Page 88

R4131 SERIES
SPECTRUM ANALYZER
INSTRUCTION MANUAL
□ □
4.15 Selection of Trace Mode
Figure 4-23 Two-screen Display with a New WRITE Waveform
Set the center frequency to 400 MHz and make the secondary
harmonic wave move to the center of the screen.
Then, the measured value can be read from the difference in
display between the two screens. (Figure 4-24)
-30d8m 401.00MHz
Figure 4-24 Two-Screen Display of Secondary Harmonic
wave and STORE Waveform
10MHz
4-30
Oct 20/89
Page 89
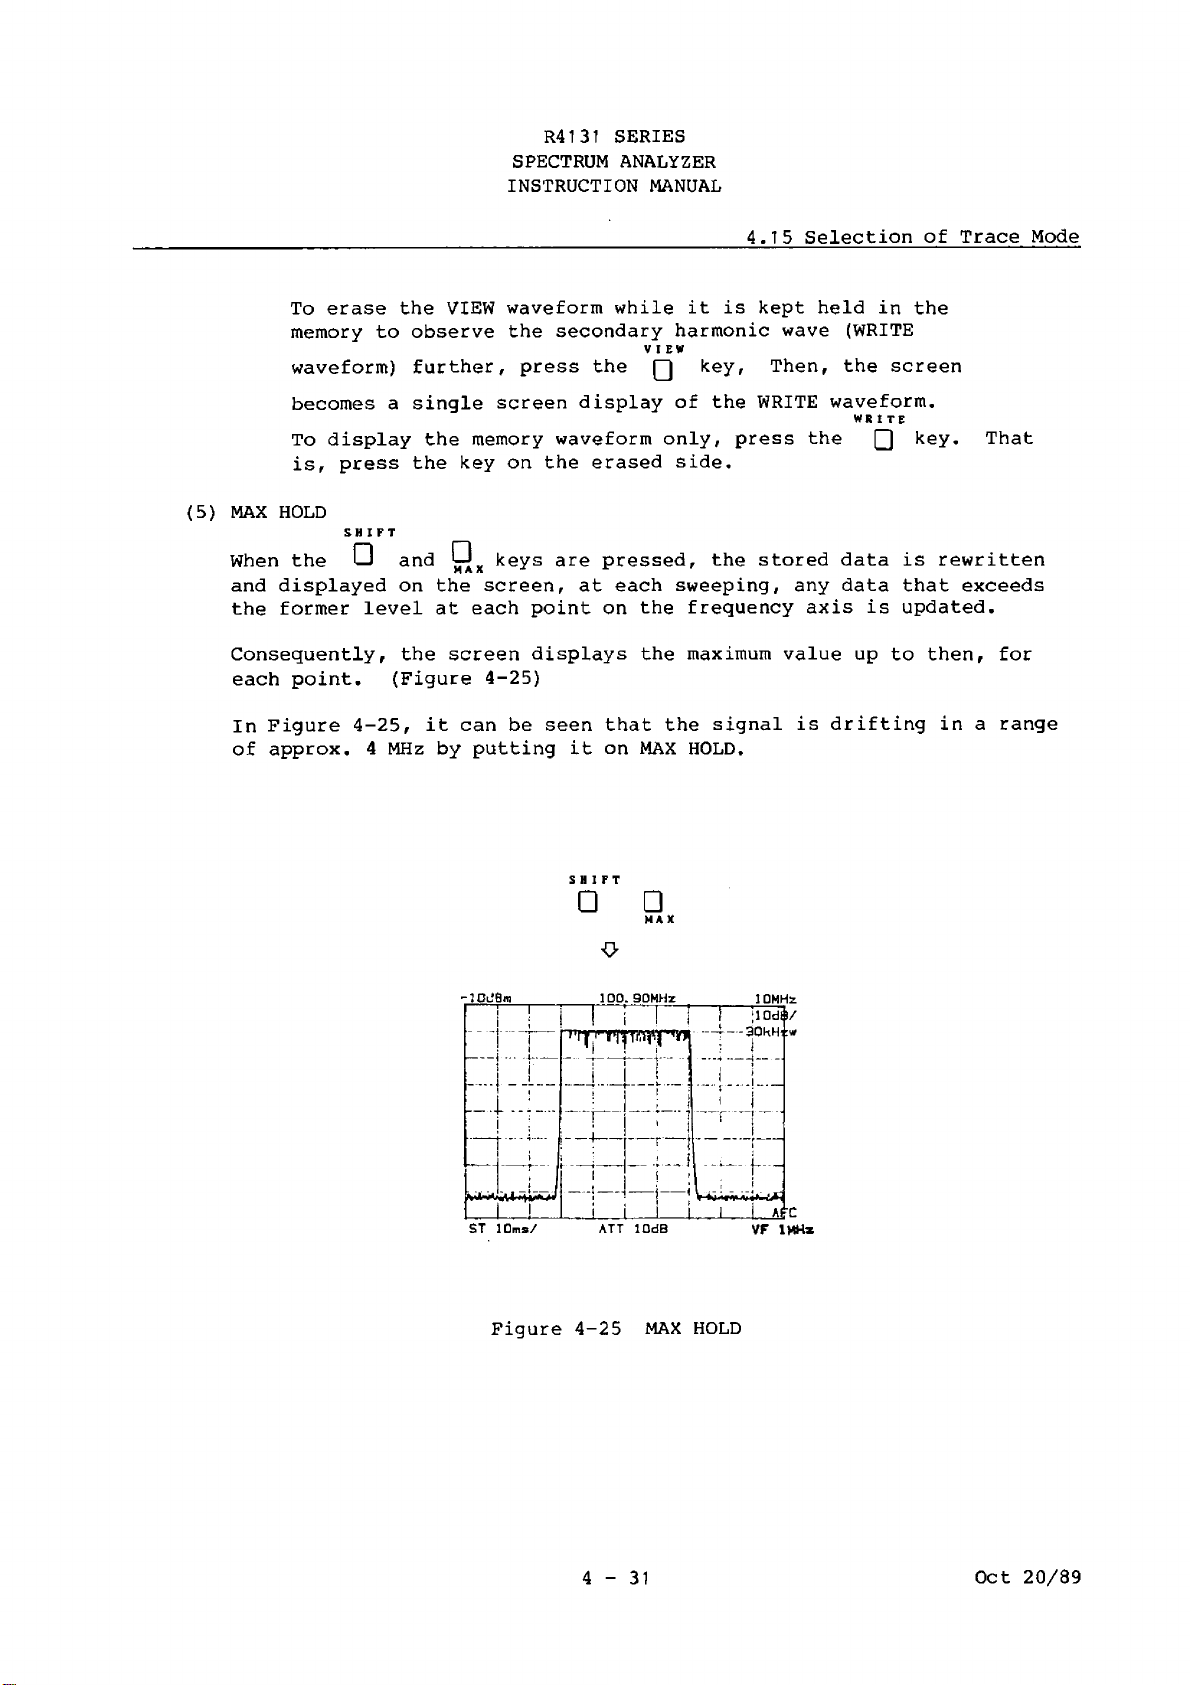
R4131 SERIES
SPECTRUM ANALYZER
INSTRUCTION MANUAL
4.75 Selection of Trace Mode
To erase the VIEW waveform while it is kept held in the
memory to observe the secondary harmonic wave (WRITE
VIEW
waveform) further, press the \ J key, Then, the screen
becomes a single screen display of the WRITE waveform.
WRITE
To display the memory waveform only, press the Q key.
is, press the key on the erased side.
(5) MAX HOLD
When the 0
and Q x keys are pressed, the stored data is rewritten
and displayed on the screen, at each sweeping, any data that exceeds
the former level at each point on the frequency axis is updated.
Consequently, the screen displays the maximum value up to then, for
each point. (Figure 4-25)
In Figure 4-25, it can be seen that the signal is drifting in a range
of approx. 4 MHz by putting it on MAX HOLD.
□ □
MAX
V
That
-lOJBm
ST 30ms/ ATT lOdB
10 0 . 90MHz
Figure 4-25 MAX HOLD
10MHz
VF 1MH*
4-31
Oct 20/89
Page 90

R4131 SERIES
SPECTRUM ANALYZER
INSTRUCTION MANUAL
4.15 Selection of Trace Mode
WRITE
When the Q key is pressed once more, the maximum held contents and
WRITE waveform are displayed in two screens, and at the same time, the
WRITE waveform is compared with the maximum held contents. When the
former is larger, that value is stored in the memory {Figure 4-26).
To release MAX HOLD, after setting to 2-screen display as shown in
SHIFT
Figure 4-26, clear it by pressing the Q and Cjx keys again: or
after setting the maximum held waveform to the VIEW mode by pressing
STORE VIEW VIEW
Q or Q key, erase the unnecessary screen by pressing the Q or
WRITE
□ key.
W1ITE
□
-10d3m
ST 10ms/ ATT lOdB VF IHHx
Figure 4-26 Two-screen Display of The Maximum Hold
Contents and WRITE Waveform
10 0 . 90MHz
10MHz
4-32
Oct 20/89
Page 91
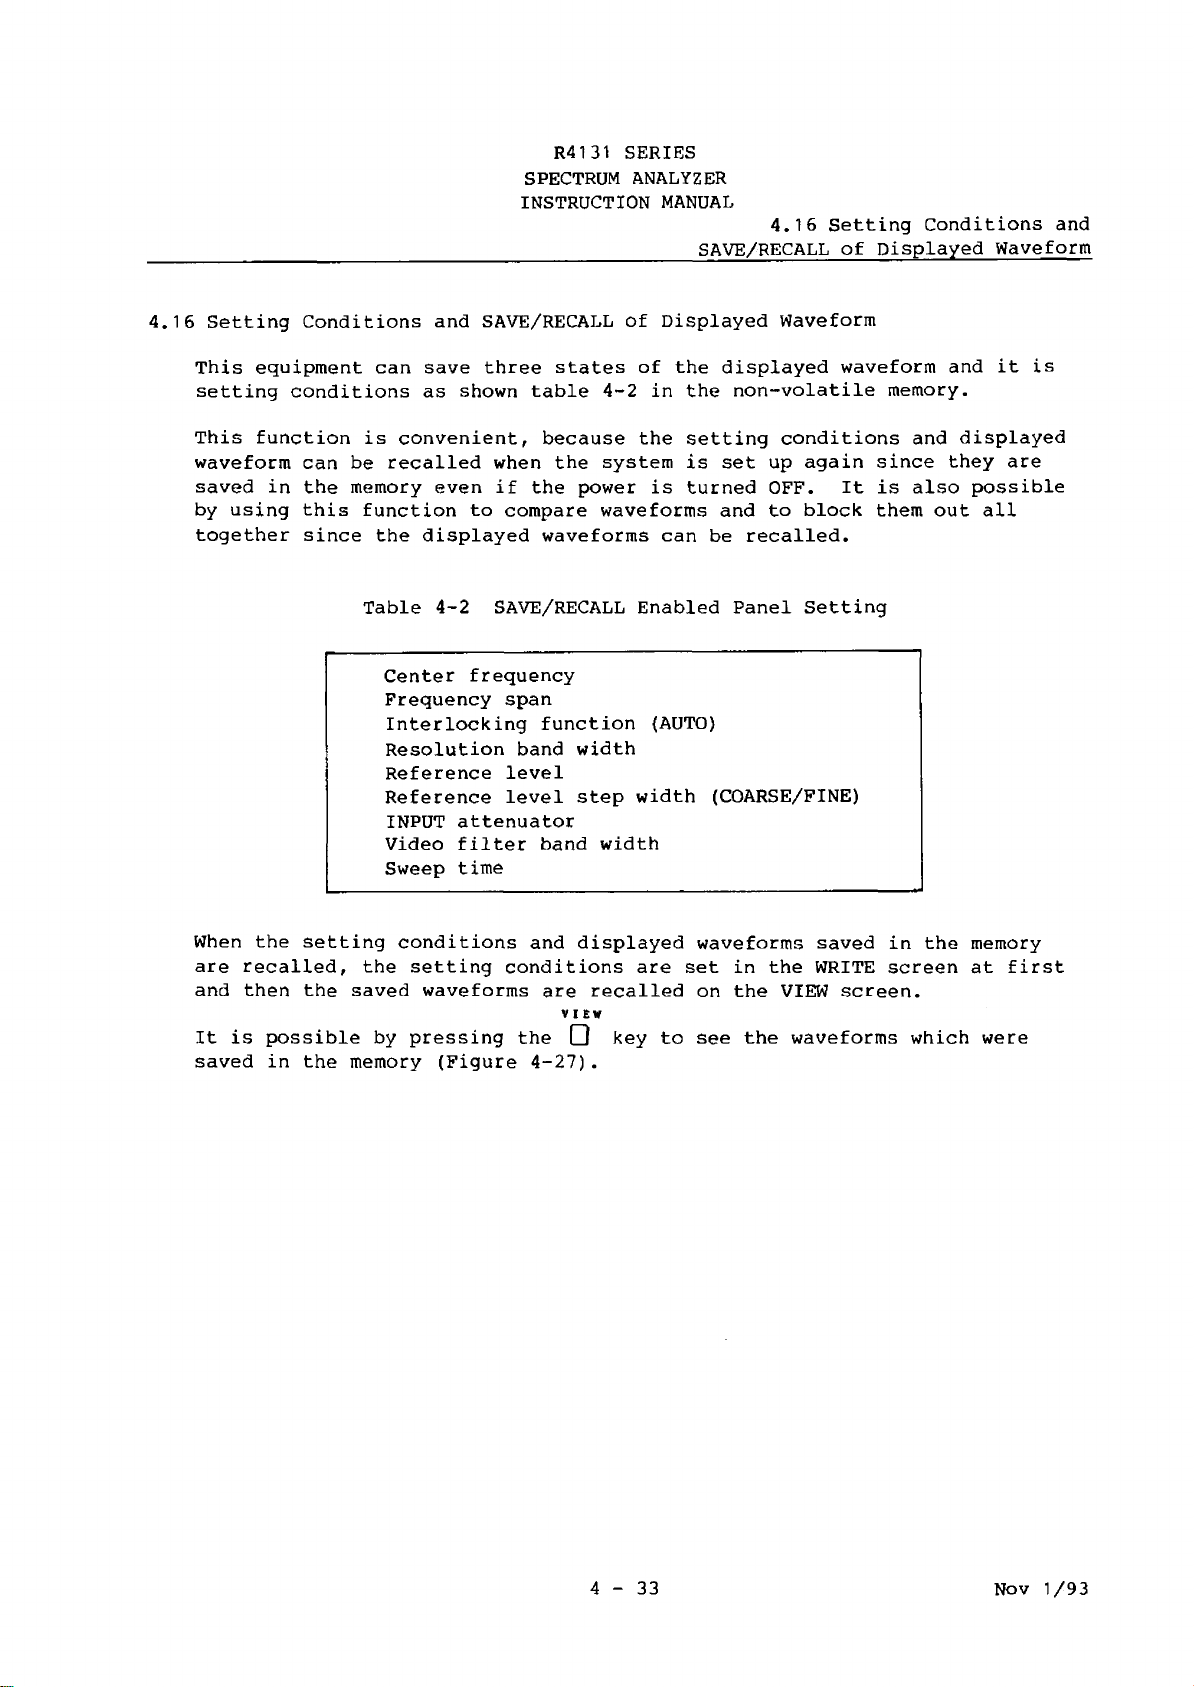
R4131 SERIES
SPECTRUM ANALYZER
INSTRUCTION MANUAL
4.16 Setting Conditions and
_____________________________________________
4.16 Setting Conditions and SAVE/RECALL of Displayed Waveform
This equipment can save three states of the displayed waveform and it is
setting conditions as shown table 4-2 in the non-volatile memory.
This function is convenient, because the setting conditions and displayed
waveform can be recalled when the system is set up again since they are
saved in the memory even if the power is turned OFF. It is also possible
by using this function to compare waveforms and to block them out all
together since the displayed waveforms can be recalled.
Table 4-2 SAVE/RECALL Enabled Panel Setting
Center frequency
Frequency span
Interlocking function {AUTO)
Resolution band width
Reference level
Reference level step width (COARSE/FINE)
INPUT attenuator
Video filter band width
Sweep time
SAVE/RECALL of Displayed Waveform
When the setting conditions and displayed waveforms saved in the memory
are recalled, the setting conditions are set in the WRITE screen at first
and then the saved waveforms are recalled on the VIEW screen.
VIEW
It is possible by pressing the Q key to see the waveforms which were
saved in the memory (Figure 4-27).
4-33
Nov 1/93
Page 92

R4131 SERIES
SPECTRUM ANALYZER
INSTRUCTION MANUAL
4.16 Setting Conditions and
_______________SAVE/RECALL of Displayed Waveform
(Non-volatile memory)
VIEW screen
Figure 4-27 SAVE/RECALL Waveform Memory
Table 4-3 shows the relations with the screen stored in the memory in each
trace mode.
Table 4-3 Screen Stored in Each Trace Mode
Trace mode
WRITE DISPLAY only
VIEW display only
WRITE/VIEW display
MAX HOLD only
WRITE/MAX HOLD display
(1) SAVE
SHIFT
When the Q and keys are pressed, the system is enters the SAVE
mode and the screen becomes as shown in Figure 4-28.
Stores the WRITE screen.
Stores th VIEW screen.
Stores the WRITE screen.
Stores the MAX HOLD screen.
Stores the WRITE screen.
^— Corresponding key
Screen stored
MEMORY 0 LCL (USER DEFINED POWER-UP)
MEMORY
MEMORY 2 STORE
MEMORY 3 VIEW
QUIT RECALL
1 WRITE
Figure 4-28 SAVE Screen
4-34
Nov 1/93
Page 93

R4131 SERIES
SPECTRUM ANALYZER
INSTRUCTION MANUAL
4.16 Setting Conditions and
_________________________________________
SAVE/RECALL of Displayed Waveform
WRITE STORE VIEW
Select the MEMORY 1, MEMORY 2, or MEMORY 3 using Q , Q , or □
key and select the memory to store.
RECALL
To quit the SAVE mode halfway, press the Q key.
The MEMORY 0 is described in Section 4.17 Automatic Setting at Power
ON.
(2) RECALL
RECALL
When the
the screen becomes as shown Figure 4-29.
C D
key is pressed, the system enters the RECALL mode and
^-Corresponding key
MEMORY 0:
MEMORY
MEMORY
MEMORY 3:
QUIT
Select the MEMORY 1, MEMORY
VIEW
j—| key to select the memory to call.
To quit the RECALL mode halfway, press the Q key.
LCL {USER DEFINED POWER-UP)
WRITE
1 I
STORE
2:
VIEW
RECALL
Figure 4-29 RECALL Screen
2,
or MEMORY 3 by using the
•RECALL
WRITE STORE
Q , Q r
or
4-35
Nov 1/93
Page 94

R4131 SERIES
SPECTRUM ANALYZER
INSTRUCTION MANUAL
_____________________________________________4.17 Automatic Setting at Power ON
4.17 Automatic Setting at Power ON
This is a function to call the setting stored in the non-volatile memory
each time the power is turned ON. The setting of the equipment selected
by yourself can always be called at power ON.
SHIFT
To store the setting to appear at power ON, press the Q and Q keys to
put the system into the SAVE mode.
Then, the screen becomes as shown in Figure 4-28.
SAVE
L C L
Press the MEMORY 0 and Q keys, then the set conditions are stored in the
memory.
4-36
Oct 20/89
Page 95

R4131 SERIES
SPECTRUM ANALYZER
INSTRUCTION MANUAL
4.7 8 Electric Field Intensity
______________________________ Measurement (dBu/m)
4.18 Electric Field Intensity Measurement (dBy/m)
The spectrum analyzer which can observe a wide frequency band at a time
can also be used as a field intensity measuring instrument. When an
antenna manufactured by ADVANTEST is used, this analyzer displays the
level data by correcting the antenna factor, making it possible to read
directly the field intensity through this analyzer. However, this
correction value is effective only when the attached 5D2W cable, 10m. is
used. When using any other cable an error results.
Operating procedure
(?) Connect the antenna to the input terminal (50 ft) of this equipment.
When the impedance of the antenna is not 50 ft, be sure to match the
impedance using a matching circuit,
(2) Set the center frequency and frequency span, etc., to facilitate the
observation.
UNITS
(3) Press the Q key and select the level unit to match the antenna as
follows:
For TR1722 half-wave dipole antenna: dBy/m (A)
For TR1711 log helical antenna : dBy/m (B)
For TR17203 active antenna : dBy/m (C)
For TR17204 log helical antenna : dBy/m (D)
PEAK
(4) Press the Q key and set it to the peak of the spectrum to measure
the marker.
The relationship between the marker point display level, that is, the
input end voltage ex (dByV) of this equipment, and the actual field
intensity Ex (dByV/m) is as shown below:
Ex = ex + K Where, K: antenna factor (dB)
When the above antenna is used, this antenna factor K is automatically
corrected and the marker display indicates the field intensity.
When any antenna other than those mentioned above is used, correct the
value referring to the following "Correction Coefficient of Antenna":
4-37
Oct 20/89
Page 96

R4131 SERIES
SPECTRUM ANALYZER
INSTRUCTION MANUAL
Measurement (dBy/m)
- Correction Factor of Antenna
Ex = ex + K = (ex + 6) + La - He + Ba
Where,
4.18 Electric Field Intensity
EX
ex
K
He (dB)
La (dB)
Ba (dB)
The factor K of the half-wave dipole antenna is obtained according to
the following equation:
K = 20 Log F + 6 + La + Ba F (MHz) : Receiving frequency
= -33.6 + 20 Log F + La + Ba
For the broad band width logarithm frequency type antenna, deduct the
antenna gain (half-wave dipole antenna ratio) from the obtained value.
Figure 4-30 shows the relationship between the frequency and
calibration factor of TR1722 half-wave dipole antenna (including the
cable loss).
Field intensity (dByV/m)
Input terminal voltage (dByV)
Antenna correction factor (dB)
Effective length of antenna
Cable loss
Baiun loss
n . .
4-38
Oct 20/89
Page 97

R4131 SERIES
SPECTRUM ANALYZER
INSTRUCTION MANUAL
4.19 QP Value Measurement
_________________________________________________ (Quasi-peak Value Measurement)
4.19 QP Value Measurement (Quasi-peak Value Measurement)
The QP value measurement is for measuring the pulse characteristic noise.
Various constants in this measurement are defined values in the CISPR
Standards as shown in Table 4-4.
Table 4-4 CISPR Standards for QP Value Measurement Basic Characteristic
Measuring band
A 10 kHz to 150 kHz
150 kHz to 30 MHz
B
C 30 MHz to 300 MHz
300 MHz to 1 GHz
D
Note : This equipment has
6 dB
band width
20 Hz
9 kHz
120 kHz
Charging
time
constant
4 5 ms 500 ms
1 ms
1 ms 550 ms
Discharging
time
constant
1 60 ms 1 60 ms
1 10 kHz 1 ms 550 ms 1 00 ms
no A-range
(10 kHz to
150 kHz, and 200 Hz band
Mechanical
time
constant
160 ms
1 00 ms
width).
Operating procedure
(7) Set the center frequency and frequency span to be measured. Since the
QP band width is automatically set as the center frequency is set,
select the frequency span in the band to be measured. For B-band for
instance, the center frequency and span are selected as 25 MHz and 5
MHz, respectively.
INPUT ATTENUATOR
(2) While observing the waveform, press the ( < >) and Q keys and
increase or decrease the input attenuator with in steps of 10 dB to
check that the waveform level does not change. If changed, it
indicates that the input stage of this equipment is saturated, so
increase the attenuator value or add B.P.F (Band Pass Filter) to its
input.
(3) When the level can be checked not to change, change the reference
level so that the output peak level meets the reference level.
SHIFT
(4) Press the Q and Q Keys.
a p
The system enters the QP measurement mode under this status and the
screen becomes 5 dB/DIV and eight scales.
4-39
Oct 20/89
Page 98
R4131 SERIES
SPECTRUM ANALYZER
INSTRUCTION MANUAL
4.19 QP Value Measurement
__________________
(Quasi-peak Value Measurement)
(5) Since a large time constant is entered when the QP value is measured
as shown in Table 4-4, make the sweep time long enough. As a
yardstick in this setting, set 1 sec per 10 kHz in the measuring band
B (150 kHz to 30 MHz) and 1 sec per 10 kHz in the measuring bands C
and D (30 MHz to 1 GHz).
MARKER
(6) Press the g key to output the marker.
Then, the QP value of the input terminal is displayed in terms of the
marker frequency.
UNITS
(7) When an antenna manufactured by ADVANTEST is used, press the
C D
key
and set the level unit to the antenna and select the unit as follows:
TR1722 half-wave dipole antenna
TR1711 log helical antenna
TR17203 active antenna
TR17204 log helical antenna
dB]i/m (A)
dBy/m (B)
dBu/m (C)
dBy/m (D)
Then, the antenna factor is automatically corrected, the level unit at
the marker point becomes dBy/m, and the QP value is displayed directly
on the screen.
This correction is made only when the attached 5D2W antenna, 10m, is
used. When any other antenna is used, obtain the correction factor
referring to the electric field intensity measurement in Section 4.18
and calculate the QP value.
SHIFT
____
SHIFT
___
SHIFT
® Press either one of the □ ,0li|pDIv' ^ °r ^ l ineak
key, and the QP value measurement mode is cleared and the setting is
changed accordingly.
4-40
Oct 20/89
Page 99

R4131 SERIES
SPECTRUM ANALYZER
INSTRUCTION MANUAL
__________________
4.19 QP Value Measurement
(Quasi-peak Value Measurement)
(including the accessory cable loss)
Field strength compensation ooefficient K(dB)
40 60 80 100 200
Measurement frequency (MHz)
400 600 800 lOOO(MHz)
Figure 4-30 Relationship between Frequency and Calibration Factor
in the half-wave dipole antenna
4-41
Oct 20/89
Page 100
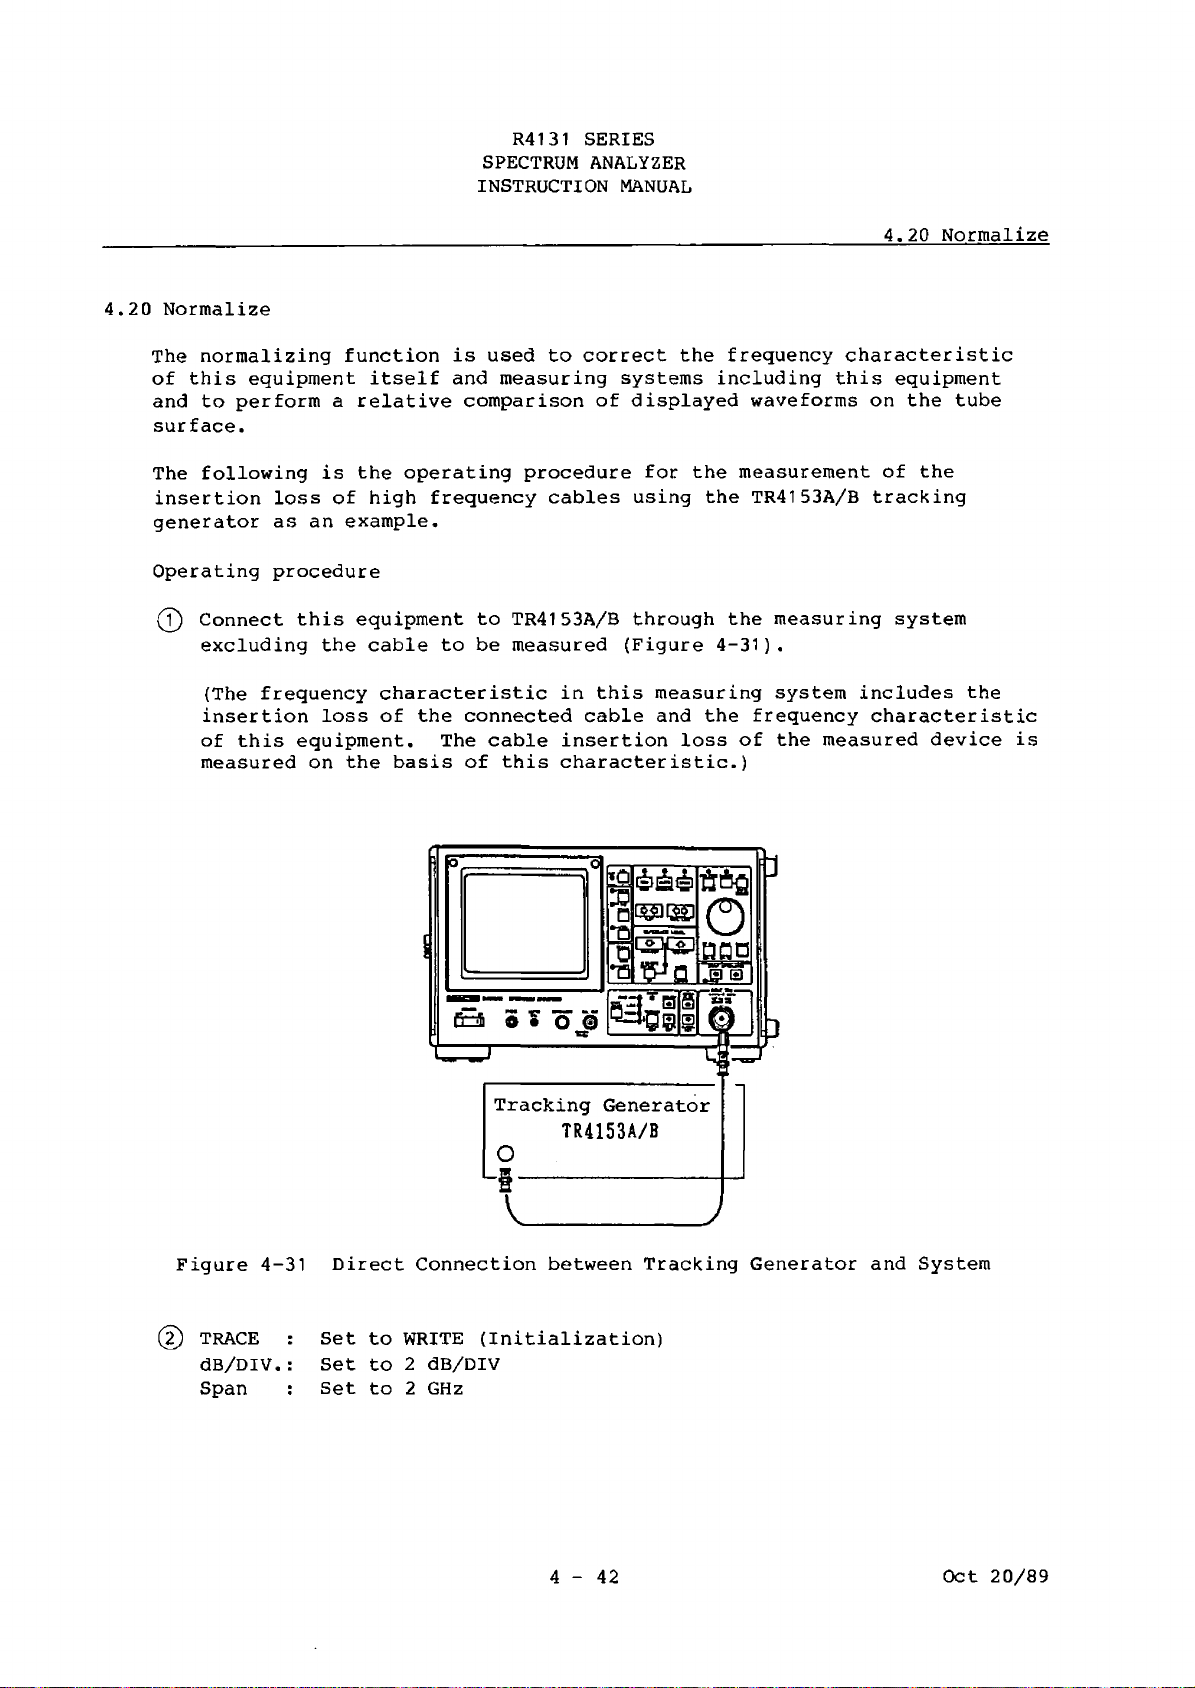
R4131 SERIES
SPECTRUM ANALYZER
INSTRUCTION MANUAL
4.20 Normalize
4.20 Normalize
The normalizing function is used to correct the frequency characteristic
of this equipment itself and measuring systems including this equipment
and to perform a relative comparison of displayed waveforms on the tube
surface.
The following is the operating procedure for the measurement of the
insertion loss of high frequency cables using the TR4153A/B tracking
generator as an example.
Operating procedure
(7) Connect this equipment to TR4153A/B through the measuring system
excluding the cable to be measured (Figure 4-31).
(The frequency characteristic in this measuring system includes the
insertion loss of the connected cable and the frequency characteristic
of this equipment. The cable insertion loss of the measured device is
measured on the basis of this characteristic.)
o
Tracking Generator
TR4153A/B
O
f
Figure 4-31 Direct Connection between Tracking Generator and System
© TRACE : Set to WRITE (Initialization)
dB/DIV.: Set to 2 dB/DIV
Span : Set to 2 GHz
4-42
Oct 20/89
 Loading...